evaporation waves in superheated dodecane -...
TRANSCRIPT

Evaporation Waves In Superheated Dodecane
J. R. Simoes–MoreiraDepartamento de Engenharia MecanicaSISEA - Alternative Energy Systems LaboratoryEscola Politecnica da USP, caixa postal 61548Sao Paulo, SP, Brazile-mail: [email protected]: (+5511) 813 1886
J. E. Shepherd1
Graduate Aeronautical LaboratoryCalifornia Institute of Technology, Pasadena, CA, 91125e-mail: [email protected]: 818 395 3283fax: 818 449 2677
Published in Journal of Fluid Mechanics, 382:63-86, 1999.
1Corresponding author
1

Abstract
We have observed propagating adiabatic evaporation waves in superheated liq-uid dodecane, C12H26. Experiments were performed with a rapid decompressionapparatus over a range of initial temperatures from 180◦C to 300◦C. Saturateddodecane in a tube was suddenly depressurized by rupturing a diaphragm. Motionpictures and still photographic images, pressure, and temperature data were ob-tained during the evaporation event that followed depressurization. Usually, a frontor wave of evaporation started at the liquid free surface and propagated into theundisturbed regions of the metastable liquid. The evaporation wave front movedwith a steady mean velocity but the front itself was unstable and fluctuating incharacter. At low superheats, no waves were observed until a threshold super-heat was exceeded. At moderate superheats, subsonic downstream states wereobserved. At higher superheats, the downstream flow was choked, correspondingto a Chapman-Jouguet condition. At the most extreme superheat tested, a vaporcontent of over 90% was estimated from the measured data, indicating a nearlycomplete evaporation wave. Our results are interpreted by modeling the evapora-tion wave as a discontinuity, or jump, between a superheated liquid state and atwo-phase liquid-vapor downstream state. Reasonable agreement is found betweenthe model and observations, however, there is a fundamental indeterminacy thatprevents the prediction of the observed wave speeds.
2

1 Introduction
In certain situations, the pressure of a liquid may suddenly be reduced far below thesaturation condition without immediate occurrence of boiling. As a result, the liquidbecomes superheated or metastable. The superheat is characterized by the differencebetween the actual liquid temperature and the temperature of the saturated liquid atthat pressure. Superheats of up to 200◦C are possible. Following a brief incubationperiod, explosive evaporation results. Such steam or physical explosions are implicated(Reid 1976; Reid 1983) in some types of industrial accidents.
Under specific conditions, described below, a superheated liquid will evaporate in awave-like process; that is, the phase change process is confined to a discrete and observ-able zone, which moves into the undisturbed metastable liquid and a two-phase mixture isobserved downstream of the wave front (Terner 1962; Grolmes and Fauske 1974; Thomp-son et al. 1987; Hill 1991; Simoes–Moreira 1994; Simoes–Moreira and Shepherd 1994).The occurrence of the evaporation wave depends on several factors: the thermodynamicproperties of the substance, the degree of superheat, the absence of activated nucleationsites, and the depressurization time scale. Evaporation waves have also been observed(Shepherd and Sturtevant 1982; Frost and Sturtevant 1986; Frost 1988; Nguyen et al.1988) in a small scale within superheated droplets. Other terms used to designate thephenomenon are boiling discontinuities or boiling shocks (Labuntsov and Avdeev 1981;Labuntsov and Avdeev 1982), boiling front propagation (Das et al. 1987) and flashboiling.
The evaporation waves we are considering can be idealized as adiabatic phase tran-sitions with the latent heat of vaporization supplied from the energy stored in themetastable liquid. The vaporization process is self-sustaining due to the superheatednature of the liquid. In this sense, evaporation waves are analogous to combustion frontssuch as flames, in which the energy is stored in the chemical bonds of the reactants andthe flame process is self-sustaining due to the metastable nature of a fuel-oxidizer mixtureor molecular explosive. This analogy immediately suggests the possibility of analyzingevaporation waves using control volume concepts and jump conditions, just as in thecase of deflagrations and detonations. We have interpreted our experiments using thisnotion together with a realistic equation of state and two-phase flow models for the flowdownstream of the wave front. An exposition of this simple model is given in Section2. In Section 5, we propose an extension of this simple theory to include the effect ofvelocity slip in the two-phase flow downstream of the wave.
The simple model predicts, and large-superheat experiments confirm, that there is amaximum mass flux through an evaporation wave. In analogy with the simple theory ofdeflagration waves, the choked solution is called the Chapman-Jouguet (CJ) point. TheCJ point is a unique solution to the jump conditions for which the downstream flow issonic or choked in relation to the moving deflagration wave. Some previous researchers(Chaves 1984; Thompson et al. 1987) have focused on the CJ point as defining a uniqueevaporation wave speed. However, the pioneering study of Hill (Hill and Sturtevant1990; Hill 1991) demonstrated, and the present experiments confirm, that a range of
3
evaporation wave speeds is possible depending on the pressure drop across the wave andthe degree of superheat of the upstream liquid. These findings are in agreement withprevious experimental results (Hill and Sturtevant 1990; Hill 1991) and indicate thatboth subsonic and sonic solutions are possible, depending on the initial thermodynamicconditions and the fluid boundary conditions.
This paper reports results and analyses of experiments carried out with saturateddodecane at temperatures ranging from 180◦C to 300◦C. The distinction of the presentstudy is the systematic examination of the effect of superheat and reservoir pressure onevaporation wave characteristics, the use of a highly retrograde pure substance (dode-cane) as the working fluid and consideration of velocity slip due to wall effects. Theexperimental setup is described in Section 3 and the results are given in Section 4. Ourchoice (Simoes–Moreira et al. 1993) of dodecane is related to the theoretical possibilityof obtaining a complete evaporation wave due to its retrograde behavior. A completeevaporation wave will have only the vapor phase in the downstream flow. The retrogradeproperty is associated with molecular complexity and is macroscopically characterized bya positive slope of the vapor branch of the temperature-entropy saturation line. There-fore, a retrograde liquid can undergo complete evaporation in an isentropic expansionprocess, which is an impossibility for regular substances such as water. A discussion ofthis aspect of the experiments is given in Section 6.
2 Control Volume Analysis
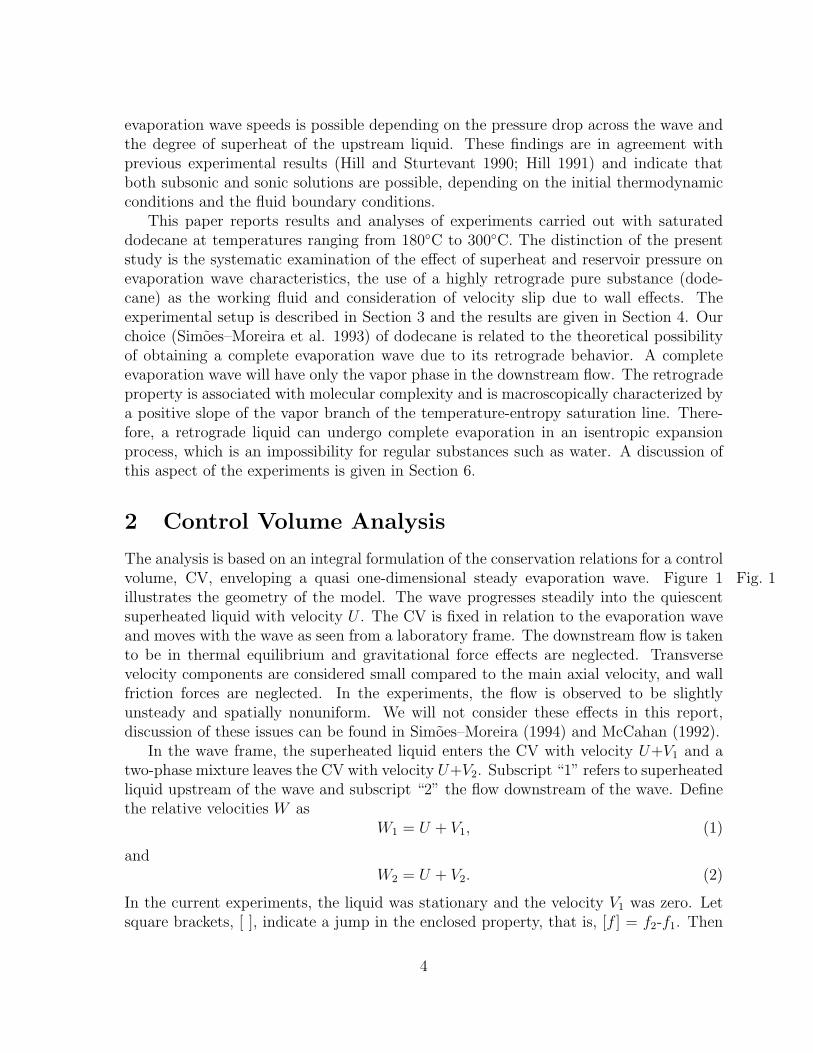
The analysis is based on an integral formulation of the conservation relations for a controlvolume, CV, enveloping a quasi one-dimensional steady evaporation wave. Figure 1 Fig. 1illustrates the geometry of the model. The wave progresses steadily into the quiescentsuperheated liquid with velocity U . The CV is fixed in relation to the evaporation waveand moves with the wave as seen from a laboratory frame. The downstream flow is takento be in thermal equilibrium and gravitational force effects are neglected. Transversevelocity components are considered small compared to the main axial velocity, and wallfriction forces are neglected. In the experiments, the flow is observed to be slightlyunsteady and spatially nonuniform. We will not consider these effects in this report,discussion of these issues can be found in Simoes–Moreira (1994) and McCahan (1992).
In the wave frame, the superheated liquid enters the CV with velocity U+V1 and atwo-phase mixture leaves the CV with velocity U+V2. Subscript “1” refers to superheatedliquid upstream of the wave and subscript “2” the flow downstream of the wave. Definethe relative velocities W as
W1 = U + V1, (1)
andW2 = U + V2. (2)
In the current experiments, the liquid was stationary and the velocity V1 was zero. Letsquare brackets, [ ], indicate a jump in the enclosed property, that is, [f ] = f2-f1. Then
4
the conservation equations for mass, momentum, and energy can be written as
[J ] = 0, (3)
[P + JW ] = 0, (4)
and
[h +W 2
2] = 0, (5)
where h is the specific enthalpy and J is the superficial mass flux
J =W1
v1
=W2
v2
, (6)
where vi is the corresponding upstream or downstream average specific volume. Com-bining the balance equations, one can obtain the Rayleigh equation,
J2 = − [P ]
[v], (7)
and the Rankine-Hugoniot equation,
[h] =v1 + v2
2[P ]. (8)
An equation-of-state must be supplied to estimate the downstream thermodynamicproperties. For single-phase states, a conventional P (v, T ) equation and ideal gas heatcapacity cig
p (T ) suffice. For two-phase states, some assumptions must be made aboutthe relationship between the phases. The simplest notion is to assume that the phasesare in mechanical and thermal equilibrium. Then the relevant extensive thermodynamicvariables can be computed by mass averages of the properties of the individual phases. Anadditional variable, the quality or vapor mass fraction x, is introduced and an additionalconstraint, the saturation condition P = Pσ(T ), is added. The saturated vapor pressureis denoted by Pσ(T ). The issue of mechanical equilibrium, i.e., relative motion betweenliquid and vapor phases, in the downstream flow will be discussed in Section 5.
In either the single or two-phase regions, there is one more variable than there areequations so that these equations do not uniquely determine the wave speed unless adownstream property can be specified. Evaporation wave speed at a given time will be afunction of the initial and boundary conditions for that flow. Only in special cases can thewave speed be considered to be uniquely fixed without making detailed considerations ofthe flowfield. In general, a family of solutions will be found, and these are parameterizedby either the wave speed or a downstream property. In addition to Eqns. (7) and (8),the entropy constraint, s2 ≥ s1, must also be satisfied.
Our formulation of the control-volume analysis of an evaporation wave is similar tothat of a subsonic deflagration wave in a combusting gas. The energy stored in thesuperheated liquid plays the same role as the energy stored in the molecular bonds of thereactants. The solution to Eqns. (7) and (8) lies on an evaporation adiabat or Hugoniot
5
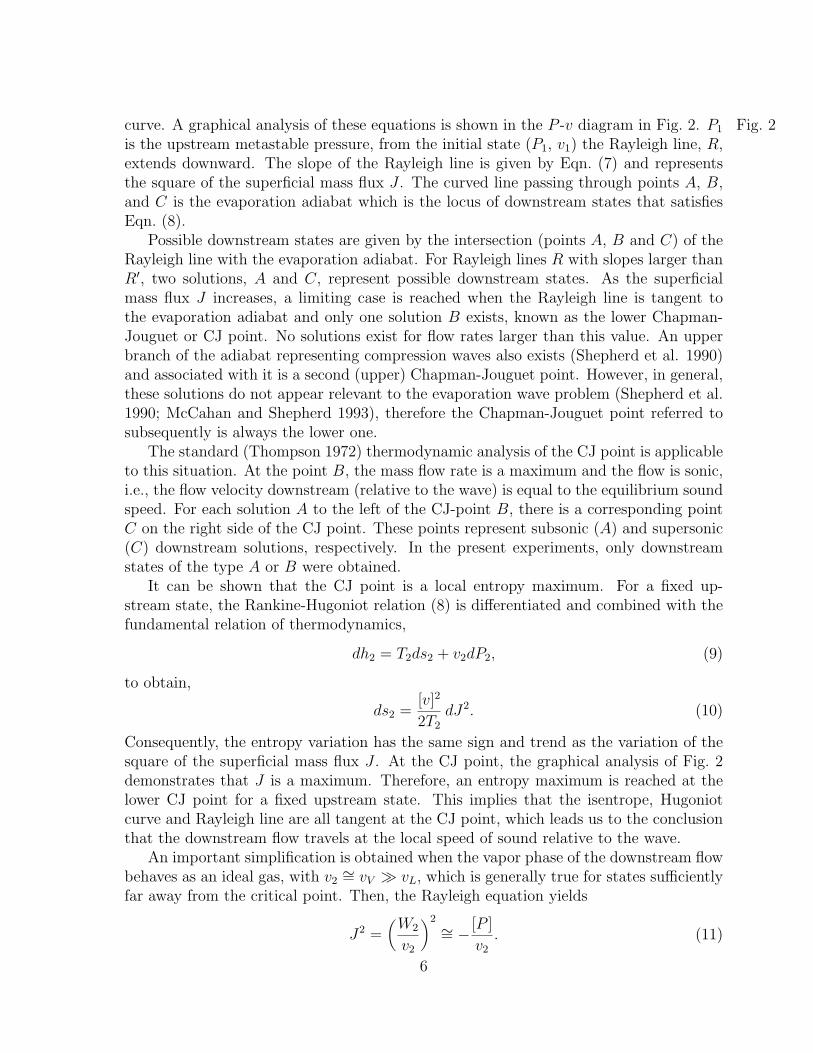
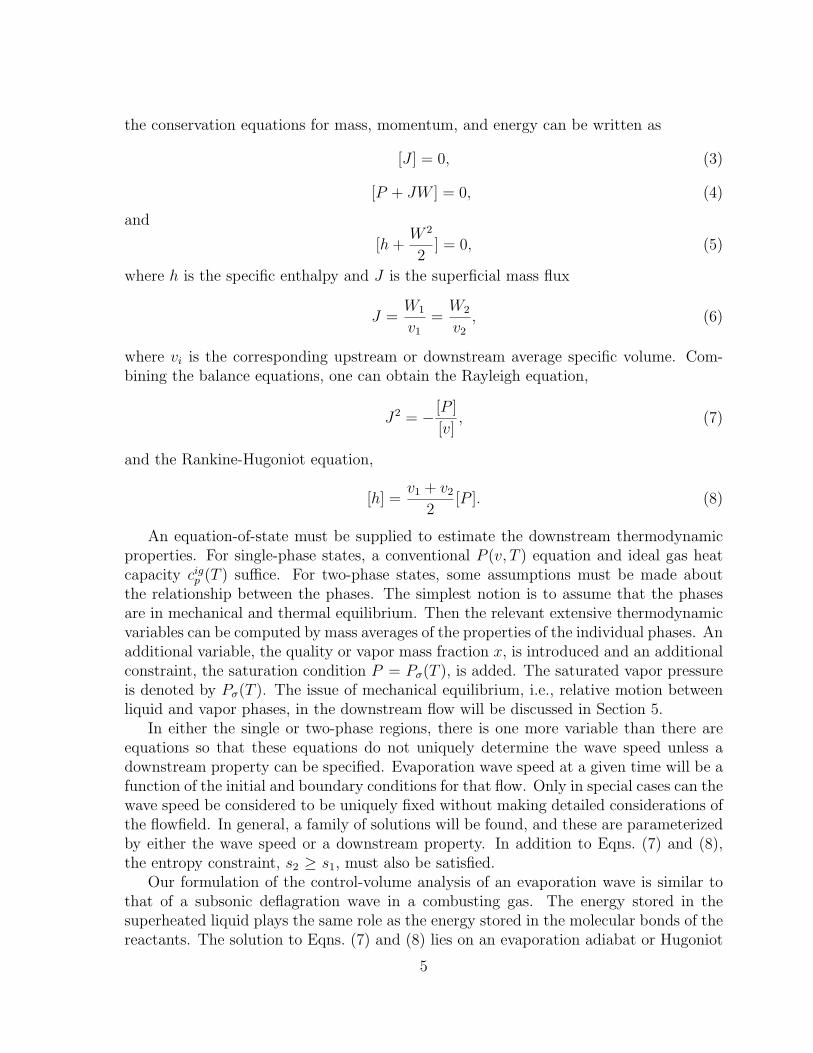
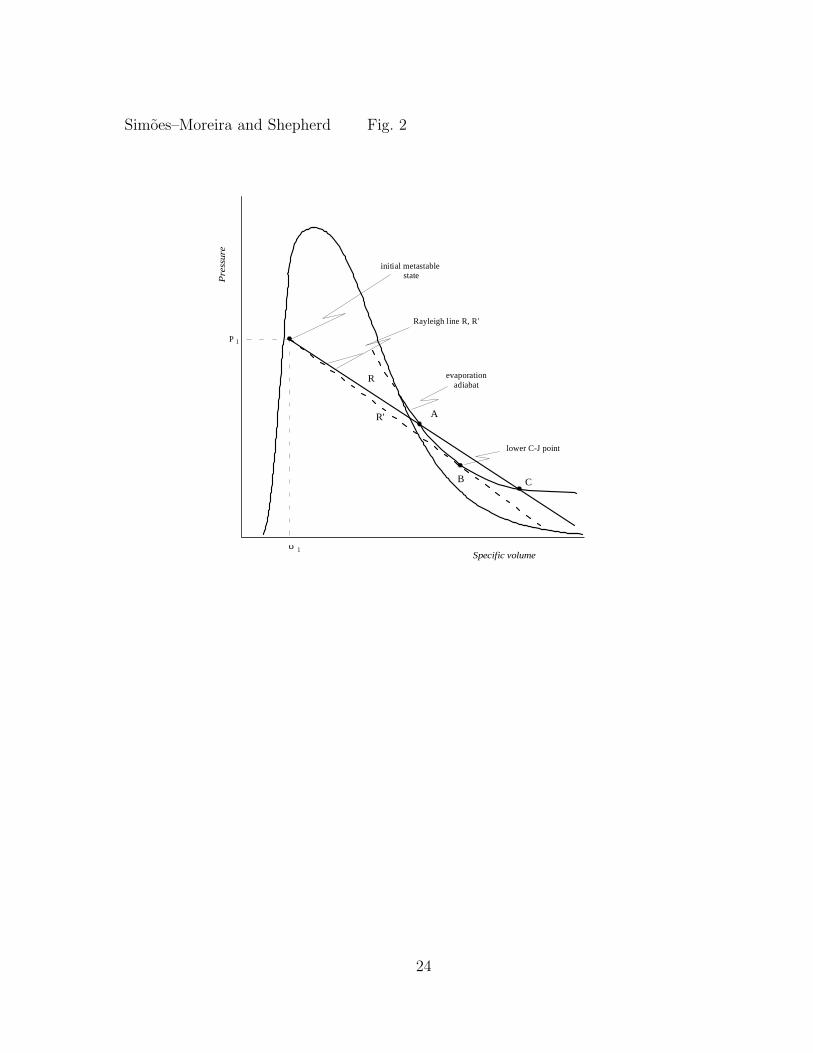
curve. A graphical analysis of these equations is shown in the P -v diagram in Fig. 2. P1 Fig. 2is the upstream metastable pressure, from the initial state (P1, v1) the Rayleigh line, R,extends downward. The slope of the Rayleigh line is given by Eqn. (7) and representsthe square of the superficial mass flux J . The curved line passing through points A, B,and C is the evaporation adiabat which is the locus of downstream states that satisfiesEqn. (8).
Possible downstream states are given by the intersection (points A, B and C) of theRayleigh line with the evaporation adiabat. For Rayleigh lines R with slopes larger thanR′, two solutions, A and C, represent possible downstream states. As the superficialmass flux J increases, a limiting case is reached when the Rayleigh line is tangent tothe evaporation adiabat and only one solution B exists, known as the lower Chapman-Jouguet or CJ point. No solutions exist for flow rates larger than this value. An upperbranch of the adiabat representing compression waves also exists (Shepherd et al. 1990)and associated with it is a second (upper) Chapman-Jouguet point. However, in general,these solutions do not appear relevant to the evaporation wave problem (Shepherd et al.1990; McCahan and Shepherd 1993), therefore the Chapman-Jouguet point referred tosubsequently is always the lower one.
The standard (Thompson 1972) thermodynamic analysis of the CJ point is applicableto this situation. At the point B, the mass flow rate is a maximum and the flow is sonic,i.e., the flow velocity downstream (relative to the wave) is equal to the equilibrium soundspeed. For each solution A to the left of the CJ-point B, there is a corresponding pointC on the right side of the CJ point. These points represent subsonic (A) and supersonic(C) downstream solutions, respectively. In the present experiments, only downstreamstates of the type A or B were obtained.
It can be shown that the CJ point is a local entropy maximum. For a fixed up-stream state, the Rankine-Hugoniot relation (8) is differentiated and combined with thefundamental relation of thermodynamics,
dh2 = T2ds2 + v2dP2, (9)
to obtain,
ds2 =[v]2
2T2
dJ2. (10)
Consequently, the entropy variation has the same sign and trend as the variation of thesquare of the superficial mass flux J . At the CJ point, the graphical analysis of Fig. 2demonstrates that J is a maximum. Therefore, an entropy maximum is reached at thelower CJ point for a fixed upstream state. This implies that the isentrope, Hugoniotcurve and Rayleigh line are all tangent at the CJ point, which leads us to the conclusionthat the downstream flow travels at the local speed of sound relative to the wave.
An important simplification is obtained when the vapor phase of the downstream flowbehaves as an ideal gas, with v2
∼= vV � vL, which is generally true for states sufficientlyfar away from the critical point. Then, the Rayleigh equation yields
J2 =(
W2
v2
)2∼= −
[P ]
v2
. (11)
6

Further simplification is possible at the CJ point where W2 = C2 =√
γRT2, the localspeed of sound. Combining these relations and substituting into Eqn. (11), we obtain
P2∼=
P1
1 + γ. (12)
The specific heats ratio γ for ideal gases is always in the range 1 to 5/3, which meansthat P2 is between 37% and 50% of the metastable pressure P1. We found that this is auseful rule of thumb for estimating the downstream pressure in our experiments.
3 Experimental Setup and Procedure
A schematic of the test facility is shown in Fig. 3. The main components were a heated Fig. 3glass test cell and a low-pressure chamber. The test cell consisted of a round Pyrexglass tube, whose dimensions were 340-mm long by 15-mm diameter. Glass was chosenbecause its surface was smooth enough to suppress undesirable heterogeneous nucleationand made photographic documentation possible. Circulation of hot air in a square glassjacket partially enclosing the cell was used to heat the system to the desired temperature.To ensure the uniformity of the initial temperature, a thermocouple was traversed withinthe test cell, and the heat supply was adjusted as necessary.
A diaphragm, made of Kapton in most experiments and aluminum in a few cases,closed the top part of the cell and served to isolate the test liquid from a low-pressurechamber. Each experiment involved discharging about 50 cm3 of liquid dodecane fromthe test cell into the low-pressure chamber (0.227 m3). We began the experiment bypiercing the diaphragm, which rapidly depressurized the liquid (see Fig. 6) and initiatedevaporation. The diaphragm was pierced by using an arrow with four knife blades drivenby a compressed-air piston actuated by a solenoid valve. The blades were at a shallowangle to the horizontal (5◦) so that the total piercing time of the diaphragm was a fewmilliseconds.
Substantial efforts were made to suppress nucleation at the bottom of the cell. Thepressure and temperature transducers located in the bottom flange were efficient nucle-ation sites as was the gasket between the flange and the glass cell. The ultimate solutionto premature nucleation at the cell bottom consisted of cooling the bottom portion ofthe test cell and allowing it to protrude below the heated section. This introduced atemperature gradient into the last 2 cm of test liquid and data from evaporation in thisportion of the cell was not used.
Pressure transducers were located at the bottom of the cell and near the cell exit. Thebottom transducer was mounted flush with the flange. The exit transducer was mountedremotely in a small aluminum block and water cooled to prevent thermal damage. Theexit pressure signal was transmitted through a small steel tube (3.18-mm diameter andabout 100-mm long) from the test cell to the pressure transducer. Exit temperatureswere obtained using a T-type thermocouple with a bead diameter of 0.6 mm, which hadan estimated response time of 50 to 100 ms. Signals were amplified and then recordedusing a digital data acquisition system.
7

We obtained simultaneous still photographs using two cameras and a short-duration(0.5 µs) light source. One camera imaged a front view of the test cell and the otherimaged the evaporation wave at 30◦ to wave plane. The light triggering signal came froma photosensor that was illuminated by a laser beam passing through the test cell. As soonas the evaporation wave passed by, it blocked off the beam causing the photosensor circuitto generate an electrical pulse, which then triggered the light source. Motion pictureswith a framing rate of 3000 frames per second were also obtained. These films revealeddetails of the development of the evaporation wave and enabled accurate measurements ofthe wave speed. Video recording was used in many experiments to get a quick indicationof the results. Diffuse lighting from behind the cell was used in all cases to minimizerefractive effects.
We started a typical test by degassing the dodecane at room temperature. Then, wefilled the test cell, installed the diaphragm, and a second low-pressure degassing processwould take place while the system was being heated. After boiling for some time, theglass cell was pressurized with a cover gas (N2). The pressure was controlled inside thetest cell so that the liquid was slightly above the saturation pressure. The low-pressurereservoir was evacuated and then brought up to the desired pressure with N2. Once thetest temperature was reached, the photographic system (motion or still pictures) and thedata acquisition were set up. The triggering signal for the data acquisition was eitherfrom the motion picture camera or from the diaphragm piercing system. The total dataacquisition time was in the range of 200–500 ms, depending on the individual experiment.More details on the experimental setup can be found in Simoes–Moreira (1994).
4 Experimental Results
A sequence of motion pictures is shown in Fig. 4. The initial test temperature was 270◦C, Fig. 4and the initial reservoir pressure was about 1 mbar. The first picture (a) in the upperleft corner shows the test cell immediately before the evaporation started and emphasisis given to the initial liquid-vapor surface. The next picture (b) registered the moment ofnucleation at the initial free surface. It seems that for this particular run, the initiationof the phenomenon was at the liquid-vapor free surface and the contact line with thetest cell. The following photographs show the evaporation wave progressing downwardsinto the undisturbed regions of the metastable liquid. These photographs are individualframes in a sequence from a high-speed film.
The sequence of photographs shows that the evaporation front was a very irregularinterface, which displayed different shapes as it progressed. If one assigned a plane tothe average evaporation front, a normal vector to this plane fluctuated about the axialdirection. Nevertheless, it was always possible to observe a mean evaporation wave regionwith a well-defined velocity of propagation characterized by a standard deviation of 1%to 2%. The velocity of propagation was obtained from motion pictures using the methodof least squares for fitting the position vs. time data. The time reference for the motionpictures was obtained from the 10-ms timing-light marks on the film.
8

The downstream region can be characterized by three distinct portions visible inthe motion pictures. Streaks of low-speed liquid could be seen flowing along the testcell walls. The core region was formed by the flow of high-speed vapor phase and finedroplets entrained in the mean stream. In the terminology of two-phase flow, the closestclassification would be annular flow with liquid entrainment. The farther downstreamthe two-phase flow was from the evaporation front, the less light was scattered, whichwas also confirmed by some still pictures. This can be interpreted as the presence of aconsiderable dense mist of fine droplets right behind the evaporation front and its dissi-pation downstream either by evaporation or by the attachment to the liquid structuresflowing at the wall.
The still pictures of Fig. 5 show front views of evaporation waves at six different Fig. 5test conditions spanning the range of initial temperatures covered in our experiments.The wave is moving from top to bottom. The evaporation front is a highly-disturbedregion formed by many interconnected hemispherical surfaces that resemble portions ofbubbles. The still pictures alone cannot precisely resolve the upper portion of thesestructures sufficiently to determine whether they are open or closed. Motion picturesand videos2 give a distinct impression of a somewhat jerky microscopic motion at lowsuperheats that becomes smoother (and faster) with increasing superheat.
Hill obtained the first high resolution photographs (Hill and Sturtevant 1990; Hill1991) of the wave initiation and startup process in refrigerants R12 and R114. Ourphotographs are strikingly similar to his, indicating that the structure of the front is notdependent on substance. Hill found, as we did, that the front appeared to be composed ofbubble-like structures and bursting of these structures gave rise to a “streak” of dropletsin the two-phase flow region downstream of the wave. This is particularly evident inthe motion pictures and videos. A certain amount of liquid is also obviously attachedto the test vessel surfaces and moving at a lower velocity than the free stream. Theseobservations are incorporated into the model for velocity slip that is developed in Section6.
Analysis of the still pictures revealed that the average size of hemispherical structuresin the front decreased as the test temperature increased. At the same time, the two-phase flow region appeared to become more homogeneous and less “streaky.” In somephotographs, there are artifacts, longitudinal streaks, due to the refraction and lensingeffect of the cylindrical test cell. It is difficult to precisely quantify the distribution ofhemispherical structure sizes. Inspection of the photographs indicated that the structureshad a maximum size of up to 5 mm (diameter) at low (200◦C) superheats and less than 1mm at the highest superheat (290◦C) studied. A spectrum of sizes were visible, down tothe smallest scales, less than 100 µm, that could be resolved by the photography. Thesestructures appear to be very similar in appearance to those observed by Hill (1991)and comparable in size, 0.1 to 1 mm. The structure lifetime measured in the presentexperiments was on the order of 1 ms, comparable to that observed by Hill.
Earlier studies (Shepherd and Sturtevant 1982; Frost and Sturtevant 1986; Frost 1988)
2A video tape of the motion pictures for selected experiments is available for the cost of handling.Contact the authors at [email protected].
9

on vaporization waves in superheated droplets also demonstrated the existence of highly-disturbed evaporating surfaces and two-phase flows in other superheated hydrocarbonssuch as butane and ether. Those observations were interpreted in terms of the instabilityof a strongly evaporating surface. The reasoning applied in those cases is equally validin the present flow but our observations are not sufficiently detailed to determine howinstabilities such as the Landau mechanism play a role. The structure and dynamics ofunstable evaporation waves still remains to be elucidated. Additional discussion on thispoint is provided in Chapter 6 of Simoes–Moreira (1994).
Pressure and temperature traces obtained in test dd-f-71 are shown in Fig. 6, cor- Fig. 6responding to the motion picture frames of Fig. 4. Sharp drops in pressure and exittemperature occurred when the diaphragm burst. Typically, the exit pressure displayeda slight recovery and recompression immediately after the depressurization (labeled “startup” in Fig. 6), which was associated with the start up of the evaporation wave. The sig-nals were approximately constant during the time period (labeled “steady motion” inFig. 6) representing the steady propagation of the evaporation wave. The decreasingsignals at late times (after 25 ms) were due to the slower evaporation of cooler liquid atthe bottom of the cell.
In some experiments, a delay of 2 to 3 ms was observed between diaphragm ruptureand the onset of the evaporation wave. During this time, acoustic waves reverberatewithin the liquid and a slight cooling (we estimate about 0.01◦C) took place. Chaves etal. (1987) suggested that the onset of evaporation occurs upon the arrival of the firstrarefaction wave reflected from the bottom of the test cell. Hill (1991) observed that thetime delay between the first expansion wave and wave onset was enough to accommodateseveral acoustic transits in his experiments with refrigerants. Our results are consistentwith Hill’s findings and we refer the reader to his excellent photographs and discussion ofthe startup process, in which an evaporation front spreads across the initially quiescentsurface and develops into an unstable evaporation wave.
The average pressure jump across the evaporation wave was estimated as the pressuredifference between the top and bottom of the cell. Corrections were estimated (Simoes–Moreira 1994) for the gravitational head and the pressure drop in the two-phase regionand found to be of the same order as the experimental uncertainties.
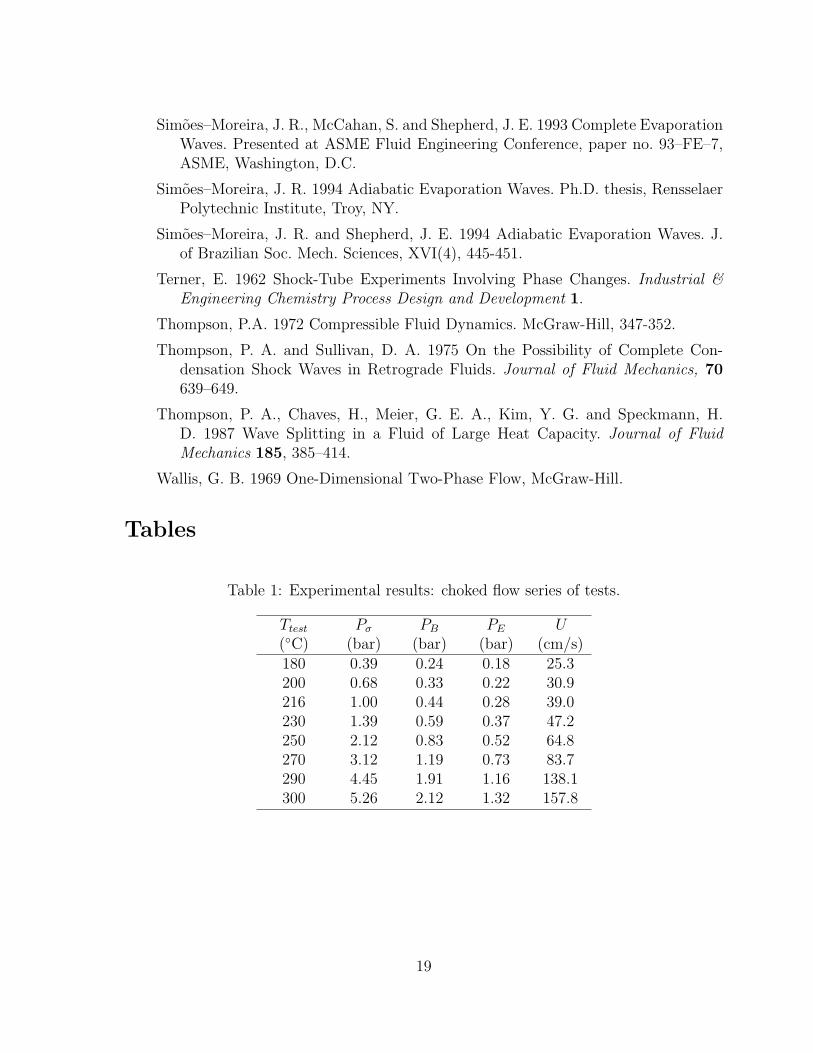
Two sets of experiments were performed. The main goal of the first set, the “chokedseries,” was to search for the complete evaporation wave. The results of that search arediscussed in Section 6. Test conditions and measured wave speeds in the “choked series”are summarized in Table 1: Ttest is the initial test temperature; Pσ is the saturation Table 1pressure; PB is the pressure at the bottom of the test cell; PE is the exit pressure; and Uis the average velocity of propagation obtained from analyses of the motion pictures. Allexperiments from this series were carried out with the reservoir evacuated to a pressureof less than 1 mbar. Thermodynamic properties such as liquid and vapor densities wereestimated from the Lee and Kesler (1975) equation of state. A short list of importantdodecane properties is given in Table 2. Table 2
The second set of experiments, the “isothermal series,” was designed to investigatethe subsonic branch of the Rankine-Hugoniot curve. To achieve this goal, the liquid
10

was exposed to decreasing values of the reservoir pressure at a fixed liquid temperature(230◦C). Wave velocities were computed in these cases by analyzing video images. Resultsare given in Table 3. Note that the saturation pressure of dodecane at 230◦C is 1.387 Table 3bar. Our general observations are as follows:
1.2 ≤ PR ≤ 1.3 bar. At low superheats, i.e., reservoir pressures close to the saturationpressure (1.387 bar), a wave did not start. Nucleation started at the interface of the freesurface and the glass tube and then the nucleation process moved randomly down thetube wall.
0.7 ≤ PR ≤ 1.1 bar. As the reservoir pressure was decreased, an evaporation waveappeared to start, but nucleation usually occurred somewhere upstream in the liquid.Usually, a single slug-flow-type bubble grew until it filled the tube and expelled theliquid above it. At PR = 0.7 bar, it was possible to observe a stable evaporation waveinitially but nucleation disrupted the process eventually.
PR ≤ 0.6 bar. Lower reservoir pressure resulted in the consistent formation of evapo-ration waves. Waves started promptly and propagated with a characteristic velocity. Nonucleation upstream was observed.
PR ≤ 0.3 bar. Beyond a certain point, the exit pressure would be independent of thereservoir pressure. The evaporation wave properties were insensitive to further decreasesin the reservoir pressure. We believe that this was due to the two-phase flow reaching achoking condition.
These results are in agreement with the earlier experiments in water (Grolmes andFauske 1974), perfluoro-heptane (PP1) (Thompson et al. 1987), and refrigerants 12 and114 (Hill and Sturtevant 1990; Hill 1991). There was a noticeable threshold, at whichan evaporation wave could be formed and sustained. There were also definite limits ofminimum and maximum superheats for which we reliably observed evaporation waves.Outside these limits, nucleation upstream of the wave would disrupt our observations. Atlow superheats, the evaporation wave was slow and there was a long dwell time before theonset of the wave. This required metastable fluid to be in the test cell for a long periodof time, and heterogeneous nucleation would occur. At moderate superheats, the wavewould start promptly and move quickly enough that heterogeneous nucleation upstreamof the wave would not occur. At high superheats, the nucleation rate became so highthat despite high evaporation wave speeds, heterogeneous nucleation occurred upstreamof the wave.
5 Modeling The Velocity Slip
The jump conditions (Section 2) can be used to solve for the downstream state giventhe upstream conditions and one other piece of information, such as the wave speed ordownstream pressure. An important case that admits such a solution is the situation of anequilibrium, homogeneous two-phase flow state downstream. In this case, the condition ofmechanical equilibrium implies that the relative average downstream velocity is commonbetween phases, W2 = WL2 = WV 2. The condition of thermodynamic equilibrium implies
11

that the average downstream thermodynamic (specific) properties f are obtained usingthe mixture rule f = xfV + (1− x)fL, where x is the vapor quality, fV is the saturatedvapor thermodynamic property, and fL is the saturated liquid thermodynamic property.The jump Eqns. (3 – 5) can be solved to obtain the vapor quality explicitly
x =h1 − hL2 + (vL2 + v1)[P ]/2
hLV 2 − vLV 2[P ]/2(13)
where vLV = vV − vL and hLV = hV − hL.Equation 13 enables the direct solution of the jump conditions in the case of a ho-
mogeneous downstream state. This was first pointed out by Thompson and Sullivan(1975) in the context of liquefaction shock waves. There are no a priori limitations onthe thermodynamic properties that would prevent the quality from being unity, i.e., asingle-phase (vapor) downstream state. The implications of this are explored in more de-tail in the subsequent section. If the downstream state is a single phase, then a numericalsolution of the jump conditions will generally be required.
The homogeneous, equilibrium model is appealing for its simplicity but our motionpictures suggest that the downstream flow is not in mechanical equilibrium. As discussedin Section 4, three regions were observed downstream of the flow: (1) a slowly movingliquid phase attached to the wall, (2) a faster moving vapor phase in the core region, and(3) entrained liquid droplets in the core region, which were assumed to flow at the speedof the vapor phase. In terms of traditional two-phase flow terminology, the flow can beclassified as an annular flow with liquid entrainment.
A more realistic model should allow for the velocity of the liquid film (at the wall) andthe vapor phase to be different. This can be accomplished by straightforward extensionsbased on classical two-phase flow modeling (Wallis 1969; Hewitt and Hall-Taylor 1970).Property and velocity values are treated as uniform within a phase domain but the phaseshave different velocities. Define a slip parameter
DW =WL2
WV 2
, (14)
which is related to the thermodynamic state through an empirical correlation such asFauske’s (1962)
DA =(
vL2
vV 2
)1/2
. (15)
The parameter D is reference-frame dependent, the subscript W is used whenever theparameter refers to the wave frame and the subscript A is used when the value is referredto the absolute or laboratory frame. In terms of a moving reference frame, the slip ratioDW can be written as
DW WV 2 − U
WV 2 − U=(
vL2
vV 2
)1/2
. (16)
A sensitivity analysis was carried out assuming different values for the ratio betweenspecific volumes. Varying the slip ratio by factor of 103 results in only a 20% variation
12

in the wave speed. Fauske’s expression maximizes the superficial mass flux and thereforethe evaporation wave speed. Some researchers prefer the cube root expression, which fallsslightly lower than the square root expression. See Fig. 7.12 of Simoes–Moreira (1994)for further details.
The mass flow rate of liquid along the wall must be distinguished from the liquiddroplets in the main two-phase flow. In the present study, the film thickness was notmeasured. Suggestions for future work include using either light extinction or impedancetechniques to quantify the liquid film. Two additional parameters are introduced intothe model in order to account for the mass of liquid within the film. The void fractionα is defined as the time-average of the fraction of the cross-sectional area occupied bythe vapor phase. The parameter β specifies the time-average fraction of cross-sectionalarea occupied by the liquid film attached to the wall. Parameters α and β are invariantwith respect to the reference frame. In terms of these parameters, the fraction of liquiddroplet mass flow relative to the total liquid mass flow is
EW =
(1 +
βDW
1− α− β
)−1
. (17)
Clearly, this will also be frame dependent.Using these definitions, the conservation equations can be used to derive modified
jump relations:
J =W1
v1
= WV 2
{α
vV 2
+1− α− β
vL2
+βDW
vL2
}, (18)
P1 +W 2
1
v1
= P2 + W 2V 2
{α
vV 2
+1− α− β
vL2
+βD2
W
vL2
}, (19)
and
W1
v1
(h1 +
W 21
2
)=
αWV 2
vV 2
(hV 2 +
W 2V 2
2
)+
βDW WV 2
vL2
(hL2 +
(DW WV 2)2
2
)
+(1− α− β)WV 2
vL2
(hL2 +
W 2V 2
2
). (20)
Equations (18) – (20) and the slip correlation (16) were solved numerically (Simoes–Moreira 1994) for a given upstream condition. The thermodynamic properties of dode-cane were computed (Simoes–Moreira 1994) using the Lee and Kesler (1975) equation ofstate. A family of solutions is shown in Fig. 7 as a function of the entrainment parameter Fig. 7EW and the downstream pressure P2. The homogeneous two-phase flow model is the caseof EW = 1 and the annular two-phase flow without liquid entrainment is the case of EW
= 0. It can be seen in this and subsequent figures that the two limiting models envelop allsolutions for different values of the liquid entrained parameter, EW . In these solutions,the flow has been represented as choked (constant mass flux) when the pressure P2 is lessthan the CJ pressure. One case of supersonic flow (dashed line) is shown to illustratethis type of solution. One data point is shown on this plot from the choked test series.
13

Figure 8 shows the graphical construction of the CJ solution for the two extremes EW Fig. 8= 1 and 0. The tangent intersection of the Rayleigh line and the evaporation adiabat orHugoniot is shown for both cases.
Comparisons of the model and experiment pressure and evaporation wave speed atthe Chapman-Jouguet condition (Table 1) are shown in Figs. 9 and 10. The lower limit Fig. 9
Fig. 10corresponds to numerical results for EW = 1 and the upper limit corresponds to EW =0. Comparisons of computed and measured wave speeds (Table 3) for the isothermal testseries are shown in Fig. 11. For each case in Table 3, the measured downstream pressure Fig. 11was used as input to the computation to determine the wave speed for the subsonic familyof solutions.
Figures 9 and 10 show that the annular flow model without liquid entrainment tendsto overestimate both the downstream pressure and wave speed at the CJ point, whilethe homogeneous model tends to underestimate those quantities. On the other hand,wave speeds (Fig. 11) were predicted reasonably well by the homogeneous model for theisothermal series of tests. A possible explanation for the differences in the numericalresults may be related to the trend of the wave speed vs. downstream pressure curves(Fig. 7). The inclination of the subsonic branch (to the right of the CJ point) is quitesteep and a small perturbation in measured pressure value will result in a large changein wave speed.
6 Complete Evaporation Waves
The form of Eqn. (13) suggests the possibility of complete evaporation waves, i.e., avapor quality x of unity. This possibility is intimately related to the thermodynamicbehavior of the fluid, in particular the characteristics of the saturation properties. Visualinspection of the saturation dome in the temperature-entropy plane (Fig. 12) suggests Fig. 12that as the molecular complexity, i.e., the number of atoms per molecule, increases, thesaturation region tilts to the right. A substance such as dodecane with a characteristicsaturation curve of the type illustrated on the right of Fig. 12 is referred to as retrograde.The vague term regular is used to classify substances like water with a characteristicsaturation dome of the type shown on the left of Fig. 12. The retrograde property isprecisely that the slope of the vapor saturation line is positive,
dS
dT
)σ,V
> 0 (21)
where the subscript “σ, V ” refers to the saturated vapor line.Retrograde and regular fluids are distinguished by the qualitative differences in behav-
ior during an adiabatic process, see Fig. 12. Regular fluids evaporate when a liquid-vapormixture is adiabatically compressed (2→ 1), while retrograde fluids evaporate when adi-abatically expanded (1 → 2).
From the geometry of the T -s diagram it is apparent that if a fluid is sufficientlyretrograde, complete adiabatic phase change is possible (Thompson and Sullivan 1975).
14

Physically, this occurs when the amount of energy stored in the intramolecular degreesof freedom is comparable to, or greater than, the intermolecular attraction that is theorigin of the enthalpy of vaporization. In other words, a fluid is retrograde when thenumber of atoms and the associated vibrational degrees of freedom are sufficiently high. Adimensionless heat capacity may be defined (Thompson and Sullivan 1975) to characterizeretrograde behavior:
Cv =Cv
0(Tc)
R(22)
where Cv0(Tc) is the ideal gas heat capacity at constant volume at the critical point
and R the universal gas constant. The higher Cv, the more pronounced the retrogradebehavior. Thompson and Sullivan (1979) found that retrograde behavior is possible forCv > 11 and a complete adiabatic liquefaction (Thompson and Sullivan 1975) is possiblefor Cv > 24. For adiabatic evaporation waves, complete evaporation (Shepherd et al.1990) can occur for Cv > 33. Dodecane has a value of Cv ≈ 60.4.
One of the goals of the present study was the possibility of experimentally observ-ing complete evaporation waves in a one-dimensional geometry. Previous experimentalstudies (Chaves et al. 1985; Hill 1991) in confined flows have resulted only in two-phasedownstream states. Kurschat et al. (1992) were able to obtain complete evaporation whenthey allowed highly-superheated liquid to expand radially as a supersonic jet in a low-pressure chamber. We believe that there is no fundamental reason why one-dimensional,complete evaporation waves can not occur within a confined, tube-like geometry also.Our computations indicate that if the initial and final conditions and a suitable fluid arecarefully selected, complete evaporation is possible.
An experimental investigation of complete evaporation waves in constant-area, one-dimensional flow presents special problems. Several constraints must be satisfied:
1. The fluid must have sufficient molecular complexity, i.e., the parameter Cv mustbe large enough (Cv > 33, for instance).
2. The amount of superheat must be sufficiently large to store enough energy in themolecules to supply the latent heat of evaporation, i.e., the Jakob number must begreater than one, where Ja = Cp∆T/hLV .
3. The degree of superheat cannot be too high since explosive boiling will occur if Tis higher than about 90% of the critical temperature.
4. The surface finish and interfacial properties must be chosen to suppress nucleation.
Conditions 1 and 2 are fundamentally questions of thermodynamic properties of thetest fluid. It has been estimated (Shepherd et al. 1990) that octane, C8H18, is the simplestfluid for which complete evaporation would be possible. However, the calculations inShepherd et al. (1990) indicated that octane is not a practical choice for experimentssince a large superheat is required, violating condition 3. Further study (Simoes–Moreira
15

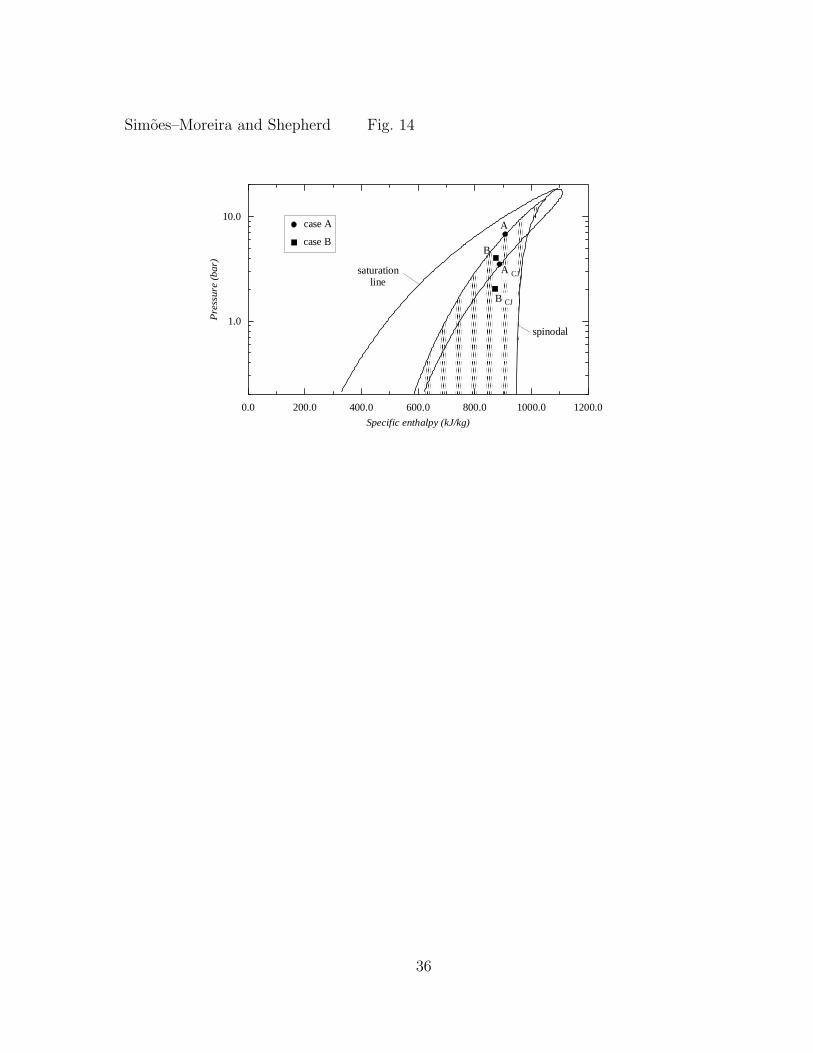
et al. 1993) of this issue determined that dodecane was a more practical choice. Figures 13 Fig. 13and 14 show the results of direct and inverse evaporation adiabat computations which Fig. 14demonstrate the potential for complete evaporation waves.
There exists a range of metastable states that will result in pure vapor downstreamstates, that is, evaporation waves with upstream states inside such regions would resultin a downstream state of vapor. These regions are shown shaded in Figs. 13, 14 and 15. Fig. 15The left side of the shaded region is bounded by the minimum degree of metastabilitythat would give a dry saturated vapor downstream. The right boundary is the liquidspinodal line.
Our experimental results are shown in Fig. 15. As the initial liquid temperaturewas increased, complete evaporation was approached but was not actually obtained.Extrapolating the experimental trend, a complete evaporation wave would be anticipatedin the temperature range of 310◦C to 320◦C. Two trials were done at 315◦C and bothresulted in nucleation either within the fluid or at the test cell wall upstream of theliquid-vapor interface. Photographic evidence of this behavior is shown in Fig. 16. Based Fig. 16on our thermodynamic computations, we had expected to be able to reach the completeevaporation condition at much lower superheats. However, the unexpected increase ofthe liquid pressure prevented us from attaining the predicted superheats. We attributethe increase in pressure to flow losses within the exit section of the apparatus due to thevery nonideal configuration of the connection to the low-pressure reservoir (see Fig. 3).
In the present experiments, vapor quality was not directly measured but could beestimated from solutions to the jump conditions. The estimated vapor quality x forthe choked test series, Fig. 17, confirms the approach toward complete evaporation as Fig. 17the initial temperature increased. The difference between the two models is much lesspronounced for the vapor quality than for the evaporation wave velocity and downstreampressure (Figs. 9 and 10). The estimated vapor quality at 180◦C is nearly 27% for bothmodels and 91% to 94% at T = 300◦C. In agreement with the previous analysis onminimum metastable pressure (Fig. 15), it is predicted that complete evaporation (x =1) would occur between 310◦C and 320◦C.
7 Conclusions
Our experiments have extended previous work on evaporation waves to a highly retro-grade material, dodecane. At modest superheats, we have obtained results similar toprevious studies with regular fluids. We have systematically explored the effect of down-stream conditions and have shown how a maximum mass flux condition is approached asthe superheat is increased. Comparisons of the experiments to a simple control-volumemodel reveal that the flow is best simulated as an annular two-phase flow with somedegree of liquid entrainment.
We fell short of the most ambitious goal of our project, which was to obtain completeevaporation waves. Although we were able to obtain a downstream state that we estimateto be over 90% vapor, nucleation prevented attaining a sufficiently superheated upstream
16

state. Our computations and the trends of the experimental data do not indicate thatthere are any fundamental barriers to obtaining a complete evaporation wave.
The mechanism of the evaporation front instability and propagation still remains tobe clarified. Our observations are very similar to Hill’s and strongly suggest a universalmechanism that causes a very frothy front with bursts of droplets being flung into theflow. However, the spatial and temporal resolution is not sufficient to distinguish ifnucleation occurs within the front or if a more subtle instability is operating.
8 Acknowledgments
The first author thanks CNPq, Conselho Nacional de Desenvolvimento Cientifico e Tec-nologico, Brazil, for the financial support and the Department of Mechanical Engineeringof Escola Politecnica da Universidade de Sao Paulo, Brazil, for granting him a leave ofabsence. This research was carried out at the Graduate Aeronautical Laboratory of theCalifornia Institute of Technology and supported by the Powell fund at Caltech. Bothauthors would like to acknowledge the importance of the ideas of Philip A. Thompson.Philip’s vision of compressible fluid dynamics and deep insight into the role of thermo-dynamics in these flows have had a profound influence on us.
References
Chaves, H. 1984 Phasenubergange und Wellen bei der Entspannung von Fluidenhoher spezifischer Warme. Dissertation, Georg August Universitat, Gottingen.
Chaves, H., Lang, H., Meier, G. E. A., and Speckman, H. D. 1985 Adiabatic PhaseTransition and Wave Splitting in Fluids of High Specific Heat. Flow of RealFluids, G.E. Meier and Thompson, P. A., eds., Springer-Verlag.
Das, P. K., Bhat, G. S. and Arakeri, V. H. 1987 Investigations on the Propagation ofRapid Depressurization of Subcooled Liquid. International Journal of Heat andMass Transfer 6, 975–984.
Dettleff, G., Thompson, P. A., Meier, G. E. A. and Speckmann, H. D. 1979 AnExperimental Study of Liquefaction Shock Waves. Journal of Fluid Mechanics,95, 279–304.
Fauske, H. K. 1962 Contribution to the Theory of Two-Phase, One-ComponentCritical Flow. Argonne National Laboratory Report, ANL–6633.
Frost, D. and Sturtevant, B., 1986 Effects of Ambient Pressure on the Instability ofLiquid Boiling Explosively at the Superheat Limit,” Transactions of the ASME,108, 418–424.
Frost, D., 1988 Dynamics of explosive boiling of a Droplet, Phys. Fluids 31, 2554–2561.
17

Grolmes, M. A. and Fauske, H. K. 1974 Axial Propagation of Free Surface Boilinginto Superheated Liquids in Vertical Tubes. Proceedings of 5th International HeatTransfer Conf., (Tokyo) Vol. IV, 30–34.
Hewitt, G. F. and Hall-Taylor, N. S. 1970 Annular Two-Phase Flow. PergamonPress.
Hill, L. G. and Sturtevant, B., 1990 An Experimental Study of Evaporation Wavesin a Superheated Liquid. Adiabatic Waves in Liquid-Vapor Systems edited byMeier, G. E. A. and Thompson, P. A., Springer-Verlag, 25–37.
Hill, L. G. 1991 An Experimental Study of Evaporation Waves in a SuperheatedLiquid. Ph.D. Thesis, California Institute of Technology, Pasadena, CA.
Kurschat, Th., Chaves, H., and Meier, G. E. A. 1992 Complete Adiabatic Evap-oration of Highly Superheated Liquid Jets, Journal of Fluid Mechanics, 236,43–59.
Labuntsov, D. A. and Avdeev, A. A. 1981 Theory of Boiling Discontinuity.Teplofizika Vysokikh Temperatur 19, 552–556.
Labuntsov, D. A. and Avdeev, A. A. 1982 Mechanism of Flow Blockage InvolvingShock Boiling of Liquids. Teplofizika Vysokikh Temperatur 20, 88–95.
Lee, B. I. and Kesler, M. G. 1975 A Generalized Thermodynamic Correlation Basedon Three-Parameter Corresponding States. AIChE Journal, 21, 510–527.
McCahan, S. M. 1992 Thermodynamic Applications: Rapid Evaporation and Re-acting Flow. Ph.D. Thesis, Rensselaer Polytechnic Institute, Troy, NY.
McCahan, S. and Shepherd, J. E. 1993 Models of Rapid Evaporation in Nonequi-librium Mixtures of Tin and Water. Progress in Astronautics and Aeronautics154, 432–448.
Nguyen, V.T., Furzeland, R.M., and Ijpelaar, M. J. M. 1988 Rapid Evaporation atthe Superheat Limit. International Journal of Heat and Mass Transfer 31(8),1687–1700.
Reid, R. C. 1976 Superheated Liquids. American Scientist, 64, 146 (1976).
Reid, R. C. 1983 Rapid Phase Transition from Liquid to Vapor. Advances in Chem-ical Engineering 12, 105.
Reid, R. C., Prausnitz, J. M., and Poling, B. E. 1987 The Properties of Gases andLiquids. 4th Edition, McGraw-Hill.
Shepherd, J. E., and Sturtevant, B. 1982 Rapid Evaporation at the Superheat Limit.J. of Fluid Mech. 121, 379–402.
Shepherd, J. E., McCahan. S. and Cho, J. 1990 Evaporation Wave Model for Super-heated Liquids. Adiabatic Waves in Liquid-Vapor Systems edited by Meier, G.E. A. and Thompson, P. A., Springer-Verlag, 3–12.
18
Simoes–Moreira, J. R., McCahan, S. and Shepherd, J. E. 1993 Complete EvaporationWaves. Presented at ASME Fluid Engineering Conference, paper no. 93–FE–7,ASME, Washington, D.C.
Simoes–Moreira, J. R. 1994 Adiabatic Evaporation Waves. Ph.D. thesis, RensselaerPolytechnic Institute, Troy, NY.
Simoes–Moreira, J. R. and Shepherd, J. E. 1994 Adiabatic Evaporation Waves. J.of Brazilian Soc. Mech. Sciences, XVI(4), 445-451.
Terner, E. 1962 Shock-Tube Experiments Involving Phase Changes. Industrial &Engineering Chemistry Process Design and Development 1.
Thompson, P.A. 1972 Compressible Fluid Dynamics. McGraw-Hill, 347-352.
Thompson, P. A. and Sullivan, D. A. 1975 On the Possibility of Complete Con-densation Shock Waves in Retrograde Fluids. Journal of Fluid Mechanics, 70639–649.
Thompson, P. A., Chaves, H., Meier, G. E. A., Kim, Y. G. and Speckmann, H.D. 1987 Wave Splitting in a Fluid of Large Heat Capacity. Journal of FluidMechanics 185, 385–414.
Wallis, G. B. 1969 One-Dimensional Two-Phase Flow, McGraw-Hill.
Tables
Table 1: Experimental results: choked flow series of tests.
Ttest Pσ PB PE U(◦C) (bar) (bar) (bar) (cm/s)180 0.39 0.24 0.18 25.3200 0.68 0.33 0.22 30.9216 1.00 0.44 0.28 39.0230 1.39 0.59 0.37 47.2250 2.12 0.83 0.52 64.8270 3.12 1.19 0.73 83.7290 4.45 1.91 1.16 138.1300 5.26 2.12 1.32 157.8
19

Table 2: Dodecane properties (Reid et al. 1987).
molar mass 170.34 g/molcritical pressure 18.2 barcritical temperature 385.05 ◦Ccritical volume 713 cm3/molacentric factor 0.575normal boiling point 216.3 ◦C
Table 3: Experimental results: isothermal series of tests. (T = 230◦C, Pσ = 1.387 bar)
PR PE PB U Observations(bar) (bar) (bar) (cm/s)
1.3–0.8 1.3–0.8 1.3–0.8 – train of bubbles or unstable wave0.7 0.700 0.702 8.1 evaporation wave and slug flow bubble0.6 0.62 0.66 29.0 threshold for evaporation wave0.5 0.54 0.62 39.4 evaporation wave0.4 0.41 0.61 45.3 evaporation wave0.3 0.37 0.60 47.2 evaporation wave0.2 0.46 0.61 45.7 evaporation wave0.1 0.44 0.61 46.5 evaporation wave0.0 0.37 0.59 47.2 evaporation wave
20

Figure Captions
Figure 1: Control volume enclosing the evaporation wave. The evaporation wave ismoving to the left with an average velocity U .
Figure 2: Graphical illustration of possible downstream solutions for an evaporation wavewith a known upstream state.
Figure 3: Diagram of the test facility.
Figure 4: Initiation of an evaporation wave as recorded by motion pictures (T0 = 270◦C,PRES = 1 mbar, U = 83.7 m/s, test dd-f-71). Sucessive frames are approximately 0.33ms apart. The evaporation wave is moving downward and the diaphragm is located outof the field of view, approximately 5 cm above the free surface of the liquid.
Figure 5: Selected still pictures, front views. (a) T0 = 180◦C, PRES = 1 mbar, test dd-p-109; (b) T0 = 200◦C, PRES = 1 mbar, test dd-p-110; (c) T0 = 230◦C, PRES = 1 mbar,test dd-p-112; (d) T0 = 250◦C, PRES = 1 mbar, test dd-p-113; (e) T0 = 270◦C, PRES =1 mbar, test dd-p-114; (f) T0 = 290◦C, PRES = 1 mbar, test dd-p-115.
Figure 6: Example of pressure and temperature signals obtained in the experiments (T0
= 270◦C, PRES = 1 mbar, U = 83.7 m/s, test dd-f-71).
Figure 7: Numerical solution of the wave speed as function of the downstream pressure.The fraction of liquid droplets EW is varied parametrically. The initial temperature isT0 = 250◦C.
Figure 8: Rankine-Hugoniot curves or adiabats and Rayleigh lines for the CJ cases.Numerical solution for T0 = 250◦C.
Figure 9: Comparisons of the numerical solution of the CJ pressure with the measuredvalues for the choked series of tests (see Table 1).
Figure 10: Comparisons of the numerical solution of the CJ wave speed with the measuredvalues for the choked series of tests (see Table 1).
Figure 11: Comparisons of the numerical solution of the CJ wave speed with the measuredvalues for the isothermal series of tests (see Table 3).
21

Figure 12: Temperature-entropy diagrams of: (a) regular substance (water); (b) retro-grade substance (dodecane).
Figure 13: Pressure-volume diagram with two representative starting states and theresulting evaporation adiabats for superheated dodecane. Initial conditions which resultin complete evaporation are shown as the shaded region.
Figure 14: Enthalpy-pressure diagram with two representative starting states and theresulting evaporation adiabats for superheated dodecane. Initial conditions which resultin complete evaporation are shown as the shaded region.
Figure 15: Comparisons of the metastable pressure reached in the experiments and thecriteria for complete evaporation of Simoes–Moreira et al. (1993) .
Figure 16: Selected frames from test dd-f-48, performed at 315 ◦C, the highest temper-ature in our tests. Multiple nucleation sites within the liquid are visible. Frames areapproximately .33 ms apart in time.
Figure 17: Estimated mass vapor quality x as function of initial temperature.
22

Simoes–Moreira and Shepherd Fig. 1
metastable liquidliquid-vapor mixture
V1V2
U
control volumeevaporationwave
23
Simoes–Moreira and Shepherd Fig. 2
Specific volume
Pre
ssure
A
B C
R
R'
initial metastable state
Rayleigh line R, R'
evaporationadiabat
lower C-J point
υ 1
P 1
24

Simoes–Moreira and Shepherd Fig. 3
25

Simoes–Moreira and Shepherd Fig. 4
(a) (b) (c)
(d) (e) (f)
26

Simoes–Moreira and Shepherd Fig. 5
(a) (b) (c)
(d) (e) (f)
27

Simoes–Moreira and Shepherd Fig. 6
0.00 0.10 0.20 0.30time (s)
0.0
1.0
2.0
3.0
4.0
Pre
ssur
e (b
ar)
100
150
200
250
300
Tem
pera
ture
( °
C)
exit temperature
bottom pressure
exit pressuresteady motion
start up
diaphragm burst
28

Simoes–Moreira and Shepherd Fig. 7
� � � � � � � � � � � � � � � � � �E
�xit p� ress ure P2 (bar)
� � �
� � �
� � �
� � �
� � �
Wav
e sp
eed
U (
m/� s
)
� � � � � � � � �
� � � � � � � � � �� � � � � � � � ! " � � !
� # � $ � � � � � �
� � %� � � �
� � � � � � �
� � % & !
# � ' � # � # # � � �� � � � � � ( � � � � ! "
) * + � � � � (
� ' � � � � # � � ( � �� � � � � (
� �
� � � ( � � � #� � � � � � � �
� % & , - � � � "
29

Simoes–Moreira and Shepherd Fig. 8
0.0 0.2 0.4 0.6
Specific volume (m 3 / kg)
0.0
0.2
0.4
0.6
0.8
1.0
Pre
ssur
e (b
ar)
saturationline (vapor)
homogeneous
pure annular
CJ - homog.
CJ - annular
metastable
saturation line (liquid)
Rayleigh lines
adiabats orRankine-Hugoniotcurves
30

Simoes–Moreira and Shepherd Fig. 9
AAAAAAAAAAAAAAAAAAAAAAAAAAAAAAAAAAAAAAAAAAAAAAAAAAAAAAAAAAAAAAAAAAAAAAAAAAAAAAAAAAAAAAAAAAAAAAAAAAAAAAAAAAAAAAAAAAAAAAAAAAAAAAAAAAAAAAAAAAAAAAAAAAAAAAAAAAAAAAAAAAAAAAAAAAAAAAAAAAAA
AAAAAAAAAAAAAAAAAAAAAAAAAAAAAAAAAAAAAAAAAAAAAAAAAAAAAAAAAAAAAAAAAAAAAAAAAAAAAAAAAAAAAAAAAAAAAAAAAAAAAAAAAAAAAAAAAAAAAAAAAAAAAAAAAAAAAAAAAAAAAAAAAAAAAAAAAAAAAAAAAAAAAAAAAAAAAAAAAAAA
AAAAAAAAAAAAAAAAAAAAAAAAAAAAAAAAAAAAAAAAAAAAAAAAAAAAAAAAAAAAAAAAAAAAAAAAAAAAAAAAAAAAAAAAAAAAAAAAAAAAAAAAAAAAAAAAAAAAAAAAAAAAAAAAAAAAAAAAAAAAAAAAAAAAAAAAAAAAAAAAAAAAAAAAAAAAAAAAAAAA
AAAAAAAAAAAAAAAAAAAAAAAAAAAAAAAAAAAAAAAAAAAAAAAAAAAAAAAAAAAAAAAAAAAAAAAAAAAAAAAAAAAAAAAAAAAAAAAAAAAAAAAAAAAAAAAAAAAAAAAAAAAAAAAAAAAAAAAAAAAAAAAAAAAAAAAAAAAAAAAAAAAAAAAAAAAAAAAAAAAA
AAAAAAAAAAAAAAAAAAAAAAAAAAAAAAAAAAAAAAAAAAAAAAAAAAAAAAAAAAAAAAAAAAAAAAAAAAAAAAAAAAAAAAAAAAAAAAAAAAAAAAAAAAAAAAAAAAAAAAAAAAAAAAAAAAAAAAAAAAAAAAAAAAAAAAAAAAAAAAAAAAAAAAAAAAAAAAAAAAAA
AAAAAAAAAAAAAAAAAAAAAAAAAAAAAAAAAAAAAAAAAAAAAAAAAAAAAAAAAAAAAAAAAAAAAAAAAAAAAAAAAAAAAAAAAAAAAAAAAAAAAAAAAAAAAAAAAAAAAAAAAAAAAAAAAAAAAAAAAAAAAAAAAAAAAAAAAAAAAAAAAAAAAAAAAAAAAAAAAAAA
AAAAAAAAAAAAAAAAAAAAAAAAAAAAAAAAAAAAAAAAAAAAAAAAAAAAAAAAAAAAAAAAAAAAAAAAAAAAAAAAAAAAAAAAAAAAAAAAAAAAAAAAAAAAAAAAAAAAAAAAAAAAAAAAAAAAAAAAAAAAAAAAAAAAAAAAAAAAAAAAAAAAAAAAAAAAAAAAAAAA
AAAAAAAAAAAAAAAAAAAAAAAAAAAAAAAAAAAAAAAAAAAAAAAAAAAAAAAAAAAAAAAAAAAAAAAAAAAAAAAAAAAAAAAAAAAAAAAAAAAAAAAAAAAAAAAAAAAAAAAAAAAAAAAAAAAAAAAAAAAAAAAAAAAAAAAAAAAAAAAAAAAAAAAAAAAAAAAAAAAA
AAAAAAAAAAAAAAAAAAAAAAAAAAAAAAAAAAAAAAAAAAAAAAAAAAAAAAAAAAAAAAAAAAAAAAAAAAAAAAAAAAAAAAAAAAAAAAAAAAAAAAAAAAAAAAAAAAAAAAAAAAAAAAAAAAAAAAAAAAAAAAAAAAAAAAAAAAAAAAAAAAAAAAAAAAAAAAAAAAAA
AAAAAAAAAAAAAAAAAAAAAAAAAAAAAAAAAAAAAAAAAAAAAAAAAAAAAAAAAAAAAAAAAAAAAAAAAAAAAAAAAAAAAAAAAAAAAAAAAAAAAAAAAAAAAAAAAAAAAAAAAAAAAAAAAAAAAAAAAAAAAAAAAAAAAAAAAAAAAAAAAAAAAAAAAAAAAAAAAAAA
AAAAAAAAAAAAAAAAAAAAAAAAAAAAAAAAAAAAAAAAAAAAAAAAAAAAAAAAAAAAAAAAAAAAAAAAAAAAAAAAAAAAAAAAAAAAAAAAAAAAAAAAAAAAAAAAAAAAAAAAAAAAAAAAAAAAAAAAAAAAAAAAAAAAAAAAAAAAAAAAAAAAAAAAAAAAAAAAAAAA
AAAAAAAAAAAAAAAAAAAAAAAAAAAAAAAAAAAAAAAAAAAAAAAAAAAAAAAAAAAAAAAAAAAAAAAAAAAAAAAAAAAAAAAAAAAAAAAAAAAAAAAAAAAAAAAAAAAAAAAAAAAAAAAAAAAAAAAAAAAAAAAAAAAAAAAAAAAAAAAAAAAAAAAAAAAAAAAAAAAA
AAAAAAAAAAAAAAAAAAAAAAAAAAAAAAAAAAAAAAAAAAAAAAAAAAAAAAAAAAAAAAAAAAAAAAAAAAAAAAAAAAAAAAAAAAAAAAAAAAAAAAAAAAAAAAAAAAAAAAAAAAAAAAAAAAAAAAAAAAAAAAAAAAAAAAAAAAAAAAAAAAAAAAAAAAAAAAAAAAAA
AAAAAAAAAAAAAAAAAAAAAAAAAAAAAAAAAAAAAAAAAAAAAAAAAAAAAAAAAAAAAAAAAAAAAAAAAAAAAAAAAAAAAAAAAAAAAAAAAAAAAAAAAAAAAAAAAAAAAAAAAAAAAAAAAAAAAAAAAAAAAAAAAAAAAAAAAAAAAAAAAAAAAAAAAAAAAAAAAAAA
AAAAAAAAAAAAAAAAAAAAAAAAAAAAAAAAAAAAAAAAAAAAAAAAAAAAAAAAAAAAAAAAAAAAAAAAAAAAAAAAAAAAAAAAAAAAAAAAAAAAAAAAAAAAAAAAAAAAAAAAAAAAAAAAAAAAAAAAAAAAAAAAAAAAAAAAAAAAAAAAAAAAAAAAAAAAAAAAAAAA
AAAAAAAAAAAAAAAAAAAAAAAAAAAAAAAAAAAAAAAAAAAAAAAAAAAAAAAAAAAAAAAAAAAAAAAAAAAAAAAAAAAAAAAAAAAAAAAAAAAAAAAAAAAAAAAAAAAAAAAAAAAAAAAAAAAAAAAAAAAAAAAAAAAAAAAAAAAAAAAAAAAAAAAAAAAAAAAAAAAA
AAAAAAAAAAAAAAAAAAAAAAAAAAAAAAAAAAAAAAAAAAAAAAAAAAAAAAAAAAAAAAAAAAAAAAAAAAAAAAAAAAAAAAAAAAAAAAAAAAAAAAAAAAAAAAAAAAAAAAAAAAAAAAAAAAAAAAAAAAAAAAAAAAAAAAAAAAAAAAAAAAAAAAAAAAAAAAAAAAAA
AAAAAAAAAAAAAAAAAAAAAAAAAAAAAAAAAAAAAAAAAAAAAAAAAAAAAAAAAAAAAAAAAAAAAAAAAAAAAAAAAAAAAAAAAAAAAAAAAAAAAAAAAAAAAAAAAAAAAAAAAAAAAAAAAAAAAAA
0.0 0.5 1.0 1.5Downstream pressure (bar)
(measured)
0.0
0.5
1.0
1.5
Do
wn
stre
am
pre
ssu
re (
ba
r) (s
imula
tion)
E W
= 0 - pure annular two-phase flow (upper limit)
E W
= 1 - homogeneous two-phase flow (lower limit)
Experimental result
AAAAAAAAAAAAAAAA
Numerical simulationfor entrainment E
W in
the range 0 - 1
31

Simoes–Moreira and Shepherd Fig. 10
AAAAAAAAAAAAAAAAAAAAAAAAAAAAAAAAAAAAAAAAAAAAAAAAAAAAAAAAAAAAAAAAAAAAAAAAAAAAAAAAAAAAAAAAAAAAAAAAAAAAAAAAAAAAAAAAAAAAAAAAAAAAAAAAAAAAAAAAAAAAAAAAAAAAAAAAAAAA
AAAAAAAAAAAAAAAAAAAAAAAAAAAAAAAAAAAAAAAAAAAAAAAAAAAAAAAAAAAAAAAAAAAAAAAAAAAAAAAAAAAAAAAAAAAAAAAAAAAAAAAAAAAAAAAAAAAAAAAAAAAAAAAAAAAAAAAAAAAAAAAAAAAAAAAAAAAA
AAAAAAAAAAAAAAAAAAAAAAAAAAAAAAAAAAAAAAAAAAAAAAAAAAAAAAAAAAAAAAAAAAAAAAAAAAAAAAAAAAAAAAAAAAAAAAAAAAAAAAAAAAAAAAAAAAAAAAAAAAAAAAAAAAAAAAAAAAAAAAAAAAAAAAAAAAAA
AAAAAAAAAAAAAAAAAAAAAAAAAAAAAAAAAAAAAAAAAAAAAAAAAAAAAAAAAAAAAAAAAAAAAAAAAAAAAAAAAAAAAAAAAAAAAAAAAAAAAAAAAAAAAAAAAAAAAAAAAAAAAAAAAAAAAAAAAAAAAAAAAAAAAAAAAAAA
AAAAAAAAAAAAAAAAAAAAAAAAAAAAAAAAAAAAAAAAAAAAAAAAAAAAAAAAAAAAAAAAAAAAAAAAAAAAAAAAAAAAAAAAAAAAAAAAAAAAAAAAAAAAAAAAAAAAAAAAAAAAAAAAAAAAAAAAAAAAAAAAAAAAAAAAAAAA
AAAAAAAAAAAAAAAAAAAAAAAAAAAAAAAAAAAAAAAAAAAAAAAAAAAAAAAAAAAAAAAAAAAAAAAAAAAAAAAAAAAAAAAAAAAAAAAAAAAAAAAAAAAAAAAAAAAAAAAAAAAAAAAAAAAAAAAAAAAAAAAAAAAAAAAAAAAA
AAAAAAAAAAAAAAAAAAAAAAAAAAAAAAAAAAAAAAAAAAAAAAAAAAAAAAAAAAAAAAAAAAAAAAAAAAAAAAAAAAAAAAAAAAAAAAAAAAAAAAAAAAAAAAAAAAAAAAAAAAAAAAAAAAAAAAAAAAAAAAAAAAAAAAAAAAAA
AAAAAAAAAAAAAAAAAAAAAAAAAAAAAAAAAAAAAAAAAAAAAAAAAAAAAAAAAAAAAAAAAAAAAAAAAAAAAAAAAAAAAAAAAAAAAAAAAAAAAAAAAAAAAAAAAAAAAAAAAAAAAAAAAAAAAAAAAAAAAAAAAAAAAAAAAAAA
AAAAAAAAAAAAAAAAAAAAAAAAAAAAAAAAAAAAAAAAAAAAAAAAAAAAAAAAAAAAAAAAAAAAAAAAAAAAAAAAAAAAAAAAAAAAAAAAAAAAAAAAAAAAAAAAAAAAAAAAAAAAAAAAAAAAAAAAAAAAAAAAAAAAAAAAAAAA
AAAAAAAAAAAAAAAAAAAAAAAAAAAAAAAAAAAAAAAAAAAAAAAAAAAAAAAAAAAAAAAAAAAAAAAAAAAAAAAAAAAAAAAAAAAAAAAAAAAAAAAAAAAAAAAAAAAAAAAAAAAAAAAAAAAAAAAAAAAAAAAAAAAAAAAAAAAA
AAAAAAAAAAAAAAAAAAAAAAAAAAAAAAAAAAAAAAAAAAAAAAAAAAAAAAAAAAAAAAAAAAAAAAAAAAAAAAAAAAAAAAAAAAAAAAAAAAAAAAAAAAAAAAAAAAAAAAAAAAAAAAAAAAAAAAAAAAAAAAAAAAAAAAAAAAAA
AAAAAAAAAAAAAAAAAAAAAAAAAAAAAAAAAAAAAAAAAAAAAAAAAAAAAAAAAAAAAAAAAAAAAAAAAAAAAAAAAAAAAAAAAAAAAAAAAAAAAAAAAAAAAAAAAAAAAAAAAAAAAAAAAAAAAAAAAAAAAAAAAAAAAAAAAAAA
AAAAAAAAAAAAAAAAAAAAAAAAAAAAAAAAAAAAAAAAAAAAAAAAAAAAAAAAAAAAAAAAAAAAAAAAAAAAAAAAAAAAAAAAAAAAAAAAAAAAAAAAAAAAAAAAAAAAAAAAAAAAAAAAAAAAAAAAAAAAAAAAAAAAAAAAAAAA
AAAAAAAAAAAAAAAAAAAAAAAAAAAAAAAAAAAAAAAAAAAAAAAAAAAAAAAAAAAAAAAAAAAAAAAAAAAAAAAAAAAAAAAAAAAAAAAAAAAAAAAAAAAAAAAAAAAAAAAAAAAAAAAAAAAAAAAAAAAAAAAAAAAAAAAAAAAA
AAAAAAAAAAAAAAAAAAAAAAAAAAAAAAAAAAAAAAAAAAAAAAAAAAAAAAAAAAAAAAAAAAAAAAAAAAAAAAAAAAAAAAAAAAAAAAAAAAAAAAAAAAAAAAAAAAAAAAAAAAAAAAAAAAAAAAAAAAAAAAAAAAAAAAAAAAAA
AAAAAAAAAAAAAAAAAAAAAAAAAAAAAAAAAAAAAAAAAAAAAAAAAAAAAAAAAAAAAAAAAAAAAAAAAAAAAAAAAAAAAAAAAAAAAAAAAAAAAAAAAAAAAAAAAAAAAAAAAAAAAAAAAAAAAAAAAAAAAAAAAAAAAAAAAAAA
AAAAAAAAAAAAAAAAAAAAAAAAAAAAAAAAAAAAAAAAAAAAAAAAAAAAAAAAAAAAAAAAAAAAAAAAAAAAAAAAAAAAAAAAAAAAAAAAAAAAAAAAAAAAAAAAAAAAAAAAAAAAAAAAAAAAAAAAAAAAAAAAAAAAAAAAAAAA
AAAAAAAAAAAAAAAAAAAAAAAAAAAAAAAAAAAAAAA
0.0 0.5 1.0 1.5Wave speed (m/s)
(measured)
0.0
0.5
1.0
1.5W
ave
sp
ee
d (
m/s
)(s
imu
lation
)
E W
= 0 - pure annular two-phase flow (upper limit)
E W
= 1 - homogeneous two-phase flow (lower limit)
Experimentalresult
AAAAAAAAAAAA
Numerical simulationfor entrainment E
W in
the range 0 - 1
32

Simoes–Moreira and Shepherd Fig. 11
AAAAAAAAAAAAAAAAAAAAAAAAAAAAAAAAAAAAAAAAAAAAAAAAAAAAAAAAAAAAAAAAAAAAAAAAAAAAAAAAAAAAAAAAAAAAAAAAAAAAAAAAAAAAAAAAAAAAAAAAAAAAAAAAAAAAAAAAAAAAAAAAAAAAAAAAAAAAAAAAAAAAAAAAAAAAAAAAAAAA
AAAAAAAAAAAAAAAAAAAAAAAAAAAAAAAAAAAAAAAAAAAAAAAAAAAAAAAAAAAAAAAAAAAAAAAAAAAAAAAAAAAAAAAAAAAAAAAAAAAAAAAAAAAAAAAAAAAAAAAAAAAAAAAAAAAAAAAAAAAAAAAAAAAAAAAAAAAAAAAAAAAAAAAAAAAAAAAAAAAA
AAAAAAAAAAAAAAAAAAAAAAAAAAAAAAAAAAAAAAAAAAAAAAAAAAAAAAAAAAAAAAAAAAAAAAAAAAAAAAAAAAAAAAAAAAAAAAAAAAAAAAAAAAAAAAAAAAAAAAAAAAAAAAAAAAAAAAAAAAAAAAAAAAAAAAAAAAAAAAAAAAAAAAAAAAAAAAAAAAAA
AAAAAAAAAAAAAAAAAAAAAAAAAAAAAAAAAAAAAAAAAAAAAAAAAAAAAAAAAAAAAAAAAAAAAAAAAAAAAAAAAAAAAAAAAAAAAAAAAAAAAAAAAAAAAAAAAAAAAAAAAAAAAAAAAAAAAAAAAAAAAAAAAAAAAAAAAAAAAAAAAAAAAAAAAAAAAAAAAAAA
AAAAAAAAAAAAAAAAAAAAAAAAAAAAAAAAAAAAAAAAAAAAAAAAAAAAAAAAAAAAAAAAAAAAAAAAAAAAAAAAAAAAAAAAAAAAAAAAAAAAAAAAAAAAAAAAAAAAAAAAAAAAAAAAAAAAAAAAAAAAAAAAAAAAAAAAAAAAAAAAAAAAAAAAAAAAAAAAAAAA
AAAAAAAAAAAAAAAAAAAAAAAAAAAAAAAAAAAAAAAAAAAAAAAAAAAAAAAAAAAAAAAAAAAAAAAAAAAAAAAAAAAAAAAAAAAAAAAAAAAAAAAAAAAAAAAAAAAAAAAAAAAAAAAAAAAAAAAAAAAAAAAAAAAAAAAAAAAAAAAAAAAAAAAAAAAAAAAAAAAA
AAAAAAAAAAAAAAAAAAAAAAAAAAAAAAAAAAAAAAAAAAAAAAAAAAAAAAAAAAAAAAAAAAAAAAAAAAAAAAAAAAAAAAAAAAAAAAAAAAAAAAAAAAAAAAAAAAAAAAAAAAAAAAAAAAAAAAAAAAAAAAAAAAAAAAAAAAAAAAAAAAAAAAAAAAAAAAAAAAAA
AAAAAAAAAAAAAAAAAAAAAAAAAAAAAAAAAAAAAAAAAAAAAAAAAAAAAAAAAAAAAAAAAAAAAAAAAAAAAAAAAAAAAAAAAAAAAAAAAAAAAAAAAAAAAAAAAAAAAAAAAAAAAAAAAAAAAAAAAAAAAAAAAAAAAAAAAAAAAAAAAAAAAAAAAAAAAAAAAAAA
AAAAAAAAAAAAAAAAAAAAAAAAAAAAAAAAAAAAAAAAAAAAAAAAAAAAAAAAAAAAAAAAAAAAAAAAAAAAAAAAAAAAAAAAAAAAAAAAAAAAAAAAAAAAAAAAAAAAAAAAAAAAAAAAAAAAAAAAAAAAAAAAAAAAAAAAAAAAAAAAAAAAAAAAAAAAAAAAAAAA
AAAAAAAAAAAAAAAAAAAAAAAAAAAAAAAAAAAAAAAAAAAAAAAAAAAAAAAAAAAAAAAAAAAAAAAAAAAAAAAAAAAAAAAAAAAAAAAAAAAAAAAAAAAAAAAAAAAAAAAAAAAAAAAAAAAAAAAAAAAAAAAAAAAAAAAAAAAAAAAAAAAAAAAAAAAAAAAAAAAA
AAAAAAAAAAAAAAAAAAAAAAAAAAAAAAAAAAAAAAAAAAAAAAAAAAAAAAAAAAAAAAAAAAAAAAAAAAAAAAAAAAAAAAAAAAAAAAAAAAAAAAAAAAAAAAAAAAAAAAAAAAAAAAAAAAAAAAAAAAAAAAAAAAAAAAAAAAAAAAAAAAAAAAAAAAAAAAAAAAAA
AAAAAAAAAAAAAAAAAAAAAAAAAAAAAAAAAAAAAAAAAAAAAAAAAAAAAAAAAAAAAAAAAAAAAAAAAAAAAAAAAAAAAAAAAAAAAAAAAAAAAAAAAAAAAAAAAAAAAAAAAAAAAAAAAAAAAAAAAAAAAAAAAAAAAAAAAAAAAAAAAAAAAAAAAAAAAAAAAAAA
AAAAAAAAAAAAAAAAAAAAAAAAAAAAAAAAAAAAAAAAAAAAAAAAAAAAAAAAAAAAAAAAAAAAAAAAAAAAAAAAAAAAAAAAAAAAAAAAAAAAAAAAAAAAAAAAAAAAAAAAAAAAAAAAAAAAAAAAAAAAAAAAAAAAAAAAAAAAAAAAAAAAAAAAAAAAAAAAAAAA
AAAAAAAAAAAAAAAAAAAAAAAAAAAAAAAAAAAAAAAAAAAAA
0.0 0.1 0.2 0.3 0.4 0.5 0.6 0.7Wave speed (m/s)
(measured)
0.0
0.1
0.2
0.3
0.4
0.5
0.6
0.7
Wave
sp
eed
(m
/s)
(sim
ula
tion)
E W
= 0 - pure annular two-phase flow (upper limit)
E W
= 1 - homogeneous two-phase flow (lower limit)
Experimental result
AAAAAAAAAAAAAAAA
Numerical simulationfor entrainment E
W in
the range 0 - 1
33

Simoes–Moreira and Shepherd Fig. 12
0.0 0.5 1.0 1.5 2.0 2.5
normalized specific entropy
100.0
150.0
200.0
250.0
300.0
350.0
400.0
Tem
pera
ture
( °
C)
water
dodecane
CP CP
� � �
2
1 1
2
process 1 - 2 is an isentropic expansion
34

Simoes–Moreira and Shepherd Fig. 13
AAAAAAAAAAAAAAAAAAAAAAAAAAAAAAAAAAAAAAAAAAAAAAAAAAAAAAAAAAAAAAAAAAAAAAAAAAAAAAAAAAAAAAAAAAAAAAAAAAAAAAAAAAAAAAAAAAAAAAAAAAAAAAAAAAAAAAAAAAAAAAAAAAAAAAAAAAAAAAAAAAAAAAAAAAAAAAAAAAAAAAAAAAAAAAAAAAAAAAAAAAAAAAAAAAAAAAAAAAAAAAAAAAAAAAAAAAAAAAAAAAAAAAAAAAAAAAAA
AAAAAAAAAAAAAAAAAAAAAAAAAAAAAAAAAAAAAAAAAAAAAAAAAAAAAAAAAAAAAAAAAAAAAAAAAAAAAAAAAAAAAAAAAAAAAAAAAAAAAAAAAAAAAAAAAAAAAAAAAAAAAAAAAAAAAAAAAAAAAAAAAAAAAAAAAAAAAAAAAAAAAAAAAAAAAAAAAAAAAAAAAAAAAAAAAAAAAAAAAAAAAAAAAAAAAAAAAAAAAAAAAAAAAAAAAAAAAAAAAAAAAAAAAAAAAAAA
0.001 0.01 0.1 1
Specific volume (m 3 / kg)
0.0
5.0
10.0
15.0
20.0
Pre
ssure
(bar)
A
B A CJ
B CJ
spinodal
saturationline
evaporationadiabat for A
evaporationadiabat for B
35
Simoes–Moreira and Shepherd Fig. 14
AAAAAAAAAAAAAAAAAAAAAAAAAAAAAAAAAAAAAAAAAAAAAAAAAAAAAAAAAAAAAAAAAAAAAAAAAAAAAAAAAAAAAAAAAAAAAAAAAAAAAAAAAAAAAAAAAAAAAAAAAAAAAAAAAAAAAAAAAAAAAAAAAAAAAAAAAAAAAAAAAAAAAAAAAAAAAAAAAAAAAAAAAAAAAAAAAAAAAAAAAAAAAAAAAAAA
AAAAAAAAAAAAAAAAAAAAAAAAAAAAAAAAAAAAAAAAAAAAAAAAAAAAAAAAAAAAAAAAAAAAAAAAAAAAAAAAAAAAAAAAAAAAAAAAAAAAAAAAAAAAAAAAAAAAAAAAAAAAAAAAAAAAAAAAAAAAAAAAAAAAAAAAAAAAAAAAAAAAAAAAAAAAAAAAAAAAAAAAAAAAAAAAAAAAAAAAAAAAAAAAAAAA
AAAAAAAAAAAAAAAAAAAAAAAAAAAAAAAAAAAAAAAAAAAAAAAAAAAAAAAAAAAAAAAAAAAAAAAAAAAAAAAAAAAAAAAAAAAAAAAAAAAAAAAAAAAAAAAAAAAAAAAAAAAAAAAAAAAAAAAAAAAAAAAAAAAAAAAAAAAAAAAAAAAAAAAAAAAAAAAAAAAAAAAAAAAAAAAAAAAAAAAAAAAAAAAAAAAA
AAAAAAAAAAAAAAAAAAAAAAAAAAAAAAAAAAAAAAAAAAAAAAAAAAAAAAAAAAAAAAAAAAAAAAAAAAAAAAAAAAAAAAAAAAAAAAAAAAAAAAAAAAAAAAAAAAAAAAAAAAAAAAAAAAAAAAAAAAAAAAAAAAAAAAAAAAAAAAAAAAAAAAAAAAAAAAAAAAAAAAAAAAAAAAAAAAAAAAAAAAAAAAAAAAAA
AAAAAAAAAAAAAAAAAAAAAAAAAAAAAAAAAAAAAAAAAAAAAAAAAAAAAAAAAAAAAAAAAAAAAAAAAAAAAAAAAAAAAAAAAAAAAAAAAAAAAAAAAAAAAAAAAAAAAAAAAAAAAAAAAAAAAAAAAAAAAAAAAAAAAAAAAAAAAAAAAAAAAAAAAAAAAAAAAAAAAAAAAAAAAAAAAAAAAAAAAAAAAAAAAAAA
AAAAAAAAAAAAAAAAAAAAAAAAAAAAAAAAAAAAAAAAAAAAAAAAAAAAAAAAAAAAAAAAAAAAAAAAAAAAAAAAAAAAAAAAAAAAAAAAAAAAAAAAAAAAAAAAAAAAAAAAAAAAAAAAAAAAAAAAAAAAAAAAAAAAAAAAAAAAAAAAAAAAAAAAAAAAAAAAAAAAAAAAAAAAAAAAAAAAAAAAAAAAAAAAAAAA
AAAAAAAAAAAAAAAAAAAAAAAAAAAAAAAAAAAAAAAAAAAAAAAAAAAAAAAAAAAAAAAAAAAAAAAAAAAAAAAAAAAAAAAAAAAAAAAAAAAAAAAAAAAAAAAAAAAAAAAAAAAAAAAAAAAAAAAAAAAAAAAAAAAAAAAAAAAAAAAAAAAAAAAAAAAAAAAAAAAAAAAAAAAAAAAAAAAAAAAAAAAAAAAAAAAA
AAAAAAAAAAAAAAAAAAAAAAAAAAAAAAAAAAAAAAAAAAAAAAAAAAAAAAAAAAAAAAAAAAAAAAAAAAAAAAAAAAAAAAAAAAAAAAAAAAAAAAAAAAAAAAAAAAAAAAAAAAAAAAAAAAAAAAAAAAAAAAAAAAAAAAAAAAAAAAAAAAAAAAAAAAAAAAAAAAAAAAAAAAAAAAAAAAAAAAAAAAAAAAAAAAAA
AAAAAAAAAAAAAAAAAAAAAAAAAAAAAAAAAAAAAAAAAAAAAAAAAAAAAAAAAAAAAAAAAAAAAAAAAAAAAAAAAAAAAAAAAAAAAAAAAAAAAAAAAAAAAAAAAAAAAAAAAAAAAAAAAAAAAAAAAAAAAAAAAAAAAAAAAAAAAAAAAAAAAAAAAAAAAAAAAAAAAAAAAAAAAAAAAAAAAAAAAAAAAAAAAAAA
0.0 200.0 400.0 600.0 800.0 1000.0 1200.0
Specific enthalpy (kJ/kg)
1.0
10.0P
ress
ure
(b
ar)
A
A CJ
B
B CJ
case A
case B
saturationline
spinodal
36

Simoes–Moreira and Shepherd Fig. 15
0.0
1.0
2.0
3.0
4.0
5.0
Pre
ssu
re (
bar)
saturation line
liquidspinodal
AAAAAAAAAAAAAAAAAAAAAAAAAAAAAAAAAAAAAAAAAAAAAAAAAAAAAAAAAAAAAAAAAAAAAAAAAAAAAAAAAAAAAAAAAAAAAAAAAAAAAAAAAAAAAAAAAAAAAAAAAAAAAAAAAAAAAAAAAAAAAAAAAAAAAAAAAAAAAAAAAAAAAAAAAAAAAAAAAAAAAAAAAAAAAAAAAAAAAAAAAAAAAAAAAAAAAAAAAAAAAAAAAAAAAAAA
AAAAAAAAAAAAAAAAAAAAAAAAAAAAAAAAAAAAAAAAAAAAAAAAAAAAAAAAAAAAAAAAAAAAAAAAAAAAAAAAAAAAAAAAAAAAAAAAAAAAAAAAAAAAAAAAAAAAAAAAAAAAAAAAAAAAAAAAAAAAAAAAAAAAAAAAAAAAAAAAAAAAAAAAAAAAAAAAAAAAAAAAAAAAAAAAAAAAAAAAAAAAAAAAAAAAAAAAAAAAAAAAAAAAAAAA
AAAAAAAAAAAAAAAAAAAAAAAAAAAAAAAAAAAAAAAAAAAAAAAAAAAAAAAAAAAAAAAAAAAAAAAAAAAAAAAAAAAAAAAAAAAAAAAAAAAAAAAAAAAAAAAAAAAAAAAAAAAAAAAAAAAAAAAAAAAAAAAAAAAAAAAAAAAAAAAAAAAAAAAAAAAAAAAAAAAAAAAAAAAAAAAAAAAAAAAAAAAAAAAAAAAAAAAAAAAAAAAAAAAAAAAA
AAAAAAAAAAAAAAAAAAAAAAAAAAAAAAAAAAAAAAAAAAAAAAAAAAAAAAAAAAAAAAAAAAAAAAAAAAAAAAAAAAAAAAAAAAAAAAAAAAAAAAAAAAAAAAAAAAAAAAAAAAAAAAAAAAAAAAAAAAAAAAAAAAAAAAAAAAAAAAAAAAAAAAAAAAAAAAAAAAAAAAAAAAAAAAAAAAAAAAAAAAAAAAAAAAAAAAAAAAAAAAAAAAAAAAAA
AAAAAAAAAAAAAAAAAAAAAAAAAAAAAAAAAAAAAAAAAAAAAAAAAAAAAAAAAAAAAAAAAAAAAAAAAAAAAAAAAAAAAAAAAAAAAAAAAAAAAAAAAAAAAAAAAAAAAAAAAAAAAAAAAAAAAAAAAAAAAAAAAAAAAAAAAAAAAAAAAAAAAAAAAAAAAAAAAAAAAAAAAAAAAAAAAAAAAAAAAAAAAAAAAAAAAAAAAAAAAAAAAAAAAAAA
AAAAAAAAAAAAAAAAAAAAAAAAAAAAAAAAAAAAAAAAAAAAAAAAAAAAAAAAAAAAAAAAAAAAAAAAAAAAAAAAAAAAAAAAAAAAAAAAAAAAAAAAAAAAAAAAAAAAAAAAAAAAAAAAAAAAAAAAAAAAAAAAAAAAAAAAAAAAAAAAAAAAAAAAAAAAAAAAAAAAAAAAAAAAAAAAAAAAAAAAAAAAAAAAAAAAAAAAAAAAAAAAAAAAAAAA
AAAAAAAAAAAAAAAAAAAAAAAAAAAAAAAAAAAAAAAAAAAAAAAAAAAAAAAAAAAAAAAAAAAAAAAAAAAAAAAAAAAAAAAAAAAAAAAAAAAAAAAAAAAAAAAAAAAAAAAAAAAAAAAAAAAAAAAAAAAAAAAAAAAAAAAAAAAAAAAAAAAAAAAAAAAAAAAAAAAAAAAAAAAAAAAAAAAAAAAAAAAAAAAAAAAAAAAAAAAAAAAAAAAAAAAA
AAAAAAAAAAAAAAAAAAAAAAAAAAAAAAAAAAAAAAAAAAAAAAAAAAAAAAAAAAAAAAAAAAAAAAAAAAAAAAAAAAAAAAAAAAAAAAAAAAAAAAAAAAAAAAAAAAAAAAAAAAAAAAAAAAAAAAAAAAAAAAAAAAAAAAAAAAAAAAAAAAAAAAAAAAAAAAAAAAAAAAAAAAAAAAAAAAAAAAAAAAAAAAAAAAAAAAAAAAAAAAAAAAAAAAAA
AAAAAAAAAAAAAAAAAAAAAAAAAAAAAAAAAAAAAAAAAAAAAAAAAAAAAAAAAAAAAAAAAAAAAAAAAAAAAAAAAAAAAAAAAAAAAAAAAAAAAAAAAAAAAAAAAAAAAAAAAAAAAAAAAAAAAAAAAAAAAAAAAAAAAAAAAAAAAAAAAAAAAAAAAAAAAAAAAAAAAAAAAAAAAAAAAAAAAAAAAAAAAAAAAAAAAAAAAAAAAAAAAAAAAAAA
AAAAAAAAAAAAAAAAAAAAAAAAAAAAAAAAAAAAAAAAAAAAAAAAAAAAAAAAAAAAAAAAAAAAAAAAAAAAAAAAAAAAAAAAAAAAAAAAAAAAAAAAAAAAAAAAAAAAAAAAAAAAAAAAAAAAAAAAAAAAAAAAAAAAAAAAAAAAAAAAAAAAAAAAAAAAAAAAAAAAAAAAAAAAAAAAAAAAAAAAAAAAAAAAAAAAAAAAAAAAAAAAAAAAAAAA
AAAAAAAAAAAAAAAAAAAAAAAAAAAAAAAAAAAAAAAAAAAAAAAAAAAAAAAAAAAAAAAAAAAAAAAAAAAAAAAAAAAAAAAAAAAAAAAAAAAAAAAAAAAAAAAAAAAAAAAAAAAAAAAAAAAAAAAAAAAAAAAAAAAAAAAAAAAAAAAAAAAAAAAAAAAAAAAAAAAAAAAAAAAAAAAAAAAAAAAAAAAAAAAAAAAAAAAAAAAAAAAAAAAAAAAA
AAAAAAAAAAAAAAAAAAAAAAAAAAAAAAAAAAAAAAAAAAAAAAAAAAAAAAAAAAAAAAAAAAAAAAAAAAAAAAAAAAAAAAAAAAAAAAAAAAAAAAAAAAAAAAAAAAAAAAAAAAAAAAAAAAAAAAAAAAAAAAAAAAAAAAAAAAAAAAAAAAAAAAAAAAAAAAAAAAAAAAAAAAAAAAAAAAAAAAAAAAAAAAAAAAAAAAAAAAAAAAAAAAAAAAAA
100 150 200 250 300 350 400Initial temperature (°C)
minimum condition forcomplete evaporation
P BOT experimental
complete evaporationregion
37

Simoes–Moreira and Shepherd Fig. 16
(a) (b) (c) (d) (e) (f)
38

Simoes–Moreira and Shepherd Fig. 17
180 200 220 240 260 280 300Initial temperature (°C)
0
20
40
60
80
100
Va
po
r q
ua
lity
(%)
(s
imu
latio
n)
E W =0 - pure annular two-phase flow (upper limit)
E W =1 - homogeneous two-phase flow (lower limit)
AAAAAAAAA
Numerical simulationfor entrainment E W inthe range 0 - 1
AAAAAAAAAAAAAAAAAAAAAAAAAAAAAAAAAAAAAAAAAAAAAAAAAAAAAAAAAAAAAAAAAAAAAAAAAAAAAAAAAAAAAAAAAAAAAAAAAAAAAAAAAAAAAAAAAAAAAAAAAAAAAAAAAAAAAAAAAAAAAAAAAAAAAAAA
AAAAAAAAAAAAAAAAAAAAAAAAAAAAAAAAAAAAAAAAAAAAAAAAAAAAAAAAAAAAAAAAAAAAAAAAAAAAAAAAAAAAAAAAAAAAAAAAAAAAAAAAAAAAAAAAAAAAAAAAAAAAAAAAAAAAAAAAAAAAAAAAAAAAAAAA
AAAAAAAAAAAAAAAAAAAAAAAAAAAAAAAAAAAAAAAAAAAAAAAAAAAAAAAAAAAAAAAAAAAAAAAAAAAAAAAAAAAAAAAAAAAAAAAAAAAAAAAAAAAAAAAAAAAAAAAAAAAAAAAAAAAAAAAAAAAAAAAAAAAAAAAA
AAAAAAAAAAAAAAAAAAAAAAAAAAAAAAAAAAAAAAAAAAAAAAAAAAAAAAAAAAAAAAAAAAAAAAAAAAAAAAAAAAAAAAAAAAAAAAAAAAAAAAAAAAAAAAAAAAAAAAAAAAAAAAAAAAAAAAAAAAAAAAAAAAAAAAAA
AAAAAAAAAAAAAAAAAAAAAAAAAAAAAAAAAAAAAAAAAAAAAAAAAAAAAAAAAAAAAAAAAAAAAAAAAAAAAAAAAAAAAAAAAAAAAAAAAAAAAAAAAAAAAAAAAAAAAAAAAAAAAAAAAAAAAAAAAAAAAAAAAAAAAAAA
AAAAAAAAAAAAAAAAAAAAAAAAAAAAAAAAAAAAAAAAAAAAAAAAAAAAAAAAAAAAAAAAAAAAAAAAAAAAAAAAAAAAAAAAAAAAAAAAAAAAAAAAAAAAAAAAAAAAAAAAAAAAAAAAAAAAAAAAAAAAAAAAAAAAAAAA
AAAAAAAAAAAAAAAAAAAAAAAAAAAAAAAAAAAAAAAAAAAAAAAAAAAAAAAAAAAAAAAAAAAAAAAAAAAAAAAAAAAAAAAAAAAAAAAAAAAAAAAAAAAAAAAAAAAAAAAAAAAAAAAAAAAAAAAAAAAAAAAAAAAAAAAA
AAAAAAAAAAAAAAAAAAAAAAAAAAAAAAAAAAAAAAAAAAAAAAAAAAAAAAAAAAAAAAAAAAAAAAAAAAAAAAAAAAAAAAAAAAAAAAAAAAAAAAAAAAAAAAAAAAAAAAAAAAAAAAAAAAAAAAAAAAAAAAAAAAAAAAAA
AAAAAAAAAAAAAAAAAAAAAAAAAAAAAAAAAAAAAAAAAAAAAAAAAAAAAAAAAAAAAAAAAAAAAAAAAAAAAAAAAAAAAAAAAAAAAAAAAAAAAAAAAAAAAAAAAAAAAAAAAAAAAAAAAAAAAAAAAAAAAAAAAAAAAAAA
AAAAAAAAAAAAAAAAAAAAAAAAAAAAAAAAAAAAAAAAAAAAAAAAAAAAAAAAAAAAAAAAAAAAAAAAAAAAAAAAAAAAAAAAAAAAAAAAAAAAAAAAAAAAAAAAAAAAAAAAAAAAAAAAAAAAAAAAAAAAAAAAAAAAAAAA
AAAAAAAAAAAAAAAAAAAAAAAAAAAAAAAAAAAAAAAAAAAAAAAAAAAAAAAAAAAAAAAAAAAAAAAAAAAAAAAAAAAAAAAAAAAAAAAAAAAAAAAAAAAAAAAAAAAAAAAAAAAAAAAAAAAAAAAAAAAAAAAAAAAAAAAA
AAAAAAAAAAAAAAAAAAAAAAAAAAAAAAAAAAAAAAAAAAAAAAAAAAAAAAAAAAAAAAAAAAAAAAAAAAAAAAAAAAAAAAAAAAAAAAAAAAAAAAAAAAAAAAAAAAAAAAAAAAAAAAAAAAAAAAAAAAAAAAAAAAAAAAAA
AAAAAAAAAAAAAAAAAAAAAAAAAAAAAAAAAAAAAAAAAAAAAAAAAAAAAAAAAAAAAAAAAAAAAAAAAAAAAAAAAAAAAAAAAAAAAAAAAAAAAAAAAAAAAAAAAAAAAAAAAAAAAAAAAAAAAAAAAAAAAAAAAAAAAAAA
AAAAAAAAAAAAAAAAAAAAAAAAAAAAAAAAAAAAAAAAAAAAAAAAAAAAAAAAAAAAAAAAAAAAAAAAAAAAAAAAAAAAAAAAAAAAAAAAAAAAAAAAAAAAAAAAAAAAAAAAAAAAAAAAAAAAAAAAAAAAAAAAAAAAAAAA
AAAAAAAAAAAAAAAAAAAAAAAAAAAAAAAAAAAAAAAAAAAAAAAAAAAAAAAAAAAAAAAAAAAAAAAAAAAAAAAAAAAAAAAAAAAAAAAAAAAAAAAAAAAAAAAAAAAAAAAAAAAAAAAAAAAAAAAAAAAAAAAAAAAAAAAA
AAAAAAAAAAAAAAAAAAAAAAAAAAAAAAAAAAAAAAAAAAAAAAAAAAAAAAAAAAAAAAAAAAAAAAAAAAAAAAAAAAAAAAAAAAAAAAAAAAAAAAAAAAAAAAAAAAAAAAAAAAAAAAAAAAAAAAAAAAAAAAAAAAAAAAAA
AAAAAAAAAAAAAAAAAAAAAAAAAAAAAAAAAAAAAAAAAAAAAAAAAAAAAAAAAAAAAAAAAAAAAAAAAAAAAAAAAAAAAAAAAAAAAAAAAAAAAAAAAAAAAAAAAAAAAAAAAAAAAAAAAAAAAAAAAAAAAAAAAAAAAAAA
AAAAAAAAAAAAAAAAAAAAAAAAAAAAAAAAAAAAAAAAAAAAAAAAAAAAAAAAAAAAAAAAAAAAAAAAAAAAAAAAAAAAAAAAAAAAAAAAAAAAAAAAAAAAAAAAAAAAAAAAAAAAAAAAAAAAAAAAAAAAAAAAAAAAAAAA
AAAAAAAAAAAAAAAAAAAAAAAAAAAAAAAAAAAAAAAAAAAAAAAAAAAAAAAAAAAAAAAAAAAAAAAAAAAAAAAAAAAAAAAAAAAAAAAAAAAAAAAAAAAAAAAAAAAAAAAAAAAAAAAAAAAAAAAAAAAAAAAAAAAAAAAA
AAAAAAAAAAAAAAAAAAAAAAAAAAAAAAAAAAAAAAAAAAAAAAAAAAAAAAAAAAAAAAAAAAAAAAAAAAAAAAAAAAAAAAAAAAAAAAAAAAAAAAAAAAAAAAAAAAAAAAAAAAAAAAAAAAAAAAAAAAAAAAAAAAAAAAAA
AAAAAAAAAAAAAAAAAAAAAAAAAAAAAAAAAAAAAAAAAAAAAAAAAAAAAAAAAAAAAAAAAAAAAAAAAAAAAAAAAAAAAAAAAAAAAAAAAAAAAAAAAAAAAAAAAAAAAAAAAAAAAAAAAAAAAAAAAAAAAAAAAAAAAAAA
AAAAAAAAAAAAAAAAAAAAAAAAAAAAAAAAAAAAAAAAAAAAAAAAAAAAAAAAAAAAAAAAAAAAAAAAAAAAAAAAAAAAAAAAAAAAAAAAAAAAAAAAAAAAAAAAAAAAAAAAAAAAAAAAAAAAAAAAAAAAAAAAAAAAAAAA
AAAAAAAAAAAAAAAAAAAAAAAAAAAAAAAAAAAAAA
39