everything starts€¦ · earnings – basic $ 4.36 $ 4.34 – earnings – diluted 4.32 4.31 –...
TRANSCRIPT

CYAN MAGENTA YELLOW BLACKD108009A_Couverture_RapportAnnuel_14_En LBBanque Nationale (100205820) PAGE 121/11/14 ÉPREUVE 4
Rédaction Directeur de création
Directionartistique
Service à la clientèle
Client Réalisateur Correction d’épreuves
InDesign CS5 CS4
Typo vérifiée Photos vérifiées R.‑C.
CD/DVD FTP
Date : 00.00.10
Commentaires
ATTENTIONLe « trapping » est à faire par
l’imprimeur selon ses propres specs.
17,3125" x 10,9375" Fermé 8,5" x 10,9375
Montage à 100 % du format final Épreuve à 100 % du montage Impression finale à 100 %
E V E R Y T H I N GS TA R T S
W I T H A N I D E A
2 0 1 4
A N N U A L
R E P O R T
A G R A V I T Y - D E F Y I N G I D E AS K Y V E N T U R E : A G R O W I N G F R E E F A L L S I M U L AT I O N C O M P A N YA N a t i o n a l B a n k C l i e n t
20
14
AN
NU
AL
RE
PO
RT
EVERYTHING STARTS WITH AN IDEA
Big or small.Unexpectedly, it strikes us.But decidedly, we transform it.Into a project, a challenge, an adventure, a source of pride. Let’s go for it. Let’s make progress.Innovate.Implement.Empower.
Powering your ideas
Powering your ideas

AT A GLANCE
National Bank of Canada is an integrated provider of financial services to retail, commercial, corporate and institutional clients. It operates in three business segments—Personal and Commercial, Wealth Management and Financial Markets—with total assets in excess of $205 billion as at October 31, 2014. Through its nearly 20,000 employees, National Bank offers a complete range of services: banking and investment solutions, securities brokerage, insurance and wealth management. National Bank is the leading bank in Quebec and the partner of choice for small and medium-sized enterprises. It is also the sixth largest bank in Canada with branches in almost every province. Clients in the United States, Europe and other parts of the world are served through a network of representative offices, subsidiaries and partnerships. Its head office is located in Montreal and its securities are listed on the Toronto Stock Exchange.
2 Message From the President and Chief Executive Officer 5 Message From the Chairman of the Board 6 Governance Architecture 7 Key Responsibilities of Committees 8 Board of Directors 9 Office of the President 10 Risk Disclosures 11 Management’s Discussion and Analysis 105 Audited Consolidated Financial Statements 200 Statistical Review 202 Glossary of Financial Terms
AT A GLANCE
National Bank of Canada is an integrated provider of financial services to retail, commercial, corporate and institutional clients. It operates in three business segments—Personal and Commercial, Wealth Management and Financial Markets—with total assets in excess of $205 billion as at October 31, 2014. Through its nearly 20,000 employees, National Bank offers a complete range of services: banking and investment solutions, securities brokerage, insurance and wealth management. National Bank is the leading bank in Quebec and the partner of choice for small and medium-sized enterprises. It is also the sixth largest bank in Canada with branches in almost every province. Clients in the United States, Europe and other parts of the world are served through a network of representative offices, subsidiaries and partnerships. Its head office is located in Montreal and its securities are listed on the Toronto Stock Exchange.
2 Message From the President and Chief Executive Officer 5 Message From the Chairman of the Board 6 Governance Architecture 7 Key Responsibilities of Committees 8 Board of Directors 9 Office of the President 10 Risk Disclosures 11 Management’s Discussion and Analysis 105 Audited Consolidated Financial Statements 200 Statistical Review 202 Glossary of Financial Terms 204 Information for Shareholders
Head Office National Bank of Canada National Bank Tower 600 De La Gauchetière Street West, 4th Floor Montreal, Quebec H3B 4L2 Canada
Telephone: 514-394-5000 Website: nbc.ca Annual Meeting The Annual Meeting of Holders of Common Shares of the Bank will be held on Wednesday, April 15, 2015, at the Drummondville Expocenter, in Drummondville, Quebec, Canada. Public Accountability Statement The 2014 Social Responsibility Report will be available in March 2015 on the Bank’s website at nbc.ca. Communication with Shareholders For information about stock transfers, address changes, dividends, lost certificates, tax forms and estate transfers, shareholders of record may contact the Transfer Agent at the following address: Computershare Trust Company of Canada Share Ownership Management 1500 University Street, 7th Floor Montreal, Quebec H3A 3S8 Canada
Telephone: 1-888-838-1407 Fax: 1-888-453-0330 E-mail: [email protected] Website: computershare.com Shareholders whose shares are held by a market intermediary are asked to contact the market intermediary concerned. Other shareholder inquiries can be addressed to: Investor Relations National Bank of Canada National Bank Tower 600 De La Gauchetière Street West, 7th Floor Montreal, Quebec H3B 4L2 Canada
Telephone: 1-866-517-5455 Fax: 514-394-6196 E-mail: [email protected] Website: nbc.ca/investorrelations
Caution Regarding Forward-Looking Statements From time to time, National Bank of Canada makes written and oral forward-looking statements included in this Annual Report, in other filings with Canadian regulators, in reports to shareholders, in press releases and in other communications. All such statements are made pursuant to the Canadian and American securities legislation and the provisions of the United States Private Securities Litigation Reform Act of 1995.
Additional information about these statements can be found on page 11 of this Annual Report. Trademarks The trademarks used in this report include National Bank of Canada, Private Wealth 1859, One client, one bank, CashPerformer, NBC CapS, NBC CapS II, NBC Asset Trust, NBC Capital Trust, Altamira, and National Bank Correspondent Network and their respective logos, which are trademarks of National Bank of Canada used under licence by National Bank of Canada or its subsidiaries. All other trademarks mentioned in this report, which are not the property of National Bank of Canada, are owned by their respective holders. Pour obtenir une version française du Rapport annuel, veuillez vous adresser à : Relations avec les investisseurs Banque Nationale du Canada 600, rue De La Gauchetière Ouest, 7e étage Montréal (Québec) H3B 4L2 Canada
Téléphone : 1 866 517-5455 Télécopieur : 514 394-6196 Adresse électronique : [email protected] Legal Deposit ISBN 978-2-921835-43-5 Legal deposit – Bibliothèque et Archives nationales du Québec, 2014 Legal deposit – Library and Archives Canada, 2014 Printing L’Empreinte National Bank of Canada is proud to help save the environment by using EcoLogo and Forest Stewardship Council® (FSC®) certified paper.
National Bank of Canada is proud to help save the environment by using EcoLogo and Forest Stewardship Council® (FSC®) certified paper.

National Bank of Canada 1 2014 Annual Report
HIGHLIGHTS The Bank’s consolidated financial statements were prepared in accordance with International Financial Reporting Standards (IFRS), as issued by the International Accounting Standards Board and set out in the CPA Canada Handbook. 2014 2013(1) % change
Operating Results (millions of Canadian dollars) Total revenues $ 5,464 $ 5,151 6 Net income 1,538 1,512 2 Net income attributable to the Bank’s shareholders 1,469 1,449 1 Return on common shareholders’ equity 17.9 % 20.1 % Per Common Share(2) (in dollars) Earnings – Basic $ 4.36 $ 4.34 – Earnings – Diluted 4.32 4.31 – Excluding Specified Items(3) Operating Results (taxable equivalent basis) (3) (millions of Canadian dollars) Total revenues $ 5,638 $ 5,230 8 Net income 1,593 1,423 12 Net income attributable to the Bank’s shareholders 1,524 1,360 12 Return on common shareholders’ equity 18.5 % 18.9 % Efficiency ratio 58.6 % 60.2 % Per Common Share(2) (in dollars) Earnings – Basic $ 4.53 $ 4.07 11 Earnings – Diluted 4.48 4.04 11 Per Common Share(2) (in dollars) Dividends declared $ 1.88 $ 1.70 Book value 25.76 22.97 Share price High 53.88 45.24 Low 41.60 36.18 Close 52.68 45.24
Financial Position (millions of Canadian dollars)
As at October 31, 2014
As atOctober 31, 2013(1) % change
Total assets $ 205,429 $ 188,219 9 Loans and acceptances 106,169 97,338 9 Deposits 119,883 102,111 17 Equity attributable to common shareholders 8,484 7,487 13 Capital ratios under Basel III(4) Common Equity Tier 1 (CET1) 9.2 % 8.7 % Tier 1(5) 12.3 % 11.4 % Total(5) 15.1 % 15.0 % Impaired loans, net of total allowances (118) (183) As a % of loans and acceptances (0.1) % (0.2) % Earnings coverage 8.98 8.72 Asset coverage 5.24 3.76 Other Information Number of common shares at year-end (thousands) 329,297 325,983 Number of common shareholders on record 22,394 22,737 Market capitalization (millions of Canadian dollars) 17,347 14,747 Assets under administration and assets under management (millions of Canadian dollars) 338,305 258,010 31 Number of employees 19,955 19,691 1 Number of branches in Canada 452 453 – Number of banking machines 935 937 –
(1) Certain amounts have been adjusted to reflect changes in accounting standards. See Note 2 to the audited consolidated financial statements for year ended October 31, 2014. (2) Reflecting the stock dividend paid on February 13, 2014. See Note 18 to the audited consolidated financial statements for year ended October 31, 2014. (3) See the Financial Reporting Method section on page 12. (4) The ratios as at October 31, 2014 and 2013 have been calculated using the "all-in" methodology, and the ratios as at October 31, 2013 have not been adjusted to reflect changes in
accounting standards. (5) The ratios as at October 31, 2014 include the redemption of the Series 16 preferred shares on November 15, 2014.

2 National Bank of Canada 2014 Annual Report
MESSAGE FROM THE PRESIDENT AND CHIEF EXECUTIVE OFFICER National Bank achieved record financial results and solid returns for shareholders in 2014.
Our net income, excluding specified items, reached $1,593 million, an increase of 12% compared to 2013. Diluted earnings per share were up 11% to $4.48. Total revenues, excluding specified items, rose 8% to $5,638 million. For all three measures of financial performance, 2014 marked the 12th consecutive year of growth.
National Bank shareholders were rewarded with another dividend increase, the 9th since 2010, and strong capital appreciation. This translated into a 21.3% total shareholder return (TSR), the highest among Canada’s major banks for 2014. Over five- and ten-year horizons, we have also delivered TSRs that compare very favourably with our Canadian peers. Total Shareholder Return Periods ended October 31, 2014
National Bank
Bank 1
Bank 2
Bank 3
Bank 4
Bank 5
We are proud of our ability to consistently create value for shareholders, and it is a responsibility that we continue to take very seriously.
Sustaining Our Momentum in a Rapidly Changing Market
Our strong financial performance during the past several years reflects our steady progress in the execution of our strategies and actions. Just as importantly, our results demonstrate that our relentless focus on three priorities—people, risk management, and processes and technology—is a winning approach.
Also key to our success has been the diversification of revenues within our three business segments—Personal and Commercial Banking, Wealth Management, and Financial Markets. We expect each segment to contribute to our results by concentrating their efforts on areas of strength and seizing the best opportunities, always with a perspective of achieving balanced growth.
We will stay the course in the years ahead as we look to sustain our strong record in value creation by evolving within changing market conditions and our clients’ financial needs. Engaged People Make the Difference With technology transforming financial services, we more than ever firmly believe that motivated and knowledgeable people are key to delivering best-in-class client experience—whether that involves providing advice, responding to information requests, or handling a transaction. For this reason, one of our priorities is to constantly nurture the engagement of our close to 20,000 employees.
Through ongoing training, coaching, and effective leadership, we strive to create a compelling workplace where each employee can develop to their full potential. National Bank’s ranking in 2014 and in previous years as being among the best employers in Canada, Quebec, and Montreal, as well as among the best diversity employers in Canada is a strong endorsement of our efforts. Sound Risk Management Ingrained in our Culture Proficiency in risk management is a determining factor in our financial performance. Whether it be a consumer mortgage, a commercial loan or a business acquisition, our people know they are expected to use their good judgment before proceeding with any transaction.
All three of our business segments are recognized for their rigour in assessing risk. Our loan loss experience in Personal and Commercial Banking is one of the lowest among our peers. In Wealth Management, we have completed and smoothly integrated several major acquisitions, and our Financial Markets business has a good track record in managing risk.
Efficient Processes and Technology: Cost Reduction and Differentiation Processes and technology are two areas where we can make the biggest gains—both by reducing costs and differentiating our offering. For example, we were the first to launch a new mortgage platform that allows for one-meeting approval for 75% of applications. This not only gives us an edge in a competitive market but lowers our costs and lets us redeploy resources to other revenue-generating activities.
2 1 .3% 20.9% 20.1%18.6%
17.1%
13.1%1 year
1 8 .0%15.9% 16.5%
12.1%
15.7%
13.1%5 years
1 2 .5%
8.1%
12.3%
13.9%
8.5%9.8%
10 years

National Bank of Canada 3 2014 Annual Report
We are investing to integrate mobile banking into our offering, providing existing and new clients a new channel for meeting some of their financial needs. This is an exciting new frontier and National Bank expects to keep pace and be at the forefront in certain areas. Our technology investments are also aimed at safeguarding client information and enhancing our data mining capabilities, with the objective of using information to improve client experience, provide our employees with better tools and pertinent knowledge, while increasing our efficiency.
Three Business Segments Contribute to Our Growth
Engaged people, sound risk management, and efficient processes and technology underpin the growth strategies of our three business segments.
All three segments also share a common vision of collaboration and teamwork – both within each business segment and among them – that is central to our One client, one bank initiative. Working together as one, we can deliver the best client experience and live up to our promise of being the Bank that truly takes care of its clients, while growing each business segment. Personal and Commercial Banking: Outperforming Peers Net income and revenues for Personal and Commercial Banking increased 6% and 4%, respectively, in 2014, driven by higher loan volumes and market share gains.
For the past several years, we have outperformed our peers in loan growth, particularly on the consumer side. These gains are the result of ongoing efforts to improve client experience by adding front-line personnel, including a growing mobile sales force, and continuous service improvements while providing better training and new tools for our employees. We are also getting better at cross-selling and directing clients to the right bank channel to meet their specific financial needs.
Going forward, we are strengthening our offering by launching mobile banking applications for tablets and smartphones that will appeal particularly to a younger demographic. Since this new distribution channel has no physical constraints, we see opportunities to extend Personal Banking’s reach across the country at a relatively low cost.
We are also taking an innovative approach to growing our physical presence across Canada by providing a range of proximity banking solutions with the Wealth Management division in White Rock, British Columbia. If successful, this model will be implemented in several Western Canadian centres where we have a critical mass of wealth management professionals.
In Commercial Banking, we are leveraging our leadership as a lender to Quebec entrepreneurs by offering a full suite of services for their business and personal needs. Outside Quebec, we are expanding our specialty lending services by targeting vertical markets where we have a recognized position and deep expertise.
Wealth Management: Pan-Canadian Footprint Organic growth and the contribution from an acquisition completed at the beginning of the fiscal year have led to increases of 37% in net income and 16% in revenues for Wealth Management in 2014. This business derives nearly 44% of its revenues from outside Quebec and is growing across Canada through a differentiated multichannel strategy.
Our pan-Canadian network of investment advisors, supported by in-house specialists, provides high-net-worth clients with a full range of wealth management services, tailored to their needs and founded on unbiased advice. Our client-centric focus is strengthened by our Private Wealth 1859 division, which rapidly established a leadership position in Quebec and is now expanding in selected markets across Canada. And we offer do-it-yourself investors an efficient transactional platform through our direct brokerage subsidiary.
Our fourth channel in this market segment is comprised of our partnerships with independent introducing brokers, portfolio managers, life insurance advisors and other institutional clients. For these clients, we offer white label banking, investment products and back-office services that are particularly attractive to independent wealth management firms having to cope with increasing administrative and compliance requirements.
In the years ahead, we see strong growth opportunities across Canada as the only bank positioned across the full advice spectrum in the wealth management market. Our unique offering of investment solutions that are manufactured internally and managed by best-in-class independent third party professionals is another key differentiator underpinning our growth. Financial Markets: A Consistent Performer Our Financial Markets business enjoyed another stellar year in 2014, with net income and revenues up 14% and 11%, respectively. Revenues were higher across all activities compared to the previous year, and approximately 72% were generated outside Quebec.
We have achieved consistency in the performance of this business through the years, a fact that is now being recognized by investors and shareholders alike. This results from our focus on client-driven activities, relationships and building diversified revenue streams.
We are leaders in government debt underwriting and public-private partnership financing in Canada, with a strong position in equity underwriting across the country, recognized expertise in structured products and overall leadership in the Quebec market.
International markets contribute significantly to revenues and profitability, mainly through our specialization in the sale of Canadian financial products through offices in London, New York and, since 2014, Hong Kong.
In recent years, this business has benefitted from the growing profitability of Credigy Ltd., our specialty finance subsidiary that operates in the U.S., Brazil and Europe. In 2014, Credigy accounted for 10% of Financial Markets’ net income and 15% of its revenues.

4 National Bank of Canada 2014 Annual Report
MESSAGE FROM THE PRESIDENT AND CHIEF EXECUTIVE OFFICER (cont.)
Market Outlook: Positive Signs
Several developments are leading us to expect stronger growth in the Quebec economy, beginning with the steady pace of recovery in the U.S., a key export market, and the weakening of the Canadian dollar. We are encouraged by government efforts to address structural problems and fiscal balance. In addition, we applaud the willingness of the Ontario and Quebec governments to work together towards strengthening the economy of Central Canada and complementing the growth in Western Canada. All of these factors are positive for business expansion.
All three of our business segments will continue to benefit from the current cycle of ownership transfers in many Quebec and Canadian family enterprises as current owners prepare their retirement. We are experiencing an unprecedented wave of transactions driven by demographics, and National Bank is well positioned to capture its share.
Meeting Expectations of All Stakeholders
With assets of $205 billion, National Bank ranks among the leading economic pillars in Quebec and Canada. We have earned this privileged position through sustained business growth in a highly competitive industry. And we have done so by meeting the expectations of our shareholders, our clients, our employees and other stakeholders.
As much as we focus on creating value for shareholders, we also fulfill our socio-economic role with great rigour. Our donations and sponsorships provide crucial support to organizations in the areas of health, education, arts and culture, and community well-being—with an emphasis on youth-oriented initiatives. Our contributions are complemented by the active involvement of our employees who volunteer and give generously to many worthy causes. We encourage entrepreneurship in our communities while being a trusted long-term financial partner to thousands of local businesses, both large and small.
We are also doing our part to protect our planet by being carbon neutral since 2011, incorporating green building principles in our branch renovations and screening suppliers more closely to encourage sustainable business practices. In 2014, National Bank was ranked by Bloomberg Markets magazine as one of the world’s greenest banks for the third consecutive year. This recognition is based on several criteria, including efforts to reduce our environmental impact.
Successfully Adapting to Change
National Bank has continued to post record earnings in recent years, despite rapidly evolving consumer preferences, technology and market conditions. This achievement demonstrates that we are focusing on the right priorities and pursuing the appropriate strategies.
Our strong performance also testifies to the quality of leadership throughout our organization and to the dedication of our close to 20,000 employees. I take this opportunity to acknowledge the engagement of our people and thank them for their contribution to the Bank’s success.
The ability to adapt quickly and effectively in times of constant change is the hallmark of a great organization. That is our ambition at National Bank, and 2014 marked another step towards our goal.
Louis Vachon President and Chief Executive Officer

National Bank of Canada 5 2014 Annual Report
MESSAGE FROM THE CHAIRMAN OF THE BOARD
National Bank achieved record results in 2014 and continued to generate strong returns for shareholders. The Board of Directors is pleased with the consistent earnings growth over the past several years and the many initiatives under way to sustain its excellent performance.
The Board and management work well together, in full respect of their respective mandates, and this is reflected in the quality of their exchanges. We are convinced that their corporate governance systems and policies safeguard and advance the interests of our shareholders and other stakeholders.
As we go forward, the Board will continue to focus on maintaining high standards of corporate governance and constructive engagement with management. We will rely on our broad and varied experience to exercise our role with rigour and independence as guardians of the Bank’s future.
Sound Governance Practices
The Board has developed a systematic approach to its oversight of key areas such as business strategy, risk management and human resources. We are briefed on a regular basis through management presentations and dialogue with business segment and functional executives, allowing us to monitor progress against strategic plans, track issues and provide input on a timely basis.
Another major responsibility of the Board is the assessment of senior management performance. In this regard, the Bank’s success offers a compelling metric. The designation of Louis Vachon as ‘‘Canada’s CEO of the Year’’ by Canadian Business magazine is an endorsement not only of his strong leadership but also the sustained engagement of the Bank’s employees.
As a director and now board chair, I have witnessed the impact of significant governance changes in recent years, including the responsibilities of the Board and the criteria for membership. Facing the retirement of a large number of directors due to self-imposed term limits, we established a succession plan and are continuing to identify potential candidates. New director training and integration have also received our attention.
Solid Succession Plan
With good planning, we have transitioned smoothly through the departure of many serving directors in recent years. Today our Board is more diverse in terms of expertise and gender and we continue to have a strong culture of teamwork and complementarity of talents to make us effective.
In 2014, we welcomed three new directors—Raymond Bachand, Karen
Kinsley and Julie Payette—who bring a wealth of experience to the Board. With the addition of two women, our Board currently has the largest female representation of all large Canadian banks.
In addition, new chairpersons have been named to the Audit and Risk Management committees—respectively, Pierre Boivin and Richard Fortin. Both bring many years of relevant experience to these demanding positions.
Looking ahead, we are focused on working with management to create long-term value for shareholders. We are also mindful of the Bank’s multiple roles in the communities it serves, as a vital force in the local economy, participant in public policy debates, supporter of worthy causes and sustainability leader.
Acknowledgements
On behalf of the Board, I wish to thank Bernard Cyr and Gérard Coulombe for their many years of service as directors. Mr. Cyr retired during the year and Mr. Coulombe will not stand for election at the 2015 Annual Meeting of Shareholders.
The Bank’s excellent performance in 2014 is testimony to the dedicated efforts of nearly 20,000 employees. We acknowledge their contribution and thank them for their commitment to our success.
Jean Houde Chairman of the Board of Directors
6 National Bank of Canada 2014 Annual Report
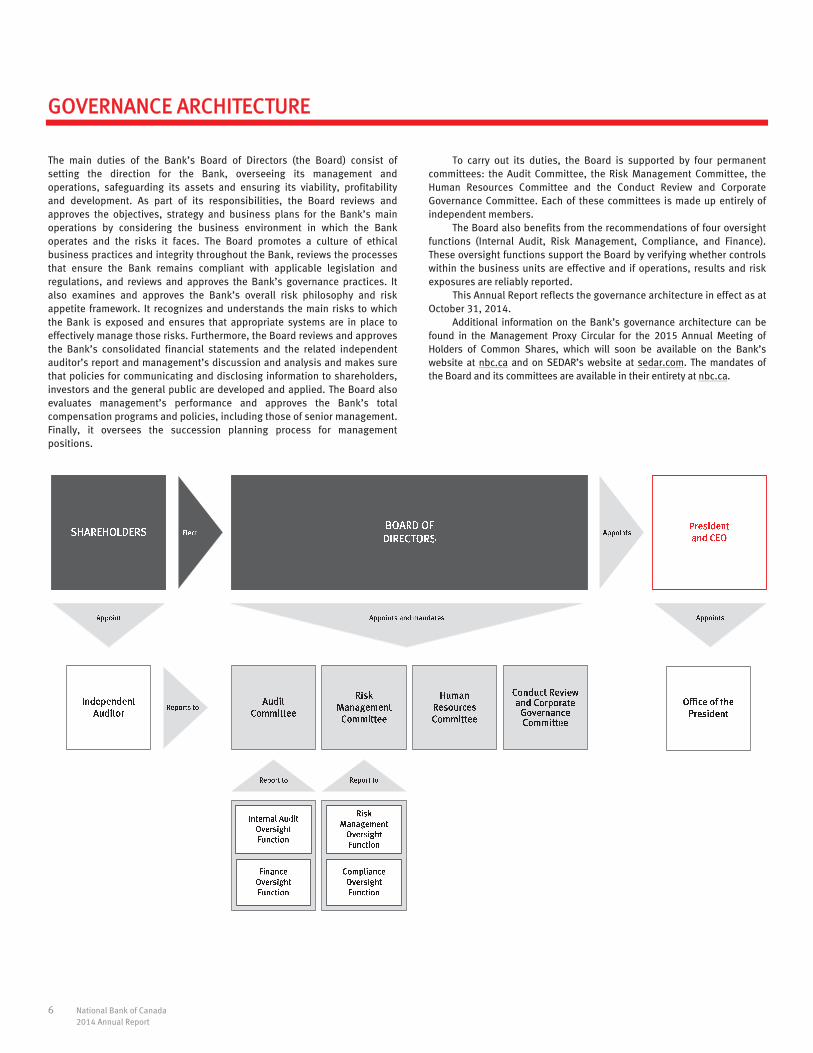
GOVERNANCE ARCHITECTURE The main duties of the Bank’s Board of Directors (the Board) consist of setting the direction for the Bank, overseeing its management and operations, safeguarding its assets and ensuring its viability, profitability and development. As part of its responsibilities, the Board reviews and approves the objectives, strategy and business plans for the Bank’s main operations by considering the business environment in which the Bank operates and the risks it faces. The Board promotes a culture of ethical business practices and integrity throughout the Bank, reviews the processes that ensure the Bank remains compliant with applicable legislation and regulations, and reviews and approves the Bank’s governance practices. It also examines and approves the Bank’s overall risk philosophy and risk appetite framework. It recognizes and understands the main risks to which the Bank is exposed and ensures that appropriate systems are in place to effectively manage those risks. Furthermore, the Board reviews and approves the Bank’s consolidated financial statements and the related independent auditor’s report and management’s discussion and analysis and makes sure that policies for communicating and disclosing information to shareholders, investors and the general public are developed and applied. The Board also evaluates management’s performance and approves the Bank’s total compensation programs and policies, including those of senior management. Finally, it oversees the succession planning process for management positions.
To carry out its duties, the Board is supported by four permanent committees: the Audit Committee, the Risk Management Committee, the Human Resources Committee and the Conduct Review and Corporate Governance Committee. Each of these committees is made up entirely of independent members.
The Board also benefits from the recommendations of four oversight functions (Internal Audit, Risk Management, Compliance, and Finance). These oversight functions support the Board by verifying whether controls within the business units are effective and if operations, results and risk exposures are reliably reported.
This Annual Report reflects the governance architecture in effect as at October 31, 2014.
Additional information on the Bank’s governance architecture can be found in the Management Proxy Circular for the 2015 Annual Meeting of Holders of Common Shares, which will soon be available on the Bank’s website at nbc.ca and on SEDAR’s website at sedar.com. The mandates of the Board and its committees are available in their entirety at nbc.ca.

National Bank of Canada 7 2014 Annual Report
KEY RESPONSIBILITIES OF COMMITTEES
Audit Committee Pierre Boivin (Chair), André Caillé, Richard Fortin, Louise Laflamme
Examines the Bank’s financial statements, reports and other significant financial communications and recommends their approval by the Board. Ensures that suitable procedures are in place to oversee financial reporting to the public. Reviews, evaluates and approves appropriate internal control mechanisms. Oversees the work of the independent auditor and the work of the Finance Oversight Function and the Internal Audit Oversight Function and ensures their independence and effectiveness. Ensures the implementation of a policy and procedures for reporting accounting irregularities.
Risk Management Committee Richard Fortin (Chair), Raymond Bachand, Maryse Bertrand, Louise Laflamme, Pierre Thabet
Reviews the Bank’s risk appetite framework and recommends its approval by the Board; oversees the control methods used to manage the main risks to which the Bank is exposed, in particular strategic risk, credit risk, market risk, liquidity risk, operational risk, regulatory risk, reputation risk and environmental risk. Monitors capital, liquidity and funding management, stress testing and capital adequacy assessment. Approves credit applications of clients that are outside the scope of management’s limits. Oversees the work of the Risk Management Oversight Function and the Compliance Oversight Function and ensures their independence and effectiveness. Oversees procedures to fight money laundering and terrorist financing.
Human Resources Committee André Caillé (Chair), Pierre Boivin, Gérard Coulombe, Gillian H. Denham, Lino A. Saputo jr
Examines and approves the Bank’s total compensation policies and programs, taking into consideration the risk management framework applicable at the time of development, review and implementation, and recommends their approval by the Board. Sets annual objectives and key performance indicators for the President and Chief Executive Officer, recommends their approval by the Board, and evaluates said performance and the corresponding achievements. Recommends Board approval for the compensation of the President and Chief Executive Officer, of the members of the Office of the President, and of the heads of the oversight functions. Periodically reviews and examines the management succession plan.
Conduct Review and Corporate Governance Committee Gérard Coulombe (Chair), Maryse Bertrand, André Caillé, Jean Houde, Roseann Runte
Makes sure that governance rules, procedures and policies are implemented and followed. Periodically reviews the size and composition of the Board and its committees, develops the candidate criteria for selecting directors to the Board, and plans the succession of directors. Develops and reviews the mandates of the Board, the Board Committees, the Chair of the Board and the committee chairs. Oversees the processes for managing and monitoring related party transactions. Ensures that the Bank’s directors, officers and employees are compliant with the standards of business conduct and ethical behaviour. Evaluates the performance and effectiveness of the Board and its members.

8 National Bank of Canada 2014 Annual Report
BOARD OF DIRECTORSCONSEIL D’ADMINISTRATION The Board of Directors is responsible for providing stewardship for the Bank. Its main duties include providing direction for the Bank, overseeing its management and activities, safeguarding its assets, and ensuring its viability, profitability and development. The Board carries out this role through a governance architecture that includes a strict set of structures, policies and processes that meets all of the legislative and regulatory requirements governing the Bank. The majority of Board members, including its Chairman, are independent under Canadian Securities Administrators criteria.
Jean Houde Montreal, Quebec, Canada Corporate Director Chairman of the Board of Directors, National Bank of Canada Director since March 2011 Lawrence S. Bloomberg Toronto, Ontario, Canada Advisor, National Bank Financial Director since August 1999 Gérard Coulombe Sainte-Marthe, Quebec, Canada Partner, Lavery, de Billy, LLP Director since February 1994 Karen Kinsley Ottawa, Ontario, Canada Corporate Director Director since December 2014 Roseann Runte Ottawa, Ontario, Canada President and Vice-Chancellor, Carleton University Director since April 2001 Louis Vachon Beaconsfield, Quebec, Canada President and Chief Executive Officer, National Bank of Canada Director since August 2006
Raymond Bachand Montreal, Quebec, Canada Strategic Advisor and Corporate Director Director since September 2014 Pierre Boivin Montreal, Quebec, Canada President and Chief Executive Officer, Claridge Inc. Director since April 2013 Gillian H. Denham Toronto, Ontario, Canada Corporate Director Director since October 2010 Louise Laflamme Rosemere, Quebec, Canada Corporate Director Director since November 2008 Lino A. Saputo jr Montreal, Quebec, Canada Chief Executive Officer and Vice-Chairman of the Board of Directors Saputo Inc. Director since April 2012
Maryse Bertrand Montreal, Quebec, Canada Vice-President, Real Estate Services, Legal Services and General Counsel, CBC/Radio-Canada Director since April 2012 André Caillé Lac-Brome, Quebec, Canada Corporate Director Director since October 2005 Richard Fortin Longueuil, Quebec, Canada Corporate Director Director since August 2013 Julie Payette Montreal, Quebec, Canada Director, Montreal Science Centre and Vice-President, Canada Lands Company Director since April 2014 Pierre Thabet St-Georges, Quebec, Canada President, Boa-Franc s.e.n.c. Director since March 2011

National Bank of Canada 9 2014 Annual Report
OFFICE OF THE PRESIDENTUREAU DE LA PRÉSIDENCE The Office of the President, which is composed of the President and Chief Executive Officer and the officers responsible for the Bank’s main functions and business units, is mandated to define the Bank’s culture and philosophy, approve and monitor the strategic growth initiatives of the Bank as a whole, manage risks that could have a strategic impact, assume stewardship of technology, manage the officer succession process, and ensure a balance between employee commitment and client and shareholder satisfaction.
The Office of the President carries out its responsibilities as a team, thereby ensuring consistency as well as information- and knowledge-sharing among the Bank’s business units. Louis Vachon President and Chief Executive Officer Dominique Fagnoule Executive Vice-President, Information Technology Karen Leggett Executive Vice-President, Marketing and Corporate Strategy Ricardo Pascoe Executive Vice-President, Financial Markets
Stéphane Bilodeau Executive Vice-President, Operations and Strategic Initiatives Office Diane Giard Executive Vice-President, Personal and Commercial Banking Luc Paiement Executive Vice-President, Wealth Management; Chair of the Board, President and Chief Executive Officer, National Bank Financial Ltd.; Co-President of the Board, Co-President and Co-Chief Executive Officer, National Bank Financial Inc.
William Bonnell Executive Vice-President, Risk Management Lynn Jeanniot Executive Vice-President, Human Resources and Corporate Affairs Ghislain Parent Chief Financial Officer and Executive Vice-President, Finance and Treasury

10 National Bank of Canada 2014 Annual Report
RISK DISCLOSURES In May 2012, the Financial Stability Board (FSB) formed a working group, the Enhanced Disclosure Task Force (EDTF), that was mandated to develop principles for enhancing the risk disclosures of major banks, to recommend improvements to current risk disclosures, and to identify risk disclosure best practices used by major financial institutions. On October 29, 2012, the EDTF published a report entitled Enhancing the Risk Disclosures of Banks, which contains 32 recommendations. The Bank makes every effort to ensure overall compliance with those recommendations and is continuing to enhance its risk disclosures to meet the best practices on an ongoing basis. The risk disclosures required by the EDTF are provided in this Annual Report and in the document entitled Supplementary Regulatory Capital Disclosure available on the Bank’s website at nbc.ca. Pages
Annual Report
Supplementary Regulatory Capital
Disclosure
General 1 Location of risk disclosures 10 Management’s Discussion and Analysis 18, 54 to 93, 98 and 102 Consolidated Financial Statements Notes 1, 7, 16, 23 and 30 Supplementary Regulatory Capital Disclosure 4 to 27 2 Risk terminology and risk measures 61 to 93 3 Top and emerging risks 61 and 62 4 New key regulatory ratios 55, 56, 82 and 87
Risk governance and risk management 5 Risk management organization, processes and key functions 63 to 66 6 Risk management culture 63 and 64 7 Key risks by business segment, risk management and risk appetite 18, 63 and 64 8 Stress testing 54, 64, 72 and 80 to 84
Capital adequacy and risk-weighted assets (RWA) 9 Minimum Pillar 1 capital requirements 55 and 56 10 Reconciliation of the accounting balance sheet to the regulatory balance sheet 4 to 6 11 Movements in regulatory capital 58 12 Capital planning 54 to 60 13 RWA by business segment and by risk type 18 and 59 7 14 Capital requirements by risk and RWA calculation method 59 and 67 to 72 7 15 Banking book credit risk 59 7 and 10 to 15 16 Movements in RWA by risk type 60 8 17 Assessment of credit risk model performance 66, 70 and 78 10 to 16
Liquidity 18 Liquidity management and components of the liquidity buffer 82 to 86
Funding 19 Summary of encumbered and unencumbered assets 85 and 86 20 Residual contractual maturities of balance sheet items and off-balance-sheet commitments 192 to 195 21 Funding strategy and funding sources 87 to 89
Market risk 22 Linkage of market risk measures to balance sheet 76 and 77 23 Market risk factors 75, 78 to 81, 178 and 179 24 VaR: assumptions, limitations and validation procedures 78 to 80 25 Stress tests, stressed VaR and backtesting 78 to 81
Credit risk 26 Credit risk exposures 68, 71 and 146 to 149 9 to 23 and 18 to 23(1) 27 Policies for identifying impaired loans 73, 118 and 119 28 Movements in impaired loans and allowances for credit losses 98, 102 and 146 to 148 19 29 Counterparty credit risk relating to derivatives transactions 73, 74 and 159 to 161 24 30 Credit risk mitigation 72 to 74 21 and 23
Other risks 31 Other risks: governance, measurement and management 66 and 90 to 92 32 Publicly known risk events 90
(1) These pages are included in the document entitled Supplementary Financial Information.

MANAGEMENT ’S DISCUSSION
AND ANA LYSIS
December 4, 2014 The following Management’s Discussion and Analysis (MD&A) presents the financial condition and operating results of National Bank of Canada (the Bank). This analysis was prepared in accordance with the requirements set out in National Instrument 51-102, Continuous Disclosure Obligations, released by the Canadian Securities Administrators (CSA). It is based on the audited consolidated financial statements for the year ended October 31, 2014 (the consolidated financial statements) and prepared in accordance with International Financial Reporting Standards (IFRS), as issued by the International Accounting Standards Board (IASB) and set out in the CPA Canada Handbook. This MD&A should be read in conjunction with the consolidated financial statements and accompanying notes for the year ended October 31, 2014. The figures for the years ended October 31, 2013, 2012 and 2011 have been adjusted to reflect changes in accounting standards. Moreover, all comparative figures reflect the impact of the stock dividend of one common share on each issued and outstanding common share declared on December 3, 2013 and paid on February 13, 2014. The effect of this dividend was the same as a two-for-one split of common shares. Additional information about the Bank, including the Annual Information Form, can be obtained from the Bank’s website at nbc.ca and SEDAR’s website at sedar.com.
Caution Regarding Forward-Looking Statements From time to time, the Bank makes written and oral forward-looking statements, such as those contained in the Major Economic Trends and the Outlook for National Bank sections of this Annual Report, in other filings with Canadian securities regulators, and in other communications, for the purpose of describing the economic environment in which the Bank will operate during fiscal 2015 and the objectives it hopes to achieve for that period. These forward-looking statements are made in accordance with current securities legislation in Canada and the United States. They include, among others, statements with respect to the economy—particularly the Canadian and U.S. economies—market changes, observations regarding the Bank’s objectives and its strategies for achieving them, Bank-projected financial returns and certain risks faced by the Bank. These forward-looking statements are typically identified by future or conditional verbs or words such as “outlook,” “believe,” “anticipate,” “estimate,” “project,” “expect,” “intend,” “plan,” and similar terms and expressions.
By their very nature, such forward-looking statements require assumptions to be made and involve inherent risks and uncertainties, both general and specific. Assumptions about the performance of the Canadian and U.S. economies in 2015 and how that will affect the Bank’s business are among the main factors considered in setting the Bank’s strategic priorities and objectives and in determining its financial targets, including provisions for credit losses. In determining its expectations for economic growth, both broadly and in the financial services sector in particular, the Bank primarily considers historical economic data provided by the Canadian and U.S. governments and their agencies.
There is a strong possibility that express or implied projections contained in these forward-looking statements will not materialize or will not be accurate. The Bank recommends that readers not place undue reliance on these statements, as a number of factors, many of which are beyond the Bank’s control, could cause actual future results, conditions, actions or events to differ significantly from the targets, expectations, estimates or intentions expressed in the forward-looking statements. These factors include strategic risk, credit risk, market risk, liquidity risk, operational risk, regulatory risk, reputation risk, and environmental risk (all of which are described in more detail in the Risk Management section beginning on page 61 of this Annual Report), general economic environment and financial market conditions in Canada, the United States and certain other countries in which the Bank conducts business, including regulatory changes affecting the Bank’s business, capital and liquidity; the situation with respect to the restructured notes of the master asset vehicle (MAV) conduits, in particular the realizable value of underlying assets; changes in the accounting policies the Bank uses to report its financial condition, including uncertainties associated with assumptions and critical accounting estimates; tax laws in the countries in which the Bank operates, primarily Canada and the United States (including the U.S. Foreign Account Tax Compliance Act (FATCA)); changes to capital and liquidity guidelines and to the manner in which they are to be presented and interpreted; changes to the credit ratings assigned to the Bank; and potential disruptions to the Bank’s information technology systems, including evolving cyber attack risk.
The foregoing list of risk factors is not exhaustive. Additional information about these factors can be found in the Risk Management and Other Risk Factors sections of this Annual Report. Investors and others who rely on the Bank’s forward-looking statements should carefully consider the above factors as well as the uncertainties they represent and the risk they entail. Except as required by law, the Bank does not undertake to update any forward-looking statements, whether written or oral, that may be made from time to time, by it or on its behalf.
The forward-looking information contained in this document is presented for the purpose of interpreting the information contained herein and may not be appropriate for other purposes.
Financial Reporting Method 12 Additional Financial Disclosure 447 Financial Disclosure 14 Critical Accounting Estimates 448 Overview 15 Accounting Policy Changes 552 Major Economic Trends 19 Capital Management 554 Outlook for National Bank 20 Risk Management 661 Business Segment Analysis 22 Other Risk Factors 993 Financial Analysis 38 Additional Financial Information 994 Securitization and Off-Balance-Sheet Arrangements 45

MANAGEMENT’S DISCUSSION AND ANALYSIS
12 National Bank of Canada 2014 Annual Report
FINANCIAL REPORTING METHOD The Bank uses certain measurements that do not comply with IFRS to assess results. Moreover, the Bank has adjusted certain specified items to make the data from fiscal 2014 and 2013 comparable. These adjustments are presented in the table below.
Reconciliation of Measures Not Compliant With IFRS
The table below provides a reconciliation of published results with results presented in the Management’s Discussion and Analysis. Year ended October 31 (millions of Canadian dollars) 2014 2013(1)
Personal and
Commercial Wealth
Management Financial Markets Other
Net interest income 1,699 315 605 (75) 2,544 2,437 Taxable equivalent(2) 219 219 209 Financing cost relating to holding restructured notes(3) 18 18 9 Net interest income on a taxable equivalent basis and excluding specified items 1,699 315 824 (57) 2,781 2,655 Non-interest income 994 1,010 690 226 2,920 2,714 Revenues related to holding restructured notes(3) (92) (92) (151) Acquisition-related revenues(4) 7 9 16 12 Funding valuation adjustment(5) 13 13 Non-interest income excluding specified items 994 1,017 703 143 2,857 2,575 Total revenues on a taxable equivalent basis and excluding specified items 2,693 1,332 1,527 86 5,638 5,230 Non-interest expenses 1,532 957 692 242 3,423 3,206 Charges related to acquisitions(6) (44) (44) (27) Impairment losses on intangible assets(7) (62) (62) (39) Litigation provisions(8) (14) (14) Severance pay(9) (12) Vacant premises(10) (16) Item related to employee benefits(11) 35 Non-interest expenses excluding specified items 1,532 913 692 166 3,303 3,147 Contribution on a taxable equivalent basis and excluding specified items 1,161 419 835 (80) 2,335 2,083 Provisions for credit losses 205 3 208 181
Income before income taxes on a taxable equivalent basis and excluding specified items 956 416 835 (80) 2,127 1,902
Income taxes 258 95 3 (61) 295 252 Taxable equivalent(2) 219 219 209 Income taxes on revenues related to holding restructured notes(3) (20) (20) (38) Income taxes on items related to the acquisitions(4) (6) 13 2 15 11 Income taxes on the funding valuation adjustment(5) 4 4 Income taxes on intangible asset impairment losses(7) 17 17 10 Income taxes on litigation provisions(8) 4 4 Income taxes on severance pay(9) 3 Income taxes on vacant premises(10) 4 Income taxes on the item related to employee benefits(11) (9) Reversal of provisions for income tax contingencies(12) 37 Income taxes on a taxable equivalent basis and excluding specified items 258 108 226 (58) 534 479 Net income excluding specified items 698 308 609 (22) 1,593 1,423 Specified items after income taxes (38) (9) (8) (55) 89 Net income 698 270 600 (30) 1,538 1,512 Non-controlling interests 14 55 69 63 Net income attributable to the Bank's shareholders 698 270 586 (85) 1,469 1,449
(1) Certain amounts have been adjusted to reflect accounting changes. See Note 2 to the consolidated financial statements. (2) The Bank uses the taxable equivalent basis to calculate net interest income and income taxes. This calculation method consists of grossing up certain tax-exempt income (particularly
dividends) by the income tax that would have been otherwise payable. An equivalent amount is added to income taxes. This adjustment is necessary in order to perform a uniform comparison of the return on different assets regardless of their tax treatment.

MANAGEMENT’S DISCUSSION AND ANALYSIS FINANCIAL REPORTING METHOD
National Bank of Canada 13 2014 Annual Report
(3) During the year ended October 31, 2014, the Bank recorded $18 million in financing costs ($13 million net of income taxes) related to holding restructured notes as well as $92 million in revenues ($67 million net of income taxes) to reflect a rise in the fair value of the notes. During the year ended October 31, 2013, the Bank had recorded $9 million in financing costs ($7 million net of income taxes) related to holding restructured notes as well as $151 million in revenues ($111 million net of income taxes) to reflect a rise in the fair value of the notes.
(4) During the year ended October 31, 2014, the Bank recorded an amount of $7 million ($6 million net of income taxes) for its share in the integration costs incurred by Fiera Capital Corporation (Fiera) and an amount of $9 million ($7 million net of income taxes) for its share in the integration costs, impairment losses and intangible asset amortization of its interest in TMX Group Limited (TMX). For the fiscal year ended October 31, 2013, the total amount of these costs was $12 million ($9 million net of income taxes).
(5) During the fiscal year ended October 31, 2014, the Bank recorded $13 million in charges ($9 million net of income taxes) to reflect an adjustment to the fair value determination of uncollateralized (including not fully collateralized) over-the-counter derivatives; known as the funding valuation adjustment (FVA), this adjustment now includes market implied funding costs and benefits.
(6) During the year ended October 31, 2014, the Bank recorded $44 million in charges ($32 million net of income taxes) related to the Wealth Management acquisitions (2013: $27 million, $19 million net of income taxes) and consisting mostly of integration charges for TD Waterhouse Institutional Services (TDWIS); they also include retention bonuses and charges related to the acquisitions of Wellington West Holdings Inc. and the full-service investment advisory business of HSBC Securities (Canada) Inc.
(7) During the year ended October 31, 2014, the Bank recorded $62 million ($45 million net of income taxes) in intangible asset impairment losses on internal technology developments (2013: $39 million, $29 million net of income taxes).
(8) During the year ended October 31, 2014, the Bank recorded $14 million in litigation provisions ($10 million net of income taxes). (9) During the year ended October 31, 2013, the Bank had recorded $12 million in severance pay ($9 million net of income taxes) for the optimization of certain activities. (10) During the year ended October 31, 2013, the Bank had recorded $16 million in charges ($12 million net of income taxes) related to vacant premises. (11) During the year ended October 31, 2013, the Bank had recorded a $35 million decrease in past service costs ($26 million net of income taxes) to reflect changes to the provisions of its
pension plans and other post-retirement plans subsequent to changes in accounting standards. (12) During the year ended October 31, 2013, the Bank had reversed $37 million in tax provisions following a revaluation of contingent income tax liabilities.
Securities regulators require companies to caution readers that net income and any other measurements adjusted using non-IFRS criteria have no standard meaning under IFRS and cannot be easily compared with similar measurements used by other companies.
Like many other institutions, the Bank uses the taxable equivalent basis to calculate net interest income and income taxes. This calculation method consists of grossing up certain tax-exempt income (particularly dividends) by the income tax that would have been otherwise payable. An equivalent amount is added to income taxes. This adjustment is necessary in order to perform a uniform comparison of the return on different assets regardless of their tax treatment.

MANAGEMENT’S DISCUSSION AND ANALYSIS
14 National Bank of Canada 2014 Annual Report
FINANCIAL DISCLOSURE
Disclosure Controls and Procedures
The Bank’s financial information is prepared with the support of a set of disclosure controls and procedures (DC&P) that are implemented by the President and Chief Executive Officer (CEO) and by the Chief Financial Officer (CFO) and Executive Vice-President of Finance and Treasury. During the year ended October 31, 2014, in accordance with Regulation 52-109 respecting Certification of Disclosure in Issuers’ Annual and Interim Filings (Regulation 52-109), released by the CSA, the design and operation of these controls and procedures were evaluated to determine their effectiveness.
As at October 31, 2014, the CEO and the CFO confirmed the effectiveness of the DC&P. These controls are designed to provide reasonable assurance that the information disclosed in annual and interim filings and in other reports filed or submitted under securities legislation is recorded, processed, summarized and reported within the time periods specified by that legislation. These controls and procedures are also designed to ensure that such information is accumulated and communicated to the Bank’s management, including its signing officers, as appropriate, to allow for timely decisions regarding disclosure.
This Annual Report was reviewed by the Disclosure Committee, the Audit Committee, and the Board of Directors, which approved it prior to publication.
Internal Controls Over Financial ReportingThe internal controls over financial reporting (ICFR) are designed to provide reasonable assurance that the financial information presented is reliable and that the consolidated financial statements were prepared in accordance with International Financial Reporting Standards (IFRS), as issued by the International Accounting Standards Board (IASB) and set out in the CPA Canada Handbook. Due to inherent limitations, ICFR may not prevent or detect all misstatements in a timely manner.
The CEO and the CFO oversaw the evaluation work performed on the design and operation of the Bank’s ICFR in accordance with Regulation 52-109. These controls were evaluated in accordance with the new control framework of the Committee of Sponsoring Organizations of the Treadway Commission (COSO — 2013) for financial controls and in accordance with the control framework of the Control Objectives for Information and Related Technologies (COBIT) for general Information Technology controls.
Based on the evaluation results, the CEO and CFO concluded, as at October 31, 2014, that there are no material weaknesses, that the ICFR are effective and provide reasonable assurance that the financial reporting is reliable, and that the Bank’s consolidated financial statements were prepared in accordance with IFRS.
Changes to Internal Controls Over Financial Reporting
The CEO and CFO also undertook work under which they were able to conclude that, during the year ended October 31, 2014, no changes were made to the ICFR that have materially affected, or are reasonably likely to materially affect, the design or operation of the ICFR.
Disclosure Committee
The Disclosure Committee assists the CEO and CFO by ensuring that disclosure controls and procedures and internal control procedures for financial reporting are implemented and operational. In so doing, the Committee ensures that the Bank is meeting its disclosure obligations under current regulations and that the CEO and CFO are producing the requisite certifications.

MANAGEMENT’S DISCUSSION AND ANALYSIS
National Bank of Canada 15 2014 Annual Report
OVERVIEW
Consolidated Results Year ended October 31 (taxable equivalent basis)(1) (millions of Canadian dollars) 2014 2013(2) 2012(2) 2014-13
% change
Excluding specified items(1) Total revenues 5,638 5,230 5,075 8 Non-interest expenses 3,303 3,147 3,051 5 Provisions for credit losses 208 181 180 15 Income before income taxes 2,127 1,902 1,844 12 Income taxes 534 479 485 11 Net income excluding specified items 1,593 1,423 1,359 12 Specified items after taxes(1) (55) 89 238 Net income 1,538 1,512 1,597 2 Net income attributable to Preferred shareholders 40 40 43 Common shareholders 1,429 1,409 1,493 1 Bank shareholders 1,469 1,449 1,536 1 Non-controlling interests 69 63 61 10 1,538 1,512 1,597 2
Average assets 206,680 193,509 181,344 7 Risk-weighted assets(3) 64,818 61,251 62,190 6 Average loans and acceptances 99,548 92,398 84,009 8 Average deposits 115,605 102,029 96,389 13 Impaired loans, net of total allowances (118) (183) (190) Efficiency ratio excluding specified items(1) 58.6 % 60.2 % 60.1 %
Financial indicators Diluted earnings per share(4) $ 4.32 $ 4.31 $ 4.58 Return on common shareholders' equity (ROE) 17.9 % 20.1 % 24.1 % Capital ratios under Basel III(3) Common Equity Tier 1 (CET1) 9.2 % 8.7 % 7.3 % Tier 1(5) 12.3 % 11.4 % 10.1 % Total(5) 15.1 % 15.0 % 14.1 % Dividend payout ratio(4)(6) 43 % 39 % 33 % Excluding specified items(1) Diluted earnings per share(4) $ 4.48 $ 4.04 $ 3.85 11 Return on common shareholders' equity (ROE) 18.5 % 18.9 % 20.3 % Dividend payout ratio(4)(6) 42 % 42 % 40 %
(1) See the Financial Reporting Method section on page 12. (2) Certain amounts have been adjusted to reflect changes in accounting standards. See Note 2 to the consolidated financial statements. (3) The October 31, 2014 figures have been calculated for common equity Tier 1 (CET1), whereas this distinction had not been made in the previous years. The October 31, 2014 and 2013
figures are presented on an “all-in” basis, and the October 31, 2012 figures are presented on a pro forma basis. The October 31, 2013 and 2012 figures have not been adjusted to reflect changes in accounting standards.
(4) Reflects the stock dividend paid on February 13, 2014. See Note 18 to the consolidated financial statements. (5) Ratios as at October 31, 2014 include the redemption of the Series 16 preferred shares on November 15, 2014. (6) Last four quarters.
In 2014, the Bank recorded $1,538 million in net income compared to $1,512 million in 2013. Diluted earnings per share for 2014 stood at $4.32 versus $4.31 in 2013, and ROE was 17.9% in 2014 versus 20.1% in 2013. Excluding the 2014 and 2013 specified items, the Bank’s net income totalled $1,593 million, up 12%, and diluted earnings per share was $4.48 versus $4.04, up 11%. In addition, ROE was 18.5% in 2014 versus 18.9% in 2013.
In 2014, the Bank’s results, excluding specified items, exceeded its medium-term objectives for net income growth and diluted earnings per share growth. It also achieved the objectives for ROE and the Basel III Common Equity Tier 1 (CET1) ratio. Excluding specified items, the Bank’s results were also in line with the target dividend payout ratio.

MANAGEMENT’S DISCUSSION AND ANALYSIS OVERVIEW
16 National Bank of Canada 2014 Annual Report
Dividends For 2014, the Bank declared $616 million in dividends to common shareholders, representing 42% of net income attributable to common shareholders, excluding specified items. Annual Dividend(1)
(1) Reflecting the stock dividend paid on February 13, 2014. See Note 18 to the
consolidated financial statements.
High Quality Loans Portfolio
The 2014 provisions for credit losses were $27 million higher than those of 2013. Specifically, the provisions for personal credit losses were up $7 million, mainly related to consumer loans. Provisions for commercial credit losses stood at $50 million for 2014, rising $6 million. Provisions for credit losses on Corporate Banking loans were nil in 2014 while substantial recoveries had been recorded in 2013. Overall, the Bank maintained sound credit quality; the 2014 provisions for credit losses represented 0.21% of average loans and acceptances compared to 0.20% in 2013, which is relatively low. Impaired loans, net of total allowances, increased $65 million year over year due to the addition of a few loans in the Personal and Commercial segment. Risk Profile (millions of Canadian dollars) 2014 2013
Provisions for credit losses 208 181 Provisions for credit losses as a % of average loans and acceptances 0.21 % 0.20 % Net impaired loans 248 183 Gross impaired loans as a % of tangible equity 7.1 % 6.5 % Individual and collective allowances as a % of impaired loans 49.0 % 53.7 % Collective allowance on non-impaired loans 366 366 Impaired loans, net of total allowances (118) (183)
Overall Composition of the Loan and Acceptance Portfolio
Breakdown of the Loan and Acceptance Portfolio(1) As at October 31, 2014
Corporate (2013: 8%) Commercial (2013: 28%) Personal and Wealth Management (2013: 64%)
(1) Excluding loans and acceptances in the Other heading.
Business Loans and Acceptances by Borrower Category As at October 31, 2014
Agriculture (2013: 9%) Mining, oil and gas (2013: 10%) Construction and real estate (2013: 20%) Manufacturing (2013: 8%) Wholesale and retail (2013: 12%) Transportation (2013: 3%) Telecommunications, media and technology (2013: 4%) Financial institutions (2013: 4%) Services (2013: 13%) Governments and other related services (2013: 9%) Other (2013: 8%)
$1.24
$1.37
$1.54
$1.70
$1. 88
2010
2011
2012
2013
20142014 8%
28%
64%
9%
9%
21%
8%12%
3%
4%
3%
12%
9%
10%
MANAGEMENT’S DISCUSSION AND ANALYSIS OVERVIEW
National Bank of Canada 17 2014 Annual Report
Prudent Capital Management
A bank’s capital covers the risks inherent to its various business activities, e.g., risks such as credit risk, downturns in financial markets, or unfavourable operating events. Capital management consists of maintaining the capital required to cover risks, complying with the regulatory capital ratios set by the Office of the Superintendent of Financial Institutions (Canada) (OSFI) and determining the economic capital required for the Bank’s operations. Capital management also addresses regulatory obligations, economic and market conditions, Bank objectives and the creation of shareholder value. As required under the Basel framework, risk-weighted assets (RWA) are calculated for credit risk, market risk, and operational risk. In 2014, the Bank maintained its prudent capital management approach to protect itself against potential market deterioration and to foster sound business growth.
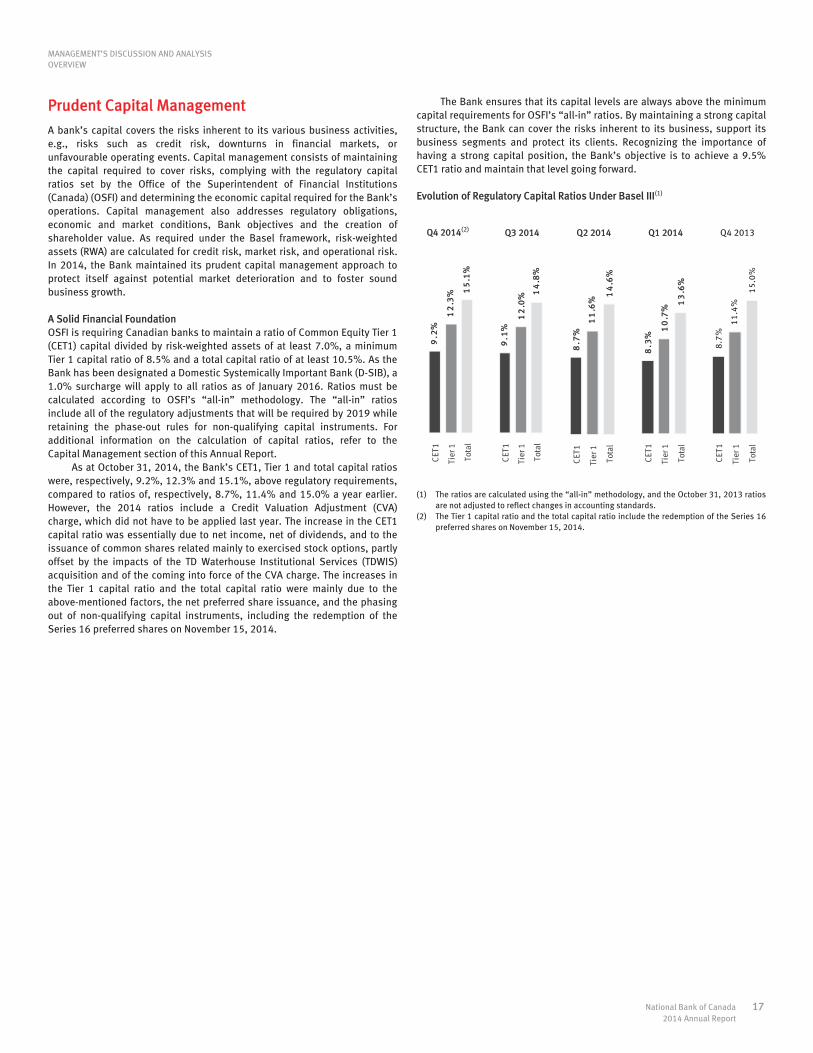
A Solid Financial Foundation OSFI is requiring Canadian banks to maintain a ratio of Common Equity Tier 1 (CET1) capital divided by risk-weighted assets of at least 7.0%, a minimum Tier 1 capital ratio of 8.5% and a total capital ratio of at least 10.5%. As the Bank has been designated a Domestic Systemically Important Bank (D-SIB), a 1.0% surcharge will apply to all ratios as of January 2016. Ratios must be calculated according to OSFI’s “all-in” methodology. The “all-in” ratios include all of the regulatory adjustments that will be required by 2019 while retaining the phase-out rules for non-qualifying capital instruments. For additional information on the calculation of capital ratios, refer to the Capital Management section of this Annual Report.
As at October 31, 2014, the Bank’s CET1, Tier 1 and total capital ratios were, respectively, 9.2%, 12.3% and 15.1%, above regulatory requirements, compared to ratios of, respectively, 8.7%, 11.4% and 15.0% a year earlier. However, the 2014 ratios include a Credit Valuation Adjustment (CVA) charge, which did not have to be applied last year. The increase in the CET1 capital ratio was essentially due to net income, net of dividends, and to the issuance of common shares related mainly to exercised stock options, partly offset by the impacts of the TD Waterhouse Institutional Services (TDWIS) acquisition and of the coming into force of the CVA charge. The increases in the Tier 1 capital ratio and the total capital ratio were mainly due to the above-mentioned factors, the net preferred share issuance, and the phasing out of non-qualifying capital instruments, including the redemption of the Series 16 preferred shares on November 15, 2014.
The Bank ensures that its capital levels are always above the minimum capital requirements for OSFI’s “all-in” ratios. By maintaining a strong capital structure, the Bank can cover the risks inherent to its business, support its business segments and protect its clients. Recognizing the importance of having a strong capital position, the Bank’s objective is to achieve a 9.5% CET1 ratio and maintain that level going forward.
Evolution of Regulatory Capital Ratios Under Basel III(1)
Q4 2014(2) Q3 2014 Q2 2014 Q1 2014 Q4 2013
(1) The ratios are calculated using the “all-in” methodology, and the October 31, 2013 ratios are not adjusted to reflect changes in accounting standards.
(2) The Tier 1 capital ratio and the total capital ratio include the redemption of the Series 16 preferred shares on November 15, 2014.
9.1
% 1
2.0
% 14
.8%
CET
1
Tier
1
Tota
l
8.7
% 1
1.6
% 1
4.6
%
CET
1
Tier
1
Tota
l
8.3
% 1
0.7
% 1
3.6
%
CET
1
Tier
1
Tota
l
8.7
% 1
1.4
%
15
.0%
CET
1
Tier
1
Tota
l
9.2
%
12
.3%
15
.1%
CET
1
Tier
1
Tota
l

MANAGEMENT’S DISCUSSION AND ANALYSIS OVERVIEW
18 National Bank of Canada 2014 Annual Report
Allocation of Economic Capital and Regulatory RWA Economic capital is an internal measure that the Bank uses to determine the capital it needs to remain solvent and to pursue its business operations. Economic capital takes into consideration the credit, market, operational, business and other risks to which the Bank is exposed as well as the risk diversification effect among them and among the business segments. Economic capital thus helps the Bank to determine the equity capital required to protect itself against such risks and ensure its long-term viability. The by-segment allocation of economic capital and regulatory RWA was done on a stand-alone basis before attribution of goodwill and intangible assets. The method used to assess economic capital is reviewed regularly in order to accurately quantify these risks.
The Risk Management section provides comprehensive information about the main types of risk. The “Other risks” presented below include risks such as strategic risk and structural interest rate risk in addition to the benefit of diversification among types of risk.
Allocation of Risks by Business Segment As at October 31, 2014 (millions of Canadian dollars)

MANAGEMENT’S DISCUSSION AND ANALYSIS
National Bank of Canada 19 2014 Annual Report
MAJOR ECONOMIC TRENDS
Global Economy
Despite concerns aroused by an uncertain geopolitical environment, the global economy appears poised to pick up speed in 2015. A resurgent U.S. will again lead advanced economies at a time when the eurozone remains challenged. In China, infrastructure spending geared towards the government’s ambitious urbanization plans will support the economy, although growth is unlikely to exceed 7% as rebalancing continues. Other emerging economies are ready to pick up the slack, buoyed by a triple boost in the form of improving U.S. demand, a stronger U.S. dollar, and lower commodity prices. India, for example, is in a good position to capitalize on this windfall, helped by a new and arguably more business-friendly government. Global growth should accelerate to 3.6% in 2015 (vs. 3.3% in 2014), since central banks will keep borrowing costs low in light of low inflation.
United States
The world’s largest economy is on a clear uptrend buoyed by an invigorated private sector. The labour market has taken off with the addition of more than 3 million full-time jobs in the past year, the best performance since 2006. Investment spending is robust and consumption looks poised to strengthen, more so considering the deleveraging cycle is over. While exports could soften a bit due to the stronger dollar, that should not prevent U.S. GDP growth to accelerate to 2.9% in 2015. There is, however, still room for improvement in the housing market, where progress is being limited by accessibility, particularly for first-time home buyers. The Federal Reserve, aware of this problem, will therefore be very cautious when it raises interest rates. There is indeed no need to rush on rate normalization given the excess capacity in the economy, as evidenced by below-target inflation.
Canada
While declining oil prices are not good news for Canada, the overall economic outlook remains positive considering the U.S. resurgence and the stabilizing effects of the weakening Canadian dollar. Exports should remain the major driver of growth, with additional help from investment spending, which is due for a rebound in light of capacity pressures in several sectors of the economy. The federal government will run a budget surplus in fiscal year 2014-2015, which leaves room for some fiscal stimulus. Those factors should help offset the anticipated moderation of housing and consumption spending, both under pressure to soften in light of elevated household debt. Growth should accelerate to 2.5% in 2015.
In Quebec, continued export momentum should enable the economy to grow by 1.9% in 2015, despite the anticipated decline in government spending and investment.

MANAGEMENT’S DISCUSSION AND ANALYSIS
20 National Bank of Canada 2014 Annual Report
OUTLOOK FOR NATIONAL BANK
Strategic Priorities
The Bank’s objective is to deliver stable returns to its shareholders that exceed those of its Canadian peers. To achieve this objective, the Bank aims for 5% to 10% annual net income growth. Successful execution of revenue growth initiatives, active capital management, sound risk management practices and sustained improvement to productivity are some of the levers the Bank uses to achieve financial performance growth. The Bank prides itself as an institution with a strong financial foundation, providing its clients with value-added products and services and adapting quickly to frequent changes in the economy and competitive environment.
To support its long-term growth objectives, the Bank continues to execute its strategic transformation program, which is designed to increase market share, enhance client satisfaction and optimize operations. The primary objective of this program, which involves significant investments, is to ensure that the Bank remains a modern, dynamic institution supported by a skilled workforce and diverse revenue sources while continuously improving productivity.
The Bank’s strong presence in Quebec remains a source of sustained revenue growth. In addition to its current business activities, geographic diversification is an important lever for the Bank’s long-term growth in that it will be able to benefit from the potential of targeted new niches across Canada. The Bank thus plans to raise the revenue and earnings contributions generated by the Personal and Commercial and Wealth Management segments.
As a super-regional + institution with a solid balance sheet, the Bank is also well-positioned to complement organic growth with acquisitions and strategic partnerships. These revenue growth opportunities are supported by all of the Bank’s employees and are subject to a very stringent planning, review and implementation process intended to quickly maximize earnings.
Geographic Distribution of Total Revenues(1) Year ended October 31, 2014
Quebec (2013: 62%) Other provinces (2013: 33%) International and unallocated (2013: 5%)
Business Mix(1) (Taxable equivalent basis)(2) Year ended October 31, 2014
Personal and
Commercial
Wealth
Management
Financial
Markets
(1) Excluding specified items and the Other heading. (2) See the Financial Reporting Method section on page 12.
61%
34%
5%
48
.5%
43
.2%
42
.2%
Tota
l rev
enue
s
Net
inco
me
Econ
omic
cap
ital
24
.0%
19
.1%
13
.7%
Tota
l rev
enue
s
Net
inco
me
Econ
omic
cap
ital
27
.5%
37
.7% 4
4.1
%
Tota
l rev
enue
s
Net
inco
me
Econ
omic
cap
ital

MANAGEMENT’S DISCUSSION AND ANALYSIS OUTLOOK FOR NATIONAL BANK
National Bank of Canada 21 2014 Annual Report
Strategic Transformation Program Over the past several years, the Bank has been deploying its strategic transformation program, which is based on the One client, one bank vision. The program is at the heart of the Bank’s business strategy. The ultimate goal is to make the Bank the leader in client experience, with the ability to always provide best-in-class financial advice, solutions, and service to clients, regardless of their point of entry into the Bank. All of the Bank’s teams are actively involved in the various transformation initiatives, whether at the identification, design or implementation stages.
Year after year, over the past few years, the Bank’s notable progress on several performance indicators relating to clients, productivity and financial results has validated the strategic transformation program. The Bank has made significant progress in implementing a true client-centric culture and deploying high-quality tools and services, while bolstering capital, liquidity and earnings. The Bank is playing its full part in the economies of Quebec and Canada at the individual, business and government levels.
Substantial changes to the banking environment in Canada, including evolving regulations, new technologies, changing client needs and the current economic environment, require innovative development methods and the ongoing strategic transformation of the Bank. With the expertise of its employees, capacity for innovation and financial strength, the Bank has the assets needed to confidently address these challenges.
Priorities for 2015
For 2015, the Bank has set the following three priorities.
— Pursue its initiatives to deliver red carpet treatment. — Optimize the returns from its super-regional + business model. — Continue to leverage promising business partnerships. Pursue its Initiatives to Deliver Red Carpet Treatment Many initiatives aimed at providing all of the Bank’s clients with red carpet treatment have been implemented in recent years. This approach will continue to guide the Bank’s efforts to provide its clients with simpler, more accessible and proactive services.
A key trend in the global banking industry is the growing demand for “digital” banking services. It’s a trend also seen in Canada and among the Bank’s clients, who are increasingly using products and services offered over the Internet and on mobile devices. The Bank is closely examining the new trends, seeing them as inspiration for innovation while also remembering the needs of clients with more traditional profiles.
The Bank has also strengthened and differentiated its brand image in recent years, particularly through targeted advertising campaigns aimed at personal and commercial clients.
Optimize the Returns From its Super-regional + Business Model In the coming years, the Bank intends on pursuing its multi-pronged expansion across all of its markets. Various initiatives are underway to continue winning market share in regions where the Bank has a strong presence. In addition, ongoing efforts will be made within various Canadian markets to further develop its distinctive strengths, particularly the activities underpinning the Bank’s success in personal and commercial banking, financial markets and wealth management. Accordingly, the Bank remains alert to acquisition opportunities that might arise.
Furthermore, the Bank will continue to build targeted niches internationally, in particular by consolidating its presence in major financial centres such as London, Hong Kong, New York and Paris, in order to support its clients’ foreign business development efforts.
In addition, the Bank intends to make investments internationally for long-term growth opportunities. In September 2014, the Bank acquired a 30% interest in Advanced Bank of Asia Limited (ABA Bank) in Cambodia. The Bank is exploring other similar opportunities. Continue to Leverage Promising Business Partnerships To maintain its performance and the quality of its service offering, the Bank can rely on promising business partnerships entered into with organizations from various sectors. These partnerships have helped to enhance the development and efficiency of the Bank’s operations.
The Bank intends to pursue this course over the next few quarters, in particular by striking new agreements that will benefit its shareholders, clients and employees.

MANAGEMENT’S DISCUSSION AND ANALYSIS
22 National Bank of Canada 2014 Annual Report
BUSINESS SEGMENT ANALYSIS PERSONAL AND COMMERCIAL
OVERVIEW
The Personal and Commercial segment meets the financial needs of some 2.4 million retail banking clients and approximately 130,000 business clients throughout Canada. These clients entrust the Bank to manage, invest and safeguard their assets and finance their projects. Personal Banking offers everyday transaction solutions, mortgage loans and home equity lines of credit, consumer loans, payment solutions, savings options and tailored investment solutions as well as a diverse range of insurance products through specialized subsidiaries. Commercial Banking offers a full line of services, including credit, deposit and investment solutions, international trade, foreign exchange transactions, payroll, cash management, insurance, electronic transactions and complementary services.
To obtain advice and service, clients turn to our experienced advisors who take time to understand their specific realities and help them reach their financial goals. And thanks to the Bank’s remote distribution network, 452 branches and 935 banking machines across Canada, clients can do their daily banking whenever and wherever they wish.
Segment Results – Personal and Commercial
Year ended October 31 (millions of Canadian dollars) 2014 2013(1) 2012(1) 2014-13
% change
Excluding specified items(2) Net interest income 1,699 1,615 1,581 5 Non-interest income 994 977 945 2 Total revenues 2,693 2,592 2,526 4 Non-interest expenses 1,532 1,497 1,444 2 Contribution 1,161 1,095 1,082 6 Provisions for credit losses 205 192 174 7 Income before income taxes 956 903 908 6 Income taxes 258 242 244 7 Net income excluding specified items 698 661 664 6 Specified items after taxes(2) (11) Net income 698 661 653 6 Net interest margin 2.24 % 2.28 % 2.42 %Average interest-bearing assets 75,963 70,718 65,426 7 Average assets 81,516 76,696 70,524 6 Average deposits 43,022 40,294 38,379 7 Average loans and acceptances 81,129 76,344 70,163 6 Net impaired loans 246 181 137 36 Net impaired loans as a % of average loans and acceptances 0.3 % 0.2 % 0.2 %Efficiency ratio excluding specified items(2) 56.9 % 57.8 % 57.2 %
(1) Certain amounts have been adjusted to reflect changes in accounting standards. See Note 2 to the consolidated financial statements. (2) See the Financial Reporting Method section on page 12.
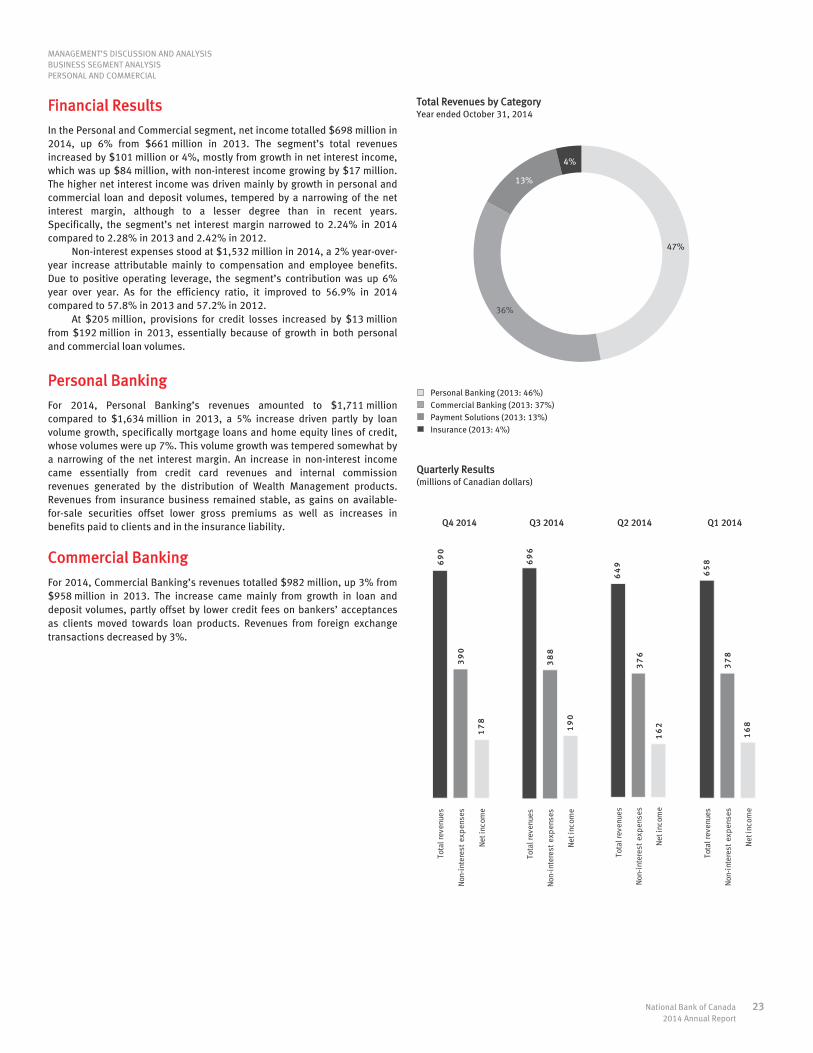
MANAGEMENT’S DISCUSSION AND ANALYSIS BUSINESS SEGMENT ANALYSIS PERSONAL AND COMMERCIAL
National Bank of Canada 23 2014 Annual Report
Financial Results
In the Personal and Commercial segment, net income totalled $698 million in 2014, up 6% from $661 million in 2013. The segment’s total revenues increased by $101 million or 4%, mostly from growth in net interest income, which was up $84 million, with non-interest income growing by $17 million. The higher net interest income was driven mainly by growth in personal and commercial loan and deposit volumes, tempered by a narrowing of the net interest margin, although to a lesser degree than in recent years. Specifically, the segment’s net interest margin narrowed to 2.24% in 2014 compared to 2.28% in 2013 and 2.42% in 2012.
Non-interest expenses stood at $1,532 million in 2014, a 2% year-over-year increase attributable mainly to compensation and employee benefits. Due to positive operating leverage, the segment’s contribution was up 6% year over year. As for the efficiency ratio, it improved to 56.9% in 2014 compared to 57.8% in 2013 and 57.2% in 2012.
At $205 million, provisions for credit losses increased by $13 million from $192 million in 2013, essentially because of growth in both personal and commercial loan volumes.
Personal Banking
For 2014, Personal Banking’s revenues amounted to $1,711 million compared to $1,634 million in 2013, a 5% increase driven partly by loan volume growth, specifically mortgage loans and home equity lines of credit, whose volumes were up 7%. This volume growth was tempered somewhat by a narrowing of the net interest margin. An increase in non-interest income came essentially from credit card revenues and internal commission revenues generated by the distribution of Wealth Management products. Revenues from insurance business remained stable, as gains on available-for-sale securities offset lower gross premiums as well as increases in benefits paid to clients and in the insurance liability.
Commercial Banking
For 2014, Commercial Banking’s revenues totalled $982 million, up 3% from $958 million in 2013. The increase came mainly from growth in loan and deposit volumes, partly offset by lower credit fees on bankers’ acceptances as clients moved towards loan products. Revenues from foreign exchange transactions decreased by 3%.
Total Revenues by Category Year ended October 31, 2014
Personal Banking (2013: 46%) Commercial Banking (2013: 37%) Payment Solutions (2013: 13%) Insurance (2013: 4%)
Quarterly Results
(millions of Canadian dollars)
Q4 2014 Q3 2014 Q2 2014 Q1 2014
47%
36%
13%
4%
69
0
39
0
17
8
Tota
l rev
enue
s
Non
-int
eres
t ex
pen
ses
Net
inco
me
69
6
38
8
19
0
Tota
l rev
enue
s
Non
-int
eres
t ex
pen
ses
Net
inco
me
64
9
37
6
16
2
Tota
l rev
enue
s
Non
-int
eres
t ex
pen
ses
Net
inco
me
65
8
37
8
16
8
Tota
l rev
enue
s
Non
-int
eres
t ex
pen
ses
Net
inco
me

MANAGEMENT’S DISCUSSION AND ANALYSIS BUSINESS SEGMENT ANALYSIS PERSONAL AND COMMERCIAL
24 National Bank of Canada 2014 Annual Report
Loan and Acceptance Volumes (millions of Canadian dollars) (% of year-over-year growth)
Total Personal and Commercial Personal Commercial
Deposit Volumes (millions of Canadian dollars) (% of year-over-year growth)
Total Personal and Commercial Personal Commercial
Strategies This year, the Personal and Commercial segment reached significant milestones in its transformation towards a service culture grounded in the three principles of the Client Value Proposition :
— accessibility of services; — proactivity in offering advice and solutions; — the simplicity of doing business with National Bank.
The Bank also spearheaded initiatives to improve the segment’s productivity and efficiency. The initiatives focused both on the deployment of more efficient work processes and rigorous operational management.
In line with its multi-channel, client-centric bank strategy, the Bank honed in on its competitive advantages in the personal and commercial services market. It relies on in-depth knowledge of clients to support this strategy, thereby fostering client commitment, prioritization and retention.
Achievements The Bank’s client distribution channels are evolving in tandem and acting as levers for better understanding clients and maintaining a proactive relationship that addresses all of their financial needs. Personal and Commercial relies on a marketing business model that, using data intelligence enabling the Bank to understand and anticipate client behaviour and needs, orchestrates targeted campaigns and actions to reach clients at the right time—through the right channel—and generate business opportunities.
Proactivity In the branch network, the Bank is laying the groundwork for an evolving advisory model. This model literally rolls out the red carpet for clients, delivering on its commitment to accessibility, proactivity and simplicity.
Intent on providing clients with personalized financial advice, the Bank has developed specialized teams that are established and recognized in the market, a strategy it consolidated in several ways in 2014. For commercial clients, the Bank has advisors across Canada specializing in agriculture and agro-industry, business transfer and international trade. The Bank has enhanced its offering for this clientele with sophisticated financing, merger and acquisition, and import-export solutions.
As for personal banking clients, they benefit from the advice of a network of mortgage financing specialists. Using a comprehensive advisory approach, these specialists not only offer customized mortgage solutions, they also refer clients to the Bank’s other services and distribution channels, thereby fostering client satisfaction and loyalty.
The Bank is also developing a new approach to offer proximity services to clients in every region of Canada. It therefore introduced a range of proximity banking solutions with the National Bank Financial branch in White Rock, British Columbia. The Bank plans to extend this innovative business model to other parts of Canada given the results of this initiative.
+8.8
%
+6
.3%
+10.
1%
+6
.7%
+6.3
%
+5
.3%
0
10,000
20,000
30,000
40,000
50,000
60,000
70,000
80,000
90,000
2012 2013 201420 14
+5.0
%
+6
.8%
+2.0
%
+3
.3%
+9.5
%
+1
1.6
%
0
10,000
20,000
30,000
40,000
50,000
2012 2013 20142014

MANAGEMENT’S DISCUSSION AND ANALYSIS BUSINESS SEGMENT ANALYSIS PERSONAL AND COMMERCIAL
National Bank of Canada 25 2014 Annual Report
Simplicity This year, the Bank continued to roll out a new mortgage financing process supported by a sales and service platform used by the entire retail distribution network, the insurance segment, and product support and development. This process and technology, which generate significant business advantages and efficiency gains for the Bank, have been used in Quebec since 2013. Improvements were made to the platform this year to optimize the execution of the process. Deployment will be completed across the Canadian distribution network by early 2015.
Always mindful of enhancing client experience and delivering on its promise of simplicity, the Bank has continued the technological modernization of its distribution network with a gradual upgrading of its Internet banking platform.
At the same time, the Bank implemented a multi-initiative program to optimize process efficiency and achieve productivity gains. These initiatives include tightening the application of business practices and concentrating the sales force on value-added activities for clients and business development.
In response to a client shift to electronic and remote channels for daily banking, the Bank is also reviewing branch size and layout. In some branches it has set up user-friendly “interactive spaces” where clients can talk to advisors and learn about the Bank’s distribution channels. Financial education areas and children’s play areas have also been set up. This initiative generated high client satisfaction and the Bank will install similar setups in other branches in 2015. Accessibility The Bank demonstrated its agility in 2014, acting swiftly to stand out in the market with competitive advantages that directly affect client satisfaction.
To improve branch accessibility and meet client needs, the Bank has extended business hours in more than half of its branches by an average of three hours per week. Moreover, 169 branches are open on Saturday.
A program to strengthen the Bank’s position with SME clients was also introduced. Several initiatives were implemented in 2014 and the program will continue in 2015. This year, the Bank focused its efforts on the experience of its new SME clients.
— The Bank simplified the process for opening accounts and significantly shortened the processing time. Clients can now open a commercial account faster, after just one meeting.
— It automated credit decisions for loans under $100,000, making it easier to process loan applications and providing clients with a faster response.
Priorities and Outlook for 2015
In 2015, the Bank will continue to shape the Personal and Commercial segment in line with its main strategic directions.
To reap the benefits of the Client Value Proposition, with its commitment to accessibility, proactivity and simplicity, the Bank will:
— further upgrade advisor skillsets; — consolidate specialized services for commercial clients in agrifood, film
and television, health care and high-tech; — continue to hone its operating and marketing business models.
To market itself as a super-regional +, the Bank will continue to:
— improve its bank branches and standardize processes and technology across Canada;
— strengthen its multi-channel distribution network and extend it to the insurance segment. Moreover, to maximize growth and efficiency opportunities, the Bank
will introduce new initiatives to improve operational efficiency and optimize synergy among the Bank’s segments through internal and external partnerships.

MANAGEMENT’S DISCUSSION AND ANALYSIS
26 National Bank of Canada 2014 Annual Report
BUSINESS SEGMENT ANALYSIS WEALTH MANAGEMENT
OVERVIEW The Wealth Management segment deploys a strategy that centres on delivering an exceptional, professional client experience to its investors. In line with its mission, the segment continues to be recognized for its industry-leading products and services that are delivered by one of the best teams of investment professionals in the country. By leveraging its internal and third-party distribution channels as well as its product manufacturers, the Bank’s Wealth Management segment has assumed a leadership position in Quebec and will continue to grow its market share in the rest of Canada. The segment will continue to distinguish its brand by offering its unique business model characterized by the superior level of professionalism that is at the very heart of its culture.
Segment Results – Wealth Management Year ended October 31 (millions of Canadian dollars) 2014 2013(1) 2012(1) 2014-13
% change
Excluding specified items(2) Net interest income 315 272 255 16 Fee-based revenues 663 559 525 19 Transaction and other revenues 354 319 305 11 Total revenues 1,332 1,150 1,085 16 Non-interest expenses 913 841 826 9 Contribution 419 309 259 36 Provisions for credit losses 3 3 3 – Income before income taxes 416 306 256 36 Income taxes 108 81 68 33 Net income excluding specified items 308 225 188 37 Specified items after taxes(2) (38) (24) 165 Net income 270 201 353 34 Non-controlling interests – – 1 Net income attributable to the Bank’s shareholders 270 201 352 34 Average assets 10,400 9,080 8,817 15 Average deposits 24,225 21,477 19,454 13 Average loans and acceptances 8,287 7,862 7,761 5 Net impaired loans 2 2 2 Efficiency ratio excluding specified items(2) 68.5 % 73.1 % 76.1 %
(1) Certain amounts have been adjusted to reflect changes in accounting standards. See Note 2 to the consolidated financial statements. (2) See the Financial Reporting Method section on page 12.

MANAGEMENT’S DISCUSSION AND ANALYSIS BUSINESS SEGMENT ANALYSIS WEALTH MANAGEMENT
National Bank of Canada 27 2014 Annual Report
Financial Results In the Wealth Management segment, net income excluding specified items totalled $308 million in 2014 versus $225 million in 2013, a strong 37% increase owing primarily to favourable synergies achieved from the segment’s recent transactions as well as to growth in assets under administration and under management. Excluding specified items, the segment’s total revenues amounted to $1,332 million in 2014, representing 16% growth from $1,150 million in 2013. Accounting for 29% of this revenue growth was the acquisition of TD Waterhouse Institutional Services (TDWIS) completed in the first quarter of 2014, while all of the segment’s other businesses made gains, particularly National Bank Financial – Wealth Management and Private Wealth 1859. At $338.3 billion, assets under administration and under management posted 31% growth, also due to the TDWIS acquisition as well as to sustained sales efforts and to a rise in stock market prices.
Excluding specified items, non-interest expenses stood at $913 million in 2014, a 9% increase from $841 million in 2013 that came mainly from the higher variable compensation associated with the segment’s volume growth as well as from the TDWIS acquisition. The segment’s efficiency ratio improved to 68.5% in 2014 from 73.1% in 2013 and from 76.1% in 2012.
The specified items for fiscal years 2014 and 2013, totalling $38 million and $24 million, respectively, net of income taxes, had an adverse effect on net income and consisted mainly of acquisition-related charges.
Total Revenues by Category Year ended October 31, 2014
Net interest income (2013: 24%) Fee-based services (2013: 48%) Transaction-based and other revenues (2013: 28%)
Quarterly Results(1) (millions of Canadian dollars) Q4 2014 Q3 2014 Q2 2014 Q1 2014
(1) Excluding specified items. See the Financial Reporting Method section on page 12.
24%
50%
26%
34
0
23
1
80
Tota
l rev
enue
s
Non
-int
eres
t ex
pen
ses
Net
inco
me
33
5
23
3
75
Tota
l rev
enue
s
Non
-int
eres
t ex
pen
ses
Net
inco
me
33
2
22
7
77
Tota
l rev
enue
s
Non
-int
eres
t ex
pen
ses
Net
inco
me
32
5
22
2
76
Tota
l rev
enue
s
Non
-int
eres
t ex
pen
ses
Net
inco
me
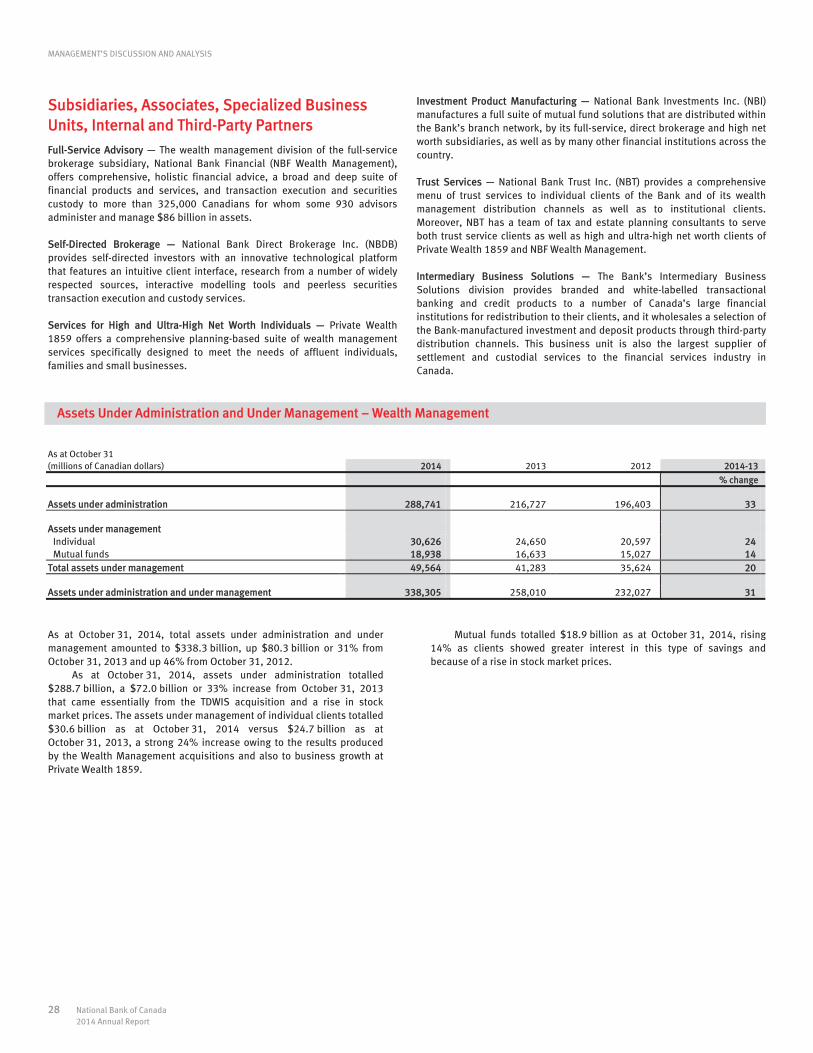
MANAGEMENT’S DISCUSSION AND ANALYSIS
28 National Bank of Canada 2014 Annual Report
Subsidiaries, Associates, Specialized Business Units, Internal and Third-Party Partners
Full-Service Advisory — The wealth management division of the full-service brokerage subsidiary, National Bank Financial (NBF Wealth Management), offers comprehensive, holistic financial advice, a broad and deep suite of financial products and services, and transaction execution and securities custody to more than 325,000 Canadians for whom some 930 advisors administer and manage $86 billion in assets. Self-Directed Brokerage — National Bank Direct Brokerage Inc. (NBDB) provides self-directed investors with an innovative technological platform that features an intuitive client interface, research from a number of widely respected sources, interactive modelling tools and peerless securities transaction execution and custody services. Services for High and Ultra-High Net Worth Individuals — Private Wealth 1859 offers a comprehensive planning-based suite of wealth management services specifically designed to meet the needs of affluent individuals, families and small businesses.
Investment Product Manufacturing — National Bank Investments Inc. (NBI) manufactures a full suite of mutual fund solutions that are distributed within the Bank’s branch network, by its full-service, direct brokerage and high net worth subsidiaries, as well as by many other financial institutions across the country. Trust Services — National Bank Trust Inc. (NBT) provides a comprehensive menu of trust services to individual clients of the Bank and of its wealth management distribution channels as well as to institutional clients. Moreover, NBT has a team of tax and estate planning consultants to serve both trust service clients as well as high and ultra-high net worth clients of Private Wealth 1859 and NBF Wealth Management. Intermediary Business Solutions — The Bank’s Intermediary Business Solutions division provides branded and white-labelled transactional banking and credit products to a number of Canada’s large financial institutions for redistribution to their clients, and it wholesales a selection of the Bank-manufactured investment and deposit products through third-party distribution channels. This business unit is also the largest supplier of settlement and custodial services to the financial services industry in Canada.
Assets Under Administration and Under Management – Wealth Management As at October 31 (millions of Canadian dollars) 2014 2013 2012 2014-13
% change
Assets under administration 288,741 216,727 196,403 33 Assets under management Individual 30,626 24,650 20,597 24 Mutual funds 18,938 16,633 15,027 14 Total assets under management 49,564 41,283 35,624 20 Assets under administration and under management 338,305 258,010 232,027 31
As at October 31, 2014, total assets under administration and under management amounted to $338.3 billion, up $80.3 billion or 31% from October 31, 2013 and up 46% from October 31, 2012.
As at October 31, 2014, assets under administration totalled $288.7 billion, a $72.0 billion or 33% increase from October 31, 2013 that came essentially from the TDWIS acquisition and a rise in stock market prices. The assets under management of individual clients totalled $30.6 billion as at October 31, 2014 versus $24.7 billion as at October 31, 2013, a strong 24% increase owing to the results produced by the Wealth Management acquisitions and also to business growth at Private Wealth 1859.
Mutual funds totalled $18.9 billion as at October 31, 2014, rising
14% as clients showed greater interest in this type of savings and because of a rise in stock market prices.

MANAGEMENT’S DISCUSSION AND ANALYSIS BUSINESS SEGMENT ANALYSIS WEALTH MANAGEMENT
National Bank of Canada 29 2014 Annual Report
Main Issues and Challenges The Wealth Management segment has identified the following issues and challenges for the years ahead.
— Investor trust improved as the securities markets advanced. In May 2014, the S&P/TSX finally climbed back to 2008 levels, while the S&P 500 has scaled new heights since mid-2013.
— To protect investors, the regulatory environment has become increasingly strict. Although this is certainly a good thing, the new requirements, taking effect over three years as of 2014, will be costly and require substantial effort.
— A large percentage of the population is aging and dipping into their savings to maintain their lifestyle in retirement. This trend presents new challenges and new opportunities for the financial services industry.
— Wealth Management, like the financial services industry in general, is increasingly technology-dependent. As this dependency grows, so does the importance of having an underlying technology that operates reliably around the clock and is resistant to online fraud.
Strategies
All of Wealth Management’s strategic priorities are guided by a commitment to growing sales and revolve around a series of focal points. Greater Emphasis on Organic Growth In the past few years, Wealth Management has carried out major transactions that have significantly raised the Bank’s profile in the financial services market, expanded its reach and generated many economies of scale that have translated into greater operational efficiency. Now that these acquisitions have been fully integrated, the emphasis is on organic growth and on drawing even greater synergies from the complementary nature of the business lines in the Wealth Management segment.
That said, there is no denying that the Canadian trend towards consolidation in financial services encourages acquisitions, and Wealth Management fully intends to remain alert to compelling new acquisition opportunities for the Bank. Prioritizing a Financial Advisory Approach to Distribution The segment remains very confident in the high-growth potential of applying an advice-based approach to the distribution of financial products and services. This optimism is supported by trends in Canadian demographics and by a growing number of high net worth households and clients. These trends, which are not expected to soon reverse, have increased the need for customized financial advice, as clients are facing important questions and financial decisions that have become increasingly complex.
However, the segment’s focus on this area of wealth management in no way diminishes the importance of other categories of services. It is understood that the growth strategies implemented by the segment apply to every category of its product and service offering.
Importance of Partnerships and Associations to the Overall Strategy A unique feature of Wealth Management’s business model is the strong emphasis placed on strategic partnerships and associations. Such arrangements provide clear mutual benefits that the Bank can leverage to optimize its capacity to design financial products and use its operational platforms. The partnerships and associations that have been concluded are integral to Wealth Management’s market expansion strategies. Therefore, notwithstanding the greater emphasis on organic growth in the period ahead, the segment will continue to examine partnership opportunities likely to further expand the Bank’s reach into the area of wealth management. Maintaining the positive leverage created through these arrangements is essential to the segment’s targeted growth. Capitalizing on Growth Prospects in the Bank’s Developing Markets The segment sees excellent opportunities to develop wealth management services in regions of Canada where the Bank is less established. The acquisitions completed in recent years have significantly expanded Wealth Management’s presence in Central, Western and Atlantic Canada. The implementation plan involves using this stronger presence as a stimulus to future growth outside Quebec.
Achievements
Given its recent acquisitions, 2014 was a transition year for the Wealth Management segment. Generally speaking, more focus was placed on the need for prudent management and control over operating costs across all business units. Achieving Synergies A major accomplishment in 2014 was the successful integration of TDWIS, the securities settlement and custody services business acquired from Toronto-Dominion Bank in November 2013. This was one of the largest transfers in Canadian banking history, with 248 market intermediaries, $39 billion in assets and 133,000 clients seamlessly integrated into the platform of National Bank Correspondent Network Inc. (NBCN). In addition to strengthening NBCN’s leadership position in institutional services, this transaction will drive economies of scale for the Bank and enable NBF Wealth Management, Private Wealth 1859 and NBDB, which have the same infrastructure, to operate more efficiently.
In 2014, after focusing on Quebec for its first five years, Private Wealth 1859 began expanding outside the province to achieve synergies with the Bank’s other business units. The Bank’s Personal and Commercial segment and NBF Wealth Management have affluent clients who may be attracted to components of Private Wealth 1859’s service offering. Private Wealth 1859 has now added staff in Vancouver, Calgary, Winnipeg and Toronto to serve these clients.
After the Bank sold Natcan Investment Management Inc. operations to Fiera Capital Corporation (Fiera) in 2012 and acquired a 35% stake in that company, Fiera began using NBT for securities custody services. In 2014, Fiera transferred the securities custody services to NBT for an amount of more than $3 billion.

MANAGEMENT’S DISCUSSION AND ANALYSIS
30 National Bank of Canada 2014 Annual Report
Delivering on the Client Value Proposition The Bank has implemented a financial program for clients of NBF Wealth Management and Private Wealth 1859. The program combines transactional banking services with lines of credit and offers a prestigious credit card, travel concierge services and a medical assistance plan, all at a very attractive price.
The TDWIS acquisition and the 2012 and 2011 acquisitions further enhanced the Bank’s wealth management offerings, since these transactions opened the door to multi-currency accounts, registered disability savings plans, U.S.-dollar registered accounts and many other products offered by NBF Wealth Management, NBDB and Private Wealth 1859.
NBDB recently opened its Do-It-Yourself Investors Zone, where novice and experienced investors alike can attend seminars, ask questions about direct brokerage, get information on NBDB’s services, open an account and trade in the interactive zone. This is yet another way for investors to access NBDB’s services, in addition to the Internet, mobile applications, telephone and the National Bank branch network.
NBF Wealth Management launched myWEALTH, a truly innovative, fee-based program that, along with many special features, offers clients great flexibility and extensive choice.
Priorities and Outlook for 2015
For 2015, Wealth Management’s priorities will address four main business priorities.
— The Bank has an “open-architecture” approach to its internally-manufactured managed solutions which is unique among wealth management units within banks. This approach centres on entrusting all portfolio management responsibilities to carefully selected external asset managers. One of the priorities for 2015 is to better promote the advantages of open architecture and aggressively grow the sales of managed products within the bank branch network, the NBF Wealth Management network and external sales networks.
— Consistent with its objective of focusing on holistic, comprehensive wealth management advice, the segment intends to export the trust services it currently offers in Quebec to other key markets in Central, Western and Atlantic Canada by hiring locally-based experts.
— With all of the acquisitions of recent years now fully integrated, a major focus for 2015 will be to identify potential synergies or any other possibility that will enable the Wealth Management segment to continue to improve its operational efficiency.
— To leverage the growing appetite on the part of affluent Canadians with multiple financial needs for “one-stop shopping” when it comes to their financial solutions, the segment intends to double up efforts to bring the full breadth of products available through National Bank to the attention of its clients.
In pursuing these four main priorities, greater emphasis will be placed
on seeking technological improvements that raise productivity, further strengthening professionalism and the wealth management approach of its advice-based channels, and achieving market penetration of the segment’s product and service offering via internal channels and through partners, with a particular concentration on Central, Western and Atlantic Canada.

MANAGEMENT’S DISCUSSION AND ANALYSIS
National Bank of Canada 31 2014 Annual Report
BUSINESS SEGMENT ANALYSIS FINANCIAL MARKETS
OVERVIEW
The Financial Markets segment offers clients a full suite of products and services to meet their specific needs—from debt and equity securities to bank credit and risk management products. The segment also delivers comprehensive advisory services in the areas of mergers and acquisitions and financing. Access to the Canadian capital markets is provided through its fixed income, equities and derivatives business lines. Clients of the segment include large and mid-sized corporations, the public sector and institutions. The Financial Markets segment is Canada-focused and employs a client-centric approach to ensure that all clients benefit from the full breadth of its capabilities. Financial Markets is an investment banking leader in Quebec with a strong presence across Canada. In fixed income and equities, the Bank is a major Canadian player, providing origination, underwriting, distribution, liquidity through secondary market activities and macroeconomic and issuer-focused research. The Financial Markets segment provides corporate lending to large and mid-sized Canadian corporate clients and risk management services to these clients. Through offices in New York, London (UK) and Hong Kong, the Financial Markets segment markets Canadian debt and equity securities to institutional investors in the United States and internationally. Through its recently formed Dublin subsidiary, the segment now has commenced trading activities with large European based institutional counterparties in local equity and equity linked securities. The Financial Markets segment has strong expertise in investing and managing distressed consumer debt portfolios through its specialty finance subsidiary Credigy Ltd., which operates exclusively outside of Canada.
Segment Results – Financial Markets Year ended October 31 (taxable equivalent basis)(1) (millions of Canadian dollars) 2014 2013(2) 2012(2) 2014-13
% change
Excluding specified items(1) Trading activity revenues Equities 333 288 246 16 Fixed-income 218 237 212 (8) Commodities and foreign exchange 83 88 73 (6) 634 613 531 3 Financial market fees 301 257 280 17 Gains on available-for-sale securities, net 27 26 49 4 Banking services 250 234 191 7 Other 315 248 252 27 Total revenues 1,527 1,378 1,303 11 Non-interest expenses 692 664 672 4 Contribution 835 714 631 17 Provisions for (recoveries of) credit losses (14) 3 Income before income taxes 835 728 628 15 Income taxes 226 195 170 16 Net income excluding specified items 609 533 458 14 Specified items after income taxes(1) (9) (28) Net income 600 533 430 13 Non-controlling interests 14 8 3 Net income attributable to the Bank's shareholders 586 525 427 12 Average assets 86,198 87,063 76,084 (1) Average deposits 11,109 6,541 4,160 70 Average loans and acceptances (Corporate Banking only) 8,070 7,081 5,855 14 Net impaired loans 40 Net impaired loans as a % of average loans and acceptances % % 0.7 % Efficiency ratio excluding specified items(1) 45.3 % 48.2 % 51.6 %
(1) See the Financial Reporting Method section on page 12. (2) Certain amounts have been adjusted to reflect changes in accounting standards. See Note 2 to the consolidated financial statements.

MANAGEMENT’S DISCUSSION AND ANALYSIS BUSINESS SEGMENT ANALYSIS FINANCIAL MARKETS
32 National Bank of Canada 2014 Annual Report
Financial Results
In the Financial Markets segment, net income totalled $600 million in 2014, up $67 million or 13% from 2013. Excluding specified items, the 2014 net income totalled $609 million, rising $76 million or 14% from $533 million in 2013. On a taxable equivalent basis, total revenues amounted to $1,527 million, a $149 million year-over-year increase driven by all of the segment’s revenue categories.
The 2014 trading activity revenues rose $21 million or 3% year over year, mainly due to solid equities business. Financial market fees were up $44 million or 17%, owing mainly to revenues from new issuances, while banking service revenues grew 7%, particularly due to greater financing needs among clients. Gains on available-for-sale securities remained steady when compared to fiscal 2013, and the segment’s other revenues saw a year-over-year increase stemming from a disposal of investments and from sustained revenue growth by the Credigy Ltd. subsidiary.
During fiscal 2014, the Bank recognized a $13 million charge ($9 million net of income taxes), as a specified item, to reflect the Funding Valuation Adjustment (FVA). The FVA represents the implied market funding costs and benefits of uncollateralized (including not fully collateralized) derivative financial instruments. The Bank, like several other financial institutions, applied this adjustment to reflect how these derivative financial instruments are traded.
Non-interest expenses stood at $692 million, a $28 million year-over-year increase that was mainly due to the higher variable compensation associated with revenue growth. Nevertheless, at 45.3%, the efficiency ratio improved from 48.2% in 2013 and from 51.6% in 2012.
The segment did not record any provisions for credit losses in 2014, while $14 million in recoveries of credit losses had been recorded in fiscal 2013.
Quarterly Results(1)(2) (taxable equivalent basis)(2) (millions of Canadian dollars)
Q4 2014 Q3 2014 Q2 2014 Q1 2014
(1) Excluding specified items. (2) See the Financial Reporting Method section on page 12.
38
0
17
4
15
0
Tota
l rev
enue
s
Non
-int
eres
t ex
pen
ses
Net
inco
me
44
5
18
8
18
7
Tota
l rev
enue
s
Non
-int
eres
t ex
pen
ses
Net
inco
me
33
7
16
2
12
8
Tota
l rev
enue
s
Non
-int
eres
t ex
pen
ses
Net
inco
me
36
5
16
8
14
4
Tota
l rev
enue
s
Non
-int
eres
t ex
pen
ses
Net
inco
me

MANAGEMENT’S DISCUSSION AND ANALYSIS BUSINESS SEGMENT ANALYSIS FINANCIAL MARKETS
National Bank of Canada 33 2014 Annual Report
Strategies and Achievements One Client, One Bank The One client, one bank strategy has remained central to the Financial Markets segment’s approach to deliver the Bank’s full capabilities to all its clients. It achieves this by employing a collaborative, partnership approach among the Bank’s business lines, the Wealth Management and Personal and Commercial segments and corporate functions. Throughout the year, Financial Markets has successfully leveraged its strengths to build and grow a leadership position in its chosen areas of focus.
The following transactions are examples of the segment’s ability to deliver a diverse and integrated set of solutions to its clients.
— The Financial Markets segment was mandated by EnerCare Inc. to advise on a $550 million acquisition of the Ontario Home and Small Commercial Services business of Direct Energy Marketing Limited from Centrica plc. It also co-led a $333 million equity capital markets financing and co-underwrote $310 million in new credit facilities.
— The Financial Markets segment, a lender to Long Run Exploration Ltd., since the inception of the company, co-led its $695 million credit facility and executed multi-product hedging strategies for the company. The segment also acted as lead underwriter to Long Run Exploration Ltd. on a $120 million bought deal equity financing, $69 million bought deal secondary offering, and $75 million convertible debenture offering in the first half of 2014.
— The segment acted as financial advisor on a $357 million transaction between Long Run Exploration Ltd. and Crocotta Energy Inc., which resulted in the formation of Leucrotta Exploration Inc. The segment then acted as lead underwriter on Leucrotta’s $30 million bought deal equity financing, is the lead lender to its $25 million credit facility and continues to execute ongoing multi-product hedging strategies for Leucrotta Exploration Inc.
— The Financial Markets segment acted as co-bookrunner for $1.42 billion in equity capital markets transactions and as joint bookrunner for a US$1.36 billion bridge credit facility related to Element Financial Corporation’s acquisition of PHH Arval, with more than US$4.6 billion of assets. The segment also acted as co-bookrunner for two previous equity capital markets transactions, including the company’s inaugural preferred share issuance.
Maintaining Focus on Mid-Market Companies The Financial Markets segment continues its focus on mid-market corporate clients, providing them with a comprehensive range of advisory services, financing alternatives and risk management products. In addition to mid-market energy and mining, the segment also focuses on other industries, including real estate, industrial products, transportation, consumer and retail as well as telecommunications, media and technology.
During the year, the segment advised on 53 publicly-announced M&A transactions and led or co-led 94 equity offerings on behalf of corporate issuers. Leveraging Market Leadership in Quebec As a market leader in Quebec, the Financial Markets segment continued to deepen its presence throughout the province. It participated in 56 syndicated loans involving Quebec borrowers and led or co-led 40 of these transactions, with a market share of 22.1%.
The Financial Markets segment ranked first in leading public equity offerings of Quebec issuers, having led 12 offerings that raised $2.0 billion which represents a market share of 18%. During the year, it was involved in a total of 26 offerings, more than any other dealers. The segment also advised on 14 merger and acquisition transactions, aggregating close to $10.0 billion in value and also ranking first for its M&A work in domestic transactions. Achievements on behalf of Quebec-based issuers included.
— Acted as co-lead underwriter on Lumenpulse Inc.’s $115 million initial public offering of common shares and $66.5 million bought deal secondary offering.
— Lead on Cominar REIT’s $825 million credit facilities, as administrative agent and co-lead on a $287.5 million equity offering related to the financing of the $1.6 billion acquisition of a shopping centre and office building portfolio of Ivanhoé Cambridge Inc.
— Financial advisor on large development projects in the province of Quebec, including acting as sole underwriter for $360 million in credit facilities, as advisor to McInnis Cement Inc. in its $1.1 billion Port-Daniel cement plant and to Petrolia Inc. and Corridor Resources Inc. regarding the $100 million oil exploration program on Anticosti Island.

MANAGEMENT’S DISCUSSION AND ANALYSIS BUSINESS SEGMENT ANALYSIS FINANCIAL MARKETS
34 National Bank of Canada 2014 Annual Report
Maintaining Leadership in Fixed Income The Financial Markets segment’s fixed-income group maintained its status as top-tier dealer, ranking first overall in Canadian government debt underwriting by Bloomberg magazine in year-to-date 2014. The group reached a market share of 19.1% in 2014 year-to-date and acted as lead or joint-lead on 63 underwritten and agency medium-term note issues of government securities totalling $31.0 billion.
Building on existing and growing lending relationships, the fixed-income team is a top-tier corporate debt underwriter, participating in 128 corporate deals for a total of $8.5 billion.
A strategic focus continues to be the distribution of Canadian products in international markets. The group recently reaffirmed its objective by opening an office in Hong Kong while maintaining a solid presence in New York and the largest Canadian-focused desk in the United Kingdom.. Demonstrating Strength in Infrastructure and Project Financing The Financial Markets segment’s fixed-income group is also a leader of Canadian public-private infrastructure long-term debt underwriting, capturing the top spot in the market over the past two years in terms of debt underwritten and deals closed. Examples of Financial Markets advisory mandates included:
— Advised project sponsors Gracorp Capital Advisors Ltd. and Balfour Beatty Investments L.P. on the structure and long-term debt capital raising for the British Columbia-based, $232 million (financing), North Island Hospitals Project, which included two new hospital facilities for the communities of Comox Valley and Campbell River.
— The first Green Bond to be directly used to fund a P3 project in North America. National Bank’s dealer subsidiary, National Bank Financial Inc. is a registered member of the Green Bond Principles. In 2014, the Financial Markets segment also pursued its commitment to
the renewable energy project financing space, playing key roles across Canada.
In British Columbia, the Bank financed four power projects including three hydroelectric projects:
— Co-underwrote a $299 million long-term bond financing for the John Hart Generating Station Replacement project (sponsored by InPower BC General Partnership);
— Co-underwrote and acted as administrative agent for $95 million in long-term credit facilities for the Tretheway Creek Power project (developed by Innergex Renewable Energy Inc.);
— Acted as sole provider of $77 million in bank financing and interest rate hedging for BluEarth Renewables Inc.’s Culliton Creek project; and
— Acted as administrative agent for $202 million in credit facilities for the Merritt Green Energy biomass project developed by Fengate Capital Management Ltd. and Dalkia Canada Inc.
In Ontario, the Bank financed multiple projects, including co-leading $543 million in credit facilities for the Kingston Solar project (developed by Connor, Clark & Lunn Infrastructure and Samsung Renewable Energy Inc.). In Nova Scotia, the Bank was proud to support Elemental Energy Inc. by providing $30 million in credit facilities as sole lender for the construction of its Watts Wind II project.
Continued Leadership in Deploying Risk Management Products to the Bank’s Clients The Financial Markets segment continued to leverage its derivatives trading and structuring skills to develop innovative risk management solutions to assist clients in managing their risks across all asset classes. The group has noted a 61% growth in the number of active clients for all asset classes over the past five years. Over the same period, the number of clients using more than one risk management product increased by 75%. This has translated into strong revenue growth. Remained Top-Tier Provider of Equity and Structured Products The group continues to provide over-the-counter derivatives and structuring services on all asset classes for exchange-traded fund (ETF), structured note and managed retail product issuers. The group also provides liquidity to investors and offers research on all investment products. Highlights – Exchange-Traded Funds (ETF) and Structured Notes — The group is the largest market maker of ETFs in Canada (by volume)
(Bloomberg). — The group provided liquidity for all ETFs and was designated market
maker for 36% of all listed ETFs in Canada. — Sales volumes of structured notes rose by 217% over the past five
years. Total ETF Volume in Canadian market and Market share
Total volume attributable to the NBF subsidiary (millions of shares) Total volume of Canadian exchange-traded funds for the top six brokers (millions of shares) Market share of the NBF subsidiary as a %
0%
5%
10%
15%
20%
25%
30%
35%
40%
45%
50%
0
500
1,000
1,500
2,000
2,500
3,000
3,500
Q4 14 Q3 14 Q2 14 Q1 14 Q4 13 Q3 13 Q2 13 Q1 13Q4 14 Q3 14 Q2 14 Q1 14

MANAGEMENT’S DISCUSSION AND ANALYSIS BUSINESS SEGMENT ANALYSIS FINANCIAL MARKETS
National Bank of Canada 35 2014 Annual Report
Delivering Industry-Leading Capabilities to Clients Further confirmation of the Financial Markets segment’s commitment to providing clients with top-tier services is demonstrated by the following achievements:
— The research team tied for first by corporate issuers based on which analyst best understood their company in Brendan Wood International’s Worldwide Equity Capital Markets Performance – Canadian Equity 2014 Report.
— The Bank’s chief economist and strategist was one of only three Canadian economists to be ranked in Bloomberg’s most recent Top Forecasters of the U.S. Economy (for the two-year period ended August 2014).
Strength in Specialty Finance Through Credigy Ltd. Credigy Ltd. is the Financial Markets segment’s specialty finance arm, of which it acquired majority control in 2006, and subsequently increased its ownership to hold its present position of 80%. Credigy Ltd. purchases performing and non-performing consumer-related asset portfolios and optimizes collections through its data analytics and modelling expertise to achieve target returns. It is also a lender to other large buyers of similar assets.
Credigy Ltd. is internationally focused, purchasing portfolios in the Americas and Europe. The group is also diversified by asset class. Between 2013 and 2014, Credigy Ltd. achieved growth in revenue and income before income taxes of 22% and 93%, respectively.
Priorities and Outlook for 2015
In 2015, the Financial Markets segment will continue to focus on its One client, one bank strategy, developing innovative, integrated solutions to meet the needs of its clients and respond to market opportunities.
Strategic priorities include continuing to build market share in corporate debt, infrastructure and power finance, continuing to expand specialty finance capabilities through the Credigy Ltd. subsidiary and continuing to strengthen the group’s capacity to distribute Canadian investment products to investors globally.

MANAGEMENT’S DISCUSSION AND ANALYSIS
36 National Bank of Canada 2014 Annual Report
BUSINESS SEGMENT ANALYSIS OTHER
OVERVIEW
The Other heading reports on Treasury operations, including the Bank’s asset and liability management, liquidity management and funding operations; certain non-recurring items; and the unallocated portion of corporate units. Corporate units include Information Technology, Risk Management, Operations, Marketing and Business Strategy, Human Resources and Corporate Affairs, and Finance and Treasury.
Segment Results – Other Year ended October 31 (taxable equivalent basis)(1) (millions of Canadian dollars)
2014 2013(2) 2012(2)
Excluding specified items(1) Net interest income (57) (16) 78 Non-interest income 143 126 83 Total revenues 86 110 161 Non-interest expenses 166 145 109 Income before income taxes (80) (35) 52 Income taxes (58) (39) 3 Net income excluding specified items (22) 4 49 Specified items after income taxes(1) (8) 113 112 Net income (30) 117 161 Non-controlling interests 55 55 57 Net income attributable to the Bank’s shareholders (85) 62 104 Average assets 28,566 20,670 25,919
(1) See the Financial Reporting Method section on page 12. (2) Certain amounts have been adjusted to reflect changes in accounting standards. See Note 2 to the consolidated financial statements.
Financial Results
For the Other heading of segment results, excluding specified items, there was a net loss of $22 million in fiscal 2014 versus net income of $4 million in fiscal 2013 and net income of $49 million in fiscal 2012. The year-over-year decline in the 2014 net income was mainly due to lower revenues from Treasury, to the variable compensation associated with the Bank’s sound performance, to technology initiatives, and to the promotion of the brand image.
The 2014 specified items, net of income taxes, consisted of $54 million ($104 million in 2013) in revenues related to holding restructured notes, net of the financing costs of holding these notes, $45 million ($29 million in 2013) in intangible asset impairment losses, $10 million in litigation provisions (nil in 2013), and $7 million ($4 million in 2013) in charges related to the Bank’s interest in TMX Group Ltd.
For fiscal 2013, the specified items, net of income taxes, had included a $26 million reduction in the pension plan and other post-employment plan expense, $21 million in charges related to severance pay and vacant premises, and a $37 million reversal of provisions for income tax contingencies.
MANAGEMENT’S DISCUSSION AND ANALYSIS BUSINESS SEGMENT ANALYSIS OTHER
National Bank of Canada 37 2014 Annual Report
Treasury and Corporate Units The Other heading encompasses Treasury and the Bank’s corporate units, which include the following: Information Technology, Risk Management, Operations, Marketing and Business Strategy, Human Resources and Corporate Affairs, and Finance and Treasury. These units provide advice and guidance throughout the Bank and to its business segments in addition to expertise and support in their respective fields. Information Technology The Information Technology unit is responsible, on one hand, for maintaining the Bank’s technological assets to ensure reliable computer service for clients and employees and, on the other hand, for ensuring that those services evolve smoothly in support of the Bank’s business objectives and in compliance with changes in regulatory requirements. Managing technology risk, whether it involves data security, obsolescence prevention, or the recovery plan, is also part of this unit’s responsibilities. Risk Management The Risk Management unit is responsible for identifying, measuring, and monitoring—independently and within an integrated framework—the risks to which the Bank is exposed and for promoting a sound risk management culture. The Risk Management team helps the Board and management understand and monitor the main risks (see the Risk Management section for additional information). The unit also develops, maintains and communicates the risk appetite framework while overseeing the integrity and reliability of risk measures. Furthermore, this unit is also a business partner and expertise leader whose mandate is to reduce legal risks by providing sound guidance on regulatory, governance and business litigation matters. Operations The Operations unit is a strategic, proactive business partner that ensures delivery of financial products and services to clients. It supports the operationalization of business strategies and creates continuous value, in particular through a structured approach to business process improvement. The Operations unit provides Bank-wide leadership on the governance of end-to-end business processes in order to streamline the Bank and generate tangible gains for clients, employees and shareholders. The Operations unit also leads the strategic initiatives office, the main role of which is to advise the Office of the President on its strategic investment decisions. In its mandates, the Operations team deploys specific strategies and executes with discipline to help drive growth and differentiate the client experience.
Marketing and Business Strategy The Marketing and Business Strategy unit is responsible for deploying the Bank’s distinctive strategy, brand image and client experience by offering customized financial products and payment solutions adapted to the needs of personal and commercial clients, relying on a proven analytical approach and tying technological and digital developments in with business priorities. The unit is also responsible for community engagement, public affairs, institutional relationships and identifying strategic development opportunities for the Bank. Human Resources and Corporate Affairs The Human Resources and Corporate Affairs unit provides its expertise to all of the Bank’s units and contributes to the Bank’s performance, growth and continued status as an employer of choice by deploying strategies meant to attract, develop and retain the best talent. The unit implements practices that promote employee mobilization and cultivates a work environment where everyone can develop to their full potential. As for Corporate Affairs, its mandate is to maintain the integrity of the Bank and its subsidiaries as a publicly accountable enterprise in addition to providing legal and administrative support to ensure institutional viability. It also oversees the institution’s governance, continuous disclosure as well as the regulatory requirements applicable to the Bank and its subsidiaries. Finance and Treasury The Finance and Treasury unit is responsible for optimizing management of financial resources (capital, liquidity, financing and sourcing), actively ensuring asset/liability management, and ensuring sound governance of accounting and financial information. It also participates in strategic and operational decision-making and supervises the activities of the pension plan fund for Bank employees. It helps the business segments and support functions in their financial performance, ensures compliance with regulatory requirements, and carries out the Bank’s reporting to shareholders and the external reporting of the various units, entities and subsidiaries of the Bank. Finally, for administrative purposes, Internal Audit reports to Finance and Treasury.

MANAGEMENT’S DISCUSSION AND ANALYSIS
38 National Bank of Canada 2014 Annual Report
FINANCIAL ANALYSIS
Analysis of Consolidated Results
Total Revenues On a taxable equivalent basis, the Bank’s 2014 total revenues amounted to $5,683 million, up $323 million from 2013 (Table 2, page 96). Excluding the specified items recorded for 2014 and 2013, total revenues on a taxable equivalent basis rose $408 million or 8% year over year. The 2014 and 2013 specified items include items related to holding restructured notes as well as acquisition-related items. The 2014 specified items also include a funding valuation adjustment related to certain derivative financial instruments. Net interest income In 2014, net interest income on a taxable equivalent basis totalled $2,763 million, up $117 million from $2,646 million in 2013 (Table 3, page 96). In the Personal and Commercial segment, net interest income totalled $1,699 million, up $84 million or 5% year over year. Average loan and deposit volumes experienced steady growth compared to fiscal 2013, rising 6% and 7%, respectively, stemming essentially from residential mortgages and home equity lines of credit. This increase, however, was tempered by a narrowing net interest margin, which was 2.24% in 2014 compared to 2.28% in 2013. In the Wealth Management segment, net interest income totalled $315 million, rising $43 million due to growth in brokerage business and the CashPerformer account as well as to the TDWIS acquisition. In the Financial Markets segment, the 2014 net interest income increased $40 million year over year, mainly due to trading activities, and should be examined together with the other items of trading activity revenues. For the Other heading, net interest income was down, mainly attributable to Treasury activities. Non-interest income Non-interest income for 2014 totalled $2,920 million versus $2,714 million last year (Table 4, page 97). The portion of trading revenues recorded in non-interest income was $106 million compared to $186 million in 2013; including the portion recorded in net interest income, trading activity revenues amounted to $743 million in 2014 (Table 5, page 97), an $82 million year-over-year decrease stemming mainly from items related to holding restructured notes (i.e., the revenues recorded to reflect a rise in value were lower in 2014 than in 2013) and from a decline in fixed-income securities revenues.
As shown in table 4 on page 97, underwriting and advisory fees increased by 29% due to growth in new issuances and to the TDWIS acquisition, whereas securities brokerage commissions declined 1% as business shifted towards fee-based services. Mutual fund revenues and trust service revenues totalled $639 million, rising $106 million and owing primarily to fee-based revenues as well as to growth in assets under administration resulting mainly from the TDWIS acquisition. Revenues from acceptances, letters of credit and letters of guarantee were down $9 million, as clients moved towards loan products. Gains on available-for-sale securities increased $21 million, mainly due to a disposal of securities by the Treasury and Insurance sectors.
With respect to insurance revenues, they were down 8% given a decline in gross premiums as well as to increases in benefits paid to customers and in the insurance liability.
The Bank’s share in the net income of associates and joint ventures was higher owing to a larger contribution from Maple Financial Group Inc. and Fiera. Other revenues amounted to $356 million, a $60 million year-over-year increase that came mainly from the disposal of investments and from revenue growth at Credigy Ltd. Provisions for Credit Losses For fiscal 2014, the provisions for credit losses item was $27 million higher than that of fiscal 2013 (Table 6, page 98). Provisions for personal credit losses were $7 million higher year over year and were related mostly to consumer loans, particularly because of loan volume growth. With respect to commercial credit, the Bank recorded $50 million in provisions for credit losses in 2014, $6 million more than last year. Provisions for credit losses on corporate loans were nil in 2014, whereas $14 million in recoveries had been recorded in 2013. Overall, the 2014 provisions for credit losses represented 0.21% of average loans and acceptances compared to 0.20% in 2013, remaining relatively low. Non-Interest Expenses Non-interest expenses stood at $3,423 million in 2014, up $217 million from last year (Table 7, page 99). Excluding the specified items recorded in 2014 and 2013, non-interest expenses increased $156 million or 5%.
At $2,051 million, compensation and employee benefits in 2014 posted an 8% year-over-year increase that was mainly due to higher variable compensation, to the TDWIS acquisition, and to the fact that a lower pension plan and other post-employment plan expense had been recorded in 2013.
Technology expense, including amortization, was up, mainly because of higher intangible asset impairment losses in 2014 compared to 2013. Occupancy expense, including amortization, was down, particularly because a provision for vacant premises had been recognized in 2013. At $227 million, professional fees increased by $6 million in 2014 due to technology developments, while advertising and external relations costs rose $9 million due to the promotion of banking services. The security and theft expense item increased to reflect litigation provisions recorded in 2014. Income Taxes Detailed information about the Bank’s income taxes is provided in Note 24 to the consolidated financial statements. For 2014, income taxes stood at $295 million, for an effective tax rate of 16%, compared to $252 million and an effective tax rate of 14% in 2013. The higher 2014 effective income tax rate came from the fact that, in 2013, a $37 million reversal of provisions for income tax contingencies had been recorded, and was partly offset by a higher amount of tax-exempt income from securities in 2014.

MANAGEMENT’S DISCUSSION AND ANALYSIS FINANCIAL ANALYSIS
National Bank of Canada 39 2014 Annual Report
Quarterly Financial Information
Several trends and factors have an impact on the Bank’s quarterly net income, revenues, non-interest expenses and provisions for credit losses. Results for the past 12 quarters have been summarized and provided in Table 1 on pages 94 and 95. Certain amounts have been adjusted to reflect accounting changes (see Note 2 to the consolidated financial statements). An analysis of the past eight quarters helps to identify the favourable and unfavourable factors that have affected results.
— Net income in each quarter of fiscal 2014 and 2013 has grown on a year-over-year basis, except for the second quarter of 2014 and the fourth and second quarters of 2013. The lower year-over-year net income for the second quarter of 2014 was due to the fact that, in the second quarter of 2013, revenues had been recognized to reflect an increase in the fair value of restructured notes. The recognition of revenues from the restructured notes in the fourth quarter and second quarter of 2012 as well as a gain on the disposal of a subsidiary in the second quarter of 2012 led to lower year-over-year net income for the fourth quarter and second quarter of 2013.
— In the first and third quarters of 2014, net income was higher as revenues were recognized to reflect a rise in the fair value of restructured notes.
— In the fourth quarter of 2014, charges were recorded for intangible asset impairment losses, litigation provisions and the funding valuation adjustment, whereas in the fourth quarter of 2013, additional charges for vacant premises and severance pay had been recognized.
— During the first quarter of 2013, a decrease in past service costs was recognized subsequent to accounting standard amendments and to changes in the Bank’s pension plans and other post-employment benefit plans.
— Net income for the third quarter of 2013 included a reversal of income tax provisions, whereas no reversal was recorded during the four quarters of 2014. Overall, net income has been positive over the past eight quarters,
reflecting sustained performance across all business segments. Net interest income increased year over year during each of the four
quarters of 2014 and 2013. Growth in personal and commercial loan and deposit volume, higher volume in the CashPerformer account as well as the acquisition of TDWIS in 2014 contributed to this increase.
For three of the four quarters of 2014, non-interest income was higher year over year. The 2014 second quarter non-interest income was lower year over year due to the recognition of revenues from a rise in the fair value of restructured notes in the second quarter of 2013. Non-interest income in three of the quarters in 2013 was down from the same periods in 2012 owing to the rise in the fair value of restructured notes in the second and fourth quarters of 2012 and to a gain on the disposal of a subsidiary in the second quarter of 2012.
Provisions for credit losses increased for most of the past eight quarters due to growth in personal and commercial loans and to corporate loan loss recoveries recorded in the first quarter of 2013.
Non-interest expenses were up for most of the past eight quarters mainly as a result of salary increases, technology investments, initiatives to promote banking services, and acquisitions. The increase in non-interest expenses was greater in the fourth quarter of 2014 compared with the same quarter last year, due to impairment losses on intangible assets, whereas, in the first quarter of 2014, the increase came from the lower pension plan and other post-employment benefit plan expense recorded in the same quarter of 2013. Lastly, non-interest expenses were lower in the second quarter of 2014 as a result of impairment losses on intangible assets in the second quarter of 2013. In the fourth quarter of 2013, non-interest expenses decreased from the same quarter in 2012 due to a lower severance pay volume in 2013.
Non-controlling interests were up for the past eight quarters of 2014 and 2013 due to growth in revenues from subsidiaries that are not wholly owned.
The income tax rate has remained stable over the past eight quarters, except for the third quarter of 2013, when the rate decreased considerably due to a reversal of provisions for income tax contingencies.
For additional information about the fourth quarter of 2014, visit the Bank’s website at nbc.ca or the SEDAR website at sedar.com to consult the Bank’s Press Release for the Fourth Quarter of 2014, published on December 5, 2014.

MANAGEMENT’S DISCUSSION AND ANALYSIS FINANCIAL ANALYSIS
40 National Bank of Canada 2014 Annual Report
Analysis of the Consolidated Balance Sheet
As at October 31, 2014, the Bank had total assets of $205.4 billion compared to $188.2 billion at year-end 2013, a 9% increase driven mainly by loan and acceptance growth of $8.9 billion, a $4.5 billion increase in cash and deposits with financial institutions, and a $3.1 billion increase in securities purchased under reverse repurchase agreements and securities borrowed (see the Consolidated Balance Sheets on page 108). Cash and Deposits With Financial Institutions At $8.1 billion as at October 31, 2014, cash and deposits with financial institutions rose $4.5 billion from the same date last year. This increase came mainly from the New York branch, which maintained higher liquidity. The Bank’s liquidity risk management practices are described on pages 82 to 89 of this MD&A. Securities As at October 31, 2014, securities totalled $53.0 billion (26% of total assets), down $0.7 billion from $53.7 billion as at October 31, 2013. Overall, the composition of securities remained relatively stable, despite a decrease in securities issued or guaranteed by Canadian governments or provinces that was offset by an increase in equity securities. Securities purchased under reverse repurchase agreements and securities borrowed totalled $24.5 billion as at October 31, 2014, a $3.1 billion increase since year-end 2013 that is related to activities in the Financial Markets segment. The Bank’s market risk management policies are described on pages 75 to 82 of this MD&A. Master Asset Vehicles (MAV) As at October 31, 2014, the face value of the restructured notes of the MAV conduits and of the other restructured notes held by the Bank was $1,479 million ($1,727 million as at October 31, 2013), of which $1,253 million was designated as Securities at fair value through profit or loss under the fair value option, and an amount of $226 million was classified in Available-for-sale securities ($1,506 million designated as Securities at fair value through profit or loss and $221 million classified in Available-for-sale securities as at October 31, 2013). The change in the face value of the restructured notes of the MAV conduits during the year ended October 31, 2014 was mainly due to capital repayments and disposals. During the year ended October 31, 2014, the Bank participated in two optional redemption unwind processes for restructured notes of the MAV II conduits and disposed of certain notes, classified in Securities at fair value through profit or loss, for a face value of $199 million. In exchange, the Bank received $183 million in cash and liquidation trust units and classified these units in Available-for-sale securities.
The carrying value of the restructured notes of the MAV conduits and of the other restructured notes held by the Bank in an investment portfolio as at October 31, 2014, designated as Securities at fair value through profit or loss, was $1,166 million, and $75 million was classified in Available-for-sale securities ($1,293 million designated as Securities at fair value through profit or loss and $68 million classified in Available-for-sale securities as at October 31, 2013). The notes held in an investment portfolio with one or more embedded derivatives were designated as Securities at fair value through profit or loss under the fair value option, and the other notes were classified in Available-for-sale securities. Establishing fair value In establishing the fair value of the restructured notes of the MAV conduits and excluding ineligible assets, the Bank considered the quality of the underlying assets. The Bank determined fair value using a valuation technique that incorporates discounted cash flows. The discount rate is based 80% on the CDX.IG index tranches and 20% on a basket of securities backed by assets such as credit card receivables, Residential Mortgage-Backed Securities (RMBS), Commercial Mortgage-Backed Securities (CMBS) and automobile loans. The fair valuation method also includes the effects of broker quotes and market conditions on the MAV II Class A-1, A-2, B and C notes. For the restructured notes of the MAV I and MAV II Class A-1, A-2 and B conduits, the adjustment related to broker quotes represented 30% in 2014 (30% in 2013) of the weighting used to determine fair value. For the restructured notes of the MAV I and MAV II Class C conduits, the adjustment related to broker quotes represented 100% in 2014 (30% in 2013) of the weighting used to determine fair value. The credit ratings and coupons were based on the terms set out in the restructured notes of the MAV conduits. Maturities are based on the anticipated cash flows of the underlying assets.
For ineligible assets, the fair value of the tracking notes is based on an analysis of the underlying assets of the notes and the market value of comparable instruments. For RMBS, fair values were based on the ABX index; for CMBS, CMBS indices, including the CMBX index, were chosen. As for derivative financial instruments, the Bank applied valuation models commonly used by market participants with inputs based on observable market factors such as the CDX.IG indices, base correlation and interest rates.
In establishing the fair value of the restructured notes, the Bank adjusts, as required, its liquidity assumption to reflect market conditions.
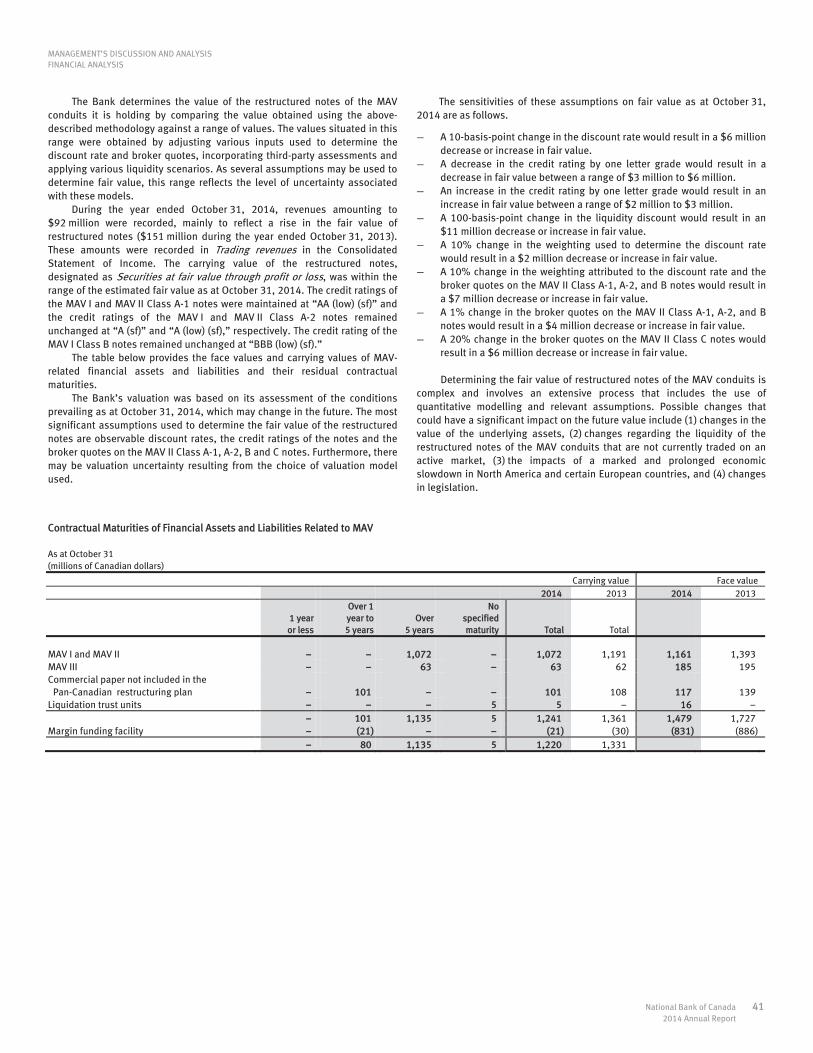
MANAGEMENT’S DISCUSSION AND ANALYSIS FINANCIAL ANALYSIS
National Bank of Canada 41 2014 Annual Report
The Bank determines the value of the restructured notes of the MAV conduits it is holding by comparing the value obtained using the above-described methodology against a range of values. The values situated in this range were obtained by adjusting various inputs used to determine the discount rate and broker quotes, incorporating third-party assessments and applying various liquidity scenarios. As several assumptions may be used to determine fair value, this range reflects the level of uncertainty associated with these models.
During the year ended October 31, 2014, revenues amounting to $92 million were recorded, mainly to reflect a rise in the fair value of restructured notes ($151 million during the year ended October 31, 2013). These amounts were recorded in Trading revenues in the Consolidated Statement of Income. The carrying value of the restructured notes, designated as Securities at fair value through profit or loss, was within the range of the estimated fair value as at October 31, 2014. The credit ratings of the MAV I and MAV II Class A-1 notes were maintained at “AA (low) (sf)” and the credit ratings of the MAV I and MAV II Class A-2 notes remained unchanged at “A (sf)” and “A (low) (sf),” respectively. The credit rating of the MAV I Class B notes remained unchanged at “BBB (low) (sf).”
The table below provides the face values and carrying values of MAV-related financial assets and liabilities and their residual contractual maturities.
The Bank’s valuation was based on its assessment of the conditions prevailing as at October 31, 2014, which may change in the future. The most significant assumptions used to determine the fair value of the restructured notes are observable discount rates, the credit ratings of the notes and the broker quotes on the MAV II Class A-1, A-2, B and C notes. Furthermore, there may be valuation uncertainty resulting from the choice of valuation model used.
The sensitivities of these assumptions on fair value as at October 31, 2014 are as follows.
— A 10-basis-point change in the discount rate would result in a $6 million decrease or increase in fair value.
— A decrease in the credit rating by one letter grade would result in a decrease in fair value between a range of $3 million to $6 million.
— An increase in the credit rating by one letter grade would result in an increase in fair value between a range of $2 million to $3 million.
— A 100-basis-point change in the liquidity discount would result in an $11 million decrease or increase in fair value.
— A 10% change in the weighting used to determine the discount rate would result in a $2 million decrease or increase in fair value.
— A 10% change in the weighting attributed to the discount rate and the broker quotes on the MAV II Class A-1, A-2, and B notes would result in a $7 million decrease or increase in fair value.
— A 1% change in the broker quotes on the MAV II Class A-1, A-2, and B notes would result in a $4 million decrease or increase in fair value.
— A 20% change in the broker quotes on the MAV II Class C notes would result in a $6 million decrease or increase in fair value. Determining the fair value of restructured notes of the MAV conduits is
complex and involves an extensive process that includes the use of quantitative modelling and relevant assumptions. Possible changes that could have a significant impact on the future value include (1) changes in the value of the underlying assets, (2) changes regarding the liquidity of the restructured notes of the MAV conduits that are not currently traded on an active market, (3) the impacts of a marked and prolonged economic slowdown in North America and certain European countries, and (4) changes in legislation.
Contractual Maturities of Financial Assets and Liabilities Related to MAV As at October 31 (millions of Canadian dollars)
Carrying value Face value 2014 2013 2014 2013
1 year or less
Over 1 year to 5 years
Over 5 years
No specified maturity Total Total
MAV I and MAV II 1,072 1,072 1,191 1,161 1,393 MAV III 63 63 62 185 195 Commercial paper not included in the Pan-Canadian restructuring plan 101 101 108 117 139 Liquidation trust units 5 5 16 101 1,135 5 1,241 1,361 1,479 1,727 Margin funding facility (21) (21) (30) (831) (886) 80 1,135 5 1,220 1,331

MANAGEMENT’S DISCUSSION AND ANALYSIS FINANCIAL ANALYSIS
42 National Bank of Canada 2014 Annual Report
Loans and Acceptances At $106.8 billion, loans and acceptances accounted for 52% of total assets as at October 31, 2014, up $8.9 billion or 9%.
Residential mortgage loans outstanding totalled $39.3 billion as at October 31, 2014, rising $2.7 billion or 7% since year-end 2013. This growth was driven by sustained demand for mortgage credit.
Personal loans and credit card receivables totalled $30.0 billion at year-end 2014, a $2.0 billion or 7% increase from $28.0 billion at year-end 2013 that is attributable to home equity lines of credit. At $2.0 billion, credit card receivables were unchanged from year-end 2013.
At $37.5 billion as at October 31, 2014, loans and acceptances to businesses and government increased 12% since year-end 2013, with loans to business outside Quebec rising 22% and loans to businesses within Quebec rising 10%. Customers’ liabilities under acceptances were stable, whereas this type of financing had increased significantly in 2013.
Table 9 (page 101) shows gross loans and acceptances by borrower category as at October 31, 2014. At $50.0 billion, residential mortgages (including home equity lines of credit) have posted strong growth since 2010 and account for 46.8% of total loans and acceptances. This growth was primarily driven by strong demand for mortgage credit in recent years. Retail loans amounted to $13.0 billion and, with respect to business loans, there was noteworthy growth in the manufacturing category, the construction and real estate category, and the wholesale and retail category from year-end 2013. Impaired Loans Gross impaired loans totalled $486 million as at October 31, 2014 versus $395 million as at October 31, 2013 (Table 10, page 102). Impaired loans were 7.1% of the tangible capital adjusted for allowances compared to 6.5% as at October 31, 2013. Impaired loans, net of individual and collective allowances, increased $65 million from a year ago, mainly attributable to the addition of a few loans in the Personal and Commercial segment.
A detailed description of the Bank’s credit risk management practices is provided on pages 67 to 74 of this MD&A as well as in Note 7 to the consolidated financial statements.
Other Assets As at October 31, 2014, other assets totalled $13.7 billion, up from year-end 2013. Other asset items consist of derivative financial instruments, amounts due from clients, dealers and brokers, investments in associates and joint ventures, premises and equipment, goodwill, intangible assets, and other items. The increase in other assets stems essentially from a $1.2 billion increase in the fair value of derivative financial instruments.
Deposit Liability At $119.9 billion as at October 31, 2014, deposits increased by $17.8 billion or 17% since year-end 2013. At $45.0 billion, personal deposits, as presented in Table 11 (page 103), increased $2.3 billion since October 31, 2013, accounting for 37.6% of all deposits. This increase was driven by Bank initiatives to grow this type of deposit and that favoured traditional savings accounts and the CashPerformer account. A summary of total personal savings is provided below.
As shown in Table 11, business and government deposits totalled $35.2 billion as at October 31, 2014, up $3.3 billion from the same date last year, as businesses increased their liquidity levels. Funding needs were met through the issuance of unsecured senior debt, which rose $9.7 billion since October 31, 2013. Deposits from deposit-taking institutions rose $0.6 billion from the same date last year. The Bank also issued 2.0 billion euros in covered bonds since October 31, 2013. Deposits from the United States and other countries have increased significantly in order to diversify sources of funding.
As at October 31, 2014, total personal savings amounted to $172.4 billion, up 9% from $157.5 billion as at October 31, 2013. The assets of NBF’s clients accounted for more than 60% of these savings, while 26% were made up of bank deposits. Overall, off-balance-sheet personal savings stood at $127.5 billion, up $12.6 billion or 11% since year-end 2013. Total Personal Savings As at October 31 (millions of Canadian dollars) 2014 2013 % change
Balance sheet Deposits 44,963 42,652 5 Off-balance-sheet Full-service brokerage 104,525 94,550 11 Mutual funds 18,938 16,633 14 Other 3,988 3,680 8 127,451 114,863 11 Total 172,414 157,515 9

MANAGEMENT’S DISCUSSION AND ANALYSIS FINANCIAL ANALYSIS
National Bank of Canada 43 2014 Annual Report
Other Liabilities Excluding acceptances, other liabilities stood at $64.2 billion as at October 31, 2014 and consisted of the following items: obligations related to securities sold short, obligations related to securities sold under repurchase agreements and securities loaned, derivative financial instruments, amounts due to clients, dealers and brokers, liabilities related to transferred receivables and other items. Other liabilities were relatively stable compared to last year, as a decrease in securities sold under repurchase agreements and securities loaned was offset by an increase in liabilities related to transferred receivables. Subordinated Debt and Other Contractual Obligations Subordinated debt decreased $545 million since October 31, 2013, mainly due to redemptions in fiscal 2014 of notes with a nominal value of $500 million maturing in November 2018 and debentures with a nominal value of US$25 million maturing in February 2087. Contractual Obligations (millions of Canadian dollars) As at October 31, 2014
1 year or less
Over 1 year to 2 years
Over 2 years to 5 years
Over 5 years Total
Long-term financing 5,125 4,554 6,578 1,935 18,192 Subordinated debt(1)(2) 350 500 1,000 8 1,858 Lease commitments and other contracts(3) 724 486 811 495 2,516
6,199 5,540 8,389 2,438 22,566
(1) At face value. (2) On October 30, 2014, the Bank announced its intention to redeem, on
December 22, 2014, $350 million of notes maturing in December 2019. (3) Most of these commitments are related to operating leases for premises, equipment and
property, outsourced IT service contracts and other contracts.
Equity As at October 31, 2014, the Bank’s equity was $10.5 billion, up $1.5 billion from $9.0 billion as at October 31, 2013. The increase in equity came mainly from net income attributable to the Bank’s shareholders, net of dividends, from a net preferred share issuance and from a $102 million issuance of common shares related to stock options exercised under the stock option plan. The Consolidated Statements of Changes in Equity on page 111 of this Annual Report presents the items of equity.
As at October 31, 2014, the Bank had 329.3 million common shares issued and outstanding compared to 326.0 million a year earlier, for an increase that stems mainly from an issuance of 2.9 million shares under the stock option plan. The Bank issued 14.0 million Series 30 preferred shares and 12.0 million Series 32 preferred shares on February 7, 2014 and October 9, 2014, respectively. The Bank also redeemed 2.4 million Series 24 preferred shares and 1.7 million Series 26 preferred shares on February 15, 2014. See Note 18 to the consolidated financial statements. An analysis of the Bank’s regulatory capital is presented in the Capital Management section of this MD&A. Shares and Stock Options As at October 31, 2014
Number of shares $ million
First Preferred Shares Series 16(1) 8,000,000 200 Series 20 6,900,000 173 Series 28 8,000,000 200 Series 30 14,000,000 350 Series 32 12,000,000 300 48,900,000 1,223 Common shares(2) 329,297,375 2,293 Stock options(2) 14,676,191
(1) On November 15, 2014, the Bank completed the redemption of all the issued and outstanding non-cumulative Series 16 First Preferred Shares. Pursuant to the share conditions, the redemption price was $25.00 per share plus the periodic dividend declared and unpaid. The Bank redeemed 8,000,000 Series 16 preferred shares for a total amount of $200 million that was paid on November 17, 2014, the first business day after the redemption date.
(2) As at November 28, 2014, there were 328,690,507 common shares and 14,658,469 stock options outstanding.

MANAGEMENT’S DISCUSSION AND ANALYSIS FINANCIAL ANALYSIS
44 National Bank of Canada 2014 Annual Report
Related Party Transactions In the normal course of business, the Bank provides various banking services and enters into contractual agreements and other transactions with associates, joint ventures, directors, key officers and other related parties. These agreements and transactions are entered into under conditions similar to those offered to non-related third parties.
Loans to eligible key officers are granted under the same conditions as those granted to any other employee of the Bank. The main conditions are as follows: the employee must meet the same credit requirements as a client; mortgage loans are granted at the posted rate less 2% limited to half of the posted rate; personal loans bear interest at the client rate divided by two; credit card advances bear interest at a prescribed fixed rate in accordance with Bank policy; and personal lines of credit bear interest at the Canadian prime rate less 3%, but never lower than Canadian prime divided by two.
For personal loans and personal lines of credit, employees may not borrow more than 50% of their annual gross base salary at the reduced rate. The Canadian prime rate is applied to the remainder.
In accordance with the Bank Act (Canada), the aggregate of loans granted to key officers of the Bank, excluding mortgage loans granted on their principal residence, cannot exceed twice the officer’s base salary.
Furthermore, the Bank offers a deferred stock unit plan to directors who are not Bank employees. For additional information, see Note 22 to the consolidated financial statements. Additional information on related parties is presented in Notes 9, 28 and 29 to the consolidated financial statements.
Acquisition
TD Waterhouse Institutional Services On November 12, 2013, through a subsidiary, the Bank completed the acquisition of Toronto-Dominion Bank’s institutional services known as TD Waterhouse Institutional Services. This acquisition marks another step in the Bank’s expansion of its wealth management platform across Canada. The final purchase price is $260 million. The net assets acquired include client list intangible assets totalling approximately $58 million. The purchase price exceeded the fair value of the net assets acquired by $206 million. This excess amount was recorded on the Consolidated Balance Sheet as goodwill and mainly represents synergies and the benefits expected from combining the acquired operations with those of the Bank. The tax deductible portion of the goodwill is $155 million. The acquired receivables, consisting mainly of loans to clients for the purchase of securities, had an acquisition-date fair value of $448 million. This amount also represents the gross contractual amounts receivable, which the Bank expects to fully recover.
An amount of $1 million in acquisition-related costs was included in Non-interest expenses in the Consolidated Statement of Income for the year ended October 31, 2014. These consolidated financial statements include the results of the acquired business as of November 12, 2013. During the year ended October 31, 2014, the acquired business contributed approximately $52 million to the Bank’s total revenues and $21 million to its net income (excluding integration costs). If the Bank had completed the acquisition on November 1, 2013, total revenues would have been approximately $5,466 million and net income approximately $1,539 million for the year ended October 31, 2014.
Events After the Consolidated Balance Sheet Date
Redemption of Subordinated Debt On October 30, 2014, the Bank announced its intention to redeem, on December 22, 2014, $350 million of notes maturing in December 2019. Redemption of Preferred Shares On November 15, 2014, the Bank completed the redemption of all the issued and outstanding non-cumulative Series 16 First Preferred Shares. Pursuant to the share conditions, the redemption price was $25.00 per share plus the periodic dividend declared and unpaid. The Bank redeemed 8,000,000 Series 16 preferred shares for a total amount of $200 million.

MANAGEMENT’S DISCUSSION AND ANALYSIS
National Bank of Canada 45 2014 Annual Report
SECURITIZATION AND OFF-BALANCE-SHEET ARRANGEMENTS In the normal course of business, the Bank is party to various financial arrangements that, under IFRS, are not required to be recorded on the Consolidated Balance Sheet or are recorded under amounts other than their notional or contractual values. These arrangements include, among others, transactions with structured entities, derivative financial instruments, the issuance of guarantees, the margin funding facility of the MAV conduits, credit instruments, and financial assets received as collateral.
Structured Entities The Bank uses structured entities, among other means, to diversify its funding sources and to offer services to clients, in particular to help them securitize their financial assets or provide them with investment opportunities. Under IFRS, a structured entity must be consolidated if the Bank controls the entity. Note 1 to the consolidated financial statements describes the accounting policy and criteria used for consolidating structured entities. Additional information on consolidated and non-consolidated structured entities is provided in Note 28 to the consolidated financial statements. Securitization of the Bank’s Financial Assets Mortgage loans The Bank participates in two Canada Mortgage and Housing Corporation (CMHC) securitization programs: the Mortgage-Backed Securities Program under the National Housing Act (Canada) (NHA) and the Canada Mortgage Bond (CMB) Program. Under the first program, the Bank issues NHA securities backed by insured residential mortgage loans and, under the second, the Bank sells NHA securities to Canada Housing Trust (CHT), which finances the purchase through the issuance of mortgage bonds insured by CMHC. Moreover, these mortgage bonds feature an interest rate swap agreement under which a CMHC-certified counterparty pays CHT the interest due to investors and receives the interest on the NHA securities. As at October 31, 2014, the outstanding amount of NHA securities issued by the Bank and sold to CHT was $15.1 billion. The mortgage loans sold consist of fixed- or variable-rate residential loans that are insured against potential losses by a loan insurer. In accordance with the NHA-MBS Program, the Bank advances the funds required to cover late payments and, if necessary, obtains reimbursement from the insurer that insured the loan. The NHA-MBS and CMB programs do not use liquidity guarantee arrangements. The Bank uses these securitization programs mainly to diversify its funding sources. In accordance with IFRS, because the Bank retains substantially all of the risks and rewards of ownership of the mortgage loans transferred to CHT, the derecognition criteria are not met. Therefore, the insured mortgage loans securitized under the CMB program continue to be recognized in Loans on the Bank’s Consolidated Balance Sheet and the liabilities for the considerations received from the transfer are recognized in Liabilities related to transferred receivables on the Consolidated Balance Sheet. For additional information, see Note 8 to the consolidated financial statements.
Credit card receivables In 1998, the Bank set up the Canadian Credit Card Trust (CCCT), a securitization program for its own credit card receivables. The Bank uses this entity for capital management and funding purposes. The Bank acts as the servicer of the receivables sold, maintaining its relationships with clients. Furthermore, it administers the securitization program and ensures that all related procedures are stringently followed and that investors are paid according to the provisions of the program. As at October 31, 2014, the credit card receivables portfolio that the Bank sold to CCCT (net of the Bank Certificate held by the Bank) represented an amount outstanding of $1.4 billion. CCCT issued investors’ certificates in the same amount, $1.3 billion of which is held by third parties and $0.1 billion is held by the Bank. New receivables are periodically sold to the structure on a revolving basis to replace the receivables reimbursed by clients. The different series of certificates are rated by DBRS and Standard & Poor’s. From this portfolio of sold receivables, the Bank retains the excess spread, i.e., the residual net interest income after all the expenses related to this structure have been paid, and thus provides first-loss protection. Furthermore, second-loss protection for issued series is provided by certificates subordinated to the senior notes (Series 2010-1, 2012-1, and 2013-1), representing 6.3% of the total amount of the series issued. The Bank controls CCCT and thus consolidates it.
Securitization of Third-Party Financial Assets The Bank administers multi-seller conduits that purchase financial assets from clients and finance those purchases by issuing commercial paper backed by the acquired assets. Clients use these multi-seller conduits to diversify their funding sources and reduce borrowing costs while continuing to service the financial assets and providing some amount of first-loss protection. Notes issued by the conduits and held by third parties provide additional credit loss protection. The Bank acts as a financial agent and provides administrative and transaction structuring services to these conduits. The Bank provides backstop liquidity and credit enhancement facilities under the commercial paper program. These facilities are presented and described in Notes 26 and 28 to the consolidated financial statements. The Bank has concluded derivative contracts with these conduits, the fair value of which is presented on the Bank’s Consolidated Balance Sheet. The Bank is not required to consolidate these conduits, as it does not control them.

MANAGEMENT’S DISCUSSION AND ANALYSIS SECURITIZATION AND OFF-BALANCE-SHEET ARRANGEMENTS
46 National Bank of Canada 2014 Annual Report
Derivative Financial Instruments
The Bank uses various types of derivative financial instruments to meet its clients’ needs, generate trading activity revenues and manage its exposure to foreign exchange, interest, and credit rate risk as well as other market risks. All derivative financial instruments are accounted for at fair value on the Consolidated Balance Sheet. Transactions in derivative financial instruments are expressed as notional amounts. These amounts are not presented as assets or liabilities on the Consolidated Balance Sheet. They represent the face amount of the contract to which a rate or price is applied to determine the amount of cash flows to be exchanged. Notes 1 and 16 to the consolidated financial statements provide additional information on the types of derivatives used by the Bank and their accounting basis.
Guarantees
In the normal course of business, the Bank enters into various guarantee contracts. The principal types of guarantees are letters of guarantee, backstop liquidity and credit enhancement facilities, certain securities lending activities, and certain indemnification agreements. Note 26 to the consolidated financial statements provides detailed information on these guarantees.
Margin Funding Facility of the MAV Conduits
The Bank has committed to contribute $831 million to a margin funding facility related to the MAV conduits in order to finance potential collateral calls. As at October 31, 2014 and 2013, no amount had been advanced by the Bank. Note 6 to the consolidated financial statements provides additional information.
Credit Instruments
In the normal course of business, the Bank enters into various off-balance-sheet credit commitments. The credit instruments used to meet the financing needs of its clients represent the maximum amount of additional credit that the Bank could be required to extend if the commitments were fully drawn. For additional information on these off-balance-sheet credit instruments and other items, see Note 26 to the consolidated financial statements.
Financial Assets Received as Collateral
In the normal course of business, the Bank receives financial assets as collateral as a result of transactions involving securities purchased under reverse repurchase agreements, securities borrowing and lending agreements, and derivative financial instrument transactions. For additional information regarding financial assets received as collateral, see Note 26 to the consolidated financial statements.

MANAGEMENT’S DISCUSSION AND ANALYSIS
National Bank of Canada 47 2014 Annual Report
ADDITIONAL FINANCIAL DISCLOSURE The Financial Stability Board (FSB) is an international financial group established at the London G20 Summit in April 2009 as a successor to the Financial Stability Forum (FSF) founded in 1999 at the initiative of the G7. It brings together 26 national financial authorities (central banks, finance ministries, etc.) as well as several international organizations and groups working to develop financial stability standards. Its objective is to promote cooperation in the oversight and monitoring of financial institutions.
In April 2008, the FSF published a report at the request of the G7 Finance Ministers and Central Bank Governors. OSFI then asked Canadian banks to apply certain recommendations set out in the report.
The recommendations seek to enhance the transparency and measurement of certain exposures, in particular structured entities, subprime and Alt-A exposures, collateralized debt obligations, residential and commercial mortgage-backed securities, and leveraged financing structures. The Bank does not market any specific mortgage financing program to subprime or Alt-A clients. Subprime loans are generally defined as loans granted to borrowers with a higher credit risk profile than prime borrowers, and the Bank does not grant this type of loan. Alt-A loans are granted to borrowers who cannot provide standard proof of income. The Bank’s Alt-A loan volume was $626 million as at October 31, 2014 ($661 million as at October 31, 2013). During the year ended October 31, 2014, the Bank acquired portfolios of residential mortgage loans with a higher credit risk profile for a total amount of $351 million ($328 million in 2013).
The Bank does not have any significant direct position in residential and commercial mortgage-backed securities that are not insured by the CMHC. Credit derivative positions are presented in the Supplementary Regulatory Capital Disclosure report, which is available on the Bank’s website at nbc.ca.
Leveraged financing structures are defined by the Bank as loans granted to large corporate and financial sponsor-backed companies that are typically non-investment grade with much higher levels of debt relative to other companies in the same industry. Leveraged finance is commonly employed to achieve a specific objective, for example, to make an acquisition, complete a buy-out or repurchase shares. Leveraged finance risk exposure takes the form of both funded and unfunded commitments. As at October 31, 2014, total commitments for this type of loan stood at $1,207 million ($865 million as at October 31, 2013). Details about other exposures are provided in the table concerning structured entities in Note 28 to the consolidated financial statements.
In May 2012, the FSB formed a working group, the Enhanced Disclosure Task Force (EDTF), that was mandated to develop principles for enhancing the risk disclosures of major banks, to recommend improvements to current risk disclosures, and to identify risk disclosure best practices used by major financial institutions. On October 29, 2012, the EDTF published a report entitled Enhancing the Risk Disclosures of Banks, which contains 32 recommendations. The Bank makes every effort to ensure overall compliance with those recommendations and is continuing to enhance its risk disclosures to meet the best practices on an ongoing basis. The risk disclosures required by the EDTF are provided in this Annual Report and in the documents entitled Supplementary Regulatory Capital Disclosure and Supplementary Financial Information, which are available on the Bank’s website at nbc.ca. In addition, on page 10 of this Annual Report is a table of contents that readers can use to locate information relative to the 32 recommendations.

MANAGEMENT’S DISCUSSION AND ANALYSIS
48 National Bank of Canada 2014 Annual Report
CRITICAL ACCOUNTING ESTIMATES A summary of the significant accounting policies used by the Bank is presented in Note 1 to the consolidated financial statements of this Annual Report. Some of these accounting policies are considered critical given their importance to the presentation of the Bank’s financial position and operating results and require subjective and complex judgments and estimates on matters that are inherently uncertain. Any change in these judgments and estimates could have a significant impact on the Bank’s consolidated financial statements. The critical accounting estimates are as follows.
Impairment of Financial Assets
At the end of each reporting period, the Bank determines whether there is objective evidence of impairment of a financial asset or group of financial assets. There is objective evidence of impairment when one or more loss events occur after the initial recognition of the asset and prior to or on the balance sheet date and these events adversely affect the estimated future cash flows of the financial assets in question. Management must use judgment to determine whether events or circumstances constitute objective evidence of impairment and to estimate the timing of future cash flows. Available-for-Sale Securities Available-for-sale securities are assessed at the end of each reporting period to determine whether there is objective evidence of impairment, which is an exercise that requires the use of judgment and estimates. For debt securities, the Bank considers all loss events, particularly a significant financial difficulty of the issuer, a breach of contract such as a default, bankruptcy or other financial reorganization. In the case of equity securities, the Bank considers all available objective evidence of impairment, including observable data or information about events relating specifically to the securities in question. A significant or prolonged decline in the fair value below its cost is also objective evidence of impairment.
If there is objective evidence of impairment, any amount previously recognized in Accumulated other comprehensive income is reclassified to Non-interest income in the Consolidated Statement of Income. This amount is determined as the difference between the acquisition cost (net of any capital repayments and amortization) and the current fair value of the asset less any impairment loss on that investment previously recognized in the Consolidated Statement of Income.
This accounting estimate has an impact, across all business segments, on Available-for-sale securities on the Consolidated Balance Sheet, on Other comprehensive income in the Consolidated Statement of Comprehensive Income, and on Non-interest income in the Consolidated Statement of Income.
Allowances for Credit Losses A loan, except credit card receivables, is considered impaired if there is objective evidence of impairment and, in management’s best estimate, the timely collection of principal and interest is no longer reasonably assured, or when a payment is contractually 90 days past due, unless the loan is fully secured and collection efforts are reasonably expected to result in repayment of the debt within 180 days. For credit card receivables, they are written off when payment is 180 days in arrears. Loans that are insured or fully guaranteed by a Canadian government (federal or provincial) or by a Canadian government agency are considered impaired when they are more than 365 days in arrears.
Allowances for credit losses are management’s best estimate of losses in its credit portfolio as at the balance sheet date. They relate primarily to loans but may also cover the credit risk associated with deposits with financial institutions, loan substitute securities, credit instruments such as acceptances, and off-balance-sheet items such as commitments to extend credit, letters of guarantee and letters of credit. Management reviews portfolio credit quality on an ongoing basis to ensure that the amount of the allowance for credit losses is adequate.
The allowances for credit losses on impaired loans are calculated on a loan-by-loan basis and assessed either individually or collectively based on the portfolio’s historical net loss experience. The allowance for credit losses on non-impaired loans is assessed collectively taking into account the Bank’s overall credit portfolio.
When assessing allowances for credit losses, management must use its judgment in establishing reasonable assumptions and subjective and critical estimates concerning the probability of default, probable losses in the event of default, the amount at risk in the event of default, the amount and dates of future cash flows, the value of the underlying collateral and realization costs. Any changes in these estimates and assumptions, as well as the use of different, but equally reasonable, estimates and assumptions, could have an impact on the allowances for credit losses and, consequently, on the provisions for credit losses for the year. A description of the methods used to calculate the allowances for credit losses can be found in Note 1 to the consolidated financial statements. All business segments are affected by this accounting estimate.
Fair Value of Financial Instruments When they are initially recognized, all financial assets and liabilities, including derivative financial instruments, are recorded at fair value on the Consolidated Balance Sheet. In subsequent periods, they are measured at fair value, except for items classified in the following categories, which are measured at amortized cost using the effective interest rate method: financial assets held to maturity, loans and receivables, and financial liabilities at amortized cost. The fair value of a financial instrument is the price that would be received to sell a financial asset or paid to transfer a financial liability in an orderly transaction in the principal market at the measurement date under current market conditions (i.e., an exit price).

MANAGEMENT’S DISCUSSION AND ANALYSIS CRITICAL ACCOUNTING ESTIMATES
National Bank of Canada 49 2014 Annual Report
Unadjusted quoted prices in active markets, based on bid prices for financial assets and offered prices for financial liabilities, provide the best evidence of fair value. A financial instrument is considered quoted in an active market when prices in exchange, dealer, broker or principal-to-principal markets are accessible at the measurement date. An active market is one where transactions occur with sufficient frequency and volume to provide quoted prices on an ongoing basis.
When there is no quoted price in an active market, the Bank uses another valuation technique that maximizes the use of relevant observable inputs and minimizes the use of unobservable inputs. The chosen valuation technique incorporates all the factors that market participants would take into account in pricing a transaction. Judgment is required in applying a large number of acceptable valuation techniques and estimates to determine fair value. The estimated fair value reflects market conditions on the valuation date and, consequently, may not be indicative of future fair value.
The best evidence of the fair value of a financial instrument at initial recognition is the transaction price, i.e., the fair value of the consideration received or paid. If there’s a difference between the fair value at initial recognition and the transaction price, and the fair value is determined using a valuation technique based on observable market inputs or, in the case of a derivative, if the risks are fully offset by other contracts entered into with third parties, the difference is recognized in the Consolidated Statement of Income. In other cases, the difference between the fair value at initial recognition and the transaction price is deferred on the Consolidated Balance Sheet. The amount of the deferred gain or loss is recognized over the term of the financial instrument. The unamortized balance is immediately recognized in net income when (i) observable market inputs can be obtained and support the fair value of the transaction, (ii) the risks associated with the initial contract are substantially offset by other contracts entered into with third parties, (iii) the gain or loss is realized through a cash receipt or payment, or (iv) the transaction matures or is cancelled before maturity.
In certain cases, measurement adjustments are recognized to address factors that market participants would use at the measurement date to determine fair value but that are not included in the measurement technique due to system limitations or uncertainty surrounding the measure. These factors include, but are not limited to, the unobservable nature of inputs used in the valuation model, assumptions about risk such as market risk, credit risk, or risk related to the valuation model and future administrative expenses. The Bank may also consider market liquidity risk when determining the fair value of financial instruments when it believes these instruments could be disposed of for a consideration below the fair value otherwise determined due to a lack of market liquidity or an insufficient volume of transactions in a given market.
IFRS establishes a fair value hierarchy that classifies the inputs used in financial instrument fair value measurement techniques according to three levels. The fair value hierarchy has the following levels.
— Level 1: Inputs corresponding to unadjusted quoted prices in active markets for identical assets and liabilities and accessible to the Bank at the measurement date. These instruments consist primarily of equity securities, derivative financial instruments traded in active markets, and certain highly liquid debt securities actively traded in over-the-counter markets.
— Level 2: Valuation techniques based on inputs, other than the quoted prices included in Level 1 inputs, that are directly or indirectly observable in the market for the asset or liability. These inputs are quoted prices of similar instruments in active markets; quoted prices for identical or similar instruments in markets that are not active; inputs other than quoted prices used in a valuation model that are observable for that instrument; and inputs that are derived principally from or corroborated by observable market inputs by correlation or other means. These instruments consist primarily of certain loans, certain deposits, derivative financial instruments traded in over-the-counter markets, certain investment grade debt securities, certain equity securities whose value is not directly observable in an active market, liabilities related to transferred receivables as well as certain other liabilities.
— Level 3: Valuation techniques based on one or more significant inputs that are not observable in the market for the asset or liability. The Bank classifies financial instruments in Level 3 when the valuation technique is based on at least one significant input that is not observable in the markets or when there is a lack of liquidity in certain markets. The valuation technique may also be partly based on observable market inputs. Financial instruments whose fair values are classified in Level 3 consist mainly of investments in the restructured notes of the MAV conduits, certain investments in asset-backed debt securities, investments in hedge funds, certain derivative financial instruments, private equity securities, certain loans and certain deposits (structured deposit notes).
Establishing fair value is an accounting estimate that has an impact on
Securities at fair value through profit or loss, certain Loans, Available-for-sale securities, Obligations related to securities sold short, Derivative financial instruments, and financial instruments designated at fair value through profit or loss on the Consolidated Balance Sheet. This estimate also has an impact on Interest income and Non-interest income in the Consolidated Statement of Income of the Financial Markets segment and of the Other heading. Lastly, this estimate has an impact on Other comprehensive income in the Consolidated Statement of Comprehensive Income. For additional information on the fair value determination of financial instruments, see Notes 3 and 6 to the consolidated financial statements.

MANAGEMENT’S DISCUSSION AND ANALYSIS CRITICAL ACCOUNTING ESTIMATES
50 National Bank of Canada 2014 Annual Report
Impairment of Non-Financial Assets Premises and equipment and intangible assets with finite useful lives are tested for impairment when events or changes in circumstances indicate that their carrying value may not be recoverable. At the end of each reporting period, the Bank determines whether there is an indication that premises and equipment or intangible assets with finite useful lives may be impaired. Goodwill and intangible assets that are not yet available for use or that have indefinite useful lives are tested for impairment annually or more frequently if there is an indication that the asset might be impaired.
An asset is tested for impairment by comparing its carrying amount with its recoverable amount. The recoverable amount must be estimated for the individual asset. Where it is not possible to estimate the recoverable amount of an individual asset, the recoverable amount of the cash-generating unit (CGU) to which the asset belongs will be determined. Goodwill is always tested for impairment at the level of a CGU or a group of CGUs. A CGU is the smallest identifiable group of assets that generates cash inflows that are largely independent of the cash inflows from other assets or groups of assets. The Bank uses judgment to identify CGUs.
An asset’s recoverable amount is the higher of fair value less costs to sell and the value in use of the asset or CGU. Value in use is the present value of expected future cash flows from the asset or CGU. The recoverable amount of the CGU is determined using valuation models that consider various factors such as projected future cash flows, discount rates and growth rates. The use of different estimates and assumptions in applying the impairment tests could have a significant impact on income. If the recoverable amount of an asset or a CGU is less than its carrying amount, the carrying amount is reduced to its recoverable amount and an impairment loss is recognized in Non-interest expenses in the Consolidated Statement of Income.
Management exercises judgment when determining whether there is objective evidence that premises and equipment or intangible assets with finite useful lives may be impaired. It also uses judgment in determining to which CGU or group of CGUs an asset or goodwill is to be allocated. Moreover, for impairment assessment purposes, management must make estimates and assumptions regarding the recoverable amount of non-financial assets, CGUs or a group of CGUs. For additional information on the estimates and assumptions used to calculate the recoverable amount of an asset or CGU, see Note 11 to the consolidated financial statements.
Any changes to these estimates and assumptions may have an impact on the recoverable amount of a non-financial asset and, consequently, on impairment testing results. These accounting estimates have an impact on Premises and equipment, Intangible assets and Goodwill reported on the Consolidated Balance Sheet. The aggregate impairment loss, if any, is recognized as a non-interest expense for the corresponding segment and presented in the Other item.
Employee Benefits – Pension Plans and Other Post-Employment Benefits
Pension plan and other post-employment plan expenses and obligations are actuarially determined using the projected benefit method prorated on service. The calculations incorporate management’s best estimates of various actuarial assumptions such as discount rates, rates of compensation increase, health care cost trend rates, mortality rates and retirement age. The discount rate assumption is determined using an interest rate curve that represents the yield for high-quality corporate bonds with terms nearing those of the Bank’s pension plan obligations.
Revaluations of these plans result in actuarial gains and losses related to the defined benefit obligation and the actual return on plan assets, excluding the net interest determined by applying the discount rate to the net asset or liability of the plans. Revaluations are immediately recognized in Other comprehensive income as items that will not be subsequently reclassified to net income and are recognized in Retained earnings.
The use of different assumptions could have a significant impact on the defined benefit asset (liability) presented in Other assets (Other liabilities) on the Consolidated Balance Sheet, on the pension plan and other post-employment benefit plan expenses presented in Compensation and employee benefits in the Consolidated Statement of Income, as well as on Revaluations of pension plans and other post-employment benefit plans presented in Other comprehensive income. All business segments are affected by this accounting estimate. For additional information, including the significant assumptions used to determine the Bank’s pension plan and other post-employment benefit plan expenses and the sensitivity analysis for significant plan assumptions, see Note 23 to the consolidated financial statements.

MANAGEMENT’S DISCUSSION AND ANALYSIS CRITICAL ACCOUNTING ESTIMATES
National Bank of Canada 51 2014 Annual Report
Income Taxes The Bank makes assumptions to estimate income taxes as well as deferred tax assets and liabilities. This process includes estimating the actual amount of income taxes payable and evaluating tax loss carryforwards and temporary differences arising from differences between the values of the items reported for accounting and for income tax purposes. Deferred tax assets and liabilities, presented in Other assets and Other liabilities on the Consolidated Balance Sheet, are calculated according to the tax rates to be applied in future periods. Previously recorded deferred tax assets and liabilities must be adjusted when the date of the future event is revised based on current information. The Bank periodically evaluates deferred tax assets to assess recoverability. In the Bank’s opinion, based on the information at its disposal, it is probable that all deferred tax assets will be realized prior to their expiration.
This accounting estimate affects Income taxes in the Consolidated Statement of Income for all business segments. For additional information on income taxes, see Notes 1 and 24 to the consolidated financial statements.
Litigation In the normal course of business, the Bank and its subsidiaries are involved in various claims relating, among other matters, to loan portfolios, investment portfolios and supplier agreements, including court proceedings, investigations or claims of a regulatory nature, class actions or other legal remedies of varied natures. Several of the court proceedings are related to lending activities, which generally occur, in particular, when the Bank takes steps to recover its claims. More specifically, the Bank is involved as a defendant in class actions instituted by consumers who contest, inter alia, certain transaction fees or who wish to avail themselves of certain legislative provisions relating to consumer protection.
On September 19, 2014, the Supreme Court of Canada issued a decision on Marcotte v. Bank of Montreal, et al., a class action seeking reimbursement of foreign currency transaction fees paid by credit cardholders from 2002 to 2008. The decision has granted a reimbursement of the fees collected by the Bank between April 17, 2000 and December 31, 2002 in addition to payment of $25.00 in punitive damages to each member, all amounts grossed-up by interest.
It is impossible to determine the outcome of the claims instituted or which may be instituted against the Bank and its subsidiaries. The Bank estimates, based on the information at its disposal, that while the amount of contingent liabilities pertaining to these claims, taken individually or in the aggregate, could have a material impact on the Bank’s consolidated operating income for a particular period, it would not have a material adverse impact on the Bank’s consolidated financial position.
Provisions are liabilities of uncertain timing and amount. A provision is recognized when the Bank has a present obligation (legal or constructive) arising from a past event, when it is probable that an outflow of economic resources will be required to settle the obligation and when the amount of the obligation can be reliably estimated. Provisions are based on the Bank’s best estimates of the economic resources required to settle the present obligation, given all relevant risks and uncertainties, and, when it is significant, the effect of the time value of money.
The recognition of a litigation provision requires the Bank’s management to assess the probability of loss and estimate any potential monetary impact. The Bank examines each litigation provision individually by considering the development of each case, its past experience in similar transactions and the opinion of its legal counsel. Each new piece of information can alter the Bank’s assessment as to the probability and estimated amount of the loss and the extent to which it adjusts the recorded provision. Moreover, the actual settlement cost of these litigations can be significantly higher or lower than the amounts recognized.
Structured Entities
In the normal course of business, the Bank enters into arrangements and transactions with structured entities. Structured entities are entities designed so that voting or similar rights are not the dominant factor in deciding who controls the entity, such as when voting rights relate solely to administrative tasks and the relevant activities are directed by means of contractual arrangements. A structured entity is consolidated when the Bank concludes, after evaluating the substance of the relationship and its right or exposure to variable returns, that it controls that entity. Management must exercise judgment in determining whether the Bank controls an entity. Additional information is provided in the Securitization and Off-Balance-Sheet Arrangements section of this MD&A (pages 45 and 46) and in Note 28 to the consolidated financial statements.

MANAGEMENT’S DISCUSSION AND ANALYSIS
52 National Bank of Canada 2014 Annual Report
ACCOUNTING POLICY CHANGES The International Accounting Standards Board (IASB) issues revisions and amendments to a number of standards, some of which have already had an impact on the Bank and others that could have an impact in the future. A summary of these amendments and the effective dates applicable to the Bank are presented below. According to OSFI, the Bank cannot early adopt these standards nor the amendments, except for certain IFRS 9 requirements related to recognizing changes in an entity’s own credit risk. Effective Date – November 1, 2013 As required by the IASB, on November 1, 2013, the Bank adopted the following new or amended accounting standards. IAS 19 – Employee Benefits In June 2011, the IASB issued an amended version of IAS 19, introducing significant changes to the accounting of employee benefits, primarily for defined benefit pension plans. The main changes to the revised standard are as follows.
— The expected return on plan assets is no longer used in calculating pension plan expense. The discount rate used to measure the accrued benefit obligation must also be used to measure the return on plan assets.
— Past service costs are recognized when a plan is amended, with no deferral over the vesting period.
— Additional annual disclosure is to be provided regarding the characteristics of defined benefit plans and the risks to which entities are exposed by participating in those plans. This disclosure information is provided in Note 23 to the consolidated financial statements.
— Revaluations are immediately recognized in Other comprehensive income. Revaluations can no longer be deferred. This last amendment has had no impact since the Bank had already been recognizing revaluations in Other comprehensive income.
The requirements of the amended version of IAS 19 have been applied retrospectively. The impacts on the Consolidated Balance Sheet as at October 31, 2013 are presented below. There is no impact on the Consolidated Balance Sheet as at November 1, 2012.
(millions of Canadian dollars) As at October 31, 2013
Consolidated Balance Sheet Increase in Other assets 15 Decrease in Other liabilities 6 Increase in Retained earnings 21
Retrospective adoption of the changes had the following impacts on the Consolidated Statement of Income and the Consolidated Statement of Comprehensive Income for the fiscal year ended October 31, 2013. (millions of Canadian dollars) Year ended October 31, 2013
Consolidated Statements of Income and
Comprehensive Income Increase in Compensation and employee benefits(1) 41 Decrease in Income taxes 11 Decrease in Net income 30 Increase in Other comprehensive income – Revaluations of pension plans and other post-employment benefit plans 51 Increase in Comprehensive income 21 Decrease in earnings per share(2) (dollars) Basic 0.09 Diluted 0.09
(1) This amount includes a $35 million decrease in past service costs, less a $6.0 million reduction recorded under the previous IAS 19, resulting from changes that had been made to provisions in the pension plans and other post-employment plans during the year ended October 31, 2013.
(2) Reflecting the stock dividend paid on February 13, 2014. See Note 18 to the consolidated financial statements.
IFRS 10 – Consolidated Financial Statements IFRS 10 replaces the consolidation guidance in IAS 27 – Consolidated and Separate Financial Statements and in interpretation SIC-12 – Consolidation – Special Purpose Entities, by establishing a single consolidation model based on control for all interests held in all types of entities (investees). According to IFRS 10, control is based on the concepts of decision-making authority regarding the investee’s relevant activities, exposure or rights to variable returns from its involvement with the investee, and the ability to exercise power to affect the amount of returns. An entity must consolidate the entities it controls and present consolidated financial statements.
The Bank retrospectively adopted IFRS 10, the impact of which was the deconsolidation of NBC Capital Trust (the Trust). Under IFRS 10, the Bank does not control the Trust because the Bank’s interest does not expose it to variable returns. The Bank’s earnings per share was not affected. The impacts of the deconsolidation were as follows.
— A $225 million increase in Deposits on the Consolidated Balance Sheet as at October 31, 2013 and as at November 1, 2012, representing the Trust’s deposit note.
— A $229 million decrease in Non-controlling interests on the Consolidated Balance Sheet as at October 31, 2013 and as at November 1, 2012, representing the trust units issued by the Trust.
— A $4 million increase in Other liabilities on the Consolidated Balance Sheet as at October 31, 2013 and as at November 1, 2012, representing accrued interest payable on the deposit note.
— A $12 million decrease in Net income and an equivalent decrease in Non-controlling interests in the Consolidated Statement of Income for the year ended October 31, 2013.

MANAGEMENT’S DISCUSSION AND ANALYSIS ACCOUNTING POLICY CHANGES
National Bank of Canada 53 2014 Annual Report
IFRS 7 – Financial Instruments: Disclosures The amendments to IFRS 7 require disclosure about legally enforceable rights of set-off for financial instruments under master netting agreements or similar arrangements. The Bank retrospectively adopted these amendments, which had no impact on its results or financial position since the standard only affects disclosures. The required IFRS 7 disclosure amendments are presented in Note 5 to the consolidated financial statements. IFRS 11 – Joint Arrangements IFRS 11 – Joint Arrangements replaces IAS 31 – Interests in Joint Ventures and SIC-13 – Jointly Controlled Entities – Non-Monetary Contributions by Venturers. Under IFRS 11, a joint arrangement is an arrangement in which two or more parties have joint control. Joint control means the contractually agreed sharing of control of an arrangement, which exists only when decisions about the relevant activities require the unanimous consent of the parties sharing control. Under IFRS 11, a joint arrangement must be classified as either a joint operation or a joint venture, depending on an assessment of the rights and obligations of the parties to the arrangement.
A joint operation is a joint arrangement wherein joint operators have rights to the assets and obligations for the liabilities. A joint operator shall account for the assets, liabilities, revenues and expenses relating to its interest in a joint operation in accordance with the IFRS standards applicable to the particular assets, liabilities, revenues and expenses. A joint venture is a joint arrangement wherein the joint venturers have rights to the net assets of the arrangement. A joint venturer accounts for its interest in a joint venture using the equity method.
The Bank retrospectively adopted IFRS 11 and concluded that the joint arrangements in which it has rights constitute joint ventures. Since these investments had already been accounted for using the equity method under IAS 31, there was no impact on the Bank’s consolidated financial statements. IFRS 12 – Disclosure of Interests in Other Entities IFRS 12 applies to entities that hold interests in subsidiaries, joint arrangements, associates and non-consolidated structured entities. It requires additional disclosure that enables financial statement users to assess the nature of, and risks associated with, an entity’s interests in other entities and the effects of those interests on the entity’s financial position, financial performance and cash flows. The Bank retrospectively adopted IFRS 12, and the required disclosures are presented in Notes 8, 9, 19, 26 and 28 to the consolidated financial statements. IFRS 13 – Fair Value Measurement IFRS 13 defines fair value, sets out in a single standard a framework for measuring fair value, and prescribes disclosure requirements for fair value measurements. Prospective adoption of this standard did not have a significant impact on the Bank’s consolidated financial statements. The additional annual disclosures are presented in Note 3 to the consolidated financial statements.
Effective Date – November 1, 2014 IAS 32 – Financial Instruments: Presentation IAS 32 was amended to clarify the requirements for offsetting financial assets and financial liabilities in order to reduce inconsistencies in current practice. Retrospective adoption of this interpretation will not have a significant impact on the Bank’s consolidated financial statements. IFRIC Interpretation 21 – Levies IFRIC Interpretation 21 provides guidance on when to recognize a liability to pay a levy imposed by a government that is accounted for in accordance with IAS 37 – Provisions, Contingent Liabilities and Contingent Assets. Retrospective adoption of this interpretation will not have a significant impact on the Bank’s consolidated financial statements. Effective Date – November 1, 2017 IFRS 15 – Revenue from Contracts with Customers In May 2014, the IASB issued a new standard, IFRS 15, which replaces the current revenue recognition standards and interpretations. IFRS 15 provides a single comprehensive model to use when accounting for revenue arising from contracts with customers. The new model applies to all contracts with customers except those that are within the scope of other IFRS standards such as leases, insurance contracts and financial instruments. IFRS 15 is to be applied retrospectively, and the Bank is currently assessing the impact of adopting this standard. Effective Date – November 1, 2018 IFRS 9 – Financial Instruments In July 2014, the IASB issued a complete and final version of IFRS 9, which replaces the current standard on financial instruments. IFRS 9 sets out requirements for the classification and measurement of financial assets and financial liabilities, for the impairment of financial assets, and for general hedge accounting. Macro hedge accounting has been decoupled from IFRS 9 and will be considered and issued as a separate standard. IFRS 9 provides a single model for financial asset classification and measurement that is based on contractual cash flow characteristics and on the business model for holding financial assets. With respect to measuring financial liabilities designated at fair value through profit or loss, the standard prescribes that fair value changes attributable to an entity’s own credit risk be accounted for in Other comprehensive income unless they offset amounts recognized in Net income. The IASB and OSFI are permitting early adoption of these new requirements for recognizing changes in an entity’s own credit risk.
IFRS 9 also introduces a new impairment model for financial assets not measured at fair value through profit or loss that requires recognition of expected credit losses rather than incurred losses as applied under the current standard. As for the new hedge accounting model, it provides better alignment of hedge accounting with risk management activities. However, the current hedge accounting requirements may continue to be applied until the IASB finalizes its macro hedge accounting project. In general, IFRS 9 is to be applied retrospectively, and the Bank is currently assessing the impact of adopting this standard.
MANAGEMENT’S DISCUSSION AND ANALYSIS
54 National Bank of Canada 2014 Annual Report
CAPITAL MANAGEMENT
Capital Management Framework
Capital management has a dual role of ensuring a competitive return to the Bank’s shareholders while maintaining a solid capital foundation that covers risks inherent to the Bank’s activity, supports its business segments and protects its clients. The Bank’s capital management policy sets out the principles and practices that the Bank incorporates into its capital management strategy and the basic criteria it adopts to ensure that it has sufficient capital at all times and is prudently managing such capital to satisfy any future capital requirements. Simulations are performed to ensure that the Bank has sufficient capital even in crisis situations. A capital plan sets operational targets, taking into account expected levels for risk-weighted assets, determined under the regulatory approach. Moreover, the capital plan presents the different strategies that are available to the Bank in order to maintain a cost effective capital structure. Those strategies may include the issuance and repurchase of shares or subordinated debt securities, the reallocation of either assets or capital, and the review of the dividend payout target or employee variable compensation. Internal Capital Adequacy Assessment Process (ICAAP) Internal capital (or, equivalently, economic capital) is a measure that determines the capital that the Bank requires in order to pursue its business operations and accommodate unexpected losses arising from extremely adverse economic and operational conditions. The Bank has implemented a rigorous internal capital adequacy assessment process that comprises the following procedures.
Conducting an overall risk assessment. Measuring significant risks and the capital requirements on the Bank’s financial budget for the next fiscal year and current and prospective risk profiles. Integrating stress tests across the organization and executing sensitivity analyses to determine the capital buffer above minimum regulatory levels (for additional information on enterprise-wide stress testing, refer to the Risk Management section of this MD&A). Aggregating capital and monitoring the reasonableness of internal capital compared with regulatory capital. Comparing projected internal capital with regulatory capital levels, internal operating targets, and competing banks. Attesting to the adequacy of the levels of capital at the Bank.
Assessing capital adequacy is an integral part of capital planning and strategy. The Capital Management team is, conjointly with its partners from Risk Management, Treasury and Finance, responsible for maintaining integrated control methods and processes so that an overall assessment of capital adequacy may be performed. The Bank’s internal capital adequacy assessment process demonstrates that it has a solid financial structure and sufficient capital to meet management’s assessment of capital requirements, both under normal market conditions and under a range of severe but plausible stress testing scenarios. This process is a key tool in establishing the Bank’s capital strategy and is subject to quarterly reviews and periodic amendments.
Risk-adjusted return on capital (RAROC) and shareholder value added (SVA), which are obtained from an assessment of required economic capital, are calculated quarterly for each of the Bank’s business segments. The results are then used to guide management in allocating capital among the different business segments.
Structure and Governance
The Board oversees the structure and development of the Bank’s capital management policy and ensures that the Bank maintains sufficient capital in accordance with regulatory requirements and in consideration of market conditions. The Board delegates certain responsibilities to the Risk Management Committee (RMC), which in turn recommends capital management policies and oversees their application. However, the Board, on the recommendation of the RMC, assumes the following responsibilities.
Reviewing and approving the capital management policy. Reviewing and approving the Bank’s risk tolerance, including the main capital and risk targets and the corresponding limits. Reviewing and approving the capital plan and strategy on an annual basis, including the Bank’s internal capital adequacy assessment process. Reviewing and approving the implementation of significant measures respecting capital, including contingency measures. Reviewing significant capital disclosures, including Basel capital adequacy ratios. Ensuring the appropriateness of the regulatory capital adequacy assessment. The Office of the President is responsible for defining the Bank’s
strategy and plays a key role in guiding measures and decisions regarding capital. The Asset/Liability Management Committee oversees capital management, which consists of reviewing the capital plan and strategy and implementing significant measures respecting capital, including contingency measures, and making recommendations with respect to these measures.

MANAGEMENT’S DISCUSSION AND ANALYSIS CAPITAL MANAGEMENT
National Bank of Canada 55 2014 Annual Report
Basel Accord and Regulatory Environment
The Basel Accord proposes a range of approaches of varying complexity, the choice of which determines, to a greater or lesser extent, the sensitivity of capital to risks. A less complex approach, such as the Standardized Approach, uses regulatory weightings, while a more complex approach uses the Bank’s internal estimates of risk components to establish risk-weighted assets and calculate regulatory capital.
As required under Basel, risk-weighted assets (RWA) are calculated for each credit risk, market risk, and operational risk. The Bank uses the Advanced Internal Rating-Based (AIRB) Approach for credit risk to determine minimum regulatory capital requirements for a majority of its portfolios. Certain portfolios that are considered to be less significant are risk-weighted for credit risk according to the Basel Standardized Approach. The simple risk-weighted method is used to calculate the expense related to available-for-sale securities in the form of equity securities. This method requires proactive management of the capital allocated to portfolios with equity securities since, beyond a certain investment threshold, the cost of regulatory capital becomes prohibitive. As for operational risk, the Bank uses the Standardized Approach. Market risk-weighted assets are primarily determined using the Internal Model-Based approach, but the Standardized Approach is used to assess interest-rate specific risk. Lastly, for externally-rated securitization exposures, the Bank uses the Rating-Based Approach (RBA). This approach assigns risk weights to exposures using external ratings. The Bank uses the ratings assigned by Moody’s Investors Service (Moody’s), Standard & Poor’s (S&P), Fitch Ratings (Fitch), DBRS or a combination of these ratings.
Capital ratios are calculated by dividing capital by risk-weighted assets. Credit, market and operational risks are factored into the risk-weighted assets calculation for regulatory purposes. Basel rules apply at the consolidated level of the Bank. Assets of non-consolidated entities for regulatory purposes are excluded from the risk-weighted assets calculation.
Not only are Canadian banks subject to regulatory capital ratio requirements, they are also subject to OSFI requirements to meet a financial leverage test. Leverage or the assets-to-capital multiple is calculated by dividing the Bank’s total assets, including certain off-balance-sheet items, by its total regulatory capital in accordance with the transitional requirements for Basel III. This ratio will be replaced by the new Basel III leverage ratio as of January 1, 2015. The Basel III leverage ratio is a measure independent of risk that is calculated by dividing the amount of Tier 1 capital by the sum of the on- and off-balance-sheet assets. Banks must meet a minimum requirement of 3.0%. Until the first quarter of 2018, however, this ratio remains subject to an observation period so that the Basel Committee on Banking and Supervision (BCBS) or OSFI can increase the minimum requirement if deemed necessary.
The definition adopted by the BCBS distinguishes between three types of capital. Common Equity Tier 1 (CET1) capital consists of common shareholders’ equity less goodwill, intangible assets and other capital deductions. The Additional Tier 1 instruments comprise eligible non-cumulative preferred shares and the eligible amount of innovative instruments. The sum of Common Equity Tier 1 and Additional Tier 1 capital form what is known as Tier 1 capital. Tier 2 capital consists of the eligible portion of subordinated debt and the eligible collective allowance for credit risk on non-impaired loans. Total regulatory capital is the sum of Tier 1 and Tier 2 capital.
In addition to those measures, OSFI now requires that regulatory capital instruments other than common equity have a non-viability contingent capital (NVCC) clause to ensure that investors bear losses before taxpayers should the government determine that it is in the public interest to rescue a non-viable financial institution. Instruments issued before January 1, 2013 that would be Basel III compliant if it were not for the absence of the NVCC clause are grandfathered and phased out over a period of ten years. The Bank expects to phase out all of its non-NVCC instruments without resorting to any regulatory event redemption.
The Basel III regulatory framework sets out transitional arrangements for the period of 2013 to 2019. OSFI has introduced two methodologies for determining capital. The “all-in” methodology includes all of the regulatory adjustments that will be required by 2019 while retaining the phase-out rules for non-qualifying capital instruments. The “transitional” methodology, which is in line with the BCBS guidelines, in addition to applying the phase-out rules for non-qualifying capital instruments, also applies a more flexible and steady phasing in of the required regulatory adjustments. The Bank will disclose its capital ratios calculated according to both methodologies for each quarter until the start of 2019. However, OSFI has been requiring Canadian banks to meet the 2019 minimum “all-in” requirements since the first quarter of 2013 for the CET1 ratio and since the first quarter of 2014 for the Tier 1 capital and total capital ratios.
Furthermore, to ensure an implementation similar to that in other countries, OSFI has decided to phase in the Credit Valuation Adjustment (CVA) charge over a period of five years beginning in 2014. In the first year, only 57%, 65% and 77% of total CVA were applied to the calculation of the CET1, Tier 1 and total capital ratios, respectively, and these percentages will gradually increase each year until they reach 100% by 2019. The percentages to be applied in 2015 will be 64%, 71% and 77%, respectively.

MANAGEMENT’S DISCUSSION AND ANALYSIS CAPITAL MANAGEMENT
56 National Bank of Canada 2014 Annual Report
Consequently, since the first quarter of 2013, the Bank has had to maintain a CET1 capital ratio of at least 7.0% and, since the first quarter of 2014, a Tier 1 capital ratio of 8.5% and total capital ratio of 10.5%, including the 2.5% capital conservation buffer for all ratios. In March 2013, OSFI designated Canada’s six largest banks, a group that includes National Bank, as Domestic Systemically Important Banks (D-SIBs). For these banks, a 1.0% surcharge will apply to their capital ratios as of January 1, 2016. Consequently, as of that date, the Bank and all other major Canadian banks will have to maintain a CET1 capital ratio of at least 8.0%, a Tier 1 capital ratio of at least 9.5% and a total capital ratio of at least 11.5%, all determined using the “all-in” methodology.
The following table provides a comparison of the transitional ratios established by the BCBS and those required by OSFI’s “all-in” methodology. All ratios include the capital conservation buffer and the D-SIB surcharge, when applicable.
The Bank ensures that its capital levels always exceed the minimum capital requirements established by OSFI’s “all-in” ratios. By maintaining a strong capital structure, the Bank can cover the risks inherent to its business activities, support its business segments and protect its clients. Recognizing the importance of having a strong capital position, the Bank’s objective is to achieve a 9.5% CET1 ratio and to maintain that level going forward.
Other disclosure requirements pursuant to Pillar 3 of the Basel Accord and a set of recommendations defined by the EDTF are presented in the Supplementary Regulatory Capital Disclosure report published quarterly and available on the Bank’s website at nbc.ca.
Furthermore, a complete list of capital instruments and their main features is also available on the Bank’s website under Investor Relations > Capital and Debt Information > Main Features of Regulatory Capital Instruments. Information about other disclosure requirements is provided in the Risk Management section of this MD&A and in Note 20 to the consolidated financial statements.
On August 1, 2014, Department of Finance Canada issued, for public comment, the Taxpayer Protection and Bank Recapitalization Regime: Consultation Paper, which outlines a proposed bail-in regime applicable to D-SIBs and that is in line with key international standards such as the FSB’s Key Attributes of Effective Resolution Regimes for Financial Institutions. This consultation paper follows an announcement made in the Government of Canada’s federal budget of March 21, 2013. Under the proposed regime, the Government of Canada would be granted two significant conversion powers with respect to the outstanding capital and debt of D-SIBs: (i) first, the government would be granted the power to permanently convert eligible liabilities of a D-SIB (“eligible liabilities” consisting solely of long-term senior debt, i.e., senior unsecured debt that is tradable and transferable with an original term of over 400 days such as senior debt securities) into common equity, and (ii) the Canadian government would be granted the power to permanently cancel the D-SIB’s outstanding shares. Each of those powers would be exercisable only if the following two preconditions were met: i) OSFI would need to have determined that the D-SIB has ceased or is about to cease being viable and ii) the full conversion of the D-SIB’s securities following the occurrence of a trigger event under NVCC provisions would need to have occurred. The proposed conversion power would apply only to eligible liabilities issued after the implementation of the regime with no retroactive application to existing debt. The implementation date of the regime has not yet been determined.
Requirements – Regulatory Capital Ratios 2014 2015 2016 2017 2018 2019 2020 2021
BCBS transitional ratios Capital conservation buffer 0.625 % 1.25 % 1.875 % 2.5 % 2.5 % 2.5 %
CET1 ratio 4.0 % 4.5 % 5.125 % 5.75 % 6.375 % 7.0 % 7.0 % 7.0 % Tier 1 ratio 5.5 % 6.0 % 6.625 % 7.25 % 7.875 % 8.5 % 8.5 % 8.5 % Total capital ratio 8.0 % 8.0 % 8.625 % 9.25 % 9.875 % 10.5 % 10.5 % 10.5 %
Phase-in of regulatory capital adjustments 20 % 40 % 60 % 80 % 100 % 100 % 100 % 100 % Phase-out of non-qualifying capital instruments 80 % 70 % 60 % 50 % 40 % 30 % 20 % 10 %
OSFI's “all-in” ratios Capital conservation buffer 2.5 % 2.5 % 2.5 % 2.5 % 2.5 % 2.5 % 2.5 % 2.5 % D-SIB surcharge 1.0 % 1.0 % 1.0 % 1.0 % 1.0 % 1.0 %
CET1 ratio 7.0 % 7.0 % 8.0 % 8.0 % 8.0 % 8.0 % 8.0 % 8.0 % Tier 1 ratio 8.5 % 8.5 % 9.5 % 9.5 % 9.5 % 9.5 % 9.5 % 9.5 % Total capital ratio 10.5 % 10.5 % 11.5 % 11.5 % 11.5 % 11.5 % 11.5 % 11.5 %
Phase-out of non-qualifying capital instruments 80 % 70 % 60 % 50 % 40 % 30 % 20 % 10 %
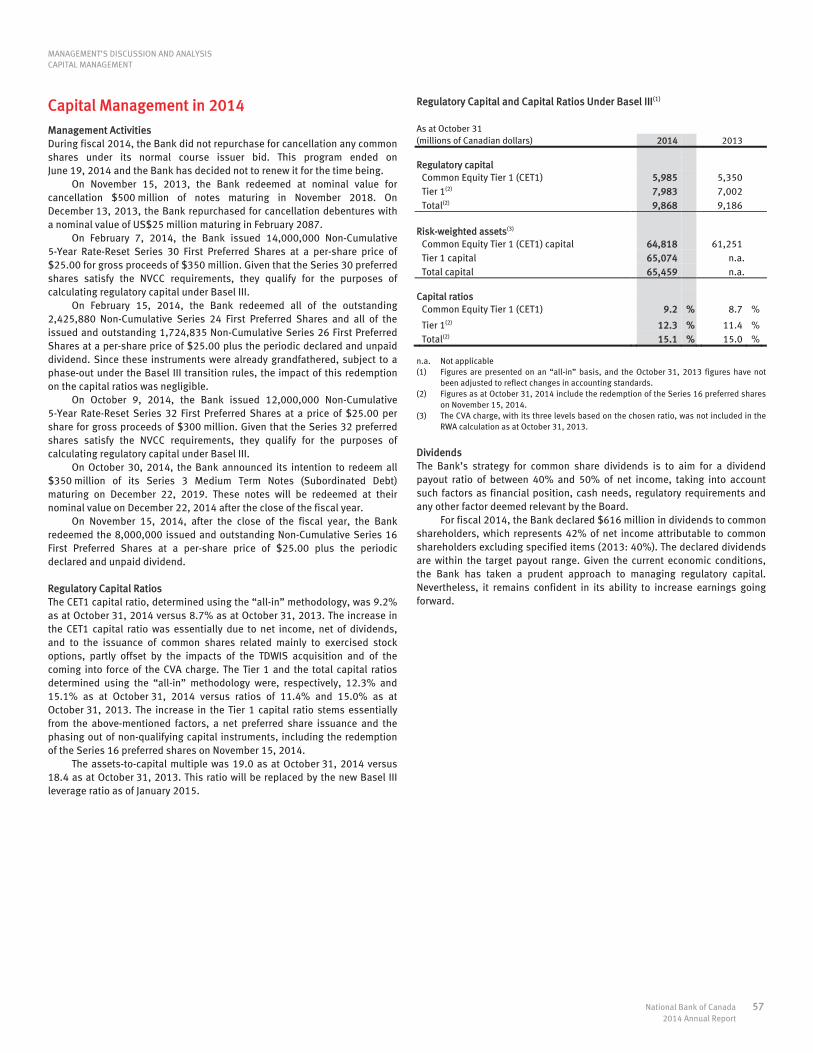
MANAGEMENT’S DISCUSSION AND ANALYSIS CAPITAL MANAGEMENT
National Bank of Canada 57 2014 Annual Report
Capital Management in 2014
Management Activities During fiscal 2014, the Bank did not repurchase for cancellation any common shares under its normal course issuer bid. This program ended on June 19, 2014 and the Bank has decided not to renew it for the time being.
On November 15, 2013, the Bank redeemed at nominal value for cancellation $500 million of notes maturing in November 2018. On December 13, 2013, the Bank repurchased for cancellation debentures with a nominal value of US$25 million maturing in February 2087.
On February 7, 2014, the Bank issued 14,000,000 Non-Cumulative 5-Year Rate-Reset Series 30 First Preferred Shares at a per-share price of $25.00 for gross proceeds of $350 million. Given that the Series 30 preferred shares satisfy the NVCC requirements, they qualify for the purposes of calculating regulatory capital under Basel III.
On February 15, 2014, the Bank redeemed all of the outstanding 2,425,880 Non-Cumulative Series 24 First Preferred Shares and all of the issued and outstanding 1,724,835 Non-Cumulative Series 26 First Preferred Shares at a per-share price of $25.00 plus the periodic declared and unpaid dividend. Since these instruments were already grandfathered, subject to a phase-out under the Basel III transition rules, the impact of this redemption on the capital ratios was negligible.
On October 9, 2014, the Bank issued 12,000,000 Non-Cumulative 5-Year Rate-Reset Series 32 First Preferred Shares at a price of $25.00 per share for gross proceeds of $300 million. Given that the Series 32 preferred shares satisfy the NVCC requirements, they qualify for the purposes of calculating regulatory capital under Basel III.
On October 30, 2014, the Bank announced its intention to redeem all $350 million of its Series 3 Medium Term Notes (Subordinated Debt) maturing on December 22, 2019. These notes will be redeemed at their nominal value on December 22, 2014 after the close of the fiscal year.
On November 15, 2014, after the close of the fiscal year, the Bank redeemed the 8,000,000 issued and outstanding Non-Cumulative Series 16 First Preferred Shares at a per-share price of $25.00 plus the periodic declared and unpaid dividend.
Regulatory Capital Ratios The CET1 capital ratio, determined using the “all-in” methodology, was 9.2% as at October 31, 2014 versus 8.7% as at October 31, 2013. The increase in the CET1 capital ratio was essentially due to net income, net of dividends, and to the issuance of common shares related mainly to exercised stock options, partly offset by the impacts of the TDWIS acquisition and of the coming into force of the CVA charge. The Tier 1 and the total capital ratios determined using the “all-in” methodology were, respectively, 12.3% and 15.1% as at October 31, 2014 versus ratios of 11.4% and 15.0% as at October 31, 2013. The increase in the Tier 1 capital ratio stems essentially from the above-mentioned factors, a net preferred share issuance and the phasing out of non-qualifying capital instruments, including the redemption of the Series 16 preferred shares on November 15, 2014.
The assets-to-capital multiple was 19.0 as at October 31, 2014 versus 18.4 as at October 31, 2013. This ratio will be replaced by the new Basel III leverage ratio as of January 2015.
Regulatory Capital and Capital Ratios Under Basel III(1) As at October 31 (millions of Canadian dollars) 2014 2013
Regulatory capital Common Equity Tier 1 (CET1) 5,985 5,350 Tier 1(2) 7,983 7,002 Total(2) 9,868 9,186
Risk-weighted assets(3) Common Equity Tier 1 (CET1) capital 64,818 61,251 Tier 1 capital 65,074 n.a. Total capital 65,459 n.a. Capital ratios Common Equity Tier 1 (CET1) 9.2 % 8.7 %
Tier 1(2) 12.3 % 11.4 % Total(2) 15.1 % 15.0 %
n.a. Not applicable (1) Figures are presented on an “all-in” basis, and the October 31, 2013 figures have not
been adjusted to reflect changes in accounting standards. (2) Figures as at October 31, 2014 include the redemption of the Series 16 preferred shares
on November 15, 2014. (3) The CVA charge, with its three levels based on the chosen ratio, was not included in the
RWA calculation as at October 31, 2013.
Dividends The Bank’s strategy for common share dividends is to aim for a dividend payout ratio of between 40% and 50% of net income, taking into account such factors as financial position, cash needs, regulatory requirements and any other factor deemed relevant by the Board.
For fiscal 2014, the Bank declared $616 million in dividends to common shareholders, which represents 42% of net income attributable to common shareholders excluding specified items (2013: 40%). The declared dividends are within the target payout range. Given the current economic conditions, the Bank has taken a prudent approach to managing regulatory capital. Nevertheless, it remains confident in its ability to increase earnings going forward.

MANAGEMENT’S DISCUSSION AND ANALYSIS CAPITAL MANAGEMENT
58 National Bank of Canada 2014 Annual Report
Movement in Regulatory Capital(1) Year ended October 31 (millions of Canadian dollars) 2014 2013
Common Equity Tier 1 (CET1) capital Balance at beginning 5,350 4,565 Issuance of common shares (including Stock Option Plan) 133 106 Repurchase of common shares Contributed surplus (6) Dividends on preferred and common shares (656) (592) Net income attributable to the Bank’s shareholders 1,469 1,449 Removal of own credit spread net of income taxes 12 2 Removal of reserves arising from property revaluation 26 (26) Other (73) (76) Movements in accumulated other comprehensive income Translation adjustments 3 6 Available-for-sale securities 72 8 Other (1) Change in goodwill and intangible assets (net of related tax liability) (394) (123) Other, including regulatory adjustments and transitional arrangements Change in defined benefit pension plan asset (net of related tax liability) (53) (5) Change in amount exceeding 15% threshold Deferred tax assets 37 20 Significant investment in common shares of financial institutions 47 30 Change in other regulatory adjustments(2) 18 (13) Balance at end 5,985 5,350 Additional Tier 1 capital Balance at beginning 1,652 1,737 New Tier 1 eligible capital issuances 650 Redeemed capital(3) (304) (285) Change in non-qualifying Additional Tier 1 subject to phase-out 200 Other, including regulatory adjustments and transitional arrangements Balance at end 1,998 1,652 Total Tier 1 capital 7,983 7,002 Tier 2 capital Balance at beginning 2,184 2,450 New Tier 2 eligible capital issuances Redeemed capital (531) Change in non-qualifying Tier 2 subject to phase-out 245 (238) Change in eligible collective allowances (13) (28) Other, including regulatory adjustments and transitional arrangements Balance at end 1,885 2,184 Total regulatory capital 9,868 9,186
(1) Figures are presented on a Basel III “all-in” basis, and the October 31, 2013 figures have not been adjusted to reflect changes in accounting standards. (2) Represents the change in investments in the Bank’s own CET1 and shortfall of total provisions to expected losses. (3) Figures for fiscal 2014 include the redemption of the Series 16 preferred shares on November 15, 2014.

MANAGEMENT’S DISCUSSION AND ANALYSIS CAPITAL MANAGEMENT
National Bank of Canada 59 2014 Annual Report
RWA by Key Risk Drivers
CET1 RWA increased by $3.5 billion to total $64.8 billion as at October 31, 2014 compared to $61.3 billion as at October 31, 2013. This increase was mainly due to the coming into force of the CVA charge and to organic growth. The Bank’s CET1 risk-weighted assets are presented in the following table. Capital Adequacy Under Basel III(1)
As at October 31 (millions of Canadian dollars) 2014 2013
Exposure at default
Risk-weighted assets
Capital requirement(2)
Risk-weighted assets
Standardized
Approach AIRB
Approach Other Total Total
Credit risk Retail Residential mortgages 40,850 71 4,548 4,619 370 4,565 Qualifying revolving retail 5,027 1,022 1,022 82 1,440 Other retail 12,280 538 4,504 5,042 403 5,625 Non-retail Corporate 49,666 2,452 20,982 23,434 1,875 22,174 Sovereign 23,609 529 529 42 418 Financial institutions 3,222 278 752 1,030 82 743 Banking book equities(3) 478 478 478 38 437 Securitization 4,145 2,173 2,173 174 2,269 Other assets 23,230 5,047 5,047 404 4,337 Counterparty credit risk Corporate 5,288 32 80 112 9 229 Sovereign 12,369 9 9 1 10 Financial institutions 53,751 1,827 1,827 146 2,425 Trading portfolio 9,981 205 3,070 3,275 262 2,524 Credit valuation adjustment charge(4) 1,828 1,828 146 Regulatory scaling factor 2,357 2,357 189 2,255
Total – Credit risk 243,896 5,404 42,331 5,047 52,782 4,223 49,451 Market risk VaR 860 860 69 775 Stressed VaR 1,218 1,218 97 1,109 Interest-rate-specific risk 1,239 1,239 99 1,498
Total – Market risk 1,239 2,078 3,317 265 3,382 Operational risk 8,719 8,719 698 8,418 Total 243,896 15,362 44,409 5,047 64,818 5,186 61,251
(1) Figures are presented on an “all-in” basis, and the October 31, 2013 figures have not been adjusted to reflect changes in accounting standards. (2) The capital requirement is equal to 8% of risk-weighted assets. (3) Calculated using the simple risk-weighted method. (4) Calculated based on CET1 risk-weighted assets.

MANAGEMENT’S DISCUSSION AND ANALYSIS CAPITAL MANAGEMENT
60 National Bank of Canada 2014 Annual Report
Risk-Weighted Assets Movement by Key Drivers(1) Quarter ended (millions of Canadian dollars) October 31, 2014 July 31, 2014 April 30, 2014 January 31, 2014 October 31, 2013
Total Total Total Total Total
Credit risk – Risk-weighted assets at beginning 52,586 51,844 52,030 49,451 49,257 Book size 975 1,082 (141) 1,209 412 Book quality (529) 297 (120) (697) 231 Model updates (433) (672) (536) Methodology and policy 1,625 Acquisitions and disposals Foreign exchange movements 183 35 75 442 87
Credit risk – Risk-weighted assets at end 52,782 52,586 51,844 52,030 49,451 Market risk – Risk-weighted assets at beginning 3,441 3,888 4,110 3,382 3,252 Movement in risk levels(2) (124) (447) (222) 728 130 Model updates Methodology and policy Acquisitions and disposals
Market risk – Risk-weighted assets at end 3,317 3,441 3,888 4,110 3,382 Operational risk – Risk-weighted assets at beginning 8,676 8,503 8,487 8,418 8,386 Movement in risk levels 43 173 16 69 32 Acquisitions and disposals
Operational risk – Risk-weighted assets at end 8,719 8,676 8,503 8,487 8,418
Risk-weighted assets at end 64,818 64,703 64,235 64,627 61,251
(1) Figures are presented on an “all-in” basis. (2) Also includes foreign exchange movement that is not considered material.
The table above provides the risk-weighted assets movements by key drivers underlying the different risk categories.
The “Book size” item reflects organic changes in exposure size and composition (including new loans and maturing loans). RWA movements attributable to book size include increases or decreases in exposures, measured by exposure at default, assuming a stable risk profile.
The “Book quality” item is the Bank’s best estimate of changes in book quality related to experience, such as underlying customer behaviour or demographics, including changes resulting from model recalibrations or realignments.
The “Model updates” item is used to reflect implementations of new models, changes in model scope, and any other change applied to address model malfunctions.
The “Methodology and policy” item presents the impact of changes in calculation methods resulting from changes in regulatory policies.
During fiscal 2014 and with OSFI approval, the Bank reviewed the
models that follow the AIRB approach for exposures related to residential mortgages and to retail term loans and credit lines and has adopted an AIRB approach model for exposures related to insurance companies. All of these changes have been included in credit risk under the “Model updates” item and reduced credit RWA by $1.1 billion. The change in the “Methodology and policy” item is a result of applying 57% of the fully implemented CVA charge to the CET1 calculation, as required by the OSFI transition guidance as of the first quarter of 2014.

MANAGEMENT’S DISCUSSION AND ANALYSIS
National Bank of Canada 61 2014 Annual Report
RISK MANAGEMENT
The Bank views risk as an integral part of its development and the diversification of its activities and advocates a risk management approach consistent with its business expansion strategy. The purpose of sound risk management is to provide reasonable assurance that incurred risks do not exceed acceptable thresholds and that risk-taking contributes to the creation of shareholder value. For the Bank, this means striking a healthy balance between return and risk.
The Bank is affected by risk in two ways. First, it exposes itself voluntarily to certain categories of risk, especially credit and market risk, in order to generate revenue. Second, it must assume risks that are inherent to its activities to which it does not choose to expose itself and that do not generate revenue, i.e., mainly operational risk. These risks may result in losses that could adversely affect expected earnings.
Top and Emerging Risks
Top and emerging risks represent risks that could have a material adverse effect on the Bank’s financial results, reputation or long-term business model and strategy. The processes aim at identifying and assessing these risks as early as possible to be able to carry out the appropriate mitigating strategies. The Bank’s top and emerging risks are as follows. Regulatory Reforms The banking industry is facing an increasing number of regulatory changes, the scope and intensity of which have been unprecedented. These changes include, among others, changes likely to result from the federal government’s review of certain components of Canada’s payment system, including governance, mobile payment, debit and credit cards and the regulatory framework. Moreover, commercial practices and the revenues of Canadian financial institutions, including the Bank, may be adversely affected by the Supreme Court of Canada’s recent decision that provincial legislation, including the Quebec Consumer Protection Act, may apply to certain practices of financial institutions. Achieving compliance with some of these reforms may require significant effort and could affect the way the Bank operates in its primary market and abroad. The Bank monitors regulatory developments and achieves compliance in a proactive fashion while seeking to mitigate any negative effects on its activities and profitability.
General Business and Economic Conditions Although the Bank operates primarily in Canada, it also has business operations in the United States and other countries. The economic and business conditions in these countries can therefore affect the Bank’s revenues. These conditions include the strength of the economy and inflation, the credit conditions of businesses, financial market and exchange rate fluctuations, monetary policy trends and interest rates. All of these factors affect the business and economic conditions in a given geographic region and, consequently, affect the Bank’s level of business activity and resulting earnings in that region. Although some risks may seem remotely related to the Bank’s business context, strong global economic and financial integration requires a vigilant approach.
In the current climate, the main global risks are geopolitical tensions, deflationary pressures in the eurozone, interest rate normalization, particularly in the United States, and an economic slowdown in emerging countries. Conscious of the potential adverse effects of a deterioration in the global, U.S. or Canadian economy on the Bank’s risk profile and profitability, the Bank is closely monitoring the situation and actively managing its operations to achieve its strategic objectives, mitigate risks and seize opportunities. See the Major Economic Trends section of this MD&A for additional information on the economy. Information System Disruptions and Security Breaches Technology has become a major part of the banking industry’s operations with the ever increasing use of information technologies such as mobile, wireless and web-enabled devices. Despite the Bank’s efforts to ensure system and information integrity, it may be unable to prevent or implement effective preventive measures against every potential cyber-threat, as the tactics used change frequently, come from a wide range of sources and are increasingly sophisticated.
Disruptions or malfunctions of the physical infrastructure or operating systems that support the Bank and its clients, or cyber-threats and security breaches affecting the networks, systems or tools that Bank clients use to access products and services, could cause client attrition, financial loss, inability of clients to do their banking, non-compliance with privacy legislation or any other laws in effect, fines, penalties or regulatory action, reputational damage, cost reimbursement or compensation, or any other compliance costs, all of which could affect the Bank’s operating results or financial position.
The Bank is closely monitoring its control environment and continues to enhance processes and practices used to ensure its continuous effectiveness and protection.
In this section of the MD&A, grey-shaded text and tables marked with an asterisk (*) are integral parts of the consolidated financial statements. They represent the Bank’s objectives, the risk management policies and procedures, and the methods applied to measure credit risk, market risk as well as liquidity and funding risk, as required by IFRS 7 – Financial Instruments: Disclosures.

MANAGEMENT’S DISCUSSION AND ANALYSIS RISK MANAGEMENT
62 National Bank of Canada 2014 Annual Report
Reliance on Technology and Third Parties The Bank depends on technology because many of its products and services require substantial data processing. The Bank’s technology platform must be able to manage all such data. Fast-paced technological change combined with competitive pressures require significant and sustained investment in technology. Unsuccessful implementation of technological improvements or new products or services could significantly affect the Bank’s ability to serve and retain its clients.
Third parties provide the essential components of the Bank’s commercial infrastructure, such as Internet connections and access to network and other communications services. The Bank is also party to outsourcing agreements for IT support and for cash management and processing. Interruptions in these services could adversely affect the Bank’s ability to provide products and services to its clients and conduct its business. To mitigate this risk, the Bank has a robust outsourcing risk management framework that includes business continuity plans that are tested periodically to ensure their effectiveness in times of crisis. Technological Innovation The Bank’s financial performance depends in part on its ability to develop and deploy new and innovative products and services, adopt and develop new technologies that help differentiate its products and services and generate savings, and market these new products and services at the right time and at competitive prices. Failure to properly review critical changes within the business before and during the implementation and deployment of key technological systems or failure to align client expectations with the Bank’s client commitments and operating capabilities could adversely affect the Bank’s operating results or financial position.
Interest Rate Normalization As a consequence of exceptional monetary measures taken by central banks combined with mild economic growth and low inflation, longer-term interest rates continue to be historically low in major advanced economies. Such a situation may have prompted market participants to adopt excessive risk-taking strategies in a quest for higher returns, the negative effects of which may be felt if interest rates return to normal faster than expected. Therefore, the Bank remains vigilant and continues to rely on its strong risk management framework to identify, assess and mitigate risk so that it remains within the risk appetite limits. Elevated Level of Canadian Household Debt and Housing Market Imbalances The elevated levels of household debt and property prices are still sources of risk for the Canadian economy. Some market segments continue to show signs of overheating, and a rapid normalization of interest rates could lead to a correction in the housing market and adverse economic conditions. Therefore, the Bank continues to monitor the evolution of the market and to remain vigilant in line with its risk tolerance policy. The credit quality of the portfolio remains solid, showing a low level of provisions for credit losses and a good business mix.

MANAGEMENT’S DISCUSSION AND ANALYSIS RISK MANAGEMENT
National Bank of Canada 63 2014 Annual Report
Risk Management Framework
Risk must be rigorously managed. That means it is identified, measured and controlled to ensure that the Bank’s operations yield an adequate return for the level of risk assumed. Managing risk requires a solid understanding of every type of risk found across the Bank. In addition to providing assurance that risk levels do not exceed acceptable thresholds, effective risk management can be used to control the volatility of the Bank's results.
Despite the exercise of stringent risk management and the mitigation measures in place, risk cannot be suppressed entirely, and the residual risks may occasionally cause significant losses. In the normal course of business, the Bank is primarily exposed to the risks listed below.
To achieve its risk management objectives, the Bank has a risk management framework that combines the following elements:
— risk management culture; — governance structure; — risk appetite framework; — risk management policies; — validation of risk models; — risk reports that ensure regular monitoring of the overall risk profile and
support risk awareness across the Bank; — a review of risk decisions by independent professionals; — capital allocation to the business units; — independent oversight by the Compliance Service; and — independent assessment by Internal Audit.
Risk Management Culture The Bank’s management continually promotes a risk management culture through its internal communications. An approach where business development initiatives are balanced with a constant focus on sound risk management is advocated. In particular, risk is taken into consideration when preparing the business plans of the segments, when analyzing strategic initiatives and when launching new products. In addition, all employees must take mandatory annual regulatory compliance training on the Bank’s code of ethics and anti-money laundering efforts. Risk management training is also offered across all the Bank’s segments.
Furthermore, to ensure the effectiveness of the risk management framework in place, the Bank has defined clear roles and responsibilities by reinforcing the concept of the three lines of defence. The Governance Structure section presented on the next pages sets out this concept and the roles and responsibilities of all levels of the organization.

MANAGEMENT’S DISCUSSION AND ANALYSIS RISK MANAGEMENT
64 National Bank of Canada 2014 Annual Report
The following guiding principles support a strong risk culture.
— Risk is everyone’s business: Business lines, risk management and oversight functions as well as internal audit play an important role in ensuring an effective and robust risk management framework is in place.
— Client-centric: Having quality information is key to understanding our clients, effectively managing risk and delivering excellent client service.
— Enterprise-wide: An integrated view of risk is the basis for sound risk management and decision-making by management.
— Human capital: The Bank’s employees are engaged, experienced and have a high level of expertise. Their curiosity supports continuous development and their rigour promotes a sound risk culture across the organization.
— Fact-based: Good risk management relies heavily on common sense and judgment and on advanced systems and models.
Risk Appetite and Reporting Risk-taking is intrinsic to a financial institution’s business. Business unit strategies have always—implicitly or explicitly—incorporated decisions regarding the amount of risk they are willing to assume. Risk appetite represents how much risk an organization is willing to assume consistent with its strategy. The Bank cultivates a risk management culture that is aligned with its risk appetite, doing so by setting risk tolerance thresholds that determine its risk-taking capacity.
The Bank’s risk appetite framework consists of principles, statements, metrics as well as targets and is reinforced by policies and limits. It is defined both quantitatively and qualitatively and requires:
— a target risk rating of at least A or equivalent; — a risk-reward balance; — a stable risk profile; — a strategic level of concentration aligned with approved targets; — a strong capital position; — a strong liquidity position; and — a low tolerance to operational, regulatory and reputation risks.
The Bank’s management and business units are involved in the process
for setting the risk appetite and are responsible for adequately monitoring the chosen key risk indicators. These needs are assessed by means of the enterprise strategic planning process. The opposite chart shows that this process is continuous and iterative. The risk indicators are reported on a regular basis to ensure an effective alignment of the Bank’s risk profile to its risk appetite; otherwise, appropriate actions could be taken.
Enterprise-Wide Stress Testing As part of a more extensive process aimed at ensuring that the Bank maintains adequate levels of capital, commensurate with its business strategy and risk appetite, an enterprise-wide stress testing program is in place at the Bank. Stress testing can be defined as a risk management method that assesses the potential effects—on the Bank’s financial position, capital and liquidity—of a series of specified changes in risk factors, corresponding to exceptional but plausible events. The program supports management’s decision-making process by identifying potential vulnerabilities for the Bank as a whole that are considered in setting limits as well as in longer term business planning. The scenarios and stress test results are reviewed by a stress testing oversight group and the Global Risk Committee and are approved by the Board. For additional information, see the Stress Testing and Crisis Scenarios headings of the credit, market and liquidity risk sections.
– Business plan– Profitability / RAROC– Target markets / segments– Acquisitions / growth– Dividend payout– Share buy-back
– Risk appetite– Limits– Stress tests
– Corporate financial plan– Balance sheet management– Capital, liquidity planning
and funding management
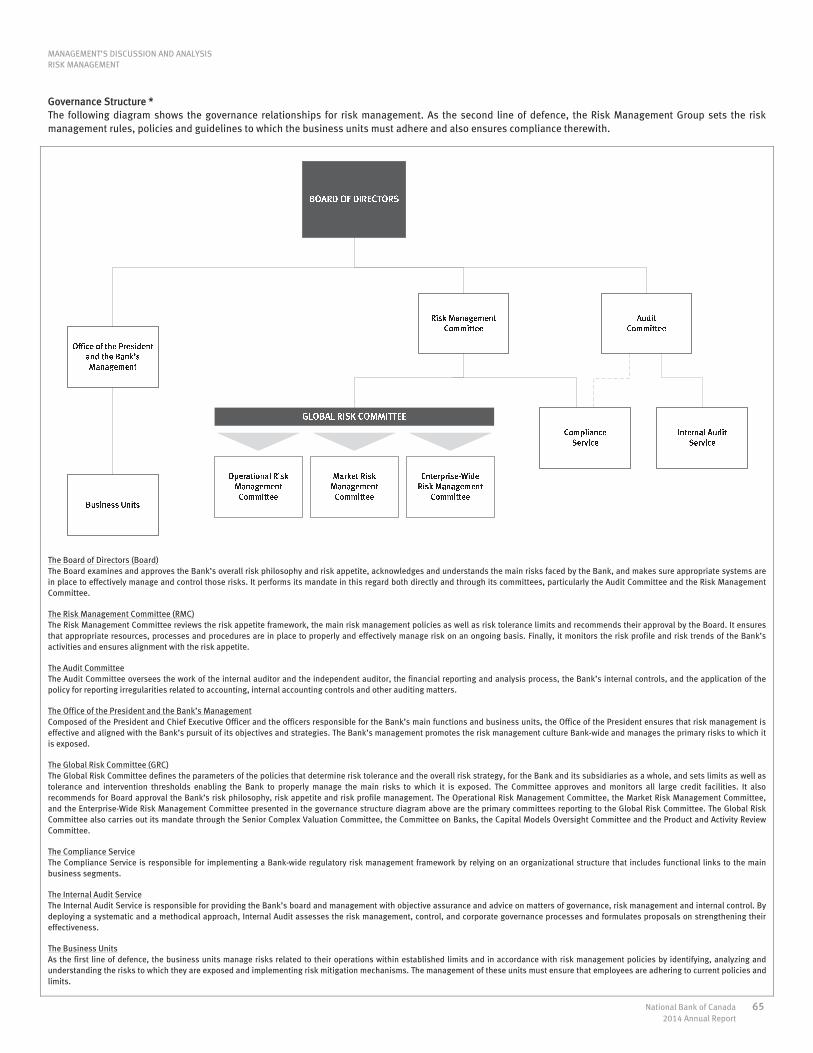
MANAGEMENT’S DISCUSSION AND ANALYSIS RISK MANAGEMENT
National Bank of Canada 65 2014 Annual Report
Governance Structure * The following diagram shows the governance relationships for risk management. As the second line of defence, the Risk Management Group sets the risk management rules, policies and guidelines to which the business units must adhere and also ensures compliance therewith.
The Board of Directors (Board) The Board examines and approves the Bank’s overall risk philosophy and risk appetite, acknowledges and understands the main risks faced by the Bank, and makes sure appropriate systems are in place to effectively manage and control those risks. It performs its mandate in this regard both directly and through its committees, particularly the Audit Committee and the Risk Management Committee. The Risk Management Committee (RMC) The Risk Management Committee reviews the risk appetite framework, the main risk management policies as well as risk tolerance limits and recommends their approval by the Board. It ensures that appropriate resources, processes and procedures are in place to properly and effectively manage risk on an ongoing basis. Finally, it monitors the risk profile and risk trends of the Bank’s activities and ensures alignment with the risk appetite. The Audit Committee The Audit Committee oversees the work of the internal auditor and the independent auditor, the financial reporting and analysis process, the Bank’s internal controls, and the application of the policy for reporting irregularities related to accounting, internal accounting controls and other auditing matters. The Office of the President and the Bank’s Management Composed of the President and Chief Executive Officer and the officers responsible for the Bank’s main functions and business units, the Office of the President ensures that risk management is effective and aligned with the Bank’s pursuit of its objectives and strategies. The Bank’s management promotes the risk management culture Bank-wide and manages the primary risks to which it is exposed. The Global Risk Committee (GRC) The Global Risk Committee defines the parameters of the policies that determine risk tolerance and the overall risk strategy, for the Bank and its subsidiaries as a whole, and sets limits as well as tolerance and intervention thresholds enabling the Bank to properly manage the main risks to which it is exposed. The Committee approves and monitors all large credit facilities. It also recommends for Board approval the Bank’s risk philosophy, risk appetite and risk profile management. The Operational Risk Management Committee, the Market Risk Management Committee, and the Enterprise-Wide Risk Management Committee presented in the governance structure diagram above are the primary committees reporting to the Global Risk Committee. The Global Risk Committee also carries out its mandate through the Senior Complex Valuation Committee, the Committee on Banks, the Capital Models Oversight Committee and the Product and Activity Review Committee. The Compliance Service The Compliance Service is responsible for implementing a Bank-wide regulatory risk management framework by relying on an organizational structure that includes functional links to the main business segments. The Internal Audit Service The Internal Audit Service is responsible for providing the Bank’s board and management with objective assurance and advice on matters of governance, risk management and internal control. By deploying a systematic and a methodical approach, Internal Audit assesses the risk management, control, and corporate governance processes and formulates proposals on strengthening their effectiveness. The Business Units As the first line of defence, the business units manage risks related to their operations within established limits and in accordance with risk management policies by identifying, analyzing and understanding the risks to which they are exposed and implementing risk mitigation mechanisms. The management of these units must ensure that employees are adhering to current policies and limits.

MANAGEMENT’S DISCUSSION AND ANALYSIS RISK MANAGEMENT
66 National Bank of Canada 2014 Annual Report
Risk Management Policies Risk management policies and the related standards and procedures are the essential elements of the risk management framework. They define and describe the main activity-related risks, specify the requirements that the business units must meet in assessing and managing risk, stipulate the authorization process for risk taking and set the risk limits to be adhered to. These policies cover all the main risks in the Bank and are reviewed on a regular basis to ensure that they are still relevant given changes in the markets and the business plans of the Bank’s business units. Other policies, standards and procedures complement the main policies and cover more specific aspects of risk management, such as business continuity, the launch of new products, initiatives or activities, or financial instrument measurement. These policies, standards and procedures apply across the Bank and its subsidiaries. Risk Models Governance and Vetting Framework In most cases, exposure to significant risks such as credit risk and market risk is assessed through the use of models. The two key components of the Bank’s model vetting governance framework are the Model Risk Management Policy and the model vetting group. The policy sets the rules and standards applicable to both the model development and the model vetting groups. The scope of models covered is wide, from the market risk pricing models and automated credit decision-making models to the business risk capital model, including models used for regulatory capital and stressed capital purposes.
The Bank makes increasing use of models to guide enterprise-wide risk management, financial markets strategy, economic and regulatory capital allocation, global credit risk management, wealth management and profitability measures. Models have in fact become a standard in risk management. This stresses the growing importance of “model risk” for banks, hence the implementation of a rigorous policy and sound model vetting processes to ensure models can be used appropriately and efficiently to manage risks.
Among the key features of the Bank’s policy is the general principle that all models that are deemed important for the Bank or that are used for regulatory capital purposes require independent vetting. To that effect, all models used by the Bank are classified in terms of their risk level (low, medium or high). Based on that assessment, the Bank applies strict guidelines with respect to model review requirements and the minimum frequency of such reviews. The Bank believes that the best defence against “model risk” is the implementation of a robust development and validation framework. Independent Oversight by the Compliance Service Compliance is an independent function within the Bank, and its senior vice-president has direct access to the Chair of the RMC, the Chair of the Audit Committee and to the President and Chief Executive Officer. The Compliance team can communicate directly with officers and directors of the Bank and its subsidiaries, obtain unrestricted access to files, reports, records and data, and require employees of the Bank and of its subsidiaries to provide the information deemed necessary for effective oversight.
Business unit managers must oversee the implementation of mechanisms for the daily control of regulatory risks arising from the operations under their responsibility. Compliance exercises independent oversight to assist managers in managing these risks effectively and to obtain reasonable assurance that the Bank is compliant with regulatory requirements.
The control framework covers the following.
— Identification, evaluation, communication, maintenance and updating of regulatory requirements.
— Information gathering and monitoring of regulatory changes. — Identification of the business units affected by these requirements. — Documentation of compliance and regulatory requirement controls
applicable to daily operations, including monitoring procedures, remedial action plans and periodic reports produced by the business units.
— Continuous training for all employees. — Information exchange between the business segments, business units
and Compliance. — Independent oversight of the application of policies and procedures in
effect. — Quarterly reporting to the RMC on the main results of compliance
oversight. — Annual certification process. Independent Assessment by Internal Audit Internal Audit is an independent objective function within the Bank. It provides assurance as to the Bank’s level of proficiency over its activities, advises on how to improve those activities and contributes to the creation of added value. It helps the Bank accomplish its objectives by applying a systematic, methodical approach for assessing and improving the effectiveness of risk management, control and governance processes. Internal Audit is mandated to provide the Board, through the Audit Committee, and the Office of the President with an evaluation in that respect.
The Senior Vice-President of Internal Audit reports to the Chair of the Audit Committee and may, at any time, call an unscheduled Audit Committee meeting. His independence is also ensured through a direct line of communication with the President and Chief Executive Officer.
As Internal Audit is not mandated to institute internal control mechanisms but rather to evaluate their effectiveness, it has no direct responsibility or authority over the activities it reviews. Whenever recommendations are issued, Internal Audit is mandated to independently evaluate the appropriateness of the measures taken by the managers to resolve the issues.
Internal Audit has unrestricted access to all business segments, corporate units and subsidiaries of the Bank.
Strategic Risk Management
Strategic risk is the risk of a loss arising from inappropriate strategic orientations, improper execution or ineffective response to economic or financial changes. The corporate strategic plan is developed by the Office of the President, in alignment with the Bank’s overall risk appetite, and approved by the Board. Once approved, the initiatives of the strategic plan are monitored regularly to ensure that they are progressing according to plan. If not, strategies could be reviewed or adjusted if deemed appropriate. Additionally, significant acquisitions are analyzed through a due diligence process that ensures they are in line with the corporate strategic plan and the Bank’s risk appetite.

MANAGEMENT’S DISCUSSION AND ANALYSIS RISK MANAGEMENT
National Bank of Canada 67 2014 Annual Report
Credit Risk Management Credit risk is the risk of a financial loss if an obligor does not fully honour its contractual commitments to the Bank. Obligors may be borrowers, issuers, counterparties or guarantors. Credit risk is the most significant risk facing the Bank in the normal course of business. The Bank is exposed to credit risk not only through its direct lending activities and transactions but also through commitments to extend credit, letters of guarantee, letters of credit, over-the-counter derivatives trading, available-for-sale debt securities, securities purchased under reverse repurchase agreements, deposits with financial institutions, brokerage activities, and transactions carrying a settlement risk for the Bank such as irrevocable fund transfers to third parties via electronic payment systems. Governance A policy framework centralizes the governance of activities that generate credit risk for the Bank and is supplemented by a series of subordinate internal or sectoral policies and guidelines on specific management issues such as credit limits, collateral requirements and risk quantification or issues that provide more thorough guidance for given business segments.
For example, the institutional activities of the Bank and its subsidiaries on financial markets and international commercial transactions are governed by business unit directives that set out standards adapted to the specific environment of these activities. This also applies to retail brokerage subsidiaries. In isolated cases, a business unit or subsidiary may have its own credit policy, and that policy must always fall within the spirit of the Bank’s policy framework and be reviewed and approved by the management of the Risk Management Group. The Risk Management Group defines the scope of the universe of subsidiaries carrying significant credit risks and the magnitude of the risks incurred.
Credit risk is controlled through a rigorous process that comprises the following elements:
— credit application; — risk and rating assessment; — assessment of capital at risk; — credit granting and approval process; — risk mitigation; — account monitoring and recovery; and — identification of impaired loans and provisioning for credit losses. Credit Risk Assessment Before a sound and prudent credit decision can be taken, the credit risk represented by the borrower or counterparty must be accurately assessed. This is the first step in processing credit applications. Each application is analyzed and assigned one of 19 grades on a scale of 1 to 10 using a credit rating system developed by the Bank for all portfolios exposed to credit risk. As each grade corresponds to a borrower’s, counterparty’s or third party’s probability of default, the Bank can determine the credit risk. The credit risk assessment method varies according to portfolio type.
The main parameters used to measure the credit risk of loans outstanding and undrawn amounts are as follows.
— Probability of default (PD), which is the probability that the obligor will default within one year.
— Loss given default (LGD), which represents the magnitude of the expected loss from the obligor's default, expressed as a percentage of exposure at default (EAD).
— EAD, which is the estimated amount potentially drawn at the time of the obligor's default.
The methodology as well as the data and the downturn periods used to estimate the LGD are as follows.

MANAGEMENT’S DISCUSSION AND ANALYSIS RISK MANAGEMENT
68 National Bank of Canada 2014 Annual Report
The amounts shown in the following tables represent the Bank’s maximum exposure to credit risk as at the financial reporting date without taking into account any collateral held or any other credit enhancements. These amounts do not take into account allowances for credit losses nor amounts pledged as collateral. The tables also exclude equity securities. Maximum Credit Risk Exposure Under the Basel Asset Categories * (millions of Canadian dollars) As at October 31, 2014
Drawn Undrawn
commitments Repo-style
transactions(1) OTC
derivatives
Other off-balance-
sheet items(2) Total
Retail Residential mortgage 35,511 5,339 40,850 Qualifying revolving retail 2,671 2,356 5,027 Other retail 11,061 1,205 14 12,280 49,243 8,900 14 58,157 Non-retail Corporate 34,070 13,141 5,282 5 2,456 54,954 Sovereign 20,429 3,080 12,187 182 100 35,978 Financial institutions 2,350 248 53,235 516 624 56,973 56,849 16,469 70,704 703 3,180 147,905 Trading portfolio 9,981 9,981 Securitization 1,190 2,955 4,145 Total – Gross Credit Risk 107,282 25,369 70,704 10,684 6,149 220,188 Standardized Approach 6,228 284 2,468 509 599 10,088 AIRB Approach 101,054 25,085 68,236 10,175 5,550 210,100 Total – Gross Credit Risk 107,282 25,369 70,704 10,684 6,149 220,188
(millions of Canadian dollars) As at October 31, 2013
Drawn Undrawn
commitments Repo-style
transactions(1) OTC
derivatives
Other off-balance-
sheet items(2) Total
Retail Residential mortgage 33,533 4,881 38,414 Qualifying revolving retail 2,600 1,974 4,574 Other retail 10,805 1,155 16 11,976 46,938 8,010 16 54,964 Non-retail Corporate 31,576 12,504 2,425 40 2,176 48,721 Sovereign 16,368 3,126 14,924 276 139 34,833 Financial institutions 2,352 143 48,470 405 738 52,108 50,296 15,773 65,819 721 3,053 135,662 Trading portfolio 8,074 8,074 Securitization 1,323 2,984 4,307 Total – Gross Credit Risk 98,557 23,783 65,819 8,795 6,053 203,007 Standardized Approach 5,338 456 2,183 845 847 9,669 AIRB Approach 93,219 23,327 63,636 7,950 5,206 193,338 Total – Gross Credit Risk 98,557 23,783 65,819 8,795 6,053 203,007
(1) Securities purchased under reverse repurchase agreements and sold under repurchase agreements as well as securities loaned and borrowed. (2) Letters of guarantee, documentary letters of credit and securitized assets that represent the Bank’s commitment to make payments in the event that a client cannot meet its financial
obligations to third parties.

MANAGEMENT’S DISCUSSION AND ANALYSIS RISK MANAGEMENT
National Bank of Canada 69 2014 Annual Report
Personal Credit Portfolios This category comprises portfolios of residential mortgage loans, consumer loans and loans to certain small businesses. A risk analysis based on loan grouping in pools of homogeneous obligor and product profiles is used for overall management of personal credit portfolios. This personal credit assessment approach, which has proven particularly effective for estimating loan defaults and losses, takes a number of factors into account, namely:
— behaviour scoring; — loan product characteristics; — collateral provided; — the length of time on the Bank’s balance sheet; and — loan status (active, delinquent or defaulted).
This mechanism provides adequate risk measurement inasmuch as it effectively differentiates risk levels by pool. Therefore, the results are periodically reviewed and, if necessary, adjustments are made to the models. Obligor migrations between pools are among the factors considered in the credit risk assessment.
Loan pools are also established based on probability of default, loss given default and exposure at default, which are measured based on the characteristics of the obligor and the transaction itself. The credit risk of these portfolios is estimated using credit scoring models that determine probability of default of the obligator. Loss given default is estimated based on transaction-specific factors such as loan product characteristics (for example, a line of credit versus a term loan), loan-to-value ratio and types of collateral.
Under the Bank’s standards applicable to default-risk rating and facility-risk rating as well as to risk reviews, renewals and quantification, default risk ratings must be reviewed annually. Personal credit risk assessments are based on a group of borrowers with similar credit histories and behaviour profiles.
The credit scoring models are also used to grant new credit. These models use proven statistical methods that measure applicants’ characteristics and history based on internal and external historical information to estimate the applicant’s future credit behaviour and assign a probability of default. The underlying data include client information such as current and past employment, historical loan data in the Bank’s management systems and information from external sources such as credit rating agencies.
The Bank also uses behaviour scoring models to manage and monitor current commitments. The risk assessment is based on statistical analyses of the past behaviour of obligors with which the Bank has a long-term relationship in an effort to predict their future behaviour. The underlying information includes the obligor’s cash flows and borrowing trends. Information on characteristics that determine behaviour in these models also comes from both internal sources on current commitments and external sources.
Business and Government Credit Portfolios This category comprises business (other than some small businesses that are classified in personal credit portfolios), government and financial institution credit portfolios.
These credit portfolios are assigned a risk rating based on a detailed individual analysis of the financial and non-financial aspects of the borrower, including the borrower’s financial strength, sector of economic activity, competitive ability, access to capital and management quality. The Bank has risk-rating tools and models enabling it to specifically assess the risk represented by an obligor in relation to its industry and peers. The models used are adapted to the obligor’s broad sector of activity. Models are in place for eight sectors: business/commercial, large business, banks-brokerage, sovereigns, energy, real estate, agriculture and insurance.
This risk assessment method assigns a default risk rating to an obligor that reflects its credit quality. To each credit risk rating corresponds a probability of default (see the following table). This credit quality classification enables the Bank to adequately differentiate its respective assessments of an obligor’s ability to meet its contractual obligations. Default risk ratings are assigned according to an assessment of the obligors’ commercial and financial risks, based on a solvency review. Various risk quantification models, described below, are used to perform this assessment.
The business and government default risk-rating scale used by the Bank is similar to the systems used by major external rating agencies. The complete rating scale comprised of 19 grades is presented in the Supplementary Regulatory Capital Disclosure report, which is available on the Bank’s website at nbc.ca. The following table presents a grouping of the grades by major risk category and compares them with the ratings of two major rating agencies. Internal Default Risk Ratings – Business and Government *
Ratings
PD – Corporate
and Financial institutions
PD – Sovereign
Standard & Poor's Moody's Description(1)
1–2.5 0.000–0.103 0.000–0.060 AAA to A- Aaa to A3 Excellent 3–4 0.103–0.462 0.060–0.342 BBB+ to BBB- Baa1 to Baa3 Good 4.5–6 0.462–3.412 0.342–3.507 BB+ to B+ Ba1 to B1 Satisfactory
6.5–7.5 3.412–15.284 3.507–20.099 B to CCC+ B2 to Caa1 Special
mention 8–8.5 15.284–99.999 20.099–99.999 CCC & CCC- Caa2 & Caa3 Substandard 9–10 100 100 CC, C & D Ca, C & D Default
(1) Additional information is provided in the table on page 71.

MANAGEMENT’S DISCUSSION AND ANALYSIS RISK MANAGEMENT
70 National Bank of Canada 2014 Annual Report
The Bank also uses individual assessment models by industry to assign a risk rating to the credit facility based on the collateral and guarantees the obligor is able to provide and, in some cases, based on other factors.
The Bank consequently has a bi-dimensional risk-rating system that, using internal and external historical data, establishes a default risk rating for each obligor, and models that assign a risk rating to the credit facility that is independent of the risk rating assigned to the obligor.
The Bank’s default, and in some cases, facility risk-rating systems and the associated risk parameters are used to estimate expected and unexpected losses and risk-based pricing as well as to establish counterparty credit concentration limits, assess economic capital and generally manage credit portfolios. Validation The Risk Management Group monitors the effectiveness of the risk-rating systems and associated parameters, which are also reviewed regularly in accordance with the Bank’s policies.
Backtesting is done at regular intervals to validate the effectiveness of the models used to estimate probability of default, loss given default and exposure at default. For probability of default in particular, this backtesting takes the form of sequentially applied statistical tests designed to assess the following criteria:
— the model’s discriminatory power; — overrides; — model calibration; and — the stability of the model’s output.
The credit risk quantification models are developed and tested by a team of specialists and their performance is monitored by the applicable business units and related credit risk management services. New models are validated by a unit that is independent of both the specialists that developed the model and the business units concerned, and approved through an escalation process established by the Model Risk Management Policy. Furthermore, new models or changes to existing models that markedly impact regulatory capital must be approved by the Board before being submitted to the regulatory agencies, and a summary report of all changes to the models is submitted to the RMC once a year.
The default risk-rating systems, methods and models are also subject to periodic independent validation, as often as required given the inherent risk of the activity. Models that have a significant impact on regulatory capital must be reviewed regularly, thereby further raising the certainty that these quantification mechanisms are working as expected. The key aspects to be validated are factors allowing accurate risk classification by level, adequate quantification of exposure, use of assessment techniques that include external factors such as economic conditions and credit status and, lastly, compliance with internal policies and regulatory provisions. Each year, the Risk Management Group presents a summary report on the validations to the RMC.
The Bank’s credit risk assessment and rating systems are overseen by the Capital Models Oversight Committee, the GRC and the RMC, and are an integral part of a comprehensive Bank-wide credit risk oversight framework. Along with the above-mentioned elements, the Bank documents and periodically reviews the policies, definitions of responsibilities, resource allocation and existing processes.

MANAGEMENT’S DISCUSSION AND ANALYSIS RISK MANAGEMENT
National Bank of Canada 71 2014 Annual Report
Personal Credit Portfolio Subject to the AIRB Approach *
The following table presents the credit quality of the personal credit portfolio subject to the AIRB Approach, according to the internal risk-rating categories assigned to borrowers. As at October 31 (millions of Canadian dollars)
Exposure at default 2014 2013
Residential mortgage(1)
Qualifying revolving
retail(2) Other
retail(3) Total Total
Excellent 19,301 2,608 2,243 24,152 22,502 Good 14,558 897 2,684 18,139 17,956 Satisfactory 5,141 1,056 3,541 9,738 9,026 Special mention 785 362 686 1,833 1,631 Substandard 420 82 204 706 731 Default 128 22 111 261 263 40,333 5,027 9,469 54,829 52,109
(1) Includes home equity lines of credit. (2) Includes lines of credit and credit card receivables. (3) Includes consumer loans, credit card receivables and certain SME loans, and other personal loans.
Business and Government Credit Portfolio Subject to the AIRB Approach *
The following table presents the credit quality of the business and government credit portfolio subject to the AIRB Approach, according to the internal risk-rating categories assigned to borrowers. As at October 31 (millions of Canadian dollars)
Exposure at default 2014 2013
Drawn(1) Undrawn
commitments(2) Other
exposures(3) Total Total
Excellent 23,279 5,207 46,672 75,158 63,040 Good 14,451 7,668 15,464 37,583 35,531 Satisfactory 13,954 2,998 8,183 25,135 28,495 Special mention 1,837 303 1,194 3,334 2,175 Substandard 45 1 46 124 Default 383 8 2 393 289 53,949 16,185 71,515 141,649 129,654
(1) Amounts drawn represent certain deposits with financial institutions, available-for-sale debt securities, gross loans, customers’ liability under acceptances and certain other assets. (2) Undrawn commitments represent unused portions of authorized credit facilities in the form of loans, acceptances, letters of guarantee and documentary letters of credit, excluding
investment banking activities. (3) Other exposures represent securities purchased under reverse repurchase agreements and securities borrowed as well as securities sold under repurchase agreements and securities
loaned, forwards, futures, swaps and options and also include letters of guarantee, documentary letters of credit, and securitized assets that represent the Bank’s commitment to make payments in the event a client cannot meet its financial obligations to third parties.

MANAGEMENT’S DISCUSSION AND ANALYSIS RISK MANAGEMENT
72 National Bank of Canada 2014 Annual Report
Assessment of Capital at Risk The assessment of the Bank’s capital at risk, or economic capital, is based on the credit risk assessments of various borrowers. These two activities are therefore interlinked. The different models used to assess the credit risk of a given portfolio type also enable the Bank to determine the default correlation among borrowers. This information is a critical component in the evaluation of potential losses for all portfolios carrying credit risk. Potential losses, whether expected or not, are based on past loss experience, portfolio monitoring, market data and statistical modelling. Expected and unexpected losses are factors in the assessment of capital at risk for each business segment. The main risk factors are as follows:
— probability of default; — balance outstanding at the time of default; — expected loss in the event of default; — correlation between transactions; — term of credit commitments; and — impact of economic and sector-based cycles on asset quality. Stress Testing and Crisis Scenarios The Bank carries out stress tests to evaluate its sensitivity to crisis situations in certain sectors of activity and key portfolios (e.g., agriculture, construction, manufacturing, etc.). Moreover, a global stress test methodology covers most business and government credit portfolios as well as personal credit portfolios to provide the Bank with an overview of the situation. By simulating specific scenarios, these tests enable the Bank to measure the level of regulatory capital needed to absorb potential losses and to determine the impact on its solvency. Mortgage Loan Underwriting To mitigate the impact of an economic slowdown and ensure the long-term quality of its portfolio, the Bank uses sound risk management when granting residential mortgages to confirm: (i) the borrower’s intention to meet its financial obligations, (ii) the borrower’s ability to repay its debts and (iii) the quality of the collateral. In addition, the Bank takes a prudent approach to client qualification by using, for example, a higher interest rate for terms less than five years to mitigate the risk of short- or medium-term rate increases.
Nonetheless, the risk of economic slowdown could adversely affect the profitability of the mortgage portfolio. In stress test analyses, the Bank considers a variety of scenarios to measure the impact of adverse market conditions. In such circumstances, our analyses show significantly higher loan losses, which would decrease profitability and reduce the Bank’s capital ratios.
To counteract the negative impact of an economic slowdown, the Bank has acted preventively by defining a contingency plan to guide its response in such an event.
Credit-Granting Process Credit-granting decisions are based first and foremost on the results of the risk assessment. Aside from a client’s solvency, credit-granting decisions are also influenced by factors such as available collateral, transaction compliance with policies, standards and procedures, and the Bank’s overall risk-adjusted return objective. Each credit-granting decision is made by authorities within the risk management teams and management who are independent of the business units and are at a reporting level commensurate with the size of the proposed credit transaction and the associated risk.
Decision-making authority is determined in compliance with the delegation of authority set out in the Credit Risk Management Policy. A person in a senior position in the organization approves credit facilities that are substantial or carry a higher risk for the Bank. The Bank’s Global Risk Committee approves and monitors all substantial credit facilities. Credit applications that exceed management’s latitudes are submitted to the Board for approval. The credit-granting process demands a high level of accountability from managers, who must proactively manage the credit portfolio. Risk Mitigation The Bank also controls credit risk using various risk mitigation techniques. In addition to the standard practice of requiring collateral to guarantee repayment of the credit it grants, the Bank also uses protection mechanisms such as credit derivative financial instruments, syndication and loan assignments as well as an orderly reduction in the amount of credit granted.
The most common method used to mitigate credit risk is to obtain quality collateral from borrowers. Obtaining collateral cannot replace a rigorous assessment of a borrower’s ability to meet its obligations, but, beyond a certain risk threshold, it is an essential complement. Collateral is not required in all cases; it depends upon the level of risk presented by the borrower and the type of loan granted. However, if the level of risk to the Bank is considered high, collateral will likely be required. The legal validity of any collateral obtained and the Bank’s ability to correctly and regularly measure the collateral’s value are critical for this mechanism to play its proper role in risk mitigation. The Bank has established specific requirements in its internal policies with respect to the appropriate legal documentation and assessment for the kinds of collateral that business units may require to guarantee loans granted. The categories of eligible collateral and the lending value of these assets have also been defined by the Bank. For the most part, they include the following asset categories as well as guarantees (whether secured by collateral or unsecured) and government and bank guarantees:
— accounts receivable; — inventories; — machinery and equipment and rolling stock; — residential and commercial real estate, office buildings and industrial
facilities; and — cash and marketable securities.
Portfolio Diversification and Management The Bank is exposed to credit risk, not only through outstanding loans and undrawn amounts of commitments to a particular borrower but also through the sectoral distribution of the outstanding loans and undrawn amounts and through the exposure of its various credit portfolios to geographical, concentration and settlement risks.

MANAGEMENT’S DISCUSSION AND ANALYSIS RISK MANAGEMENT
National Bank of Canada 73 2014 Annual Report
The Bank’s approach to controlling these diverse risks begins with optimizing the diversification of its exposures. Measures designed to maintain a healthy degree of diversification of credit risk in its portfolios are set out in the Bank’s internal policies and procedures. These instructions are mainly reflected in the application of various exposure limits: credit concentration limits by counterparty and credit concentration limits by industry, country, region and type of financial instrument. Compliance with these limits, particularly exceptions, is monitored through periodic reports submitted by the Risk Management officers to the Board.
The criteria established for portfolio diversification and the specific limits set for economic, industrial or geographical sectors are based on findings of sector-based studies and analyses conducted by economists and the Risk Management Group and are approved by the Board. Continuous analyses are performed in order to anticipate problems with a sector or borrower before they materialize as defaulted payments. Other Risk Mitigation Methods Credit risk mitigation measures for transactions in derivative financial instruments, which are regularly used by the Bank, are described in detail in the Counterparty Risk section. Credit derivative financial instruments and financial guarantee contracts The Bank also reduces credit risk by using the protection provided by credit derivative financial instruments such as credit default swaps. When the Bank acquires credit protection, it pays a premium on the swap to the counterparty in exchange for the counterparty’s commitment to pay if the underlying entity defaults or another event involving the underlying entity and covered by the legal agreement occurs. Since, like borrowers, providers of credit protection must receive a default risk rating, the Bank’s standards set out all the criteria under which a counterparty may be judged eligible to mitigate the Bank’s credit risk. The Bank may also reduce its credit risk by entering into financial guarantee contracts whereby a guarantor indemnifies the Bank for a loss resulting from an obligor failing to make a payment when due in accordance with the contractual terms of a debt instrument.
Loan syndication The Bank has developed specific instructions on the appropriate objectives, responsibilities and documentation requirements for loan syndication. Account Monitoring and Recovery Credit granted and borrowers are monitored on an ongoing basis and in a manner commensurate with the related risk. Loan portfolio managers use an array of intervention methods to conduct a particularly rigorous follow-up on files showing risk of default. When loans continue to deteriorate and there is an increase in risk to the point where monitoring has to be increased, a group specialized in managing problem accounts steps in to maximize collection of the disbursed amounts and tailor strategies to these accounts.
In these cases, loan portfolio managers prepare and submit, to the credit department, a detailed monitoring report each month to track the status of at-risk obligors and the corrective measures undertaken. The management of each credit department concerned performs follow-ups on the reports, and each quarter a credit monitoring committee meets to review the action plans and monitoring reports of obligors that have commitments of $2 million or more. The authority to approve allowances for credit losses is attributed using limits delegated on the basis of hierarchical level under the Credit Risk Management Policy.
Information on the recognition of impaired loans and allowances for credit losses are presented in Note 1 to the consolidated financial statements. Forbearance and Restructuring Situations where a business or retail obligor begins showing clear signs of potential insolvency are managed on a case by case basis. The Loan Work Out Policy sets the principles applicable in such situations to guide loan restructuring decisions and identify situations where distressed restructuring applies. A distressed restructuring situation occurs when the Bank grants special concession to an obligor for economic or legal reasons related to the obligor’s financial difficulties.
The Bank establishes a management framework for commercial and corporate obligors that represent higher-than-normal risk of default. It outlines the roles and responsibilities of loan portfolio managers with respect to managing high-risk accounts and the responsibilities of the Work Out units and other participants in the process.
Lastly, the Credit Risk Management Policy and a management framework are used to determine the authorization limits for distressed restructuring situations.
Counterparty Risk Counterparty risk is a credit risk that the Bank incurs on various types of transactions involving financial instruments. The most significant risks are those it faces when it trades derivative financial instruments with counterparties on the over-the-counter market or when it purchases securities under reverse repurchase agreements or sells securities under repurchase agreements. Securities lending transactions and securities brokerage activities involving derivative products are also sources of counterparty risk. Note 16 to the consolidated financial statements provides a complete description of the credit risk for derivative financial instruments by type of traded product. The Risk Management Group has developed models by broad category of financial instrument through which it applies an advanced methodology for calculating the Bank’s credit risk exposure and economic capital. The exposures are subject to limits. These two elements are established based on the potential volatility of the underlying assets until maturity of the contract.

MANAGEMENT’S DISCUSSION AND ANALYSIS RISK MANAGEMENT
74 National Bank of Canada 2014 Annual Report
Counterparty obligations related to the trading of contracts on derivative financial instruments are frequently subject to credit risk mitigation measures. The mitigation techniques are somewhat different from those used for loans and advances and depend on the nature of the instrument or the type of contract traded. The first of these, and the most widely used, is the signing of International Swaps & Derivatives Association, Inc. (ISDA) master agreements with the appropriate counterparties. These agreements make it possible, in the event of default, insolvency or bankruptcy of one of the contracting parties, to apply full netting of the gross amounts of the market values for each of the transactions covered by the agreement and in force at the time of default. The amount of the final settlement is therefore the net balance of gains and losses on each transaction, which reduces exposure when a counterparty defaults. The Bank’s policies require signing an ISDA agreement with most derivative and foreign exchange forward contracts trading counterparties.
Another mechanism for reducing credit risk complements the ISDA master agreement in many cases and provides the Bank and its counterparty (or either of the parties, if need be) with the right to request collateral from the counterparty when the net balance of gains and losses on each transaction exceeds a threshold defined in the agreement. These agreements, also known as Credit Support Annexes (CSAs), are common between financial institutions active in international financial markets since they limit credit risk while providing traders with additional flexibility to continue trading with the counterparty. The Bank often uses this type of legal documentation in transactions with financial institutions and governments. For business transactions, the Bank prefers to use internal mechanisms set out in the credit agreements. The Bank’s internal policies set the conditions governing the implementation of such mitigation methods.
Requiring collateral as part of a securities lending transaction or reverse repurchase agreement is not solely the result of an internal credit decision. In fact, it is a mandatory market practice imposed by self-regulating organizations in the financial services sector such as the Investment Industry Regulatory Organization of Canada (IIROC).
The Bank also has policies and guidelines governing its own collateral pledged to counterparties, given the potential impact of such asset transfers on its liquidity. In accordance with its Liquidity, Funding & Pledging Policy, the Bank conducts simulations of potential counterparty collateral claims under CSAs in effect, in the event of a Bank downgrade or other unlikely occurrences. The simulations are based on various Bank downgrading scenarios or market value fluctuations of transactions covered by CSAs.
The Bank has identified circumstances in which it is likely to be exposed to wrong-way risk, which is generally associated with exposure to counterparty risk and increases as the counterparty’s probability of default increases (unfavourable positive correlation). A common wrong-way risk arises from the trading of derivatives contracts with counterparties where the underlying assets may include equity securities issued by those counterparties.
Settlement Risk Settlement risk potentially arises from transactions that feature reciprocal delivery of cash or securities between the Bank and a counterparty. Foreign exchange contracts are an example of transactions that can generate significant levels of settlement risk. However, the implementation of multilateral settlement systems that allow settlement netting among participating institutions has contributed greatly to reducing the risks associated with the settlement of foreign exchange transactions among banks. The Bank also uses financial intermediaries to have access to established clearing houses in order to minimize settlement risk for certain financial derivative transactions. In some cases, the Bank may have direct access to established clearing houses for settling financial transactions such as repurchase agreements or reverse repurchase agreements. In addition, certain derivative financial instruments traded over the counter are settled directly or indirectly by central counterparties. For additional information, see the table that presents notional amounts in Note 16 to the consolidated financial statements.
There are several other types of transactions that may generate settlement risk, in particular the use of certain electronic fund transfer services. This risk refers to the possibility that the Bank may make a payment or settlement on a transaction without receiving the amount owed from the counterparty, and with no opportunity to recover the funds delivered (irrevocable settlement).
The ultimate means for completely eliminating such a risk is for the Bank to complete no payments or settlements before receiving the funds due from the counterparty. Such an approach cannot, however, be used systematically. For several electronic payment services, the Bank is able to implement mechanisms that allow it to make its transfers revocable or to debit the counterparty in the amount of the settlements before it makes its own transfer. On the other hand, the nature of transactions in financial instruments makes it impossible for such practices to be widely used. For example, on foreign exchange transactions involving a currency other than the U.S. dollar, time zone differentials impose strict payment schedules on the parties. The Bank cannot unduly postpone a settlement without facing significant penalties, due to the large size of amounts involved.
The most effective way for the Bank to control settlement risks, both for financial market transactions and irrevocable transfers, is to impose internal risk limits based on the counterparty’s ability to pay.

MANAGEMENT’S DISCUSSION AND ANALYSIS RISK MANAGEMENT
National Bank of Canada 75 2014 Annual Report
Market Risk Management
Market risk is the risk of financial loss resulting from adverse movements in underlying market factors.
Market risk at the Bank arises from its participation in market making, trading, investment and asset/liability management activities. Trading-market risk includes market-making and trading activities that involve taking positions mainly in interest rate, equity and foreign exchange instruments, commodities or derivative products. Non-trading market risk arises from non-trading exposure in asset and liability management portfolios, as well as securities held in investment, funding and liquidity portfolios.
Market risk is the risk of a negative impact from adverse changes or from the implicit volatility of the following key risk factors.
— Interest rate risk: relates to changes in the term structure of interest rates of financial instruments such as bonds, money market instruments and derivatives.
— Foreign exchange risk: relates to changes in foreign exchange rates of financial instruments such as investments in foreign subsidiaries, foreign currency denominated loans and securities, future cash flows in foreign currencies and derivatives.
— Equity risk: relates to changes in overall equity prices (general equity risk) or in individual characteristics that are specific to an entity (equity specific risk) for financial instruments such as common shares, and derivatives such as options.
— Commodity risk: relates to changes in commodity prices of financial instruments in exchange trading or over-the-counter trading, involving either physical trading or derivatives trading of commodities.
— Traded credit risk: relates to changes in the creditworthiness of all issuers (general traded credit risk) or in characteristics of a specific issuer (traded credit issuer-specific risk) relating mainly to the Bank’s portfolios of debt securities and credit derivatives, whose value could be adversely affected by changes in credit spreads, by credit migration or by defaults.
— Implied correlation risk: relates to changes in implied correlations between two or more risk factors mainly included in complex derivatives.
— Market liquidity risk: relates to a significant decrease or, at worst, a halt in the level of expected market activity for a specific market or for a variety of instruments, thereby making the instruments concerned less liquid or illiquid. This exposes the Bank to losses due to the inability to execute its transactions at the prevailing prices, which may not represent the true price at which the entire position can be unwound. Almost all traded instruments are exposed to this type of risk depending mainly on frequency and volume of transactions.
— Portfolio diversification and hedging risk (basis risk): relates to changes in correlations realized between two or more risk factors. Adverse changes in realized correlations can reduce the portfolio diversification benefit in the sense that several of the positions could have higher correlation than expected, giving rise to simultaneous losses. In addition, adverse changes in realized correlation can make hedging strategies less effective if the underlying position and the hedge position have weaker correlation than expected. The trading portfolios include positions in financial instruments and
commodities held either with trading intent or to hedge other elements of the trading book. Positions held with trading intent are those held for short-term resale and/or with intent of taking advantage of actual or expected short term price movements or to lock in arbitrage profits. These portfolios target one of the following objectives: market making, trading, proprietary trading, liquidating positions for clients or selling financial products to clients.
Non-trading portfolios include all financial instruments held to maturity or until conditions are more advantageous to invest in other investments, or for strict liquidity management purposes, as well as structural portfolios that aim at managing the Bank’s structural interest rate and foreign exchange risks. Governance The Board is responsible for approving the market risk policy framework and the Bank’s market risk appetite measures and targets. The Board also defines Bank-wide market risk limits. The Bank’s President and Chief Executive Officer (the President), who has ultimate responsibility for market risk limits, manages the Bank’s market risk based on the risk appetite targets set and approved by the Board to generate acceptable return on market risk capital. The President delegates risk-taking responsibilities to business units managers reporting to him. The business units are responsible for the market risks inherent to their particular activities and must therefore actively manage such risks. The Market Risk Management Committee monitors market risk across the Bank and ensures that the magnitude and mix of risks remain within the Bank’s market risk appetite targets and risk limits. This committee also ensures that the risk management environment is transparent, disciplined and controlled, and that market risk capital is used to maximize shareholders’ equity.
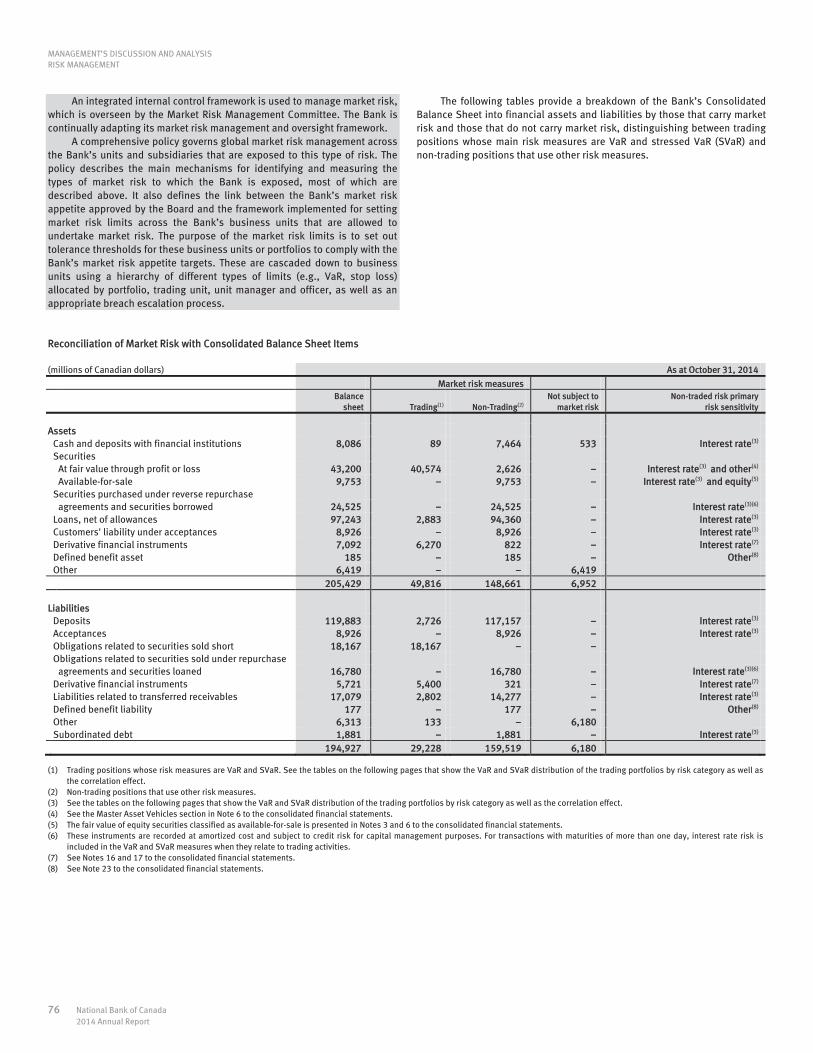
MANAGEMENT’S DISCUSSION AND ANALYSIS RISK MANAGEMENT
76 National Bank of Canada 2014 Annual Report
An integrated internal control framework is used to manage market risk, which is overseen by the Market Risk Management Committee. The Bank is continually adapting its market risk management and oversight framework.
A comprehensive policy governs global market risk management across the Bank’s units and subsidiaries that are exposed to this type of risk. The policy describes the main mechanisms for identifying and measuring the types of market risk to which the Bank is exposed, most of which are described above. It also defines the link between the Bank’s market risk appetite approved by the Board and the framework implemented for setting market risk limits across the Bank’s business units that are allowed to undertake market risk. The purpose of the market risk limits is to set out tolerance thresholds for these business units or portfolios to comply with the Bank’s market risk appetite targets. These are cascaded down to business units using a hierarchy of different types of limits (e.g., VaR, stop loss) allocated by portfolio, trading unit, unit manager and officer, as well as an appropriate breach escalation process.
The following tables provide a breakdown of the Bank’s Consolidated Balance Sheet into financial assets and liabilities by those that carry market risk and those that do not carry market risk, distinguishing between trading positions whose main risk measures are VaR and stressed VaR (SVaR) and non-trading positions that use other risk measures.
Reconciliation of Market Risk with Consolidated Balance Sheet Items (millions of Canadian dollars) As at October 31, 2014
Market risk measures
Balance
sheet Trading(1) Non-Trading(2) Not subject to
market risk Non-traded risk primary
risk sensitivity
Assets Cash and deposits with financial institutions 8,086 89 7,464 533 Interest rate(3) Securities At fair value through profit or loss 43,200 40,574 2,626 Interest rate(3) and other(4) Available-for-sale 9,753 9,753 Interest rate(3) and equity(5) Securities purchased under reverse repurchase agreements and securities borrowed 24,525 24,525 Interest rate(3)(6) Loans, net of allowances 97,243 2,883 94,360 Interest rate(3) Customers' liability under acceptances 8,926 8,926 Interest rate(3) Derivative financial instruments 7,092 6,270 822 Interest rate(7) Defined benefit asset 185 185 Other(8) Other 6,419 6,419 205,429 49,816 148,661 6,952 Liabilities Deposits 119,883 2,726 117,157 Interest rate(3) Acceptances 8,926 8,926 Interest rate(3) Obligations related to securities sold short 18,167 18,167 Obligations related to securities sold under repurchase agreements and securities loaned 16,780 16,780 Interest rate(3)(6) Derivative financial instruments 5,721 5,400 321 Interest rate(7) Liabilities related to transferred receivables 17,079 2,802 14,277 Interest rate(3) Defined benefit liability 177 177 Other(8) Other 6,313 133 6,180 Subordinated debt 1,881 1,881 Interest rate(3) 194,927 29,228 159,519 6,180
(1) Trading positions whose risk measures are VaR and SVaR. See the tables on the following pages that show the VaR and SVaR distribution of the trading portfolios by risk category as well as the correlation effect.
(2) Non-trading positions that use other risk measures. (3) See the tables on the following pages that show the VaR and SVaR distribution of the trading portfolios by risk category as well as the correlation effect. (4) See the Master Asset Vehicles section in Note 6 to the consolidated financial statements. (5) The fair value of equity securities classified as available-for-sale is presented in Notes 3 and 6 to the consolidated financial statements. (6) These instruments are recorded at amortized cost and subject to credit risk for capital management purposes. For transactions with maturities of more than one day, interest rate risk is
included in the VaR and SVaR measures when they relate to trading activities. (7) See Notes 16 and 17 to the consolidated financial statements. (8) See Note 23 to the consolidated financial statements.

MANAGEMENT’S DISCUSSION AND ANALYSIS RISK MANAGEMENT
National Bank of Canada 77 2014 Annual Report
(millions of Canadian dollars) As at October 31, 2013(1)
Market risk measures
Balance
sheet Trading(2) Non-trading(3) Not subject to
market risk Non-traded risk primary
risk sensitivity
Assets Cash and deposits with financial institutions 3,596 5 2,806 785 Interest rate(4) Securities At fair value through profit or loss 44,000 40,790 3,210 Interest rate(4) and other(5) Available-for-sale 9,744 9,744 Interest rate(4) and equity(6) Securities purchased under reverse repurchase agreements and securities borrowed 21,449 21,449 Interest rate(4)(7) Loans, net of allowances 88,384 1,588 86,796 Interest rate(4) Customers' liability under acceptances 8,954 8,954 Interest rate(4) Derivative financial instruments 5,904 5,252 652 Interest rate(8) Defined benefit asset 131 131 Other(9) Other 6,057 6,057
188,219 47,635 133,742 6,842 Liabilities Deposits 102,111 2,055 100,056 Interest rate(4) Acceptances 8,954 8,954 Interest rate(4) Obligations related to securities sold short 18,909 18,909 Obligations related to securities sold under repurchase agreements and securities loaned 19,746 19,746 Interest rate(4)(7) Derivative financial instruments 4,858 4,559 299 Interest rate(8) Liabilities related to transferred receivables 15,323 2,028 13,295 Interest rate(4) Defined benefit liability 178 178 Other(9) Other 6,761 109 6,652 Subordinated debt 2,426 2,426 Interest rate(4)
179,266 27,660 144,954 6,652
(1) Certain amounts have been adjusted to reflect changes in accounting standards. See Note 2 to the consolidated financial statements. (2) Trading positions whose main risk measures are VaR and SVaR. See the tables on the following pages that show the VaR and SVaR distribution of the trading portfolios by risk category as
well as the correlation effect. (3) Non-trading positions that use other risk measures. (4) See the tables on the following pages that show the VaR and SVaR distribution of the trading portfolios by risk category as well as the correlation effect. (5) See the Master Asset Vehicles section in Note 6 to the consolidated financial statements. (6) The fair value of equity securities classified as available-for-sale is presented in Notes 3 and 6 to the consolidated financial statements. (7) These instruments are recorded at amortized cost and subject to credit risk for capital management purposes. For transactions with maturities of more than one day, interest rate risk is
included in the VaR and SVaR measures when they relate to trading activities. (8) See Notes 16 and 17 to the consolidated financial statements. (9) See Note 23 to the consolidated financial statements.

MANAGEMENT’S DISCUSSION AND ANALYSIS RISK MANAGEMENT
78 National Bank of Canada 2014 Annual Report
Assessing Market Risk The Risk Management Group uses a variety of risk measures to estimate the size of potential losses under more or less severe scenarios, and using both short-term and long-term time horizons. For short-term horizons, the Bank’s risk measures include VaR, SVaR, and sensitivity metrics. For long-term horizons or sudden significant market moves, including those due to a lack of market liquidity, the risk measures include stress testing across an extensive range of scenarios. VaR is a statistical measure of risk that is used to quantify market risks across products, per types of risks and aggregate risk on a portfolio basis. VaR is defined as the maximum loss at a specific confidence level over a certain horizon under normal market conditions. The VaR method has the advantage of providing a uniform measurement of financial instrument-related market risks based on a single statistical confidence level and time horizon. The Bank uses an historical price distribution to compute the probable loss levels at the 99% level of confidence, using a two-year daily time series of risk factor changes. VaR is the maximum daily loss the Bank could incur, in 99 cases out of 100, in a given portfolio. In other words, the loss could exceed that amount in only one out of 100 cases.
The trading VaR is measured by assuming a holding period of one day for ongoing market risk management and a 10-day horizon for regulatory capital purposes. This assumption is used to combine the VaR of various portfolios and provides an estimate of the daily market risk incurred by the Bank. VaR is calculated on a daily basis both for major classes of financial instruments (including derivative financial instruments) and all trading portfolios of the Financial Markets segment and Corporate Treasury of the Bank.
In addition to the one-day trading VaR, the Bank calculates a trading SVaR, which is a statistical measure of risk that replicates the VaR calculation method (1-day holding period for risk management purposes and 10-day horizon for regulatory capital purposes) but uses, instead of the variable two-year history of market risk data input, 12-month historical data corresponding to a continuous period of significant financial stress that is relevant in terms of the Bank’s portfolios.
VaR methodology techniques are well suited to measure risks under normal market conditions. VaR metrics are most appropriate as a risk measure for trading positions in liquid financial markets. However, there are limitations in measuring risks with this method when extreme and sudden market risk events occur, since they are likely to underestimate the Bank’s market risk. VaR methodology limitations include the following.
— Past changes in market risk factors may not always produce accurate predictions of the distribution and correlations of future market movements.
— A VaR with a daily time horizon does not fully capture the market risk of positions that cannot be liquidated or hedged within one day.
— The market risk factor historical database used for VaR calculation may not reflect potential losses that could occur under unusual market conditions (e.g., periods of extreme illiquidity) relative to the historical period used for VaR estimates.
— The use of a 99% VaR confidence level does not reflect the extent of potential losses beyond that percentile.
Given the limitations to VaR, for the Bank it represents only one component in its risk management oversight, which also incorporates, among others, stress testing, sensitivity analysis, concentration and liquidity limits and analysis.
The Bank also conducts backtesting of the VaR model. It consists of comparing the actual and theoretical profit and losses to the statistical VaR measure. Theoretical profit and losses are obtained using daily price movements but under the assumption that there is no intraday change in the composition of the portfolios. Backtesting is essential to verify the capacity of the VaR model to adequately forecast the maximum risk of market losses and thus validate, retroactively, the quality and accuracy of the statistical results obtained using the model. If the backtesting results present material discrepancies, the VaR model could be revised in accordance with the Bank’s model risk management framework. Trading Activities The revenues generated by trading activities are compared with VaR as a backtesting assessment of the appropriateness of this risk measure as well as the financial performance of trading activities relative to the risk undertaken.
The first table below shows the VaR distribution of trading portfolios by risk category as well as the correlation effect. The second table on the next page shows the SVaR distribution, i.e., the VaR of the Bank's current portfolios obtained following the calibration of risk factors over a 12-month stress period.
VaR of Trading Portfolios by Risk Category(1) *
(millions of Canadian dollars) Year ended October 31, 2014
Low High Average Period end
Interest rate (3.2) (7.5) (5.1) (4.7) Foreign exchange (0.4) (2.9) (1.7) (2.2) Equity (2.5) (6.4) (4.7) (3.2) Commodity (0.4) (1.5) (0.9) (0.9) Correlation effect(2) n.m. n.m. 5.3 3.8 Total trading VaR (5.3) (10.1) (7.1) (7.2) (millions of Canadian dollars) Year ended October 31, 2013
Low High Average Period end
Interest rate (4.6) (12.3) (6.6) (5.7) Foreign exchange (0.2) (1.6) (0.7) (0.4) Equity (2.4) (8.6) (4.4) (3.4)Commodity (0.5) (1.9) (1.1) (1.1)Correlation effect(2) n.m. n.m. 5.5 4.5 Total trading VaR (5.0) (11.4) (7.3) (6.1)
n.m. Computation of a correlation effect for the high and low is not meaningful as highs and lows may occur on different days and may be attributable to different types of risk.
(1) Amounts are presented on a pre-tax basis and represent one-day VaR using a 99% confidence level.
(2) The total trading VaR is less than the sum of the individual risk factor VaR results due to the correlation effect.

MANAGEMENT’S DISCUSSION AND ANALYSIS RISK MANAGEMENT
National Bank of Canada 79 2014 Annual Report
SVaR of Trading Portfolios by Risk Category(1) * (millions of Canadian dollars) Year ended October 31, 2014
Low High Average Period end
Interest rate (6.9) (12.7) (9.9) (9.9) Foreign exchange (0.6) (9.0) (4.0) (7.4) Equity (4.0) (20.3) (11.4) (6.4) Commodity (0.4) (2.6) (1.1) (1.3) Correlation effect(2) n.m. n.m. 13.4 14.0 Total trading SVaR (8.3) (21.7) (13.0) (11.0)
(millions of Canadian dollars) Year ended October 31, 2013
Low High Average Period end
Interest rate (5.9) (13.9) (10.1) (11.4) Foreign exchange (0.3) (3.6) (1.2) (0.7) Equity (3.3) (12.2) (6.5) (5.7) Commodity (0.5) (3.4) (1.7) (1.2) Correlation effect(2) n.m. n.m. 9.5 8.5 Total trading SVaR (6.7) (14.7) (10.0) (10.5)
n.m. Computation of a correlation effect for the high and low is not meaningful as highs and lows may occur on different days and may be attributable to different types of risk.
(1) Amounts are presented on a pre-tax basis and represent one-day SVaR using a 99% confidence level.
(2) The total trading SVaR is less than the sum of the individual risk factor SVaR results due to the correlation effect.
As shown in the tables, the total trading VaR and SVaR are generally lower than the sum of the individual VaRs and SVaRs by risk factor, which shows the correlation effect. The average total trading VaR was $7.1 million for fiscal 2014, stable when compared to $7.3 million in fiscal 2013, with the increase in foreign exchange VaR being offset by a lower interest rate VaR. The average total trading SVaR increased by $3.0 million and stood at $13.0 million for fiscal 2014 compared to $10.0 million the previous fiscal year. The increase came essentially from higher foreign exchange and equity SVaR. Total trading VaR peaked in the first quarter of 2014 and then hovered around the annual average for the rest of the fiscal year. As for total trading SVaR, it peaked during the first two quarters of 2014 and then declined and closed out fiscal 2014 at a level below the annual average.
The following table shows daily trading revenues and VaR. Daily trading revenues were positive almost 93% of the days in the year ended October 31, 2014. Net daily trading losses in excess of $1 million were recorded on eight days. None of these losses exceeded the VaR limit.
Daily Trading Revenues (millions of Canadian dollars)
(15)
(10)
(5)
0
5
10
15
20
25
30
Nov
. 13
Dec
. 13
Jan.
14
Feb.
14
Mar
. 14
Apr.
14
May
14
June
14
July
14
Aug.
14
Sept
. 14
Oct
. 14
Trading revenuesVaR (CAN)
(15)
(10)
(5)
0
5
10
15
20
25
30
Nov
. 13
Dec
. 13
Jan.
14
Feb
. 14
Mar
. 14
Apr
. 14
May
14
June
14
July
14
Aug
. 14
Sep
t. 14
Oct
. 14
Trading revenues VaR (CAN)

MANAGEMENT’S DISCUSSION AND ANALYSIS RISK MANAGEMENT
80 National Bank of Canada 2014 Annual Report
Stress Testing and Crisis Scenarios Stress testing is a risk management technique that consists of estimating potential losses under abnormal market conditions and risk factor movements. Stress testing enhances transparency by exploring a range of potential low-probability events. Comprehensive stress testing scenarios include the following:
— changes in all relevant market rates; — potential political shifts; — market illiquidity; and — the interplay between market and credit risk.
These stress tests and sensitivity analyses simulate the results that the portfolios would generate if the extreme scenarios in question were to occur. The Bank’s stress testing framework applied to all positions generating market risk currently comprises the following range of different stress test scenarios.
— Interest rate: sharp parallel increases/decreases in interest rates; non-parallel movements (flattening and steepening) and increases/decreases in credit spreads.
— Equity: sharp stock market crash coupled with a significant increase in volatility; increase in stock prices associated with a lesser volatility; increase in volatility of term structure coupled with a decrease in stock prices.
— Commodity: significant increases/decreases in commodity prices coupled with increases/decreases in volatility; short-term and long-term increases/decreases in commodity prices.
— Foreign exchange: depreciation/appreciation of the U.S. dollar and of other currencies relative to the Canadian dollar.
Controlling Risk Outstanding VaR exposure is monitored daily in relation to established limits for each type of market risk, portfolio and business unit. The RMC reviews VaR results each quarter, including breaches of the limits set out in the policy, if any. The results of stress tests and sensitivity analyses are subject to maximum potential loss limits for the Bank, which are approved by the Board.
The Bank also uses economic capital for market risk as an indicator for risk appetite and limits setting. This indicator measures the amount of capital that is required to absorb unexpected losses due to market risk events over a one-year horizon and with a determined confidence level. For additional information related to economic capital, see the Overview section of this MD&A.
Separate policies govern the pricing and valuation adjustments on financial instruments valued at fair value.
Structural Interest Rate Risk As part of its core banking activities, such as lending and deposit taking, the Bank is exposed to interest rate risk. Interest rate risk is the potential negative impact on the Bank’s economic value and annual net interest income caused by changes in interest rates. The Bank’s material exposure to interest rate risk stems from a variety of sources.
— Yield curve risk, which refers to changes in the level, slope and shape of the yield curve.
— Repricing risk, which arises from timing differences in the maturity and repricing of on- and off-balance-sheet items.
— Options risk, either implicit (e.g., prepayment in mortgage loans) or explicit (e.g., capped mortgages and rate guarantees) in balance sheet products.
— Basis risk that is caused by imperfect correlation between different rate curves.
Structural interest rate risk exposure also includes activities related to
hedging, investments and term funding. To manage such risk, the Bank uses a funds transfer pricing mechanism. The funds transfer pricing is a process by which the Bank’s business units are charged or paid according to their use or supply of funding. Through this mechanism, all funding activities, interest rate risk and liquidity risk associated with those activities are centralized in Corporate Treasury.
Active management of structural interest rate risk can significantly enhance the Bank’s profitability and add to shareholder value. The Bank’s goal is to maximize its economic value and annual net interest income subject to the Bank’s risk appetite. This has to be accomplished within prescribed risk limits in order to protect and stabilize the Bank’s economic value and net interest income. This is done primarily by implementing a policy framework approved by the Board, which establishes a risk tolerance threshold, monitoring structures controlled by the various committees, risk indicators, reporting procedures, delegation of responsibilities and segregation of duties. The Bank also prepares an annual funding plan that incorporates the expected growth of assets and liabilities.

MANAGEMENT’S DISCUSSION AND ANALYSIS RISK MANAGEMENT
National Bank of Canada 81 2014 Annual Report
Governance Management of the Bank’s structural interest rate risk is mandated to Corporate Treasury. In this role, the Corporate Treasury executives and personnel are responsible for the identification and day-to-day management of the risks inherent to structural interest rate risk hedging decisions and operations. They act as the primary effective challenge function with respect to the execution and monitoring of these activities. Moreover, they must ensure compliance with the structural interest rate risk policy. The Office of the President approves and endorses the structural interest rate exposure and strategies on the recommendation of Corporate Treasury. The operational supervision is ensured by two committees: the Forecast Committee and the Intersector Funding Committee. The former analyzes the various structural interest rate risk metrics. The latter ensures that the funds transfer pricing mechanism is adequate and captures all new products offered. Both committees report to the Office of the President – Asset/Liability Management Committee. Stress Testing and Crisis Scenarios Simulations and stress tests are performed on a regular basis to assess the impact of various scenarios on annual net interest income and on the economic value of equity in order to guide the management of structural interest rate risk. Scenarios are performed where the yield curve level, shape and slope are shocked. Yield curve basis and volatility scenarios are also performed. All risk factors mentioned above are covered by specific scenarios and have Board-approved or Global Risk Committee approved risk limits.
Dynamic simulation is also used to project the Bank’s future net interest income, future economic value and future structural interest rate risk exposure. These simulations project cash flows of assets, liabilities and off-balance-sheet products over a given investment horizon. Given their dynamic nature, they encompass assumptions pertaining to changes in volume, client term preference, prepayments of deposits and loans, and yield curve.
The tables opposite present the potential before-tax impact of an immediate and sustained 100-basis-point increase or decrease in interest rates on net interest income for the next 12 months and on the economic value of equity in the Bank’s non-trading portfolios, assuming no further hedging is undertaken.
Interest Rate Sensitivity – Non-Trading Activities (Before Tax) * (millions of Canadian dollars) As at October 31, 2014
Canadian
dollar U.S.
dollar Total
Impact on equity 100-basis-point increase (91) 3 (88) in the interest rate 100-basis-point decrease in the interest rate 59 (6) 53 Impact on net interest income 100-basis-point increase in the interest rate 8 12 20 100-basis-point decrease in the interest rate (15) (15) (30)
(millions of Canadian dollars) As at October 31, 2013
Canadian
dollar U.S.
dollar Total
Impact on equity 100-basis-point increase in the interest rate (148) 15 (133) 100-basis-point decrease in the interest rate 122 (17) 105 Impact on net interest income 100-basis-point increase in the interest rate (13) 17 4 100-basis-point decrease in the interest rate 2 (19) (17)

MANAGEMENT’S DISCUSSION AND ANALYSIS RISK MANAGEMENT
82 National Bank of Canada 2014 Annual Report
Investment Guidelines The Bank has created available-for-sale securities portfolios in liquid and less liquid securities for strategic, long-term investment and liquidity management purposes. These investments carry market risk, credit risk, liquidity risk and concentration risk.
The investment guidelines set out the guiding principles and general management standards that must be followed by all those who manage portfolios of available-for-sale securities included in the portfolios of the Bank and its subsidiaries. Under these guidelines, business units that are active in managing this type of portfolio must adopt internal investment policies that set, among other things, targets and limits for the allocation of assets in the portfolios concerned and internal approval mechanisms. The primary objective is to reduce concentration risk by industry, issuer, country, type of financial instrument and credit quality.
Overall limits in value and in proportion to the Bank’s equity are set on the outstanding amount of liquid preferred shares, liquid equity securities excluding preferred shares, and instruments classified as illiquid securities in the available-for-sale securities portfolios. The overall exposure to common shares with respect to an individual issuer and the total outstanding amount invested in hedge funds and private equity funds, for investment banking services, are also subject to these limits. Restrictions are also set on investments defined as special. Lastly, the Bank has a specific strategic investment policy, approved by the Board, which defines strategic investments as purchases of business assets or acquisitions of deemed material equity stake in an entity for purposes of acquiring control or creating a long-term relationship. Structural Foreign Exchange Risk The Bank’s structural foreign exchange risk arises from investments in foreign operations denominated in currencies other than the Canadian dollar. This risk is measured by assessing the impact of currency fluctuations. The Bank uses financial instruments (derivative and non-derivative) to hedge structural foreign exchange risk. In a hedge of a net investment in a foreign operation, the financial instruments used will offset foreign exchange gains and losses on the investments. Management of this risk is governed by a specific policy submitted to the Board.
Liquidity Risk Management
Liquidity risk is the risk that the Bank will be unable to honour daily cash and financial obligations without resorting to costly and untimely measures. Liquidity risk arises when sources of funds become insufficient to meet scheduled payments under the Bank's commitments. Liquidity risk stems from mismatched cash flows related to assets and liabilities as well as the characteristics of certain products, such as credit commitments and non-fixed term deposits.
The Bank’s primary objective as a financial institution is to manage liquidity such that it supports the Bank’s business strategy and allows it to honour its commitments when they come due, even in extreme conditions. This is done primarily by implementing a policy framework approved by the Board, which establishes a risk tolerance threshold, monitoring structures controlled by the various committees, risk indicators, reporting procedures, delegation of responsibilities and segregation of duties. The Bank also prepares an annual funding plan that incorporates the expected growth of assets and liabilities.
In 2010, the Basel Committee on Banking Supervision (BCBS) issued new Basel III rules aimed at promoting financial stability while encouraging sustainable economic growth. This document entitled Basel III: International framework for liquidity risk measurement, standards and monitoring proposes global regulatory standards on bank liquidity risk. The proposed guidelines introduce two key liquidity ratios: the liquidity coverage ratio (LCR), which is intended to oversee banks through severe short-term stress, and the net stable funding ratio (NSFR), which is a structural ratio over a one-year horizon. The ratios are scheduled for formal implementation in January 2015 (LCR) and 2018 (NSFR), respectively. The LCR rules were finalized in January 2013 while the NSFR rules were finalized in October 2014, and the Bank will be compliant with both. Although the Bank for International Settlements (BIS) had prescribed a minimum LCR of 60% as of January 2015, Canadian banks are required to maintain an LCR of at least 100% as of January 2015. In January 2014, the BIS published a consultation document on NSFR, Basel III: the Net Stable Funding Ratio – Consultative Document. The Bank also produces a quarterly report, Quantitative Impact Study (QIS), which is submitted to the BIS and lets them follow the progress of Basel III implementation. The Bank has already started monitoring both ratios and has submitted its LCR ratio to the national regulator, OSFI, for observation purposes.

MANAGEMENT’S DISCUSSION AND ANALYSIS RISK MANAGEMENT
National Bank of Canada 83 2014 Annual Report
Governance Corporate Treasury manages liquidity and funding needs Bank-wide. Its activities comprise.
— Managing day-to-day cash flow, collateral and short-term funding. — Planning and issuing long-term funding and determining liquidity cost
transfer pricing. — Participating in the development and implementation of the liquidity
management framework, Liquidity, Funding and Pledging Policy, annual funding plan and liquidity contingency plan.
— Developing and implementing the Basel III liquidity project based on the principles, rules and metrics set by the BIS.
— Monitoring, measuring and reporting on the Bank’s exposure to liquidity risk, both overall and by currency.
— Establishing and maintaining an adequate risk assessment process and effective controls.
The Bank’s liquidity, funding and pledging policy requires review and
approval by the RMC, based on recommendations from the GRC. The Bank has established two levels of limits. The first level of limits encompasses the Bank’s overall liquidity position and is Board approved, while the second level of limits is more focused on specific elements of liquidity risk and is approved by the GRC. The Board not only approves the supervision of day-to-day management and risk governance but also backup plans in anticipation of emergency situations and liquidity crisis. If a limit has to be revised, Corporate Treasury and Risk Management together submit the proposed revision to the GRC. If the latter approves the request, it is presented to the Board for approval only if a level-one limit is concerned.
Liquidity risk supervision at the Bank is mainly assigned to the Liquidity and Funding Committee, composed of Corporate Treasury and Risk Management Group representatives. In accordance with their roles and responsibilities under their respective mandates, the members of this committee are also asked for input in developing risk management and control mechanisms and implementing policies.
Through the Liquidity and Funding Committee, Corporate Treasury regularly reports changes in liquidity, funding and pledging indicators and compliance with regulatory, Board and GRC approved limits. If control reports indicate non-compliance with the limits and, generally, deterioration of liquidity indicators, Corporate Treasury takes remedial action. According to the escalation process, problematic situations are reported to the management of the Finance and Treasury unit and of the Risk Management unit, as well as to the GRC and to the RMC. An executive report on liquidity risk management and Bank funding, which describes the Bank’s liquidity position and informs the Board of non-compliance with the limits and other rules observed during the reference period as well as remedial action taken, is submitted quarterly to the RMC.
Although the day-to-day management of risks associated with liquidity, funding and pledging activities and the monitoring of compliance with the resulting policy is assumed by Corporate Treasury, the Risk Management Group is responsible for ensuring that an appropriate risk management framework is in place and that risk appetite and policy are adhered to. This provides an independent oversight and effective challenge for the liquidity, funding and pledging decisions, strategy and exposure.
Liquidity Management The Bank performs liquidity management, funding and pledging operations not only from its head office and regional offices in Canada, but also through certain foreign centres. Although the volume of such operations abroad represents a sizable portion of global liquidity management, the Bank’s liquidity management is centralized. By organizing liquidity, funding and pledging activities within Corporate Treasury, the Bank can better coordinate enterprise-wide funding and risk monitoring activities. All internal funding transactions between Bank entities are controlled by Corporate Treasury.
This centralized structure streamlines the allocation and control of liquidity management, funding and pledging limits, since most (in particular the liquidity ratios) apply on a consolidated basis. Nonetheless, the Liquidity, Funding and Pledging Policy contains special provisions for the financial centres that are most active in terms of institutional funding and sets limits and monitoring thresholds for secured and unsecured short-term funding, both in absolute value and materiality.
The Bank’s funds transfer pricing system prices liquidity by allocating the cost or income to the various business segments. Liquidity costs are allocated to liquidity-intensive activities, mainly long-term loans, and commitments to extend credit and less liquid securities as well as strategic investments. The liquidity compensation is credited to the suppliers of funds, primarily funding in the form of stable deposits from the Bank’s distribution network.
Short-term day-to-day funding decisions are based on a daily cumulative net cash position, which is controlled using liquidity ratio limits. Among these ratios and metrics, the Bank pays particular attention to the funds obtained on the wholesale market and to cumulative cash flows over various time horizons.
Moreover, the Bank’s collateral pledging activities are monitored on a daily basis in relation to the different limits set by the Bank and are subject to monthly stress tests using a series of simulations. In particular, the Bank uses various scenarios to estimate the potential amounts of additional collateral that would be required in the event of a downgrade to the Bank’s credit rating.
The Bank also regularly monitors unencumbered securities outstanding in proportion to unsecured institutional market funding due in less than one year. The Bank must hold unencumbered liquid assets equal to at least the total amount of unsecured institutional market funds maturing within one year, taking into account the potential downward market volatility of the assets by applying prudent “haircuts” to the value of these securities.
Liquidity risk can be assessed in many different ways using different liquidity indicators. One of the key monitoring tools of liquidity risk is the Bank’s survival period based on contractual maturity and behavioural assumptions applied to balance sheet items as well as off-balance-sheet commitments.

MANAGEMENT’S DISCUSSION AND ANALYSIS RISK MANAGEMENT
84 National Bank of Canada 2014 Annual Report
Stress Testing and Crisis Scenarios Survival period measures, using various simulations, the number of months it would take to completely utilize the Bank’s liquid assets if the Bank were to lose deposits prematurely or if funds from wholesale markets were not renewed at maturity. It is measured monthly using three scenarios. These scenarios were developed to assess sensitivity to a Bank-specific or systemic crisis. Deposit loss simulations are carried out based on their degree of stability, while the value of certain assets is encumbered by an amount reflecting their readiness for liquidation in a crisis. These stress test scenarios are reviewed and submitted to the Board once a year for approval.
The Bank considers, among its simulations, a severe liquidity crisis scenario, where the Bank experiences difficulties in a turbulent financial market. This scenario combines a significant limitation in the access to its funding channels and a significant decrease of its assets’ marketability.
The stress test results provide the Bank with its potential liquidity requirements under each scenario and, given the liquidity risk tolerance level adopted, allow the Bank to manage unwanted risk. Each scenario has its own set of underlying assumptions that cover a wide range of aspects, including haircuts, encumbrance on liquid assets, loss of deposits, collateral usage and assets pledged. It also includes an estimate of the funding needs of contingent liabilities. Contingent liquidity risk refers to the possibility that the Bank needs a significant amount of funding due to events such as an unexpected increase in drawdowns on committed lines, withdrawal of deposits, increase in collateral requirements or other triggers embedded in legal documentation.
The following assumptions underlie the scenarios.
— Non-renewal at maturity for most of the Bank’s unsecured wholesale funding.
— Non-renewal for a portion of the retail and commercial deposits. — Partial renewal of loans. — No inflows from demand loans or collections of minimum payments. — Drawdowns on committed lines. — Additional collateral required for the Bank in the event of a credit rating
downgrade. — Limited access to the foreign exchange market.
The results of these stress tests are reviewed on a monthly basis by designated committees while the Board reviews the results each quarter.
Lastly, the Bank maintains an up-to-date, comprehensive financial contingency and crisis recovery plan that describes the measures to be taken in the event of a critical liquidity situation. This plan is reviewed and approved annually by the Board as part of business continuity and recovery planning. See the Regulatory Risk Management section for additional information. Liquidity Risk Tolerance The Bank monitors and manages its risk tolerance through liquidity limits, ratios and stress scenarios. The Bank’s liquidity risk tolerance is articulated around the following three axes.
— Ensure the Bank has a sufficient amount of unencumbered liquid assets to cover its financial requirements.
— Ensure the Bank keeps a liquidity buffer above the minimum regulatory requirement.
— Ensure the Bank maintains diversified funding products. Liquid Assets To protect depositors and creditors from unexpected crisis situations, the Bank holds a portfolio of unencumbered liquid assets that can be readily liquidated to meet financial obligations. This portfolio consists of highly liquid securities, most of which are issued or guaranteed by governments, and of cash loans maturing in less than 30 days. The majority of unencumbered liquid assets are held in Canadian or U.S. dollars. Moreover, all assets that can be quickly monetized are considered liquid assets. The Bank does not consider any central bank’s emergency liquidity facilities in its liquidity buffer. For additional information, see the following table on encumbered and unencumbered assets.

MANAGEMENT’S DISCUSSION AND ANALYSIS RISK MANAGEMENT
National Bank of Canada 85 2014 Annual Report
Liquid Asset Portfolio As at October 31 (millions of Canadian dollars) 2014 2013
Bank-owned
liquid assets(1)
Liquid
assets received(2)
Total liquid assets
Encumbered liquid assets(3)
Unencumbered liquid assets
Unencumbered liquid assets
Cash and deposits with financial institutions 8,086 8,086 1,054 7,032 3,289 Securities Issued or guaranteed by Canada, U.S. Treasury, other U.S. agencies and other foreign governments 13,806 23,255 37,061 27,041 10,020 10,964 Issued or guaranteed by provinces 12,275 12,045 24,320 20,100 4,220 3,615 Issued or guaranteed by municipalities and school boards 1,088 160 1,248 92 1,156 682 Other debt securities 4,102 1,181 5,283 1,106 4,177 2,365 Equity securities 20,441 31,869 52,310 32,957 19,353 16,092 Loans Securities backed by insured residential mortgages 2,221 2,221 619 1,602 620 62,019 68,510 130,529 82,969 47,560 As at October 31, 2013 57,310 58,757 116,067 78,440 37,627
As at October 31 (millions of Canadian dollars) 2014 2013
Unencumbered liquid assets by entity National Bank (parent) 32,104 26,096 Domestic subsidiaries 7,882 8,475 Foreign subsidiaries and branches 7,574 3,056
47,560 37,627
As at October 31 (millions of Canadian dollars) 2014 2013
Unencumbered liquid assets by currency Canadian dollar 29,091 24,274 U.S. dollar 17,719 12,840 Other currencies 750 513 47,560 37,627
Liquid Asset Portfolio – Average(4)
(millions of Canadian dollars) Year ended October 31, 2014
Bank-owned
liquid assets(1)
Liquid
assets received(2)
Total liquid assets
Encumbered liquid assets(3)
Unencumbered liquid assets
Cash and deposits with financial institutions 7,459 7,459 174 7,285
Securities Issued or guaranteed by Canada, U.S. Treasury, other U.S. agencies and other foreign governments 17,478 21,942 39,420 29,457 9,963
Issued or guaranteed by provinces 12,665 11,593 24,258 20,113 4,145
Issued or guaranteed by municipalities and school boards 826 175 1,001 118 883
Other debt securities 3,480 1,202 4,682 1,521 3,161
Equity securities 19,842 29,034 48,876 30,837 18,039
Loans Securities backed by insured residential mortgages 2,029 2,029 657 1,372
63,779 63,946 127,725 82,877 44,848
(1) Bank-owned liquid assets include assets for which there are no legal or geographic restrictions. (2) Securities received as collateral with respect to securities financing and derivative transactions and securities purchased under reverse repurchase agreements and securities borrowed. (3) In the normal course of its funding activities, the Bank pledges assets as collateral in accordance with standard terms. Encumbered liquid assets include assets used to cover short sales,
obligations related to securities sold under repurchase agreements and securities loaned, guarantees related to security-backed loans and borrowings, collateral related to derivative financial instrument transactions, asset-backed securities and untransferred but legally restricted amounts.
(4) The average is based on the sum of the end-of-period balances of the 12 months of the year divided by 12.

MANAGEMENT’S DISCUSSION AND ANALYSIS RISK MANAGEMENT
86 National Bank of Canada 2014 Annual Report
Summary of Encumbered and Unencumbered Assets (millions of Canadian dollars) As at October 31, 2014
Encumbered
assets(1)
Unencumbered assets Total
Encumbered assets as %
of total assets
Pledged as
collateral Other(2) Available as
collateral Other(3)
Cash and deposits with financial institutions 40 1,014 7,032 8,086 0.5
Securities 18,743 400 32,569 1,241 52,953 9.3
Securities purchased under reverse repurchase
agreements and securities borrowed 18,168 6,357 24,525 8.8
Loans, net of allowances 25,631 1,602 70,010 97,243 12.5
Customers' liability under acceptances 8,926 8,926
Derivative financial instruments 7,092 7,092
Due from clients, dealers and brokers 861 861
Investments in associates and joint ventures 697 697
Premises and equipment 380 380
Goodwill 1,272 1,272
Intangible assets 998 998
Other assets 2,396 2,396
Total 44,414 19,582 47,560 93,873 205,429 31.1
(millions of Canadian dollars) As at October 31, 2013(4)
Encumbered
assets(1)
Unencumbered assets Total
Encumbered assets as %
of total assets
Pledged as
collateral Other(2) Available as
collateral Other(3)
Cash and deposits with financial institutions 48 259 3,289 3,596 0.2
Securities 21,205 31,178 1,361 53,744 11.3
Securities purchased under reverse repurchase
agreements and securities borrowed 18,909 2,540 21,449 10.0
Loans, net of allowances 20,266 620 67,498 88,384 10.8
Customers' liability under acceptances 8,954 8,954
Derivative financial instruments 5,904 5,904
Due from clients, dealers and brokers 1,101 1,101
Investments in associates and joint ventures 684 684
Premises and equipment 404 404
Goodwill 1,064 1,064
Intangible assets 898 898
Other assets 2,037 2,037
Total 41,519 19,168 37,627 89,905 188,219 32.3
(1) In the normal course of its funding activities, the Bank pledges assets as collateral in accordance with standard terms. Encumbered assets include assets used to cover short sales, obligations related to securities sold under repurchase agreements and securities loaned, guarantees related to security-backed loans and borrowings, collateral related to derivative financial instrument transactions, asset-backed securities, residential mortgage loans securitized and transferred under the Canada Mortgage Bond program, assets held in consolidated trusts supporting the Bank’s funding activities and mortgage loans transferred under covered bond programs.
(2) Other encumbered assets include assets for which there are restrictions and therefore cannot be used for collateral or funding purposes as well as assets used to cover short sales. (3) Other unencumbered assets are assets that cannot be used for collateral or funding purposes in their current form. This category includes assets that are potentially eligible as funding
program collateral (for example, Canada Mortgage and Housing Corporation insured mortgages that can be securitized into mortgage-backed securities under the National Housing Act (Canada)).
(4) Certain amounts have been adjusted to reflect changes in accounting standards. See Note 2 to the consolidated financial statements.

MANAGEMENT’S DISCUSSION AND ANALYSIS RISK MANAGEMENT
National Bank of Canada 87 2014 Annual Report
Regulatory Environment The regulatory environment has evolved significantly since the financial crisis. The Bank is working closely with national regulators to implement regulatory liquidity standards.
In February 2012, OSFI issued an update of its guideline on liquidity management to financial institutions. The revised guideline was developed based on the BCBS’s Principles for Sound Liquidity Risk Management and Supervision.
In April 2013, the BCBS issued a paper on intraday liquidity entitled Monitoring tools for intraday liquidity management. The intent of this document is to provide guidance for banks on their management of intraday liquidity risk and ability to meet payment and settlement obligations on a timely basis. The implementation schedule proposed ranges from January 2015 to January 2017 at the latest.
On May 30, 2014, OSFI issued its final Liquidity Adequacy Requirements (LAR) guideline. The LAR guideline is the new liquidity framework proposed by OSFI. It contains the following six chapters: Overview, Liquidity Coverage Ratio (LCR), Net Stable Funding Ratio (NSFR), Net Cumulative Cash Flow (NCCF), Liquidity Monitoring Tools and Intraday Liquidity Monitoring Tools. The Net Cumulative Cash Flow (NCCF) metric is defined as a monitoring tool that calculates survival period. It is based on the assumptions of a stress scenario prescribed by OSFI that aims to represent a combined systemic and bank-specific crisis. The LAR guideline will be reviewed annually to reflect both international and domestic regulatory developments.
In July 2014, OSFI also issued Public Disclosure Requirements for Domestic Systemically Important Banks on Liquidity Coverage Ratio, a guideline based on the BCBS’s final LCR rules that prescribe a common disclosure framework with standardized formats across the banking industry. The Canadian D-SIBs are required to implement the LCR Disclosure Standards by the second quarter of 2015.
Lastly, on August 1, 2014, Department of Finance Canada issued, for public comment, a consultation paper entitled Taxpayer Protection and Bank Recapitalization Regime that describes a proposed bail-in regime applicable to D-SIBs. The Bank is currently assessing the impact of adopting this regime. Intraday Liquidity The Bank manages its intraday liquidity in such a way that the amount of available liquidity exceeds its maximum intraday liquidity requirements. The Bank monitors its intraday liquidity on an hourly basis and the evolution is presented monthly to the Liquidity and Funding Committee.
Funding Risk Funding risk is defined as the risk to the Bank’s ongoing ability to raise sufficient funds to finance actual or proposed business activities on an unsecured or secured basis at an acceptable price. The Bank maintains a good balance of its funding through appropriate diversification of its unsecured funding vehicles, securitization programs and secured funding. The Bank also diversifies its funding by currency, geography and maturity. The funding management priority is to achieve the optimal balance between the deposit liabilities of the Bank’s retail network, secured funding and unsecured funding. This brings optimal stability to the funding and reduces vulnerability to unpredictable events.
The Bank’s retail network deposits are its primary and most stable source of funding. Stable funds are used to fund Bank activities, whereas funds from the wholesale markets are used to fund securities. In order to maintain the ideal funding profile, the Bank seeks to limit short-term wholesale funding and is careful to diversify its funding sources. The Bank seeks to diversify its funding sources by geographic location, currency, instrument, maturity and depositor. In addition, the Bank is actively involved in securitization programs (residential mortgages and credit card receivables) that diversify its access to long-term funding.
Funding and liquidity levels remained sound and robust over the year and the Bank does not foresee any event, commitment or demand that might have a significant impact on its liquidity risk position. For additional information, see the table entitled Residual Contractual Maturities of Balance Sheet Items and Off-Balance-Sheet Commitments in Note 30 to the consolidated financial statements. Credit Ratings The credit ratings assigned by ratings agencies represent their assessment of the Bank’s credit quality based on qualitative and quantitative information provided to them. Credit ratings may be revised at any time based on macro-economic factors or on the current and projected financial condition of the Bank. Credit ratings are one of the main factors that influence the Bank’s ability to access financial markets at a reasonable cost. A downgrade in the Bank’s credit ratings would likely adversely affect the cost, size and term of future funding. Following the issuance by Department of Finance Canada of a consultation paper on a proposed bail-in regime, certain credit rating agencies have lowered their outlook for all Canadian D-SIBs. The following table presents the Bank’s credit ratings, as per four agencies, as at October 31, 2014.
Moody’s S&P DBRS Fitch
Short-term senior debt P-1 A-1 R-1 (mid) F1 Canadian commercial paper A-1 (mid) Long-term senior debt Aa3 A AA (low) A+ Subordinated debt Baa1 BBB+ A (high) A Preferred shares Baa3 P-2(low) Pfd-2 BBB- NVCC preferred shares Baa3 P-3(high) Pfd-2 (low)
Rating outlook Negative(1) Negative Stable Stable
(1) Outlook for long-term senior debt was lowered from stable to negative.

MANAGEMENT’S DISCUSSION AND ANALYSIS RISK MANAGEMENT
88 National Bank of Canada 2014 Annual Report
Collateral As part of a comprehensive liquidity management framework, the Bank regularly reviews its contracts that stipulate that additional collateral could be required in the event of a downgrade of the Bank’s credit rating. The Bank’s liquidity position management already incorporates additional collateral requirements in the event of a one-notch to three-notch downgrade. The table below presents the additional collateral requirements in the event of a one-, two- or three-notch credit rating downgrade. (millions of Canadian dollars) As at October 31, 2014
One-notch
downgrade Two-notch
downgrade Three-notch downgrade
Derivatives(1) 19 33 143 Other(2) 199 199
(1) Contractual requirements related to agreements known as Credit Support Annexes. (2) Contractual requirements related to a margin funding facility related to the MAV
conduits.
Funding Strategy The key objectives of the funding strategy are to:
— Support the organic growth of the Bank through prudent liquidity and funding management to withstand severe stresses.
— Fund core banking activities with deposits and securitizations. — Limit short-term wholesale funding.
To do so, the Bank actively monitors and controls liquidity risk
exposures and funding needs within and across legal entities, business segments and currencies. The process involves evaluating the liquidity position of individual business segments in addition to that of the Bank as a whole as well as the liquidity risk from raising unsecured and secured funding in foreign currencies. The funding strategy is executed through the funding plan. The Bank’s funding framework consists of the following:
— Maintaining active access to wholesale funding markets and ensuring diversification by depositor, funding vehicle type, geographic location, currency, and tenor of funding in the secured and unsecured markets.
— Monitoring and controlling liquidity risk exposure and funding needs across all the Bank’s entities, business segments and currencies using a well-developed fund transfer pricing system that includes a liquidity premium.
— Having funding teams in Montreal, Toronto, New York and London offices.
— Investing in infrastructure to ensure quality and timeliness in data transmission.
— Integrating the regulatory framework in day-to-day liquidity management and the long-term funding plan.
The chart below shows the Bank’s funding structure as at October 31, 2014.
Assets ($205.4 billion) Liabilities and equity ($205.4 billion) (1) This category comprises term debt funding products, marketable or non-marketable. (2) This category comprises securities purchased under reverse repurchase agreements and
securities borrowed. (3) This category comprises subordinated debt and equity.
The Bank’s balance sheet is well diversified and is aligned with the
funding strategy. The core banking activities are funded entirely through personal and commercial deposits and through securitization programs. Wholesale funding is invested in cash and securities.
Other liabilities: 5%
Capital(3): 6%
Personal deposits: 22%
Business and government deposits: 18%
Bankers' acceptances: 4%
Securitization and covered bonds: 12%
Short sales: 9%
Secured funding: 8%
Unsecured funding(1): 16%
Other assets: 6%
Residential mortgages: 19%
Personal and credit card loans: 15%
Business and government loans: 14%
Bankers' acceptances: 4%
Cash and other(2): 16%
Securities: 26%

MANAGEMENT’S DISCUSSION AND ANALYSIS RISK MANAGEMENT
National Bank of Canada 89 2014 Annual Report
Diversified Funding Sources The purpose of diversification by source, geographic location, currency, instrument, maturity and depositor is to mitigate liquidity and funding risk by ensuring that the Bank has in place alternative sources of funds that strengthen its capacity to withstand a variety of severe yet plausible institution-specific and market-wide shocks. To meet this objective, the Bank:
— Takes funding diversification into account in the business planning process.
— Maintains a variety of funding programs to access different markets. — Sets Board-approved limits on funding concentration. — Maintains strong relationships with fund providers. — Is active in various funding markets of all tenors. — Identifies and monitors the main factors that affect the ability to raise
funds.
The Bank is active in the following funding programs:
— Canadian dollar Senior Unsecured Debt; — U.S. dollar Senior Unsecured Debt; — Canadian Medium Term Note Shelf; — U.S. dollar Commercial Paper program; — U.S. dollar Certificates of Deposit; — Euro Medium Term Note program; — Canada Mortgage and Housing Corporation securitization programs; — Canadian Credit Card Trust; and — Legislative Covered Bond program.
The table below presents the remaining contractual maturities of the Bank’s wholesale funding. The information has been presented in accordance with the categories recommended by the EDTF for comparison purposes with other banks.
Residual Contractual Maturities of Wholesale Funding(1) (millions of Canadian dollars) As at October 31, 2014
1 month or less
Over 1 month to 3 months
Over 3 months to 6 months
Over 6 months to
12 months
Subtotal 1 year or less
Over 1 year to 2 years
Over 2 years Total
Deposits from banks(2) 8,491 650 39 18 9,198 35 66 9,299 Certificates of deposit and commercial paper(3) 141 1,222 630 6,003 7,996 1,330 1,014 10,340 Asset-backed commercial paper Senior unsecured medium-term notes(4) 1,314 529 3,281 5,124 2,223 5,233 12,580 Senior unsecured structured notes 25 81 55 47 208 580 788 Covered bonds and asset-backed securities Mortgage securitization 7 335 405 383 1,130 2,223 13,726 17,079 Covered bonds 2,260 2,809 5,069 Securitization of credit card receivables 330 950 1,280 1,280 Subordinated liabilities(5) 352 352 515 1,014 1,881 Other 8,664 3,954 1,988 10,682 25,288 8,586 24,442 58,316 Secured funding 7 335 735 1,333 2,410 4,483 16,535 23,428 Unsecured funding 8,657 3,619 1,253 9,349 22,878 4,103 7,907 34,888 8,664 3,954 1,988 10,682 25,288 8,586 24,442 58,316
As at October 31, 2013 3,863 3,368 2,257 2,808 12,296 11,641 21,570 45,507
(1) Bankers’ acceptances are not included in this table. (2) Deposits from banks correspond to all term deposits made by financial institutions such as banks, broker-dealers, pension funds, trusts and other institutions. (3) Includes bearer deposit notes. (4) Certificates of deposit denominated in euros are included in senior unsecured medium-term notes. (5) Subordinated debt is presented in this table but the Bank does not consider it as part of its wholesale funding.

MANAGEMENT’S DISCUSSION AND ANALYSIS RISK MANAGEMENT
90 National Bank of Canada 2014 Annual Report
Operational Risk Management
Operational risk is the risk of loss resulting from an inadequacy or a failure ascribable to people, processes, technology or external events. Operational risk exists for every Bank activity. Theft, fraud, unauthorized transactions, system errors, human error, amendments to or misinterpretation of laws and regulations, litigation or disputes with clients or property damage are just a few examples of events likely to cause financial loss, harm the Bank’s reputation or lead to punitive damages or regulatory penalties or sanctions.
Although operational risk cannot be eliminated entirely, it can be managed in a thorough and transparent manner to keep it at an acceptable level. The Bank’s operational risk management framework is built on the concept of three lines of defence and provides a clear allocation of responsibilities to all levels of the organization, as mentioned below.
Operational Risk Management Framework By identifying, assessing and monitoring operational risk, business units and corporate units can:
— recognize and understand the inherent and residual risks to which their activities and operations are exposed;
— identify measures for keeping such risks at an acceptable level; and — manage the risks proactively and continuously.
The main tools developed for purposes of this framework are described below. Collection and Analysis of Data on Operational Losses Incurred by the Bank The Operational and Reputation Risk Unit applies a process, across the Bank and its subsidiaries, for collecting and compiling data on internal operational losses. This data is indexed in a centralized database and includes the amount of each loss, the type of risk involved, a description of the event that caused the loss, and the date of the loss, making it possible to better understand the fundamental causes of this type of loss and develop mitigation strategies. During fiscal 2014, there were no material losses resulting from an operational risk event. Collection and Analysis of Data on External Operational Events Observed in the Financial Industry The Bank collects and analyzes information reported in the media on significant operational events experienced by other financial institutions in order to assess the effectiveness of its own operational risk management practices and reinforce them, if necessary.
Operational Risk Self-Assessment The operational risk self-assessment program gives each business unit and corporate unit the means to proactively identify new or major operational risks to which they are exposed, evaluate the effectiveness of mitigating controls, and develop action plans to keep such risks at acceptable levels. Key Risk Indicators The business units and corporate units define key indicators associated with their main operational risks. The key indicators are used to monitor operational risk profiles and are related to critical thresholds that, once reached, result in action by management. Using key risk indicators, the business units and corporate units can track risks and proactively detect any adverse change in risk exposure. Specialized Risk Assessment Programs Certain specialized groups have implemented programs with their own risk- specific policies and procedures as well as oversight mechanisms to ensure they are adhered to. Such specialized programs exist for managing:
— financial reporting risk; — technological and information security risks; — business continuity; — outsourcing risk; — fraud risk; — model risk management; — review and approval of new products and activities; and — information confidentiality. Operational Risk Reports and Disclosures The Operational and Reputation Risk Unit regularly reports to the Operational Risk Management Committee, to the GRC, and to the RMC on the status of operational risk across the Bank, on the measures taken with respect to the risks, and on the material exposures to losses and emerging risks in order to ensure management accountability and attention is maintained over current and emerging issues. This reporting enhances the transparency and proactive management of major operational risk factors. Insurance Program In order to protect itself against any material losses related to its exposure to unforeseeable operational risks, the Bank also has adequate insurance, the nature and amount of which meet its coverage requirements.

MANAGEMENT’S DISCUSSION AND ANALYSIS RISK MANAGEMENT
National Bank of Canada 91 2014 Annual Report
Regulatory Risk Management
Regulatory risk is the risk of consequences arising from a failure to meet regulatory requirements. A non-compliance situation occurs when the Bank or one of its employees fails to comply with the regulatory requirements in effect where the Bank does business. Regulatory risk is present in all of the daily operations of each Bank segment. A regulatory non-compliance situation can adversely affect the Bank’s reputation and result in penalties, fines and sanctions or increased oversight by regulators.
The Bank operates in a highly regulated industry. The diversity of its activities and its geographical reach in Canada and abroad add to this complexity, since its operations are overseen by various regulatory bodies and self-regulatory organizations. Organizational Structure of Compliance The Senior Vice-President, Legal Affairs, Chief Compliance Officer (CCO) oversees the compliance program for all the Bank’s segments. The Chief Anti-Money Laundering Officer (CAMLO) reports directly to the CCO. Sound Management of Regulatory Risk The Bank ensures sound regulatory risk management by using a proactive approach and emphasizing the integration of regulatory requirements in its day-to-day operations as well as ongoing communication to remind its employees of the importance of complying with laws and regulations.
Regulatory risk management ensures that events stemming from regulatory non-compliance that could have an impact on the Bank’s activities and reputation are proactively identified and understood and that mitigating strategies are implemented. It also allows the Bank to obtain reasonable assurance that it is in compliance, in all material respects, in both Canada and internationally, with the legislation, regulations, principles, standards, directives, guidelines, decisions, recommendations, codes of practice and voluntary commitments relevant to its operations.
The implementation of a regulatory risk management framework across the Bank is entrusted to the Compliance Service, which has the following mandate.
— Make sure that policies and procedures that ensure compliance with the regulations in effect in all territories where the Bank and its subsidiaries operate, including regulations related to money laundering and terrorist financing activities, are in place and operational.
— Develop compliance training and information programs for employees of the Bank and its subsidiaries.
— Exercise independent oversight of Bank and subsidiary compliance with the policies and procedures.
— Refer relevant matters with respect to compliance and money laundering and terrorist financing to the Bank’s Board.
The Bank holds itself to high regulatory risk management standards in
order to earn the trust of its clients, its shareholders, the market and the general public.
Recovery and Resolution Planning As part of the regulatory measures used to manage systemic risks, D-SIBs are also required to have in place sufficient recovery and resolution plans. A recovery plan is essentially a road map that guides the recovery of a Bank in the event of severe financial stress; conversely, a resolution plan guides its orderly wind-down in the event of failure when recovery is no longer an option. The Bank began its recovery and resolution planning in 2010 and updates its plans periodically for submission to its domestic regulatory authorities. Over the next year, the focus will be on documenting a resolution plan with the Canada Deposit Insurance Corporation (CDIC) that would ensure orderly winding down of the Bank’s operations. Regulatory Changes Changes in the regulatory or legal framework are a significant potential risk factor for the Bank. Various laws, regulations and other guidelines have been introduced by governments and regulatory bodies to protect the interests of the general public as well as the Bank’s clients, employees and shareholders. Changes to these laws, regulations and other guidelines, including those that affect how they are interpreted and applied, could have a significant impact on the Bank. In particular, such changes could limit its product and service offering or enhance its competitors’ ability to rival the Bank’s offering with their own. Also, in spite of the precautions the Bank takes to prevent such an eventuality, failure to comply with laws, regulations and other guidelines could give rise to penalties and fines likely to have an adverse impact on its financial results and reputation.
Below are some significant regulatory changes that have affected the Bank’s activities. Regulatory Capital and Liquidity Reforms In order to promote a more resilient banking sector and strengthen global capital standards, tighter global rules for bank regulatory capital and liquidity were introduced by the BCBS through Basel III and implemented domestically. In Canada, the capital rules changes were implemented in January 2013 and liquidity rules will begin phasing in during 2015. For additional information, refer to the Capital Management and Liquidity Risk Management sections of this MD&A. Increased Regulatory Oversight for D-SIBs Since six major Canadian banks were designated as Domestic Systemically Important Banks (D-SIBs) in March 2013, regulatory oversight has increased. The regulators are paying close attention to the approaches used for the determination of capital ratios, to stress test scenarios, to the establishment of a strict risk appetite framework, to recovery and resolution planning (Living Will) and to the implementation of effective anti-cyberterrorism measures. The Bank is making every effort to meet the regulatory requirements and is incorporating these initiatives into its day-to-day business management.

MANAGEMENT’S DISCUSSION AND ANALYSIS RISK MANAGEMENT
92 National Bank of Canada 2014 Annual Report
Risk Data Aggregation and Reporting In order to strengthen risk data aggregation and risk reporting practices, the BCBS issued new principles for effective risk data aggregation and reporting in January 2013. Designated D-SIBs are required to implement these new standards by December 31, 2016. Over-The-Counter (OTC) Derivatives Reforms OTC derivatives market reforms have introduced significant changes to capital requirements, regulatory framework and market infrastructures. The most significant changes relate to the requirement to clear OTC derivatives through central counterparties and the higher capital requirements for transactions that are not cleared by qualifying central counterparties. The reforms also cover financial requirements and business conduct rules. Anti-Money Laundering and Anti-Terrorism Financing (AML/ATF) Canada is preparing for a 2015 evaluation of its AML/ATF regime by the Financial Action Task Force (FATF). In its latest budget, the federal government tabled regulatory changes that will increase the already stringent AML/ATF requirements. In the years ahead, banks must prepare for significant changes to anti-money laundering measures. Foreign Account Tax Compliance Act (FATCA) To combat tax evasion, the U.S. authorities have adopted the Foreign Account Tax Compliance Act (FATCA), which took effect on July 1, 2014. The United States is requiring foreign financial institutions to disclose accounts held by Americans who should be paying U.S. income tax. To facilitate the implementation of these rules, the U.S. government negotiated intergovernmental agreements. Canada signed such an agreement in February 2014. Canada’s Anti-Spam Legislation The Fighting Internet and Wireless Spam Act (Canada), which sets out legislative provisions on the distribution of commercial electronic messages, has gradually been coming into force since July 2014. Going forward, an electronic message with a commercial purpose may be sent to clients or potential clients only if they have provided their consent to the Bank or its subsidiaries and only if the message contains prescribed information and offers an unsubscribe mechanism. Violations of this Act could result in penalties of up to $10 million per violation. The Act also sets out provisions prohibiting unauthorized installation of computer programs and a private right of action, which will take effect on January 15, 2015 and July 1, 2017, respectively.
Reputation Risk Management
Reputation risk is the risk that the Bank’s operations or practices will be judged negatively by the public, whether that judgment is with or without basis, thereby adversely affecting the perception, image or trademarks of the Bank, potentially resulting in costly litigation or loss of income. Reputation risk generally arises from a deficiency in managing another risk. The Bank’s reputation may, for example, be adversely affected by non-compliance with laws and regulations or by process failures. All risks must therefore be managed effectively in order to protect the Bank’s reputation.
The Bank seeks to ensure that its employees are constantly aware of the potential repercussions of their actions on the Bank’s reputation and image. In addition to the previously discussed operational risk management initiatives, a variety of mechanisms are in place to support sound reputation risk management, including codes of professional conduct applicable to all employees, policies regarding ethics and corporate governance and appropriate training programs.
The Bank also has a policy, approved by the Board, that covers reputation risk stemming from complex structured financing transactions and other transactions that may give rise to reputation issues. The policy sets the reputation risk management rules and practices applicable to these transactions. The policy is complemented by the special provisions of the new products and activities policy, which determines the approvals required by the various committees that assess risk whenever new products or activities are introduced within the business units. These provisions are intended, among other things, to provide oversight for the management of reputation risk, which may be material for such products or activities. The new products and activities policy requires that any new product or activity for which reputation risk is determined to be high be submitted to the Global Risk Committee for approval.
The activities of the Compliance Service, Legal Affairs Department, Corporate Secretary’s Office, Public Relations Department and Investor Relations Department complete the reputation risk management framework.
Environmental Risk Management
Environmental risk is the risk of a loss or of damage to the Bank’s reputation arising from environmental concerns related to the Bank or its clients. Environmental risk is often associated with credit risk and operational risk.
Environmental risk means any impact of environmental problems that leads to a loss of financial or operational value or affects the Bank’s reputation. This risk arises from commercial and operating activities. For example, environmental issues related to the purchase or sale of contaminated properties by clients of the Bank or the deployment of large-scale projects could expose the Bank to credit and reputation risk. The Bank would also be forced to deal with operational risk and the risk related to the legal environment when environmental issues arise in its branches or administrative offices.
In this context, the Risk Management Group develops requirements that are prescribed in its internal policies in order to reveal, assess, control and monitor environmental risk. For their part, the business segments and corporate units must integrate requirements and controls related to the management of environmental risk in their activities. The Risk Management Group monitors its application and regularly reviews the standards.

MANAGEMENT’S DISCUSSION AND ANALYSIS
National Bank of Canada 93 2014 Annual Report
OTHER RISK FACTORS In addition to the risks described in the Risk Management section, other risk factors may have an impact on the Bank’s future results. International Risks Through the operations of certain units and subsidiaries in Canada and abroad (in particular, Credigy Ltd.), the Bank is exposed to the risks related to its presence in international markets or foreign jurisdictions. Although these risks do not affect a significant proportion of the Bank’s portfolios, their impact must not be overlooked, especially those that are of a legal or regulatory nature. Such risk can be particularly high when the exposure is in a territory where the enforceability of agreements signed by the Bank is uncertain, in countries and regions facing political or socio-economic disturbances, or in countries that may be subject to international sanctions. Generally speaking, there are many ways in which the Bank may be exposed to the risks posed by other countries, not the least of which being foreign laws and regulations. In all such situations, it is important to consider what is referred to as “country risk,” which affects not only the activities that the Bank carries out abroad, but also the business that it conducts with non-resident clients as well as the services it provides to clients doing business abroad, such as electronic funds transfers and international products.
As part of its program to combat money laundering and terrorist financing (MLTF), the Bank audits country risk, which in particular involves classifying countries into three MLTF-risk levels and applying, in accordance with the Bank’s various policies, restrictions of varying severity depending on the classification of a particular country.
The Bank is exposed to financial risks outside Canada and the United States primarily through its interbank transactions on international financial markets or through international trade finance activities. This geographic exposure, which represents a moderate proportion of the Bank’s total risk, is mainly concentrated in Europe and is subject to quarterly reporting in the Supplementary Financial Information report. To control country risk, the Bank sets credit concentration limits by country and reviews and submits them to the Board for approval upon renewal of the Credit Risk Management Policy. These limits, which are based on a percentage of the Bank’s regulatory capital, are proportionate to the level of risk represented by each country, particularly emerging countries. The risk is rated using a classification mechanism similar to the one used for credit default risk. In addition to the country limits per se, authorization caps and limits are established, as a percentage of capital, for the world’s high-risk regions, i.e., essentially all regions except for North America, Western European countries and the developed countries of Asia. Level of Competition The extent of competition in the markets where the Bank operates has an impact on its performance. Retaining clients hinges on several factors, including the price of products and services, quality of service, and changes to the products and services offered.
Acquisitions The Bank’s ability to successfully complete an acquisition is often conditional on regulatory approval, and the Bank cannot be certain when or under what conditions, if any, approval will be granted. Acquisitions may affect future results depending on any difficulties the Bank experiences in integrating the acquired business. If the Bank or its subsidiary encounters difficulty in integrating the acquired business, maintaining the appropriate level of governance over the acquired business, or retaining key officers within the acquired business, these factors could prevent the Bank from realizing expected revenue growth, cost savings, market share gains and other projected benefits from the acquisition. Ability to Attract and Retain Key Officers The Bank’s future performance depends largely on its ability to attract and retain key officers. There is intense competition for the best people in the financial services industry, and there is no assurance that the Bank, or any entity it acquires, will be able to continue to attract and retain key officers. Judicial and Regulatory Proceedings The Bank takes reasonable measures to comply with the laws and regulations in effect in the jurisdictions where it operates. Should these measures prove ineffective, the Bank could be subject to judicial or regulatory decisions resulting in fines, damages, or other costs or to restrictions likely to adversely affect its net income and damage its reputation. The Bank may also be subject to litigation in the normal course of business. Although the Bank establishes provisions for the measures it is subject to under accounting requirements, actual losses resulting from such litigation could differ significantly from the recognized amounts, and unfavourable outcomes in such cases could have a significant adverse effect on the Bank’s financial results. The resulting reputational damage could also affect the Bank’s future business prospects. For additional information on this matter, see Note 26 to the consolidated financial statements. Accounting Policies, Methods and Estimates Used by the Bank The accounting policies and methods used by the Bank determine how the Bank reports its financial position and operating results and may require management to make estimates or rely on assumptions about matters that are inherently uncertain. Any changes to these estimates and assumptions may have a significant impact on the Bank’s operating results and financial position. Other Factors Other factors that could affect the Bank’s future results include amendments to tax legislation, unexpected changes in consumer spending and saving habits, technological advances, the timely development and launch of new products and services, the ability to successfully align its organizational structure, resources and processes, the ability to activate a business continuity plan within a reasonable time, the potential impact of international conflicts or natural catastrophes on the Bank’s activities, and the Bank’s ability to foresee and effectively manage the risks associated with these factors through rigorous risk management.

MANAGEMENT’S DISCUSSION AND ANALYSIS
94 National Bank of Canada 2014 Annual Report
ADDITIONAL FINANCIAL INFORMATION
TABLE 1 – QUARTERLY RESULTS (millions of Canadian dollars, except per share amounts) 2014
Total Q4 Q3 Q2 Q1
Statement of income data Net interest income 2,544 641 640 649 614 Non-interest income 2,920 723 820 627 750 Total revenues 5,464 1,364 1,460 1,276 1,364 Provisions for credit losses 208 57 49 51 51 Non-interest expenses 3,423 929 879 799 816 Income taxes 295 48 91 64 92 Net income 1,538 330 441 362 405 Non-controlling interests 69 18 18 17 16 Net income attributable to the Bank's shareholders 1,469 312 423 345 389
Earnings per common share(2) Basic $ 4.36 $ 0.92 $ 1.26 $ 1.02 $ 1.16 Diluted 4.32 0.91 1.24 1.01 1.15 Dividends (per share) Common(2) $ 1.88 $ 0.48 $ 0.48 $ 0.46 $ 0.46 Preferred Series 15 Series 16 1.2125 0.3031 0.3031 0.3032 0.3031 Series 20 1.5000 0.3750 0.3750 0.3750 0.3750 Series 21 Series 24 0.4125 0.4125 Series 26 0.4125 0.4125 Series 28 0.9500 0.2375 0.2375 0.2375 0.2375 Series 30 0.7849 0.2562 0.2563 0.2724 Return on common shareholders’ equity 17.9 % 14.3 % 20.1 % 17.4 % 19.8 % Total assets 205,429 198,822 194,289 195,300 Long-term financial liabilities(3) 1,881 1,885 1,892 1,902 Net impaired loans 248 184 191 194 Number of common shares outstanding(2) (thousands) Average – Basic 327,463 328,330 327,687 327,318 326,510 Average – Diluted 331,086 332,826 331,381 330,716 330,185 End of period 329,297 328,469 327,606 326,943 Per common share(2) Book value $ 25.76 $ 25.18 $ 24.41 $ 23.68 Stock trading range High 53.88 53.88 49.15 45.73 46.86 Low 41.60 48.16 45.19 41.60 41.72 Number of employees 19,955 20,014 19,831 19,784 Number of branches in Canada 452 452 451 451
(1) Certain amounts have been adjusted to reflect changes in accounting standards. See Note 2 to the consolidated financial statements. (2) Reflecting the stock dividend paid on February 13, 2014. See Note 18 to the consolidated financial statements. (3) Subordinated debt.

MANAGEMENT’S DISCUSSION AND ANALYSIS ADDITIONAL FINANCIAL INFORMATION
National Bank of Canada 95 2014 Annual Report
2013(1) 2012(1)
Total Q4 Q3 Q2 Q1 Total Q4 Q3 Q2 Q1
2,437 592 629 620 596 2,326 590 576 571 589 2,714 659 656 763 636 2,975 757 642 925 651 5,151 1,251 1,285 1,383 1,232 5,301 1,347 1,218 1,496 1,240 181 48 48 53 32 180 46 40 49 45 3,206 827 808 834 737 3,207 878 760 802 767 252 56 27 79 90 317 81 48 102 86 1,512 320 402 417 373 1,597 342 370 543 342 63 16 15 15 17 61 15 16 14 16 1,449 304 387 402 356 1,536 327 354 529 326
$ 4.34 $ 0.91 $ 1.16 $ 1.21 $ 1.06 $ 4.63 $ 0.98 $ 1.06 $ 1.61 $ 0.98 4.31 0.90 1.16 1.20 1.05 4.58 0.97 1.05 1.59 0.97 $ 1.70 $ 0.44 $ 0.44 $ 0.41 $ 0.41 $ 1.54 $ 0.40 $ 0.40 $ 0.37 $ 0.37 0.2444 - - - 0.2444 1.4625 0.3656 0.3656 0.3657 0.3656 1.2125 0.3031 0.3031 0.3032 0.3031 1.2125 0.3031 0.3031 0.3032 0.3031 1.5000 0.3750 0.3750 0.3750 0.3750 1.5000 0.3750 0.3750 0.3750 0.3750 1.0078 - 0.3360 0.3359 0.3359 1.3438 0.3360 0.3360 0.3359 0.3359 1.6500 0.4125 0.4125 0.4125 0.4125 1.6500 0.4125 0.4125 0.4125 0.4125 1.6500 0.4125 0.4125 0.4125 0.4125 1.6500 0.4125 0.4125 0.4125 0.4125 0.9728 0.2375 0.2375 0.2375 0.2603 – – – – – – – – – – – – – – – 20.1 % 15.8 % 21.0 % 23.4 % 20.7 % 24.1 % 19.5 % 21.3 % 34.7 % 21.5 % 188,219 187,195 184,775 183,788 177,903 179,816 176,456 175,245 2,426 2,426 2,456 2,452 2,470 2,479 2,461 1,496 183 172 146 165 179 158 130 159 324,468 325,374 324,772 324,556 323,170 322,774 323,526 323,658 322,686 321,222 327,048 328,593 327,176 327,076 326,090 325,747 326,380 326,462 326,234 324,302 325,983 325,207 325,082 324,937 322,617 323,917 323,823 321,841 $ 22.97 $ 22.60 $ 21.57 $ 20.76 $ 20.02 $ 19.80 $ 19.57 $ 18.44 45.24 45.24 39.68 39.76 40.02 40.64 38.76 38.70 40.64 38.97 36.18 38.86 36.33 36.18 37.53 31.64 36.95 35.53 37.53 31.64 19,691 19,817 19,779 19,858 19,920 20,183 19,785 19,990 453 453 452 452 451 449 449 447

MANAGEMENT’S DISCUSSION AND ANALYSIS ADDITIONAL FINANCIAL INFORMATION
96 National Bank of Canada 2014 Annual Report
TABLE 2 – OVERVIEW OF RESULTS Year ended October 31 (taxable equivalent basis)(1) (millions of Canadian dollars) 2014 2013(2) 2012(2) 2011(2) 2010(3)
Net interest income 2,763 2,646 2,498 2,494 2,139 Non-interest income 2,920 2,714 2,975 2,336 2,351 Total revenues 5,683 5,360 5,473 4,830 4,490 Non-interest expenses 3,423 3,206 3,207 2,952 2,822 Contribution 2,260 2,154 2,266 1,878 1,668 Provisions for credit losses 208 181 180 184 144 Income before income taxes 2,052 1,973 2,086 1,694 1,524 Income taxes 514 461 489 440 427 Income before non-controlling interests 1,097 Non-controlling interests 63 Net income 1,538 1,512 1,597 1,254 1,034 Non-controlling interests 69 63 61 60 Net income attributable to the Bank's shareholders 1,469 1,449 1,536 1,194 Average assets 206,680 193,509 181,344 165,942 140,360
(1) See the Financial Reporting Method section on page 12. (2) Certain amounts have been adjusted to reflect changes in accounting standards. See Note 2 to the consolidated financial statements. (3) These figures are presented in accordance with previous Canadian GAAP.
TABLE 3 – CHANGES IN NET INTEREST INCOME Year ended October 31 (taxable equivalent basis)(1) (millions of Canadian dollars) 2014 2013(2) 2012(2) 2011(2) 2010(3)
Personal and Commercial Net interest income 1,699 1,615 1,581 1,520 1,515 Average assets 81,516 76,696 70,524 62,205 61,076 Average interest-bearing assets 75,963 70,718 65,426 58,161 58,106 Net interest margin 2.24 % 2.28 % 2.42 % 2.61 % 2.61 % Wealth Management Net interest income 315 272 255 229 108 Average assets 10,400 9,080 8,817 7,861 940 Financial Markets Net interest income 824 784 584 579 773 Average assets 86,198 87,063 76,084 72,613 65,469 Other Net interest income (75) (25) 78 166 (257) Average assets 28,566 20,670 25,919 23,263 12,875 Total Net interest income 2,763 2,646 2,498 2,494 2,139 Average assets 206,680 193,509 181,344 165,942 140,360
(1) See the Financial Reporting Method section on page 12. (2) Certain amounts have been adjusted to reflect changes in accounting standards. See Note 2 to the consolidated financial statements. (3) The figures for 2010 are presented in accordance with previous Canadian GAAP and were not restated to reflect the fact that the distribution of banking products through independent
networks has been transferred from the Personal and Commercial segment to the Wealth Management segment and that banking activities with energy sector companies have been transferred from the Financial Markets segment to the Personal and Commercial segment.

MANAGEMENT’S DISCUSSION AND ANALYSIS ADDITIONAL FINANCIAL INFORMATION
National Bank of Canada 97 2014 Annual Report
TABLE 4 – NON-INTEREST INCOME Year ended October 31 (taxable equivalent basis)(1) (millions of Canadian dollars) 2014 2013 2012 2011 2010(2)
Underwriting and advisory fees 388 301 318 308 268 Securities brokerage commissions 333 335 343 327 301 Mutual fund revenues 251 219 200 192 172 Trust service revenues 388 314 280 234 203 Credit fees 169 165 166 169 168 Revenues from acceptances, letters of credit and guarantee 217 226 203 166 146 Card revenues 134 121 113 116 44 Deposit and payment service charges 234 235 229 228 228 Trading revenues (losses) 106 186 233 (25) (93) Gains (losses) on available-for-sale securities, net 103 82 123 105 112 Insurance revenues, net 108 118 111 111 121 Securitization revenues 282 Foreign exchange revenues, other than trading 89 90 94 105 109 Share in the net income of associates and joint ventures 44 26 29 2 17 Other 356 296 533 298 273 2,920 2,714 2,975 2,336 2,351 Domestic 2,617 2,433 2,675 2,101 2,099 International United States 302 227 223 185 160 Other 1 54 77 50 92 Non-interest income as a % of total revenues on a taxable equivalent basis(1) 51.4 % 50.6 % 54.4 % 48.4 % 52.4 % Non-interest income as a % of total revenues on a taxable equivalent basis and excluding specified items(1) 50.7 % 49.2 % 50.8 % 48.3 % 52.2 %
(1) See the Financial Reporting Method section on page 12. (2) These figures are presented in accordance with previous Canadian GAAP.
TABLE 5 – TRADING ACTIVITY REVENUES(1)
Year ended October 31 (taxable equivalent basis)(2) (millions of Canadian dollars) 2014 2013 2012 2011 2010(3)
Financial markets Equities 332 288 246 234 243 Fixed-income securities 207 237 212 130 177 Commodities and foreign exchange 82 88 73 92 85 621 613 531 456 505 Other segments 122 212 158 (31) 28 743 825 689 425 533
(1) Including net interest income and non-interest income. (2) See the Financial Reporting Method section on page 12. (3) The figures for 2010 are presented in accordance with previous Canadian GAAP and have not been restated to reflect the fact that banking activities with energy sector companies have been
transferred from the Financial Markets segment to the Personal and Commercial segment.

MANAGEMENT’S DISCUSSION AND ANALYSIS ADDITIONAL FINANCIAL INFORMATION
98 National Bank of Canada 2014 Annual Report
TABLE 6 – PROVISIONS FOR CREDIT LOSSES
Year ended October 31 (millions of Canadian dollars) 2014 2013 2012 2011 2010(1)
Provisions for credit losses on impaired loans Personal 155 148 135 139 95 Commercial 50 44 36 63 42 Wealth Management 3 3 3 2 Corporate (14) 3 (5) 2 Real estate 3 5 Total 208 181 180 199 144 Collective allowance on non-impaired loans(2) (15) Total provisions for credit losses 208 181 180 184 144 Average loans and acceptances 99,548 92,398 84,009 73,575 59,014 Provisions for credit losses on impaired loans as a % of average loans and acceptances 0.21 % 0.20 % 0.21 % 0.27 % 0.24 % Provisions for credit losses on impaired and non-impaired loans as a % of average loans and acceptances 0.21 % 0.20 % 0.21 % 0.25 % 0.24 % Allowances for credit losses Balance at beginning 578 577 608 638 642 IFRS-conversion adjustment 58 Provisions for credit losses 208 181 180 199 144 Write-offs (118) (112) (154) (193) (134) Write-offs on credit cards (79) (78) (78) (91) (103) Recoveries(3) 15 10 21 12 89 Reversal(4) (15) Balance at end 604 578 577 608 638 Composition of allowances Portion related to securities 2 Individual and collective allowances on impaired loans 238 212 208 232 207 Collective allowance on non-impaired loans(5) 366 366 369 376 429
(1) The figures for 2010 are presented in accordance with previous Canadian GAAP and have not been restated to reflect the fact that the distribution of banking products through independent networks has been transferred from the Personal and Commercial segment to the Wealth Management segment and that banking activities with energy sector companies have been transferred from the Financial Markets segment to the Personal and Commercial segment.
(2) Provisions taken (reversed) for credit facilities granted to clients holding restructured notes of the MAV conduits. (3) Including exchange rate fluctuations and the $2 million portion applicable to securities in 2011. (4) During the year ended October 31, 2011, a $15 million reversal of allowances for credit losses taken for loans and credit facilities secured by restructured notes of the MAV conduits had
been recorded to the provisions for credit losses. (5) The collective allowance on non-impaired loans was established taking into account the Bank’s overall credit portfolio (except for the following amounts created for loans and credit facilities
secured by restructured notes of the MAV conduits; 2014 and 2013: nil; 2012: $3 million; 2011: $10 million; 2010: $121 million).

MANAGEMENT’S DISCUSSION AND ANALYSIS ADDITIONAL FINANCIAL INFORMATION
National Bank of Canada 99 2014 Annual Report
TABLE 7 – NON-INTEREST EXPENSES Year ended October 31 (millions of Canadian dollars) 2014 2013(1) 2012(1) 2011(1) 2010(2)
Compensation and employee benefits(3) 2,051 1,899 1,987 1,770 1,607 Occupancy 183 194 162 151 138 Technology 335 319 303 323 328 Amortization – Premises and equipment 39 43 43 39 40 Amortization – Technology 178 139 111 82 79 Communications 68 68 70 74 71 Professional fees 227 221 195 185 162 Restructuring charges(4) 22 Advertising and external relations 80 71 64 58 55 Stationery 25 22 22 25 25 Travel and business development 34 30 34 33 29 Security and theft 43 26 30 22 17 Capital and payroll taxes 44 46 57 63 60 Other 116 128 129 127 189 Total 3,423 3,206 3,207 2,952 2,822 Domestic 3,223 3,006 2,987 2,724 2,609 International United States 186 183 167 167 150 Other 14 17 53 61 63 Non-interest expenses as a % of total revenues on a taxable equivalent basis(5) 60.2 % 59.8 % 58.6 % 61.1 % 62.9 % Non-interest expenses as a % of total revenues on a taxable equivalent basis and excluding specified items(5) 58.6 % 60.2 % 60.1 % 59.8 % 60.5 %
(1) Certain amounts have been adjusted to reflect changes in accounting standards. See Note 2 to the consolidated financial statements. (2) These figures are presented in accordance with previous Canadian GAAP. (3) Compensation and employee benefits included severance pay amounts of $12 million in 2013, $80 million in 2012 and $27 million in 2011. (4) The restructuring charges for 2010 had included $21 million in compensation and employee benefits and $1 million in professional fees. (5) See the Financial Reporting Method section on page 12.
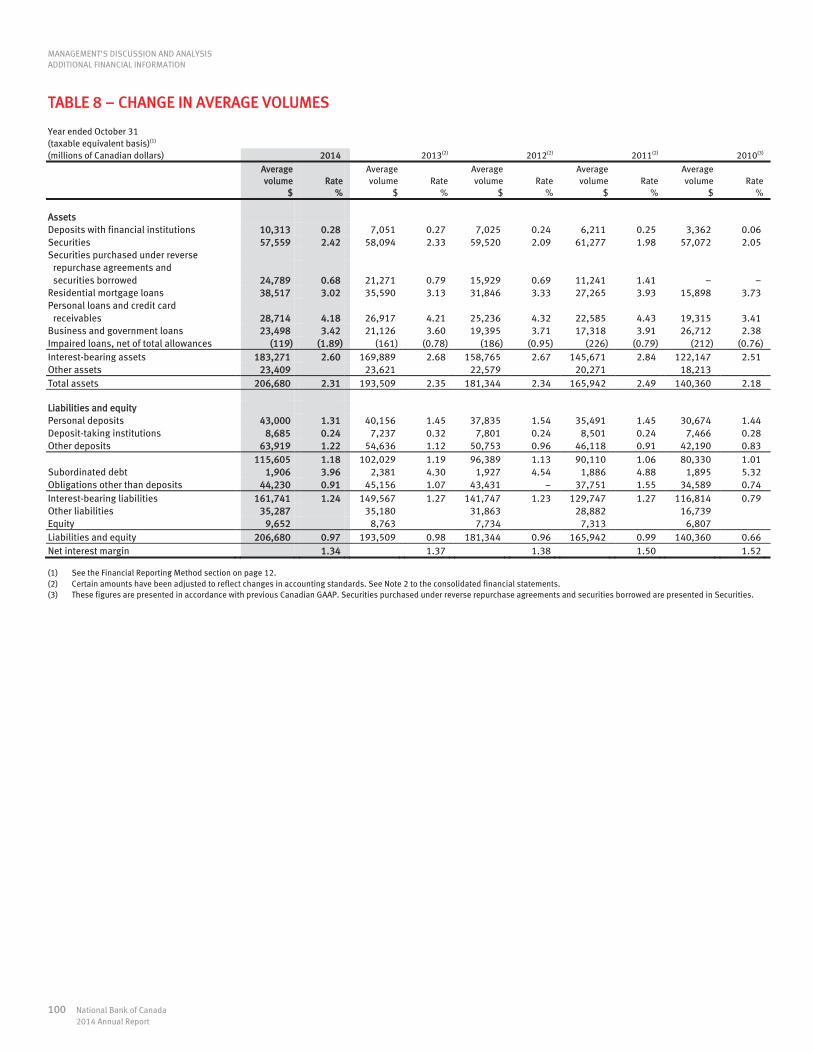
MANAGEMENT’S DISCUSSION AND ANALYSIS ADDITIONAL FINANCIAL INFORMATION
100 National Bank of Canada 2014 Annual Report
TABLE 8 – CHANGE IN AVERAGE VOLUMES Year ended October 31 (taxable equivalent basis)(1) (millions of Canadian dollars) 2014 2013(2) 2012(2) 2011(2) 2010(3)
Average volume
$ Rate
%
Average volume
$ Rate
%
Average volume
$ Rate
%
Average volume
$ Rate
%
Average volume
$ Rate
%
Assets Deposits with financial institutions 10,313 0.28 7,051 0.27 7,025 0.24 6,211 0.25 3,362 0.06 Securities 57,559 2.42 58,094 2.33 59,520 2.09 61,277 1.98 57,072 2.05 Securities purchased under reverse repurchase agreements and securities borrowed 24,789 0.68 21,271 0.79 15,929 0.69 11,241 1.41 Residential mortgage loans 38,517 3.02 35,590 3.13 31,846 3.33 27,265 3.93 15,898 3.73 Personal loans and credit card receivables 28,714 4.18 26,917 4.21 25,236 4.32 22,585 4.43 19,315 3.41 Business and government loans 23,498 3.42 21,126 3.60 19,395 3.71 17,318 3.91 26,712 2.38 Impaired loans, net of total allowances (119) (1.89) (161) (0.78) (186) (0.95) (226) (0.79) (212) (0.76) Interest-bearing assets 183,271 2.60 169,889 2.68 158,765 2.67 145,671 2.84 122,147 2.51 Other assets 23,409 23,621 22,579 20,271 18,213 Total assets 206,680 2.31 193,509 2.35 181,344 2.34 165,942 2.49 140,360 2.18 Liabilities and equity Personal deposits 43,000 1.31 40,156 1.45 37,835 1.54 35,491 1.45 30,674 1.44 Deposit-taking institutions 8,685 0.24 7,237 0.32 7,801 0.24 8,501 0.24 7,466 0.28 Other deposits 63,919 1.22 54,636 1.12 50,753 0.96 46,118 0.91 42,190 0.83 115,605 1.18 102,029 1.19 96,389 1.13 90,110 1.06 80,330 1.01 Subordinated debt 1,906 3.96 2,381 4.30 1,927 4.54 1,886 4.88 1,895 5.32 Obligations other than deposits 44,230 0.91 45,156 1.07 43,431 37,751 1.55 34,589 0.74 Interest-bearing liabilities 161,741 1.24 149,567 1.27 141,747 1.23 129,747 1.27 116,814 0.79 Other liabilities 35,287 35,180 31,863 28,882 16,739 Equity 9,652 8,763 7,734 7,313 6,807 Liabilities and equity 206,680 0.97 193,509 0.98 181,344 0.96 165,942 0.99 140,360 0.66 Net interest margin 1.34 1.37 1.38 1.50 1.52
(1) See the Financial Reporting Method section on page 12. (2) Certain amounts have been adjusted to reflect changes in accounting standards. See Note 2 to the consolidated financial statements. (3) These figures are presented in accordance with previous Canadian GAAP. Securities purchased under reverse repurchase agreements and securities borrowed are presented in Securities.

MANAGEMENT’S DISCUSSION AND ANALYSIS ADDITIONAL FINANCIAL INFORMATION
National Bank of Canada 101 2014 Annual Report
TABLE 9 – DISTRIBUTION OF GROSS LOANS AND ACCEPTANCES BY BORROWER CATEGORY UNDER BASEL ASSET CLASSES As at October 31 (millions of Canadian dollars) 2014 2013(1) 2012(2) 2011(2) 2010(2)
$ % $ % $ % $ % $ %
Residential mortgage(3) 50,011 46.8 46,836 47.8 43,225 47.2 37,639 46.3 23,609 37.0 Qualifying revolving retail 4,033 3.8 3,962 4.1 3,918 4.3 3,917 4.8 2,556 4.0 Other retail 9,027 8.5 8,801 9.0 11,605 12.7 11,365 14.0 10,333 16.2 Agriculture 3,857 3.6 3,553 3.6 2,364 2.6 2,292 2.8 2,212 3.5 Financial institutions 1,482 1.4 1,693 1.7 1,459 1.6 893 1.1 3,840 6.0 Manufacturing 3,689 3.5 3,286 3.4 2,780 3.0 2,959 3.6 2,719 4.3 Construction and real estate 9,088 8.5 7,562 7.7 5,258 5.7 4,302 5.3 3,635 5.7 Transportation 1,223 1.1 1,202 1.2 1,145 1.3 907 1.1 877 1.4 Telecommunications, media and technology 1,540 1.4 1,471 1.5 1,367 1.5 1,334 1.6 1,299 2.0 Mining, oil and gas 3,868 3.6 3,763 3.8 3,599 3.9 2,414 3.0 1,728 2.7 Wholesale and retail 5,281 5.0 4,587 4.7 4,481 4.9 4,238 5.2 3,370 5.3 Services 9,308 8.7 8,512 8.7 6,401 7.0 5,593 6.9 5,034 7.9 Other 4,366 4.1 2,688 2.8 3,897 4.3 3,513 4.3 2,558 4.0 106,773 100.0 97,916 100.0 91,499 100.0 81,366 100.0 63,770 100.0
(1) Certain 2013 comparative figures have been reclassified to conform to the presentation adopted for the year ended October 31, 2014. (2) Figures for 2012, 2011 and 2010 have not been restated to reflect the presentation for the years ended October 31, 2014 and 2013, and the figures for 2010 are presented in accordance
with previous Canadian GAAP. (3) Including residential mortgage loans on one-to-four unit dwellings (as defined by Basel) as well as home equity lines of credit.

MANAGEMENT’S DISCUSSION AND ANALYSIS ADDITIONAL FINANCIAL INFORMATION
102 National Bank of Canada 2014 Annual Report
TABLE 10 – IMPAIRED LOANS As at October 31 (millions of Canadian dollars) 2014 2013 2012 2011 2010(1)
Net impaired loans Personal(2) 88 70 56 57 47 Commercial 137 90 63 81 79 Wealth Management 2 2 2 Corporate 40 16 15 Real estate 21 21 18 21 21 Total net impaired loans 248 183 179 175 162 Gross impaired loans 486 395 387 407 369 Individual and collective allowances on impaired loans 238 212 208 232 207 Net impaired loans 248 183 179 175 162 Provisioning rate 49.0 % 53.7 % 53.7 % 57.0 % 56.1 % As a % of average loans and acceptances 0.2 % 0.2 % 0.2 % 0.2 % 0.4 % As a % of common shareholders’ equity 2.9 % 2.4 % 2.8 % 3.1 % 2.6 % As a % of tangible capital adjusted for allowances 7.1 % 6.5 % 7.5 % 8.6 % 6.7 %
(1) The figures for 2010 are presented in accordance with previous Canadian GAAP and have not been restated to reflect the fact that the distribution of banking products through independent networks has been transferred from the Personal and Commercial segment to the Wealth Management segment and that banking activities with energy sector companies have been transferred from the Financial Markets segment to the Personal and Commercial segment.
(2) Including $46 million in net consumer loans in 2014 (2013: $37 million; 2012: $30 million; 2011: $26 million; 2010: $23 million).

MANAGEMENT’S DISCUSSION AND ANALYSIS ADDITIONAL FINANCIAL INFORMATION
National Bank of Canada 103 2014 Annual Report
TABLE 11 – DEPOSITS As at October 31 (millions of Canadian dollars) 2014 2013(1) 2012(1) 2011(1) 2010(2)
$ % $ % $ % $ % $ %
Personal 44,963 37.6 42,652 41.8 40,814 43.7 37,432 43.6 36,549 44.7 Business and government 35,160 29.3 31,909 31.2 26,222 28.1 24,136 28.1 23,227 28.4 Deposit-taking institutions 1,684 1.4 1,072 1.0 2,547 2.7 1,781 2.1 2,326 2.8 Unsecured senior debt 33,007 27.5 23,336 22.9 20,876 22.3 20,046 23.4 19,683 24.1 Covered bonds 5,069 4.2 3,142 3.1 3,015 3.2 2,392 2.8 Total 119,883 100.0 102,111 100.0 93,474 100.0 85,787 100.0 81,785 100.0 Domestic 105,621 88.1 94,647 92.6 82,818 88.6 75,090 87.6 71,872 87.9 International United States 12,152 10.1 6,893 6.8 9,545 10.2 10,144 11.8 8,204 10.0 Other 2,110 1.8 571 0.6 1,111 1.2 553 0.6 1,709 2.1 Total 119,883 100.0 102,111 100.0 93,474 100.0 85,787 100.0 81,785 100.0 Personal deposits as a % of total assets 21.9 22.7 22.9 22.4 25.2
(1) Certain amounts have been adjusted to reflect changes in accounting standards. See Note 2 to the consolidated financial statements. (2) These figures are presented in accordance with previous Canadian GAAP.

MANAGEMENT’S DISCUSSION AND ANALYSIS ADDITIONAL FINANCIAL INFORMATION
104 National Bank of Canada 2014 Annual Report

AUDITED CONSOLIDATED FINANCIAL STATEMENTS
Management’s Responsibility for Financial Reporting 1106
Independent Auditor’s Report 1107
Consolidated Balance Sheets 1108
Consolidated Statements of Income 1109
Consolidated Statements of Comprehensive Income 1110
Consolidated Statements of Changes in Equity 1111
Consolidated Statements of Cash Flows 1112
Notes to the Audited Consolidated Financial Statements 1113

106 National Bank of Canada 2014 Annual Report
MANAGEMENT’S RESPONSIBILITY FOR FINANCIAL REPORTING The consolidated financial statements of National Bank of Canada (the Bank) have been prepared in accordance with section 308(4) of the Bank Act (Canada), which states that, except as otherwise specified by the Office of the Superintendent of Financial Institutions (Canada) (OSFI), the financial statements are to be prepared in accordance with International Financial Reporting Standards (IFRS), as issued by the International Accounting Standards Board (IASB) and set out in the CPA Canada Handbook. None of the OSFI accounting requirements are exceptions to IFRS. Management maintains the accounting and internal control systems needed to discharge its responsibility, which is to provide reasonable assurance that the financial accounts are accurate and complete and that the Bank’s assets are adequately safeguarded. Controls that are currently in place include quality standards on staff hiring and training; the implementation of organizational structures with clear divisions of responsibility and accountability for performance; the Code of Professional Conduct; and the communication of operating policies and procedures. As Chief Executive Officer and as Chief Financial Officer, we have overseen the evaluation of the design and operation of the Bank’s internal controls over financial reporting in accordance with Regulation 52-109 respecting Certification of Disclosures in Issuers’ Annual and Interim Filings released by the Canadian Securities Administrators. Based on the evaluation work performed, we have concluded that the internal controls over financial reporting were effective as at October 31, 2014 and that they provide reasonable assurance that the financial information is reliable and that the Bank’s consolidated financial statements have been prepared in accordance with IFRS. The Board of Directors (the Board) is responsible for reviewing and approving the financial information contained in the Annual Report. Acting through the Audit Committee, the Board also oversees the presentation of the consolidated financial statements and ensures that accounting and control systems are maintained. Composed of directors who are neither officers nor employees of the Bank, the Audit Committee is responsible, through Internal Audit, for performing an independent and objective review of the Bank’s internal control effectiveness, i.e., governance processes, risk management processes and control measures. Furthermore, the Audit Committee reviews the consolidated financial statements and recommends their approval to the Board. The control systems are supported by the presence of the Compliance Service, which exercises independent oversight in order to assist managers in effectively managing regulatory risk and to obtain reasonable assurance that the Bank is compliant with regulatory requirements. The Senior Vice-President of Internal Audit and the Senior Vice-President, Legal Affairs, and Chief Compliance Officer have direct access to the Chair of the Audit Committee and to the President and Chief Executive Officer. In accordance with the Bank Act (Canada), OSFI is mandated to protect the rights and interests of the depositors. Accordingly, OSFI examines and enquires into the business and affairs of the Bank, as deemed necessary, to ensure that the provisions of the Bank Act (Canada) are being satisfied and that the Bank is in sound financial condition. The independent auditor, Deloitte S.E.N.C.R.L./s.r.l., whose report follows, was appointed by the shareholders on the recommendation of the Board. The auditor has full and unrestricted access to the Audit Committee to discuss audit and financial reporting matters. Louis Vachon President and Chief Executive Officer
Ghislain Parent Chief Financial Officer and Executive Vice-President Finance and Treasury
Montreal, Canada, December 4, 2014

National Bank of Canada 107 2014 Annual Report
INDEPENDENT AUDITOR’S REPORT To the Shareholders of National Bank of Canada We have audited the accompanying consolidated financial statements of National Bank of Canada (the Bank), which comprise the consolidated balance sheets as at October 31, 2014 and 2013, the consolidated statements of income, the consolidated statements of comprehensive income, the consolidated statements of changes in equity and the consolidated statements of cash flows for the years ended October 31, 2014 and 2013, as well as a summary of significant accounting policies and other explanatory information. Management’s responsibility for the consolidated financial statements Management is responsible for the preparation and fair presentation of these consolidated financial statements in accordance with International Financial Reporting Standards as issued by the International Accounting Standards Board, and for such internal control as management determines is necessary to enable the preparation of consolidated financial statements that are free from material misstatement, whether due to fraud or error. The auditor’s responsibility Our responsibility is to express an opinion on these consolidated financial statements based on our audits. We conducted our audits in accordance with Canadian generally accepted auditing standards. Those standards require that we comply with ethical requirements and plan and perform the audit to obtain reasonable assurance about whether the consolidated financial statements are free from material misstatement. An audit involves performing procedures to obtain audit evidence about the amounts and disclosures in the consolidated financial statements. The procedures selected depend on the auditor’s judgment, including the assessment of the risks of material misstatement of the consolidated financial statements, whether due to fraud or error. In making those risk assessments, the auditor considers internal control relevant to the entity’s preparation and fair presentation of the consolidated financial statements in order to design audit procedures that are appropriate in the circumstances, but not for the purpose of expressing an opinion on the effectiveness of the entity’s internal control. An audit also includes evaluating the appropriateness of accounting policies used and the reasonableness of accounting estimates made by management, as well as evaluating the overall presentation of the consolidated financial statements. We believe that the audit evidence we have obtained in our audits is sufficient and appropriate to provide a basis for our audit opinion. Opinion In our opinion, the consolidated financial statements present fairly, in all material respects, the financial position of the Bank as at October 31, 2014 and 2013, and its financial performance and its cash flows for the years ended October 31, 2014 and 2013 in accordance with the International Financial Reporting Standards issued by the International Accounting Standards Board. Deloitte S.E.N.C.R.L./s.r.l.1 Montreal, Canada, December 4, 2014 1 CPA auditor, CA, public accountancy permit No. A121444

AUDITED CONSOLIDATED FINANCIAL STATEMENTS
108 National Bank of Canada 2014 Annual Report
CONSOLIDATED BALANCE SHEETS (millions of Canadian dollars) As at October 31 2014 2013(1)
Assets Cash and deposits with financial institutions 8,086 3,596
Securities Notes 4 and 6 At fair value through profit or loss 43,200 44,000 Available-for-sale 9,753 9,744 52,953 53,744
Securities purchased under reverse repurchase agreements and securities borrowed 24,525 21,449
Loans Note 7 Residential mortgage 39,300 36,573 Personal and credit card 29,996 27,989 Business and government 28,551 24,400 97,847 88,962 Customers’ liability under acceptances 8,926 8,954 Allowances for credit losses (604) (578) 106,169 97,338
Other Derivative financial instruments Note 16 7,092 5,904 Due from clients, dealers and brokers 861 1,101 Investments in associates and joint ventures Note 9 697 684 Premises and equipment Note 10 380 404 Goodwill Note 11 1,272 1,064 Intangible assets Note 11 998 898 Other assets Note 12 2,396 2,037 13,696 12,092 205,429 188,219
Liabilities and Equity Deposits Notes 4 and 13 Personal 44,963 42,652 Business and government 67,364 57,103 Deposit-taking institutions 7,556 2,356 119,883 102,111 Other Acceptances 8,926 8,954 Obligations related to securities sold short 18,167 18,909 Obligations related to securities sold under repurchase agreements and securities loaned 16,780 19,746 Derivative financial instruments Note 16 5,721 4,858 Due to clients, dealers and brokers 1,996 2,442 Liabilities related to transferred receivables Notes 4 and 8 17,079 15,323 Other liabilities Note 14 4,494 4,497 73,163 74,729 Subordinated debt Note 15 1,881 2,426 Equity Equity attributable to the Bank’s shareholders Notes 18 and 22 Preferred shares 1,223 677 Common shares 2,293 2,160 Contributed surplus 52 58 Retained earnings 5,850 5,055 Accumulated other comprehensive income 289 214 9,707 8,164 Non-controlling interests Note 19 795 789 10,502 8,953 205,429 188,219
The accompanying notes are an integral part of these audited consolidated financial statements. (1) Certain amounts have been adjusted to reflect changes in accounting standards. See Note 2.
Louis Vachon Pierre Boivin
President and Chief Executive Officer Director

AUDITED CONSOLIDATED FINANCIAL STATEMENTS
National Bank of Canada 109 2014 Annual Report
CONSOLIDATED STATEMENTS OF INCOME (millions of Canadian dollars) Year ended October 31 2014 2013(1)
Interest income Loans 3,393 3,247 Securities at fair value through profit or loss 970 942 Available-for-sale securities 204 201 Deposits with financial institutions 29 20 4,596 4,410
Interest expense Deposits 1,231 1,015 Liabilities related to transferred receivables 398 408 Subordinated debt 76 102 Other 347 448 2,052 1,973
Net interest income 2,544 2,437
Non-interest income Underwriting and advisory fees 388 301 Securities brokerage commissions 333 335 Mutual fund revenues 251 219 Trust service revenues 388 314 Credit fees 386 391 Card revenues 134 121 Deposit and payment service charges 234 235 Trading revenues (losses) Note 21 106 186 Gains (losses) on available-for-sale securities, net 103 82 Insurance revenues, net 108 118 Foreign exchange revenues, other than trading 89 90 Share in the net income of associates and joint ventures 44 26 Other 356 296 2,920 2,714
Total revenues 5,464 5,151 Provisions for credit losses Note 7 208 181 5,256 4,970
Non-interest expenses Compensation and employee benefits 2,051 1,899 Occupancy 222 237 Technology 513 458 Communications 68 68 Professional fees 227 221 Other 342 323 3,423 3,206
Income before income taxes 1,833 1,764 Income taxes Note 24 295 252 Net income 1,538 1,512
Net income attributable to Preferred shareholders 40 40 Common shareholders 1,429 1,409 Bank shareholders 1,469 1,449 Non-controlling interests 69 63 1,538 1,512 Earnings per share(2) (dollars) Note 25 Basic 4.36 4.34 Diluted 4.32 4.31
Dividends per common share(2) (dollars) Note 18 1.88 1.70
The accompanying notes are an integral part of these audited consolidated financial statements. (1) Certain amounts have been adjusted to reflect changes in accounting standards. See Note 2. (2) Reflecting the stock dividend paid on February 13, 2014. See Note 18.

AUDITED CONSOLIDATED FINANCIAL STATEMENTS
110 National Bank of Canada 2014 Annual Report
CONSOLIDATED STATEMENTS OF COMPREHENSIVE INCOME (millions of Canadian dollars) Year ended October 31 2014 2013(1)
Net income 1,538 1,512 Other comprehensive income, net of income taxes Items that may be subsequently reclassified to net income Net foreign currency translation adjustments Net unrealized foreign currency translation gains (losses) on investments in foreign operations 47 51 Impact of hedging net foreign currency translation gains (losses) (44) (45) 3 6
Net change in available-for-sale securities Net unrealized gains (losses) on available-for-sale securities 85 49 Net (gains) losses on available-for-sale securities reclassified to net income (89) (41) (4) 8
Net change in cash flow hedges Net gains (losses) on derivative financial instruments designated as cash flow hedges 87 (26) Net (gains) losses on designated derivative financial instruments reclassified to net income (11) (28) 76 (54) Item that will not be subsequently reclassified to net income
Revaluations of pension plans and other post-employment benefit plans 23 104
Share in the other comprehensive income of associates and joint ventures (1) Total other comprehensive income, net of income taxes 98 63
Comprehensive income 1,636 1,575
Comprehensive income attributable to Bank shareholders 1,567 1,512 Non-controlling interests 69 63
1,636 1,575
INCOME TAXES – OTHER COMPREHENSIVE INCOME
The following table presents the income tax expense or recovery for each component of other comprehensive income. Year ended October 31 2014 2013(1)
Net foreign currency translation adjustments Net unrealized foreign currency translation gains (losses) on investments in foreign operations 3 2 Impact of hedging net foreign currency translation gains (losses) (8) (11) (5) (9)
Net change in available-for-sale securities Net unrealized gains (losses) on available-for-sale securities 29 20 Net (gains) losses on available-for-sale securities reclassified to net income (32) (17) (3) 3
Net change in cash flow hedges Net gains (losses) on derivative financial instruments designated as cash flow hedges 32 (10) Net (gains) losses on designated derivative financial instruments reclassified to net income (4) (10) 28 (20) Revaluations of pension plans and other post-employment benefit plans 10 40 30 14
The accompanying notes are an integral part of these audited consolidated financial statements. (1) Certain amounts have been adjusted to reflect changes in accounting standards. See Note 2.

AUDITED CONSOLIDATED FINANCIAL STATEMENTS
National Bank of Canada 111 2014 Annual Report
CONSOLIDATED STATEMENTS OF CHANGES IN EQUITY (millions of Canadian dollars) Year ended October 31 2014 2013(1)
Preferred shares at beginning Note 18 677 762 Issuance of Series 28, 30 and 32 preferred shares 650 200 Repurchase of Series 15, 21, 24 and 26 preferred shares for cancellation (104) (285) Preferred shares at end 1,223 677 Common shares at beginning Note 18 2,160 2,054 Issuances of common shares Stock Option Plan 102 107 Impact of shares purchased or sold for trading 31 (1) Common shares at end 2,293 2,160 Contributed surplus at beginning 58 58 Stock option expense Note 22 15 16 Stock options exercised (13) (13) Other (8) (3) Contributed surplus at end 52 58 Retained earnings at beginning 5,055 4,091 Net income attributable to the Bank’s shareholders 1,469 1,449 Dividends Note 18 Preferred shares (40) (40) Common shares (616) (552) Share issuance expense (14) (4) Revaluations of pension plans and other post-employment benefit plans 23 104 Impact of a financial liability resulting from a put option written to a non-controlling interest (27) Other 7 Retained earnings at end 5,850 5,055 Accumulated other comprehensive income at beginning 214 255 Net foreign currency translation adjustments 3 6 Net change in unrealized gains (losses) on available-for-sale securities (4) 8 Net change in gains (losses) on cash flow hedges 76 (54) Share in the other comprehensive income of associates and joint ventures (1) Accumulated other comprehensive income at end 289 214 Equity attributable to the Bank’s shareholders 9,707 8,164 Non-controlling interests at beginning 789 791 Net income attributable to non-controlling interests 69 63 Other comprehensive income attributable to non-controlling interests Distributions to non-controlling interests (63) (65) Non-controlling interests at end 795 789 Equity 10,502 8,953
ACCUMULATED OTHER COMPREHENSIVE INCOME As at October 31 2014 2013
Accumulated other comprehensive income Net foreign currency translation adjustments (3) (6) Net unrealized gains (losses) on available-for-sale securities 168 172 Net gains (losses) on instruments designated as cash flow hedges 123 47 Share in the other comprehensive income of associates and joint ventures 1 1 289 214
The accompanying notes are an integral part of these audited consolidated financial statements. (1) Certain amounts have been adjusted to reflect changes in accounting standards. See Note 2.

AUDITED CONSOLIDATED FINANCIAL STATEMENTS
112 National Bank of Canada 2014 Annual Report
CONSOLIDATED STATEMENTS OF CASH FLOWS (millions of Canadian dollars) Year ended October 31 2014 2013(1)
Cash flows from operating activities Net income 1,538 1,512 Adjustments for Provisions for credit losses 208 181 Amortization of premises and equipment and intangible assets 167 150 Impairment losses on intangible assets Note 11 62 39 Deferred taxes 2 12 Translation adjustment on foreign currency subordinated debt 1 1 Losses (gains) on sales of available-for-sale securities, net (110) (111) Impairment losses on available-for-sale securities 7 29 Stock option expense 15 16 Change in operating assets and liabilities Securities at fair value through profit or loss 800 524 Securities purchased under reverse repurchase agreements and securities borrowed (3,076) (5,920) Loans, net of securitization (7,240) (5,968) Investments in associates and joint ventures (13) (59) Deposits 16,392 8,637 Obligations related to securities sold short (742) 785 Obligations related to securities sold under repurchase agreements and securities loaned (2,966) 207 Derivative financial instruments, net (429) 124 Due from and to clients, dealers and brokers, net 131 1,043 Interest and dividends receivable and interest payable (25) 97 Current tax assets and liabilities 87 (183) Other items (662) (420)
4,147 696 Cash flows from financing activities Issuances of preferred shares 650 200 Repurchase of preferred shares for cancellation (104) (285) Issuances of common shares 120 93 Repurchase of subordinated debt (525) Share issuance expenses (14) (4) Dividends paid on shares (795) (581) Change in other items (44) (119)
(712) (696)
Cash flows from investing activities Acquisition of TD Waterhouse Institutional Services Note 27 722 Purchases of available-for-sale securities (6,426) (5,876) Maturities of available-for-sale securities 382 52 Sales of available-for-sale securities 6,024 6,467 Net change in premises and equipment (50) (146) Net change in intangible assets (197) (127) 455 370
Impact of currency rate movements on cash and cash equivalents 600 (23) Increase in cash and cash equivalents 4,490 347 Cash and cash equivalents at beginning 3,596 3,249 Cash and cash equivalents at end(2) 8,086 3,596 Supplementary information about cash flows from operating activities Interest paid 2,047 1,941 Interest and dividends received 4,567 4,474 Income taxes paid 264 352
The accompanying notes are an integral part of these audited consolidated financial statements. (1) Certain amounts have been adjusted to reflect changes in accounting standards. See Note 2. (2) This item is the equivalent of Consolidated Balance Sheet item Cash and deposits with financial institutions. It includes an amount of $1.0 billion as at October 31, 2014 ($307 million as at
October 31, 2013) for which there are restrictions. In addition, $2 million was held in escrow as at October 31, 2014 ($7 million as at October 31, 2013).

AUDITED CONSOLIDATED FINANCIAL STATEMENTS
National Bank of Canada 113 2014 Annual Report
NOTES TO THE AUDITED CONSOLIDATED FINANCIAL STATEMENTS (millions of Canadian dollars)
Note 1 Basis of Presentation and Summary of Significant Accounting Policies 113 Note 18 Share Capital 1164 Note 2 Accounting Policy Changes 1127 Note 19 Non-Controlling Interests 1169 Note 3 Fair Value of Financial Instruments 1130 Note 20 Capital Disclosure 1170 Note 4 Financial Instruments Designated at Fair Value Through Profit or Loss 140 Note 21 Trading Activity Revenues 1171 Note 5 Offsetting Financial Assets and Financial Liabilities 141 Note 22 Share-Based Payments 1172 Note 6 Securities 1142 Note 23 Employee Benefits – Pension Plans and Other Note 7 Loans 1146 Post-Employment Benefits 1175 Note 8 Financial Assets Transferred But Not Derecognized 1150 Note 24 Income Taxes 1180 Note 9 Associates and Joint Ventures 1151 Note 25 Earnings Per Share 1181 Note 10 Premises and Equipment 1152 Note 26 Guarantees, Commitments and Contingent Liabilities 1182 Note 11 Goodwill and Intangible Assets 1153 Note 27 Acquisition 1185 Note 12 Other Assets 1155 Note 28 Structured Entities 1186 Note 13 Deposits 155 Note 29 Related Party Disclosures 1190 Note 14 Other Liabilities 1156 Note 30 Management of the Risks Associated with Financial Instruments 1192 Note 15 Subordinated Debt 1157 Note 31 Interest Rate Sensitivity 1196 Note 16 Derivative Financial Instruments 1158 Note 32 Segment Disclosures 1197 Note 17 Hedging Activities 1162 Note 33 Events After the Consolidated Balance Sheet Date 1198
NOTE 1 – BASIS OF PRESENTATION AND SUMMARY OF SIGNIFICANT ACCOUNTING POLICIES National Bank of Canada (the Bank) is a financial institution incorporated and domiciled in Canada and whose shares are listed on the Toronto Stock Exchange. Its head office is located at 600 De La Gauchetière Street West in Montreal, Quebec, Canada. The Bank is a chartered bank under Schedule 1 of the Bank Act (Canada) and is regulated by the Office of the Superintendent of Financial Institutions Canada (OSFI). The Bank provides integrated financial services to consumers, small- and medium-sized enterprises, and large corporations and operates three business segments, namely, the Personal and Commercial segment, the Wealth Management segment, and the Financial Markets segment. Its full line of services includes banking and investing solutions for individuals and businesses, securities brokerage, insurance and wealth management. On December 4, 2014, the Board of Directors (the Board) authorized the publication of the Bank’s audited annual consolidated financial statements (the consolidated financial statements) for the year ended October 31, 2014.
Basis of Presentation
The consolidated financial statements of the Bank have been prepared in accordance with section 308(4) of the Bank Act (Canada), which states that, except as otherwise specified by OSFI, the financial statements are to be prepared in accordance with the International Financial Reporting Standards (IFRS), as issued by the International Accounting Standards Board (IASB) and set out in the CPA Canada Handbook. None of the OSFI accounting requirements are exceptions to IFRS. The figures for the year ended October 31, 2013 have been adjusted to reflect changes in accounting standards and the impact of the stock dividend of one common share on each issued and outstanding common share declared on December 3, 2013 and paid on February 13, 2014. The effect of this dividend was the same as a two-for-one split of common shares, as described in Note 18. Unless otherwise indicated, all amounts are expressed in Canadian dollars.
Summary of Significant Accounting Policies
Judgments, Estimates and Assumptions In preparing consolidated financial statements in accordance with IFRS, management must exercise judgment and make estimates and assumptions that affect the reporting date carrying amounts of assets and liabilities, net income and related information. Furthermore, certain accounting policies require complex judgments and estimates because they apply to matters that are inherently uncertain, in particular the accounting policies applicable to allowances for credit losses, the fair value determination of financial instruments, the impairment of available-for-sale securities, the impairment of non-financial assets, pension plans and other post-employment benefits, income taxes, provisions and consolidation of structured entities. Descriptions of these judgments and estimates are provided in each of the related notes to the consolidated financial statements. Actual results could differ from these estimates, in which case the impact is recognized in the consolidated financial statements of future fiscal periods. The accounting policies in this note provide greater detail about the use of estimates and assumptions and reliance on judgment.

AUDITED CONSOLIDATED FINANCIAL STATEMENTS NOTES TO THE AUDITED CONSOLIDATED FINANCIAL STATEMENTS (millions of Canadian dollars)
114 National Bank of Canada 2014 Annual Report
NOTE 1 – BASIS OF PRESENTATION AND SUMMARY OF SIGNIFICANT ACCOUNTING POLICIES (cont.) Basis of Consolidation Subsidiaries The consolidated financial statements include all of the assets, liabilities, operating results and cash flows of the Bank and its subsidiaries, after elimination of intercompany transactions and balances. The subsidiaries are entities, including structured entities, controlled by the Bank. A structured entity is an entity created to accomplish a narrow and well-defined objective and is designed so that voting or similar rights are not the dominant factor in deciding who controls the entity, such as when voting rights relate solely to administrative tasks and the relevant activities are directed by means of contractual arrangements. Management must exercise judgment in determining whether the Bank must consolidate an entity. The Bank controls an entity only if the following three conditions are met.
— It has decision-making authority regarding the entity’s relevant activities. — It has exposure or rights to variable returns from its involvement with the entity. — It has the ability to use its power to affect the amount of the returns. When determining decision-making authority, many factors are taken into account, including the existence and effect of actual and potential voting rights held by the Bank that can be exercised as well as the holding of instruments that are convertible into voting shares. In addition, the Bank must determine whether, as an investor with decision-making rights, it acts as a principal or agent. Based on these principles, an assessment of control is performed at the inception of a relationship between any entity and the Bank. At the time of the assessment, the Bank considers all facts and circumstances and reassesses whether it still controls an investee if facts and circumstances indicate that there are changes to one or more of the three conditions of control. The Bank consolidates the entities it controls from the date on which control is obtained and ceases to consolidate them from the date control ceases. The Bank uses the acquisition method to account for the acquisition of a subsidiary from a third party on the date control is obtained. Non-controlling interests Non-controlling interests in subsidiaries represent the equity interests of third parties in the Bank’s subsidiaries and are presented in total Equity, separately from the Equity attributable to the Bank’s shareholders. The non-controlling interests’ proportionate share in the net income and other comprehensive income of the Bank’s subsidiaries are presented in total net income and total comprehensive income, respectively. With respect to units issued to third parties by mutual funds and certain other funds that are consolidated, they are presented at fair value in Other liabilities on the Consolidated Balance Sheet. Lastly, changes in ownership interests in subsidiaries that do not result in a loss of control are recognized as equity transactions. The difference between the adjustment in the carrying value of the non-controlling interest and the fair value of the consideration paid or received is recognized directly in Equity attributable to the Bank’s shareholders. Investments in associates and joint ventures The Bank exercises significant influence over an entity when it has the power to participate in the financial and operating policy decisions of the investee. The Bank has joint control over an entity when there’s a contractually agreed sharing of control of an entity that exists only when decisions about the relevant activities require the unanimous consent of the parties sharing control. Investments in associates, i.e., entities over which the Bank exercises significant influence, and investments in joint ventures, i.e., entities over which the Bank has rights to the net assets and exercises joint control, are accounted for using the equity method. Under the equity method, the investment is initially recorded at cost and, following acquisition, the Bank’s shares in the net income and in the other comprehensive income are recognized, respectively, in Non-interest income in the Consolidated Statement of Income and in Other comprehensive income in the Consolidated Statement of Comprehensive Income. The carrying value of the investment is adjusted by an equivalent amount on the Consolidated Balance Sheet and reduced by distributions received.

AUDITED CONSOLIDATED FINANCIAL STATEMENTS NOTES TO THE AUDITED CONSOLIDATED FINANCIAL STATEMENTS (millions of Canadian dollars)
National Bank of Canada 115 2014 Annual Report
Foreign Currencies The consolidated financial statements are presented in Canadian dollars, which is the Bank’s functional and presentation currency. Each entity in the group determines its own functional currency, and items included in the financial statements of each entity are measured using that currency. Monetary assets and liabilities denominated in foreign currencies are translated into the functional currency using the rates in effect on the date of the Consolidated Balance Sheet. Translation gains and losses are recognized in Non-interest income in the Consolidated Statement of Income. Revenues and expenses denominated in foreign currencies are translated at the average exchange rates for the period. Non-monetary assets and liabilities are translated into the functional currency at historical rates. Non-monetary items denominated in foreign currencies measured at fair value are translated using the exchange rates in effect on the date fair value is determined, and the translation gains or losses are recognized in the Consolidated Statement of Income. Translation gains or losses on non-monetary items classified as available for sale are recognized in Other comprehensive income. Upon disposal or due to impairment of a non-monetary item classified as available for sale, the deferred translation gains or losses are reclassified, in whole or in part, from Accumulated other comprehensive income to Non-interest income of the Consolidated Statement of Income. In the consolidated financial statements, the assets and liabilities of all foreign operations are translated into the Bank’s functional currency using the rates in effect on the Consolidated Balance Sheet date, whereas the revenues and expenses of such foreign operations are translated into the Bank’s functional currency at the average exchange rates for the period. Any goodwill resulting from the acquisition of a foreign operation, which does not have the same functional currency as the parent company, and any fair value adjustments to the carrying amounts of assets and liabilities resulting from the acquisition, are treated as assets and liabilities of the foreign operation and translated using the rates in effect on the Consolidated Balance Sheet date. Gains and losses on translating the financial statements of foreign operations, along with related hedge and tax effects, are presented in Other comprehensive income. Upon disposal of a foreign operation, the deferred cumulative amount recognized in Accumulated other comprehensive income relating to that particular operation is reclassified to Non-interest income of the Consolidated Statement of Income. Classification and Measurement of Financial Instruments In accordance with the accounting framework for financial instruments, all financial assets and liabilities must be classified based on their characteristics, management’s intention, or choice of category in certain circumstances. When initially recognized, all financial assets are classified as either at fair value through profit or loss, held to maturity, available for sale, or loans and receivables, while financial liabilities are classified as either at fair value through profit or loss or as financial liabilities at amortized cost. Certain debt securities that are not quoted in an active market may be classified as loans and receivables, and impairment is determined using the same model as for loans. Loans and receivables that the Bank intends to sell immediately or in the near term must be classified as at fair value through profit or loss, whereas loans and receivables for which the Bank may not recover substantially all of its initial investment, for reasons other than credit deterioration, must be classified as available for sale. When they are initially recognized, all financial assets and liabilities, including derivative financial instruments, are recorded at fair value on the Consolidated Balance Sheet. In subsequent periods, they are measured at fair value, except for items classified in the following categories, which are measured at amortized cost using the effective interest rate method: financial assets held to maturity, loans and receivables, and financial liabilities at amortized cost. Under the fair value option, a financial asset or liability may be irrevocably designated at fair value through profit or loss when it is initially recognized. Financial instruments thus designated are accounted for under the fair value option, and any change in fair value is recorded in Non-interest income in the Consolidated Statement of Income. Interest income and expenses resulting from these financial instruments are recorded in Net interest income in the Consolidated Statement of Income. The Bank may use the option in the following cases.
— If, consistent with a documented risk management strategy, using this option allows the Bank to eliminate or significantly reduce the measurement or recognition mismatch of measuring financial assets or liabilities on a different basis, and if the fair values are reliable.
— If a group of financial assets and financial liabilities to which an instrument belongs is managed and its performance is evaluated on a fair value basis, in accordance with the Bank’s documented risk management or investment strategy, and information is provided on that basis to senior management. Consequently, the Bank may use the fair value option if it has implemented a documented risk management strategy to manage a group of financial instruments together on the fair value basis, if it can demonstrate that significant financial risks are eliminated or significantly reduced, and if the fair values are reliable.
— For hybrid financial instruments with one or more embedded derivatives that would significantly modify the cash flows of the financial instruments and that would otherwise be bifurcated and accounted for separately.

AUDITED CONSOLIDATED FINANCIAL STATEMENTS NOTES TO THE AUDITED CONSOLIDATED FINANCIAL STATEMENTS (millions of Canadian dollars)
116 National Bank of Canada 2014 Annual Report
NOTE 1 – BASIS OF PRESENTATION AND SUMMARY OF SIGNIFICANT ACCOUNTING POLICIES (cont.) Reclassification of Financial Instruments A financial asset, other than a derivative financial instrument or a financial asset that, upon initial recognition, was designated as measured at fair value through profit or loss, may be reclassified out of the fair value through profit or loss category in rare circumstances if the financial asset is no longer held for the purpose of selling it in the near term. The financial asset must be reclassified at its fair value on the date of reclassification, and this fair value becomes its new amortized cost, as applicable. No gain or loss previously recognized in the Consolidated Statement of Income may be reversed. Establishing Fair Value The fair value of a financial instrument is the price that would be received to sell a financial asset or paid to transfer a financial liability in an orderly transaction in the principal market at the measurement date under current market conditions (i.e., an exit price). Unadjusted quoted prices in active markets, based on bid prices for financial assets and offered prices for financial liabilities, provide the best evidence of fair value. A financial instrument is considered quoted in an active market when prices in exchange, dealer, broker or principal-to-principal markets are accessible at the measurement date. An active market is one where transactions occur with sufficient frequency and volume to provide quoted prices on an ongoing basis. When there is no quoted price in an active market, the Bank uses another valuation technique that maximizes the use of relevant observable inputs and minimizes the use of unobservable inputs. The chosen valuation technique incorporates all the factors that market participants would take into account in pricing a transaction. Judgment is required when applying a large number of acceptable valuation techniques and estimates to determine fair value. The estimated fair value reflects market conditions on the valuation date and, consequently, may not be indicative of future fair value. The best evidence of the fair value of a financial instrument at initial recognition is the transaction price, i.e., the fair value of the consideration received or paid. If there’s a difference between the fair value at initial recognition and the transaction price, and the fair value is determined using a valuation technique based on observable market inputs or, in the case of a derivative, if the risks are fully offset by other contracts entered into with third parties, this difference is recognized in the Consolidated Statement of Income. In other cases, the difference between the fair value at initial recognition and the transaction price is deferred on the Consolidated Balance Sheet. The amount of the deferred gain or loss is recognized over the term of the financial instrument. The unamortized balance is immediately recognized in net income when (i) observable market inputs can be obtained and support the fair value of the transaction, (ii) the risks associated with the initial contract are substantially offset by other contracts entered into with third parties, (iii) the gain or loss is realized through a cash receipt or payment, or (iv) the transaction matures or is cancelled before maturity. In certain cases, measurement adjustments are recognized to address factors that market participants would use at the measurement date to determine fair value but that are not included in the measurement technique due to system limitations or uncertainty surrounding the measure. These factors include, but are not limited to, the unobservable nature of inputs used in the valuation model, assumptions about risk such as market risk, credit risk, or risk related to the valuation model, and future administrative expenses. The Bank may also consider market liquidity risk when determining the fair value of financial instruments when it believes these instruments could be disposed of for a consideration below the fair value otherwise determined due to a lack of market liquidity or an insufficient volume of transactions in a given market. As permitted when certain criteria are met, the Bank has elected to determine fair value based on net exposure to credit risk or market risk for certain portfolios of financial instruments, mainly derivatives. Cash and Deposits With Financial Institutions Cash and deposits with financial institutions consist of cash and cash equivalents, amounts pledged as collateral as well as amounts placed in escrow. Cash comprises cash, bank notes and coin. Cash equivalents consist of deposits with the Bank of Canada, deposits with financial institutions, including net receivables related to cheques and other items in the clearing process, as well as the net amount of cheques and other items in transit. Securities at Fair Value Through Profit or Loss Securities at fair value through profit or loss are generally purchased for sale in the near term or are part of portfolios of identified financial instruments that are managed together and for which there is evidence of a recent actual pattern of short-term profit-taking. The Bank accounts for securities transactions at fair value through profit or loss on the settlement date on the Consolidated Balance Sheet. Changes in fair value between the trade date and the settlement date are included in Non-interest income in the Consolidated Statement of Income. Securities at fair value through profit or loss are recognized at fair value, and the transaction fees are recognized directly in the Consolidated Statement of Income. Interest income as well as realized and unrealized gains and losses on such securities are recorded in Non-interest income in the Consolidated Statement of Income. Dividend income is recorded in Interest income in the Consolidated Statement of Income.

AUDITED CONSOLIDATED FINANCIAL STATEMENTS NOTES TO THE AUDITED CONSOLIDATED FINANCIAL STATEMENTS (millions of Canadian dollars)
National Bank of Canada 117 2014 Annual Report
Available-for-Sale Securities Securities that are neither classified as at fair value through profit or loss nor as held to maturity nor in the loans and receivables category are classified as available-for-sale securities. The Bank accounts for available-for-sale securities transactions on the trade date, and the related transaction costs are capitalized. Available-for-sale securities are recognized at fair value. Unrealized gains and losses are recognized, net of impairment charges and income taxes, provided they are not hedged by derivative financial instruments in a fair value hedging relationship, in Other comprehensive income. When the securities are sold, the realized gains or losses, determined on an average cost basis, are reclassified to Non-interest income in the Consolidated Statement of Income on the transaction date. The amortization of premiums and discounts, calculated using the effective interest rate method, as well as dividend and interest income, are recognized in Interest income in the Consolidated Statement of Income. Held-to-Maturity Securities Securities classified as held to maturity are financial assets with fixed or determinable payments and fixed maturities that the Bank intends and is able to hold to the specified maturity. These securities are recognized at amortized cost using the effective interest rate method less impairment losses. Securities Purchased Under Reverse Repurchase Agreements, Obligations Related to Securities Sold Under Repurchase Agreements and Securities Borrowed and Loaned The Bank recognizes these transactions on the settlement date at amortized cost using the effective interest rate method. Securities sold under repurchase agreements remain on the Consolidated Balance Sheet, whereas securities purchased under reverse repurchase agreements are not recognized. Reverse repurchase agreements and repurchase agreements are treated as collateralized lending and borrowing transactions. The Bank also borrows and lends securities. Securities loaned remain on the Consolidated Balance Sheet while securities borrowed are not recognized. As part of these transactions, the Bank pledges or receives collateral in the form of cash or securities. Collateral pledged in the form of securities remain on the Consolidated Balance Sheet. Collateral received in the form of securities are not recognized on the Consolidated Balance Sheet. Collateral pledged or received in the form of cash is recognized in financial assets or liabilities on the Consolidated Balance Sheet. When the collateral is pledged or received in the form of cash, the interest income and expense are recorded in Net interest income in the Consolidated Statement of Income. Loans Loans, including transaction costs directly attributable to the granting of the loans, other than loans classified or designated as measured at fair value through profit or loss, are presented on the Consolidated Balance Sheet at amortized cost using the effective interest rate method. Loans classified or designated as measured at fair value through profit or loss are recognized at fair value. Impairment of Financial Assets At the end of each reporting period, the Bank determines whether there is objective evidence of impairment of a financial asset or group of financial assets. There is objective evidence of impairment when one or more loss events occur after the initial recognition of the asset and prior to or on the balance sheet date and these events adversely affect the estimated future cash flows of the financial assets in question. Management must use judgment to determine whether events or circumstances constitute objective evidence of impairment and to estimate the timing of future cash flows. Available-for-sale securities Available-for-sale securities are assessed at the end of each reporting period to determine whether there is objective evidence of impairment. For debt securities, the Bank considers all loss events, particularly: a significant financial difficulty of the issuer, a breach of contract such as a default, bankruptcy or other financial reorganization. In the case of equity securities, the Bank considers all available objective evidence of impairment, including observable data or information about events relating specifically to the securities in question. A significant or prolonged decline in the fair value below its cost is also objective evidence of impairment. If there is objective evidence of impairment, any amount previously recognized in Accumulated other comprehensive income is reclassified to Non-interest income in the Consolidated Statement of Income. This amount is determined as the difference between the acquisition cost (net of any capital repayments and amortization) and the current fair value of the asset less any impairment loss on that investment previously recognized in the Consolidated Statement of Income.

AUDITED CONSOLIDATED FINANCIAL STATEMENTS NOTES TO THE AUDITED CONSOLIDATED FINANCIAL STATEMENTS (millions of Canadian dollars)
118 National Bank of Canada 2014 Annual Report
NOTE 1 – BASIS OF PRESENTATION AND SUMMARY OF SIGNIFICANT ACCOUNTING POLICIES (cont.) Once an impairment loss has been recognized for an available-for-sale security, the subsequent accounting treatment depends on whether the instrument is a debt or equity security.
— For an available-for-sale debt security, a subsequent decline in fair value will be accounted for in Non-interest income in the Consolidated Statement of Income when there is further objective evidence of impairment as a result of further decreases in the estimated future cash flows of the debt security. Impairment losses recognized in income relating to an available-for-sale debt security must be reversed in income when, in a subsequent period, the fair value of the security increases and the increase can be objectively associated with an event occurring after the loss was recognized.
— For an available-for-sale equity security, subsequent decreases in fair value are accounted for in the Consolidated Statement of Income. Impairment losses recognized are not reversed through the Consolidated Statement of Income. All subsequent increases in fair value will be accounted for in Other comprehensive income in the Consolidated Statement of Comprehensive Income.
Impaired loans A loan, except credit card receivables, is considered impaired if there is objective evidence of impairment and, in management’s best estimate, the timely collection of principal and interest is no longer reasonably assured, or when a payment is contractually 90 days past due, unless the loan is fully secured and collection efforts are reasonably expected to result in repayment of the debt within 180 days. For credit card receivables, they are written off when payment is 180 days in arrears. Loans that are insured or fully guaranteed by a Canadian government (federal or provincial) or by a Canadian government agency are considered impaired when more than 365 days in arrears. When a counterparty to a loan fails to make the payment when contractually due, that loan is considered past due but not impaired. When a loan is deemed impaired, interest recognition ceases and the carrying amount of the loan is reduced to its estimated realizable amount by writing off all or part of the loan or by taking an allowance for credit losses. The impairment loss is calculated by comparing the present value of expected future cash flows, discounted at the initial effective interest rate of the loan, to its current carrying amount including accrued interest. The losses are recorded in Provisions for credit losses in the Consolidated Statement of Income. A loan is returned to performing status when the timely collection of future interest and principal is reasonably assured and when all principal and interest payments in arrears have been collected. A loan and its related allowance for credit losses is normally written off in whole or in part when the Bank considers the probability of recovery to be non-existent and when all guarantees and other remedies available to the Bank have been exhausted or if the borrower is bankrupt, winding up and balances owing are not likely to be recovered. Allowances for credit losses Allowances for credit losses are management’s best estimate of losses in its credit portfolio as at the balance sheet date. These allowances are primarily related to loans but may also cover the credit risk associated with deposits with financial institutions, loan substitute securities, credit instruments such as acceptances, and off-balance-sheet items such as commitments to extend credit, letters of guarantee and letters of credit. Changes in allowances for credit losses attributable to the passage of time are recorded in Interest income in the Consolidated Statement of Income, whereas changes attributable to a revision of expected payments are recorded in Provisions for credit losses in the Consolidated Statement of Income. If, in a subsequent period, the amount of the impairment loss decreases and the decrease can be related objectively to an event occurring after the allowances were recognized, the previously recognized impairment loss is reversed directly in Provisions for credit losses in the Consolidated Statement of Income. The allowances for credit losses on impaired loans are calculated on a loan-by-loan basis and assessed either individually or collectively based on the portfolio’s historical net loss experience. The allowance for credit losses on non-impaired loans is assessed collectively.

AUDITED CONSOLIDATED FINANCIAL STATEMENTS NOTES TO THE AUDITED CONSOLIDATED FINANCIAL STATEMENTS (millions of Canadian dollars)
National Bank of Canada 119 2014 Annual Report
Individual allowances on impaired loans An individual allowance on impaired loans is recognized following a detailed analysis of a borrower’s file. This type of allowance relates primarily to business and government loan portfolios. These portfolios include loans to businesses (other than certain small businesses that are classified in the personal credit portfolios) as well as loans to governments and financial institutions. As for personal loan portfolios, the Bank recognizes individual allowances for residential mortgages and certain other loans. The credit risk for these loans is assessed individually and on an ongoing basis. Collective allowances on impaired loans Most personal loan portfolios—other than residential mortgages—which include consumer loans and loans to certain small businesses, are portfolios of loans made up of many relatively low homogeneous balances that are managed together, for which a collective allowance is established on a loan-by-loan basis in accordance with historical net loss experience. Collective allowance on non-impaired loans The collective allowance on non-impaired loans includes two components for credit risk: the allocated collective allowance and the unallocated collective allowance. This collective allowance reflects management’s best estimate of probable losses in the overall credit portfolio that has not yet been specifically identified as impaired. The allocated collective allowance for the business and government loan portfolio is based on the application of expected default and loss factors, determined by statistical loss migration analysis, delineated by loan type, to which is added an amount that takes into account the discovery period and migration risk. For personal loans, the allocated collective allowance is calculated based on specific parameters by product and no discovery period is calculated. Losses are determined by the application of loss ratios established through statistical analysis of loss migration over an economic cycle. The unallocated collective allowance reflects management’s assessment of probable losses in the portfolio that have not been captured by the allocated collective allowance. This assessment takes into account general economic and business conditions, recent credit loss data, and credit quality and concentration trends when the collective allowance is determined at the Consolidated Balance Sheet date. This allowance also reflects model and estimation risks. The unallocated collective allowance does not represent future losses or serve as a substitute for the allocated collective allowance. Derecognition of Financial Assets and Securitization A financial asset is considered for derecognition when the Bank has transferred contractual rights to receive the cash flows or assumed an obligation to transfer these cash flows to a third party. The Bank derecognizes a financial asset when it considers that substantially all of the risks and rewards of the asset have been transferred or when the contractual rights to the cash flows of the financial asset expire. When the Bank considers that it has retained substantially all of the risks and rewards of the transferred asset, it continues to recognize the financial asset and, if applicable, recognizes a financial liability on the Consolidated Balance Sheet. If, due to a derivative financial instrument, the transfer of a financial asset does not result in derecognition, the derivative financial instrument is not recognized on the Consolidated Balance Sheet. When the Bank has neither transferred nor retained substantially all the risks and rewards related to a financial asset, it derecognizes the financial asset it no longer controls. Any rights and obligations retained following the asset transfer are recognized separately as an asset or liability. If the Bank retains control of the financial asset, it continues to recognize the asset to the extent of its continuing involvement in that asset, i.e., to the extent to which it is exposed to changes in the value of the transferred asset. In order to diversify its funding sources, the Bank participates in two Canada Mortgage and Housing Corporation (CMHC) securitization programs: the Mortgage-Backed Securities Program under the National Housing Act (Canada) (NHA) and Canada Mortgage Bond (CMB) program. Under the first program, the Bank issues NHA securities backed by insured residential mortgages and, under the second, the Bank sells NHA securities to Canada Housing Trust (CHT). As part of these transactions, the Bank retains substantially all of the risks and rewards related to ownership of the mortgage loans sold. Therefore, the insured mortgage loans securitized under the CMB program continue to be recognized in the Loans item on the Bank’s Consolidated Balance Sheet and the liabilities for the considerations received from the transfer are recognized in Liabilities related to transferred receivables on the Consolidated Balance Sheet. Moreover, insured mortgage loans securitized and retained by the Bank continue to be recognized in Loans on the Consolidated Balance Sheet.

AUDITED CONSOLIDATED FINANCIAL STATEMENTS NOTES TO THE AUDITED CONSOLIDATED FINANCIAL STATEMENTS (millions of Canadian dollars)
120 National Bank of Canada 2014 Annual Report
NOTE 1 – BASIS OF PRESENTATION AND SUMMARY OF SIGNIFICANT ACCOUNTING POLICIES (cont.) Derecognition of Financial Liabilities A financial liability is derecognized when the obligation is discharged, cancelled or expires. The difference between the carrying value of the financial liability transferred and the consideration paid is recognized in the Consolidated Statement of Income. Acceptances and Customers’ Liability Under Acceptances The potential liability of the Bank under acceptances is recorded as a customer commitment liability on the Consolidated Balance Sheet. The Bank’s potential recourse vis à vis clients is recorded as an equivalent offsetting asset. Fees are recorded in Non-interest income in the Consolidated Statement of Income. Obligations Related to Securities Sold Short This financial liability represents the Bank’s obligation to deliver the securities it sold but did not own at the time of sale. Obligations related to securities sold short are recorded at fair value and presented as liabilities on the Consolidated Balance Sheet. Realized and unrealized gains and losses are recognized in Non-interest income in the Consolidated Statement of Income. Derivative Financial Instruments In the normal course of business, the Bank uses derivative financial instruments to meet the needs of its clients, to generate trading activity revenues and to manage its exposure to interest rate risk, foreign exchange risk, credit risk and other market risks. All derivative financial instruments are recorded at fair value on the Consolidated Balance Sheet. Derivative financial instruments with a positive fair value are included in assets, and derivative financial instruments with a negative fair value are included in liabilities on the Consolidated Balance Sheet. Embedded derivative financial instruments An embedded derivative financial instrument is a component of a financial instrument or another contract, the characteristics of which are similar to those of a derivative product. Taken together, the financial instrument or contract is considered to be a hybrid instrument comprising a host contract and an embedded derivative financial instrument. Embedded derivatives are bifurcated and accounted for separately if, and only if, the following three conditions are met: the economic characteristics and risks of the embedded derivative are not closely related to those of the host contract, the embedded derivative is a separate instrument that meets the definition of a derivative financial instrument, and the hybrid contract is not recorded at fair value. An embedded derivative financial instrument is classified with the host contract on the Consolidated Balance Sheet and measured at its fair value. Realized and unrealized gains and losses are recognized in Non-interest income in the Consolidated Statement of Income. Held-for-trading derivative financial instruments Derivative financial instruments are recognized at fair value, and the realized and unrealized gains and losses (including interest income and expense) are recorded in Non-interest income in the Consolidated Statement of Income. Interest income and expense related to derivative financial instruments that are managed with financial instruments designated at fair value through profit or loss are recorded in Net interest income in the Consolidated Statement of Income. Derivative financial instruments designated as hedging instruments Policy The purpose of a hedging transaction is to modify the Bank’s exposure to one or more risks by creating an offset between changes in the fair value of, or the cash flows attributable to, the hedged item and the hedging instrument. Hedge accounting ensures that offsetting gains, losses, revenues and expenses are recognized in the Consolidated Statement of Income in the same period or periods.

AUDITED CONSOLIDATED FINANCIAL STATEMENTS NOTES TO THE AUDITED CONSOLIDATED FINANCIAL STATEMENTS (millions of Canadian dollars)
National Bank of Canada 121 2014 Annual Report
Documenting and assessing effectiveness The Bank designates and formally documents each hedging relationship, at its inception, by detailing the risk management objective and the hedging strategy. The documentation identifies the specific asset, liability or cash flows being hedged, the related hedging instrument, the nature of the specific risk exposure or exposures being hedged, the intended term of the hedging relationship and the method for assessing the effectiveness or ineffectiveness of the hedging relationship. At the inception of the hedging relationship, and for every financial reporting period for which the hedge has been designated, the Bank ensures that the hedging relationship is highly effective and consistent with its originally documented risk management objective and strategy. When a hedging relationship meets the hedge accounting requirements, it is designated as either a fair value hedge, a cash flow hedge or a foreign exchange hedge of a net investment in a foreign operation. Fair value hedge In a fair value hedge, the Bank mainly uses interest rate swaps to hedge changes in the fair value of a hedged item. The carrying amount of the hedged item is adjusted based on the effective portion of the gains or losses attributable to the hedged risk, which are recognized in the Consolidated Statement of Income, and on the change in the fair value of the hedging instrument. The resulting ineffective portion is recognized in Non-interest income in the Consolidated Statement of Income. The Bank prospectively discontinues hedge accounting if the hedging instrument is sold or expires or if the hedging relationship no longer qualifies for hedge accounting or if the Bank revokes the designation. When the designation is revoked, the hedged item is no longer adjusted to reflect changes in fair value, and the amounts previously recorded as cumulative adjustments with respect to the effective portion of gains and losses attributable to the hedged risk are amortized using the effective interest rate method and recognized in the Consolidated Statement of Income over the remaining useful life of the hedged item. If the hedged item is sold or terminated before maturity, the cumulative adjustments to the effective portion of gains and losses attributable to the hedged risk are immediately recorded in the Consolidated Statement of Income. Cash flow hedge In a cash flow hedge, the Bank mainly uses interest rate swaps and total return swaps to hedge variable cash flows attributable to the hedged risk related to a financial asset or liability (or to a group of financial assets or liabilities). The effective portion of changes in fair value of the hedging instrument is recognized in Other comprehensive income and the ineffective portion in Non-interest income in the Consolidated Statement of Income. The amounts previously recorded in Accumulated other comprehensive income are reclassified to the Consolidated Statement of Income of the period or periods during which the cash flows of the hedged item affect the Consolidated Statement of Income. If the hedging instrument is sold or expires or if the hedging relationship no longer qualifies for hedge accounting or if the Bank cancels that designation, then the amounts previously recognized in Accumulated other comprehensive income are reclassified to the Consolidated Statement of Income in the period or periods during which the cash flows of the hedged item affect the Consolidated Statement of Income. Hedge of a net investment in a foreign operation Derivative and non-derivative financial instruments are used to hedge foreign exchange risk related to investments made in foreign operations whose functional currency is not the Canadian dollar. The effective portion of the gains and losses on the hedging instrument is recognized in Other comprehensive income and the ineffective portion in Non-interest income in the Consolidated Statement of Income. Upon the total or partial sale of a net investment in a foreign operation, amounts reported in Other comprehensive income are reclassified, in whole or in part, to Non-interest income in the Consolidated Statement of Income. Offsetting of Financial Assets and Liabilities Financial assets and liabilities are offset and the net amount is presented on the Consolidated Balance Sheet when the Bank has a legally enforceable right to set off the recognized amounts and intends to settle on a net basis or to realize the asset and settle the liability simultaneously.

AUDITED CONSOLIDATED FINANCIAL STATEMENTS NOTES TO THE AUDITED CONSOLIDATED FINANCIAL STATEMENTS (millions of Canadian dollars)
122 National Bank of Canada 2014 Annual Report
NOTE 1 – BASIS OF PRESENTATION AND SUMMARY OF SIGNIFICANT ACCOUNTING POLICIES (cont.) Premises and Equipment Premises and equipment, except for land, are recognized at cost less accumulated amortization and accumulated impairment losses. Land is recorded at cost net of any impairment losses. Premises and equipment and the significant components of a building that have different useful lives or that provide economic benefits at a different pace are systematically amortized over their useful lives. Amortization methods and useful lives are reviewed on an annual basis. The amortization expense is recorded in Non-interest expenses in the Consolidated Statement of Income. Methods Useful life
Significant components of a building Exterior design Straight-line 20 years Interior design, roofing and electromechanical system Straight-line 30 years Structure Straight-line 75 years Other buildings 5% declining balance Equipment and furniture Straight-line 8 years Computer equipment Straight-line 3-4 years Leasehold improvements Straight-line (1) Computer equipment leased under a finance lease Straight-line 7 years
(1) Average 15-year amortization period is the lesser of the useful life or the lease term plus the first renewal option.
Goodwill The Bank uses the acquisition method to account for business combinations. The consideration transferred in a business combination is measured at the acquisition-date fair value and the transaction costs related to the acquisition are expensed as incurred. When the Bank acquires control of a business, all of the identifiable assets and liabilities of the acquiree, including intangible assets, are recorded at fair value. The interests previously held in the acquiree are also measured at fair value. Goodwill represents the excess of the purchase consideration and all previously held interests over the fair value of identifiable net assets of the acquiree. If the fair value of identifiable net assets exceeds the purchase consideration and all previously held interests, the difference is immediately recognized as a gain on a bargain purchase. Non-controlling interests in the net assets of consolidated subsidiaries are identified separately from the Bank’s ownership interest and can be initially measured at either fair value or at the non-controlling interest’s proportionate share of the acquiree’s identifiable net assets. The measurement basis is selected on a case-by-case basis. Following the acquisition, non-controlling interests consist of the value assigned to those interests at initial recognition plus the non-controlling interests’ share of changes in equity since the date of the combination. Intangible Assets Intangible assets with finite useful lives Software, internally-generated technological developments and certain other intangible assets are recognized at cost net of accumulated amortization and accumulated impairment losses. These intangible assets are systematically amortized on a straight-line basis over their useful lives, which vary between four and ten years. The amortization expense is recorded in Non-interest expenses in the Consolidated Statement of Income. Intangible assets with indefinite useful lives The Bank’s intangible assets with indefinite useful lives come from the acquisition of subsidiaries or groups of assets and consist of management contracts and a trademark. They are recognized at the acquisition-date fair value. At the end of each financial reporting period, the Bank reviews the useful lives to determine whether events and circumstances continue to support an indefinite useful life assessment.

AUDITED CONSOLIDATED FINANCIAL STATEMENTS NOTES TO THE AUDITED CONSOLIDATED FINANCIAL STATEMENTS (millions of Canadian dollars)
National Bank of Canada 123 2014 Annual Report
Impairment of Non-Financial Assets Premises and equipment and intangible assets with finite useful lives are tested for impairment when events or changes in circumstances indicate that their carrying value may not be recoverable. At the end of each reporting period, the Bank determines whether there is an indication that premises and equipment or intangible assets with finite useful lives may be impaired. Goodwill and intangible assets that are not yet available for use or that have indefinite useful lives are tested for impairment annually or more frequently if there is an indication that the asset might be impaired. An asset is tested for impairment by comparing its carrying amount with its recoverable amount. The recoverable amount must be estimated for the individual asset. Where it is not possible to estimate the recoverable amount of an individual asset, the recoverable amount of the cash-generating unit (CGU) to which the asset belongs will be determined. A CGU is the smallest identifiable group of assets that generates cash inflows that are largely independent of the cash inflows from other assets or groups of assets. The Bank uses judgment to identify CGUs. An asset’s recoverable amount is the higher of fair value less costs to sell and the value in use of the asset or CGU. Value in use is the present value of expected future cash flows from the asset or CGU. The recoverable amount of the CGU is determined using valuation models that consider various factors such as projected future cash flows, discount rates and growth rates. The use of different estimates and assumptions in applying the impairment tests could have a significant impact on income. Corporate assets, such as the head office building and computer equipment, do not generate cash inflows that are largely independent of the cash inflows from other assets or groups of assets. Therefore, the recoverable amount of an individual corporate asset cannot be determined unless management has decided to dispose of the asset. However, if there is an indication that a corporate asset may be impaired, the recoverable amount is determined for the CGU or group of CGUs to which the corporate asset belongs, and is compared with the carrying amount of this CGU or group of CGUs. Goodwill is always tested for impairment at the level of a CGU or groups of CGUs. For impairment testing purposes, from the acquisition date, goodwill resulting from a business combination must be allocated to the CGU or group of CGUs expected to benefit from the synergies of the business combination. Each CGU or group of CGUs to which goodwill is allocated must represent the lowest level for which the goodwill is monitored internally at the Bank and must not be larger than an operating segment. The allocation of goodwill to a CGU or group of CGUs involves management’s judgment. If an impairment loss is to be recognized, the Bank does so by first reducing the carrying amount of goodwill allocated to the CGU or group of CGUs and then reducing the carrying amounts of the other assets of the CGU or group of CGUs in proportion to the carrying amount of each asset in the CGU or group of CGUs. If the recoverable amount of an asset or a CGU is less than its carrying amount, the carrying amount is reduced to its recoverable amount and an impairment loss is recognized in Non-interest expenses in the Consolidated Statement of Income. An impairment loss recognized in prior periods for an asset other than goodwill must be reversed if, and only if, there has been a change in the estimates used to determine the asset’s recoverable amount since the last impairment was recognized. If this is the case, the carrying amount of the asset is increased, as the impairment loss was reversed, but shall not exceed the carrying amount that would have been determined, net of amortization, had no impairment loss been recognized for this asset in previous years. Provisions Provisions are liabilities of uncertain timing and amount. A provision is recognized when the Bank has a present obligation (legal or constructive) arising from a past event, when it is probable that an outflow of economic resources will be required to settle the obligation and when the amount of the obligation can be reliably estimated. Provisions are based on the Bank’s best estimates of the economic resources required to settle the present obligation, given all relevant risks and uncertainties, and, when it is significant, the effect of the time value of money. The provisions are reviewed at the end of each financial reporting period and changes in the estimates are reflected in the Consolidated Statement of Income of the revaluation period. Provisions are presented in Other liabilities on the Consolidated Balance Sheet.

AUDITED CONSOLIDATED FINANCIAL STATEMENTS NOTES TO THE AUDITED CONSOLIDATED FINANCIAL STATEMENTS (millions of Canadian dollars)
124 National Bank of Canada 2014 Annual Report
NOTE 1 – BASIS OF PRESENTATION AND SUMMARY OF SIGNIFICANT ACCOUNTING POLICIES (cont.) Revenue Recognition The Bank’s revenues are recognized in the Consolidated Statement of Income as they are earned. Interest income and expense Interest income and expense, except for the interest income on securities classified at fair value through profit or loss, are recognized in Net interest income and calculated using the effective interest rate method. The effective interest rate is the rate that discounts estimated future cash inflows and outflows through the expected life of the financial instrument (or, when appropriate, a shorter period) to the net carrying amount of the instrument. When calculating the effective interest rate, the Bank estimates cash flows considering all contractual terms of the financial instrument but without considering future credit losses and also includes all fees paid or received related to the contract that are an integral part of the effective interest rate, transaction costs and all other premiums or discounts. Commission revenues Loan origination fees, including commitment, restructuring and renegotiation fees, are considered an integral part of the yield earned on the loan. They are deferred and amortized using the effective interest rate method, and the amortization is recognized in Interest income over the term of the loan. Direct costs for originating a loan are netted against the loan origination fees. If it is likely that a commitment will result in a loan, commitment fees receive the same accounting treatment, i.e., they are deferred and amortized using the effective interest rate method and the amortization is recognized in Interest income over the term of the loan. Otherwise, they are recorded in Non-interest income over the term of the commitment. Loan syndication fees are recorded in Non-interest income unless the yield on the loan retained by the Bank is less than that of other comparable lenders involved in the financing. In such cases, an appropriate portion of the fees is deferred and amortized using the effective interest rate method, and the amortization is recognized in Interest income over the term of the loan. Certain mortgage loan prepayment fees are recognized as Credit fees in the Consolidated Statement of Income when earned. Dividend income Dividends from an equity instrument are recognized in the Consolidated Statement of Income when the Bank’s right to receive payment is established. Insurance revenues Insurance contracts, including reinsurance contracts, are arrangements under which one party accepts significant insurance risk by agreeing to compensate the policyholder if a specified uncertain future event were to occur. Gross premiums, net of premiums transferred under reinsurance contracts, are recognized when they become due. Royalties received from reinsurers are recognized when earned. Claims are recognized when received and an amount is estimated as they are being processed. All of these amounts are recognized on a net basis in Non-interest income in the Consolidated Statement of Income. Upon recognition of a premium, a reinsurance asset and insurance liability are recognized, respectively, in Other assets and in Other liabilities on the Consolidated Balance Sheet. Subsequent changes in the carrying value of the reinsurance asset and insurance liability are recognized on a net basis in Non-interest income in the Consolidated Statement of Income. Income Taxes Income taxes include current taxes and deferred taxes and are recorded in net income except for income taxes generated by items recognized in Other comprehensive income or directly in equity. Current tax is the amount of income tax payable on the taxable income for a period. It is calculated using the enacted or substantively enacted tax rates prevailing on the reporting date, and any adjustments recognized in the period for current tax of prior periods. Current tax assets and liabilities are offset and the net balance is presented in either Other assets or Other liabilities on the Consolidated Balance Sheet when the Bank has a legally enforceable right to set off the recognized amounts and intends to settle on a net basis or to simultaneously realize the asset and settle the liability. Deferred tax is established based on temporary differences between the carrying values and the tax bases of assets and liabilities, in accordance with enacted or substantively enacted income tax laws and rates that will apply on the date the differences will reverse. Deferred tax is not recognized for temporary differences related to the following.
— The initial accounting of goodwill. — The initial accounting of an asset or liability in a transaction that is not a business combination and that, at the time of the transaction, affects neither
accounting income nor taxable income. — Investments in subsidiaries, associates and joint ventures when it is probable that the temporary difference will not reverse in the foreseeable future and
that the Bank controls the timing of the reversal of the temporary difference. — Investments in subsidiaries, associates and joint ventures when it is probable that the temporary difference will not reverse in the foreseeable future and
that there will not be taxable income to which the temporary difference can be recognized.

AUDITED CONSOLIDATED FINANCIAL STATEMENTS NOTES TO THE AUDITED CONSOLIDATED FINANCIAL STATEMENTS (millions of Canadian dollars)
National Bank of Canada 125 2014 Annual Report
Deferred tax assets represent the tax benefits related to deductions the Bank may claim to reduce its taxable income in future years. The carrying amount of deferred tax assets is revised at the end of each reporting period and reduced to the extent that it is no longer probable that sufficient taxable income will be available to allow the benefit of the deferred tax asset. Deferred tax assets and liabilities are offset and the net balance is presented in either Other assets or Other liabilities on the Consolidated Balance Sheet when the Bank has a legally enforceable right to set off the current tax assets and liabilities, and if the deferred tax assets and liabilities relate to taxes levied by the same taxation authority on the same taxable entity, or on different taxable entities that intend to settle current tax assets and liabilities based on their net amount. The Bank makes assumptions to estimate income taxes as well as deferred tax assets and liabilities. This process includes estimating the actual amount of current taxes and evaluating tax loss carry forwards and temporary differences arising from differences between the values of the items reported for accounting and for income tax purposes. Deferred tax assets and liabilities presented on the Consolidated Balance Sheet are calculated according to the tax rates to be applied in future periods. Previously recorded deferred tax assets and liabilities must be adjusted when the date of the future event is revised based on current information. In the Bank’s opinion, based on the information at its disposal, it is probable that all deferred tax assets will be realized prior to their expiration. Moreover, the Bank is subject to the jurisdiction of various tax authorities. In the normal course of its business, the Bank is involved in a number of transactions for which the tax impacts are uncertain. As a result, the Bank accounts for provisions for uncertain tax positions that adequately represent the tax risk stemming from tax matters under discussion or being audited by tax authorities or from other matters involving uncertainty. The amounts of these provisions reflect the best possible estimates of the amounts that may have to be paid based on qualitative assessments of all relevant factors. The provisions are estimated at the end of each reporting period. However, it is possible that an adjustment to the provision needs to be recognized at a future date following an audit by the tax authorities. When the final assessment differs from the initially provisioned amounts, the difference will impact the income taxes of the period in which the assessment was made. Financial Guarantee Contracts A financial guarantee contract is a contract or indemnification agreement that could require the Bank to make specified payments (in cash, financial instruments, other assets, Bank shares, or provisions of services) to reimburse the beneficiary in the event of a loss resulting from a debtor defaulting on the original or amended terms of a debt instrument. To reflect the fair value of the obligation assumed at the inception of a guarantee, a liability is recorded in Other liabilities on the Consolidated Balance Sheet. After initial recognition, the Bank must measure financial guarantee contracts at the higher of the estimated amount needed to settle the financial obligation under the guarantee or the amount initially recognized less, where applicable, the accumulated amortization that corresponds to revenue earned during the period. This revenue is recognized in Credit fees in the Consolidated Statement of Income. Employee Benefits – Pension Plans and Other Post-Employment Benefits The Bank offers defined benefit pension plans and other post-employment benefit plans to eligible employees. The other post-employment benefit plans include post-retirement medical, dental and life insurance coverage. While pension plans are funded, the other plans are not. Plan expenses and obligations are determined using actuarial valuations based on the projected benefit method prorated on service. The calculations use management’s best estimates of various actuarial assumptions such as discount rates, rates of compensation increase, health care cost trend rates, mortality rates and retirement age. The discount rate assumption is determined using an interest rate curve that represents the reporting date yield on high-quality corporate bonds with terms nearing those of the Bank’s plan obligations. The net asset or net liability of pension plans and other benefit plans are calculated separately for each plan as the difference between the present value of the future benefits earned by employees in respect of current- and prior-period service and the fair value of plan assets. The net asset or net liability is included in either the Other assets or Other liabilities item of the Consolidated Balance Sheet. The expense related to pension plans and other benefit plans consists of the following items: current service cost, net interest on the net plan asset or liability, administrative costs and past service cost, if any, recognized when a plan is amended. This expense is recognized in Compensation and employee benefits in the Consolidated Statement of Income. The net amount of interest income and expense is determined by applying the discount rate to the net plan asset or liability amount. Revaluations resulting from pension plans and other post-employment benefit plans represent actuarial gains and losses related to the defined benefit obligation and the actual return on plan assets, excluding net interest determined by applying the discount rate to the net asset or liability of the plans. Revaluations are immediately recognized in Other comprehensive income and will not be subsequently reclassified to net income; they will be recognized in Retained earnings.

AUDITED CONSOLIDATED FINANCIAL STATEMENTS NOTES TO THE AUDITED CONSOLIDATED FINANCIAL STATEMENTS (millions of Canadian dollars)
126 National Bank of Canada 2014 Annual Report
NOTE 1 – BASIS OF PRESENTATION AND SUMMARY OF SIGNIFICANT ACCOUNTING POLICIES (cont.) Share-Based Payments The Bank has several share-based compensation plans: the Stock Option Plan, the Stock Appreciation Rights (SAR) Plan, the Deferred Stock Unit (DSU) Plan, the Restricted Stock Unit (RSU) Plan, the Performance Stock Unit (PSU) Plan, the Deferred Compensation Plan (DCP) of National Bank Financial and the Employee Share Ownership Plan. Compensation expense is recognized over the service period required for employees to become fully entitled to the award. This period is generally the same as the vesting period, except where the required service period begins before the award date. Compensation expense related to awards granted to employees eligible to retire on the award date is immediately recognized on the award date. Compensation expense related to awards granted to employees who will become eligible to retire during the vesting period is recognized over the period from the award date to the date the employee becomes eligible to retire. For all of these plans, as of the first year of recognition, the expense includes cancellation and forfeiture estimates. These estimates are subsequently revised as necessary. The Bank uses derivative financial instruments to hedge the risks associated with some of these plans. The compensation expense for these plans, net of related hedges, is recognized in the Consolidated Statement of Income. Under the Stock Option Plan, the Bank uses the fair value method to account for stock options awarded. The options vest at 25% per year, and each tranche is treated as though it was a separate award. The fair value of each of the tranches is measured on the award date using the Black-Scholes model, and this fair value is recognized in Compensation and employee benefits and Contributed surplus. When the options are exercised, the Contributed surplus amount is credited to Equity – Common shares on the Consolidated Balance Sheet. The proceeds received from the employees when these options are exercised are also credited to Equity – Common shares on the Consolidated Balance Sheet. SARs are recorded at fair value when awarded and their fair value is remeasured at the end of each reporting period until they are exercised. The cost is recognized in Compensation and employee benefits in the Consolidated Statement of Income and in Other liabilities on the Consolidated Balance Sheet. The obligation that results from the change in fair value at each period is recognized in net income gradually over the vesting period, and periodically thereafter, until the SARs are exercised. When a SAR is exercised, the Bank makes a cash payment equal to the increase in the stock price since the date of the award. The obligation that results from the award of a DSU, RSU, PSU and DCP unit is recognized in net income, and the corresponding amount is included in Other liabilities on the Consolidated Balance Sheet. For the DSU, RSU and DCP plans, the change in the obligation attributable to variations in the share price and dividends paid on common shares for these plans is recognized in Compensation and employee benefits in the Consolidated Statement of Income for the period in which the variations occur. On the redemption date, the Bank makes a cash payment equal to the value of the common shares on that date. For the PSU Plan, the change in the obligation attributable to changes in the stock price, adjusted upward or downward depending on the relative result of the performance criteria, and the change in the obligation attributable to dividends paid on the shares awarded under the plan, are recognized in Compensation and employee benefits in the Consolidated Statement of Income for the period in which the changes occur. On the redemption date, the Bank makes a cash payment equal to the value of the common shares on that date, adjusted upward or downward according to the performance criteria. This is based on the total shareholder return (TSR) achieved by the Bank compared to that of the S&P/TSX Banks Sub-index. The Bank’s contributions to the employee share ownership plan are expensed as incurred.

AUDITED CONSOLIDATED FINANCIAL STATEMENTS NOTES TO THE AUDITED CONSOLIDATED FINANCIAL STATEMENTS (millions of Canadian dollars)
National Bank of Canada 127 2014 Annual Report
NOTE 2 – ACCOUNTING POLICY CHANGES The IASB issues revisions and amendments to a number of standards, some of which have already had an impact on the Bank and others that could have an impact in the future. A summary of these amendments and the effective dates applicable to the Bank are presented below. According to OSFI, the Bank cannot early adopt these standards nor the amendments, except for certain IFRS 9 requirements related to recognizing changes in an entity’s own credit risk. Effective Date – November 1, 2013 As required by the IASB, on November 1, 2013, the Bank adopted the following new or amended accounting standards. IAS 19 – Employee Benefits In June 2011, the IASB issued an amended version of IAS 19, introducing significant changes to the accounting of employee benefits, primarily for defined benefit pension plans. The main changes to the revised standard are as follows.
— The expected return on plan assets is no longer used in calculating pension plan expense. The discount rate used to measure the accrued benefit obligation must also be used to measure the return on plan assets.
— Past service costs are recognized when a plan is amended, with no deferral over the vesting period. — Additional annual disclosure is to be provided regarding the characteristics of defined benefit plans and the risks to which entities are exposed by
participating in those plans. This disclosure information is provided in Note 23. — Revaluations are immediately recognized in Other comprehensive income. Revaluations can no longer be deferred. This last amendment has had no
impact since the Bank had already been recognizing revaluations in Other comprehensive income. The requirements of the amended version of IAS 19 have been applied retrospectively. The impacts on the Consolidated Balance Sheet as at October 31, 2013 are presented below. There is no impact on the Consolidated Balance Sheet as at November 1, 2012. As at October 31, 2013
Consolidated Balance Sheet Increase in Other assets 15 Decrease in Other liabilities 6 Increase in Retained earnings 21
Retrospective adoption of the changes had the following impacts on the Consolidated Statement of Income and the Consolidated Statement of Comprehensive Income for the fiscal year ended October 31, 2013.
Year ended October 31, 2013
Consolidated Statements of Income and Comprehensive Income Increase in Compensation and employee benefits(1) 41 Decrease in Income taxes 11 Decrease in Net income 30 Increase in Other comprehensive income – Revaluations of pension plans and other post-employment benefit plans 51 Increase in Comprehensive income 21 Decrease in earnings per share(2) (dollars) Basic 0.09 Diluted 0.09
(1) This amount includes a $35 million decrease in past service costs, less a $6 million reduction recorded under the previous IAS 19, resulting from changes that had been made to provisions in the pension plans and other post-employment plans during the year ended October 31, 2013.
(2) Reflecting the stock dividend paid on February 13, 2014. See Note 18.
IFRS 10 – Consolidated Financial Statements IFRS 10 replaces the consolidation guidance in IAS 27 – Consolidated and Separate Financial Statements and in interpretation SIC-12 – Consolidation – Special Purpose Entities, by establishing a single consolidation model based on control for all interests held in all types of entities (investees). According to IFRS 10, control is based on the concepts of decision-making authority regarding the investee’s relevant activities, exposure or rights to variable returns from its involvement with the investee, and the ability to exercise power to affect the amount of returns. An entity must consolidate the entities it controls and present consolidated financial statements.

AUDITED CONSOLIDATED FINANCIAL STATEMENTS NOTES TO THE AUDITED CONSOLIDATED FINANCIAL STATEMENTS (millions of Canadian dollars)
128 National Bank of Canada 2014 Annual Report
NOTE 2 – ACCOUNTING POLICY CHANGES (cont.)
The Bank retrospectively adopted IFRS 10, the impact of which was the deconsolidation of NBC Capital Trust (the Trust). Under IFRS 10, the Bank does not control the Trust because the Bank’s interest does not expose it to variable returns. The Bank’s earnings per share was not affected. The impacts of the deconsolidation were as follows. — A $225 million increase in Deposits on the Consolidated Balance Sheet as at October 31, 2013 and as at November 1, 2012, representing the Trust’s
deposit note. — A $229 million decrease in Non-controlling interests on the Consolidated Balance Sheet as at October 31, 2013 and as at November 1, 2012,
representing the trust units issued by the Trust. — A $4 million increase in Other liabilities on the Consolidated Balance Sheet as at October 31, 2013 and as at November 1, 2012, representing accrued
interest payable on the deposit note. — A $12 million decrease in Net income and an equivalent decrease in Non-controlling interests in the Consolidated Statement of Income for the year ended
October 31, 2013. IFRS 7 – Financial Instruments: Disclosures The amendments to IFRS 7 require disclosure about legally enforceable rights of set-off for financial instruments under master netting agreements or similar arrangements. The Bank retrospectively adopted these amendments, which had no impact on its results or financial position since the standard only affects disclosures. The required IFRS 7 disclosure amendments are presented in Note 5. IFRS 11 – Joint Arrangements IFRS 11 – Joint Arrangements replaces IAS 31 – Interests in Joint Ventures and SIC-13 – Jointly Controlled Entities – Non-Monetary Contributions by Venturers. Under IFRS 11, a joint arrangement is an arrangement in which two or more parties have joint control. Joint control means the contractually agreed sharing of control of an arrangement, which exists only when decisions about the relevant activities require the unanimous consent of the parties sharing control. Under IFRS 11, a joint arrangement must be classified as either a joint operation or a joint venture, depending on an assessment of the rights and obligations of the parties to the arrangement. A joint operation is a joint arrangement wherein joint operators have rights to the assets and obligations for the liabilities. A joint operator shall account for the assets, liabilities, revenues and expenses relating to its interest in a joint operation in accordance with the IFRS standards applicable to the particular assets, liabilities, revenues and expenses. A joint venture is a joint arrangement wherein the joint venturers have rights to the net assets of the arrangement. A joint venturer accounts for its interest in a joint venture using the equity method. The Bank retrospectively adopted IFRS 11 and concluded that the joint arrangements in which it has rights constitute joint ventures. Since these investments had already been accounted for using the equity method under IAS 31, there was no impact on the Bank’s consolidated financial statements. IFRS 12 – Disclosure of Interests in Other Entities IFRS 12 applies to entities that hold interests in subsidiaries, joint arrangements, associates and non-consolidated structured entities. It requires additional disclosure that enables financial statement users to assess the nature of, and risks associated with, an entity’s interests in other entities and the effects of those interests on the entity’s financial position, financial performance and cash flows. The Bank retrospectively adopted IFRS 12, and the required disclosures are presented in Notes 8, 9, 19, 26 and 28. IFRS 13 – Fair Value Measurement IFRS 13 defines fair value, sets out in a single standard a framework for measuring fair value and prescribes disclosure requirements for fair value measurements. Prospective adoption of this standard did not have a significant impact on the Bank’s consolidated financial statements. The additional annual disclosures are presented in Note 3.

AUDITED CONSOLIDATED FINANCIAL STATEMENTS NOTES TO THE AUDITED CONSOLIDATED FINANCIAL STATEMENTS (millions of Canadian dollars)
National Bank of Canada 129 2014 Annual Report
Effective Date – November 1, 2014 IAS 32 – Financial Instruments: Presentation IAS 32 was amended to clarify the requirements for offsetting financial assets and financial liabilities in order to reduce inconsistencies in current practice. Retrospective adoption of this interpretation will not have a significant impact on the Bank’s consolidated financial statements. IFRIC Interpretation 21 – Levies IFRIC Interpretation 21 provides guidance on when to recognize a liability to pay a levy imposed by a government that is accounted for in accordance with IAS 37 – Provisions, Contingent Liabilities and Contingent Assets. Retrospective adoption of this interpretation will not have a significant impact on the Bank’s consolidated financial statements. Effective Date – November 1, 2017 IFRS 15 – Revenue from Contracts with Customers In May 2014, the IASB issued a new standard, IFRS 15, which replaces the current revenue recognition standards and interpretations. IFRS 15 provides a single comprehensive model to use when accounting for revenue arising from contracts with customers. The new model applies to all contracts with customers except those that are within the scope of other IFRS standards such as leases, insurance contracts and financial instruments. IFRS 15 is to be applied retrospectively, and the Bank is currently assessing the impact of adopting this standard. Effective Date – November 1, 2018 IFRS 9 – Financial Instruments In July 2014, the IASB issued a complete and final version of IFRS 9, which replaces the current standard on financial instruments. IFRS 9 sets out requirements for the classification and measurement of financial assets and financial liabilities, for the impairment of financial assets, and for general hedge accounting. Macro hedge accounting has been decoupled from IFRS 9 and will be considered and issued as a separate standard. IFRS 9 provides a single model for financial asset classification and measurement that is based on contractual cash flow characteristics and on the business model for holding financial assets. With respect to measuring financial liabilities designated at fair value through profit or loss, the standard prescribes that fair value changes attributable to an entity’s own credit risk be accounted for in Other comprehensive income unless they offset amounts recognized in Net income. The IASB and OSFI are permitting early adoption of these new requirements for recognizing changes in an entity’s own credit risk. IFRS 9 also introduces a new impairment model for financial assets not measured at fair value through profit or loss that requires recognition of expected credit losses rather than incurred losses as applied under the current standard. As for the new hedge accounting model, it provides better alignment of hedge accounting with risk management activities. However, the current hedge accounting requirements may continue to be applied until the IASB finalizes its macro hedge accounting project. In general, IFRS 9 is to be applied retrospectively, and the Bank is currently assessing the impact of adopting this standard.

AUDITED CONSOLIDATED FINANCIAL STATEMENTS NOTES TO THE AUDITED CONSOLIDATED FINANCIAL STATEMENTS (millions of Canadian dollars)
130 National Bank of Canada 2014 Annual Report
NOTE 3 – FAIR VALUE OF FINANCIAL INSTRUMENTS
Fair Value and Carrying Value of Financial Instruments by Category
Financial assets and financial liabilities are recognized on the Consolidated Balance Sheet at fair value or at amortized cost in accordance with the categories set out in the accounting framework for financial instruments. The Bank did not classify any financial assets as held to maturity.
As at October 31, 2014
Carrying value and fair value Carrying value Fair value
Total carrying
value
Total fair
value
Financial instruments
classified as at fair
value through profit or loss
Financial instruments designated at fair value
through profit or loss
Available- for-sale
Loans and
receivables and financial
liabilities at amortized cost
Loans and
receivables and financial
liabilities at amortized cost
Financial assets Cash and deposits with financial institutions 8,086 8,086 8,086 8,086 Securities 40,560 2,640 9,753 52,953 52,953 Securities purchased under reverse repurchase agreements and securities borrowed 415 24,110 24,110 24,525 24,525 Loans and acceptances 2,762 121 103,286 103,956 106,169 106,839 Other Derivative financial instruments 7,092 7,092 7,092 Due from clients, dealers and brokers 861 861 861 861 Other assets 1,244 1,244 1,244 1,244
Financial liabilities Deposits 2,524 117,359 (1) 117,707 119,883 120,231 Other Acceptances 8,926 8,926 8,926 8,926 Obligations related to securities sold short 18,167 18,167 18,167 Obligations related to securities sold under repurchase agreements and securities loaned 16,780 16,780 16,780 16,780 Derivative financial instruments 5,721 5,721 5,721 Due to clients, dealers and brokers 1,996 1,996 1,996 1,996 Liabilities related to transferred receivables 6,127 10,952 11,067 17,079 17,194 Other liabilities 133 2,224 2,243 2,357 2,376 Subordinated debt 1,881 1,904 1,881 1,904
(1) Including embedded derivative financial instruments.

AUDITED CONSOLIDATED FINANCIAL STATEMENTS NOTES TO THE AUDITED CONSOLIDATED FINANCIAL STATEMENTS (millions of Canadian dollars)
National Bank of Canada 131 2014 Annual Report
As at October 31, 2013(1)
Carrying value and fair value Carrying value Fair value
Total carrying
value
Total fair
value
Financial instruments
classified as at fair
value through profit or loss
Financial instruments designated at fair value
through profit or loss
Available- for-sale
Loans and
receivables and financial
liabilities at amortized cost
Loans and
receivables and financial
liabilities at amortized cost
Financial assets Cash and deposits with financial institutions 3,596 3,596 3,596 3,596 Securities 40,778 3,222 9,744 53,744 53,744 Securities purchased under reverse repurchase agreements and securities borrowed 21,449 21,449 21,449 21,449 Loans and acceptances 1,526 62 95,750 96,323 97,338 97,911 Other Derivative financial instruments 5,904 5,904 5,904 Due from clients, dealers and brokers 1,101 1,101 1,101 1,101 Other assets 891 891 891 891
Financial liabilities Deposits 1,846 100,265 (2) 100,639 102,111 102,485 Other Acceptances 8,954 8,954 8,954 8,954 Obligations related to securities sold short 18,909 18,909 18,909 Obligations related to securities sold under repurchase agreements and securities loaned 19,746 19,746 19,746 19,746 Derivative financial instruments 4,858 4,858 4,858 Due to clients, dealers and brokers 2,442 2,442 2,442 2,442 Liabilities related to transferred receivables 6,819 8,504 8,593 15,323 15,412 Other liabilities 109 2,297 2,334 2,406 2,443 Subordinated debt 2,426 2,450 2,426 2,450
(1) Certain amounts have been adjusted to reflect changes in accounting standards. See Note 2. (2) Including embedded derivative financial instruments.

AUDITED CONSOLIDATED FINANCIAL STATEMENTS NOTES TO THE AUDITED CONSOLIDATED FINANCIAL STATEMENTS (millions of Canadian dollars)
132 National Bank of Canada 2014 Annual Report
NOTE 3 – FAIR VALUE OF FINANCIAL INSTRUMENTS (cont.)
Establishing Fair Value
Unadjusted quoted prices in active markets provide the best evidence of fair value. When there is no quoted price in an active market, the Bank will apply other valuation techniques that maximize the use of relevant observable inputs and that minimize the use of unobservable inputs. Such valuation techniques include the following: using information available from recent market transactions, referring to the current fair value of a comparable financial instrument, applying discounted cash flow analysis, applying option pricing models, or relying on any other valuation technique that is commonly used by market participants and has proven to yield reliable estimates. Judgment is required when applying many of the valuation techniques. Valuation Governance Fair value is established in accordance with a rigorous control framework. The Bank has policies and procedures that govern the process for determining fair value. These policies are documented and periodically reviewed by the Risk Management Group. All valuation models are validated, and controls have been implemented to ensure that they are applied. The fair value of existing or new products is determined and validated by functions independent of the risk-taking team. Fair value matters are reviewed by complex valuation committees made up of experts from various support functions. For financial instruments classified in Level 3 of the fair value hierarchy, the Bank has documented the classification policies to determine the hierarchy and there are controls in place to ensure that fair value is measured appropriately, reliably and consistently. Valuation methods and the underlying assumptions are reviewed on a regular basis. Valuation Methods and Assumptions Financial instruments whose fair value equals carrying value The carrying value of the following financial instruments is a reasonable approximation of fair value:
— cash and deposits with financial institutions; — securities purchased under reverse repurchase agreements and securities borrowed; — obligations related to securities sold under repurchase agreements and securities loaned; — customers’ liability under acceptances; — acceptances; — amounts due from clients, dealers and brokers; — amounts due to clients, dealers and brokers; and — certain items of other assets and other liabilities. Securities and obligations related to securities sold short These financial instruments are recognized at fair value on the Consolidated Balance Sheet. Their fair value is based on quoted prices in active markets, i.e., bid prices for financial assets and offered prices for financial liabilities. If there are no quoted prices in an active market, fair value is estimated based on prices for securities that, in substance, are identical. If such prices are not available, fair value is determined using valuation techniques that incorporate assumptions based primarily on observable market inputs such as current market prices, the contractual prices of the underlying instruments, the time value of money, credit risk, interest rate yield curves and currency rates. When one or more significant inputs are not observable in the markets, fair value is established primarily on the basis of internal estimates and data that consider the valuation policies in effect at the Bank, economic conditions, the specific characteristics of the financial asset or liability and other relevant factors. Information about the fair value determination of the restructured notes of the master asset vehicle (MAV) conduits is presented in Note 6. Derivative financial instruments Derivative financial instruments are recorded at fair value on the Consolidated Balance Sheet. For exchange-traded derivative financial instruments, fair value is based on the quoted price in an active market, i.e., bid prices for financial assets or offered prices for financial liabilities. For over-the-counter (OTC) derivative financial instruments, fair value is determined using well established valuation techniques that incorporate assumptions based primarily on observable market inputs such as current market prices and the contractual prices of the underlying instruments, the time value of money, interest rate yield curves, credit curves, currency rates as well as price and rate volatility factors. When one or more significant inputs are not observable in the markets, fair value is established primarily on the basis of internal estimates and data that consider the valuation policies in effect at the Bank, economic conditions, the specific characteristics of the financial asset or financial liability and other relevant factors. In establishing the fair value of derivative financial instruments, the Bank incorporates credit risk by considering the credit quality of the Bank and of the counterparties to the contracts, the measurement of current or future market value of the transactions, and credit risk mitigation measures such as master netting arrangements and collateral agreements. The Bank also incorporates the market implied funding costs and benefits in determining the fair value of uncollateralized (or not fully collateralized) OTC derivative financial instruments.

AUDITED CONSOLIDATED FINANCIAL STATEMENTS NOTES TO THE AUDITED CONSOLIDATED FINANCIAL STATEMENTS (millions of Canadian dollars)
National Bank of Canada 133 2014 Annual Report
Loans The fair value of fixed-rate mortgage loans is determined by discounting expected future contractual cash flows, adjusted for several factors, including prepayment options, current market interest rates for similar loans, and other relevant variables where applicable. The fair value of variable-rate mortgage loans is deemed to equal carrying value. The fair value of other fixed-rate loans is determined by discounting expected future contractual cash flows using current market interest rates charged for similar new loans. The fair value of variable-rate loans is deemed to equal carrying value. Deposits The fair value of fixed-term deposits is determined primarily by discounting expected future contractual cash flows and considering several factors such as redemption options and market interest rates currently offered for financial instruments with similar conditions. The fair value of demand deposits and notice deposits is deemed to equal carrying value. For certain term financing instruments, fair value is determined using market prices for similar instruments. As for structured deposit notes, fair value is established using valuation models that maximize the use of observable inputs when available, such as benchmark indices. Liabilities related to transferred receivables These liabilities arise from two types of transactions: (1) the sale to Canada Housing Trust (CHT) of securities backed by insured residential mortgages and other securities under the Canada Mortgage Bond (CMB) program, and (2) the sale of insured and uninsured residential mortgages to a mutual fund administered by the Bank. These transactions do not qualify for derecognition. They are recorded as guaranteed borrowings, which results in the recording of liabilities on the Consolidated Balance Sheet. As part of the sale to CHT, the fair value of the liability is established using valuation techniques based on observable market inputs such as Canada Mortgage Bond prices. As for the sales to the mutual fund, the fair value of the liability is determined by discounting expected contractual cash flows, adjusted for prepayment options, using market interest rates currently offered for similar new financial instruments. Other liabilities and subordinated debt The fair value of these financial liabilities is based on quoted market prices in an active market. If there is no active market, fair value is determined by discounting contractual cash flows using the current market interest rates offered for similar financial instruments that have the same term to maturity.
AUDITED CONSOLIDATED FINANCIAL STATEMENTS NOTES TO THE AUDITED CONSOLIDATED FINANCIAL STATEMENTS (millions of Canadian dollars)
134 National Bank of Canada 2014 Annual Report
NOTE 3 – FAIR VALUE OF FINANCIAL INSTRUMENTS (cont.)
Hierarchy of Fair Value Measurements
IFRS establishes a fair value hierarchy that classifies the inputs used in financial instrument fair value measurement techniques according to three levels. This fair value hierarchy requires observable market inputs to be used whenever such inputs exist. According to the hierarchy, the highest level of inputs are unadjusted quoted prices in active markets for identical instruments and the lowest level of inputs are unobservable inputs. If inputs from different levels of the hierarchy are used, the financial instrument is classified in the same level as the lowest level input that is significant to the fair value measurement. The fair value hierarchy has the following levels. — Level 1: Inputs corresponding to unadjusted quoted prices in active markets for identical assets and liabilities and accessible to the Bank at the
measurement date. These instruments consist primarily of equity securities, derivative financial instruments traded in active markets, and certain highly liquid debt securities actively traded in over-the-counter markets.
— Level 2: Valuation techniques based on inputs, other than the quoted prices included in Level 1 inputs, that are directly or indirectly observable in the
market for the asset or liability. These inputs are quoted prices of similar instruments in active markets; quoted prices for identical or similar instruments in markets that are not active; inputs other than quoted prices used in a valuation model that are observable for that instrument; and inputs that are derived principally from or corroborated by observable market inputs by correlation or other means. These instruments consist primarily of certain loans, certain deposits, derivative financial instruments traded in over-the-counter markets, certain investment grade debt securities, certain equity securities whose value is not directly observable in an active market, liabilities related to transferred receivables and certain other liabilities.
— Level 3: Valuation techniques based on one or more significant inputs that are not observable in the market for the asset or liability. The Bank classifies
financial instruments in Level 3 when the valuation technique is based on at least one significant input that is not observable in the markets or when there is a lack of liquidity in certain markets. The valuation technique may also be partly based on observable market inputs.
Financial instruments whose fair values are classified in Level 3 consist mainly of the following. — Financial instruments measured at fair value through profit or loss: investments in the restructured notes of the MAV conduits (for additional information,
see Note 6), certain investments in asset-backed debt securities, investments in hedge funds for which there are certain restrictions on unit or security redemptions, as well as certain derivative financial instruments whose fair value is established using internal valuation models that are based on significant unobservable market inputs.
— Available-for-sale securities: investments in the restructured notes of the MAV conduits and private equity securities. — Certain loans and certain deposits (structured deposit notes) whose fair value is established using internal valuation models that are based on significant
unobservable market inputs. Transfers Between the Fair Value Hierarchy Levels Transfers of financial instruments between Levels 1 and 2 and transfers to (or from) Level 3 are deemed to have taken place at the beginning of the period. Significant transfers can occur between the fair value hierarchy levels due to new information on inputs used to determine fair value and the observable nature of those inputs. During fiscal years 2014 and 2013, there were no significant transfers of financial instruments between Levels 1 and 2 but financial instruments were transferred to (or from) Level 3 due to changes in the availability of observable market inputs resulting from changing market conditions.
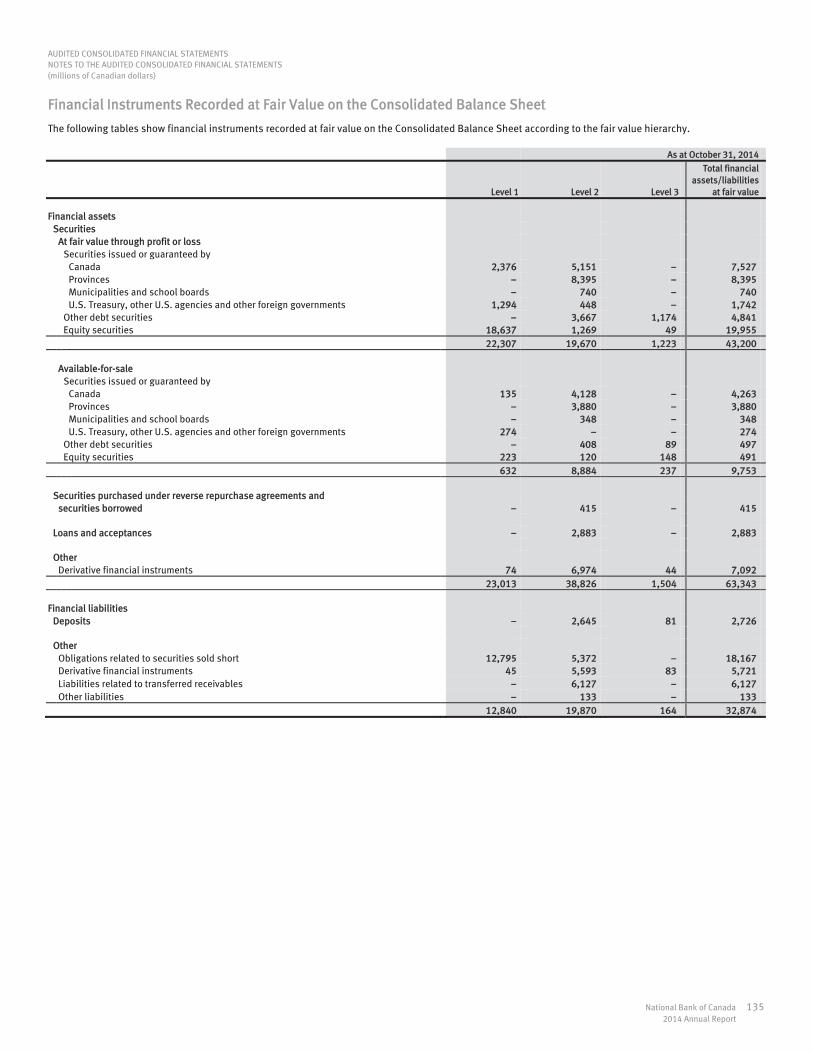
AUDITED CONSOLIDATED FINANCIAL STATEMENTS NOTES TO THE AUDITED CONSOLIDATED FINANCIAL STATEMENTS (millions of Canadian dollars)
National Bank of Canada 135 2014 Annual Report
Financial Instruments Recorded at Fair Value on the Consolidated Balance Sheet
The following tables show financial instruments recorded at fair value on the Consolidated Balance Sheet according to the fair value hierarchy. As at October 31, 2014
Level 1 Level 2 Level 3
Total financial assets/liabilities
at fair value
Financial assets Securities At fair value through profit or loss Securities issued or guaranteed by Canada 2,376 5,151 7,527 Provinces 8,395 8,395 Municipalities and school boards 740 740 U.S. Treasury, other U.S. agencies and other foreign governments 1,294 448 1,742 Other debt securities 3,667 1,174 4,841 Equity securities 18,637 1,269 49 19,955 22,307 19,670 1,223 43,200
Available-for-sale Securities issued or guaranteed by Canada 135 4,128 4,263 Provinces 3,880 3,880 Municipalities and school boards 348 348 U.S. Treasury, other U.S. agencies and other foreign governments 274 274 Other debt securities 408 89 497 Equity securities 223 120 148 491 632 8,884 237 9,753
Securities purchased under reverse repurchase agreements and securities borrowed 415 415 Loans and acceptances 2,883 2,883 Other Derivative financial instruments 74 6,974 44 7,092 23,013 38,826 1,504 63,343 Financial liabilities Deposits 2,645 81 2,726 Other Obligations related to securities sold short 12,795 5,372 18,167 Derivative financial instruments 45 5,593 83 5,721 Liabilities related to transferred receivables 6,127 6,127 Other liabilities 133 133 12,840 19,870 164 32,874

AUDITED CONSOLIDATED FINANCIAL STATEMENTS NOTES TO THE AUDITED CONSOLIDATED FINANCIAL STATEMENTS (millions of Canadian dollars)
136 National Bank of Canada 2014 Annual Report
NOTE 3 – FAIR VALUE OF FINANCIAL INSTRUMENTS (cont.) As at October 31, 2013
Level 1 Level 2 Level 3
Total financial assets/liabilities
at fair value
Financial assets Securities At fair value through profit or loss Securities issued or guaranteed by Canada 5,476 5,080 10,556 Provinces 10,654 10,654 Municipalities and school boards 367 367 U.S. Treasury, other U.S. agencies and other foreign governments 689 120 809 Other debt securities 2,664 1,305 3,969 Equity securities 15,929 1,670 46 17,645 22,094 20,555 1,351 44,000
Available-for-sale Securities issued or guaranteed by Canada 143 5,517 5,660 Provinces 2,617 2,617 Municipalities and school boards 302 302 U.S. Treasury, other U.S. agencies and other foreign governments 390 390 Other debt securities 253 77 330 Equity securities 209 65 171 445 742 8,754 248 9,744 Loans and acceptances 1,588 1,588 Other Derivative financial instruments 239 5,609 56 5,904 23,075 36,506 1,655 61,236 Financial liabilities Deposits 1,978 73 2,051 Other Obligations related to securities sold short 11,415 7,494 18,909 Derivative financial instruments 330 4,454 74 4,858 Liabilities related to transferred receivables 6,819 6,819 Other liabilities 109 109 11,745 20,854 147 32,746
Financial Instruments Classified in Level 3 The Bank classifies financial instruments in Level 3 when the valuation technique is based on at least one significant input that is not observable in the markets or when there is a lack of liquidity in certain markets. The valuation technique may also be based, in part, on observable market inputs. The following table shows the significant unobservable inputs used for the fair value measurements of financial instruments classified in Level 3 of the hierarchy.

AUDITED CONSOLIDATED FINANCIAL STATEMENTS NOTES TO THE AUDITED CONSOLIDATED FINANCIAL STATEMENTS (millions of Canadian dollars)
National Bank of Canada 137 2014 Annual Report
As at October 31, 2014
Fair
value Primary
valuation techniques Significant
unobservable inputs Range
of input values
Financial assets Securities Restructured notes of the MAV conduits Liquidity discount 1.50% to 6.31% and other restructured notes 1,236 Internal model(1) Credit spread 33 Bps to 560 Bps(2) Equity securities and other debt securities 224 Various(3) Various(3) Various(3) Other Long-term volatility 12% to 36% Derivative financial instruments 44 Option pricing model Long-term correlation (31)% to 81%
1,504 Financial liabilities Deposits Long-term volatility 14% to 35% Structured deposit notes 81 Option pricing model Long-term correlation (7)% to 78% Other Long-term volatility 12% to 36% Derivative financial instruments 83 Option pricing model Long-term correlation (31)% to 99% 164
(1) For a description of the valuation techniques, see note 6. (2) Bps or basis point is a unit of measure equal to 0.01%. (3) In the absence of an active market, the fair value of these securities is estimated based on an analysis of the investee’s financial position and results, risk profile, economic outlook and
other factors. Given the nature of the analysis in respect of each investment, it is not practical to quote a range of values for significant unobservable inputs.
Significant Unobservable Inputs Used for Fair Value Measurements Classified in Level 3 Liquidity discount The liquidity discount is the difference in liquidity between the measured financial asset and comparable assets. There is no predictable correlation between the liquidity discount and the credit spread. An increase (decrease) in this unobservable input generally results in a decrease (increase) in fair value. Credit spread Credit spread is the difference between a benchmark interest rate and the interest rate required by market participants to accept the lower credit quality of the measured financial asset. The interest rate on certain government bonds with a high credit rating and a maturity similar to the measured asset can often be considered a benchmark interest rate. An increase (decrease) in this unobservable input generally results in a decrease (increase) in fair value. Long-term volatility Volatility is a measure of the expected future variability of market prices. Volatility is generally observable in the market through options prices. However, the long-term volatility of options with a longer maturity might not be observable. An increase (decrease) in long-term volatility is generally associated with an increase (decrease) in long-term correlation. Higher long-term volatility may increase or decrease an instrument’s fair value depending on its terms. Long-term correlation Correlation is a measure of the inter-relationship between two different variables. A positive correlation means that the variables tend to move in the same direction; a negative correlation means that the variables tend to move in opposite directions. Correlation is used to measure financial instruments whose future returns depend on several variables. Changes in correlation will either increase or decrease a financial instrument’s fair value depending on the terms of its contractual payout. Sensitivity Analysis of Financial Instruments Classified in Level 3 The Bank performs sensitivity analyses for fair value measurements of financial instruments classified in Level 3, substituting unobservable inputs with one or more reasonably plausible alternative assumptions. For the sensitivity analysis of investments in the restructured notes of the MAV conduits, see Note 6. For private equity securities classified in Available-for-sale securities, the Bank varies significant unobservable market inputs such as net asset value or projected future cash flows and establishes a reasonable fair value range that could result in a $16 million increase or decrease in the fair value recorded as at October 31, 2014 (a $17 million increase or decrease as at October 31, 2013). For derivative financial instruments and embedded derivatives in structured deposit notes, the Bank varies long-term volatility and correlation inputs and establishes a reasonable fair value range. As at October 31, 2014, for derivative financial instruments, the net fair value could result in a $10 million increase or decrease ($12 million increase or decrease at October 31, 2013) whereas for structured deposit notes, the fair value could result in a $12 million increase or decrease ($6 million increase or decrease at October 31, 2013). For other financial instruments classified in Level 3, sensitivity analyses result in a negligible change in fair value.

AUDITED CONSOLIDATED FINANCIAL STATEMENTS NOTES TO THE AUDITED CONSOLIDATED FINANCIAL STATEMENTS (millions of Canadian dollars)
138 National Bank of Canada 2014 Annual Report
NOTE 3 – FAIR VALUE OF FINANCIAL INSTRUMENTS (cont.) Change in the Fair Value of Financial Instruments Classified in Level 3
The Bank may hedge the fair value of financial instruments classified in the various levels through offsetting hedge positions. Gains and losses for financial instruments classified in Level 3 presented in the following tables do not reflect the inverse gains and losses on financial instruments used for economic hedging purposes that may have been classified in Level 1 or 2 by the Bank. In addition, the Bank may hedge the fair value of financial instruments classified in Level 3 using other financial instruments classified in Level 3. The effect of these hedges is not included in the net amount presented in the following tables. The gains and losses presented hereafter may comprise changes in fair value based on observable and unobservable inputs. Year ended October 31, 2014
Securities at fair value
through profit or loss
Available- for-sale
securities Loans
Derivative financial
instruments(1)
Business and government
deposits
Fair value as at October 31, 2013 1,351 248 (18) (73) Total realized and unrealized gains (losses) included in Net income (2) 106 12 (6) 2 Total realized and unrealized gains (losses) included in Other comprehensive income 11 Purchases 24 18 Sales (207) (44) Issuances (51) Settlements and other (51) (9) Financial instruments transferred into Level 3 (9) (10) Financial instruments transferred out of Level 3 1 (6) 51 Fair value as at October 31, 2014 1,223 237 (39) (81) Change in unrealized gains and losses included in net income with respect to financial assets and financial liabilities held as at October 31, 2014(3) 98 (6) 2
Year ended October 31, 2013
Securities at fair value
through profit or loss
Available- for-sale
securities Loans
Derivative financial
instruments(1)
Business and government
deposits
Fair value as at October 31, 2012 1,326 270 (3) (36) (73) Total realized and unrealized gains (losses) included in Net income (4) 181 8 6 (3) Total realized and unrealized gains (losses) included in Other comprehensive income 13 Purchases 32 15 Sales (39) (43) Issuances 2 (68) Settlements and other (149) (15) 3 1 (1) Financial instruments transferred into Level 3 4 (20) Financial instruments transferred out of Level 3 5 92 Fair value as at October 31, 2013 1,351 248 (18) (73) Change in unrealized gains and losses included in net income with respect to financial assets and financial liabilities held as at October 31, 2013(5) 181 6 (3)
(1) The derivative financial instruments include assets and liabilities presented on a net basis. (2) Total net gains included in Non-interest income was $114 million. (3) Total unrealized gains included in Non-interest income was $94 million. (4) Total net gains included in Non-interest income was $192 million. (5) Total unrealized gains included in Non-interest income was $184 million.

AUDITED CONSOLIDATED FINANCIAL STATEMENTS NOTES TO THE AUDITED CONSOLIDATED FINANCIAL STATEMENTS (millions of Canadian dollars)
National Bank of Canada 139 2014 Annual Report
Financial Instruments Not Recorded at Fair Value on the Consolidated Balance Sheet
The following table shows the financial instruments that have not been recorded at fair value on the Consolidated Balance Sheet according to the fair value hierarchy, except for those whose fair value is equal to carrying value. As at October 31, 2014
Level 1 Level 2 Level 3 Total
Financial assets Loans 42,265 52,765 95,030 Financial liabilities Deposits 117,505 117,505 Other Liabilities related to transferred receivables 11,067 11,067 Other liabilities 1,354 1,354
Subordinated debt 1,904 1,904 131,830 131,830

AUDITED CONSOLIDATED FINANCIAL STATEMENTS NOTES TO THE AUDITED CONSOLIDATED FINANCIAL STATEMENTS (millions of Canadian dollars)
140 National Bank of Canada 2014 Annual Report
NOTE 4 – FINANCIAL INSTRUMENTS DESIGNATED AT FAIR VALUE THROUGH PROFIT OR LOSS The Bank chose to designate certain financial instruments at fair value through profit or loss according to criteria presented in Note 1. In accordance with its risk management strategy, which allows the Bank to eliminate or significantly reduce the measurement or recognition mismatch resulting from measuring financial assets and liabilities on different bases, the Bank designated certain securities, certain securities purchased under reverse repurchase agreements, and certain liabilities related to transferred receivables as at fair value through profit or loss. The fair value of liabilities related to transferred receivables does not include credit risk, as the holders of these liabilities are not exposed to the Bank’s credit risk. The Bank also designated certain hybrid financial instruments with one or more embedded derivatives, such as restructured notes of the MAV conduits, certain deposits, and certain loans as at fair value through profit or loss. There is no exposure to credit risk on the loans to the extent that they are fully collateralized. To determine a change in fair value arising from a change in the credit risk of deposits designated at fair value through profit or loss, the Bank calculates, at the beginning of the period, the present value of the instrument’s contractual cash flows using the following rates: first, using an observed discount rate that reflects the Bank’s credit spread and, then, using a rate that excludes the Bank’s credit spread. The difference between the two values is then compared to the difference obtained using the same rates at the end of the period. Information about the financial assets and financial liabilities designated at fair value through profit or loss is provided in the following tables. Year ended October 31, 2014
Carrying value as at
October 31
Change in the total fair value (including the
change in the fair value attributable
to credit risk)
Change in fair value
since the initial recognition
of the instrument
Financial assets designated at fair value through profit or loss Securities 2,640 117 416 Securities purchased under reverse repurchase agreements 415 Loans 121 (18) (18) 3,176 99 398
Financial liabilities designated at fair value through profit or loss Deposits(1)(2) 2,524 (77) (148) Liabilities related to transferred receivables 6,127 10 (183) 8,651 (67) (331)
Year ended October 31, 2013
Carrying value as at
October 31
Change in thetotal fair value (including the
change in the fairvalue attributable
to credit risk)
Change infair value
since the initialrecognition
of theinstrument
Financial assets designated at fair value through profit or loss Securities 3,222 136 343 Loans 62 2 2 3,284 138 345
Financial liabilities designated at fair value through profit or loss Deposits(1) 1,846 (99) (137) Liabilities related to transferred receivables 6,819 110 (190) 8,665 11 (327)
(1) For the year ended October 31, 2014, the change in the fair value of deposits designated at fair value through profit or loss attributable to credit risk resulted in a $2 million gain ($2 million for the year ended October 31, 2013).
(2) The amount at maturity that the Bank will be contractually required to pay to the holders of these deposits varies and will differ from the reporting date fair value.

AUDITED CONSOLIDATED FINANCIAL STATEMENTS NOTES TO THE AUDITED CONSOLIDATED FINANCIAL STATEMENTS (millions of Canadian dollars)
National Bank of Canada 141 2014 Annual Report
NOTE 5 – OFFSETTING FINANCIAL ASSETS AND FINANCIAL LIABILITIES Financial assets and liabilities are offset and the net amount is presented on the Consolidated Balance Sheet when the Bank has a legally enforceable right to set off the recognized amounts and intends to settle on a net basis or to realize the asset and settle the liability simultaneously. Generally, over-the-counter financial derivatives subject to master netting arrangements of the International Swaps & Derivatives Association, Inc. or other similar agreements do not meet the netting criteria on the Consolidated Balance Sheet because the right of set-off is legally enforceable only in the event of default, insolvency or bankruptcy. Generally, securities purchased under reverse repurchase agreements and securities borrowed as well as obligations related to securities sold under repurchase agreements and securities loaned, subject to master agreements, do not meet the netting criteria since they confer a right of set-off that is enforceable only in the event of default, insolvency or bankruptcy. However, the above-mentioned transactions may be subject to contractual netting agreements concluded with clearing houses. If the netting criteria are met, these transactions are netted on the consolidated balance sheet. In addition, as part of these transactions, the Bank may give or receive cash or other financial instruments used as collateral. The following tables present information on financial assets and financial liabilities that are netted on the consolidated balance sheet because they meet the netting criteria and on those that are not netted and are subject to an enforceable master netting arrangement or similar agreement. As at October 31, 2014
Gross amounts recognized
Amounts set off on the Consolidated
Balance Sheet
Net amounts
reported on the
Consolidated Balance Sheet
Associated amounts not set off on the
Consolidated Balance Sheet
Financial
instruments(1)
Financial assets received/pledged
as collateral(2) Net
amounts
Financial assets Securities purchased under reverse repurchase agreements and securities borrowed 32,381 7,856 24,525 2,825 21,608 92 Derivative financial instruments 7,585 493 7,092 3,661 1,960 1,471 39,966 8,349 31,617 6,486 23,568 1,563
Financial liabilities Obligations related to securities sold under repurchase agreements and securities loaned 24,636 7,856 16,780 2,825 13,852 103 Derivative financial instruments 6,214 493 5,721 3,661 698 1,362 30,850 8,349 22,501 6,486 14,550 1,465
As at October 31, 2013
Gross amounts recognized
Amounts set off on the Consolidated
Balance Sheet
Net amounts
reported on the
Consolidated Balance Sheet
Associated amounts not set off on the
Consolidated Balance Sheet
Financial
instruments(1)
Financial assets received/pledged
as collateral(2) Net
amounts
Financial assets Securities purchased under reverse repurchase agreements and securities borrowed 22,478 1,029 21,449 4,373 17,005 71 Derivative financial instruments 5,904 5,904 2,826 1,911 1,167 28,382 1,029 27,353 7,199 18,916 1,238
Financial liabilities Obligations related to securities sold under repurchase agreements and securities loaned 20,775 1,029 19,746 4,373 15,318 55 Derivative financial instruments 4,858 4,858 2,826 1,040 992 25,633 1,029 24,604 7,199 16,358 1,047
(1) Carrying amount of financial instruments that are subject to a master netting agreement or similar agreement but that do not satisfy offsetting criteria. (2) Excluding non-financial instruments collateral.

AUDITED CONSOLIDATED FINANCIAL STATEMENTS NOTES TO THE AUDITED CONSOLIDATED FINANCIAL STATEMENTS (millions of Canadian dollars)
142 National Bank of Canada 2014 Annual Report
NOTE 6 – SECURITIES
Residual Contractual Maturities of Securities As at October 31 2014 2013
1 year or less
Over 1 year to
5 years Over
5 years
No specified maturity Total Total
Securities at fair value through profit or loss Securities issued or guaranteed by Canada 1,193 3,862 2,472 7,527 10,556 Provinces 976 3,838 3,581 8,395 10,654 Municipalities and school boards 119 454 167 740 367 U.S. Treasury, other U.S. agencies and other foreign governments 634 591 517 1,742 809 Other debt securities 1,360 1,590 1,891 4,841 3,969 Equity securities 17 34 19,904 19,955 17,645 4,299 10,369 8,628 19,904 43,200 44,000
Available-for-sale securities Securities issued or guaranteed by Canada 420 3,374 469 4,263 5,660 Provinces 219 3,661 3,880 2,617 Municipalities or school boards 58 290 348 302 U.S. Treasury, other U.S. agencies and other foreign governments 273 1 274 390 Other debt securities 306 190 1 497 330 Equity securities 8 22 7 454 491 445 701 3,980 4,617 455 9,753 9,744

AUDITED CONSOLIDATED FINANCIAL STATEMENTS NOTES TO THE AUDITED CONSOLIDATED FINANCIAL STATEMENTS (millions of Canadian dollars)
National Bank of Canada 143 2014 Annual Report
Gross Unrealized Gains (Losses) on Available-for-Sale Securities As at October 31, 2014
Amortized
cost
Gross unrealized
gains
Gross unrealized
losses Carrying
value
Securities issued or guaranteed by Canada 4,226 38 (1) 4,263 Provinces 3,704 186 (10) 3,880 Municipalities and school boards 332 16 348 U.S. Treasury, other U.S. agencies and other foreign governments 274 274 Other debt securities 447 50 497 Equity securities 437 69 (15) 491 9,420 359 (26) 9,753
As at October 31, 2013
Amortized
cost
Gross unrealized
gains
Gross unrealized
losses Carrying
value
Securities issued or guaranteed by Canada 5,646 30 (16) 5,660 Provinces 2,480 159 (22) 2,617 Municipalities and school boards 286 17 (1) 302 U.S. Treasury, other U.S. agencies and other foreign governments 387 3 390 Other debt securities 292 40 (2) 330 Equity securities 391 58 (4) 445 9,482 307 (45) 9,744
Impairment Losses Recognized At the end of each reporting period, the Bank determines whether there is objective evidence of impairment for each available-for-sale security. During the year ended October 31, 2014, an amount of $7 million ($29 million for the year ended October 31, 2013) for impairment charges was recognized in Gains (losses) on available-for-sale securities, net in the Consolidated Statement of Income. In addition, during the years ended October 31, 2014 and 2013, no amounts were reversed in the Consolidated Statement of Income to recognize subsequent increases in the fair value of previously impaired debt securities. Gross Unrealized Losses As at October 31, 2014 and 2013, the Bank concluded that the gross unrealized losses on available-for-sale securities were mainly due to market price fluctuations and to changes in foreign exchange rates and that there is no objective evidence of impairment requiring an impairment charge to be recognized in the Consolidated Statement of Income.

AUDITED CONSOLIDATED FINANCIAL STATEMENTS NOTES TO THE AUDITED CONSOLIDATED FINANCIAL STATEMENTS (millions of Canadian dollars)
144 National Bank of Canada 2014 Annual Report
NOTE 6 – SECURITIES (cont.)
Master Asset Vehicles
As at October 31, 2014, the face value of the restructured notes of the MAV conduits and of the other restructured notes held by the Bank was $1,479 million ($1,727 million as at October 31, 2013), of which $1,253 million was designated as Securities at fair value through profit or loss under the fair value option, and an amount of $226 million was classified in Available-for-sale securities ($1,506 million designated as Securities at fair value through profit or loss and $221 million classified in Available-for-sale securities as at October 31, 2013). The change in the face value of the restructured notes of the MAV conduits during the year ended October 31, 2014 was mainly due to capital repayments and disposals. During the year ended October 31, 2014, the Bank participated in two optional redemption unwind processes for restructured notes of the MAV II conduits and disposed of certain notes, classified in Securities at fair value through profit or loss, for a face value of $199 million. In exchange, the Bank received $183 million in cash and liquidation trust units and classified these units in Available-for-sale securities. The Bank has committed to contribute $831million ($886 million as at October 31, 2013) to a margin funding facility related to the MAV conduits in order to finance potential collateral calls. As at October 31, 2014 and 2013, no amount had been advanced by the Bank. The carrying value of the restructured notes of the MAV conduits and of the other restructured notes held by the Bank in an investment portfolio as at October 31, 2014, designated as Securities at fair value through profit or loss, was $1,166 million, and $75 million was classified in Available-for-sale securities ($1,293 million designated as Securities at fair value through profit or loss and $68 million classified in Available-for-sale securities as at October 31, 2013). The notes held in an investment portfolio with one or more embedded derivatives were designated as Securities at fair value through profit or loss under the fair value option, and the other notes were classified in Available-for-sale securities. The following table presents the carrying values and face values of the MAV-related financial assets and liabilities and their residual contractual maturities. As at October 31
Carrying value Face value 2014 2013 2014 2013
1 year or less
Over 1 year to 5 years
Over 5 years
No specified maturity Total Total
MAV I and MAV II 1,072 1,072 1,191 1,161 1,393 MAV III 63 63 62 185 195 Commercial paper not included in the Pan-Canadian restructuring plan 101 101 108 117 139 Liquidation trust units 5 5 16 101 1,135 5 1,241 1,361 1,479 1,727 Margin funding facility (21) (21) (30) (831) (886) 80 1,135 5 1,220 1,331
Establishing Fair Value In establishing the fair value of the restructured notes of the MAV conduits and excluding ineligible assets, the Bank considered the quality of the underlying assets. The Bank determined fair value using a valuation technique that incorporates discounted cash flows. The discount rate is based 80% on the CDX.IG index tranches and 20% on a basket of securities backed by assets such as credit card receivables, Residential Mortgage-Backed Securities (RMBS), Commercial Mortgage-Backed Securities (CMBS) and automobile loans. The fair valuation method also includes the effects of broker quotes and market conditions on the MAV II Class A-1, A-2, B and C notes. For the restructured notes of the MAV I and MAV II Class A-1, A-2 and B conduits, the adjustment related to broker quotes represented 30% in 2014 (30% in 2013) of the weighting used to determine fair value. For the restructured notes of the MAV I and MAV II Class C conduits, the adjustment related to broker quotes represented 100% in 2014 (30% in 2013) of the weighting used to determine fair value. The credit ratings and coupons were based on the terms set out in the restructured notes of the MAV conduits. Maturities are based on the anticipated cash flows of the underlying assets. For ineligible assets, the fair value of the tracking notes is based on an analysis of the underlying assets of the notes and the market value of comparable instruments. For RMBS, fair values were based on the ABX index; for CMBS, CMBS indices, including the CMBX index, were chosen. As for derivative financial instruments, the Bank applied valuation models commonly used by market participants with inputs based on observable market factors such as the CDX.IG indices, base correlation and interest rates. In establishing the fair value of the restructured notes, the Bank adjusts, as required, its liquidity assumption to reflect market conditions.

AUDITED CONSOLIDATED FINANCIAL STATEMENTS NOTES TO THE AUDITED CONSOLIDATED FINANCIAL STATEMENTS (millions of Canadian dollars)
National Bank of Canada 145 2014 Annual Report
The Bank determines the value of the restructured notes of the MAV conduits it is holding by comparing the value obtained using the above-described methodology against a range of values. The values situated in this range were obtained by adjusting various inputs used to determine the discount rate and broker quotes, incorporating third-party assessments and applying various liquidity scenarios. As several assumptions may be used to determine fair value, this range reflects the level of uncertainty associated with these models. During the year ended October 31, 2014, revenues amounting to $92 million were recorded mainly to reflect a rise in the fair value of restructured notes ($151 million during the year ended October 31, 2013). These amounts were recorded in Trading revenues in the Consolidated Statement of Income. The carrying value of the restructured notes, designated as Securities at fair value through profit or loss, was within the range of the estimated fair value as at October 31, 2014. The credit ratings of the MAV I and MAV II Class A-1 notes were maintained at “AA (low) (sf)” and the credit ratings of the MAV I and MAV II Class A-2 notes remained unchanged at “A (sf)” and “A (low) (sf)”, respectively. The credit rating of the MAV I Class B notes remained unchanged at “BBB (low) (sf)”. The Bank’s valuation was based on its assessment of the conditions prevailing as at October 31, 2014, which may change in the future. The most significant assumptions used to determine the fair value of the restructured notes are observable discount rates, the credit ratings of the notes and the broker quotes on the MAV II Class A-1, A-2, B and C notes. Furthermore, there may be valuation uncertainty resulting from the choice of valuation model used. The sensitivities of these assumptions on fair value as at October 31, 2014 are as follows.
— A 10-basis-point change in the discount rate would result in a $6 million decrease or increase in fair value. — A decrease in the credit rating by one letter grade would result in a decrease in fair value between a range of $3 million to $6 million. — An increase in the credit rating by one letter grade would result in an increase in fair value between a range of $2 million to $3 million. — A 100-basis-point change in the liquidity discount would result in an $11 million decrease or increase in fair value. — A 10% change in the weighting used to determine the discount rate would result in a $2 million decrease or increase in fair value. — A 10% change in the weighting attributed to the discount rate and the broker quotes on the MAV II Class A-1, A-2 and B notes would result in a $7 million
decrease or increase in fair value. — A 1% change in the broker quotes on the MAV II Class A-1, A-2 and B notes would result in a $4 million decrease or increase in fair value. — A 20% change in the broker quotes on the MAV II Class C notes would result in a $6 million decrease or increase in fair value. Determining the fair value of the restructured notes of the MAV conduits is complex and involves an extensive process that includes the use of quantitative modelling and relevant assumptions. Possible changes that could have a significant impact on the future value include (1) changes in the value of the underlying assets, (2) changes regarding the liquidity of the restructured notes of the MAV conduits that are not currently traded on an active market, (3) the impacts of a marked and prolonged economic slowdown in North America and certain European countries, and (4) changes in legislation.

AUDITED CONSOLIDATED FINANCIAL STATEMENTS NOTES TO THE AUDITED CONSOLIDATED FINANCIAL STATEMENTS (millions of Canadian dollars)
146 National Bank of Canada 2014 Annual Report
NOTE 7 – LOANS
Credit Quality of Loans
As at October 31, 2014
Residential
mortgage Personal and
credit card Business and government(1) Total
Neither past due(2) nor impaired 38,969 29,663 28,061 96,693 Past due(2) but not impaired 270 252 146 668 Impaired 61 81 344 486 Gross loans 39,300 29,996 28,551 97,847 Less: Allowances on impaired loans Individual allowances 9 15 191 215 Collective allowances 21 2 23 Allowances on impaired loans 9 36 193 238 39,291 29,960 28,358 97,609 Less: Collective allowance on non-impaired loans(3) 366 Loans, net of allowances 97,243
As at October 31, 2013
Residential
mortgage Personal and
credit card Business andgovernment(1) Total
Neither past due(2) nor impaired 36,213 27,674 24,022 87,909 Past due(2) but not impaired 314 245 99 658 Impaired 46 70 279 395 Gross loans 36,573 27,989 24,400 88,962 Less: Allowances on impaired loans Individual allowances 7 13 170 190 Collective allowances 20 2 22 Allowances on impaired loans 7 33 172 212 36,566 27,956 24,228 88,750 Less: Collective allowance on non-impaired loans(3) 366 Loans, net of allowances 88,384
(1) Business credit portfolios are closely monitored and a monthly watchlist of problem commitments is produced. The watchlist is analyzed by the loan portfolio managers concerned, who must then submit a report to Credit Risk Management.
(2) A loan is past due when the counterparty has not made a payment by the contractual due date. (3) The collective allowance on non-impaired loans for credit risk was established taking into account the Bank’s overall credit portfolio.

AUDITED CONSOLIDATED FINANCIAL STATEMENTS NOTES TO THE AUDITED CONSOLIDATED FINANCIAL STATEMENTS (millions of Canadian dollars)
National Bank of Canada 147 2014 Annual Report
Loans Past Due But Not Impaired As at October 31 2014 2013
Residential
mortgage Personal and
credit card Business and government(1)
Residential mortgage
Personal and credit card
Business andgovernment(1)
Past due but not impaired 1 month late 123 90 56 168 89 24 2 months late 45 30 23 52 50 14 3 months late and more 102 132 67 94 106 61 270 252 146 314 245 99
(1) As at October 31, 2014, the fair value of financial collateral held against loans past due but not impaired was $20 million ($7 million as at October 31, 2013).
Impaired Loans As at October 31, 2014
Gross Individual
allowances Collective
allowances Net
Loans Residential mortgage 61 9 52 Personal and credit card 81 15 21 45 Business and government 344 191 2 151 486 215 23 248
As at October 31, 2013
Gross Individual
allowances Collective
allowances Net
Loans Residential mortgage 46 7 39 Personal and credit card 70 13 20 37 Business and government 279 170 2 107 395 190 22 183
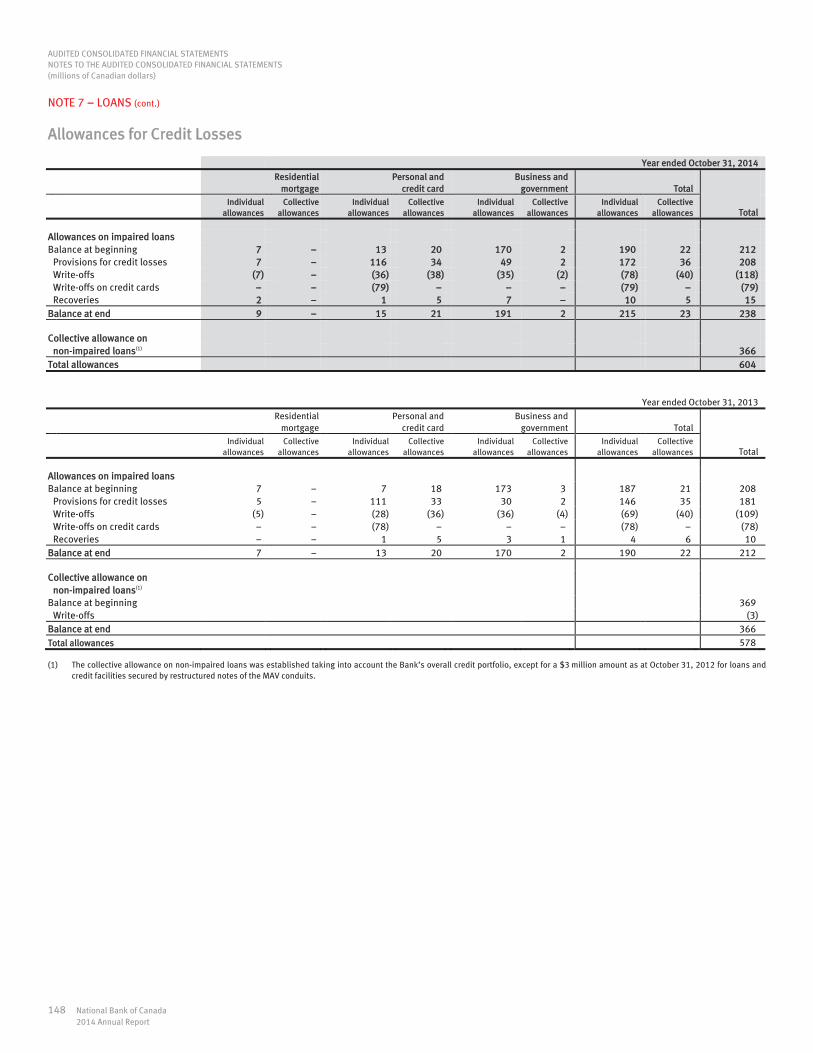
AUDITED CONSOLIDATED FINANCIAL STATEMENTS NOTES TO THE AUDITED CONSOLIDATED FINANCIAL STATEMENTS (millions of Canadian dollars)
148 National Bank of Canada 2014 Annual Report
NOTE 7 – LOANS (cont.)
Allowances for Credit Losses Year ended October 31, 2014
Residential
mortgage Personal and
credit card Business and
government Total
Total
Individual
allowances Collective
allowances Individual
allowances Collective
allowances Individual
allowances Collective
allowances Individual
allowances Collective
allowances
Allowances on impaired loans Balance at beginning 7 13 20 170 2 190 22 212 Provisions for credit losses 7 116 34 49 2 172 36 208 Write-offs (7) (36) (38) (35) (2) (78) (40) (118) Write-offs on credit cards (79) (79) (79) Recoveries 2 1 5 7 10 5 15 Balance at end 9 15 21 191 2 215 23 238 Collective allowance on non-impaired loans(1) 366 Total allowances 604
Year ended October 31, 2013
Residential
mortgage Personal and
credit card Business and
government Total
Total
Individual
allowances Collective
allowances Individual
allowances Collective
allowances Individual
allowances Collective
allowances Individual
allowances Collective
allowances
Allowances on impaired loans Balance at beginning 7 7 18 173 3 187 21 208 Provisions for credit losses 5 111 33 30 2 146 35 181 Write-offs (5) (28) (36) (36) (4) (69) (40) (109) Write-offs on credit cards (78) (78) (78) Recoveries 1 5 3 1 4 6 10 Balance at end 7 13 20 170 2 190 22 212 Collective allowance on non-impaired loans(1) Balance at beginning 369 Write-offs (3) Balance at end 366 Total allowances 578
(1) The collective allowance on non-impaired loans was established taking into account the Bank’s overall credit portfolio, except for a $3 million amount as at October 31, 2012 for loans and credit facilities secured by restructured notes of the MAV conduits.

AUDITED CONSOLIDATED FINANCIAL STATEMENTS NOTES TO THE AUDITED CONSOLIDATED FINANCIAL STATEMENTS (millions of Canadian dollars)
National Bank of Canada 149 2014 Annual Report
Distribution of Gross and Impaired Loans by Borrower Category Under the Basel Asset Classes 2014
As at October 31 Year ended October 31
Gross
loans Impaired
loans Allowances for impaired loans
Provisions for credit
losses Write-offs
Residential mortgage(1) 50,011 66 10 7 7 Qualifying revolving retail(2) 4,033 19 10 101 103 Other retail(3) 9,027 52 24 49 50 Total – Retail 63,071 137 44 157 160 Agriculture 3,832 17 8 (1) 4 Mining, oil and gas 1,677 68 29 7 2 Construction and real estate(4) 7,562 44 14 7 3 Manufacturing 2,963 64 55 4 3 Wholesale and retail 4,268 62 31 26 4 Transportation 816 11 5 2 2 Telecommunications, media and technology 1,081 11 7 1 Financial institutions 1,205 1 Services 4,096 31 20 3 11 Governments and other related services 2,916 26 11 Other 4,360 14 14 2 8 Total – Non-retail 34,776 349 194 51 37 97,847 486 238 208 197
2013
As at October 31 Year ended October 31
Gross
loans Impaired
loans Allowances for impaired loans
Provisionsfor credit
losses Write-offs
Residential mortgage(1) 46,836 53 8 5 5 Qualifying revolving retail(2) 3,962 16 9 100 99 Other retail(3) 8,801 47 23 44 43 Total – Retail 59,599 116 40 149 147 Agriculture 3,427 29 13 2 2 Mining, oil and gas 1,709 21 21 24 2 Construction and real estate(4) 6,063 35 7 3 2 Manufacturing 2,595 97 66 4 5 Wholesale and retail 3,680 18 15 (1) 4 Transportation 833 1 1 1 Telecommunications, media and technology 1,099 6 5 Financial institutions 1,321 1 Services 3,676 36 26 (5) 17 Governments and other related services 2,272 21 8 Other 2,688 14 11 4 7 Total – Non-retail 29,363 279 172 32 40 88,962 395 212 181 187
(1) Includes residential mortgages on one-to-four unit dwellings (Basel definition) and home equity lines of credit. (2) Includes lines of credit and credit card receivables. (3) Includes consumer loans and other retail loans but excludes SME loans. (4) Includes non-residential mortgages.

AUDITED CONSOLIDATED FINANCIAL STATEMENTS NOTES TO THE AUDITED CONSOLIDATED FINANCIAL STATEMENTS (millions of Canadian dollars)
150 National Bank of Canada 2014 Annual Report
NOTE 8 – FINANCIAL ASSETS TRANSFERRED BUT NOT DERECOGNIZED In the normal course of its business, the Bank enters into transactions in which it transfers financial assets such as securities or loans directly to third parties, in particular structured entities. In some of those transactions, the Bank retains substantially all of the risks and rewards related to those financial assets. The risks include credit risk, interest rate risk, foreign exchange risk, prepayment risk and other price risks, whereas the rewards include income streams associated with the financial assets. As such, those financial assets are not derecognized and the transactions are treated as collateralized or secured borrowings. The nature of those transactions is described below. Securities Sold Under Repurchase Agreements and Securities Loaned When securities are sold under repurchase agreements and securities loaned under securities lending agreements, the Bank transfers financial assets to third parties in accordance with the standard terms for such transactions. These third parties may have an unlimited right to resell or repledge the financial assets received. If cash collateral is received, the Bank records the cash along with an obligation to return the cash, which is included in Obligations related to securities sold under repurchase agreements and securities loaned on the Consolidated Balance Sheet. Where securities are received as collateral, the Bank does not record the collateral on the Consolidated Balance Sheet. Financial Assets Transferred to Structured Entities Under the Canada Mortgage Bond (CMB) program, the Bank sells securities backed by insured residential mortgages and other securities to Canada Housing Trust (CHT), which finances the purchase through the issuance of insured mortgage bonds. Third-party CMB investors have legal recourse only to the transferred assets. The Bank also sells insured and non-insured residential mortgages to a mutual fund administered by the Bank. The cash received for these transferred assets is treated as a secured borrowing, and a corresponding liability is recorded in Liabilities related to transferred receivables on the Consolidated Balance Sheet. The following table provides additional information about the nature of the transferred financial assets that do not qualify for derecognition and the associated liabilities. As at October 31 2014 2013
Carrying value of financial assets transferred but not derecognized Securities(1) 31,359 33,677 Residential mortgages 15,790 14,280 47,149 47,957
Carrying value of associated liabilities(2) 28,933 28,543
Fair value of financial assets transferred but not derecognized Securities(1) 31,359 33,677 Residential mortgages 16,068 14,464 47,427 48,141
Fair value of associated liabilities(2) 29,049 28,632
(1) The amount related to the securities loaned is the maximum amount of Bank securities that can be lent. For the obligations related to securities sold under repurchase agreements, the amount includes the Bank’s own financial assets as well as those of third parties.
(2) Associated liabilities include obligations related to securities sold under repurchase agreements before the offsetting impact of $2,737 million as at October 31, 2014 ($1,029 million as at October 31, 2013) and liabilities related to transferred receivables. Liabilities related to securities loaned are not included, as the Bank can lend its own financial assets and those of third parties. The carrying value and fair value of liabilities related to securities loaned were $7,662 million as at October 31, 2014 ($7,555 million as at October 31, 2013).
The following table specifies the nature of the transactions related to financial assets transferred but not derecognized. As at October 31 2014 2013
Carrying value of financial assets transferred but not derecognized Securities backed by insured residential mortgages and other securities sold to CHT 16,604 14,903 Securities sold under repurchase agreements 11,921 13,297 Securities loaned 18,619 19,674 Residential mortgages transferred to a mutual fund 5 83 47,149 47,957

AUDITED CONSOLIDATED FINANCIAL STATEMENTS NOTES TO THE AUDITED CONSOLIDATED FINANCIAL STATEMENTS (millions of Canadian dollars)
National Bank of Canada 151 2014 Annual Report
NOTE 9 – ASSOCIATES AND JOINT VENTURES As at October 31 2014 2013
Business
segment Ownership percentage
Carrying value
Carryingvalue
Listed associates(1) TMX Group Limited(2) Other 8.7 % 232 231 Fiera Capital Corporation Wealth Management 35.0 % 207 207 Unlisted associates 228 188 Unlisted joint ventures 30 58 697 684
(1) The fair value of investments in associates based on quoted prices in an active market was $554 million as at October 31, 2014 ($551 million as at October 31, 2013). (2) The Bank exercises significant influence over TMX Group Limited mainly because of its equity interest, debt financing, and presence on TMX Group’s board of directors.
TMX Group Limited is a Canadian corporation that directly or indirectly controls a number of entities that operate stock exchanges and clearing houses and provide clearing and settlement services. During the year ended October 31, 2014, TMX Group Limited paid $8 million in dividends to the Bank ($8 million for the year ended October 31, 2013). Fiera Capital Corporation is an independent Canadian investment management firm. During the year ended October 31, 2014, Fiera Capital Corporation paid $10 million in dividends to the Bank ($7 million for the year ended October 31, 2013). As at October 31, 2014 and 2013, there were no significant restrictions limiting the ability of associates and joint ventures to transfer funds to the Bank in the form of dividends or to repay loans or advances. Furthermore, the Bank has not made any specific commitment or contracted any contingent liability with respect to associates or joint ventures. The following table provides summarized financial information on the associates that are significant for the Bank. As at October 31 2014 2013
TMX Group Limited
Fiera Capital Corporation
Total Total
Balance sheet(1) Current assets 11,055 81 11,136 7,264 Non-current assets 4,829 688 5,517 5,529 Current liabilities 11,034 40 11,074 7,008 Non-current liabilities 1,919 303 2,222 2,550 Income statement(2) Total revenues 715 190 905 829 Net income 56 23 79 126 Other comprehensive income 18 18 9 Comprehensive income 74 23 97 134
(1) The amounts represent the balances in the unaudited financial statements as at September 30, 2014 and 2013, which are the most recent available. (2) The amounts are based on the cumulative balances for the 12-month periods ended September 30, 2014 and 2013.
The table below provides summarized financial information related to the Bank’s share of associates and joint ventures that are not individually significant. As at October 31 2014(1) 2013(1)
Unlisted
associates
Unlisted joint ventures
Total Total
Net income 10 3 13 9 Other comprehensive income (1) Comprehensive income 10 3 13 8
(1) The amounts are based on the cumulative balances for the 12-month periods ended September 30, 2014 and 2013.

AUDITED CONSOLIDATED FINANCIAL STATEMENTS NOTES TO THE AUDITED CONSOLIDATED FINANCIAL STATEMENTS (millions of Canadian dollars)
152 National Bank of Canada 2014 Annual Report
NOTE 10 – PREMISES AND EQUIPMENT
Land Buildings
Computer equipment
Equipment and furniture
Leasehold improvements Total
Cost As at October 31, 2012 15 263 204 340 554 1,376
Acquisitions 5 18 9 23 55 Disposals (1) (13) (10) (10) (4) (38)
As at October 31, 2013 14 255 212 339 573 1,393 Acquisitions 1 20 15 16 52 Disposals (2) (5) (7) (14)
As at October 31, 2014 14 254 232 349 582 1,431
Accumulated amortization As at October 31, 2012 143 114 291 388 936
Amortization for the year 7 34 10 27 78 Disposals (4) (11) (7) (3) (25)
As at October 31, 2013 146 137 294 412 989 Amortization for the year 5 35 10 24 74 Disposals (1) (5) (6) (12)
As at October 31, 2014 150 172 299 430 1,051
Carrying value as at October 31, 2013 14 109 75 45 161 404 Carrying value as at October 31, 2014 14 104 60 50 152 380
Buildings Rented Under Operating Leases
The Bank is a lessor under operating lease agreements for certain buildings. The following table breaks down the future minimum payments receivable under these leases. As at October 31, 2014
1 year or less 14 Over 1 year to 5 years 37 Over 5 years 17 68

AUDITED CONSOLIDATED FINANCIAL STATEMENTS NOTES TO THE AUDITED CONSOLIDATED FINANCIAL STATEMENTS (millions of Canadian dollars)
National Bank of Canada 153 2014 Annual Report
NOTE 11 – GOODWILL AND INTANGIBLE ASSETS
Goodwill
The following table presents the change in the carrying amount of goodwill by cash-generating unit (CGU) and business segment for the years ended October 31, 2014 and 2013.
Personal and Commercial(1)
Wealth
Management Financial Markets(1)
Total
Third-Party Solutions(1)
Securities Brokerage(1)
Managed Solutions(1) Total
Balance as at October 31, 2012 51 50 434 269 753 259 1,063 Impact of the foreign currency translation 1 1 Balance as at October 31, 2013 51 50 434 269 753 260 1,064 Acquisition of TD Waterhouse Institutional Services 206 206 206 Impact of the foreign currency translation 2 2 Balance as at October 31, 2014 51 50 640 269 959 262 1,272
(1) Constitutes a CGU.
Goodwill Impairment Testing and Significant Assumptions For impairment testing purposes, from the acquisition date, goodwill resulting from a business combination must be allocated to a CGU or a group of CGUs expected to benefit from the synergies of the business combination. Goodwill is tested for impairment annually or more frequently if events or circumstances indicate that the recoverable value of the CGU or group of CGUs may have fallen below its carrying amount. The recoverable value of a CGU or CGU group is calculated based on discounted pre-tax cash flows. Future pre-tax cash flows are estimated based on the reference period used for the most recent financial forecasts approved by management. Cash flows beyond that period are extrapolated using a long-term growth rate. The discount rate used for each CGU or group of CGUs is calculated using the cost of debt financing and cost related to the Bank’s equity. This rate corresponds to the Bank’s weighted average cost of capital and reflects the risk specific to the CGU. The long-term growth rate used in calculating discounted cash flow estimates is based on the forecasted growth rate plus a risk premium. The rate is constant over the entire five-year period for which the cash flows were determined. Growth rates are determined, among other factors, based on past growth rates, economic trends, inflation, competition and the impact of the Bank’s strategic initiatives. As at October 31, 2014 and 2013, for each CGU or CGU group, the discount rate used was 13.5% and the long-term growth rate ranged between 2.4% and 4.0%, depending on the CGU. Goodwill was tested for impairment during the years ended October 31, 2014 and 2013, and no impairment loss was recognized.

AUDITED CONSOLIDATED FINANCIAL STATEMENTS NOTES TO THE AUDITED CONSOLIDATED FINANCIAL STATEMENTS (millions of Canadian dollars)
154 National Bank of Canada 2014 Annual Report
NOTE 11 – GOODWILL AND INTANGIBLE ASSETS (cont.)
Intangible Assets Indefinite useful life Useful life Total
Management
contracts Trademark Total
Internally- generated
technological developments(1) Software
Other intangible
assets Total
Cost As at October 31, 2012 161 11 172 871 170 48 1,089 1,261 Acquisitions 200 31 231 231 Impairment losses(2) (39) (2) (41) (41) As at October 31, 2013 161 11 172 1,032 199 48 1,279 1,451 Acquisitions 186 11 58 255 255 Impairment losses(2) (159) (3) (162) (162) As at October 31, 2014 161 11 172 1,059 207 106 1,372 1,544
Accumulated amortization As at October 31, 2012 332 132 19 483 483 Amortization for the year 50 16 6 72 72 Impairment losses(2) (2) (2) (2) As at October 31, 2013 380 148 25 553 553 Amortization for the year 61 20 12 93 93 Impairment losses(2) (97) (3) (100) (100) As at October 31, 2014 344 165 37 546 546
Carrying value as at October 31, 2013 161 11 172 652 51 23 726 898 Carrying value as at October 31, 2014 161 11 172 715 42 69 826 998
(1) The remaining amortization period for significant internally-designed technology developments is five years. (2) The Bank wrote off certain technology developments due to obsolescence and decided to discontinue or replace them. The recoverable amount of those technology developments was
estimated to be nil. During the year ended October 31, 2014, $62 million in impairment losses ($39 million for the year ended October 31, 2013) were recognized and charged to the Other heading.

AUDITED CONSOLIDATED FINANCIAL STATEMENTS NOTES TO THE AUDITED CONSOLIDATED FINANCIAL STATEMENTS (millions of Canadian dollars)
National Bank of Canada 155 2014 Annual Report
NOTE 12 – OTHER ASSETS As at October 31 2014 2013(1)
Receivables, prepaid expenses and other items 634 612 Interest and dividends receivable 454 425 Purchased receivables 790 466 Defined benefit asset (Note 23) 185 131 Deferred tax assets (Note 24) 264 289 Current tax assets 44 88 Reinsurance assets 25 26 2,396 2,037
(1) Certain amounts have been adjusted to reflect changes in accounting standards. See Note 2.
NOTE 13 – DEPOSITS As at October 31 2014 2013(1)
On demand
or after notice Fixed term Total Total
Personal 24,853 20,110 44,963 42,652 Business and government 32,828 34,536 67,364 57,103 Deposit-taking institutions 1,248 6,308 7,556 2,356
58,929 60,954 119,883 102,111
(1) Certain amounts have been adjusted to reflect changes in accounting standards. See Note 2.
The Deposits – Business and government item includes the deposit from NBC Capital Trust and the covered bonds, as described below. Deposit from NBC Capital Trust On June 15, 2006, NBC Capital Trust (the Trust), an open-end trust established under the laws of the Province of Ontario, issued 225,000 transferable non-voting trust units called Trust Capital Securities – Series 1 or NBC CapS – Series 1. The gross proceeds of $225 million from the offering were used by the Trust to acquire a deposit note from the Bank. The Bank does not control the Trust and therefore does not consolidate it. See Note 28 for additional information. Consequently, the NBC CapS – Series 1 issued by the Trust are not included on the Bank’s Consolidated Balance Sheet, but the deposit note is presented in Deposits – Business and government. The main terms and characteristics of the $225 million deposit note are as follows.
Issuance date Fixed annual interest rate
Interest
payment dates Semi-annual
payment(1) Maturity
Date ofconversion
at the optionof the Trust(2)
June 15, 2006 5.329 %(3) June 30,
December 31 $26.645 June 30, 2056 Anytime
(1) Per $1,000 principal amount. (2) Each $1,000 principal amount of the deposit note is convertible at the option of the Trust into 40 Series 17 First Preferred Shares of the Bank. The Trust will exercise this conversion right in
circumstances in which holders of NBC CapS – Series 1 exercise their exchange right. (3) The rate of 5.329% will be in effect up to and including June 30, 2016. After that date, the note will bear interest at a fixed annual rate equal to the 180-day bankers’ acceptance rate in effect
plus 1.50%.
Redemption at the option of the Bank Since June 30, 2011, and on any subsequent distribution date, the Bank may, at its option, redeem the deposit note, in whole or in part, upon the occurrence of predetermined events of a regulatory or fiscal nature. Any redemption may be carried out without the consent of the Trust, subject to prior written notice and OSFI approval. If the Bank redeems the deposit note in whole or in part, the Trust will be required to redeem a corresponding amount of NBC CapS – Series 1.

AUDITED CONSOLIDATED FINANCIAL STATEMENTS NOTES TO THE AUDITED CONSOLIDATED FINANCIAL STATEMENTS (millions of Canadian dollars)
156 National Bank of Canada 2014 Annual Report
NOTE 13 – DEPOSITS (cont.) Purchase for cancellation Since June 30, 2011, the Bank may, with OSFI approval, purchase the deposit note in whole or in part on the open market by tender or private contract at any price. Any part of the deposit note purchased by the Bank will be cancelled and will not be reissued. Instances of default Failure by the Bank to make payments or to satisfy its other obligations under the deposit note will not entitle the Trust to accelerate payment of the deposit note. Covered Bonds NBC Covered Bond Guarantor (Legislative) Limited Partnership In December 2013, the Bank established the covered bond legislative program under which covered bonds are issued. As a result, the Bank created NBC Covered Bond Guarantor (Legislative) Limited Partnership (the Guarantor) in order to guarantee payment of the principal and interest owed to the bondholders. The Bank sold uninsured residential mortgages to the Guarantor and granted it loans to facilitate the acquisition of these assets. During the year ended October 31, 2014, the Bank issued covered bonds under this program for an amount of 2.0 billion euros. The covered bonds, totalling $2.8 billion as at October 31, 2014, are presented in Deposits – Business and government on the Bank’s Consolidated Balance Sheet. See Note 28 for additional information. The Bank has limited access to the assets owned by this structured entity according to the terms of the agreements that apply to this transaction. The assets owned by this entity totalled $8.2 billion as at October 31, 2014, of which $8.0 billion is presented in Residential mortgage loans on the Bank’s Consolidated Balance Sheet. NBC Covered Bond Guarantor Limited Partnership In January 2011, the Bank established the structured covered bond program under which covered bonds are issued. As a result, the Bank created NBC Covered Bond Guarantor Limited Partnership (the Guarantor) in order to guarantee payment of the principal and interest owed to the bondholders. The Bank sold insured residential mortgages to the Guarantor and granted it a demand loan to facilitate the acquisition of these assets. During the year ended October 31, 2014, an amount of US$1.0 billion matured. The covered bonds issued under this program, totalling $2.3 billion as at October 31, 2014 ($3.1 billion as at October 31, 2013), are presented in Deposits – Business and government on the Bank’s Consolidated Balance Sheet. See Note 28 for additional information. The Bank has limited access to the assets owned by this structured entity according to the terms of the agreements that apply to this transaction. The assets owned by this entity totalled $2.5 billion as at October 31, 2014 ($3.9 billion as at October 31, 2013), of which $2.3 billion ($3.5 billion as at October 31, 2013) is presented in Residential mortgage loans on the Bank’s Consolidated Balance Sheet.
NOTE 14 – OTHER LIABILITIES As at October 31 2014 2013(1)
Accounts payable and accrued expenses 1,317 1,236 Subsidiaries' debts to third parties 1,472 1,457 Interest and dividends payable 650 785 Defined benefit liability (Note 23) 177 178 Deferred tax liabilities (Note 24) 108 119 Current tax liabilities 113 70 Insurance liabilities 72 73 Other items(2)(3) 585 579 4,494 4,497
(1) Certain amounts have been adjusted to reflect changes in accounting standards. See Note 2. (2) As at October 31, 2014, other items include a $14 million provision ($26 million as at October 31, 2013) for severance pay related to the optimization of certain organizational structures. (3) As at October 31, 2014, other items include a $50 million litigation provision ($32 million as at October 31, 2013).
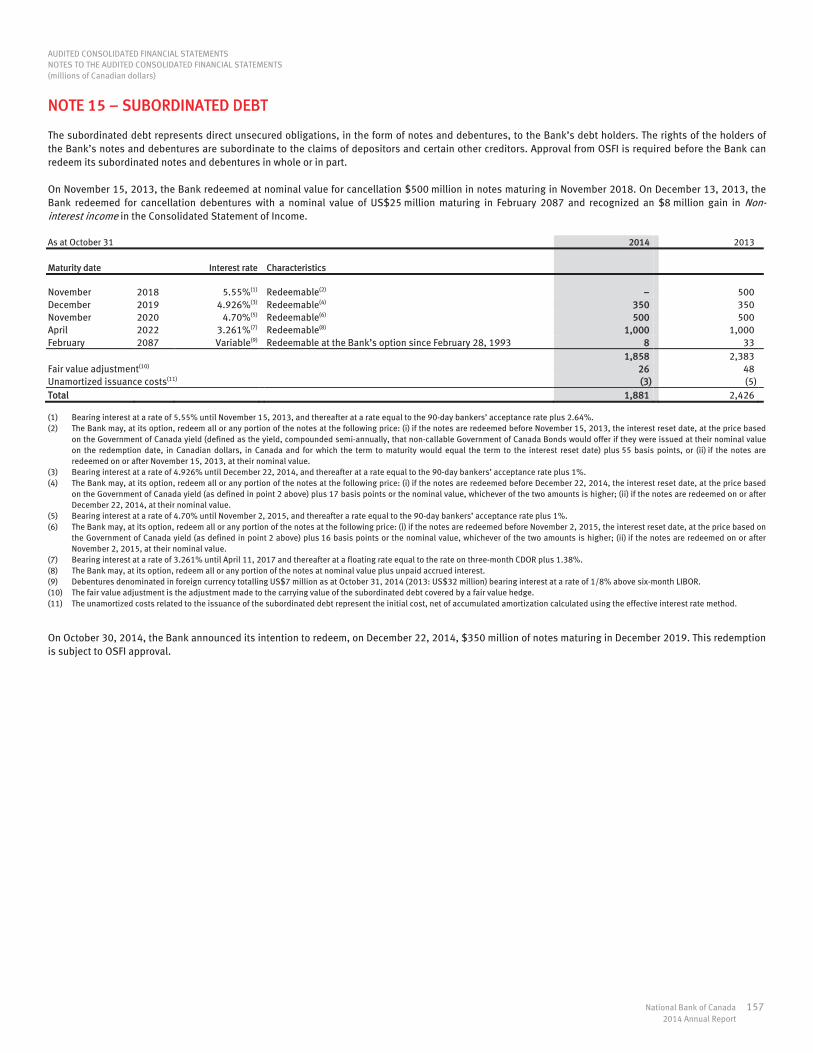
AUDITED CONSOLIDATED FINANCIAL STATEMENTS NOTES TO THE AUDITED CONSOLIDATED FINANCIAL STATEMENTS (millions of Canadian dollars)
National Bank of Canada 157 2014 Annual Report
NOTE 15 – SUBORDINATED DEBT The subordinated debt represents direct unsecured obligations, in the form of notes and debentures, to the Bank’s debt holders. The rights of the holders of the Bank’s notes and debentures are subordinate to the claims of depositors and certain other creditors. Approval from OSFI is required before the Bank can redeem its subordinated notes and debentures in whole or in part. On November 15, 2013, the Bank redeemed at nominal value for cancellation $500 million in notes maturing in November 2018. On December 13, 2013, the Bank redeemed for cancellation debentures with a nominal value of US$25 million maturing in February 2087 and recognized an $8 million gain in Non-interest income in the Consolidated Statement of Income. As at October 31 2014 2013
Maturity date Interest rate Characteristics
November 2018 5.55%(1) Redeemable(2) 500 December 2019 4.926%(3) Redeemable(4) 350 350 November 2020 4.70%(5) Redeemable(6) 500 500 April 2022 3.261%(7) Redeemable(8) 1,000 1,000 February 2087 Variable(9) Redeemable at the Bank’s option since February 28, 1993 8 33 1,858 2,383 Fair value adjustment(10) 26 48 Unamortized issuance costs(11) (3) (5) Total 1,881 2,426
(1) Bearing interest at a rate of 5.55% until November 15, 2013, and thereafter at a rate equal to the 90-day bankers’ acceptance rate plus 2.64%. (2) The Bank may, at its option, redeem all or any portion of the notes at the following price: (i) if the notes are redeemed before November 15, 2013, the interest reset date, at the price based
on the Government of Canada yield (defined as the yield, compounded semi-annually, that non-callable Government of Canada Bonds would offer if they were issued at their nominal value on the redemption date, in Canadian dollars, in Canada and for which the term to maturity would equal the term to the interest reset date) plus 55 basis points, or (ii) if the notes are redeemed on or after November 15, 2013, at their nominal value.
(3) Bearing interest at a rate of 4.926% until December 22, 2014, and thereafter at a rate equal to the 90-day bankers’ acceptance rate plus 1%. (4) The Bank may, at its option, redeem all or any portion of the notes at the following price: (i) if the notes are redeemed before December 22, 2014, the interest reset date, at the price based
on the Government of Canada yield (as defined in point 2 above) plus 17 basis points or the nominal value, whichever of the two amounts is higher; (ii) if the notes are redeemed on or after December 22, 2014, at their nominal value.
(5) Bearing interest at a rate of 4.70% until November 2, 2015, and thereafter a rate equal to the 90-day bankers’ acceptance rate plus 1%. (6) The Bank may, at its option, redeem all or any portion of the notes at the following price: (i) if the notes are redeemed before November 2, 2015, the interest reset date, at the price based on
the Government of Canada yield (as defined in point 2 above) plus 16 basis points or the nominal value, whichever of the two amounts is higher; (ii) if the notes are redeemed on or after November 2, 2015, at their nominal value.
(7) Bearing interest at a rate of 3.261% until April 11, 2017 and thereafter at a floating rate equal to the rate on three-month CDOR plus 1.38%. (8) The Bank may, at its option, redeem all or any portion of the notes at nominal value plus unpaid accrued interest. (9) Debentures denominated in foreign currency totalling US$7 million as at October 31, 2014 (2013: US$32 million) bearing interest at a rate of 1/8% above six-month LIBOR. (10) The fair value adjustment is the adjustment made to the carrying value of the subordinated debt covered by a fair value hedge. (11) The unamortized costs related to the issuance of the subordinated debt represent the initial cost, net of accumulated amortization calculated using the effective interest rate method.
On October 30, 2014, the Bank announced its intention to redeem, on December 22, 2014, $350 million of notes maturing in December 2019. This redemption is subject to OSFI approval.

AUDITED CONSOLIDATED FINANCIAL STATEMENTS NOTES TO THE AUDITED CONSOLIDATED FINANCIAL STATEMENTS (millions of Canadian dollars)
158 National Bank of Canada 2014 Annual Report
NOTE 16 – DERIVATIVE FINANCIAL INSTRUMENTS Derivative financial instruments are financial contracts whose value is derived from an underlying interest rate, exchange rate, or equity, commodity or credit instrument or index. The main types of derivative financial instruments used are presented below. Forwards and Futures Forwards and futures are contractual obligations to buy or deliver a specified amount of currency, interest rates, commodities or financial instruments on a specified future date at a specified price. Forwards are tailor-made agreements transacted in the over-the-counter market. Futures are traded on organized exchanges and are subject to cash margining calculated daily by clearing houses. Swaps Swaps are over-the-counter contracts in which two parties agree to exchange cash flows. The Bank uses the following types of swap contracts.
— Cross-currency swaps are transactions in which counterparties exchange fixed-rate interest payments and principal payments in different currencies. — Interest rate swaps are transactions in which counterparties exchange fixed and floating rate interest payments, based on the notional principal value in
the same currency. — Commodity swaps are transactions in which counterparties exchange fixed and floating rate payments, based on the notional principal value of a single
product. — Equity swaps are transactions in which counterparties agree to exchange the return on one equity or group of equities for a payment based on a
benchmark interest rate. — Credit default swaps are transactions in which one of the parties agrees to pay returns to the other party so that the latter can make a payment if a credit
event occurs. Options Options are agreements between two parties in which the writer of the option conveys to the buyer the right, but not the obligation, to buy or sell, at or by a predetermined date, at any time prior to a predetermined expiry date, a specific amount of currency, commodities or financial instruments at a price agreed to when the option is sold. The writer receives a premium for selling this instrument.

AUDITED CONSOLIDATED FINANCIAL STATEMENTS NOTES TO THE AUDITED CONSOLIDATED FINANCIAL STATEMENTS (millions of Canadian dollars)
National Bank of Canada 159 2014 Annual Report
Notional Amounts
Notional amounts are not presented in assets or liabilities on the Consolidated Balance Sheet. They represent the reference amount of the contract to which a rate or price is applied to determine the amount of cash flows to be exchanged. As at October 31 2014 2013
Term to maturity
3 months
or less
Over 3 months to
12 months
Over 1 year to 5 years
Over 5 years
Total contracts
Contracts held for trading
purposes
Contracts designated as hedges
Totalcontracts
Interest rate contracts OTC contracts Forward rate agreements Not settled by central counterparties 847 1,434 83 2,364 2,364 16,934 Settled by central counterparties 620 1,071 1,691 1,691 364 Swaps Not settled by central counterparties 16,495 30,274 83,246 41,245 171,260 143,700 27,560 209,010 Settled by central counterparties 55,690 74,938 86,162 35,798 252,588 247,689 4,899 85,940 Options purchased 1,607 2,351 2,667 505 7,130 6,908 222 2,832 Options written 263 41 4,207 1,114 5,625 5,189 436 2,559 74,902 109,658 177,436 78,662 440,658 407,541 33,117 317,639 Exchange-traded contracts Futures Long positions 2,242 9,771 11,033 23,046 23,046 3,835 Short positions 2,987 9,882 11,556 24,425 24,425 14,479 Options purchased 4,950 6,168 452 11,570 11,570 2,150 Options written 3,041 4,477 904 8,422 8,422 1,261 13,220 30,298 23,945 67,463 67,463 21,725
Foreign exchange contracts OTC contracts Forwards 10,240 3,311 2,728 1,123 17,402 17,345 57 12,177 Swaps 49,263 21,086 27,229 20,696 118,274 111,791 6,483 72,860 Options purchased 2,094 2,085 591 105 4,875 4,875 3,025 Options written 2,257 2,000 763 52 5,072 5,072 3,144 63,854 28,482 31,311 21,976 145,623 139,083 6,540 91,206 Exchange-traded contracts Futures Long positions 67 67 67 54 Short positions 99 99 99 130 Options purchased 9 Options written 14 166 166 166 207
Equity, commodity and credit derivative contracts(1) OTC contracts Forwards 260 98 3,159 515 4,032 4,032 146 Swaps Not settled by central counterparties 2,721 4,198 14,986 371 22,276 22,222 54 23,804 Settled by central counterparties 194 82 278 118 672 672 280 Options purchased 259 151 1,236 34 1,680 1,680 1,849 Options written 212 318 1,586 60 2,176 2,176 1,749 3,646 4,847 21,245 1,098 30,836 30,782 54 27,828 Exchange-traded contracts Futures Long positions 2,781 182 164 87 3,214 3,214 1,516 Short positions 4,699 1,359 807 46 6,911 6,911 7,756 Options purchased 2,295 380 158 2,833 2,833 1,640 Options written 670 233 354 1,257 1,257 1,418 10,445 2,154 1,483 133 14,215 14,215 12,330 166,233 175,439 255,420 101,869 698,961 659,250 39,711 470,935
(1) Includes precious metal contracts.

AUDITED CONSOLIDATED FINANCIAL STATEMENTS NOTES TO THE AUDITED CONSOLIDATED FINANCIAL STATEMENTS (millions of Canadian dollars)
160 National Bank of Canada 2014 Annual Report
NOTE 16 – DERIVATIVE FINANCIAL INSTRUMENTS (cont.) Credit Risk Credit risk on derivative financial instruments is the risk of financial loss that the Bank will have to assume if a counterparty fails to honour its contractual obligations. Credit risk related to derivative financial instruments is subject to the same credit approval, credit limit and monitoring standards as those applied to the Bank’s other credit transactions. Consequently, the Bank evaluates the creditworthiness of counterparties and monitors the size of the portfolios as well as the diversification and maturity profiles of these financial instruments. The Bank limits the credit risk of over-the-counter contracts by dealing with creditworthy counterparties and entering into contracts that provide for the exchange of collateral between parties where the fair value of the outstanding transactions exceeds an agreed threshold. The Bank also negotiates master netting agreements that provide for the simultaneous close-out and settling of all transactions with a given counterparty in the event of default, insolvency or bankruptcy. However, overall exposure to credit risk, reduced through master netting agreements, may change substantially after the balance sheet date because it is affected by all transactions subject to a contract as well as by changes in the market rates of the underlying instruments. The Bank also uses financial intermediaries to have access to established clearing houses in order to minimize the settlement risk for certain financial derivative transactions. In some cases, the Bank has direct access to clearing houses for settling derivative financial instruments. In addition, certain derivative financial instruments traded over the counter are settled directly or indirectly by central counterparties. In the case of exchange-traded contracts, exposure to credit risk is limited because these transactions are standardized contracts executed on established exchanges, each of which is associated with a well-capitalized clearing house that assumes the obligations of both counterparties and guarantees their performance obligations. All exchange-traded contracts are subject to initial margins and daily settlement. Terms Used Replacement cost Replacement cost is the Bank’s maximum credit risk associated with derivative financial instruments as at the Consolidated Balance Sheet date. This amount is the positive fair value of all over-the-counter derivative financial instruments, before all master netting agreements and collateral held. Credit risk equivalent The credit risk equivalent amount is the total replacement cost plus an amount representing the potential future credit risk exposure, as outlined in the guidelines issued by OSFI. Risk-weighted amount The risk-weighted amount is determined by applying the Basel rules to the credit risk equivalent.
Credit Risk Exposure of the Derivative Financial Instrument Portfolio As at October 31 2014 2013
Replacement
cost(1) Credit risk equivalent
Risk- weighted
amount Replacement
cost(1) Credit risk equivalent
Risk-weighted
amount
Interest rate contracts 3,067 5,605 1,232 3,105 4,664 1,336 Foreign exchange contracts 2,297 6,431 1,889 1,011 3,372 989 Equity, commodity and credit derivative contracts 1,652 4,244 987 1,549 3,765 2,076 7,016 16,280 4,108 5,665 11,801 4,401 Impact of master netting agreements (3,661) (8,266) (671) (2,826) (5,484) (1,728) 3,355 8,014 3,437 2,839 6,317 2,673
(1) As at October 31, 2014, the total positive fair value of exchange-traded contracts, which amounted to $76 million, was excluded ($239 million as at October 31, 2013).
Credit Risk Exposure of the Derivative Financial Instrument Portfolio by Counterparty As at October 31 2014 2013
Replacement
cost Credit risk equivalent
Replacement cost
Credit risk equivalent
OECD(1) governments 421 1,019 262 590 Banks of OECD member countries 721 2,953 601 2,108 Other 2,213 4,042 1,976 3,619 3,355 8,014 2,839 6,317
(1) Organization for Economic Co-operation and Development.

AUDITED CONSOLIDATED FINANCIAL STATEMENTS NOTES TO THE AUDITED CONSOLIDATED FINANCIAL STATEMENTS (millions of Canadian dollars)
National Bank of Canada 161 2014 Annual Report
Fair Value of Derivative Financial Instruments As at October 31 2014 2013
Positive Negative Net Positive Negative Net
Contracts held for trading purposes Interest rate contracts Forwards 22 3 19 22 12 10 Swaps 2,374 1,835 539 2,613 2,240 373 Options 24 15 9 9 17 (8) 2,420 1,853 567 2,644 2,269 375
Foreign exchange contracts Forwards 249 215 34 116 77 39 Swaps 1,941 1,583 358 850 592 258 Options 77 94 (17) 45 58 (13) 2,267 1,892 375 1,011 727 284
Equity, commodity and credit derivative contracts Forwards 1,050 257 793 200 284 (84) Swaps 440 1,085 (645) 1,329 1,024 305 Options 238 370 (132) 246 333 (87) 1,728 1,712 16 1,775 1,641 134 Total – Contracts held for trading purposes 6,415 5,457 958 5,430 4,637 793 Contracts designated as hedges Interest rate contracts Forwards Swaps 645 238 407 469 210 259 Options 2 26 (24) 2 11 (9) 647 264 383 471 221 250
Foreign exchange contracts
Forwards Swaps 30 30 2 2 Options 30 30 2 2
Equity, commodity and credit derivative contracts
Forwards Swaps 1 1 Options 1 1 Total – Contracts designated as hedges 677 264 413 474 221 253 Designated as fair value hedges 420 178 242 390 188 202 Designated as cash flow hedges 243 86 157 82 33 49 Designated as a hedge of a net investment in a foreign operation 14 14 2 2 Total fair value 7,092 5,721 1,371 5,904 4,858 1,046 Impact of master netting agreements (3,661) (3,661) (2,826) (2,826) 3,431 2,060 1,371 3,078 2,032 1,046

AUDITED CONSOLIDATED FINANCIAL STATEMENTS NOTES TO THE AUDITED CONSOLIDATED FINANCIAL STATEMENTS (millions of Canadian dollars)
162 National Bank of Canada 2014 Annual Report
NOTE 17 – HEDGING ACTIVITIES
Derivative and Non-Derivative Financial Instruments Designated as Hedging Instruments As at October 31 2014 2013
Fair value
hedge Cash flow
hedge Net investment
hedge Fair value
hedge Cash flow
hedge Net investment
hedge
Assets Derivative financial instruments 420 243 14 390 82 2 Liabilities Derivative financial instruments 178 86 188 33 Carrying value of non-derivative financial instruments 1,373 1,192 Notional amounts of designated derivative financial instruments 19,156 19,918 637 20,830 3,956 190
Fair Value Hedges Fair value hedge transactions consist of using interest rate swaps to hedge changes in the fair value of a financial asset or financial liability caused by interest rate fluctuations. Changes in the fair value of the derivative financial instruments used as hedging instruments offset changes in the fair value of the hedged item. The Bank applies this strategy mainly to portfolios of available-for-sale securities, fixed-rate deposits, liabilities related to transferred receivables and subordinated debt.
Results of the Fair Value Hedges Year ended October 31 2014 2013
Gains (losses) on hedging instruments 95 (106) Gains (losses) on hedged items attributable to the hedged risk (96) 107 Ineffectiveness of fair value hedging relationships 1 2
Cash Flow Hedges Cash flow hedge transactions consist of using interest rate swaps to hedge the risk of changes in future cash flows caused by floating-rate assets or liabilities. The Bank applies this strategy mainly to loan, personal credit line and deposit portfolios. The Bank also uses total return swaps to hedge the risk of changes in future cash flows related to the Restricted Stock Unit (RSU) Plan. Some of these swaps are designated as part of a cash flow hedge against a portion of the unrecognized obligation of the RSU Plan. In a cash flow hedge, the derivative financial instruments used as hedging instruments reduce the variability of future cash flows related to the hedged item.
Results of the Cash Flow Hedges Year ended October 31 2014 2013
Unrealized gains (losses) included in Other comprehensive income as the effective portion of the hedging instrument 119 (36) Losses (gains) reclassified to Net interest income in the Consolidated Statement of Income (15) (38) Ineffectiveness of cash flow hedging relationships (2)

AUDITED CONSOLIDATED FINANCIAL STATEMENTS NOTES TO THE AUDITED CONSOLIDATED FINANCIAL STATEMENTS (millions of Canadian dollars)
National Bank of Canada 163 2014 Annual Report
The following table shows the periods during which the Bank expects the hedged cash flows to occur and have an impact on net income. As at October 31, 2014
1 year or less
Over 1 year to 2 years
Over 2 years to 5 years
Over
5 years
Expected cash flows from hedged assets 55 64 229 77 Expected cash flows from hedged liabilities 92 72 165 64
Net exposure (37) (8) 64 13
As at October 31, 2013
1 year or less
Over 1 year to 2 years
Over 2 years to 5 years
Over
5 years
Expected cash flows from hedged assets 60 49 66 22 Expected cash flows from hedged liabilities 75 63 111
Net exposure (15) (14) (45) 22 Hedges of Net Investments in Foreign Operations The Bank’s structural foreign exchange risk arises from investments in foreign operations denominated in currencies other than the Canadian dollar. The Bank measures this risk by assessing the impact of foreign currency fluctuations and hedges it using financial instruments (derivative or non-derivative). In a hedge of a net investment in a foreign operation, the financial instruments used offset foreign exchange gains and losses on the investments. When non-derivative financial instruments are designated as foreign exchange risk hedges, only the changes in fair value that are attributable to foreign exchange risk are taken into account in assessing and calculating the effectiveness of the hedge. For the years ended October 31, 2014 and 2013, a negligible amount representing the ineffective portion was recognized in Non-interest income in the Consolidated Statement of Income.

AUDITED CONSOLIDATED FINANCIAL STATEMENTS NOTES TO THE AUDITED CONSOLIDATED FINANCIAL STATEMENTS (millions of Canadian dollars)
164 National Bank of Canada 2014 Annual Report
NOTE 18 – SHARE CAPITAL Authorized Common Shares An unlimited number of shares without par value. First Preferred Shares An unlimited number of shares, without par value, issuable for a maximum aggregate consideration of $5 billion. Characteristics of first preferred shares issued and outstanding (amounts in dollars) Series 16 Redeemable in cash at the Bank’s option, subject to the provisions of the Bank Act (Canada) and to OSFI approval, since May 15, 2010, in whole or in part, at a price equal to $26.00 per share if redeemed before May 15, 2011, at a price equal to $25.75 per share if redeemed during the 12-month period preceding May 15, 2012, at a price equal to $25.50 per share if redeemed during the 12-month period preceding May 15, 2013, at a price equal to $25.25 per share if redeemed during the 12-month period preceding May 15, 2014, and at a price equal to $25.00 per share if redeemed on or after May 15, 2014, plus, in all cases, all declared and unpaid dividends at the date fixed for redemption. These shares carry a non-cumulative quarterly dividend of $0.303125. Series 20 Redeemable in cash at the Bank’s option, subject to the provisions of the Bank Act (Canada) and to OSFI approval, since May 15, 2013, in whole or in part, at a price equal to $26.00 per share if redeemed before May 15, 2014, at a price equal to $25.75 per share if redeemed during the 12-month period preceding May 15, 2015, at a price equal to $25.50 per share if redeemed during the 12-month period preceding May 15, 2016, at a price equal to $25.25 per share if redeemed during the 12-month period preceding May 15, 2017, and at a price equal to $25.00 per share if redeemed on or after May 15, 2017, plus, in all cases, all declared and unpaid dividends at the date fixed for redemption. These shares carry a non-cumulative quarterly dividend of $0.375. Series 28 Redeemable in cash at the Bank’s option, subject to the provisions of the Bank Act (Canada) and to OSFI approval, on or after November 15, 2017 and November 15 every five years thereafter, in whole or in part, at a price equal to $25.00 per share, plus all dividends declared and unpaid thereon on the date fixed for redemption. Convertible into floating-rate non-cumulative Series 29 First Preferred Shares of the Bank, subject to certain conditions, on November 15, 2017 and on November 15 every five years thereafter. These shares carry a non-cumulative quarterly dividend of $0.2375 for the initial period ending November 15, 2017. Thereafter, these shares carry a non-cumulative quarterly fixed dividend in an amount per share determined by multiplying the interest rate, equal to the sum of the 5-year Government of Canada bond-yield on the calculation date of the applicable fixed rate plus 2.43%, by $25.00. Series 30 Redeemable in cash at the Bank’s option, subject to the provisions of the Bank Act (Canada) and to OSFI approval, on or after May 15, 2019 and May 15 every five years thereafter, in whole or in part, at a price equal to $25.00 per share, plus all dividends declared and unpaid thereon on the date fixed for redemption. Convertible into floating-rate non-cumulative Series 31 First Preferred Shares of the Bank, subject to certain conditions, on May 15, 2019 and on May 15 every five years thereafter. These shares carry a non-cumulative quarterly dividend of $0.2563 for the initial period ending May 15, 2019. Thereafter, these shares carry a non-cumulative quarterly fixed dividend in an amount per share determined by multiplying the interest rate, equal to the sum of the 5-year Government of Canada bond-yield on the calculation date of the applicable fixed rate plus 2.40%, by $25.00. Upon the occurrence of a trigger event as defined by OSFI, each outstanding Series 30 preferred share will be automatically and immediately converted, on a full and permanent basis, without the consent of the holder, into a number of common shares of the Bank determined pursuant to an automatic conversion formula. This conversion will be calculated by dividing the value of the preferred shares, i.e., $25.00 per share, plus all declared and unpaid dividends as at the date of the trigger event, by the value of the common shares. The value of the common shares will be the greater of a $5.00 floor price or the current market price of the common shares. Current market price means the volume weighted average trading price of common shares for the ten consecutive trading days ending on the trading day preceding the date of the trigger event. If the common shares are not listed on an exchange when this price is being established, the price will be the fair value reasonably determined by the Bank’s Board.

AUDITED CONSOLIDATED FINANCIAL STATEMENTS NOTES TO THE AUDITED CONSOLIDATED FINANCIAL STATEMENTS (millions of Canadian dollars)
National Bank of Canada 165 2014 Annual Report
Series 32 Redeemable in cash at the Bank’s option, subject to the provisions of the Bank Act (Canada) and to OSFI approval, on or after February 15, 2020 and February 15 every five years thereafter, in whole or in part, at a price equal to $25.00 per share, plus all dividends declared and unpaid thereon on the date fixed for redemption. Convertible into floating-rate non-cumulative Series 33 First Preferred Shares of the Bank, subject to certain conditions, on February 15, 2020 and on February 15 every five years thereafter. These shares carry a non-cumulative quarterly dividend of $0.2438 for the initial period ending February 15, 2020. Thereafter, these shares carry a non-cumulative quarterly fixed dividend in an amount per share determined by multiplying the interest rate, equal to the sum of the 5-year Government of Canada bond-yield on the calculation date of the applicable fixed rate plus 2.25%, by $25.00. Upon the occurrence of a trigger event as defined by OSFI, each outstanding Series 32 preferred share will be automatically and immediately converted, on a full and permanent basis, without the consent of the holder, into a number of common shares of the Bank determined pursuant to an automatic conversion formula. This conversion will be calculated by dividing the value of the preferred shares, i.e., $25.00 per share, plus all declared and unpaid dividends as at the date of the trigger event, by the value of the common shares. The value of the common shares will be the greater of a $5.00 floor price or the current market price of the common shares. Current market price means the volume weighted average trading price of common shares for the ten consecutive trading days ending on the trading day preceding the date of the trigger event. If the common shares are not listed on an exchange when this price is being established, the price will be the fair value reasonably determined by the Bank’s Board. Characteristics of first preferred shares, authorized but unissued (amounts in dollars) Series 17 Each NBC CapS – Series 1 is exchangeable at any time, upon prior notice, for 40 Series 17 First Preferred Shares, which pay semi-annual non-cumulative cash dividends and are redeemable at the Bank’s option, subject to the provisions of the Bank Act (Canada) and to OSFI approval, since June 30, 2011, but are not redeemable at the option of the holders. Series 18 Each NBC CapS – Series 1 can be exchanged automatically, without the consent of the holders, for 40 Series 18 First Preferred Shares, upon the occurrence of any one of the following events: (i) proceedings are commenced for the winding-up of the Bank; (ii) OSFI takes control of the Bank; (iii) the Bank posts a Tier 1 capital ratio of less than 5% or a total capital ratio of less than 8%; or (iv) OSFI has directed the Bank to increase its capital or to provide additional liquidity and the Bank elects such automatic exchange or the Bank fails to comply with such direction to the satisfaction of OSFI. Series 18 First Preferred Shares pay semi-annual non-cumulative cash dividends and are redeemable at the Bank’s option, subject to the provisions of the Bank Act (Canada) and to OSFI approval, since June 30, 2011, but are not redeemable at the option of the holders. Series 19 Each NBC CapS II – Series 1 can be exchanged automatically, without the consent of the holders, for 40 Series 19 First Preferred Shares of the Bank upon the occurrence of one of the following events: (i) proceedings are commenced for the winding-up of the Bank; (ii) OSFI takes control of the Bank; (iii) the Bank posts a Tier 1 capital ratio of less than 5% or a total capital ratio of less than 8%; or (iv) OSFI has directed the Bank to increase its capital or to provide additional liquidity and the Bank elects such automatic exchange or the Bank fails to comply with such direction to the satisfaction of OSFI. Series 19 First Preferred Shares pay semi-annual non-cumulative cash dividends and are redeemable at the Bank’s option, subject to the provisions of the Bank Act (Canada) and to OSFI approval, since June 30, 2013, but are not redeemable at the option of the holders. Series 23 Each NBC CapS II – Series 2 can be exchanged automatically, without the consent of the holders, for 40 Series 23 First Preferred Shares of the Bank upon the occurrence of one of the following events: (i) proceedings are commenced for the winding-up of the Bank; (ii) OSFI takes control of the Bank; (iii) the Bank posts a Tier 1 capital ratio of less than 5% or a total capital ratio of less than 8%; or (iv) OSFI has directed the Bank to increase its capital or to provide additional liquidity and the Bank elects such automatic exchange or the Bank fails to comply with such direction to the satisfaction of OSFI. Series 23 First Preferred Shares pay semi-annual non-cumulative cash dividends and are redeemable at the Bank’s option, subject to the provisions of the Bank Act (Canada) and to OSFI approval, since July 31, 2013, but are not redeemable at the option of the holders. Series 29 Redeemable in cash at the Bank’s option, subject to the provisions of the Bank Act (Canada) and to OSFI approval, on or after November 15, 2022 and November 15 every five years thereafter, in whole or in part, at a price equal to $25.00 per share, plus all dividends declared and unpaid thereon on the date fixed for redemption or at $25.50 per share, plus all dividends declared and unpaid thereon on the date fixed for redemption on any other date on or after November 15, 2017. Series 29 First Preferred Shares pay quarterly floating-rate non-cumulative dividends on or after November 15, 2017.

AUDITED CONSOLIDATED FINANCIAL STATEMENTS NOTES TO THE AUDITED CONSOLIDATED FINANCIAL STATEMENTS (millions of Canadian dollars)
166 National Bank of Canada 2014 Annual Report
NOTE 18 – SHARE CAPITAL (cont.) Series 31 Redeemable in cash at the Bank’s option, subject to the provisions of the Bank Act (Canada) and to OSFI approval, on or after May 15, 2024 and May 15 every five years thereafter, in whole or in part, at a price equal to $25.00 per share, plus all dividends declared and unpaid thereon on the date fixed for redemption or at $25.50 per share, plus all dividends declared and unpaid thereon on the date fixed for redemption on any other date on or after May 15, 2019. Series 31 First Preferred Shares pay quarterly floating-rate non-cumulative dividends on or after May 15, 2019. Upon the occurrence of a trigger event as defined by OSFI, each outstanding Series 31 preferred share will be automatically and immediately converted, on a full and permanent basis, without the consent of the holder, into a number of common shares of the Bank determined pursuant to an automatic conversion formula. This conversion will be calculated by dividing the value of the preferred shares, i.e., $25.00 per share, plus all declared and unpaid dividends as at the date of the trigger event, by the value of the common shares. The value of the common shares will be the greater of a $5.00 floor price or the current market price of the common shares. Current market price means the volume weighted average trading price of common shares for the ten consecutive trading days ending on the trading day preceding the date of the trigger event. If the common shares are not listed on an exchange when this price is being established, the price will be the fair value reasonably determined by the Bank’s Board. Series 33 Redeemable in cash at the Bank’s option, subject to the provisions of the Bank Act (Canada) and to OSFI approval, on or after February 15, 2025 and February 15 every five years thereafter, in whole or in part, at a price equal to $25.00 per share, plus all dividends declared and unpaid thereon on the date fixed for redemption or at $25.50 per share, plus all dividends declared and unpaid thereon on the date fixed for redemption on any other date on or after February 15, 2020. Series 33 First Preferred Shares pay quarterly floating-rate non-cumulative dividends on or after February 15, 2020. Upon the occurrence of a trigger event as defined by OSFI, each outstanding Series 33 preferred share will be automatically and immediately converted, on a full and permanent basis, without the consent of the holder, into a number of common shares of the Bank determined pursuant to an automatic conversion formula. This conversion will be calculated by dividing the value of the preferred shares, i.e., $25.00 per share, plus all declared and unpaid dividends as at the date of the trigger event, by the value of the common shares. The value of the common shares will be the greater of a $5.00 floor price or the current market price of the common shares. Current market price means the volume weighted average trading price of common shares for the ten consecutive trading days ending on the trading day preceding the date of the trigger event. If the common shares are not listed on an exchange when this price is being established, the price will be the fair value reasonably determined by the Bank’s Board. Second Preferred Shares 15 million shares without par value, issuable for a total maximum consideration of $300 million. As at October 31, 2014, no shares had been issued or traded.
Shares Outstanding and Dividends Declared 2014
As at October 31 Year ended October 31 Shares Dividends
Number
of shares $ $ Per share
First Preferred Shares Series 16 8,000,000 200 10 1.2125 Series 20 6,900,000 173 10 1.5000 Series 24 1 0.4125 Series 26 1 0.4125 Series 28 8,000,000 200 7 0.9500 Series 30 14,000,000 350 11 0.7849 Series 32 12,000,000 300 Preferred shares and dividends 48,900,000 1,223 40 Common shares at beginning(1) 325,982,736 2,160 Issued pursuant to Stock Option Plan(1) 2,944,507 102 Impact of shares purchased or sold for trading(1) 405,424 31 Other(1) (35,292) Common shares at end and dividends(1) 329,297,375 2,293 616 1.8800 Total dividends 656
(1) Reflecting the stock dividend, as described on the next page.

AUDITED CONSOLIDATED FINANCIAL STATEMENTS NOTES TO THE AUDITED CONSOLIDATED FINANCIAL STATEMENTS (millions of Canadian dollars)
National Bank of Canada 167 2014 Annual Report
2013
As at October 31 Year ended October 31 Shares Dividends
Number
of shares $ $ Per share
First Preferred Shares Series 15 2 0.2444 Series 16 8,000,000 200 10 1.2125 Series 20 6,900,000 173 10 1.5000 Series 21 3 1.0078 Series 24 2,425,880 61 4 1.6500 Series 26 1,724,835 43 3 1.6500 Series 28 8,000,000 200 8 0.9728 Preferred shares and dividends 27,050,715 677 40 Common shares at beginning(1) 322,616,546 2,054 Issued pursuant to Stock Option Plan(1) 3,529,528 107 Impact of shares purchased or sold for trading(1) (137,688) (1) Other(1) (25,650) Common shares at end and dividends(1) 325,982,736 2,160 552 1.7000 Total dividends 592
(1) Reflecting the stock dividend, as described below.
Stock Dividend On December 3, 2013, the Board declared a stock dividend of one common share on each issued and outstanding common share, paid on February 13, 2014 to common shareholders of record on February 6, 2014. The effect was the same as a two-for-one split of common shares. All common share information has been adjusted retrospectively to reflect the stock dividend. Issuances of Preferred Shares On October 9, 2014, the Bank completed the issuance of 12,000,000 non-cumulative 5-year rate-reset Series 32 First Preferred Shares at a price equal to $25.00 per share for gross proceeds of $300 million. Given that the Series 32 preferred shares satisfy the non-viability contingent capital requirements, they qualify for the purposes of calculating regulatory capital under Basel III. On February 7, 2014, the Bank completed the issuance of 14,000,000 non-cumulative 5-year rate-reset Series 30 First Preferred Shares at a price equal to $25.00 per share for gross proceeds of $350 million. Given that the Series 30 preferred shares satisfy the non-viability contingent capital requirements, they qualify for the purposes of calculating regulatory capital under Basel III. On November 7, 2012, the Bank had completed the issuance of 8,000,000 non-cumulative 5-year rate-reset Series 28 First Preferred Shares at a price equal to $25.00 per share for gross proceeds of $200 million.

AUDITED CONSOLIDATED FINANCIAL STATEMENTS NOTES TO THE AUDITED CONSOLIDATED FINANCIAL STATEMENTS (millions of Canadian dollars)
168 National Bank of Canada 2014 Annual Report
NOTE 18 – SHARE CAPITAL (cont.) Redemption of Preferred Shares On September 26, 2014, the Bank announced the redemption of all the issued and outstanding non-cumulative Series 16 First Preferred Shares. Pursuant to the share conditions, the redemption price was $25.00 per share plus the periodic dividend declared and unpaid. The Bank completed the redemption of 8,000,000 Series 16 preferred shares for a total amount of $200 million on November 17, 2014, the first business day after the redemption date. On February 15, 2014, the Bank announced the redemption of all the issued and outstanding non-cumulative 5-year rate-reset Series 24 and Series 26 First Preferred Shares. Pursuant to the share conditions, the redemption price was $25.00 per share plus the periodic dividend declared and unpaid. The Bank redeemed 2,425,880 Series 24 preferred shares for a total amount of $61 million and 1,724,835 Series 26 preferred shares for a total amount of $43 million, which reduced Preferred share capital by $104 million. On August 16, 2013, the Bank had completed the redemption of all the issued and outstanding non-cumulative 5-year rate-reset Series 21 First Preferred Shares. Pursuant to the share conditions, the redemption price was $25.00 per share plus the periodic dividend declared and unpaid. The Bank had redeemed 3,410,861 Series 21 preferred shares for a total amount of $85 million, which reduced Preferred share capital by $85 million. On January 15, 2013, the Bank had completed the redemption of all the issued and outstanding non-cumulative fixed-rate Series 15 First Preferred Shares. Pursuant to the share conditions, the redemption price was $25.00 per share plus the periodic dividend declared and unpaid. The Bank had redeemed 8,000,000 Series 15 preferred shares for a total amount of $200 million, which reduced Preferred share capital by $200 million. Repurchase of Common Shares(1) On June 20, 2013, the Bank began a normal course issuer bid to repurchase for cancellation up to 6,496,228 common shares over the 12-month period ended June 19, 2014. During the years ended October 31, 2014 and 2013, the Bank did not repurchase any shares. Reserved Common Shares As at October 31, 2014 and 2013, 15,507,568 common shares were reserved under the Dividend Reinvestment and Share Purchase Plan, and 23,186,367 common shares were reserved under the Stock Option Plan. Common Shares Held in Escrow(1) As part of the acquisition of Wellington West Holdings Inc. in 2011, the Bank had issued common shares held in escrow. As at October 31, 2014, the number of common shares held in escrow was 977,110 (2,664,268 as at October 31, 2013). The Bank expects that the conditions will be met and that the remaining shares held in escrow will be released by the end of fiscal 2016. Restriction on the Payment of Dividends The Bank is prohibited from declaring dividends on its common or preferred shares if there are reasonable grounds for believing that the Bank would, by so doing, be in contravention of the regulations of the Bank Act (Canada) or OSFI’s capital adequacy and liquidity guidelines. In addition, the ability to pay common share dividends is restricted by the terms of the outstanding preferred shares pursuant to which the Bank may not pay dividends on its common shares without the approval of the holders of the outstanding preferred shares, unless all preferred share dividends have been declared and paid or set aside for payment. Moreover, if NBC Capital Trust or NBC Asset Trust were unable to pay the full amount of distributions on the trust units, the Bank would not be permitted to pay dividends on its preferred or common shares. For additional information, see Notes 19 and 28. Dividend Reinvestment Plan The Bank has a dividend reinvestment plan for common and preferred shareholders. Participation in the plan is optional. Under the terms and conditions of the plan, participants acquire shares through the reinvestment of cash dividends paid on the shares they hold or through optional cash payments. Common shares subscribed by participants are purchased on their behalf in the secondary market through the Bank’s transfer agent, Computershare Trust Company of Canada, at a price equal to the average purchase price of the common shares during the ten business days immediately following the dividend payment date. (1) Reflecting the stock dividend, as described on the previous page.

AUDITED CONSOLIDATED FINANCIAL STATEMENTS NOTES TO THE AUDITED CONSOLIDATED FINANCIAL STATEMENTS (millions of Canadian dollars)
National Bank of Canada 169 2014 Annual Report
NOTE 19 – NON-CONTROLLING INTERESTS As at October 31 2014 2013(1)
Trust units issued by NBC Asset Trust (NBC CapS II) Series 1(2) 409 409 Series 2(3) 359 359 Other 27 21 Total 795 789
(1) Certain amounts have been adjusted to reflect changes in accounting standards. See Note 2. (2) Includes $9 million in accrued interest ($9 million as at October 31, 2013). (3) Includes $9 million in accrued interest ($9 million as at October 31, 2013).
Trust Units Issued by NBC Asset Trust Through structured entity NBC Asset Trust (the Trust), an open-end trust established under the laws of the Province of Ontario, the Bank issued transferable non-voting trust units called “Trust Capital Securities” or “NBC CapS II.” These securities are not redeemable or exchangeable for Bank preferred shares at the option of the holder. The gross proceeds from the issuance were used by the Trust to finance the acquisition of mortgage loans from the Bank. For additional information, see Note 28. The main terms and characteristics of the NBC CapS II trust units are presented below.
Number Issuance date Annual yield Distribution date
Semi-annual distribution
by NBC CapS II(1)
Series 1 400,000 January 22, 2008 7.235 % June 30,
December 31 $36.175 (2)
Series 2 350,000 June 30, 2008 7.447 % June 30,
December 31 $37.235 (3)
(1) For each unit with a face value of $1,000. (2) For each distribution date after June 30, 2018, the distribution will be paid at the rate equal to one-half of the sum of 180-day bankers’ acceptance rate in effect plus 3.79%. (3) For each distribution date after June 30, 2020, the distribution will be paid at the rate equal to one-half of the sum of 180-day bankers’ acceptance rate in effect plus 4.09%.
Distribution No cash distributions will be payable by the Trust on NBC CapS II if the Bank fails to declare regular dividends on its preferred shares or, if no preferred shares are then outstanding, on its outstanding common shares. In this case, the net distributable funds of the Trust will be paid to the Bank as the sole holder of the special trust securities, representing the residual interest in the Trust. Should the Trust fail to pay the semi-annual distributions in full on the NBC CapS II, the Bank will withhold from declaring dividends on any of its preferred and common shares during a determined period. Automatic exchange Each NBC CapS II – Series 1 can be exchanged automatically, without the consent of the holders, for 40 Series 19 First Preferred Shares of the Bank, and each NBC CapS II – Series 2 can be exchanged automatically, without the consent of the holders, for 40 Series 23 First Preferred Shares of the Bank, upon the occurrence of certain predetermined events. For additional information, see Note 18. On an automatic exchange, the Bank will hold all outstanding trust capital securities of the Trust. Redemption at the option of the Trust Since June 30, 2013 for Series 1, and since July 31, 2013 for Series 2, and on any subsequent distribution date, the Trust may, subject to prior written notice and OSFI approval, redeem, at its option, the NBC CapS II, in whole but not in part, without the consent of the holders. Purchase for cancellation Since January 22, 2013 for Series 1 and since June 30, 2013 for Series 2, the Trust may, with OSFI approval, purchase NBC CapS II in whole or in part on the open market or by tender or private contract at any price. The NBC CapS II purchased by the Trust, if any, will be cancelled and will not be reissued. Regulatory capital The NBC CapS II qualify as innovative capital instruments and are eligible as additional Tier 1 capital, but because these instruments do not satisfy the non-viability contingent capital requirements, they are to be phased out at a rate of 10% per year between 2013 and 2022.
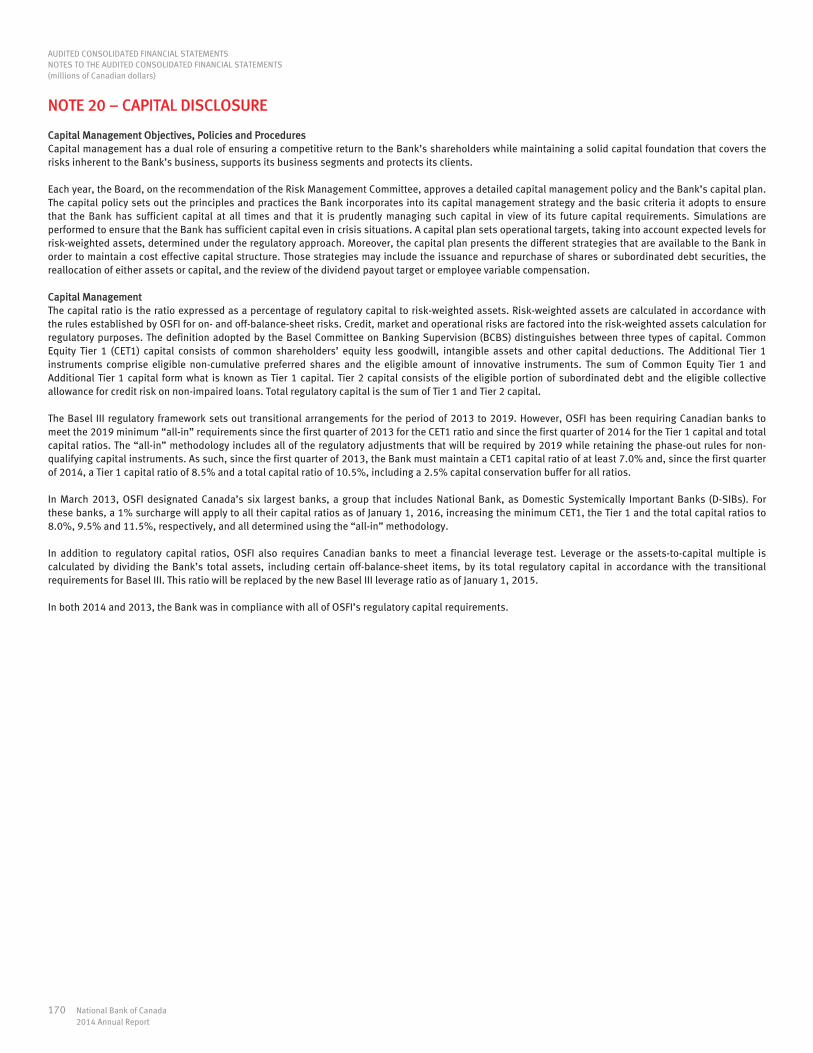
AUDITED CONSOLIDATED FINANCIAL STATEMENTS NOTES TO THE AUDITED CONSOLIDATED FINANCIAL STATEMENTS (millions of Canadian dollars)
170 National Bank of Canada 2014 Annual Report
NOTE 20 – CAPITAL DISCLOSURE Capital Management Objectives, Policies and Procedures Capital management has a dual role of ensuring a competitive return to the Bank’s shareholders while maintaining a solid capital foundation that covers the risks inherent to the Bank’s business, supports its business segments and protects its clients. Each year, the Board, on the recommendation of the Risk Management Committee, approves a detailed capital management policy and the Bank’s capital plan. The capital policy sets out the principles and practices the Bank incorporates into its capital management strategy and the basic criteria it adopts to ensure that the Bank has sufficient capital at all times and that it is prudently managing such capital in view of its future capital requirements. Simulations are performed to ensure that the Bank has sufficient capital even in crisis situations. A capital plan sets operational targets, taking into account expected levels for risk-weighted assets, determined under the regulatory approach. Moreover, the capital plan presents the different strategies that are available to the Bank in order to maintain a cost effective capital structure. Those strategies may include the issuance and repurchase of shares or subordinated debt securities, the reallocation of either assets or capital, and the review of the dividend payout target or employee variable compensation. Capital Management The capital ratio is the ratio expressed as a percentage of regulatory capital to risk-weighted assets. Risk-weighted assets are calculated in accordance with the rules established by OSFI for on- and off-balance-sheet risks. Credit, market and operational risks are factored into the risk-weighted assets calculation for regulatory purposes. The definition adopted by the Basel Committee on Banking Supervision (BCBS) distinguishes between three types of capital. Common Equity Tier 1 (CET1) capital consists of common shareholders’ equity less goodwill, intangible assets and other capital deductions. The Additional Tier 1 instruments comprise eligible non-cumulative preferred shares and the eligible amount of innovative instruments. The sum of Common Equity Tier 1 and Additional Tier 1 capital form what is known as Tier 1 capital. Tier 2 capital consists of the eligible portion of subordinated debt and the eligible collective allowance for credit risk on non-impaired loans. Total regulatory capital is the sum of Tier 1 and Tier 2 capital. The Basel III regulatory framework sets out transitional arrangements for the period of 2013 to 2019. However, OSFI has been requiring Canadian banks to meet the 2019 minimum “all-in” requirements since the first quarter of 2013 for the CET1 ratio and since the first quarter of 2014 for the Tier 1 capital and total capital ratios. The “all-in” methodology includes all of the regulatory adjustments that will be required by 2019 while retaining the phase-out rules for non-qualifying capital instruments. As such, since the first quarter of 2013, the Bank must maintain a CET1 capital ratio of at least 7.0% and, since the first quarter of 2014, a Tier 1 capital ratio of 8.5% and a total capital ratio of 10.5%, including a 2.5% capital conservation buffer for all ratios. In March 2013, OSFI designated Canada’s six largest banks, a group that includes National Bank, as Domestic Systemically Important Banks (D-SIBs). For these banks, a 1% surcharge will apply to all their capital ratios as of January 1, 2016, increasing the minimum CET1, the Tier 1 and the total capital ratios to 8.0%, 9.5% and 11.5%, respectively, and all determined using the “all-in” methodology. In addition to regulatory capital ratios, OSFI also requires Canadian banks to meet a financial leverage test. Leverage or the assets-to-capital multiple is calculated by dividing the Bank’s total assets, including certain off-balance-sheet items, by its total regulatory capital in accordance with the transitional requirements for Basel III. This ratio will be replaced by the new Basel III leverage ratio as of January 1, 2015. In both 2014 and 2013, the Bank was in compliance with all of OSFI’s regulatory capital requirements.

AUDITED CONSOLIDATED FINANCIAL STATEMENTS NOTES TO THE AUDITED CONSOLIDATED FINANCIAL STATEMENTS (millions of Canadian dollars)
National Bank of Canada 171 2014 Annual Report
Regulatory Capital and Capital Ratios According to Basel III(1)
As at October 31 2014 2013
Regulatory Capital Common Equity Tier 1 (CET1) 5,985 5,350 Tier 1(2) 7,983 7,002 Total(2) 9,868 9,186 Risk-weighted assets(3) Common Equity Tier 1 (CET1) capital 64,818 61,251 Tier 1 capital 65,074 n.a. Total capital 65,459 n.a. Capital ratios Common Equity Tier 1 (CET1) 9.2 % 8.7 % Tier 1(2) 12.3 % 11.4 % Total(2) 15.1 % 15.0 % Assets-to-capital multiple 19.0 18.4
n.a. Not applicable (1) Figures are presented on an “all-in” basis except for the assets-to-capital multiple, which is presented in accordance with the transitional requirements for Basel III, and the October 31,
2013 figures have not been adjusted to reflect changes in accounting standards. (2) Figures as at October 31, 2014 include the redemption of the Series 16 preferred shares on November 15, 2014. (3) The credit valuation adjustment (CVA) charge, with its three levels based on the chosen ratio, was not included in the RWA calculation as at October 31, 2013.
NOTE 21 – TRADING ACTIVITY REVENUES Trading activity revenues consist of the net interest income from trading activities and trading revenues recognized in Non-interest income in the Consolidated Statement of Income. Net interest income comprises dividends related to financial assets and liabilities associated with trading activities, net of interest expenses and interest income related to the financing of these financial assets and liabilities. Non-interest income consists of realized and unrealized gains and losses as well as interest income on securities measured at fair value through profit or loss, income from held-for-trading derivative financial instruments, and the change in fair value of financial instruments designated at fair value through profit or loss. Year ended October 31 2014 2013
Net interest income 418 430 Non-interest income 106 186 Total 524 616

AUDITED CONSOLIDATED FINANCIAL STATEMENTS NOTES TO THE AUDITED CONSOLIDATED FINANCIAL STATEMENTS (millions of Canadian dollars)
172 National Bank of Canada 2014 Annual Report
NOTE 22 – SHARE-BASED PAYMENTS
The information below on compensation expense reflects the stock dividend paid on February 13, 2014, (see Note 18) and excludes the impact of hedging. Stock Option Plan The Bank’s Stock Option Plan is for officers and other designated persons of the Bank and its subsidiaries. Under this plan, options are awarded annually and provide participants with the right to purchase common shares at an exercise price equal to the closing price of the Bank’s common share on the Toronto Stock Exchange on the day preceding the award. The options vest evenly over a four-year period and expire ten years from the award date or, in certain circumstances set out in the plan, within specified time limits. The Stock Option Plan contains provisions for retiring employees that allow the participant’s rights to continue vesting in accordance with the stated terms of the grant agreement. The maximum number of common shares that may be issued under the Stock Option Plan was 23,186,367 as at October 31, 2014 (26,130,874 as at October 31, 2013). The maximum number of common shares reserved for a participant may not exceed 5% of the total number of Bank shares issued and outstanding. As at October 31 2014 2013
Number of options
Weighted average
exercise price Number of
options
Weightedaverage
exercise price
Stock Option Plan Outstanding at beginning 15,015,756 $31.86 15,588,436 $29.33 Awarded 2,863,376 $44.96 3,225,392 $38.36 Exercised (2,944,507) $30.16 (3,529,528) $26.48 Cancelled(1) (258,434) $37.37 (268,544) $34.30 Outstanding at end 14,676,191 $34.65 15,015,756 $31.86 Exercisable at end 7,286,133 $29.65 7,132,326 $27.96
(1) No options expired during the years ended October 31, 2014 and 2013.
Exercise price Options
outstanding Options
exercisable Expiry date
$24.10 52,400 52,400 December 2014 $30.72 233,700 233,700 December 2015 $32.95 684,898 684,898 December 2016 $26.93 960,620 960,620 December 2017 $17.44 1,163,104 1,163,104 December 2018 $29.25 1,387,164 1,387,164 December 2019 $34.34 1,948,975 1,260,281 December 2020 $34.09 2,566,462 980,558 December 2021 $38.36 2,861,900 563,408 December 2022 $44.96 2,816,968 December 2023
Total 14,676,191 7,286,133
During the year ended October 31, 2014, the Bank awarded 2,863,376 stock options (3,225,392 during the year ended October 31, 2013) with an average fair value of $5.39 per option ($4.90 for the year ended October 31, 2013). The average fair value of options awarded was estimated on the award date using the Black-Scholes model as well as the following assumptions. As at October 31 2014 2013
Risk-free interest rate 2.47% 1.78% Expected life of options 7 years 7 years Expected volatility 20.46% 22.85% Expected dividend yield 4.4% 4.3%

AUDITED CONSOLIDATED FINANCIAL STATEMENTS NOTES TO THE AUDITED CONSOLIDATED FINANCIAL STATEMENTS (millions of Canadian dollars)
National Bank of Canada 173 2014 Annual Report
The expected life of the options is based on historical data and is not necessarily representative of how options will be exercised in the future. Expected volatility is extrapolated from the implied volatility of the Bank’s share price and observable market inputs, which are not necessarily representative of actual results. The expected dividend yield represents the annualized dividend divided by the Bank’s share price at the award date. The risk-free interest rate is based on the Canadian dollar swap curve at the award date. The exercise price is equal to the Bank’s share price at the award date. No other market parameter has been included in the fair value measurement of the options. The compensation expense recorded for this plan for the year ended October 31, 2014 was $15 million ($16 million for the year ended October 31, 2013). Stock Appreciation Rights (SAR) Plan The SAR Plan is for officers and other designated persons of the Bank and its subsidiaries. Under this plan, participants receive, upon exercising the right, a cash amount equal to the difference between the closing price of the Bank’s common share on the Toronto Stock Exchange on the day preceding the exercise date and the closing price on the day preceding the award date. SARs vest evenly over a four-year period and expire 10 years after the award date or, in certain circumstances set out in the plan, within specified time limits. The SAR Plan contains provisions for retiring employees that allow the participant’s rights to continue vesting in accordance with the stated terms of the grant agreement. The compensation expense recognized for the year ended October 31, 2014 with respect to this plan was $3 million ($2 million for the year ended October 31, 2013). As at October 31 2014 2013
Number of SARs
Weighted average
exercise price Number of SARs
Weightedaverage
exercise price SAR Plan Outstanding at beginning 356,094 $30.01 360,052 $28.61 Awarded 36,320 $44.96 47,496 $38.36 Exercised (127,480) $26.90 (51,454) $27.91 Cancelled(1) (21,394) $33.31 Outstanding at end 243,540 $33.58 356,094 $30.01
Exercisable at end 141,428 $29.49 221,766 $27.05
(1) No SARs expired during the years ended October 31, 2014 and 2013.
Exercise price SARs
outstanding SARs
exercisable Expiry date
$30.72 4,600 4,600 December 2015 $32.95 5,200 5,200 December 2016 $26.93 5,896 5,896 December 2017 $17.44 24,140 24,140 December 2018 $29.25 48,014 48,014 December 2019 $34.34 47,470 28,224 December 2020 $34.09 32,552 15,808 December 2021 $38.36 39,348 9,546 December 2022 $44.96 36,320 December 2023 Total 243,540 141,428
Deferred Stock Unit (DSU) Plans The DSU Plans are for officers and other designated persons of the Bank and its subsidiaries as well as directors. These plans allow the Bank to tie a portion of the value of the compensation of participants to the future value of the Bank’s common shares. A DSU is a right that has a value equal to the closing price of a common share of the Bank on the Toronto Stock Exchange on the day preceding the award. DSUs generally vest evenly over four years. Additional DSUs are credited to the account of participants equal in amount to the dividends paid on common shares of the Bank and vest evenly over the same period as the reference DSUs. DSUs may only be cashed when participants retire or leave the Bank, or for directors, when their term ends. The DSU Plan contains provisions for retiring employees that allow the participant’s units to continue vesting in accordance with the stated terms of the grant agreement. During the year ended October 31, 2014, the Bank awarded 90,402 DSUs at a weighted average price of $44.96 (90,722 DSUs at a weighted average price of $38.36 for the year ended October 31, 2013). A total of 699,906 DSUs were outstanding as at October 31, 2014 (738,770 DSUs as at October 31, 2013). A compensation expense of $11 million was recognized for the year ended October 31, 2014 with respect to these plans ($11 million for the year ended October 31, 2013).

AUDITED CONSOLIDATED FINANCIAL STATEMENTS NOTES TO THE AUDITED CONSOLIDATED FINANCIAL STATEMENTS (millions of Canadian dollars)
174 National Bank of Canada 2014 Annual Report
NOTE 22 – SHARE-BASED PAYMENTS (cont.) Restricted Stock Unit (RSU) Plan The RSU Plan is for certain officers and other designated persons of the Bank and its subsidiaries. The objective of this plan is to ensure that the compensation of certain officers is competitive and to foster retention. An RSU is a right that has a value equal to the closing price of a common share of the Bank on the Toronto Stock Exchange on the day preceding the award. RSUs generally vest evenly over three years, although some RSUs vest on the last day of the 35th month following the date of the award, the date on which all RSUs expire. Additional RSUs are credited to the account of participants equal in amount to the dividends declared on the common shares of the Bank and vest evenly over the same period as the reference RSUs. The RSU Plan contains provisions for retiring employees that allow the participant’s units to continue vesting in accordance with the stated terms of the grant agreement. During the year ended October 31, 2014, the Bank awarded 1,704,530 RSUs at a weighted average price of $44.96 (2,082,580 RSUs at a weighted average price of $38.36 for the year ended October 31, 2013). As at October 31, 2014, a total of 4,807,225 RSUs were outstanding (4,990,348 RSUs as at October 31, 2013). A compensation expense of $120 million was recognized for the year ended October 31, 2014 with respect to this plan ($129 million for the year ended October 31, 2013). Performance Stock Unit (PSU) PlanThe PSU Plan is for certain members of senior management of the Bank. The objective of this plan is to tie a portion of the value of the compensation of these members of senior management to the future value of the Bank’s common shares. A PSU is a right that has a value equal to the closing price of a common share of the Bank on the Toronto Stock Exchange on the day preceding the award, adjusted upward or downward according to performance criteria, which is based on the total shareholder return (TSR) achieved by the Bank compared to that of the S&P/TSX Banks Sub-index. PSUs vest on the last day of the 35th month following the date of the award, the date on which all PSUs expire. Additional PSUs are credited to the account of participants in an amount equal to the dividends declared on the common shares of the Bank and vest evenly over the same period as the reference PSUs. The PSU Plan contains provisions for retiring employees that allow the participant’s units to continue vesting in accordance with the stated terms of the award agreement. During the year ended October 31, 2014, the Bank awarded 181,348 PSUs at a weighted average price of $44.96 (237,736 PSUs at a weighted average price of $38.36 for the year ended October 31, 2013). As at October 31, 2014, a total of 707,126 PSUs were outstanding (614,738 PSUs as at October 31, 2013). A compensation expense of $15 million was recognized for the year ended October 31, 2014 with respect to this plan ($11 million for the year ended October 31, 2013). Deferred Compensation Plan of National Bank Financial (NBF) This plan is exclusively for key employees of Individual Investor Services of NBF. The purpose of this plan is to foster the retention of key employees and promote the growth in income and the continuous improvement in profitability at Individual Investor Services. Under this plan, participants can defer a portion of their annual compensation and NBF may pay a contribution to key employees when certain financial objectives are met. Amounts awarded by NBF and the compensation deferred by participants are invested in, among others, Bank share units. These share units represent a right, the value of which corresponds to the closing price of the Bank’s common share on the Toronto Stock Exchange on the award date. Additional units are paid to the participant’s account equal in amount to the dividends declared on the common shares of the Bank. Share units representing the amounts awarded by NBF vest evenly over four years. When a participant retires, or in certain cases when the participant’s employment is terminated, the participant receives a cash amount representing the value of the vested share units. During the year ended October 31, 2014, NBF awarded 157,842 share units at a weighted average price of $44.25 (65,870 share units at a weighted average price of $38.44 for the year ended October 31, 2013). As at October 31, 2014, 1,226,249 share units were outstanding (1,161,376 share units as at October 31, 2013). During the year ended October 31, 2014, a $12 million compensation expense was recognized for this plan ($12 million for the year ended October 31, 2013). Employee Share Ownership Plan Under the Bank’s Employee Share Ownership Plan, employees who meet the eligibility criteria can contribute up to 8% of their annual gross salary by way of payroll deductions. The Bank matches 25% of the employee contribution, to a maximum of $1,500 per annum. Bank contributions vest to the employee after one year of uninterrupted participation in the plan. Subsequent contributions vest immediately. The Bank’s contributions, amounting to $9 million for the year ended October 31, 2014 ($9 million for the year ended October 31, 2013), were charged to Compensation and employee benefits when paid. As at October 31, 2014, a total of 5,958,437 common shares were held for this plan (5,894,660 common shares as at October 31, 2013). Plan shares are purchased on the open market and are considered to be outstanding for earnings per share calculations. Dividends paid on the Bank’s common shares held for the Employee Share Ownership Plan are used to purchase other common shares on the open market. Total liabilities arising from the Bank’s share-based compensation plans amounted to $470 million as at October 31, 2014 ($353 million as at October 31, 2013). The intrinsic value of liabilities that had vested as at October 31, 2014 was $203 million ($170 million as at October 31, 2013).
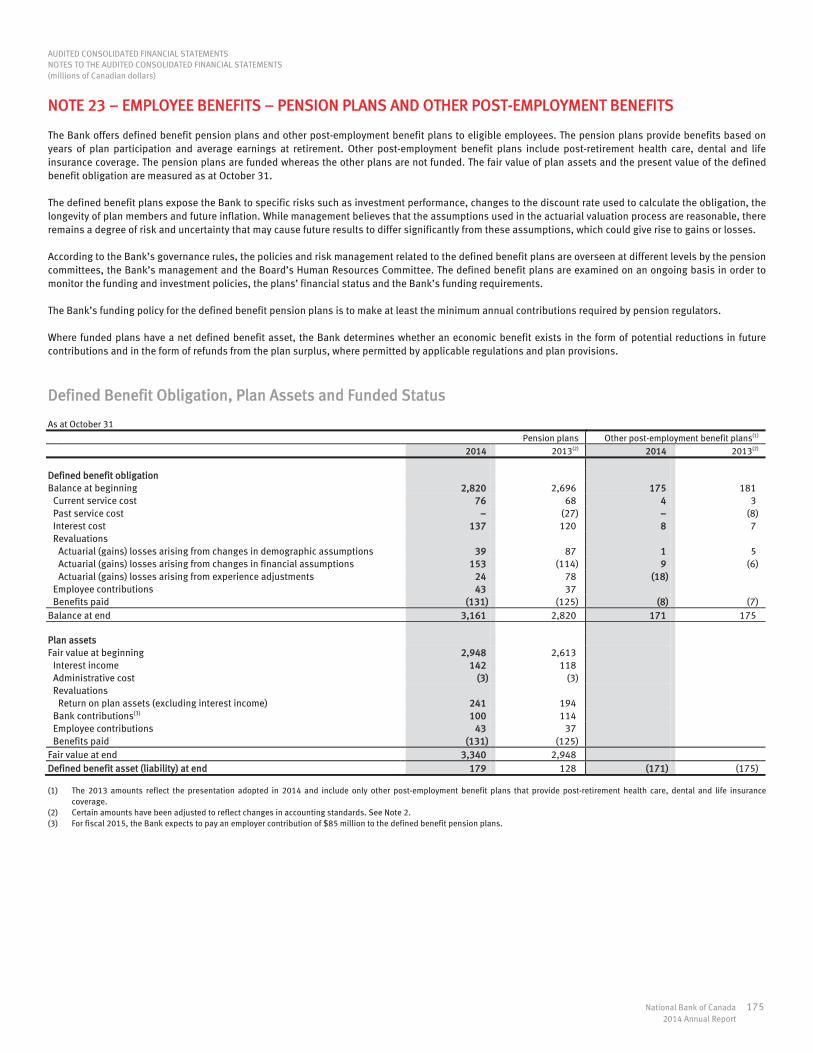
AUDITED CONSOLIDATED FINANCIAL STATEMENTS NOTES TO THE AUDITED CONSOLIDATED FINANCIAL STATEMENTS (millions of Canadian dollars)
National Bank of Canada 175 2014 Annual Report
NOTE 23 – EMPLOYEE BENEFITS – PENSION PLANS AND OTHER POST-EMPLOYMENT BENEFITS The Bank offers defined benefit pension plans and other post-employment benefit plans to eligible employees. The pension plans provide benefits based on years of plan participation and average earnings at retirement. Other post-employment benefit plans include post-retirement health care, dental and life insurance coverage. The pension plans are funded whereas the other plans are not funded. The fair value of plan assets and the present value of the defined benefit obligation are measured as at October 31. The defined benefit plans expose the Bank to specific risks such as investment performance, changes to the discount rate used to calculate the obligation, the longevity of plan members and future inflation. While management believes that the assumptions used in the actuarial valuation process are reasonable, there remains a degree of risk and uncertainty that may cause future results to differ significantly from these assumptions, which could give rise to gains or losses. According to the Bank’s governance rules, the policies and risk management related to the defined benefit plans are overseen at different levels by the pension committees, the Bank’s management and the Board’s Human Resources Committee. The defined benefit plans are examined on an ongoing basis in order to monitor the funding and investment policies, the plans’ financial status and the Bank’s funding requirements. The Bank’s funding policy for the defined benefit pension plans is to make at least the minimum annual contributions required by pension regulators. Where funded plans have a net defined benefit asset, the Bank determines whether an economic benefit exists in the form of potential reductions in future contributions and in the form of refunds from the plan surplus, where permitted by applicable regulations and plan provisions.
Defined Benefit Obligation, Plan Assets and Funded Status As at October 31
Pension plans Other post-employment benefit plans(1) 2014 2013(2) 2014 2013(2)
Defined benefit obligation Balance at beginning 2,820 2,696 175 181 Current service cost 76 68 4 3 Past service cost (27) (8) Interest cost 137 120 8 7 Revaluations Actuarial (gains) losses arising from changes in demographic assumptions 39 87 1 5 Actuarial (gains) losses arising from changes in financial assumptions 153 (114) 9 (6) Actuarial (gains) losses arising from experience adjustments 24 78 (18) Employee contributions 43 37 Benefits paid (131) (125) (8) (7) Balance at end 3,161 2,820 171 175 Plan assets Fair value at beginning 2,948 2,613 Interest income 142 118 Administrative cost (3) (3) Revaluations Return on plan assets (excluding interest income) 241 194 Bank contributions(3) 100 114 Employee contributions 43 37 Benefits paid (131) (125) Fair value at end 3,340 2,948 Defined benefit asset (liability) at end 179 128 (171) (175)
(1) The 2013 amounts reflect the presentation adopted in 2014 and include only other post-employment benefit plans that provide post-retirement health care, dental and life insurance coverage.
(2) Certain amounts have been adjusted to reflect changes in accounting standards. See Note 2. (3) For fiscal 2015, the Bank expects to pay an employer contribution of $85 million to the defined benefit pension plans.

AUDITED CONSOLIDATED FINANCIAL STATEMENTS NOTES TO THE AUDITED CONSOLIDATED FINANCIAL STATEMENTS (millions of Canadian dollars)
176 National Bank of Canada 2014 Annual Report
NOTE 23 – EMPLOYEE BENEFITS – PENSION PLANS AND OTHER POST-EMPLOYMENT BENEFITS (cont.)
Defined Benefit Asset (Liability) As at October 31
Pension plans Other post-employment benefit plans(1) 2014 2013(2) 2014 2013(2)
Defined benefit asset included in Other assets 185 131 Defined benefit liability included in Other liabilities (6) (3) (171) (175) 179 128 (171) (175)
(1) The 2013 amounts reflect the presentation adopted in 2014 and include only other post-employment benefit plans that provide post-retirement health care, dental and life insurance coverage.
(2) Certain amounts have been adjusted to reflect changes in accounting standards. See Note 2.
Expense for Pension Plans and Other Post-Employment Benefits Year ended October 31
Pension plans Other post-employment benefit plans(1)
2014 2013(2) 2014 2013(2)
Current service cost 76 68 4 3 Past service cost (27) (8) Interest expense (income), net (5) 2 8 7 Administrative expenses 3 3 Expense recognized in Net income 74 46 12 2 Revaluations Actuarial (gains) losses on defined benefit obligation 216 51 (8) (1) Return on plan assets (excluding interest income) (241) (194) Revaluations recognized in Other comprehensive income (25) (143) (8) (1) 49 (97) 4 1
(1) The 2013 amounts reflect the presentation adopted in 2014 and include only other post-employment benefit plans that provide post-retirement health care, dental and life insurance coverage.
(2) Certain amounts have been adjusted to reflect changes in accounting standards. See Note 2.

AUDITED CONSOLIDATED FINANCIAL STATEMENTS NOTES TO THE AUDITED CONSOLIDATED FINANCIAL STATEMENTS (millions of Canadian dollars)
National Bank of Canada 177 2014 Annual Report
Allocation of the Fair Value of Pension Plan Assets
As at October 31 2014 2013
Quoted in an active
market(1)
Not quoted in an active
market Total
Quoted in an active
market(1)
Not quoted in an active
market Total
Asset classes Cash and cash equivalents 23 23 90 90 Equity securities 1,386 1,386 1,522 1,522 Debt securities Government of Canada 309 309 270 270 Provinces, municipalities and other public administrations 984 984 543 543 Other issuers 308 308 219 219 Other 330 330 304 304 1,695 1,645 3,340 1,792 1,156 2,948
(1) Fair value based on inputs corresponding to unadjusted quoted prices in active markets for identical assets and liabilities that the Bank can access at the measurement date.
The Bank’s investment strategy for plan assets considers many factors, including the time horizon of pension plan obligations and investment risk. For each plan, an allocation range per asset class is defined using a mix of equity and debt securities to optimize the risk-return profile of plan assets and minimize asset/liability mismatching. The pension plan assets include investment securities issued by the Bank. As at October 31, 2014, these investments totalled $131 million ($176 million as at October 31, 2013). In fiscal 2014 and 2013, the Bank and its related entities received approximately $6 million in fees from the pension plans for related management, administration and custodial services.
Allocation of the Defined Benefit Obligation by the Status of Defined Benefit Plan Participants
As at October 31
Pension plans Other post-employment benefit plans 2014 2013 2014 2013
Active employees 45 % 47 % 37 % 43 % Retirees 51 % 50 % 63 % 57 % Participants with deferred vested benefits 4 % 3 % 100 % 100 % 100 % 100 % Weighted average duration of the defined benefit obligation (in years) 16 15 15 14

AUDITED CONSOLIDATED FINANCIAL STATEMENTS NOTES TO THE AUDITED CONSOLIDATED FINANCIAL STATEMENTS (millions of Canadian dollars)
178 National Bank of Canada 2014 Annual Report
NOTE 23 – EMPLOYEE BENEFITS – PENSION PLANS AND OTHER POST-EMPLOYMENT BENEFITS (cont.)
Significant Actuarial Assumptions (Weighted Average)
The discount rate assumption is based on an interest rate curve that represents the yields on corporate AA bonds. Short-term maturities are obtained using a curve based on actual data from corporate AA bonds. Long-term maturities are obtained using a curve based on extrapolated data, which is obtained by adding a yield spread, based on maturity, to the long-term provincial bond yields. The spread is established based on the differences observed between the yields on corporate AA bonds and provincial AA bonds in three maturity ranges of the yield curve. For measurement purposes, the estimated annual growth rate for health care costs was 6.07% for 2014 (5.75% for 2013). Based on the assumption retained, this rate is expected to decrease gradually to 2.97% in 2034 and remain steady thereafter. The mortality assumption is a determining factor when measuring the defined benefit obligation. Determining the expected benefit payout period is based on best estimate assumptions regarding mortality. Mortality tables are reviewed at least once a year, and the assumptions made are in accordance with accepted actuarial practice. New results regarding the plans are reviewed and used in calculating best estimates of future mortality. As at October 31
Pension plans Other post-employment benefit plans 2014 2013 2014 2013
Defined benefit obligation Discount rate 4.35 % 4.75 % 4.35 % 4.75 % Rate of compensation increase 3.00 % 3.00 % 3.00 % 3.00 % Health care cost trend rate n.a. n.a. 6.07 % 5.75 % Life expectancy (in years) at 65 for a participant currently at Age 65 Men 21.0 20.3 21.0 20.3 Women 23.4 22.6 23.4 22.6 Age 45 Men 22.1 22.1 22.1 22.1 Women 24.4 23.7 24.4 23.7
Year ended October 31
Pension plans Other post-employment benefit plans 2014 2013 2014 2013
Pension plan expense Discount rate 4.75 % 4.50 % 4.75 % 4.50 % Rate of compensation increase 3.00 % 3.00 % 3.00 % 3.00 % Health care cost trend rate n.a. n.a. 6.07 % 5.75 % Life expectancy (in years) at 65 for a participant currently at Age 65 Men 20.3 19.3 20.3 19.3 Women 22.6 21.6 22.6 21.6 Age 45 Men 22.1 20.8 22.1 20.8 Women 23.7 22.4 23.7 22.4
n.a. Not applicable

AUDITED CONSOLIDATED FINANCIAL STATEMENTS NOTES TO THE AUDITED CONSOLIDATED FINANCIAL STATEMENTS (millions of Canadian dollars)
National Bank of Canada 179 2014 Annual Report
Sensitivity of Significant Assumptions for 2014
The following table shows the potential impacts of changes to key assumptions on the defined benefit obligation of the pension plans and other post-employment benefit plans as at October 31, 2014. These impacts are hypothetical and should be interpreted with caution as changes in each significant assumption may not be linear.
Pension plans Other post-employment
benefit plans
Change in the obligation Change in the obligation Impact of a 0.25% increase in the discount rate (124) (6) Impact of a 0.25% decrease in the discount rate 126 6 Impact of a 0.25% increase in the rate of compensation increase 25 1 Impact of a 0.25% decrease in the rate of compensation increase (25) (1) Impact of a 1.00% increase in the health care cost trend rate n.a. 9 Impact of a 1.00% decrease in the health care cost trend rate n.a. (8) Impact of an increase in the age of participants by one year (67) (2) Impact of a decrease in the age of participants by one year 65 2
n.a. Not applicable
Projected Benefit Payments Year ended October 31
Pension plans Other post-employment
benefit plans
2015 122 8 2016 125 8 2017 127 8 2018 128 9 2019 128 9 2020 to 2024 736 57
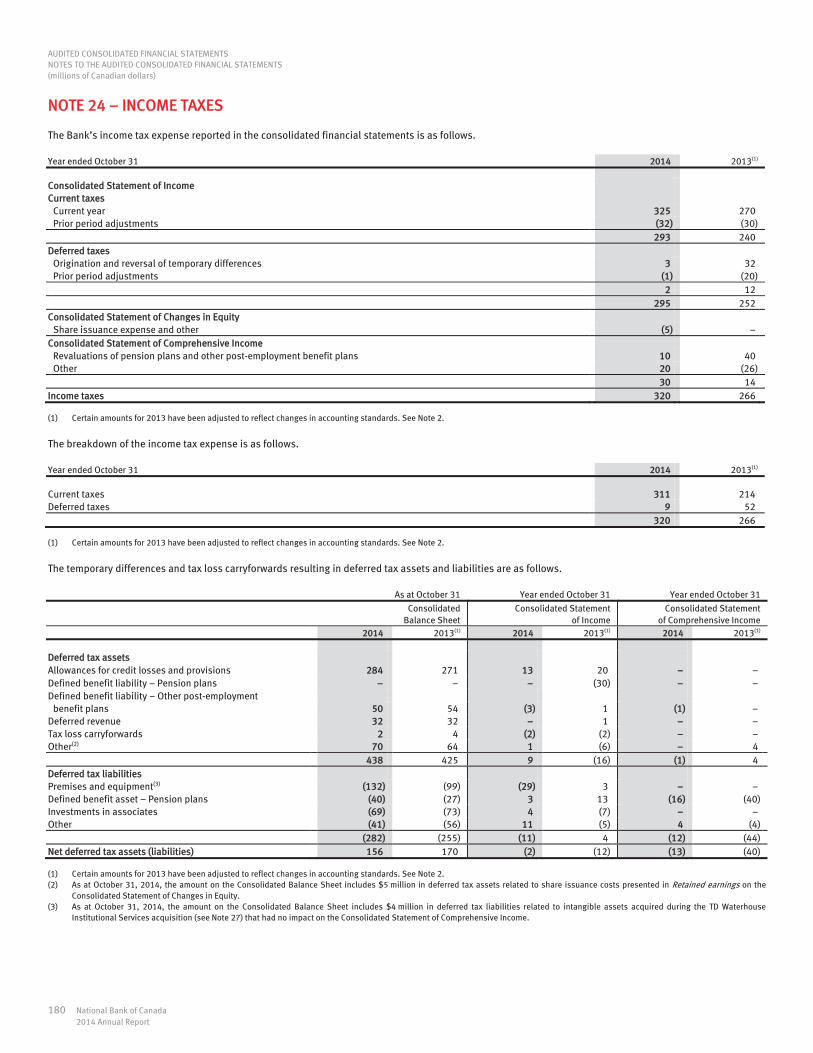
AUDITED CONSOLIDATED FINANCIAL STATEMENTS NOTES TO THE AUDITED CONSOLIDATED FINANCIAL STATEMENTS (millions of Canadian dollars)
180 National Bank of Canada 2014 Annual Report
NOTE 24 – INCOME TAXES The Bank’s income tax expense reported in the consolidated financial statements is as follows. Year ended October 31 2014 2013(1)
Consolidated Statement of Income Current taxes Current year 325 270 Prior period adjustments (32) (30) 293 240 Deferred taxes Origination and reversal of temporary differences 3 32 Prior period adjustments (1) (20) 2 12 295 252 Consolidated Statement of Changes in Equity Share issuance expense and other (5) Consolidated Statement of Comprehensive Income Revaluations of pension plans and other post-employment benefit plans 10 40 Other 20 (26) 30 14 Income taxes 320 266
(1) Certain amounts for 2013 have been adjusted to reflect changes in accounting standards. See Note 2.
The breakdown of the income tax expense is as follows. Year ended October 31 2014 2013(1)
Current taxes 311 214 Deferred taxes 9 52 320 266
(1) Certain amounts for 2013 have been adjusted to reflect changes in accounting standards. See Note 2.
The temporary differences and tax loss carryforwards resulting in deferred tax assets and liabilities are as follows. As at October 31 Year ended October 31 Year ended October 31
Consolidated Balance Sheet
Consolidated Statement
of Income Consolidated Statement
of Comprehensive Income
2014 2013(1) 2014 2013(1) 2014 2013(1)
Deferred tax assets Allowances for credit losses and provisions 284 271 13 20 Defined benefit liability – Pension plans (30) Defined benefit liability – Other post-employment benefit plans 50 54 (3) 1 (1) Deferred revenue 32 32 1 Tax loss carryforwards 2 4 (2) (2) Other(2) 70 64 1 (6) 4 438 425 9 (16) (1) 4 Deferred tax liabilities Premises and equipment(3) (132) (99) (29) 3 Defined benefit asset – Pension plans (40) (27) 3 13 (16) (40) Investments in associates (69) (73) 4 (7) Other (41) (56) 11 (5) 4 (4) (282) (255) (11) 4 (12) (44) Net deferred tax assets (liabilities) 156 170 (2) (12) (13) (40)
(1) Certain amounts for 2013 have been adjusted to reflect changes in accounting standards. See Note 2. (2) As at October 31, 2014, the amount on the Consolidated Balance Sheet includes $5 million in deferred tax assets related to share issuance costs presented in Retained earnings on the
Consolidated Statement of Changes in Equity. (3) As at October 31, 2014, the amount on the Consolidated Balance Sheet includes $4 million in deferred tax liabilities related to intangible assets acquired during the TD Waterhouse
Institutional Services acquisition (see Note 27) that had no impact on the Consolidated Statement of Comprehensive Income.

AUDITED CONSOLIDATED FINANCIAL STATEMENTS NOTES TO THE AUDITED CONSOLIDATED FINANCIAL STATEMENTS (millions of Canadian dollars)
National Bank of Canada 181 2014 Annual Report
Net deferred tax assets are included in Other assets and net deferred tax liabilities are included in Other liabilities. As at October 31 2014 2013(1)
Deferred tax assets 264 289 Deferred tax liabilities (108) (119) 156 170
(1) Certain amounts for 2013 have been adjusted to reflect changes in accounting standards. See Note 2.
As at October 31, 2014, the total amount of temporary differences, unused tax loss carryforwards and unused tax credits for which no deferred tax asset has been recognized was $113 million ($91 million as at October 31, 2013). As at October 31, 2014, the total amount of temporary differences related to investments in subsidiaries, associates, and joint ventures for which no deferred tax liability has been recognized was $557 million ($463 million as at October 31, 2013). The following table provides a reconciliation of the Bank’s income tax rate. Year ended October 31 2014 2013(1)
$ % $ %
Income before income taxes 1,833 100.0 1,764 100.0 Income taxes at Canadian statutory income tax rate 495 27.0 473 26.8 Reduction in income tax rate due to Tax-exempt income from securities, mainly dividends from Canadian corporations (163) (8.9) (150) (8.5) Tax rates of subsidiaries, foreign entities and associates (3) (0.2) (3) (0.2) Tax benefit from loss carrybacks to prior periods (10) (0.6) Reversal of provisions for income tax contingencies, net (37) (2.0) Other items (34) (1.9) (21) (1.2) (200) (11.0) (221) (12.5) Income taxes reported in the Consolidated Statement of Income and effective income tax rate 295 16.0 252 14.3
(1) Certain amounts for 2013 have been adjusted to reflect changes in accounting standards. See Note 2.
NOTE 25 – EARNINGS PER SHARE(1) Diluted earnings per share is calculated by dividing net income attributable to common shareholders by the weighted average number of common shares outstanding after taking into account the dilution effect of stock options using the treasury stock method. Year ended October 31 2014 2013(2)
Basic earnings per share Net income attributable to the Bank’s shareholders 1,469 1,449 Dividends on preferred shares 40 40 Net income attributable to common shareholders 1,429 1,409 Weighted average basic number of common shares outstanding (thousands) 327,463 324,468 Basic earnings per share (dollars) 4.36 4.34 Diluted earnings per share Net income attributable to common shareholders 1,429 1,409 Weighted average basic number of common shares outstanding (thousands) 327,463 324,468 Adjustment to average number of common shares (thousands) Stock options(3) 3,623 2,580 Weighted average diluted number of common shares outstanding (thousands) 331,086 327,048 Diluted earnings per share (dollars) 4.32 4.31
(1) The weighted average basic number of common shares outstanding, the weighted average diluted number of common shares outstanding, basic earnings per share and diluted earnings per share have been adjusted retrospectively to reflect the stock dividend paid on February 13, 2014. See Note 18.
(2) Certain amounts have been adjusted to reflect changes in accounting standards. See Note 2. (3) For the years ended October 31, 2014 and 2013, as the exercise price of the options was less than the average price of the Bank’s common shares, no option was excluded from the diluted
earnings per share calculation.
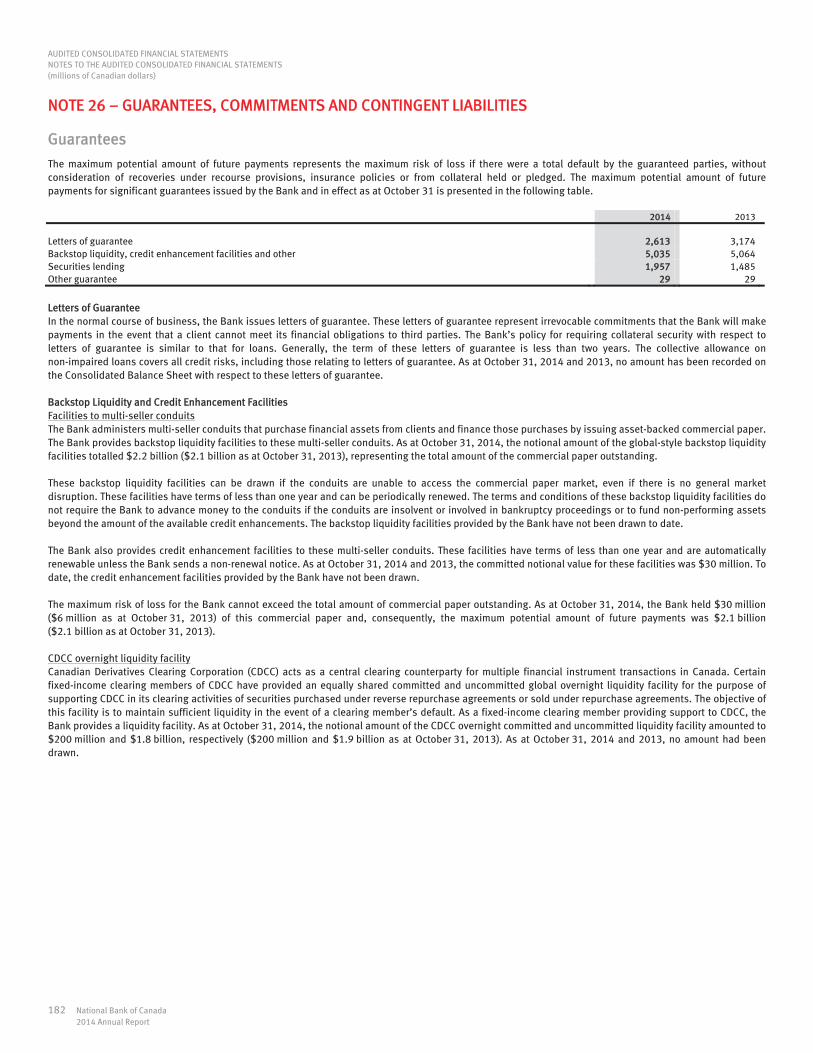
AUDITED CONSOLIDATED FINANCIAL STATEMENTS NOTES TO THE AUDITED CONSOLIDATED FINANCIAL STATEMENTS (millions of Canadian dollars)
182 National Bank of Canada 2014 Annual Report
NOTE 26 – GUARANTEES, COMMITMENTS AND CONTINGENT LIABILITIES
Guarantees
The maximum potential amount of future payments represents the maximum risk of loss if there were a total default by the guaranteed parties, without consideration of recoveries under recourse provisions, insurance policies or from collateral held or pledged. The maximum potential amount of future payments for significant guarantees issued by the Bank and in effect as at October 31 is presented in the following table. 2014 2013
Letters of guarantee 2,613 3,174 Backstop liquidity, credit enhancement facilities and other 5,035 5,064 Securities lending 1,957 1,485 Other guarantee 29 29
Letters of Guarantee In the normal course of business, the Bank issues letters of guarantee. These letters of guarantee represent irrevocable commitments that the Bank will make payments in the event that a client cannot meet its financial obligations to third parties. The Bank’s policy for requiring collateral security with respect to letters of guarantee is similar to that for loans. Generally, the term of these letters of guarantee is less than two years. The collective allowance on non-impaired loans covers all credit risks, including those relating to letters of guarantee. As at October 31, 2014 and 2013, no amount has been recorded on the Consolidated Balance Sheet with respect to these letters of guarantee. Backstop Liquidity and Credit Enhancement Facilities Facilities to multi-seller conduits The Bank administers multi-seller conduits that purchase financial assets from clients and finance those purchases by issuing asset-backed commercial paper. The Bank provides backstop liquidity facilities to these multi-seller conduits. As at October 31, 2014, the notional amount of the global-style backstop liquidity facilities totalled $2.2 billion ($2.1 billion as at October 31, 2013), representing the total amount of the commercial paper outstanding. These backstop liquidity facilities can be drawn if the conduits are unable to access the commercial paper market, even if there is no general market disruption. These facilities have terms of less than one year and can be periodically renewed. The terms and conditions of these backstop liquidity facilities do not require the Bank to advance money to the conduits if the conduits are insolvent or involved in bankruptcy proceedings or to fund non-performing assets beyond the amount of the available credit enhancements. The backstop liquidity facilities provided by the Bank have not been drawn to date. The Bank also provides credit enhancement facilities to these multi-seller conduits. These facilities have terms of less than one year and are automatically renewable unless the Bank sends a non-renewal notice. As at October 31, 2014 and 2013, the committed notional value for these facilities was $30 million. To date, the credit enhancement facilities provided by the Bank have not been drawn. The maximum risk of loss for the Bank cannot exceed the total amount of commercial paper outstanding. As at October 31, 2014, the Bank held $30 million ($6 million as at October 31, 2013) of this commercial paper and, consequently, the maximum potential amount of future payments was $2.1 billion ($2.1 billion as at October 31, 2013). CDCC overnight liquidity facility Canadian Derivatives Clearing Corporation (CDCC) acts as a central clearing counterparty for multiple financial instrument transactions in Canada. Certain fixed-income clearing members of CDCC have provided an equally shared committed and uncommitted global overnight liquidity facility for the purpose of supporting CDCC in its clearing activities of securities purchased under reverse repurchase agreements or sold under repurchase agreements. The objective of this facility is to maintain sufficient liquidity in the event of a clearing member’s default. As a fixed-income clearing member providing support to CDCC, the Bank provides a liquidity facility. As at October 31, 2014, the notional amount of the CDCC overnight committed and uncommitted liquidity facility amounted to $200 million and $1.8 billion, respectively ($200 million and $1.9 billion as at October 31, 2013). As at October 31, 2014 and 2013, no amount had been drawn.

AUDITED CONSOLIDATED FINANCIAL STATEMENTS NOTES TO THE AUDITED CONSOLIDATED FINANCIAL STATEMENTS (millions of Canadian dollars)
National Bank of Canada 183 2014 Annual Report
Securities Lending Under securities lending agreements the Bank has entered into with certain clients who have entrusted it with the safekeeping of their securities, the Bank lends the securities to third parties and indemnifies its clients in the event of loss. In order to protect itself against any contingent loss, the Bank obtains, as security from the borrower, a cash amount or extremely liquid marketable securities with a fair value greater than that of the securities loaned. No amount has been recognized on the Consolidated Balance Sheet with respect to potential indemnities resulting from securities lending agreements. Other Guarantee Pursuant to a mutual guarantee agreement required by a regulatory authority, a subsidiary of the Bank has agreed to guarantee all commitments, debts and liabilities of an associate to the maximum of its regulatory capital. This guarantee expires no later than the date the investment in the associate is sold, or sooner if deemed appropriate by the regulatory authority. As at October 31, 2014 and 2013, this guarantee remains undrawn and no amount has been recognized on the Consolidated Balance Sheet with respect to this agreement. Other Indemnification Agreements In the normal course of business, including securitization transactions and discontinuances of businesses and operations, the Bank enters into numerous contractual agreements under which it undertakes to compensate the counterparty for costs incurred as a result of litigation, changes in laws and regulations (including tax legislation), claims with respect to past performance, incorrect representations or the non-performance of certain restrictive covenants. The Bank also undertakes to indemnify any person acting as a director or officer or performing a similar function within the Bank or one of its subsidiaries or another entity, at the request of the Bank, for all expenses incurred by that person in proceedings or investigations to which he or she is party in that capacity. Moreover, as a member of a securities transfer network and pursuant to the membership agreement and the regulations governing the operation of the network, the Bank granted a movable hypothec to the network that can be used in the event another member fails to meet its contractual obligations. The durations of the indemnification agreements vary according to circumstance; as at October 31, 2014 and 2013, given the nature of the agreements, the Bank is unable to make a reasonable estimate of the maximum potential liability it could be required to pay to counterparties. No amount has been recorded on the Consolidated Balance Sheet with respect to these agreements. Master Asset Vehicles Margin funding facility The Bank has committed to contribute $831 million ($886 million as at October 31, 2013) to a margin funding facility related to the MAV conduits in order to finance potential collateral calls. As at October 31, 2014 and 2013, no amount had been advanced by the Bank. For additional information, see Note 6.
Commitments
Credit InstrumentsIn the normal course of business, the Bank enters into various off-balance-sheet commitments. The credit instruments used to meet the financing needs of its clients represent the maximum amount of additional credit the Bank could be obligated to extend if the commitments were fully drawn. As at October 31 2014 2013
Letters of guarantee(1) 2,613 3,174 Documentary letters of credit(2) 76 69 Credit card receivables(3) 6,442 6,332 Commitments to extend credit(3) 41,139 38,244
(1) See Letters of guarantee on page 182. (2) Documentary letters of credit are documents issued by the Bank and used in international trade to enable a third party to draw drafts on the Bank up to an amount established under specific
terms and conditions; these instruments are collateralized by the delivery of the goods to which they are related. (3) Credit card receivables and commitments to extend credit represent the undrawn portions of credit authorizations granted in the form of loans, acceptances, letters of guarantee and
documentary letters of credit. The Bank is required at all times to make the undrawn portion of the credit authorization available, subject to certain conditions.
Financial Assets Received as Collateral As at October 31, 2014, the fair value of financial assets received as collateral that the Bank was authorized to sell or repledge totalled $61 billion ($48 billion as at October 31, 2013). These financial assets received as collateral were obtained as a result of transactions involving securities purchased under reverse repurchase agreements, securities borrowing and lending agreements, and derivative financial instrument transactions. These transactions are concluded in accordance with standard terms and conditions for such transactions.

AUDITED CONSOLIDATED FINANCIAL STATEMENTS NOTES TO THE AUDITED CONSOLIDATED FINANCIAL STATEMENTS (millions of Canadian dollars)
184 National Bank of Canada 2014 Annual Report
NOTE 26 – GUARANTEES, COMMITMENTS AND CONTINGENT LIABILITIES (cont.) Other Commitments The Bank acts as an investor in investment banking activities where it enters into agreements to finance external private equity funds and investments in equity and debt securities at market value at the time the agreements are signed. In connection with these activities, the Bank has commitments to invest up to $67 million as at October 31, 2014 ($106 million as at October 31, 2013). Pledged Assets In the normal course of business, the Bank pledges securities and other assets as collateral. A breakdown of encumbered assets pledged as collateral is provided in the following table. These transactions are concluded in accordance with standard terms and conditions for such transactions. As at October 31 2014 2013
Assets pledged to Bank of Canada 25 25 Direct clearing organizations(1) 1,363 946 Assets pledged in relation to Derivative financial instrument transactions 1,350 936 Borrowing, securities lending and securities sold under repurchase agreements 31,702 31,365 Securitization transactions 20,134 18,404 Covered bonds(2) 5,498 3,347 Other 107 119 Total 60,179 55,142
(1) Includes assets pledged as collateral for Large Value Transfer System (LVTS) activities. (2) The Bank established two covered bond programs. For additional information, see Notes 13 and 28.
Contingent Liabilities
Litigation In the normal course of business, the Bank and its subsidiaries are involved in various claims relating, among other matters, to loan portfolios, investment portfolios and supplier agreements, including court proceedings, investigations or claims of a regulatory nature, class actions or other legal remedies of varied natures. Several of the court proceedings are related to lending activities, which generally occur, in particular, when the Bank takes steps to recover its claims. More specifically, the Bank is involved as a defendant in class actions instituted by consumers who contest, inter alia, certain transaction fees or who wish to avail themselves of certain legislative provisions relating to consumer protection. On September 19, 2014, the Supreme Court of Canada issued a decision on Marcotte v. Bank of Montreal, et al., a class action seeking reimbursement of foreign currency transaction fees paid by credit cardholders from 2002 to 2008. The decision has granted a reimbursement of the fees collected by the Bank between April 17, 2000 and December 31, 2002 in addition to payment of $25.00 in punitive damages to each member, all amounts grossed-up by interest. It is impossible to determine the outcome of the claims instituted or which may be instituted against the Bank and its subsidiaries. The Bank estimates, based on the information at its disposal, that while the amount of contingent liabilities pertaining to these claims, taken individually or in the aggregate, could have a material impact on the Bank’s consolidated operating income for a particular period, it would not have a material adverse impact on the Bank’s consolidated financial position.
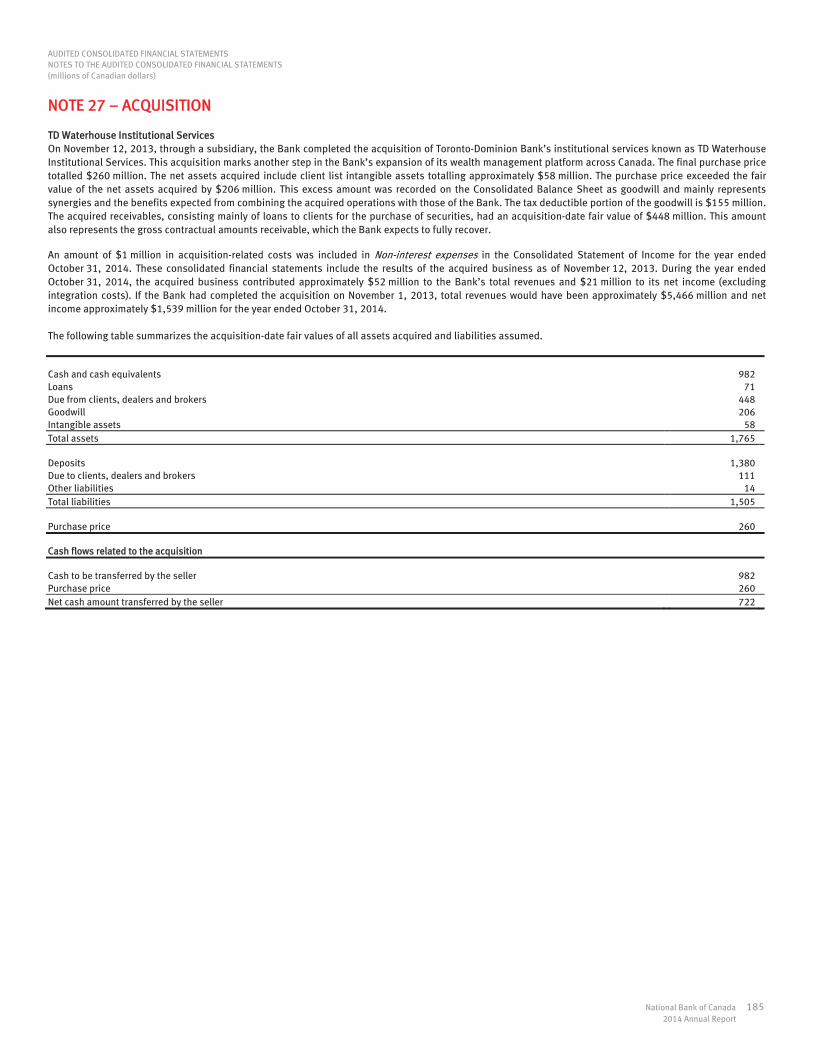
AUDITED CONSOLIDATED FINANCIAL STATEMENTS NOTES TO THE AUDITED CONSOLIDATED FINANCIAL STATEMENTS (millions of Canadian dollars)
National Bank of Canada 185 2014 Annual Report
NOTE 27 – ACQUISITION TD Waterhouse Institutional Services On November 12, 2013, through a subsidiary, the Bank completed the acquisition of Toronto-Dominion Bank’s institutional services known as TD Waterhouse Institutional Services. This acquisition marks another step in the Bank’s expansion of its wealth management platform across Canada. The final purchase price totalled $260 million. The net assets acquired include client list intangible assets totalling approximately $58 million. The purchase price exceeded the fair value of the net assets acquired by $206 million. This excess amount was recorded on the Consolidated Balance Sheet as goodwill and mainly represents synergies and the benefits expected from combining the acquired operations with those of the Bank. The tax deductible portion of the goodwill is $155 million. The acquired receivables, consisting mainly of loans to clients for the purchase of securities, had an acquisition-date fair value of $448 million. This amount also represents the gross contractual amounts receivable, which the Bank expects to fully recover. An amount of $1 million in acquisition-related costs was included in Non-interest expenses in the Consolidated Statement of Income for the year ended October 31, 2014. These consolidated financial statements include the results of the acquired business as of November 12, 2013. During the year ended October 31, 2014, the acquired business contributed approximately $52 million to the Bank’s total revenues and $21 million to its net income (excluding integration costs). If the Bank had completed the acquisition on November 1, 2013, total revenues would have been approximately $5,466 million and net income approximately $1,539 million for the year ended October 31, 2014. The following table summarizes the acquisition-date fair values of all assets acquired and liabilities assumed. Cash and cash equivalents 982 Loans 71 Due from clients, dealers and brokers 448 Goodwill 206 Intangible assets 58 Total assets 1,765 Deposits 1,380 Due to clients, dealers and brokers 111 Other liabilities 14 Total liabilities 1,505 Purchase price 260
Cash flows related to the acquisition
Cash to be transferred by the seller 982 Purchase price 260 Net cash amount transferred by the seller 722

AUDITED CONSOLIDATED FINANCIAL STATEMENTS NOTES TO THE AUDITED CONSOLIDATED FINANCIAL STATEMENTS (millions of Canadian dollars)
186 National Bank of Canada 2014 Annual Report
NOTE 28 – STRUCTURED ENTITIES A structured entity is an entity created to accomplish a narrow and well-defined objective and is designed so that voting or similar rights are not the dominant factor in deciding who controls the entity, such as when any voting rights relate solely to administrative tasks and the relevant activities are directed by means of contractual arrangements. Structured entities are assessed for consolidation in accordance with the accounting treatment described in Note 1. The Bank’s maximum exposure to loss resulting from its interests in these structured entities consists primarily of the investments in these entities, the fair value of the derivative contracts entered into with them, and the backstop liquidity and credit enhancement facilities granted to certain structured entities. Non-Consolidated Structured Entities Multi-seller conduits The Bank administers multi-seller conduits that purchase financial assets from clients and finance those purchases by issuing commercial paper backed by the assets acquired. Clients use these multi-seller conduits to diversify their funding sources and reduce borrowing costs, while continuing to manage the financial assets and providing some amount of first-loss protection. Notes issued by the conduits and held by third parties provide additional credit loss protection. The Bank acts as a financial agent and provides these conduits with administrative and transaction structuring services as well as backstop liquidity and credit enhancement facilities under the commercial paper program. These facilities are presented and described in Note 26. The Bank has concluded derivative contracts with these conduits, the fair value of which is presented on the Bank’s Consolidated Balance Sheet. Although the Bank has the ability to direct the relevant activities of these conduits, it cannot use its power to affect the amount of the returns it obtains, as it acts as an agent. Consequently, the Bank does not control these conduits and does not consolidate them. National Bank Hedge Fund Managed Accounts (Innocap Platform) Innocap Investment Management Inc. (Innocap), a company under joint control, offers hedge fund account programs for fund sponsors seeking a platform that gives them a high degree of transparency and leading-edge tools to manage liquidity and control assets and risk. The Bank can hold economic interests in certain hedge funds of the platform but does not consolidate those funds over which it does not have the ability to direct the relevant activities and in which it cannot exercise its power to affect the amount of returns it obtains. Master Asset Vehicles (MAV) The MAVs are structured entities created for the purpose of grouping the restructured notes stemming from asset-backed commercial paper held by Canadian corporate investors. For additional information, see Note 6. The Bank holds economic interests in MAVs in the form of restructured notes and the margin funding facility. The Bank does not have the ability to direct the relevant activities of the MAVs. Consequently, it does not control these MAVs and does not consolidate them. Investment funds The Bank enters into derivative or other financial instrument contracts with third parties to provide them with the desired exposure to certain investment funds. The Bank economically hedges the risks related to these derivatives by investing in those investment funds. The Bank can also hold economic interests in certain investment funds as part of its investing activities. The Bank does not consolidate those funds over which it does not have the ability to direct the relevant activities and in which it cannot exercise its power to affect the amount of returns it obtains. Private investments As part of its investment banking operations, the Bank invests in several limited liability partnerships and other incorporated entities. These investment companies in turn invest in operating companies with a view to reselling these investments at a profit over the medium or long term. The Bank does not intervene in the operations of these entities; its only role is that of an investor. Consequently, it does not control these companies and does not consolidate them. NBC Capital Trust The Bank created NBC Capital Trust (the Trust) for its funding and capital management needs. The securities issued by this trust constitute innovative capital instruments and are eligible as additional Tier 1 capital, but because these instruments do not satisfy the non-viability contingent capital requirements, they are to be phased out at a rate of 10% per year between 2013 and 2022. The gross proceeds from the securities issued by this trust were used to acquire a deposit note from the Bank. For additional information, see Note 13. The Bank also holds all of the trust’s equity and has committed to lend it the liquidity required in the normal course of business. Although the Bank has the ability to direct the relevant activities of the Trust, it is not exposed to or have the rights to variable returns since the Trust’s primary asset is a deposit note issued by the Bank. Consequently, the Bank does not control the Trust and does not consolidate it.

AUDITED CONSOLIDATED FINANCIAL STATEMENTS NOTES TO THE AUDITED CONSOLIDATED FINANCIAL STATEMENTS (millions of Canadian dollars)
National Bank of Canada 187 2014 Annual Report
The following table presents the carrying amounts of the assets and liabilities relating to the Bank’s interests in non-consolidated structured entities, the Bank’s maximum exposure to loss from these interests, as well as the total assets of these structured entities. The structured entity Canada Housing Trust is not presented. For additional information, see Note 8. As at October 31, 2014
Multi-seller
conduits(1) Innocap
platform(2) Master asset
vehicles(3) Investment
funds(4) Private
investments(5) NBC Capital
Trust(6)
Assets on the Consolidated Balance Sheet Securities at fair value through profit or loss 30 1,166 946 Available-for-sale securities 75 46 87 Derivative financial instruments 4 34 1,241 992 87 As at October 31, 2013(7) 6 32 1,361 1,234 70 Liabilities on the Consolidated Balance Sheet Deposits – Business and government 225 Other liabilities 4 229 As at October 31, 2013(7) 229 Maximum exposure to loss Securities and derivative financial instruments 34 1,241 992 87 Liquidity and credit enhancement facilities 2,130 Margin funding facility 831 2,164 2,072 992 87 As at October 31, 2013(7) 2,104 32 2,247 1,234 70 Total assets of the structured entity 2,174 14 6,029 3,218 241 As at October 31, 2013(7) 2,110 290 4,459 2,724 246
(1) The main underlying assets, located in Canada, are residential mortgages, automobile loans, automobile inventory financings, and other receivables. As at October 31, 2014, the notional committed amount of the global-style liquidity facilities totalled $2.2 billion ($2.1 billion as at October 31, 2013), representing the total amount of commercial paper outstanding. The Bank also provides series-wide credit enhancement facilities for a notional committed amount of $30 million ($30 million as at October 31, 2013). The maximum exposure to loss cannot exceed the amount of commercial paper outstanding. As at October 31, 2014, the Bank held $30 million in commercial paper ($6 million as at October 31, 2013) and, consequently, the maximum potential amount of future payments as at October 31, 2014 is limited to $2.1 billion ($2.1 billion as at October 31, 2013), which represents the undrawn liquidity and credit enhancement facilities.
(2) The underlying assets are various financial instruments (trading portfolio). The total assets of the Innocap platform are presented on a net asset basis. (3) See the Master Asset Vehicles section in Note 6. The total amount outstanding of restructured notes of the MAV conduits was $18 billion as at October 31, 2014 ($25 billion as at
October 31, 2013). The undrawn margin funding facility amounted to $831 million as at October 31, 2014 ($886 million as at October 31, 2013). (4) The underlying assets are various financial instruments and are presented on a net asset basis. Certain investment funds are in a trading portfolio. (5) The underlying assets are private investments. The amount of total assets of the structured entities corresponds to the amount for the most recent available period. (6) The underlying asset is a deposit note from the Bank. See Note 13. (7) Certain amounts have been adjusted to reflect changes in accounting standards. See Note 2.

AUDITED CONSOLIDATED FINANCIAL STATEMENTS NOTES TO THE AUDITED CONSOLIDATED FINANCIAL STATEMENTS (millions of Canadian dollars)
188 National Bank of Canada 2014 Annual Report
NOTE 28 – STRUCTURED ENTITIES (cont.)
Consolidated Structured Entities Securitization entity for the Bank’s credit card receivables The Bank established Canadian Credit Card Trust (CCCT) to securitize its credit card receivables on a revolving basis and uses the entity for capital management and funding purposes. The Bank provides first-loss protection against the losses since it retains the excess spread from the portfolio of sold receivables. The excess spread represents the residual net interest income after all the expenses related to this structure have been paid. The Bank also provides second-loss protection as it holds subordinated notes issued by CCCT. In addition, the Bank acts as an administrative agent and servicer and as such is responsible for the daily administration and management of CCCT’s credit card receivables. The Bank therefore has the ability to direct the relevant activities of CCCT and can exercise its power to affect the amount of returns it obtains. Consequently, the Bank controls CCCT and consolidates it. National Bank Hedge Fund Managed Accounts (Innocap Platform) The Bank can hold economic interests in certain hedge funds of the previously described platform and consolidates those of which it has the ability to direct the relevant activities and in which it can use its power to affect the amount of returns it obtains. Covered bond guarantors NBC Covered Bond Guarantor (Legislative) Limited Partnership In December 2013, the Bank established the covered bond legislative program, under which covered bonds are issued. It therefore created NBC Covered Bond Guarantor (Legislative) Limited Partnership (the Guarantor) to guarantee payment of the principal and interest owed to the bondholders. The Bank sold uninsured residential mortgages to the Guarantor and granted it loans to facilitate the acquisition of these assets. The Bank acts as manager of the partnership and has decision-making authority over its relevant activities, subject to the contractual terms governing the covered bond legislative program. In addition, the Bank is able, subject to the contractual terms governing the covered bond legislative program, to affect the variable returns of the partnership, which are directly related to the return on the mortgage loan portfolio and the interest on the loans from the Bank. Consequently, the Bank controls the partnership and consolidates it. NBC Covered Bond Guarantor Limited Partnership In January 2011, the Bank established the structured covered bond program under which covered bonds are issued. It therefore created NBC Covered Bond Guarantor Limited Partnership (the Guarantor) to guarantee payment of the principal and interest owed to the bondholders. The Bank sold insured residential mortgages to the Guarantor and granted it a demand loan to facilitate the acquisition of these assets. The Bank acts as manager of the partnership and has decision-making authority over its relevant activities, subject to the contractual terms governing the structured covered bond program. In addition, the Bank is able, subject to the contractual terms governing the structured covered bond program, to affect the variable returns of the partnership, which are directly related to the return on the mortgage loan portfolio and the interest on the loans from the Bank. Consequently, the Bank controls the partnership and consolidates it. Investment funds The Bank enters into derivative or other financial instrument contracts with third parties to provide them with the desired exposure to certain investment funds. The Bank economically hedges the risks related to these derivatives by investing in those investment funds. The Bank can also hold economic interests in certain investment funds as part of its investing activities. The Bank consolidates those over which it has the ability to direct the relevant activities and in which it can use its power to affect the amount of returns it obtains. NBC Asset Trust The Bank created NBC Asset Trust for its funding and capital management needs. The securities issued by this trust constitute innovative capital instruments and are eligible as additional Tier 1 capital, but because these instruments do not satisfy the non-viability contingent capital requirements, they are to be phased out at a rate of 10% per year between 2013 and 2022. For additional information, see Note 19. The issuance proceeds were used to acquire, from the Bank, residential mortgage loans. The Bank continues to administer these loans and is committed to repurchase from NBC Asset Trust the capital balance and unpaid accrued interest on any loan that is more than 90 days past due. The Bank also manages day-to-day operations and holds the special voting securities of the trust. After the distribution has been paid to the holders of the trust capital securities, the Bank, as the sole holder of the special trust securities, is entitled to receive the balance of net residual funds. Therefore, the Bank has the ability to direct the relevant activities of NBC Asset Trust and can use its power to affect the amount of returns it obtains. Consequently, the Bank controls this trust and consolidates it.

AUDITED CONSOLIDATED FINANCIAL STATEMENTS NOTES TO THE AUDITED CONSOLIDATED FINANCIAL STATEMENTS (millions of Canadian dollars)
National Bank of Canada 189 2014 Annual Report
The following table presents the Bank’s investments and other assets in the consolidated structured entities as well as the total assets of these entities. As at October 31 2014 2013(1)
Investments
and other assets Total
assets(2) Investments
and other assets Total
assets(2)
Consolidated structured entities Securitization entity for the Bank’s credit card receivables(3)(4) 342 1,636 328 1,621 National Bank hedge fund managed accounts (Innocap platform)(4)(5) 467 549 508 617 Investment funds(6) 281 332 411 411 Covered bonds(7) 10,315 10,696 3,506 3,939 Building(8) 73 66 78 71 NBC Asset Trust(9) 938 1,709 938 1,710 12,416 14,988 5,769 8,369
(1) Certain amounts have been adjusted to reflect changes in accounting standards. See Note 2. (2) There are restrictions that stem mainly from regulatory requirements, corporate or securities laws and contractual restrictions, which limit the ability of certain consolidated structured
entities to transfer funds to the Bank. (3) The underlying assets are credit card receivables. (4) The Bank's investment is presented net of third-party holdings. (5) The underlying assets are various financial instruments (trading portfolio). The total assets of the Innocap platform are presented on a net asset basis. (6) The underlying assets are various financial instruments and are presented on a net asset basis. Certain investment funds are in a trading portfolio. (7) For the covered bonds issued under the covered bond legislative program, the underlying assets are uninsured residential mortgage loans. The average maturity of these underlying assets
is two years. For covered bonds issued under the structured covered bond program, the underlying assets are insured residential mortgage loans. The average maturity of these underlying assets is two years. See Note 13.
(8) The underlying asset is a building located in Canada. (9) The underlying assets are insured and uninsured residential mortgage loans of the Bank. As at October 31, 2014, insured loans amounted to $253 million ($277 million as at
October 31, 2013). The average maturity of the underlying assets is two years. See Note 19.

AUDITED CONSOLIDATED FINANCIAL STATEMENTS NOTES TO THE AUDITED CONSOLIDATED FINANCIAL STATEMENTS (millions of Canadian dollars)
190 National Bank of Canada 2014 Annual Report
NOTE 29 – RELATED PARTY DISCLOSURES In the normal course of business, the Bank provides various banking services to related parties and enters into contractual agreements and other operations with related parties. The Bank considers the following to be related parties.
— Its key officers and directors and members of their immediate family, i.e., spouses and children under 18 living in the same household. — Entities over which its key officers and directors and their immediate family have control and/or significant influence through their significant voting
power. — The Bank’s associates and joint ventures. — The Bank’s pension plans (for additional information, see Note 23). According to the established definition, the Bank’s key officers are those persons having authority and responsibility for planning, directing and controlling the Bank’s activities, directly or indirectly.
Transactions With Related Parties As at October 31
Key officers
and directors(1) Related entities 2014 2013 2014 2013
Assets Mortgage loans and other loans(2) 64 33 429 (3) 327 (3) Other 57 58
Liabilities Deposits 43 51 588 (4) 605 (4) Other 29 34
(1) As at October 31, 2014, key officers, directors and their immediate family members were holding $32 million of the Bank’s common and preferred shares ($30 million as at October 31, 2013).
(2) The Bank did not record any allowance or provisions for credit losses in 2014 and 2013. (3) As at October 31, 2014, mortgage loans and other loans consisted of (i) $107 million in loans to the Bank’s associates and joint ventures ($116 million as at October 31, 2013), and
(ii) $322 million in loans to entities whose key officers, directors and immediate family members exercise control or significant influence through significant voting power ($211 million as at October 31, 2013).
(4) As at October 31, 2014, deposits consisted of (i) $189 million in deposits from the Bank’s associates and joint ventures ($251 million as at October 31, 2013), (ii) $268 million in deposits from entities whose key officers, directors and their immediate family members exercise control or significant influence through significant voting power ($178 million as at October 31, 2013), and (iii) $131 million in Bank-issued investment securities held by the Bank’s pension plans ($176 million as at October 31, 2013).
The contractual agreements and other transactions with related entities as well as with directors and key officers are entered into under conditions similar to those offered to non-related third parties. These agreements did not have a significant impact on the Bank’s results. Loans to eligible key officers are granted under the same conditions as those granted to any other employee of the Bank. The main conditions are as follows: the employee must meet the same credit requirements as a client; mortgage loans are granted at the posted rate less 2% limited to half of the posted rate; personal loans bear interest at the client rate divided by two; credit card advances bear interest at a prescribed fixed rate in accordance with Bank policy; and personal lines of credit bear interest at the Canadian prime rate less 3%, but never lower than Canadian prime divided by two. For personal loans and personal lines of credit, employees may not borrow more than 50% of their annual gross base salary at the reduced rate. The Canadian prime rate is applied to the remainder. In accordance with the Bank Act (Canada), the aggregate of loans granted to key officers of the Bank, excluding mortgage loans granted on their principal residence, cannot exceed twice the officer’s base salary. Moreover, the Bank offers a deferred stock unit plan to directors who are not Bank employees. For additional information, see Notes 9, 22 and 28.

AUDITED CONSOLIDATED FINANCIAL STATEMENTS NOTES TO THE AUDITED CONSOLIDATED FINANCIAL STATEMENTS (millions of Canadian dollars)
National Bank of Canada 191 2014 Annual Report
Compensation of Key Officers and Directors As at October 31 2014 2013
Compensation and other short-term and long-term benefits 23 21 Share-based payments 15 13
Other The Bank analyzes all contracts and commitments that it has signed with related parties. These transactions were executed at the market conditions prevailing at the time of the transactions.
Principal Subsidiaries of the Bank(1)
Name Business activity Principal office address Voting
shares(2) Investment atcarrying value
Canada and United States National Bank Acquisition Holding Inc. Holding Company Montreal, Canada 100% 772 National Bank Group Inc. Holding Company Montreal, Canada 100% National Bank Financial Inc. Securities Brokerage Montreal, Canada 100% National Bank Financial Ltd. Securities Brokerage Montreal, Canada 100% NBF International Holdings Inc. Holding Company Montreal, Canada 100% National Bank of Canada Financial Group Inc. Holding Company New York, NY, United States 100% Credigy Ltd. Holding Company Atlanta, GA, United States 80% National Bank Life Insurance Company Insurance Montreal, Canada 100% Natcan Trust Company Trustee Montreal, Canada 100% National Bank Trust Inc. Trustee Montreal, Canada 100% 195 National Bank Realty Inc. Real estate Montreal, Canada 100% 13 National Bank Investments Inc. Mutual Funds Dealer Montreal, Canada 100% 421 National Bank Direct Brokerage Inc. Securities Brokerage Montreal, Canada 100% 38 NatBC Holding Corporation Holding Company Hollywood, FL, United States 100% 15 Natbank, National Association Banking Hollywood, FL, United States 100% Other countries Natcan Global Holdings Ltd. Holding Company Sliema, Malta 100% 25 NBC Global Finance Limited Investment Services Dublin, Ireland 100% NBC Trade Finance Limited Reissue of letters of credit Hong Kong, China 100% 1
(1) Excluding consolidated structured entities. See Note 28. (2) The Bank’s percentage of voting rights in these subsidiaries.

AUDITED CONSOLIDATED FINANCIAL STATEMENTS NOTES TO THE AUDITED CONSOLIDATED FINANCIAL STATEMENTS (millions of Canadian dollars)
192 National Bank of Canada 2014 Annual Report
NOTE 30 – MANAGEMENT OF THE RISKS ASSOCIATED WITH FINANCIAL INSTRUMENTS The Bank is exposed to credit risk, market risk, liquidity risk and financing risk. The Bank’s objectives, policies and procedures for managing risk and the risk measurement methods are presented in the Risk Management section of the MD&A. Text in grey shading and tables identified with an asterisk (*) in the Risk Management section of the MD&A are an integral part of these consolidated financial statements.
Residual Contractual Maturities of Balance Sheet Items and Off-Balance-Sheet Commitments
The following tables present balance sheet items and off-balance-sheet commitments by residual contractual maturity as at October 31, 2014 and 2013. The information gathered from this maturity analysis is a component of liquidity and funding management. However, this maturity profile does not represent how the Bank manages its interest rate risk nor its liquidity risk and funding needs. The Bank considers factors other than contractual maturity in the assessment of liquid assets or in determining expected future cash flows. In the normal course of business, the Bank enters into various off-balance-sheet commitments. The credit instruments used to meet the funding needs of its clients represent the maximum amount of additional credit the Bank could be obligated to extend if the commitments were fully drawn. The Bank also has future minimum commitments under leases for premises as well for other contracts, mainly contracts for outsourced Information Technology services. Most of the lease commitments are related to operating leases.
Assets As at October 31, 2014
1 month
or less
Over 1 month to 3 months
Over 3 months to 6 months
Over 6 months to 9 months
Over 9 months to
12 months
Over 1 year to 2 years
Over 2 years to 5 years
Over 5 years
No specified maturity Total
Cash and deposits with financial institutions 5,695 4 2,387 8,086
Securities At fair value through profit or loss 398 582 584 1,070 1,665 3,114 7,255 8,628 19,904 43,200 Available-for-sale 171 177 264 89 222 3,758 4,617 455 9,753 569 759 584 1,334 1,754 3,336 11,013 13,245 20,359 52,953
Securities purchased under reverse repurchase agreements and securities borrowed 9,894 3,876 5,480 283 1,125 1,044 2,823 24,525
Loans and acceptances(1) Residential mortgage 915 1,144 1,693 2,848 2,168 9,183 20,523 564 262 39,300 Personal and credit card 254 333 573 782 661 2,465 5,850 1,585 17,493 29,996 Business and government 3,922 1,849 1,337 1,637 1,100 2,027 5,714 1,142 9,823 28,551 Customers’ liability under acceptances 7,878 870 178 8,926 Allowances for credit losses (604) (604) 12,969 4,196 3,781 5,267 3,929 13,675 32,087 3,291 26,974 106,169
Other Derivative financial instruments 305 491 310 225 142 842 1,449 3,328 7,092 Due from clients, dealers and brokers(1) 861 861 Investments in associates and joint ventures 697 697 Premises and equipment 380 380 Goodwill 1,272 1,272 Intangible assets 998 998 Other assets 158 55 212 89 253 54 9 44 1,522 2,396 463 546 522 314 395 896 1,458 3,372 5,730 13,696 29,590 9,381 10,367 7,198 6,078 19,032 45,602 19,908 58,273 205,429
(1) Amounts collectible on demand are considered to have no specified maturity.

AUDITED CONSOLIDATED FINANCIAL STATEMENTS NOTES TO THE AUDITED CONSOLIDATED FINANCIAL STATEMENTS (millions of Canadian dollars)
National Bank of Canada 193 2014 Annual Report
Liabilities, Equity and Off-Balance-Sheet Commitments As at October 31, 2014
1 month
or less
Over 1 month to 3 months
Over 3 months to 6 months
Over 6 months to 9 months
Over 9 months to
12 months
Over 1 year to 2 years
Over 2 years to 5 years
Over 5 years
No specified maturity Total
Deposits(1)(2) Personal 532 1,029 1,807 1,049 1,373 4,586 8,858 876 24,853 44,963 Business and government 620 140 143 26 87 499 316 501 32,828 35,160 Deposit-taking institutions 436 1,248 1,684 Unsecured senior debt 8,657 3,267 1,253 5,482 3,867 3,588 6,253 640 33,007 Covered bonds 2,260 1,407 1,402 5,069 10,245 4,436 3,203 6,557 5,327 10,933 16,834 3,419 58,929 119,883
Other Acceptances 7,878 870 178 8,926 Obligations related to securities sold short(3) 288 1,175 75 39 95 2,321 3,667 7,414 3,093 18,167 Obligations related to securities sold under repurchase agreements and securities loaned 8,146 1,469 3,438 2,415 1,312 16,780 Derivative financial instruments 296 664 389 325 160 880 1,432 1,575 5,721 Due to clients, dealers and brokers(1) 1,996 1,996 Liabilities related to transferred receivables(4) 7 335 405 367 16 2,223 8,703 5,023 17,079 Securitization – Credit card(5) 330 550 400 1,280 Other liabilities – Other items(1)(5) 228 53 142 21 753 2 2 69 1,944 3,214 16,843 4,566 4,957 3,717 1,424 5,426 13,804 14,081 8,345 73,163
Subordinated debt 352 515 1,006 8 1,881
Equity 10,502 10,502 27,088 9,354 8,160 10,274 6,751 16,874 31,644 17,508 77,776 205,429
Commitments Letters of guarantee and documentary letters of credit 102 715 62 287 182 363 574 404 2,689 Credit card receivables(6) 6,442 6,442 Backstop liquidity and credit enhancement facilities(7) 2,044 15 2,130 846 5,035 Commitments to extend credit(8) 725 868 1,155 1,895 1,474 8,104 7,216 439 19,263 41,139 Lease commitments and other contracts 64 125 181 179 175 486 811 495 2,516 Other guarantee 29 29
(1) Amounts payable upon demand or notice are considered to have no specified maturity. (2) The Deposits item is presented in greater detail than it is on the Consolidated Balance Sheet. (3) Amounts have been disclosed according to the remaining contractual maturity of the underlying security. (4) These amounts mainly include liabilities related to the securitization of mortgage loans. (5) The Other liabilities item is presented in greater detail than it is on the Consolidated Balance Sheet. (6) These amounts are unconditionally revocable at the Bank’s discretion at any time. (7) In the event of payment on one of the backstop liquidity facilities, the Bank will receive as collateral government bonds in an amount up to $1.8 billion. (8) These amounts include $17.2 billion that is unconditionally revocable at the Bank’s discretion at any time.

AUDITED CONSOLIDATED FINANCIAL STATEMENTS NOTES TO THE AUDITED CONSOLIDATED FINANCIAL STATEMENTS (millions of Canadian dollars)
194 National Bank of Canada 2014 Annual Report
NOTE 30 – MANAGEMENT OF THE RISKS ASSOCIATED WITH FINANCIAL INSTRUMENTS (cont.)
Assets As at October 31, 2013(1)
1 month
or less
Over 1 month to 3 months
Over 3 months to 6 months
Over 6 months to 9 months
Over 9 months to
12 months
Over 1 year to 2 years
Over 2 years to 5 years
Over 5 years
Nospecifiedmaturity Total
Cash and deposits with financial institutions 1,177 203 2,216 3,596
Securities At fair value through profit or loss 286 1,151 770 10 2,234 4,233 7,335 10,374 17,607 44,000 Available-for-sale 365 36 64 103 60 607 4,917 3,193 399 9,744
651 1,187 834 113 2,294 4,840 12,252 13,567 18,006 53,744
Securities purchased under reverse repurchase agreements and securities borrowed 7,142 5,039 3,814 1,330 347 3,777 21,449
Loans and acceptances(2) Residential mortgage 871 968 1,289 2,271 1,732 7,503 20,976 698 265 36,573 Personal and credit card 254 322 500 624 513 1,652 5,619 1,447 17,058 27,989 Business and government 4,050 1,492 1,063 1,421 908 1,463 3,427 901 9,675 24,400 Customers' liability under acceptances 8,104 843 7 8,954 Allowances for credit losses (578) (578)
13,279 3,625 2,859 4,316 3,153 10,618 30,022 3,046 26,420 97,338
Other Derivative financial instruments 321 338 156 148 151 705 1,580 2,505 5,904 Due from clients, dealers and brokers(2) 1,101 1,101 Investments in associates and joint ventures 684 684 Premises and equipment 404 404 Goodwill 1,064 1,064 Intangible assets 898 898 Other assets 144 63 219 115 113 64 124 76 1,119 2,037
465 401 375 263 264 769 1,704 2,581 5,270 12,092
22,714 10,455 7,882 6,022 6,058 16,227 43,978 19,194 55,689 188,219
(1) Certain amounts have been adjusted to reflect changes in accounting standards. See Note 2. (2) Amounts collectible on demand are considered to have no specified maturity.

AUDITED CONSOLIDATED FINANCIAL STATEMENTS NOTES TO THE AUDITED CONSOLIDATED FINANCIAL STATEMENTS (millions of Canadian dollars)
National Bank of Canada 195 2014 Annual Report
Liabilities, Equity and Off-Balance-Sheet Commitments As at October 31, 2013(1)
1 month
or less
Over 1 month to 3 months
Over 3 months to 6 months
Over 6 months to 9 months
Over 9 months to
12 months
Over 1 year to 2 years
Over 2 years to 5 years
Over 5 years
Nospecifiedmaturity Total
Deposits(2)(3) Personal 801 970 1,808 2,043 1,479 4,457 8,272 355 22,467 42,652 Business and government 840 189 247 143 153 308 450 305 29,274 31,909 Deposit-taking institutions 141 314 617 1,072 Unsecured senior debt 3,349 1,835 1,895 617 1,506 8,891 4,725 518 23,336 Covered bonds 1,043 2,099 3,142
5,131 4,351 3,950 2,803 3,138 13,656 15,546 1,178 52,358 102,111
Other Acceptances 8,104 843 7 8,954 Obligations related to securities sold short(4) 258 210 413 818 1,183 4,199 8,260 3,568 18,909 Obligations related to securities sold under repurchase agreements and securities loaned 8,968 3,349 5,366 773 1,290 19,746 Derivative financial instruments 245 580 345 140 160 590 1,380 1,418 4,858 Due to clients, dealers and brokers(2) 2,442 2,442 Liabilities related to transferred receivables(5) 14 490 362 402 283 1,108 7,274 5,390 15,323 Securitization – Credit card(6) 1,280 1,280 Other liabilities – Other items(2)(6) 156 63 155 1 588 97 120 173 1,864 3,217
17,745 5,535 6,648 1,316 1,849 4,258 12,973 15,241 9,164 74,729
Subordinated debt 500 362 1,531 33 2,426
Equity 8,953 8,953
23,376 9,886 10,598 4,119 4,987 18,276 30,050 16,452 70,475 188,219
Commitments Letters of guarantee and documentary letters of credit 8 404 43 254 265 1,150 1,054 65 3,243 Credit card receivables(7) 6,332 6,332 Backstop liquidity and credit enhancement facilities(8) 15 2,050 15 2,098 886 5,064 Commitments to extend credit(9) 813 507 1,175 1,740 1,613 7,423 6,507 294 18,172 38,244 Lease commitments and other contracts 62 120 174 169 163 453 696 550 2,387 Other guarantee 29 29
(1) Certain amounts have been adjusted to reflect changes in accounting standards. See Note 2. (2) Amounts payable upon demand or notice are considered to have no specified maturity. (3) The Deposits item is presented in greater detail than it is on the Consolidated Balance Sheet. (4) Amounts have been disclosed according to the remaining contractual maturity of the underlying security. (5) These amounts mainly include liabilities related to the securitization of mortgage loans. (6) The Other liabilities item is presented in greater detail than it is on the Consolidated Balance Sheet. (7) These amounts are unconditionally revocable at the Bank’s discretion at any time. (8) In the event of payment on one of the backstop liquidity facilities, the Bank will receive as collateral government bonds in an amount up to $1.8 billion. (9) These amounts include $15.9 billion that is unconditionally revocable at the Bank’s discretion at any time.
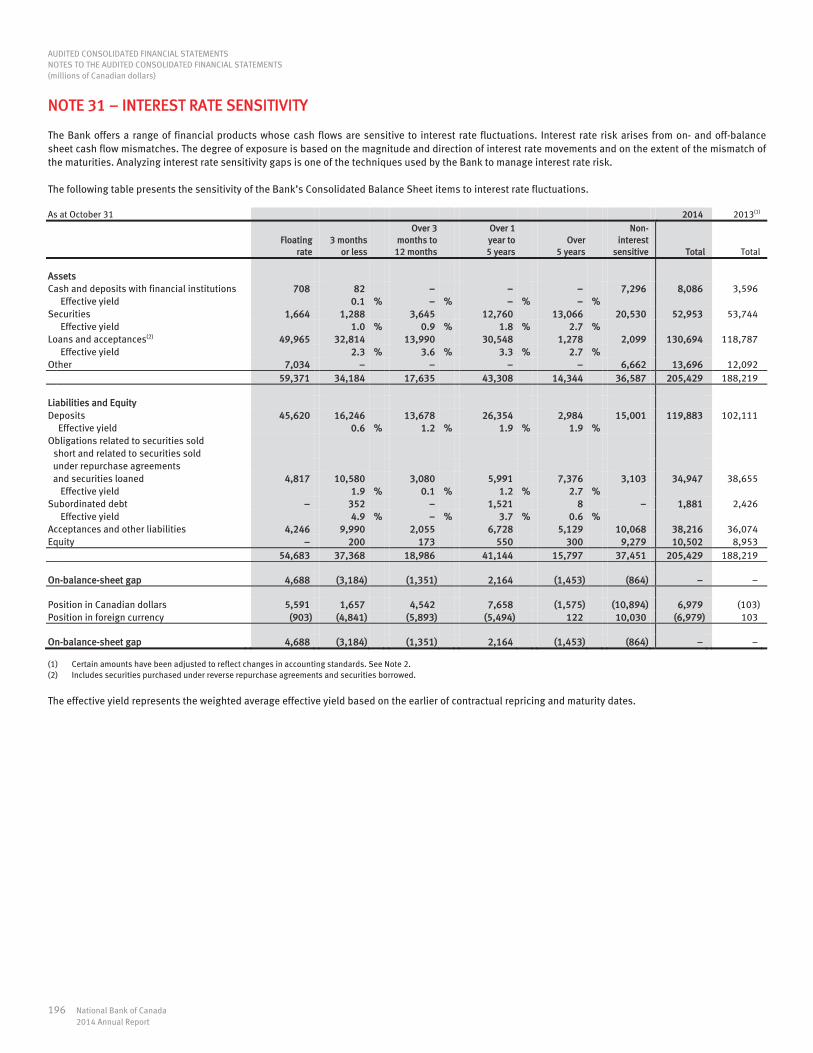
AUDITED CONSOLIDATED FINANCIAL STATEMENTS NOTES TO THE AUDITED CONSOLIDATED FINANCIAL STATEMENTS (millions of Canadian dollars)
196 National Bank of Canada 2014 Annual Report
NOTE 31 – INTEREST RATE SENSITIVITY The Bank offers a range of financial products whose cash flows are sensitive to interest rate fluctuations. Interest rate risk arises from on- and off-balance sheet cash flow mismatches. The degree of exposure is based on the magnitude and direction of interest rate movements and on the extent of the mismatch of the maturities. Analyzing interest rate sensitivity gaps is one of the techniques used by the Bank to manage interest rate risk. The following table presents the sensitivity of the Bank’s Consolidated Balance Sheet items to interest rate fluctuations. As at October 31 2014 2013(1)
Floating
rate 3 months
or less
Over 3 months to
12 months
Over 1 year to 5 years
Over 5 years
Non-interest
sensitive Total Total
Assets Cash and deposits with financial institutions 708 82 7,296 8,086 3,596 Effective yield 0.1 % % % % Securities 1,664 1,288 3,645 12,760 13,066 20,530 52,953 53,744 Effective yield 1.0 % 0.9 % 1.8 % 2.7 % Loans and acceptances(2) 49,965 32,814 13,990 30,548 1,278 2,099 130,694 118,787 Effective yield 2.3 % 3.6 % 3.3 % 2.7 % Other 7,034 6,662 13,696 12,092 59,371 34,184 17,635 43,308 14,344 36,587 205,429 188,219 Liabilities and Equity Deposits 45,620 16,246 13,678 26,354 2,984 15,001 119,883 102,111 Effective yield 0.6 % 1.2 % 1.9 % 1.9 % Obligations related to securities sold
short and related to securities sold under repurchase agreements and securities loaned 4,817 10,580 3,080 5,991 7,376 3,103 34,947 38,655 Effective yield 1.9 % 0.1 % 1.2 % 2.7 % Subordinated debt 352 1,521 8 1,881 2,426 Effective yield 4.9 % % 3.7 % 0.6 % Acceptances and other liabilities 4,246 9,990 2,055 6,728 5,129 10,068 38,216 36,074 Equity 200 173 550 300 9,279 10,502 8,953 54,683 37,368 18,986 41,144 15,797 37,451 205,429 188,219 On-balance-sheet gap 4,688 (3,184) (1,351) 2,164 (1,453) (864) Position in Canadian dollars 5,591 1,657 4,542 7,658 (1,575) (10,894) 6,979 (103) Position in foreign currency (903) (4,841) (5,893) (5,494) 122 10,030 (6,979) 103 On-balance-sheet gap 4,688 (3,184) (1,351) 2,164 (1,453) (864)
(1) Certain amounts have been adjusted to reflect changes in accounting standards. See Note 2. (2) Includes securities purchased under reverse repurchase agreements and securities borrowed.
The effective yield represents the weighted average effective yield based on the earlier of contractual repricing and maturity dates.

AUDITED CONSOLIDATED FINANCIAL STATEMENTS NOTES TO THE AUDITED CONSOLIDATED FINANCIAL STATEMENTS (millions of Canadian dollars)
National Bank of Canada 197 2014 Annual Report
NOTE 32 – SEGMENT DISCLOSURES The Bank carries out its activities in three business segments, which are defined below. For presentation purposes, other activities are grouped in the Other heading. Each reportable segment is distinguished by services offered, type of clientele and marketing strategy. Personal and Commercial The Personal and Commercial segment encompasses the banking, financing, and investing services offered to individuals and businesses as well as insurance operations. Wealth Management The Wealth Management segment comprises investment solutions, trust services, banking services, lending services and other wealth management solutions offered through internal and third-party distribution networks. Financial Markets The Financial Markets segment encompasses banking services, investment banking services and financial solutions for institutional clients. The segment is also active in proprietary trading and investment activities for the Bank. Other This heading encompasses Treasury activities, including the Bank’s asset and liability management, liquidity management and funding operations, certain non-recurring items and the unallocated portion of corporate services. The Bank’s segment reporting for fiscal 2014 is consistent with the reporting for fiscal 2013. The segment disclosures have been prepared in accordance with the accounting policies described in Note 1, except for the net interest income and income taxes (recovery) of the operating segments, which are presented on a taxable equivalent basis. Taxable equivalent basis is a calculation method that consists in grossing up certain tax-exempt income by the amount of income tax that would have otherwise been payable. The effect of these adjustments is reversed under the Other heading. Head office expenses are allocated to each operating segment presented in the segmented results. The Bank assesses performance based on the net income attributable to the Bank’s shareholders. Intersegment revenues are recognized at the exchange amount. Segment assets correspond to average assets used in segment operations.
Results by Business Segment Year ended October 31
Personal and Commercial Wealth Management Financial Markets Other Total 2014 2013(1) 2014 2013(1) 2014 2013(1) 2014 2013(1) 2014 2013(1)
Net interest income(2) 1,699 1,615 315 272 824 784 (294) (234) 2,544 2,437 Non-interest income 994 977 1,010 872 690 594 226 271 2,920 2,714 Total revenues 2,693 2,592 1,325 1,144 1,514 1,378 (68) 37 5,464 5,151 Non-interest expenses 1,532 1,497 957 868 692 664 242 177 3,423 3,206 Contribution 1,161 1,095 368 276 822 714 (310) (140) 2,041 1,945 Provisions for credit losses 205 192 3 3 (14) 208 181 Income before income taxes (recovery) 956 903 365 273 822 728 (310) (140) 1,833 1,764 Income taxes (recovery)(2) 258 242 95 72 222 195 (280) (257) 295 252 Net income 698 661 270 201 600 533 (30) 117 1,538 1,512 Non-controlling interests 14 8 55 55 69 63 Net income attributable to the Bank’s shareholders 698 661 270 201 586 525 (85) 62 1,469 1,449
Average assets 81,516 76,696 10,400 9,080 86,198 87,063 28,566 20,670 206,680 193,509
(1) Certain amounts have been adjusted to reflect changes in accounting standards. See Note 2. (2) For the business segments as a whole, Net interest income was grossed up by $219 million for fiscal year ended October 31, 2014 ($209 million for 2013). An equivalent amount was added
to Income taxes (recovery). The effect of these adjustments is reversed under the Other heading.

AUDITED CONSOLIDATED FINANCIAL STATEMENTS NOTES TO THE AUDITED CONSOLIDATED FINANCIAL STATEMENTS (millions of Canadian dollars)
198 National Bank of Canada 2014 Annual Report
NOTE 32 – SEGMENT DISCLOSURES (cont.)
Results by Geographic Segment Year ended October 31
Canada United States Other Total 2014 2013(1) 2014 2013(1) 2014 2013(1) 2014 2013(1)
Net interest income 2,533 2,452 19 (3) (8) (12) 2,544 2,437 Non-interest income 2,617 2,433 302 227 1 54 2,920 2,714 Total revenues 5,150 4,885 321 224 (7) 42 5,464 5,151 Non-interest expenses 3,223 3,006 186 183 14 17 3,423 3,206 Contribution 1,927 1,879 135 41 (21) 25 2,041 1,945 Provisions for credit losses 208 181 208 181 Income before income taxes (recovery) 1,719 1,698 135 41 (21) 25 1,833 1,764 Income taxes (recovery) 245 231 49 20 1 1 295 252 Net income 1,474 1,467 86 21 (22) 24 1,538 1,512 Non-controlling interests 56 55 13 8 69 63 Net income attributable to the Bank’s shareholders 1,418 1,412 73 13 (22) 24 1,469 1,449
Average assets 191,762 182,319 13,182 10,454 1,736 736 206,680 193,509
(1) Certain amounts have been adjusted to reflect changes in accounting standards. See Note 2.
NOTE 33 – EVENTS AFTER THE CONSOLIDATED BALANCE SHEET DATE Redemption of Subordinated Debt On October 30, 2014, the Bank announced its intention to redeem, on December 22, 2014, $350 million of notes maturing in December 2019. Redemption of Preferred Shares On November 15, 2014, the Bank completed the redemption of all the issued and outstanding non-cumulative Series 16 First Preferred Shares. Pursuant to the share conditions, the redemption price was $25.00 per share plus the periodic dividend declared and unpaid. The Bank redeemed 8,000,000 Series 16 preferred shares for a total amount of $200 million.

National Bank of Canada 199 2014 Annual Report
SUPPLEMENTARY INFORMATION
Statistical Review 2200
Glossary of Financial Terms 2202
Information for Shareholders 2204

SUPPLEMENTARY INFORMATION
200 National Bank of Canada 2014 Annual Report
STATISTICAL REVIEW As at October 31(1) 2014 2013(2) 2012(2) 2011(2) 2010 2009 2008 2007 2006 2005
Consolidated Balance Sheet data (millions of Canadian dollars) Cash and deposits with financial institutions 8,086 3,596 3,249 2,851 2,274 2,228 3,660 3,328 10,879 10,314 Securities 52,953 53,744 54,898 56,592 54,268 50,233 46,185 39,270 38,678 33,052 Securities purchased under reverse repurchase agreements and securities borrowed 24,525 21,449 15,529 12,507 10,878 7,637 7,868 5,966 7,592 7,023 Loans and acceptances 106,169 97,338 90,922 80,758 63,134 58,370 56,015 52,045 50,670 47,311 Other assets 13,696 12,092 13,305 14,146 14,748 13,670 15,604 12,476 8,982 10,270 Total assets 205,429 188,219 177,903 166,854 145,302 132,138 129,332 113,085 116,801 107,970 Deposits 119,883 102,111 93,474 85,787 81,785 75,170 76,022 70,798 71,917 62,219 Other liabilities 73,163 74,729 73,948 71,791 Other liabilities and non-controlling interests 54,276 48,474 45,546 36,045 38,647 40,052 Subordinated debt 1,881 2,426 2,470 2,000 2,033 2,017 2,255 1,605 1,449 1,102 Share capital Preferred 1,223 677 762 762 1,089 1,089 774 400 400 400 Common 2,293 2,160 2,054 1,970 1,804 1,729 1,656 1,575 1,566 1,565 Contributed surplus 52 58 58 46 66 48 31 32 21 13 Retained earnings 5,850 5,055 4,091 3,366 4,081 3,515 3,110 2,793 2,893 2,645 Accumulated other comprehensive income (loss) 289 214 255 337 168 96 (62) (163) (92) (26) Non-controlling interests 795 789 791 795 Total liabilities and equity 205,429 188,219 177,903 166,854 145,302 132,138 129,332 113,085 116,801 107,970 Average assets 206,680 193,509 181,344 165,942 140,360 140,978 128,319 125,964 106,192 90,794 Average capital funds(3) 10,931 10,211 9,117 8,942 7,779 7,198 6,416 5,840 5,568 5,268 Consolidated Statement of Income data (millions of Canadian dollars) Net interest income 2,544 2,437 2,326 2,318 1,933 1,961 1,772 1,116 1,284 1,441 Non-interest income 2,920 2,714 2,975 2,336 2,351 2,172 2,062 2,301 2,511 2,226 Total revenues 5,464 5,151 5,301 4,654 4,284 4,133 3,834 3,417 3,795 3,667 Provisions for credit losses 208 181 180 184 144 305 144 103 77 33 Non-interest expenses 3,423 3,206 3,207 2,952 2,822 2,662 2,695 2,626 2,538 2,463 Income taxes 295 252 317 264 221 252 167 79 277 291 Non-controlling interests 63 60 52 68 32 25 Net income 1,538 1,512 1,597 1,254 1,034 854 776 541 871 855 Non-controlling interests 69 63 61 60 Net income attributable to the Bank’s shareholders 1,469 1,449 1,536 1,194
(1) Figures for 2010 and prior years are presented in accordance with previous Canadian GAAP. (2) Certain amounts have been adjusted to reflect changes in accounting standards. See Note 2 to the audited consolidated financial statements. (3) Average capital funds include common shareholders’ equity, redeemable preferred shares and subordinated debt.

SUPPLEMENTARY INFORMATION STATISTICAL REVIEW
National Bank of Canada 201 2014 Annual Report
As at October 31(1) 2014 2013(2) 2012(2) 2011(2) 2010 2009 2008 2007 2006 2005
Number of common shares(3) (thousands) 329,297 325,983 322,617 320,948 325,544 322,402 318,894 315,612 323,024 330,670 Number of common shareholders on record 22,394 22,737 23,180 23,588 23,598 23,970 24,354 24,780 25,531 26,235 Basic earnings per share (3) $ 4.36 $ 4.34 $ 4.63 $ 3.41 $ 3.00 $ 2.48 $ 2.35 $ 1.63 $ 2.61 $ 2.49 Diluted earnings per share(3) $ 4.32 $ 4.31 $ 4.58 $ 3.37 $ 2.97 $ 2.47 $ 2.34 $ 1.61 $ 2.57 $ 2.45 Dividend per share(3) $ 1.88 $ 1.70 $ 1.54 $ 1.37 $ 1.24 $ 1.24 $ 1.24 $ 1.14 $ 0.98 $ 0.86 Share price(3) High $ 53.88 $ 45.24 $ 40.64 $ 40.72 $ 33.94 $ 31.04 $ 27.32 $ 33.30 $ 32.80 $ 30.74 Low $ 41.60 $ 36.18 $ 31.64 $ 32.43 $ 27.23 $ 12.81 $ 21.13 $ 25.25 $ 28.07 $ 23.20 Close $ 52.68 $ 45.24 $ 38.59 $ 35.57 $ 33.57 $ 28.20 $ 22.61 $ 27.33 $ 30.63 $ 29.57 Book value(3) $ 25.76 $ 22.97 $ 20.02 $ 17.82 $ 18.80 $ 16.72 $ 14.85 $ 13.43 $ 13.59 $ 12.70 Dividends on preferred shares Series 13 – – – – – – – – – $ 1.2000 Series 15 – $ 0.2444 $ 1.4625 $ 1.4625 $ 1.4625 $ 1.4625 $ 1.4625 $ 1.4625 $ 1.4625 $ 1.4625 Series 16 $ 1.2125 $ 1.2125 $ 1.2125 $ 1.2125 $ 1.2125 $ 1.2125 $ 1.2125 $ 1.2125 $ 1.2125 $ 0.8089 Series 20 $ 1.5000 $ 1.5000 $ 1.5000 $ 1.5000 $ 1.5000 $ 1.5000 $ 0.8692 $ – – – Series 21 – $ 1.0078 $ 1.3438 $ 1.3438 $ 1.3438 $ 1.3438 $ 0.5596 $ – – – Series 24 $ 0.4125 $ 1.6500 $ 1.6500 $ 1.6500 $ 1.6500 $ 1.3765 $ – – – – Series 26 $ 0.4125 $ 1.6500 $ 1.6500 $ 1.6500 $ 1.6500 $ 1.3042 $ – – – – Series 28 $ 0.9500 $ 0.9728 $ – – – – – – – – Series 30 $ 0.7849 – – – – – – – – – Financial ratios Return on common shareholders’ equity 17.9 % 20.1 % 24.1 % 19.8 % 17.0 % 15.6 % 16.4 % 11.5 % 20.1 % 20.7 % Return on average assets 0.74 % 0.78 % 0.88 % 0.76 % 0.74 % 0.61 % 0.60 % 0.43 % 0.82 % 0.94 % Return on average capital funds 14.1 % 14.8 % 17.5 % 14.0 % 13.3 % 11.9 % 12.1 % 9.3 % 15.6 % 16.2 % Capital ratios(4) Common Equity Tier 1(5) 9.2 % 8.7 % 7.3 % 7.6 % Tier 1(6) 12.3 %(7) 11.4 % 10.1 % 10.8 % 14.0 % 10.7 % 9.4 % 9.0 % 9.9 % 9.6 % Total(6) 15.1 %(7) 15.0 % 14.1 % 14.3 % 17.5 % 14.3 % 13.2 % 12.4 % 14.0 %(8) 12.8 %(9) Other information Net impaired loans (millions of dollars) $ 248 $ 183 $ 179 $ 175 $ 162 $ 223 $ 169 $ 129 $ 116 $ 117 Number of employees(10) 17,056 16,675 16,636 16,217 15,298 14,851 14,420 14,484 14,381 14,372 Branches in Canada 452 453 451 448 442 445 446 447 451 457 Banking machines 935 937 923 893 869 866 858 836 801 788
(1) Figures for 2010 and prior years are presented in accordance with previous Canadian GAAP. (2) Certain amounts have been adjusted to reflect changes in accounting standards. See Note 2 to the audited consolidated financial statements. (3) Reflecting the stock dividend paid on February 13, 2014. See Note 18 to the audited consolidated financial statements. (4) The October 31, 2013, 2012 and 2011 ratios have not been adjusted to reflect changes in accounting standards. (5) As at October 31, 2014 and 2013, the capital ratios under Basel III were calculated using the “all-in” methodology and the October 31, 2012 and 2011 ratios are presented on a pro forma
basis. (6) In 2008, the Bank adopted the rules of the Basel II Accord and, since November 1, 2009, it has been applying the AIRB Approach for credit risk, whereas prior to that date, it had been using
the Standardized Approach under Basel I for 2007 and years prior. (7) Taking into account the redemption of the Series16 preferred shares on November 15, 2014. (8) Taking into account the issuance of $500 million in subordinated debt on November 2, 2006. (9) Taking into account the issuance of $500 million in subordinated debt on November 2, 2005. (10) In full-time equivalent.

SUPPLEMENTARY INFORMATION
202 National Bank of Canada 2014 Annual Report
GLOSSARY OF FINANCIAL TERMS Acceptances Acceptances constitute a guarantee of payment by a bank and can be traded in the money market. The bank earns a “stamping fee” for providing this guarantee. Allowances for credit losses Allowances for credit losses are management’s best estimate of losses in its credit portfolio as at the balance sheet date. These allowances are primarily related to loans but may also cover the credit risk associated with deposits with financial institutions, loan substitute securities, credit instruments such as acceptances, and off-balance-sheet items such as commitments to extend credit, letters of guarantee and letters of credit. The allowances are increased by the provisions for credit losses, which are charged to income and decreased by the amount of write-offs, net of recoveries in the period. Assets-to-capital multiple Total assets plus specified off-balance-sheet items, as defined by OSFI, divided by total regulatory capital. Assets under administration Assets in respect of which a financial institution provides administrative services such as custodial services, collection of investment income, settlement of purchase and sale transactions and record-keeping. Assets under administration, which are beneficially owned by clients, are not reported on the balance sheet of the institution offering such services. Assets under management Assets managed by a financial institution that are beneficially owned by clients. Management services are more comprehensive than administrative services, and include selecting investments or offering investment advice. Assets under management, which may also be administered by the financial institution, are not reported on the financial institution’s balance sheet. Basis point Unit of measure equal to one one-hundredth of a percentage point (0.01%). Common Equity Tier 1 (CET1) capital ratio Common Equity Tier 1 capital consists of common shareholders’ equity less goodwill, intangible assets and other capital deductions. Common Equity Tier 1 capital ratio is calculated by dividing Common Equity Tier 1 capital by risk-weighted assets. Derivative financial instruments Derivative financial instruments are financial contracts whose value is derived from an underlying interest rate, exchange rate or equity, commodity or credit instrument or index. Examples of derivatives include swaps, options, forward rate agreements and futures. The notional amount of the derivative is the contract amount used as a reference point to calculate the payments to be exchanged between the two parties, and the notional amount itself is generally not exchanged by the parties.
Dividend payout ratio Common dividends as a percentage of net income after preferred share dividends. Economic capital Economic capital is the internal measure used by the Bank to determine the capital required for its solvency and to pursue its business operations. Economic capital takes into consideration the credit, market, operational, business and other risks to which the Bank is exposed, as well as the risk diversification effect among them and among the business segments. Economic capital thus helps the Bank to determine the capital required to protect itself against such risks and ensure its long-term viability. Efficiency ratio Non-interest expenses as a percentage of total revenue, the efficiency ratio measures the efficiency of the Bank’s operations. Fair value The fair value of a financial instrument is the price that would be received to sell a financial asset or paid to transfer a financial liability in an orderly transaction in the principal market at the measurement date under current market conditions (i.e., an exit price). Hedging The purpose of a hedging transaction is to modify the Bank’s exposure to one or more risks by creating an offset between changes in the fair value of, or the cash flows attributable to, the hedged item and the hedging instrument. Impaired loans A loan, except credit card receivables, is considered impaired if there is objective evidence of impairment and, in management’s best estimate, the timely collection of principal and interest is no longer reasonably assured, or when a payment is contractually 90 days past due, unless the loan is fully secured and collection efforts are reasonably expected to result in repayment of the debt within 180 days. Loans that are insured or fully guaranteed by a Canadian government (federal or provincial) or by a Canadian government agency are considered impaired when they are more than 365 days in arrears. Master netting agreement Legal agreement between two parties that have multiple derivative contracts with each other that provides for the net settlement of all contracts through a single payment, in the event of default, insolvency or bankruptcy. Net interest margin Net interest income as a percentage of average interest-bearing assets.

SUPPLEMENTARY INFORMATION GLOSSARY OF FINANCIAL TERMS
National Bank of Canada 203 2014 Annual Report
Office of the Superintendent of Financial Institutions (Canada) The mandate of the Office of the Superintendent of Financial Institutions (OSFI) is to regulate and supervise financial institutions and private pension plans subject to federal oversight, to help minimize undue losses to depositors and policyholders and, thereby, to contribute to public confidence in the Canadian financial system. Provisions for credit losses The amount charged to income necessary to bring the allowances for credit losses to a level determined appropriate by management. This includes both individual and collective provisions. Return on common shareholders’ equity (ROE) Net income, less dividends on preferred shares, expressed as a percentage of the average value of common shareholders’ equity. Risk-weighted assets Assets are risk weighted according to the guidelines established by the Office of the Superintendent of Financial Institutions (Canada). In the Standardized calculation approach, factors are applied to the face value of certain assets in order to reflect comparable risk levels. In the Advanced Internal Rating-Based (AIRB) approach, risk-weighted assets are derived from the Bank's internal models, which represent the Bank's own assessment of the risks it incurs. Off-balance-sheet instruments are converted to balance sheet (or credit) equivalents by adjusting the notional values before applying the appropriate risk-weighting factors. Securities purchased under reverse repurchase agreements Securities purchased by the Bank from a client pursuant to an agreement under which the securities will be resold to the same client on a specified date and at a specified price. Such an agreement is a form of short-term collateralized lending. Securities sold under repurchase agreements Financial obligations related to securities sold pursuant to an agreement under which the securities will be repurchased on a specified date and at a specified price. Such an agreement is a form of short-term funding.
Structured entities A structured entity is an entity created to accomplish a narrow and well-defined objective and is designed so that voting or similar rights are not the dominant factor in deciding who controls the entity, such as when voting rights relate solely to administrative tasks and the relevant activities are directed by means of contractual arrangements. Taxable equivalent basis Taxable equivalent basis is a calculation method that consists in grossing up certain tax-exempt income by the amount of income tax that would have otherwise been payable. Tier 1 capital ratio Tier 1 capital ratio consists of Common Equity Tier 1 capital and Additional Tier 1 instruments, namely, eligible non-cumulative preferred shares and the eligible amount of innovative instruments. Tier 1 capital ratio is calculated by dividing Tier 1 capital, less regulatory adjustments, by risk-weighted assets. Total capital ratio Total capital is the sum of Tier 1 and Tier 2 capital. Tier 2 capital consists of the eligible portion of subordinated debt and the eligible collective allowance for credit risk on non-impaired loans. Total capital ratio is calculated by dividing total capital, less regulatory adjustments, by risk-weighted assets. Total shareholder return The one-year, five-year and ten-year average annual total shareholder return represents the average annual total return on an investment in the Bank’s common shares made at the beginning of a one-year, five-year and ten-year period, respectively. The return includes changes in share price and assumes that the dividends received were reinvested in additional common shares of the Bank. Value-at-Risk (VaR) VaR is a statistical measure of risk that is used to quantify market risks across products, per types of risks and aggregate risk on a portfolio basis. VaR is defined as the maximum loss at a specific confidence level over a certain horizon under normal market conditions. The VaR method has the advantage of providing a uniform measurement of financial instrument-related market risks based on a single statistical confidence level and time horizon.
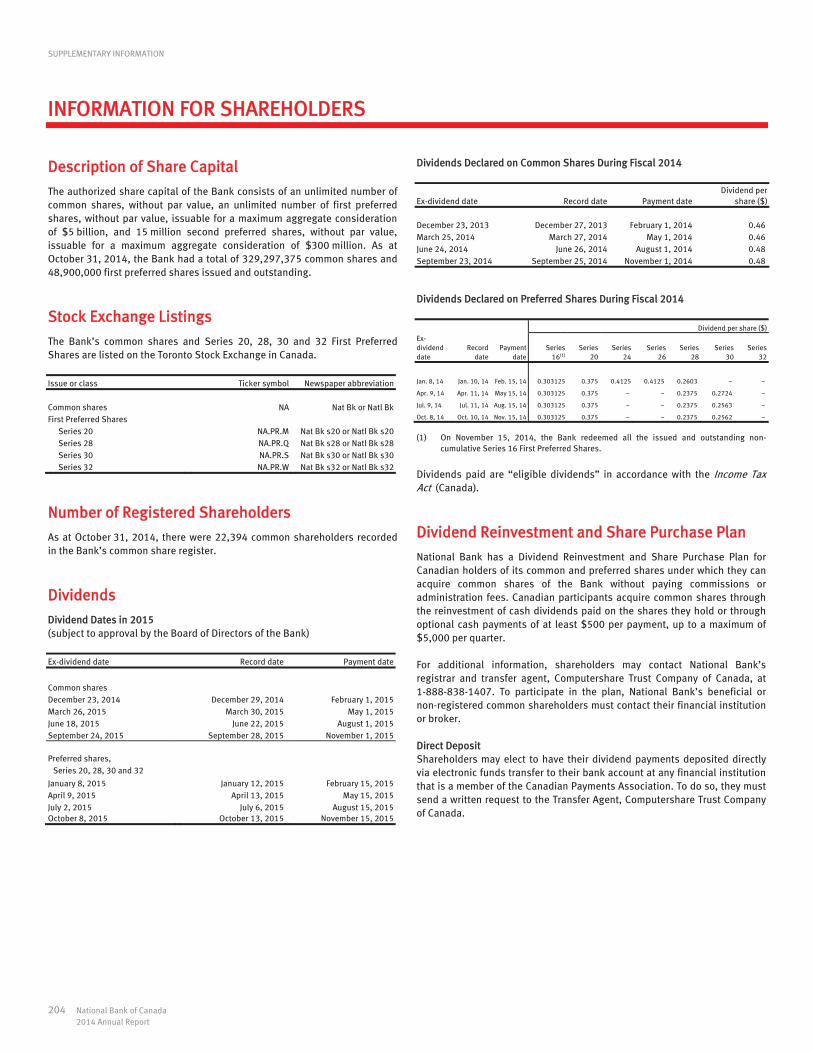
SUPPLEMENTARY INFORMATION
204 National Bank of Canada 2014 Annual Report
INFORMATION FOR SHAREHOLDERS
Description of Share Capital
The authorized share capital of the Bank consists of an unlimited number of common shares, without par value, an unlimited number of first preferred shares, without par value, issuable for a maximum aggregate consideration of $5 billion, and 15 million second preferred shares, without par value, issuable for a maximum aggregate consideration of $300 million. As at October 31, 2014, the Bank had a total of 329,297,375 common shares and 48,900,000 first preferred shares issued and outstanding.
Stock Exchange Listings
The Bank’s common shares and Series 20, 28, 30 and 32 First Preferred Shares are listed on the Toronto Stock Exchange in Canada. Issue or class Ticker symbol Newspaper abbreviation
Common shares NA Nat Bk or Natl Bk First Preferred Shares Series 20 NA.PR.M Nat Bk s20 or Natl Bk s20 Series 28 NA.PR.Q Nat Bk s28 or Natl Bk s28 Series 30 NA.PR.S Nat Bk s30 or Natl Bk s30 Series 32 NA.PR.W Nat Bk s32 or Natl Bk s32
Number of Registered Shareholders
As at October 31, 2014, there were 22,394 common shareholders recorded in the Bank’s common share register.
Dividends
Dividend Dates in 2015 (subject to approval by the Board of Directors of the Bank) Ex-dividend date Record date Payment date
Common shares December 23, 2014 December 29, 2014 February 1, 2015 March 26, 2015 March 30, 2015 May 1, 2015 June 18, 2015 June 22, 2015 August 1, 2015 September 24, 2015 September 28, 2015 November 1, 2015 Preferred shares, Series 20, 28, 30 and 32 January 8, 2015 January 12, 2015 February 15, 2015 April 9, 2015 April 13, 2015 May 15, 2015 July 2, 2015 July 6, 2015 August 15, 2015 October 8, 2015 October 13, 2015 November 15, 2015
Dividends Declared on Common Shares During Fiscal 2014
Ex-dividend date Record date Payment date Dividend per
share ($)
December 23, 2013 December 27, 2013 February 1, 2014 0.46 March 25, 2014 March 27, 2014 May 1, 2014 0.46 June 24, 2014 June 26, 2014 August 1, 2014 0.48 September 23, 2014 September 25, 2014 November 1, 2014 0.48
Dividends Declared on Preferred Shares During Fiscal 2014 Dividend per share ($)Ex-dividend date
Record date
Payment date
Series 16(1)
Series 20
Series 24
Series26
Series28
Series30
Series32
Jan. 8, 14 Jan. 10, 14 Feb. 15, 14 0.303125 0.375 0.4125 0.4125 0.2603
Apr. 9, 14 Apr. 11, 14 May 15, 14 0.303125 0.375 0.2375 0.2724
Jul. 9, 14 Jul. 11, 14 Aug. 15, 14 0.303125 0.375 0.2375 0.2563
Oct. 8, 14 Oct. 10, 14 Nov. 15, 14 0.303125 0.375 0.2375 0.2562
(1) On November 15, 2014, the Bank redeemed all the issued and outstanding non-cumulative Series 16 First Preferred Shares.
Dividends paid are “eligible dividends” in accordance with the Income Tax Act (Canada).
Dividend Reinvestment and Share Purchase Plan
National Bank has a Dividend Reinvestment and Share Purchase Plan for Canadian holders of its common and preferred shares under which they can acquire common shares of the Bank without paying commissions or administration fees. Canadian participants acquire common shares through the reinvestment of cash dividends paid on the shares they hold or through optional cash payments of at least $500 per payment, up to a maximum of $5,000 per quarter. For additional information, shareholders may contact National Bank’s registrar and transfer agent, Computershare Trust Company of Canada, at 1-888-838-1407. To participate in the plan, National Bank’s beneficial or non-registered common shareholders must contact their financial institution or broker. Direct Deposit Shareholders may elect to have their dividend payments deposited directly via electronic funds transfer to their bank account at any financial institution that is a member of the Canadian Payments Association. To do so, they must send a written request to the Transfer Agent, Computershare Trust Company of Canada.

AT A GLANCE
National Bank of Canada is an integrated provider of financial services to retail, commercial, corporate and institutional clients. It operates in three business segments—Personal and Commercial, Wealth Management and Financial Markets—with total assets in excess of $205 billion as at October 31, 2014. Through its nearly 20,000 employees, National Bank offers a complete range of services: banking and investment solutions, securities brokerage, insurance and wealth management. National Bank is the leading bank in Quebec and the partner of choice for small and medium-sized enterprises. It is also the sixth largest bank in Canada with branches in almost every province. Clients in the United States, Europe and other parts of the world are served through a network of representative offices, subsidiaries and partnerships. Its head office is located in Montreal and its securities are listed on the Toronto Stock Exchange.
2 Message From the President and Chief Executive Officer 5 Message From the Chairman of the Board 6 Governance Architecture 7 Key Responsibilities of Committees 8 Board of Directors 9 Office of the President 10 Risk Disclosures 11 Management’s Discussion and Analysis 105 Audited Consolidated Financial Statements 200 Statistical Review 202 Glossary of Financial Terms
AT A GLANCE
National Bank of Canada is an integrated provider of financial services to retail, commercial, corporate and institutional clients. It operates in three business segments—Personal and Commercial, Wealth Management and Financial Markets—with total assets in excess of $205 billion as at October 31, 2014. Through its nearly 20,000 employees, National Bank offers a complete range of services: banking and investment solutions, securities brokerage, insurance and wealth management. National Bank is the leading bank in Quebec and the partner of choice for small and medium-sized enterprises. It is also the sixth largest bank in Canada with branches in almost every province. Clients in the United States, Europe and other parts of the world are served through a network of representative offices, subsidiaries and partnerships. Its head office is located in Montreal and its securities are listed on the Toronto Stock Exchange.
2 Message From the President and Chief Executive Officer 5 Message From the Chairman of the Board 6 Governance Architecture 7 Key Responsibilities of Committees 8 Board of Directors 9 Office of the President 10 Risk Disclosures 11 Management’s Discussion and Analysis 105 Audited Consolidated Financial Statements 200 Statistical Review 202 Glossary of Financial Terms 204 Information for Shareholders
Head Office National Bank of Canada National Bank Tower 600 De La Gauchetière Street West, 4th Floor Montreal, Quebec H3B 4L2 Canada
Telephone: 514-394-5000 Website: nbc.ca Annual Meeting The Annual Meeting of Holders of Common Shares of the Bank will be held on Wednesday, April 15, 2015, at the Drummondville Expocenter, in Drummondville, Quebec, Canada. Public Accountability Statement The 2014 Social Responsibility Report will be available in March 2015 on the Bank’s website at nbc.ca. Communication with Shareholders For information about stock transfers, address changes, dividends, lost certificates, tax forms and estate transfers, shareholders of record may contact the Transfer Agent at the following address: Computershare Trust Company of Canada Share Ownership Management 1500 University Street, 7th Floor Montreal, Quebec H3A 3S8 Canada
Telephone: 1-888-838-1407 Fax: 1-888-453-0330 E-mail: [email protected] Website: computershare.com Shareholders whose shares are held by a market intermediary are asked to contact the market intermediary concerned. Other shareholder inquiries can be addressed to: Investor Relations National Bank of Canada National Bank Tower 600 De La Gauchetière Street West, 7th Floor Montreal, Quebec H3B 4L2 Canada
Telephone: 1-866-517-5455 Fax: 514-394-6196 E-mail: [email protected] Website: nbc.ca/investorrelations
Caution Regarding Forward-Looking Statements From time to time, National Bank of Canada makes written and oral forward-looking statements included in this Annual Report, in other filings with Canadian regulators, in reports to shareholders, in press releases and in other communications. All such statements are made pursuant to the Canadian and American securities legislation and the provisions of the United States Private Securities Litigation Reform Act of 1995.
Additional information about these statements can be found on page 11 of this Annual Report. Trademarks The trademarks used in this report include National Bank of Canada, Private Wealth 1859, One client, one bank, CashPerformer, NBC CapS, NBC CapS II, NBC Asset Trust, NBC Capital Trust, Altamira, and National Bank Correspondent Network and their respective logos, which are trademarks of National Bank of Canada used under licence by National Bank of Canada or its subsidiaries. All other trademarks mentioned in this report, which are not the property of National Bank of Canada, are owned by their respective holders. Pour obtenir une version française du Rapport annuel, veuillez vous adresser à : Relations avec les investisseurs Banque Nationale du Canada 600, rue De La Gauchetière Ouest, 7e étage Montréal (Québec) H3B 4L2 Canada
Téléphone : 1 866 517-5455 Télécopieur : 514 394-6196 Adresse électronique : [email protected] Legal Deposit ISBN 978-2-921835-43-5 Legal deposit – Bibliothèque et Archives nationales du Québec, 2014 Legal deposit – Library and Archives Canada, 2014 Printing L’Empreinte National Bank of Canada is proud to help save the environment by using EcoLogo and Forest Stewardship Council® (FSC®) certified paper.
National Bank of Canada is proud to help save the environment by using EcoLogo and Forest Stewardship Council® (FSC®) certified paper.

CYAN MAGENTA YELLOW BLACKD108009A_Couverture_RapportAnnuel_14_En LBBanque Nationale (100205820) PAGE 121/11/14 ÉPREUVE 4
Rédaction Directeur de création
Directionartistique
Service à la clientèle
Client Réalisateur Correction d’épreuves
InDesign CS5 CS4
Typo vérifiée Photos vérifiées R.‑C.
CD/DVD FTP
Date : 00.00.10
Commentaires
ATTENTIONLe « trapping » est à faire par
l’imprimeur selon ses propres specs.
17,3125" x 10,9375" Fermé 8,5" x 10,9375
Montage à 100 % du format final Épreuve à 100 % du montage Impression finale à 100 %
E V E R Y T H I N GS TA R T S
W I T H A N I D E A
2 0 1 4
A N N U A L
R E P O R T
A G R A V I T Y - D E F Y I N G I D E AS K Y V E N T U R E : A G R O W I N G F R E E F A L L S I M U L AT I O N C O M P A N YA N a t i o n a l B a n k C l i e n t
20
14
AN
NU
AL
RE
PO
RT
EVERYTHING STARTS WITH AN IDEA
Big or small.Unexpectedly, it strikes us.But decidedly, we transform it.Into a project, a challenge, an adventure, a source of pride. Let’s go for it. Let’s make progress.Innovate.Implement.Empower.
Powering your ideas
Powering your ideas