evidence and guidelines technology 2016 - mcgill...
TRANSCRIPT

Evidence and Guidelines TECHNOLOGY 2016
Tina Kader, MDStaff endocrinologist
Jewish General Hospital
Certified Diabetes Educator
Montreal, Quebec

CGM=continuous glucose monitoring; SMBG=self-monitoring of blood glucoseHandelsman Y, et al. Endocrine Practice. 2015;21(suppl 1):1-87.
A1c measurement• 2 or more times each year in all individuals with diabetes
• 4 or more times each year in individuals not at target
All patients using insulin should perform SMBG• Minimum twice daily• Ideally, before any insulin injection
• More frequent checks after meals or middle of the night may be required for patients with frequent hypoglycemia
Consider CGM for patients with T1D and T2D on basal-bolus therapy• Improve A1c levels• Reduce hypoglycemia
AACE/ACE 2015 GuidelinesGlucose Monitoring: When, How, and In Whom?

Faculty/Presenter Disclosure
Faculty/Presenter: tina kader
Relationships with commercial interests:
Grants/research support: BI; Sanofi
Speaker’s bureau/honoraria:eli lilly sanofi; medtronic; novonordisk;merck
BMS; Astraxeneca;Jansen; Takeda
Consulting fees: eli lilly sanofi; medtronic; novonordisk;merck
Other: [insert company/organization name(s) here]

DIABETES AND TECHNOLOGY
• CANADIAN GUIDELINES FOR CBGM
• HOW ACCURATE ARE OUR CURRENT TOOLS
• CASE PRESENTATION
• WHAT IS AGP; COMING TO YOU SOON
• WHAT TECHNOLOGY IS HERE AND WHAT IS
COMING

DIABETES AND TECHNOLOGY
• CANADIAN GUIDELINES FOR CBGM
• HOW ACCURATE ARE OUR CURRENT TOOLS
• CASE PRESENTATION
• WHAT IS AGP; COMING TO YOU SOON
• WHAT TECHNOLOGY IS HERE AND WHAT IS
COMING
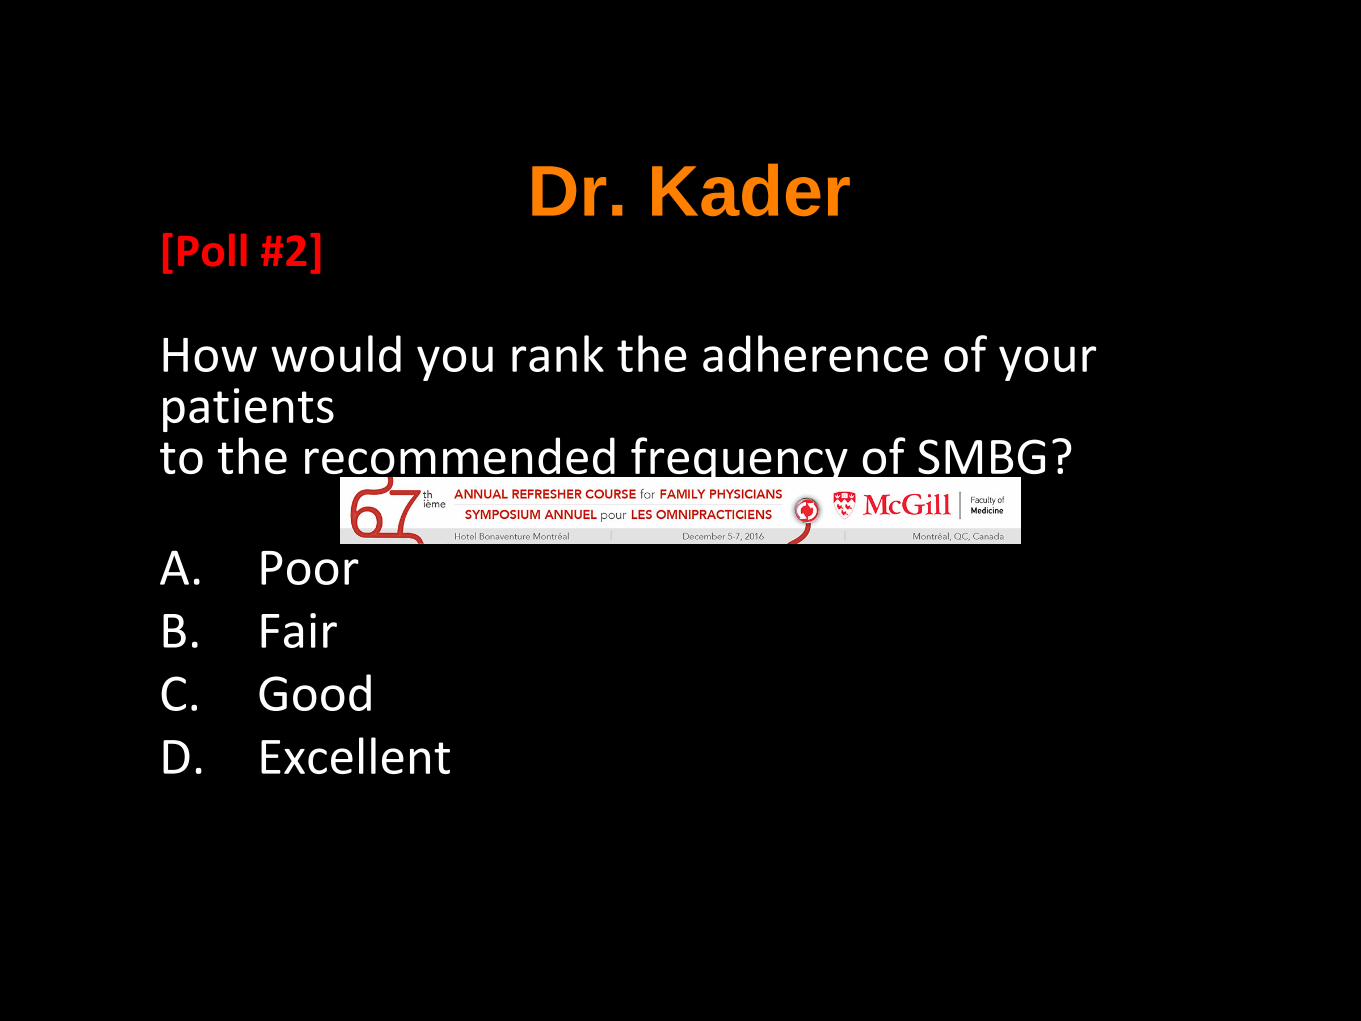
[Poll #2]
How would you rank the adherence of your patients to the recommended frequency of SMBG?
A. PoorB. FairC. GoodD. Excellent
Dr. Kader

Is treated only with lifestyle AND is meeting glycemic targets
Has pre-diabetes
C. DAILY SMBG IS NOT USUALLY REQUIRED if the person with
diabetes:
Daily SMBG is not usually required if:
guidelines.diabetes.ca | 1-800-BANTING (226-8464) | diabetes.caCopyright © 2013 Canadian Diabetes Association
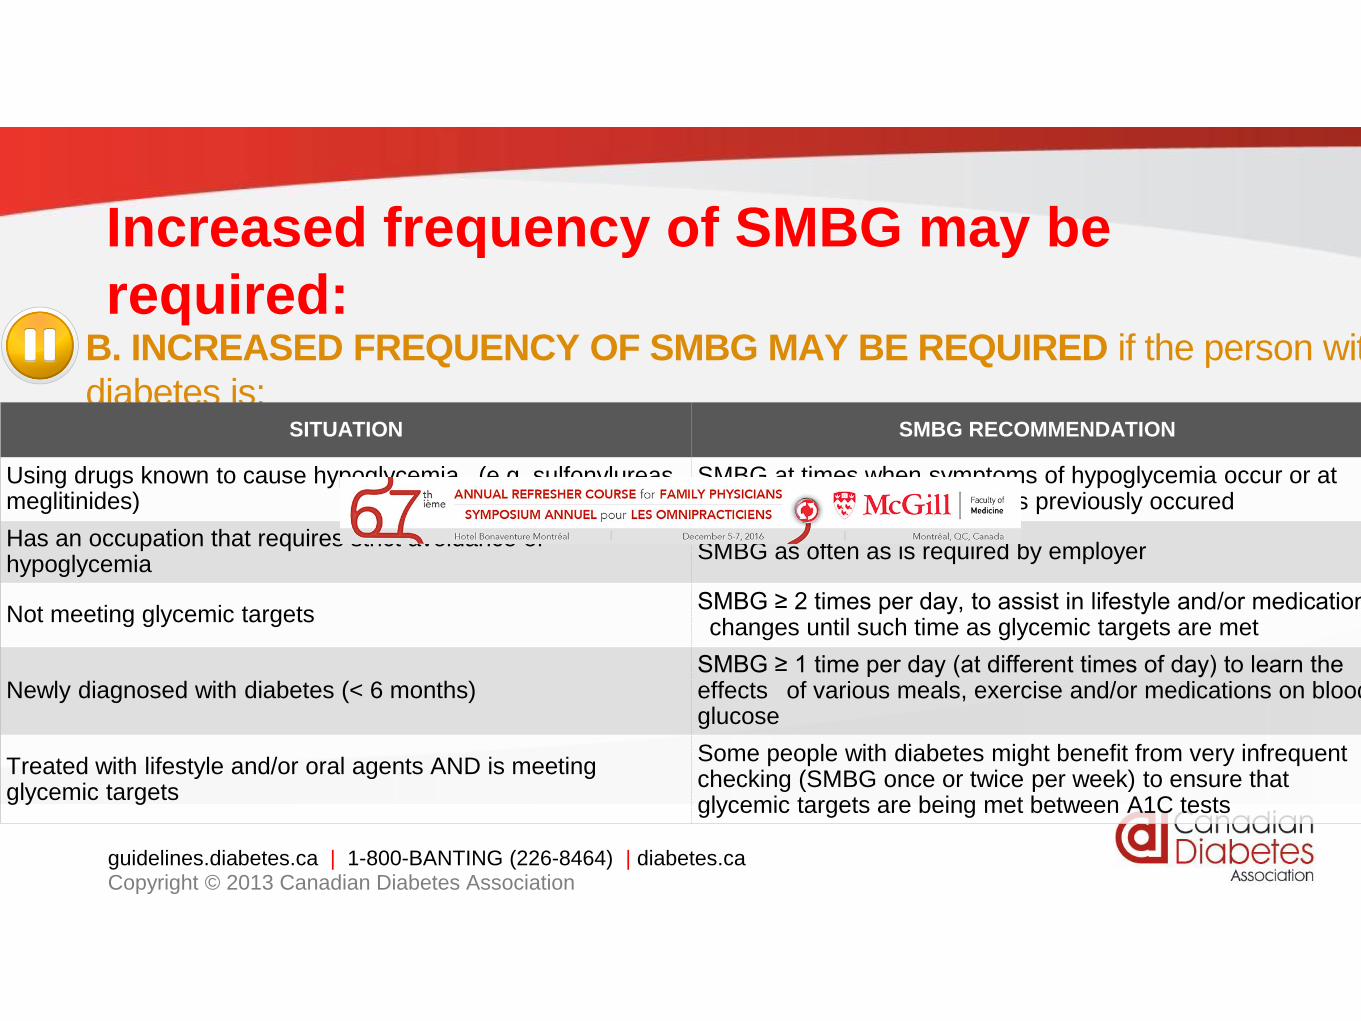
Increased frequency of SMBG may be
required:
guidelines.diabetes.ca | 1-800-BANTING (226-8464) | diabetes.caCopyright © 2013 Canadian Diabetes Association
B. INCREASED FREQUENCY OF SMBG MAY BE REQUIRED if the person with
diabetes is: SITUATION SMBG RECOMMENDATION
Using drugs known to cause hypoglycemia (e.g. sulfonylureas, meglitinides)
SMBG at times when symptoms of hypoglycemia occur or at times when hypoglycemia has previously occured
Has an occupation that requires strict avoidance of hypoglycemia
SMBG as often as is required by employer
Not meeting glycemic targetsSMBG ≥ 2 times per day, to assist in lifestyle and/or medication changes until such time as glycemic targets are met
Newly diagnosed with diabetes (< 6 months)SMBG ≥ 1 time per day (at different times of day) to learn the effects of various meals, exercise and/or medications on blood glucose
Treated with lifestyle and/or oral agents AND is meeting glycemic targets
Some people with diabetes might benefit from very infrequent checking (SMBG once or twice per week) to ensure that glycemic targets are being met between A1C tests

Regular SMBG is required:
guidelines.diabetes.ca | 1-800-BANTING (226-8464) | diabetes.caCopyright © 2013 Canadian Diabetes Association
A. REGULAR SMBG IS REQUIRED if the person with diabetes is:
SITUATION SMBG RECOMMENDATION
Using multiple daily injections of insulin (≥ 4 times per day) SMBG ≥ 4 times per day (see page 2 – QID – [basal-
bolus/MDI])Using an insulin pump
Using insulin < 4 times per daySMBG at least as often as insulin is being given (see page 2 – premixed or basal insulin only)
Pregnant (or planning a pregnancy), whether using insulin or not SMBG individualized and may involve SMBG ≥ 4
times per dayHospitalized or acutely ill
Starting a new medication known to cause hyperglycemia (e.g. steroids) SMBG individualized and may involve SMBG ≥ 2
times per dayExperiencing an illness known to cause hyperglycemia (e.g. infection)

• SMBG accompanied by structured educational program
to facilitate behaviour change results in improved outcomes
• Teach patients
1. How and when to perform SMBG
2. How to record the results
3. Meaning of various BG levels
4. How behaviour and actions affect SMBG results
1.Parkin CG et al. J Diabetes Sci Technol. 2009;3:500-508.
2.Polonsky WH, et al. Diabetes Care. 2011;34:262-267.guidelines.diabetes.ca | 1-800-BANTING (226-8464) | diabetes.caCopyright © 2013 Canadian Diabetes Association
Monitoring with Meaning …

DIABETES AND TECHNOLOGY
• CANADIAN GUIDELINES FOR CBGM
• HOW ACCURATE ARE OUR CURRENT TOOLS
• CASE PRESENTATION
• WHAT IS AGP; COMING TO YOU SOON
• WHAT TECHNOLOGY IS HERE AND WHAT IS
COMING

Kildegaard J, et al: JDST 2009, 3(4):986-991.
Causes of glucose variability
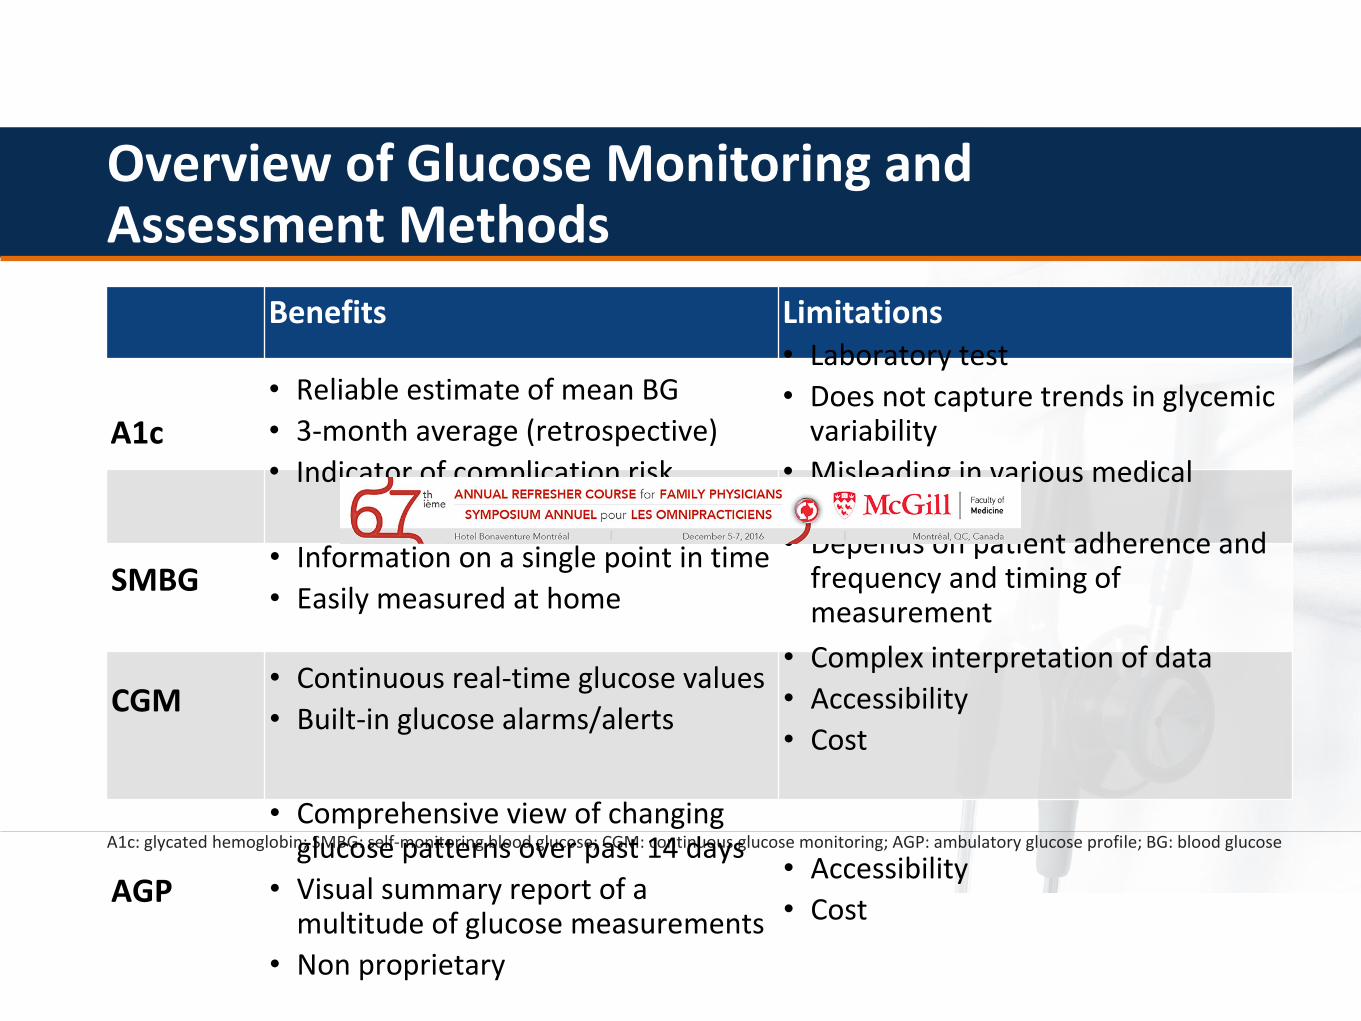
A1c: glycated hemoglobin; SMBG: self-monitoring blood glucose; CGM: continuous glucose monitoring; AGP: ambulatory glucose profile; BG: blood glucose
Benefits Limitations
Overview of Glucose Monitoring and Assessment Methods
A1c
• Reliable estimate of mean BG
• 3-month average (retrospective)
• Indicator of complication risk
• Laboratory test
• Does not capture trends in glycemic variability
• Misleading in various medical conditions
AGP
• Comprehensive view of changing glucose patterns over past 14 days
• Visual summary report of a multitude of glucose measurements
• Non proprietary
• Accessibility
• Cost
SMBG• Information on a single point in time
• Easily measured at home
• Depends on patient adherence and frequency and timing of measurement
CGM• Continuous real-time glucose values
• Built-in glucose alarms/alerts
• Complex interpretation of data
• Accessibility
• Cost

Patient A: A1c 7.0%
8 AM 8 AM8 PM2 PM 2 AM
Checks qAM (fasting)What if he checked more often?
Patient B: A1c 7.0%
8 AM 8 AM8 PM2 PM 2 AM
Checks 4x/dWhat if he checked more often?
More frequent SMBG gives you a more complete picture
6.0
8.0
10.0
Glu
cose
(m
mo
l/L)
6.0
8.0
10.0
A1c in Combination with SMBG

Glucose VARIABILITY and Hypoglycemia
• Increasing glycemic variability is correlated with more
frequent episodes of hypoglycemia1-3:
– Reduced peaks and troughs, should result in a lower likelihood
of patients slipping below their target range.
– Less time below target means less risk of hypoglycemia.
– Reduced glucose variability and flux, will reduce the risk of
HbA1c-independent mortality and morbidity.
1. Monnier L et al: Diabetes Technol Ther 2011, 13:813–818 2. Qu Y et al: Diabetes Technol Ther 2012, 14:1008–1012. 3. Catherine Gorst et al; Diabetes Care 2015, 10:2337dc15-1188

How frequently do you recommend obtaining information from CGM in your insulin-treated patients with T2D?
A. RarelyB. SometimesC. OftenD. RoutinelyE. never

DIABETES AND TECHNOLOGY
• CANADIAN GUIDELINES FOR CBGM
• HOW ACCURATE ARE OUR CURRENT TOOLS
• CASE PRESENTATION
• WHAT IS AGP; COMING TO YOU SOON
• WHAT TECHNOLOGY IS HERE AND WHAT IS
COMING

Mr. Cross – Type 1 diabetes
• Age 48
• Diagnosed at age 6
• Labile glycemia for years
• DKA; seizures
• Multiple admissions
CURRENT MEDICATIONS
• Insulin lispro via CSII (insulin pump)• Basal rates 0.35-0.7 U/hr
• Boluses 1U/7g to 1U/11g; ISF = 2.8 to 3.4
• Rosuvastatin 10 mg QD
• Perindopril 2 mg QD
LABS• A1c 7.2%
• FPG 6.8 mmol/L
• LDL-C 1.8 mmol/L
• ACR 2.5 mg/mmoL
• eGFR >60 ml/min

Data Sources: Paradigm Veo - 554 (813483)
CarbohydrateRatio(g/U)
Insulin Sensitivity(mmol/L per U)
Blood GlucoseTarget(mmol/L)
Mr. Cross – CGM ReportBasal
Maximum BasalRate
2.00 U/hr
Temp Basal TypePercent of Basal
BolusMaximum Basal Rate10.0 U
Dual/Square (Variable) On
Blood Glucose Reminder Off24-Hour
Total12.625 U 24-HourTotal--
24-HourTotal--
PatternA
PatternB
Standard(active)
TIMEU/hr
0:000.700
3:000.650
7:000.550
10:000.475
12:000.525
15:000.350
20:000.500
TIMEU/hr
----
TIMEU/hr
----
TIMERatio
0:009.0
6:0011.0
11:009.0
18:007.0
TIMESensivity
0:002.8
4:003.4
12:003.4
18:003.0
22:002.8
TIMELow High
0:005.5 7.0
6:005.0 6.5
23:005.5 7.0
Easy (Audio) BolusOff
Entry (Step)0.10 U
Bolus WizardOn
Unitsg, mmol/L
Active Insulin Time (h:mm)4:00
Insuline Concentration --
Missed Bolus
ReminderOff
Start(h:mm)
End (h:mm)
----
SensorSensorOn
Transmitter ID2268733
BG UnitsMmol/LGlucose AlertsOn
TIME Low (mmol/L) High (mmol/L)
0:00 4.5 10.5
Alert Repeat 0:30 2:00Predictive Alert On
Low | High (mins) 15 15
Rate Alert: Fall Rise (mmol/L/min) 0.200 0.200
AUC Limit: Low | High (mmol/L) 3.9 10.0
Missed Data/Weak Signal (h:mm)0.30
Graph Timeout (h:mm)0.02
Auto Calibration Off
Calibration Reminder (h:mm)1:00
Calibration (Alert) Repeat (h:mm)1:00
UtilitiesAlert TypeVibrate
Low Suspend (mmol/L)3.3
Low Reservoir Warning Insulin Units
Amount 20 U
• Show different settings, e.g., basal rates on exercise or work days, I:C ratios, ISF and pump settings
• 3 SETTINGS
• BASAL RATE
• CARB RATIO
• INSULIN SENSITIVITY
INSULIN PUMP 101
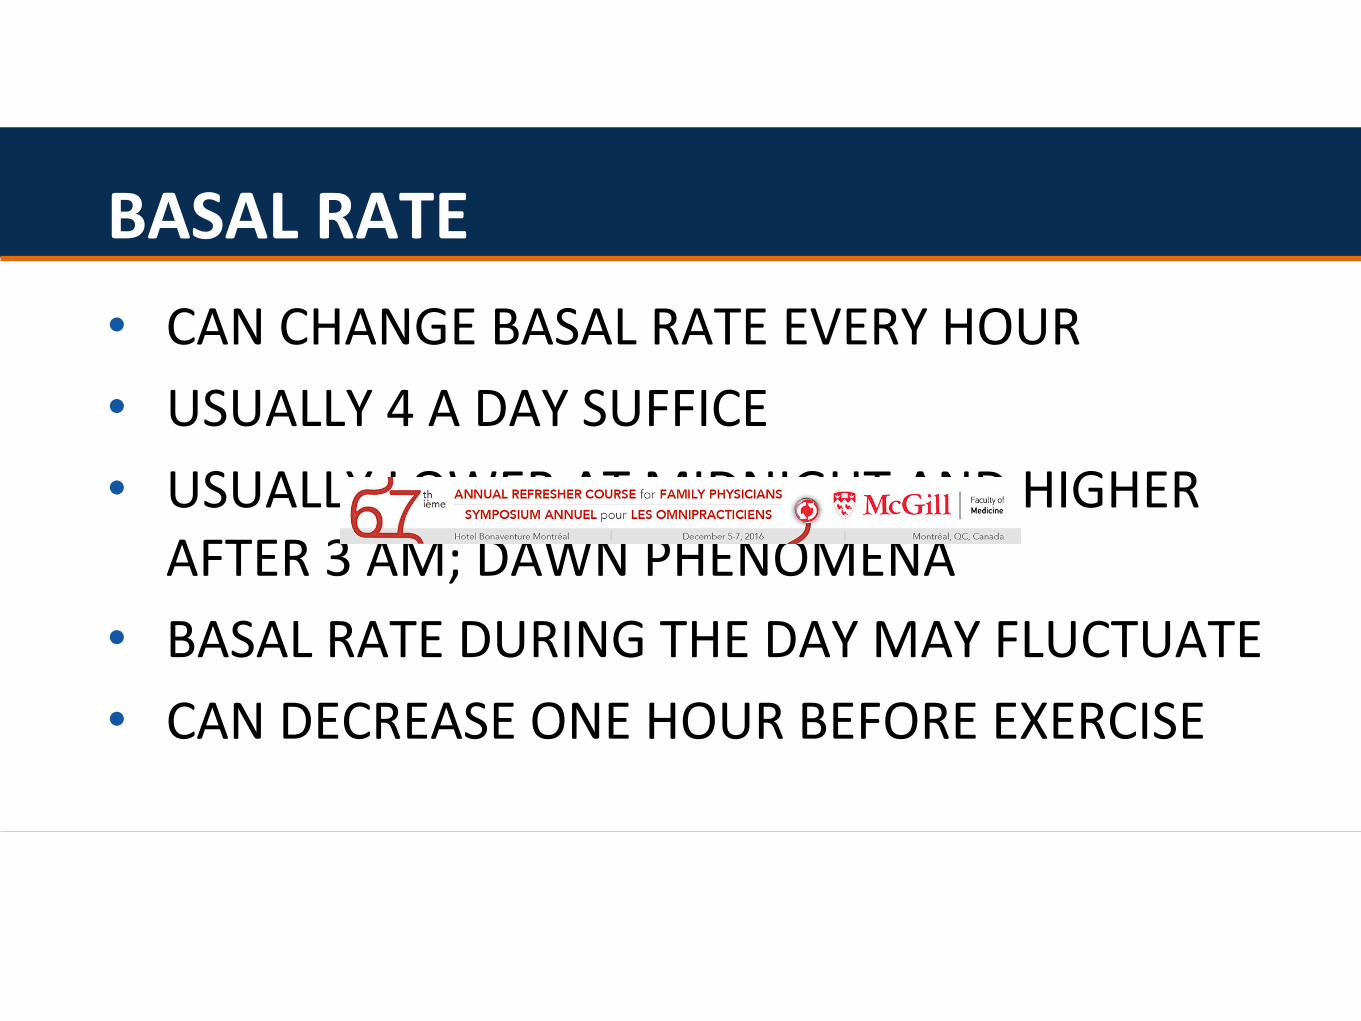
• CAN CHANGE BASAL RATE EVERY HOUR
• USUALLY 4 A DAY SUFFICE
• USUALLY LOWER AT MIDNIGHT AND HIGHER AFTER 3 AM; DAWN PHENOMENA
• BASAL RATE DURING THE DAY MAY FLUCTUATE
• CAN DECREASE ONE HOUR BEFORE EXERCISE
BASAL RATE

• ONE UNIT FOR ? CARBS
• START IS ONE UNIT FOR 10 GRAMS
• SOME NEED LESS; IE LEAN ACTIVE
• 1 UNIT FOR 20
• OBESE 1 UNIT FOR 5
• SO IF 1/5 IF EATS 40 GRAM ; 40/5 = 8
INSULIN CARB RATIO

• SLIDING SCALE
• USUALLY 2 TO 3
• IE 1 UNIT WILL DROP SUGAR BY 2 MMOL
• IF TARGET IS 8; SUGAR IS 16
• 16-8 OVER 2; 4 UNITS EXTRA IS GIVEN
INSULIN SENSITIVITY

Indications for CSII
• Poor control despite MDI
• Frequent hypoglycemia
• Dawn phenomenon
• Shift work
• Athletic; work benefit
• Lifestyle choice or personal preference
Bruttomesso D, et al. Diabetes Metab Res Rev 2009;25:99-111.
Lassmann-Vague V, et al. Diabetes Metab 2010;36:79-85.
CSII: continuous subcutaneous insulin infusion;
MDI: multiple daily insulin injections

Contraindications or
“Cautions” for CSII
• Lack of motivation
• Psychiatric issues
• Little or no self-monitoring of blood glucose
• Active proliferative retinopathy
• Magnetic fields in environment
• Frequent DKA
CSII: continuous subcutaneous insulin infusion
DKA: diabetic ketoacidosis
Bruttomesso D, et al. Diabetes Metab Res Rev 2009;25:99-111.
Lassmann-Vague V, et al. Diabetes Metab 2010;36:79-85.
Data Sources: Paradigm Veo - 554 (813483)
Sensor trace
Interrupted
Average
Bedtime toWake-up
Breakfast: 6:00 AM -10:00 AM
Meals Analyzed: 14
Lunch: 11:00 AM -3:00 PM
Meals Analyzed: 8
Dinner: 4:00 PM -10:00 PM
Meals Analyzed: 26Bedtime: 8:00 PM -12:00 AM
Wake-up: 5:00 AM -9:00 AM
Avg Carbs: 34g
Avg Insulin: 3.1U
Avg Carbs/Insulin:11.2g/U
Avg Carbs: 26g
Avg Insulin: 2.7U
Avg Carbs/Insulin:9.7g/U
Avg Carbs: 24g
Avg Insulin: 3.3U
Avg Carbs/Insulin:7.3g/U
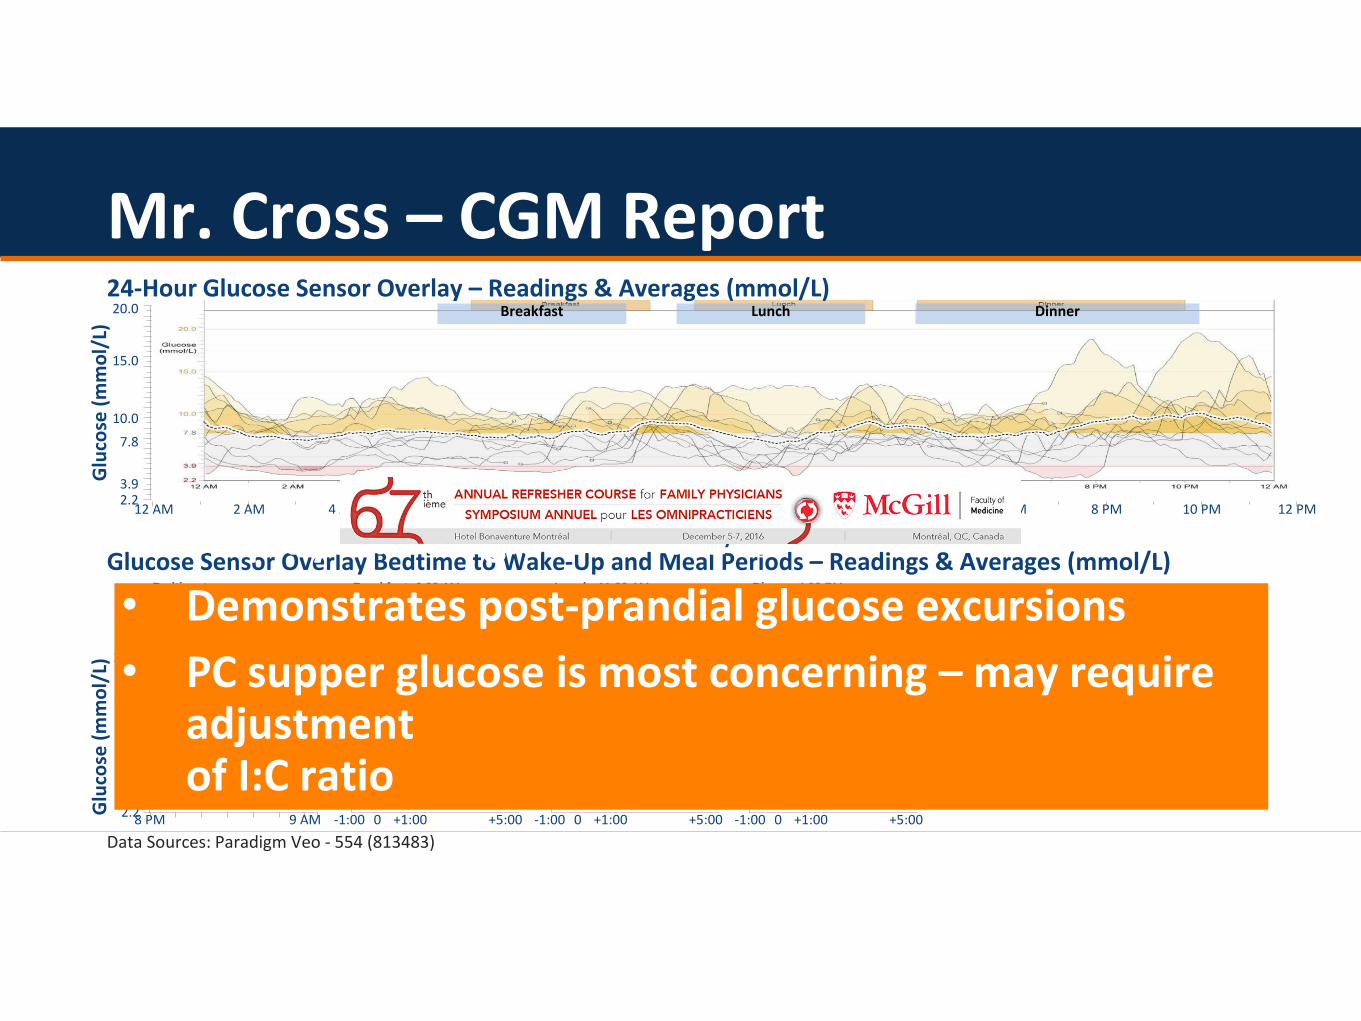
Glucose Sensor Overlay Bedtime to Wake-Up and Meal Periods – Readings & Averages (mmol/L)
Mr. Cross – CGM Report
Glu
cose
(m
mo
l/L)
15.0
20.0
2.23.9
7.8
10.0
12 AM 2 AM 4 AM 6 AM 8 AM 10 AM 12 PM 2 PM 4 PM 6 PM 8 PM 10 PM 12 PM
Breakfast Lunch Dinner24-Hour Glucose Sensor Overlay – Readings & Averages (mmol/L)
Glu
cose
(m
mo
l/L)
15.0
20.0
2.23.9
7.8
10.0
8 PM 9 AM -1:00 0 +1:00 +5:00 -1:00 0 +1:00 +5:00 -1:00 0 +1:00 +5:00
Time of day
0 = Time of meal
• Displays mean glucose values
• Demonstrates post-prandial glucose excursions
• PC supper glucose is most concerning – may require adjustment of I:C ratio

Sensor trace
BG reading
Basal
Bolus
Suspend
Low Suspend
Time change
Injected insulin (U)
Exercise
Other
Interrupted Off chart
Temp basal
12 AM 6 AM 6 PM 6 AM 6 PM12 PM 12 AM 12 PM 12 AM 6 AM 6 PM 6 AM 6 PM12 PM 12 AM 12 PM 12 AM 6 AM 6 PM12 PM 12 AM
Saturday 10/11 Sunday 10/12 Monday 10/13 Tuesday 10/14
013
15
63
2.2
3.9
7.8
10.0
15.0
20.0
(g)
Insulin(U/hr)
Carbs
Glucose
(mmol/L)
013
15
63
2.2
3.9
7.8
10.0
15.0
20.0
(g)
Insulin(U/hr)
Carbs
Glucose
(mmol/L)
013
15
63
2.2
3.9
7.8
10.0
15.0
20.0
(g)
Insulin(U/hr)
Carbs
Glucose
(mmol/L)
Mr. Cross – CGM ReportBreakf
astLunch Dinner
Data Sources: Paradigm Veo - 554 (813483)
Breakfast
Lunch Dinner Breakfast
Lunch Dinner Breakfast
Lunch Dinner Breakfast
Lunch Dinner
Monday 10/6 Tuesday 10/7 Wednesday 10/8 Thursday 10/9 Friday 10/10
Wednesday 10/1 Thursday 10/2 Friday 10/3 Saturday 10/4 Sunday 10/5
• Useful patient teaching tool
• Displays basal, bolus, carbs and daily fluctuations
• E.g., October 6 demonstrates over- treatment of hypoglycemia in the evening
4.2
3.2
Data Sources: Paradigm Veo - 554 (813483)
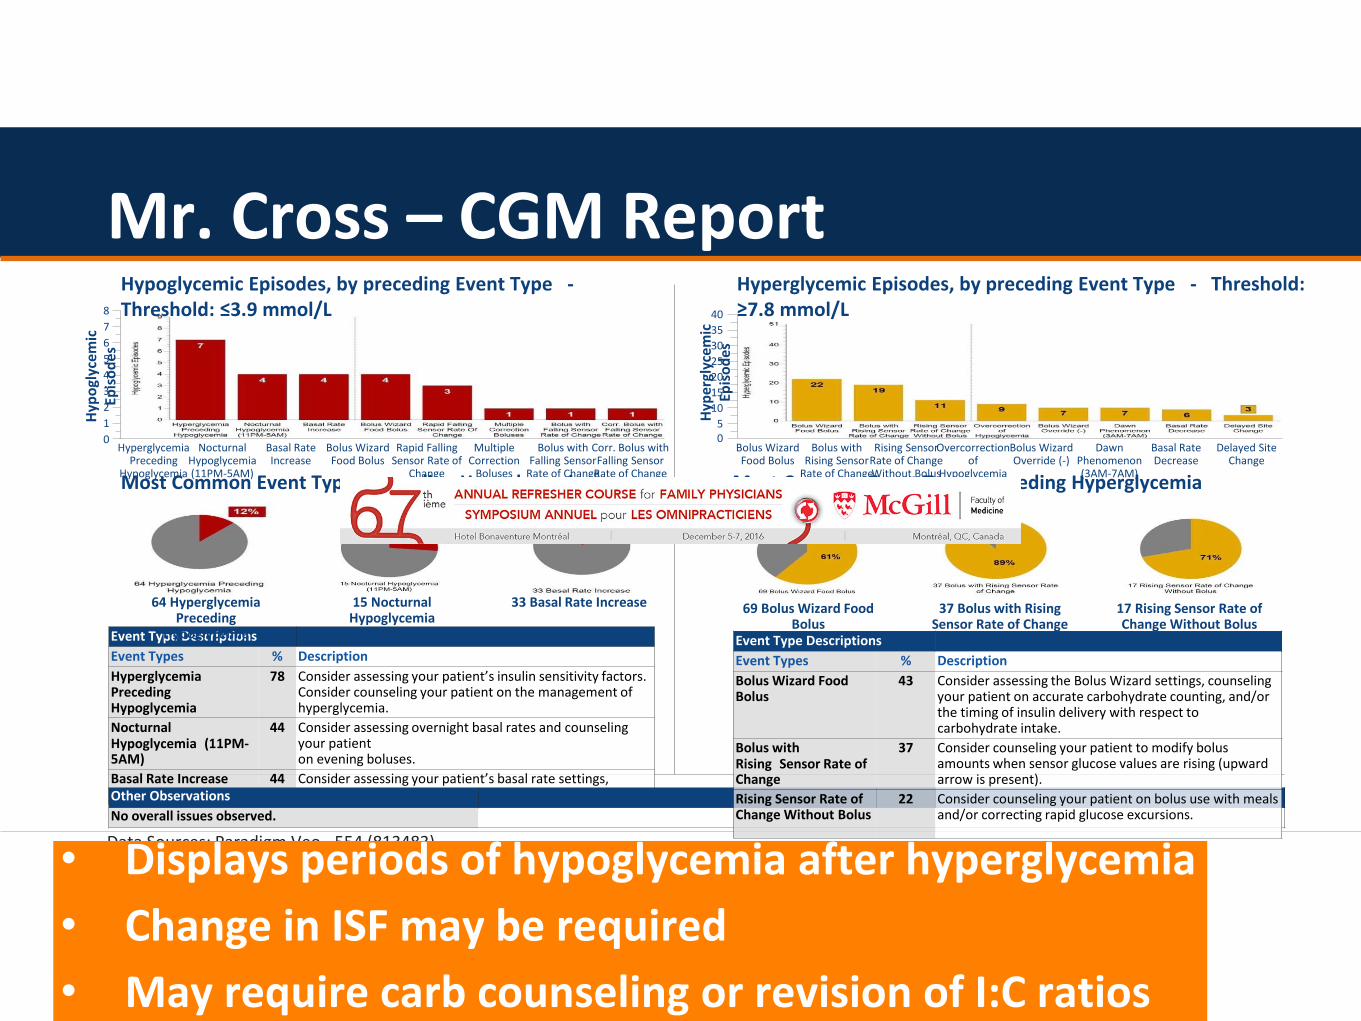
Hypoglycemic Episodes, by preceding Event Type -Threshold: ≤3.9 mmol/L
Hyperglycemic Episodes, by preceding Event Type - Threshold: ≥7.8 mmol/L
Most Common Event Types preceding Hypoglycemia Most Common Event Types preceding Hyperglycemia
Hyp
ogl
ycem
ic
Epis
od
es
8
7
6
5
4
3
2
1
0
Event Type Descriptions
Event Types % Description
Hyperglycemia Preceding Hypoglycemia
78 Consider assessing your patient’s insulin sensitivity factors. Consider counseling your patient on the management of hyperglycemia.
Nocturnal Hypoglycemia (11PM-5AM)
44 Consider assessing overnight basal rates and counseling your patienton evening boluses.
Basal Rate Increase 44 Consider assessing your patient’s basal rate settings, including temporary basal rates.Other Observations
No overall issues observed.
Event Type Descriptions
Event Types % Description
Bolus Wizard Food Bolus
43 Consider assessing the Bolus Wizard settings, counseling your patient on accurate carbohydrate counting, and/or the timing of insulin delivery with respect to carbohydrate intake.
Bolus with Rising Sensor Rate of Change
37 Consider counseling your patient to modify bolus amounts when sensor glucose values are rising (upward arrow is present).
Rising Sensor Rate of Change Without Bolus
22 Consider counseling your patient on bolus use with meals and/or correcting rapid glucose excursions.
Hyp
ergl
yce
mic
Ep
iso
des
40
35
30
25
20
15
10
50
Mr. Cross – CGM Report
HyperglycemiaPreceding
Hypoglycemia
NocturnalHypoglycemia(11PM-5AM)
Basal RateIncrease
Bolus WizardFood Bolus
Rapid FallingSensor Rate of
Change
MultipleCorrection
Boluses
Bolus withFalling Sensor
Rate of Change
Corr. Bolus withFalling Sensor
Rate of Change
Bolus WizardFood Bolus
Bolus withRising Sensor
Rate of Change
Rising SensorRate of ChangeWithout Bolus
Overcorrectionof
Hypoglycemia
Bolus WizardOverride (-)
DawnPhenomenon(3AM-7AM)
Basal RateDecrease
Delayed SiteChange
64 Hyperglycemia Preceding
Hypoglycemia
15 Nocturnal Hypoglycemia(11PM-5AM)
33 Basal Rate Increase 69 Bolus Wizard Food Bolus
37 Bolus with Rising Sensor Rate of Change
17 Rising Sensor Rate of Change Without Bolus
• Displays periods of hypoglycemia after hyperglycemia
• Change in ISF may be required
• May require carb counseling or revision of I:C ratios

Mr. Cross – AGP Report
00:00
2:00 4:00 6:00 8:00 10:00
12:00
14:00
16:00
18:00
20:00
22:00
00:00
15
20
10
Targ
et
Ran
ge
Glu
cose
(m
mo
l/L)
Time of day
10
4.45
0
Reminder: AGP is a single report with comprehensive view of changing data over 14
Glucose values are widely spread indicating glucose
variability
Median curve rises after
lunch
Median curve is moving up and
down, indicating glucose variability
Lowest glucose readings are between
2:00am-8:00am

CURRENT MEDICATIONS
• Insulin glargine 40 qhs
• Insulin aspart 1 U/10 gac meals; ISF=2
• Atorvastatin 20 mg QD
• Ramipril 10 mg QD
LABS• A1c 8.8%
• FPG 12.6 mmol/L
• LDL-C 2.0 mmol/L
• ACR 1.1 mg/mmol
• eGFR 55 ml/min
Mr. Smith – Type 2 Diabetes
• 58 years old
• T2D x 15 yrs
• Poor glycemic control for years
– Neuropathy
– Retinopathy
– Exam normal except for reduced monofilament
• Variable adherence to SMBG
• Aware of carb counting and prandial insulin adjustments

Current insulin regimen: glargine 40 qhs, aspart 1 U/10 g ac meals; ISF=2
Mr. Smith - SMBG Logbook
Pre Breakfast
Pre Lunch Pre Supper Bed Notes
Mon 9.6 6.1hypo at
night
Tues
Wed 3.1 10.2
Thur
Fri 8.8 15.3hypo at
night
Sat
Sun 5.1 7.2

What would you recommend for Mr. Smith?
a. Increase insulin glargineb. Ask Mr. Smith to increase frequency of SMBG for
more informationc. Initiate CGM for more glucose informationd. Obtain an AGP for more glucose informatione. Other

DIABETES AND TECHNOLOGY
• CANADIAN GUIDELINES FOR CBGM
• HOW ACCURATE ARE OUR CURRENT TOOLS
• CASE PRESENTATION
• WHAT IS AGP; COMING TO YOU SOON
• WHAT TECHNOLOGY IS HERE AND WHAT IS
COMING

CGM: continuous glucose monitoring; AGP: ambulatory glucose profile
Ambulatory Glucose Profile (AGP)
• Algorithm developed by the IDC (International Diabetes Centre)
• Single report with statistical summary, visual display and daily views of glucose information
• Analyzes glucose data collected over days/weeks as if they occurred within a single 24-hour period
• Provides a comprehensive view of changing glucose levels/patterns over 14 days
Assessing More Frequent Glucose DataContinuous Glucose Monitoring (CGM)
• Continuous real-time glucose values
• Device measures glucose levels in interstitial fluid
• Generates a “spaghetti view” reportGlu
cose
(m
mo
l/L)
5
10
15
20
25
30
0
Time of day
06:00 08:00 10:00 12:00 14:00 16:00 18:00 20:00 22:00 00:00 02:00 04:00
00:00
02:00
04:00
06:00
08:00
10:00
12:00
14:00
16:00
18:00
20:00
22:00
00:00
15
20
0
Glu
cose
(m
mo
l/L)
10
Time of day
Target Range
4.4

Interpretation of Mr. Smith’s AGP
04:00 06:00 08:00 10:00 12:00 14:00 16:00 18:00 20:00 22:00 00:00 02:00 04:00
0
Glu
cose
(m
mo
l/L)
Time of day
6
12
15
18
21
3 25th and 75th
percentiles
10th and 90th
percentiles
Median curve rises after
meal
Wide IQR indicates glucose
variability
9Target Range
10
4.4
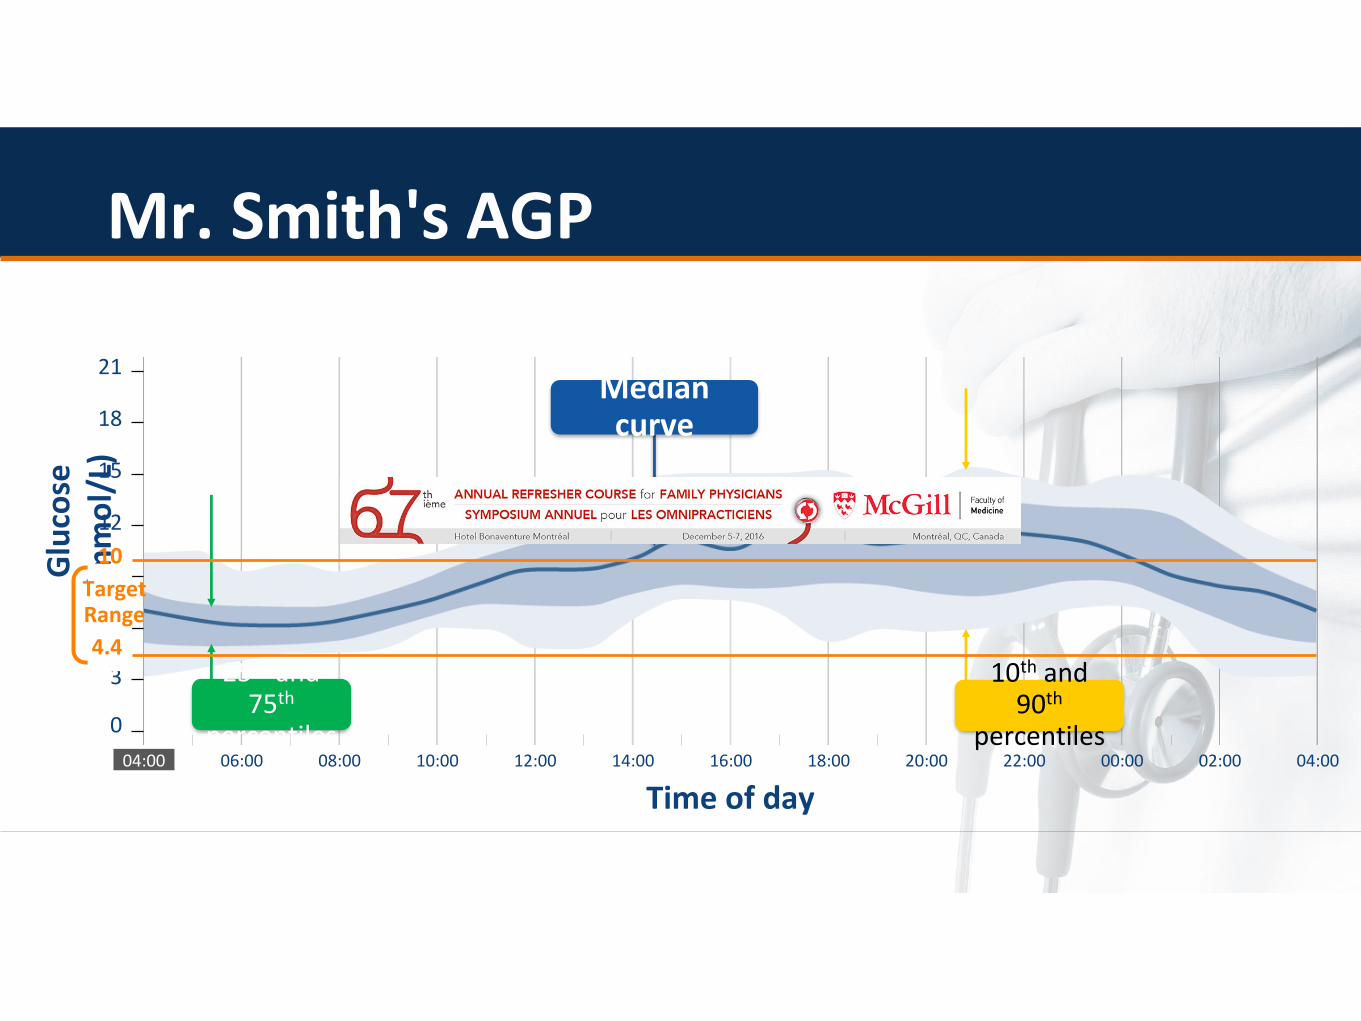
Mr. Smith's AGP
04:00 06:00 08:00 10:00 12:00 14:00 16:00 18:00 20:00 22:00 00:00 02:00 04:00
0
Glu
cose
(m
mo
l/L)
Time of day
6
12
15
18
21Median curve
3 10th and 90th
percentiles
25th and 75th
percentiles
9Target Range
10
4.4

DIABETES AND TECHNOLOGY• CANADIAN GUIDELINES FOR CBGM
• HOW ACCURATE ARE OUR CURRENT TOOLS
• CASE PRESENTATION
• WHAT IS AGP; COMING TO YOU SOON
• WHAT TECHNOLOGY IS HERE AND WHAT IS
COMING

CGM Devices available in CanadaWired and Wireless Continuous
Sensors
MiniLink Transmitter
Implantable Sensors
Install Transmitter


Conclusions
• PUMP USE IS ON THE RISE
• BE AWARE OF BASIC PARAMETERS
• CONTINUOUS TESTING IS COMING
• BE AWARE OF AGP AND HOW TO INTERPRET
• WE WILL SOON BE THE MOST MONITORED
AND PICTURED GENERATION