evidence-based design and operations pier … · evidence-based design and operations final program...
TRANSCRIPT

E n e r g y R e s e a r c h a n d De v e l o p m e n t Di v i s i o n
FINAL PROGRAM REPORT
Prepared for: California Energy Commission
Prepared by: New Buildings Institute Contact: Cathy Higgins, Research Director, NBI
MARCH 2013 CEC-500-08-049
The CEC is in the process of reviewing this Final Report
EVIDENCE-BASED DESIGN AND OPERATIONS PIER PROGRAM:
Improving the Real World Performance of Commercial Buildings

Prepared by: Primary Author(s): Cathy Higgins New Buildings Institute 1601 Broadway Vancouver, WA 98663 360-567-0950 www.newbuildings.org Contract Number: 500-08-049 Prepared for: California Energy Commission David Weightman Contract Manager
Virgina Law Office Manager Energy Efficiency Research Office
Laurie ten Hope Deputy Director RESEARCH AND DEVELOPMENT DIVISION
Robert P. Oglesby Executive Director
DISCLAIMER This report was prepared as the result of work sponsored by the California Energy Commission. It does not necessarily represent the views of the Energy Commission, its employees or the State of California. The Energy Commission, the State of California, its employees, contractors and subcontractors make no warranty, express or implied, and assume no legal liability for the information in this report; nor does any party represent that the uses of this information will not infringe upon privately owned rights. This report has not been approved or disapproved by the California Energy Commission nor has the California Energy Commission passed upon the accuracy or adequacy of the information in this report.

i
PREFACE
The California Energy Commission Energy Research and Development Division supports
public interest energy research and development that will help improve the quality of life in
California by bringing environmentally safe, affordable, and reliable energy services and
products to the marketplace.
The Energy Research and Development Division conducts public interest research,
development, and demonstration (RD&D) projects to benefit California.
The Energy Research and Development Division strives to conduct the most promising public
interest energy research by partnering with RD&D entities, including individuals, businesses,
utilities, and public or private research institutions.
Energy Research and Development Division funding efforts are focused on the following
RD&D program areas:
Buildings End-Use Energy Efficiency
Energy Innovations Small Grants
Energy-Related Environmental Research
Energy Systems Integration
Environmentally Preferred Advanced Generation
Industrial/Agricultural/Water End-Use Energy Efficiency
Renewable Energy Technologies
Transportation
Evidence-based Design and Operations Final Program Report is the final report for the Evidence-
based Design and Operations PIER Program (contract number 500-08-049) conducted by New
Buildings Institute (NBI). The information from this project contributes to PIER’s Buildings
End-Use Energy Efficiency Program.
When the source of a table, figure or photo is not otherwise credited, it is the work of the author
of the report.
For more information about the Energy Research and Development Division, please visit the
Energy Commission’s website at www.energy.ca.gov/research/ or contact the Energy
Commission at 916-327-1551.

ii
ACKNOWLEDGEMENTS
New Buildings Institute (NBI) would like to acknowledge the work and support of the many
individuals and organizations that contributed to the research and results of the Evidence-
Based Design and Operations PIER Research Program.
Cathy Higgins, NBI Research Director - Reseach Program Manager and Prime Investigator
The support of the California Energy Commission’s Public Interest Energy Research program is
gratefully acknowledged - David Weightman, Contract Manager
California Advisors on Measured Performance (CAMP) PIER Program Advisors
Scott Shell, EHDD Architects
Janika McFeeley, EHDD Architects
Brad Jacobson, EHDD Architects
Michael Murray, Lucid
Paul Mathew, LBNL
Sandy Mendler, Mithun Architects - SF
Wes Sullens, Stop Waste
Zorana Bosnic, HOK Architects
Clark Bisel, WSP Flack & Kutz
David Lehrer, Center for the Built
Environment University of Berkeley
David Vasnaik, PG&E
Karl Brown, California Institute for Energy
and the Enviornment (CIEE)
Reinhard Seidl, Taylor Engineering
David Kaneda, IDeAs
Lisa Gelfand, Gelfand Partners Architects
Doug Mahone, Heschong Mahone Group,
Inc.
Amy Barr, Heschong Mahone Group, Inc.
Kevin Hydes, Integral PE
RK Stewart, Perkins & Will
Steve Oliver, P.E., SMUD
Sara Graham, HOK St. Louis
Kevin Powell, GSA
Brian Sehnert, Green Building Services
Emma Bassein, Wave One - Palo Alto
AY Ahmed, Sempra
Project 2 - High Performance Buildings Measured Performance
Amy Cortese, Dan Harris, Howard Reichmuth, Adam Scherba, Cathy Higgins and Cathy
Turner, NBI; Lia Webster, Eric Greensfelder and Erin Rowe PECI - Measured Performance
Research Team
Mark Frankel and Dan Harris NBI; Jonathan Heller and Morgan Heater, Ecotope -
Sensitivity Analysis Research Team
Dan Harris, Cathy Turner and Cathy Higgins NBI; Lia Webster, Eric Greensfelder and Erin
Rowe PECI - Key Performance Indicators Research Team
NorthWrite Inc. and PowerMand Inc./Dent Instruments - Monitoring Products
Wes Sullens, StopWaste.Org - Oakland California Metering Field Site
Additional Thanks: Tyler Bradshaw Integral Group
Carbon Lighthouse, Ecology Action, City of San Francisco Dept. of Environment & Energy,
Friends of SF Environment, EHDD, Cadmus Group, ZGF Architects, SERA Architects

iii
Student, UC Davis, Waypoint Building Group, Jonathan Rose Companies, City Planning
Department Berkeley, Glenborough Properties – Pilot Participants of California Buildings
into the FirstView Tool
Project 3 - Plug Load Savings Assessment
Catherine Mercier and Laura Moorfield Ecova – Lead Researchers
Craig Billingsley and Chris Calwell Ecova – Analysis and Policy Support
Lia Webster, Erin Rowe, Eric Greensfelder and Mark Effinger PECI – Field Metering Leads
Dan Harris, Amy Cortese, Cathy Higgins and Cathy Turner NBI – Analysis and Metering
Support, Project Report Support
Jim Edelson and Mark Lyles NBI – Plug Load Policies Paper
Eliot Crowe and Joan Effinger PECI – Plug Load Case Study Development
Amy Cortese and Connie Umpress NBI; Catherine Mercier Ecova, Tod Bedrosian and Debra
Hirsh Bedrosian and Associates - Plug Guide Best Practices Guide
StopWaste Org and San Mateo Library – Field Metering Sites
Project 4 – Skylight Modeling and Validation
Judie Porter Architectural Energy Corporation (AEC) – Project Manager
Zack Rodgers Daylighting Innovations, Inc. – Lead Researcher
Kosta Papamichael California Lighting Technology Center (CLTC) – Lead Project Advisor
Luis Lomelino Fernandes and Anothai Thanachareonkit formerly with CLTC – Field
Measurements and Analysis
Bruce Mosher and Velux - Skylight Photometric Facility and Product Support
Kurt Levens Daylight Technology – Technical Support
Mark Jongewaard, Calvin Lanpher, Meg Tidd and LTI Optics - Photopia Simulations,
Software Access and Technical Support
Michael Gauvin, Ed Freniere, Dave Jacobsen, and TracePro - Software Access and Technical
Support
Jacob Jonsson LBNL - Goniophotometer Measurements, Data Translation and Support.
Andy McNeil LBNL; Greg Ward Anyhere Software - genBSDF, BSDF Material, and
Radiance Simulation Support
Barb Hamilton NBI – Final Report Review

iv
Project 5- Rooftop Unit Fault Detection and Diagnostics (FDD)
Mark Cherniack NBI – Project Manager
Kristin Heinemeier Western Cooling Efficiency Center – Technology and Market Review
and Savings Assessment Research Lead
Stuart Tartaglia PG&E; Heschong Mahone Group; Jon McHugh McHugh Energy
Consultants Matthew Tyler and Amber Buhl of PECI; Project Support through the
California Investor Owned Utilities Codes and Standards Enhancement (CASE)Project on
FDD
Martyn Dodd EnergySoft - Energy Simulations for Title 24 FDD Cost Effectiveness
Dr. Jim Braun (PI) David Yuill and Howard Cheung Herrick Laboratories/Purdue
University – Lead Researcher Team and Developers of the FDD Evaluator 0.1.1
Dr. Piotr Domanski and Vance Payne NIST - Collaboration with Purdue
Jon Douglas Lennox International; Sean Gouw Southern California Edison; Keith Temple,
Industry Consultant, John Proctor Proctor Engineering Group – Technical Review of the
Final Report and Evaluator 0.1.1.
Program Adminstration and Market Connection Support
Tod Bedrosian and Debra Hirsh Bedrosian and Associates
Amanda Reynolds, Stacey Hobart, Pat Heatherly, Connie Umpress, Ulrike Mengelberg, Sue
Grant Harris, Sean Denniston, Dave Hewitt, Barb Hamilton, Rochelle Hale NBI
For further information regarding this program please contact Cathy Higgins [email protected]

v
ABSTRACT
This report presents the results of the Evidence-based Design and Operations Research Program led
by New Buildings Institute from 2008-2013. The Program included four technical projects for
commercial buildings. The objective of the first project was to develop feedback tools for
designers, operators/owners and tenants as aides to reduce building energy use. These tools
feature new and unique data analysis capabilities. The other projects included: field
measurement to quantify and estimate potential plug load energy savings, validating computer
simulation for skylight systems evaluation, and developing a method and software to evaluate
rooftop heating and cooling units fault detection and diagnostic protocols.
In the first project the research team examined energy bills and conducted site monitoring of 22
new high performance buildings in California to assess measured energy compared to code and
design, finding most buildings not better than comparisons. The project also determined the
energy use impact of building features and operations (Sensitivity Analysis) and introduced,
FirstViewTM, a tool that identifies areas to investigate for potential efficiency improvements.
The plug loads study measured the energy use of major categories of office equipment at two
buildings. This study then quantified energy savings from implementing conservation
strategies; changes to hardware and software and using messages to influence occupant
behavior. The skylight research validated the ability to define and develop accurate computer
simulation methods for producing useable skylight photometric data as an alternative to
reliance solely on physical measurements.
The fault detection and diagnostic study included a market assessment of current products and
produced a new protocol evaluator (software) that determines the accuracy of tools designed to
detect faults that impede operating and energy performance of rooftop units. This research
facilitated the implementation of a new mandatory Fault Detection and Diagnostics
requirement in Title 24, part 6 (2013).
Keywords: Measured energy performance, commercial building energy efficiency, skylights,
plug loads, key performance indicators, fault detection and diagnostics, Sensitivity Analysis,
FDD, FirstView, Plug Load Guide.
Please use the following citation for this report:
Higgins, Cathy, New Buildings Institute (NBI), 2013. Evidence-based Design and Operations
Final Program Report. California Energy Commission. Publication number: CEC-500-
08-049-2013
vi
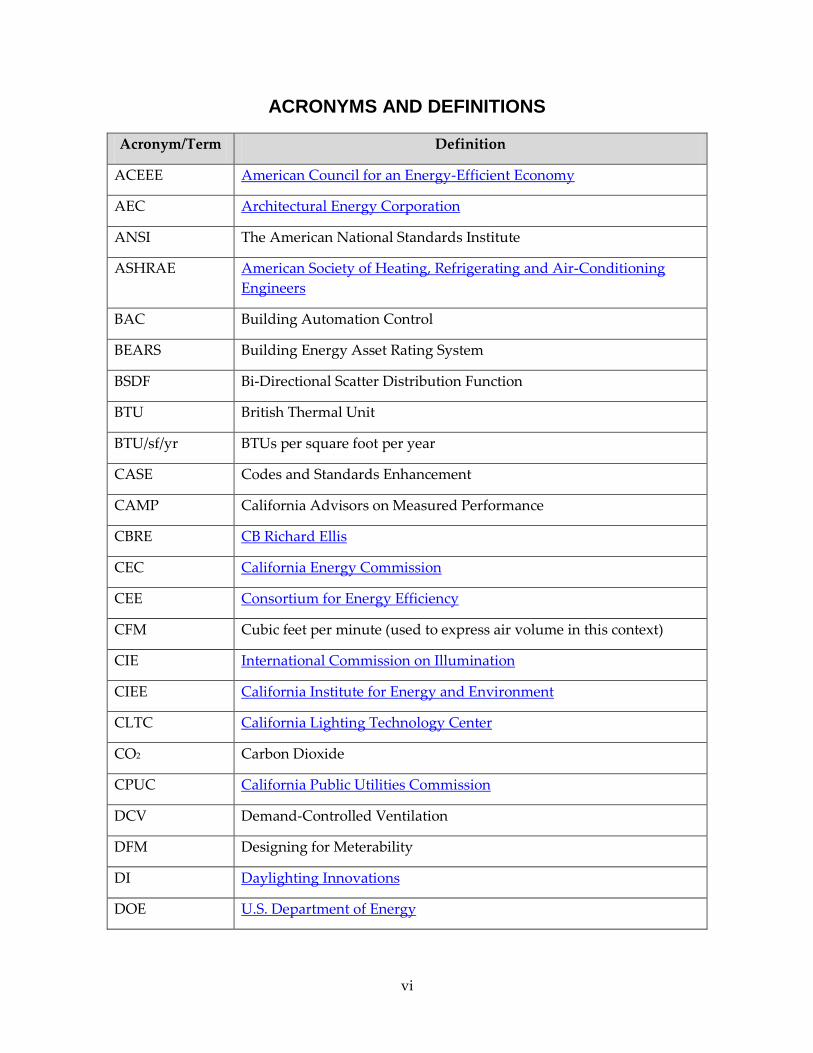
ACRONYMS AND DEFINITIONS
Acronym/Term Definition
ACEEE American Council for an Energy-Efficient Economy
AEC Architectural Energy Corporation
ANSI The American National Standards Institute
ASHRAE American Society of Heating, Refrigerating and Air-Conditioning
Engineers
BAC Building Automation Control
BEARS Building Energy Asset Rating System
BSDF Bi-Directional Scatter Distribution Function
BTU British Thermal Unit
BTU/sf/yr BTUs per square foot per year
CASE Codes and Standards Enhancement
CAMP California Advisors on Measured Performance
CBRE CB Richard Ellis
CEC California Energy Commission
CEE Consortium for Energy Efficiency
CFM Cubic feet per minute (used to express air volume in this context)
CIE International Commission on Illumination
CIEE California Institute for Energy and Environment
CLTC California Lighting Technology Center
CO2 Carbon Dioxide
CPUC California Public Utilities Commission
DCV Demand-Controlled Ventilation
DFM Designing for Meterability
DI Daylighting Innovations
DOE U.S. Department of Energy

vii
Acronym/Term Definition
DOT Designer, Owner/Operation and Tenant
EIA US Energy Information Administration
EISA Energy Independence and Security Act
EMCS Energy Management Control Systems
EMS Energy Management Information System
EPA U.S. Environmental Protection Agency
EPAct Energy Policy Act
ERM Energy Resource Management
EUI Energy Use Intensity (also Energy Use Index)
EUL Equipment Useful Life
FDD Fault Detection and Diagnostics
FirstView Energy Performance Assessment Tool
GSA U.S. General Services Administration
HDR High Dynamic Range
HERS Home Energy Rating System
HVAC Heating, Ventilation and Air-Conditioning
IECC International Energy Code Council
IES Illuminating Engineering Society
IESNA Illuminating Engineering Society of North America
IT Information Technology
KPI Key Performance Indicator
kWh Kilowatt hour
kWh/sf/yr Kilowatt hour per square foot per year
LADWP Los Angeles Department of Water and Power
LBNL Lawrence Berkeley National Laboratory
LED Lighting-Emitting Diode

viii
Acronym/Term Definition
LEED-EA Leadership in Energy and Environmental Design – Energy and
Atmosphere
LEED-NC Leadership in Energy and Environmental Design for New
Construction
Low-e Low-emissivity. Emissivity is the relative ability of a surface to emit
energy by radiation. Low-e refers to windows that have a surface that
reduces the energy loss (through radiation) from the building.
LPD Lighting Power Density
MC Market Connection
MFD Multifunction Device
MOU Memorandum of Understanding
NAECA National Appliance Energy Conservation Act
NBI New Buildings Institute
NFRC National Fenestration Rating Council
NIST National Institute for Standards and Technology
NRDC Natural Resources Defense Council
NZE Net Zero Energy
OBC Outcome-Based Code
PG&E Pacific Gas and Electric Company
PIER Public Interest Energy Research
PNNL Pacific Northwest National Laboratory
RCA Refrigerant Charge and Airflow
RTU Rooftop Unit (packaged air conditioners)
SCE Southern California Edison
SDG&E San Diego Gas & Electric
SHGC Solar Heat Gain Coefficient
SMUD Sacramento Municipal Utility District
TDV Time-Dependent Value
ix
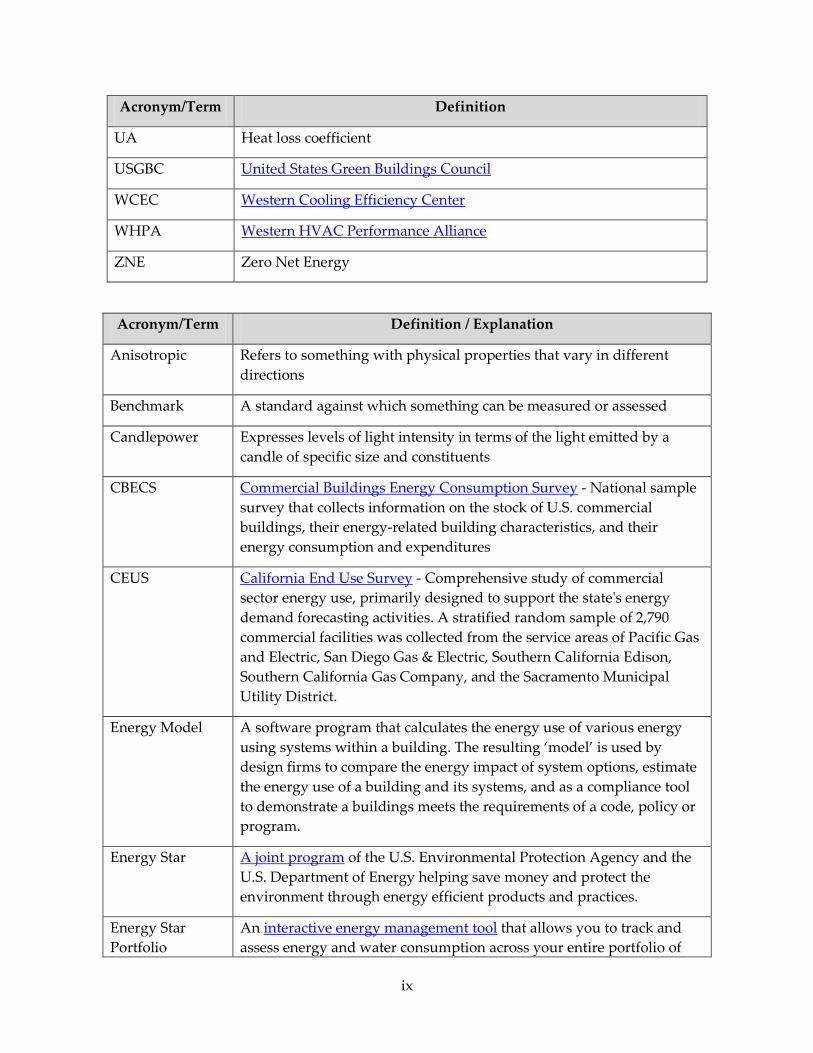
Acronym/Term Definition
UA Heat loss coefficient
USGBC United States Green Buildings Council
WCEC Western Cooling Efficiency Center
WHPA Western HVAC Performance Alliance
ZNE Zero Net Energy
Acronym/Term Definition / Explanation
Anisotropic Refers to something with physical properties that vary in different
directions
Benchmark A standard against which something can be measured or assessed
Candlepower Expresses levels of light intensity in terms of the light emitted by a
candle of specific size and constituents
CBECS Commercial Buildings Energy Consumption Survey - National sample
survey that collects information on the stock of U.S. commercial
buildings, their energy-related building characteristics, and their
energy consumption and expenditures
CEUS California End Use Survey - Comprehensive study of commercial
sector energy use, primarily designed to support the state's energy
demand forecasting activities. A stratified random sample of 2,790
commercial facilities was collected from the service areas of Pacific Gas
and Electric, San Diego Gas & Electric, Southern California Edison,
Southern California Gas Company, and the Sacramento Municipal
Utility District.
Energy Model A software program that calculates the energy use of various energy
using systems within a building. The resulting ‘model’ is used by
design firms to compare the energy impact of system options, estimate
the energy use of a building and its systems, and as a compliance tool
to demonstrate a buildings meets the requirements of a code, policy or
program.
Energy Star A joint program of the U.S. Environmental Protection Agency and the
U.S. Department of Energy helping save money and protect the
environment through energy efficient products and practices.
Energy Star
Portfolio
An interactive energy management tool that allows you to track and
assess energy and water consumption across your entire portfolio of

x
Acronym/Term Definition / Explanation
Manager buildings in a secure online environment. Enter energy consumption
and cost data into your Portfolio Manager account to benchmark
building energy performance, assess energy management goals over
time, and identify strategic opportunities for savings and recognition
opportunities
Energy Star Score A national building energy use ranking against comparable buildings
EUI Energy Use Intensity (or Index) is a metric of total building energy use
commonly used in benchmarking. EUI is the sum of all fuels used in
the building per year divided by the building’s floor space and is
expressed in thousands (kilos) of British Thermal Units (BTUs) per
square foot (sf) of occupied space per year
Fenestration Refers to the design and characteristics of windows and other exterior
openings of a building
Goniophotometer A device used for measurement of the light emitted from an object at
different angles
LEED Developed by the U.S. Green Buildings Council, LEED (Leadership in
Energy and Environmental Design) is a voluntary, consensus-based,
market-driven program that provides third-party verification of green
buildings. A suite of nine rating systems for the design, construction
and operation of buildings, homes and neighborhoods.
LEED Energy &
Atmosphere
Points
LEED Energy and Atmosphere credits encourage energy efficiency
through improved glazing, better insulation, improved daylighting
design / lighting power density reduction, high-efficiency HVAC&R
equipment selection, renewable energy production, and building
commissioning.
Multifunction
Device
One device which combines printing, coping, scanning and/or faxing.
Perez Sky A standard used for measured luminance data modeling of the sky
named for Richard Perez
Plug Loads Devices that plug into wall outlets
Title 24 Title 24 California is the 24th part of the California Code of Regulations
(CCR). According to Title 24 building standards, any construction of a
new building or alterations made to an existing building have to meet
the standards stated in the Title. The standards were adopted as a way
to regulate an energy crisis that the state was experiencing.

xi
TABLE OF CONTENTS
PREFACE ..................................................................................................................................................... i
ACKNOWLEDGEMENTS ..................................................................................................................... ii
ABSTRACT ................................................................................................................................................ v
ACRONYMS AND DEFINITIONS..................................................................................................... vi
TABLE OF CONTENTS .......................................................................................................................... xi
LIST OF FIGURES ................................................................................................................................ xiv
LIST OF TABLES .................................................................................................................................... xv
EXECUTIVE SUMMARY ........................................................................................................................ 1
Project 2: High Performance Buildings Measured Performance ..................................................... 2
Project 3: Plug Load Savings Assessment ........................................................................................... 5
Project 4: Skylight Testing and Validation ......................................................................................... 7
Project 5: Fault Detection and Diagnostics ......................................................................................... 9
1. Introduction ..................................................................................................................................... 13
1.1 Background ............................................................................................................................... 13
1.2 The Projects ............................................................................................................................... 13
2. High Performance Buildings Measured Performance ............................................................. 15
2.1 Background ............................................................................................................................... 15
2.1.1 Objective ............................................................................................................................ 17
2.2 Measured Performance Assessment ..................................................................................... 17
2.2.1 Approach ........................................................................................................................... 18
2.2.2 Measured Performance Assessment Findings and Outcomes .................................. 18
2.2.3 New Performance Review Tool: FirstView .................................................................. 22
2.2.4 Measured Performance Assessment Market Connections ......................................... 30
2.3 Sensitivity Analysis .................................................................................................................. 32
2.3.1 Approach ........................................................................................................................... 32
2.3.2 Sensitivity Analysis Findings and Outcomes .............................................................. 33
2.3.3 Sensitivity Analysis Market Connections ..................................................................... 35

xii
2.4 Key Performance Indicators ................................................................................................... 37
2.4.1 Approach ........................................................................................................................... 37
2.4.2 Technical Findings and Outcomes – The KPI Metrics ................................................ 38
2.4.3 Key Performance Indicators Market Connections....................................................... 46
2.5 Benefits to California ............................................................................................................... 47
2.6 Conclusions and Next Steps ................................................................................................... 48
2.6.1 Next Steps .......................................................................................................................... 49
3. Plug Load Savings Assessment Final Report ............................................................................ 51
3.1 Background ............................................................................................................................... 51
3.1.1 Objectives .......................................................................................................................... 51
3.1.2 Approach ........................................................................................................................... 52
3.2 Technical Outcomes and Findings ........................................................................................ 53
3.2.1 Commercial Plug Load Savings Assessment ............................................................... 54
3.3 Market Connections ................................................................................................................. 69
3.3.1 Plug Load Guide – Best Practices for Offices ............................................................... 70
3.3.2 Plug Load Methodology Paper ...................................................................................... 70
3.3.3 Plug Load Case Study ..................................................................................................... 71
3.3.4 Research Promotion and Outreach ................................................................................ 71
3.3.5 Public Programs and Market Adoption ........................................................................ 72
3.4 Benefits to California ............................................................................................................... 73
3.5 Conclusions and Next Steps ................................................................................................... 74
3.5.1 Next Steps .......................................................................................................................... 75
4. Skylight Testing and Validation .................................................................................................. 81
4.1 Background ............................................................................................................................... 81
4.1.1 Objective ............................................................................................................................ 83
4.1.2 Approach ........................................................................................................................... 83
4.2 Outcome and Findings ............................................................................................................ 89
4.2.1 Sky Measurement and Processing ................................................................................. 90
xiii
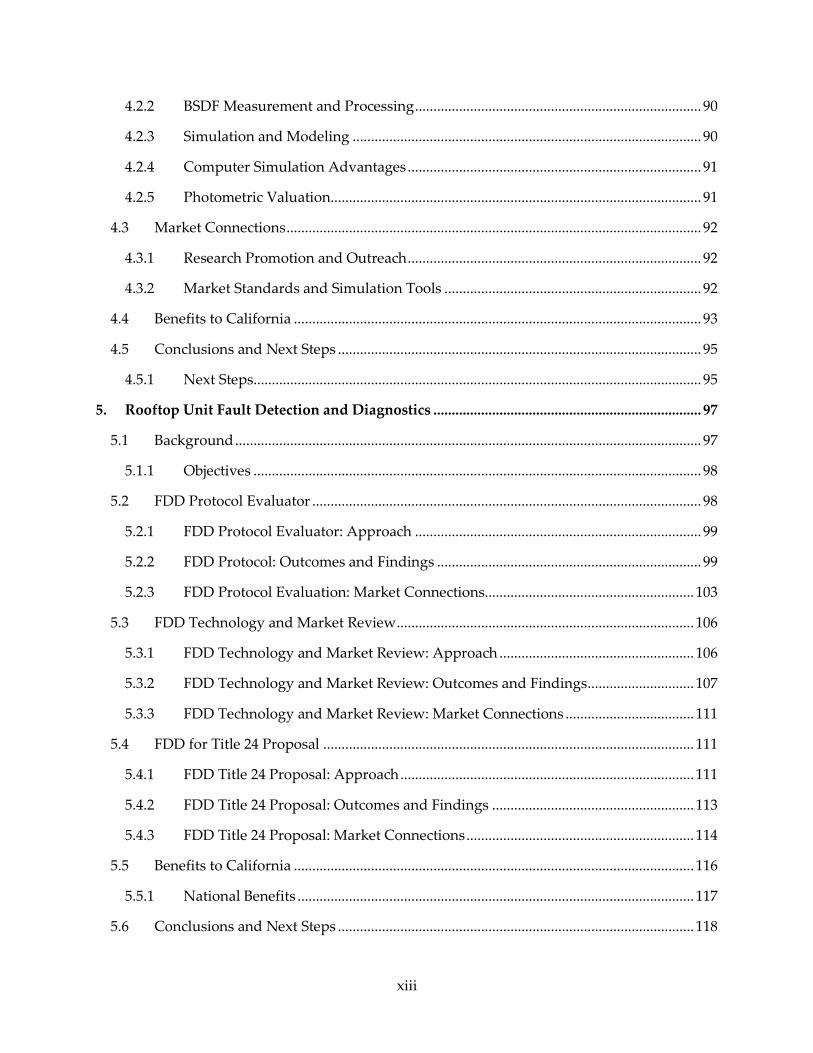
4.2.2 BSDF Measurement and Processing .............................................................................. 90
4.2.3 Simulation and Modeling ............................................................................................... 90
4.2.4 Computer Simulation Advantages ................................................................................ 91
4.2.5 Photometric Valuation..................................................................................................... 91
4.3 Market Connections ................................................................................................................. 92
4.3.1 Research Promotion and Outreach ................................................................................ 92
4.3.2 Market Standards and Simulation Tools ...................................................................... 92
4.4 Benefits to California ............................................................................................................... 93
4.5 Conclusions and Next Steps ................................................................................................... 95
4.5.1 Next Steps .......................................................................................................................... 95
5. Rooftop Unit Fault Detection and Diagnostics ......................................................................... 97
5.1 Background ............................................................................................................................... 97
5.1.1 Objectives .......................................................................................................................... 98
5.2 FDD Protocol Evaluator .......................................................................................................... 98
5.2.1 FDD Protocol Evaluator: Approach .............................................................................. 99
5.2.2 FDD Protocol: Outcomes and Findings ........................................................................ 99
5.2.3 FDD Protocol Evaluation: Market Connections......................................................... 103
5.3 FDD Technology and Market Review ................................................................................. 106
5.3.1 FDD Technology and Market Review: Approach ..................................................... 106
5.3.2 FDD Technology and Market Review: Outcomes and Findings ............................. 107
5.3.3 FDD Technology and Market Review: Market Connections ................................... 111
5.4 FDD for Title 24 Proposal ..................................................................................................... 111
5.4.1 FDD Title 24 Proposal: Approach ................................................................................ 111
5.4.2 FDD Title 24 Proposal: Outcomes and Findings ....................................................... 113
5.4.3 FDD Title 24 Proposal: Market Connections .............................................................. 114
5.5 Benefits to California ............................................................................................................. 116
5.5.1 National Benefits ............................................................................................................ 117
5.6 Conclusions and Next Steps ................................................................................................. 118

xiv
LIST OF FIGURES
Figure 1: Whole Building Energy Performance of Six Studied Offices Compared to CEUS ........ 21
Figure 2: Percent of Buildings Reporting Energy Conservation Measures ..................................... 22
Figure 3: School # 1687 Before and After Renovation ......................................................................... 23
Figure 4: Office Building Energy Use Over Time ................................................................................ 24
Figure 5: Two Library Energy Signatures - Zone 4 Bldg. # 1791 and Zone 3 Bldg. # 1662 ............ 24
Figure 6: Participant Design Models Compared to Measured EUI Totals ..................................... 25
Figure 7: Design versus Actual End Use Split ..................................................................................... 25
Figure 8: Sensitivity of Envelope, Lighting and HVAC Measures in Los Angeles ........................ 34
Figure 9: Sensitivity of Operational and Occupant Characteristics .................................................. 35
Figure 10: Levels of Metering and Analysis Progressing from Whole Building to Systems ......... 38
Figure 11: Overview of Study Scope and Methodology ..................................................................... 53
Figure 12: Percent of the Studied Plug Load Energy Use by Device Category – Office ................ 55
Figure 13: Savings from Setting Aggressive Power Management (PM) Settings on One Printer 56
Figure 14: Savings from Digital Timer Plug Strips (DTPS) ................................................................ 57
Figure 15: Savings Example from Employing Strategies to Remind Users to Shut off Computers
Nights and Weekends (Monitoring Feedback) .................................................................................... 58
Figure 16: Summary of Savings at the Small Office ............................................................................ 62
Figure 17: Studied Plug Load Energy Savings from all Strategies and Measures .......................... 66
Figure 18: Plug Loads as a Percent of Whole-Building Energy - Small Office ................................ 69
Figure 19: Velux Test Facility ................................................................................................................. 83
Figure 20: Skylight Types and Systems Tested .................................................................................... 84
Figure 21: Isometric diagrams of the Sunoptics Light Box and the Sun Tunnel Geometric Models
.................................................................................................................................................................... 86
Figure 22: Laser Scan 3D Prismatic Lens Material Models ................................................................ 87
Figure 23: Sky Image 9 (top) with Measured Photometrics and Simulated Photometrics (below)
by TracePro, Radiance, and Photopia ................................................................................................... 88
Figure 24: Example Output Table of Numerical Results from the FDD Evaluator 0.1.1 ............. 101
Figure 25: Example of Missed Detection Rates from the FDD Evaluator 0.1.1 ............................. 101
Figure 26: Fault Categories for Rooftop Unit Diagnostics ............................................................... 107
Figure 27: Description of Faults Detected by FDD Tools ................................................................ 109
xv
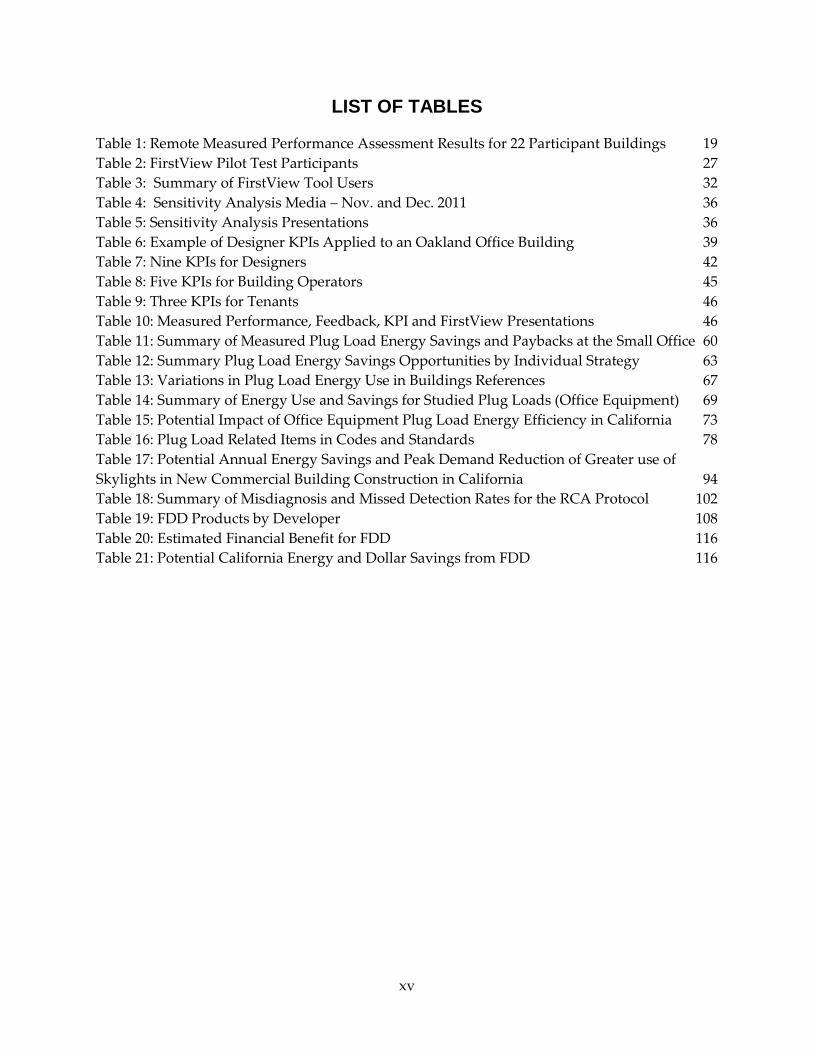
LIST OF TABLES
Table 1: Remote Measured Performance Assessment Results for 22 Participant Buildings 19
Table 2: FirstView Pilot Test Participants 27
Table 3: Summary of FirstView Tool Users 32
Table 4: Sensitivity Analysis Media – Nov. and Dec. 2011 36
Table 5: Sensitivity Analysis Presentations 36
Table 6: Example of Designer KPIs Applied to an Oakland Office Building 39
Table 7: Nine KPIs for Designers 42
Table 8: Five KPIs for Building Operators 45
Table 9: Three KPIs for Tenants 46
Table 10: Measured Performance, Feedback, KPI and FirstView Presentations 46
Table 11: Summary of Measured Plug Load Energy Savings and Paybacks at the Small Office 60
Table 12: Summary Plug Load Energy Savings Opportunities by Individual Strategy 63
Table 13: Variations in Plug Load Energy Use in Buildings References 67
Table 14: Summary of Energy Use and Savings for Studied Plug Loads (Office Equipment) 69
Table 15: Potential Impact of Office Equipment Plug Load Energy Efficiency in California 73
Table 16: Plug Load Related Items in Codes and Standards 78
Table 17: Potential Annual Energy Savings and Peak Demand Reduction of Greater use of
Skylights in New Commercial Building Construction in California 94
Table 18: Summary of Misdiagnosis and Missed Detection Rates for the RCA Protocol 102
Table 19: FDD Products by Developer 108
Table 20: Estimated Financial Benefit for FDD 116
Table 21: Potential California Energy and Dollar Savings from FDD 116

xvi
This page deliberately left blank
1
EXECUTIVE SUMMARY
This Program Report (Final Report) summarizes the findings for the Evidence-based Design and
Operation research program (Program) led by New Buildings Institute (NBI) and its
subcontractors for the California Energy Commission’s Public Interest Energy Research (PIER)
program. The research period was October 2008 and March 2013 and included studies on key
performance indicators for whole-building and system-level energy analysis, plug load energy
savings strategies, an evaluation methodology for skylight system and materials performance
using computer simulation, and a methodology for evaluating the effectiveness of Fault
Detection and Diagnostic protocols that identify and measure operational faults in rooftop
heating, ventilation and air conditioning equipment. Fully detailed reports describing the work
in each of the four technical research projects are attached as Appendices A2-5.
Achieving California’s ambitious energy and environmental goals and policies will depend in
part upon achieving dramatic improvements in the energy efficiency of new and existing
commercial buildings. The commitment to these goals is evidenced by the existence and
progression of advanced building codes and appliance standards, and the proliferation of utility
energy conservation incentive programs. However some recent studies on the actual measured
energy performance of newer generations of commercial buildings (those designed for high
energy efficiency) evidence a wide range of energy performance; some buildings are
performing far below design expectations. For example, NBI’s 2008 study of measured energy
performance of Leadership in Energy and Environment Design –New Construction (LEED –
NC) buildings1 found average savings of 28% compared to national code, but energy use at 1/4
of the buildings was near or higher than the allowable code baseline level. This performance
shortfall needs to be better understood and corrected so that efficiency “as designed” comes
into alignment with efficiency “as measured.”
Objective. The goal of the research Program was to improve the measured energy performance
of the next generation of California commercial buildings. To accomplish this goal the
researchers examined the reasons for the variable energy performance through an evidence-
based assessment of high performance buildings (those built to energy efficiency targets beyond
code requirements). These assessments were made through a series of project elements focused
on identifying key feedback loops and tools that can better inform designers, operators/owners
and tenants (DOTs) about their role in optimizing building performance. The fundamental
theme of the Program was to ‘connect the DOTs’ by identifying the key areas of performance
related to each party having a role in the ultimate energy use.
NBI was the prime research investigator for the Program, led the project elements related to
whole-building performance (Project 2), fault detection and diagnostics (Project 5), and the
market connections work (disseminating research findings) for all the technical projects. To
complete detailed research elements, NBI teamed with a series of organizations having
specialized expertise. These organizations included PECI, for detailed field-based whole-
1Energy Performance of LEED® for New Construction Buildings, NBI 2008

2
building performance assessment (Projects 2 and 3); Ecova on the field investigation and
understanding of plug load contributions to energy use (Project 3); Architectural Energy
Corporation, Daylighting Innovations and the California Lighting Technology Center on
improving daylighting predictability and performance of skylight systems (Project 4); and the
Western Cooling Efficiency Center and Purdue University on fault detection and diagnostics
(FDD) in unitary HVAC systems (Project 5). The background, objectives, approaches, outcomes
and market connections work for each of these projects are discussed in this Final Program
Report.
Project 2: High Performance Buildings Measured Performance
The objective of this project was to identify typical patterns affecting energy performance in
high performance buildings and to develop easily understood feedback mechanisms, tools and
indicators directed to the designers, operators/owners and tenants, thus connecting the ‘DOTs’
of energy performance. Full details regarding the technical work done for this project are found
in Appendix A-2.
Background. At the time this research was proposed in 2008 there was no simple, effective
feedback system for capturing and analyzing system-level measured energy results (i.e., actual
use) in a way that informed owners, operators and tenants of the impact of their actions on
energy use. For designers, feedback from occupied buildings can inform and improve future
design work for new or renovated facilities. Feedback can guide owners when making
investments in energy equipment and controls and provide guidance for operational practices
once buildings are occupied. Occupants can learn to recognize and change their activities to
decrease energy use.
Approach. The research team began by using monthly utility bills to assess measured actual vs.
designed energy performance of a set of 22 new California buildings whose design targets were
intended to significantly exceed simple -energy code compliance. Next, site investigations were
done on a subset of 12 buildings to discern physical and operational characteristics. The
researchers extensively evaluated the energy use impact of various efficiency measures. This
Sensitivity Analysis, coupled with system-level (i.e. lighting, HVAC, plug loads, etc.) measured
energy use at two sites helped identify the key performance indicators (KPIs) that simplify the
representation of building energy performance.
Results: Whole-Building Energy Use. Research on the initial set of 22 buildings found they
performed much better than the national average per building type. Of those eligible for an
Energy Star score2, over 70% were in the top 10% of like-type buildings nationally. But the
research found little correlation between a building’s actual measured energy performance
(EUI3 and Energy Star score) and ratings such as LEED energy points that represent estimated
2 An Energy Star score is a national benchmarking comparison to similar occupancy buildings by climate
area and greenhouse gas emissions associated with energy use.
3 Energy Use Intensity (EUI) is the sum of all fuels used in the building per year divided by the building’s
floor space and is expressed here in British Thermal Units (BTUs) per square foot (sf).

3
energy performance. Compared to similar buildings in the CEUS4 database, many failed to
achieve their original estimated high performance design goals. These findings further
demonstrate that there is often a discrepancy between expected energy performance and actual
measured outcomes.
Results: A Building Performance Review Tool. Building on a pre-existing spreadsheet energy
analysis tool, an automated remote energy performance assessment software tool called
FirstView was developed and refined as part of this project. FirstView‘s evolution was piloted
(beta tested) by 28 companies responsible for over 4.6 million square feet of commercial floor
space. This tool applies an inverse-modeling method to segregate monthly utility bills into
energy end-use categories (lighting, plug loads, heating and cooling, etc.), each uniquely
affected by the actions associated with design, operations and tenants. Its analysis, shown in
graphic form, provides insights that can determine if building performance is on track or off
target. Where energy use is higher than expected, FirstView can identify specific problem areas
for investigation.
Results: Sensitivity Analysis. The Sensitivity Analysis work in this project investigated,
through extensive modeling runs, how variations in physical features, HVAC and lighting
systems, operational practices and tenant behavior patterns affect building energy use. Findings
from this analysis provided a scale of impact for each item and correlated corrective actions to
one or more of the DOTs. Findings from this work also reinforced the need for stringent energy
codes because design decisions are so key in affecting energy use. For example, for an office
building in Los Angeles5, poor or inefficient design features can increase the energy use by 10-
20%. Yet in this same building the Sensitivity Analysis revealed that poor operational practices
(such as using incorrect outside air and thermostat settings) and uniformed occupant behavior
could combine to increase energy use by up to 50-60% more than necessary.
Results: Key Performance Indicators (KPIs). The KPIs were expressed as metrics that
characterize occupancy patterns and how HVAC controls, lighting, daylighting and plug loads
are working and contribute to whole building energy use. Each metric is a descriptor, and the
rating of that metric, and its graphical representation of the data measuring the metric give
clues as to whether or not the problem may be design related or related to the actions of tenants
or facility operations. For example, the KPI” Daylighting Effectiveness” indicates the degree to
which electric lighting energy use is reduced when daylight is available. When a lighting
system design includes daylighting controls, the KPI should indicate a correlation of reduced
electric lighting during daylight hours. These KPIs drill down and give feedback as to the
reasons for differences between measured energy use and design energy use expectations, and
indicate how operations or tenant activities factor in that difference.
4 The California Energy Use Survey (CEUS) for Nonresidential Buildings (2006) represents a survey of
measured energy use by building type.
5 The impact of any feature will vary depending on the use and locations of the building. The Sensitivity
Analysis covered climate areas throughout the U.S.
4
Market Connections and Policies. Mandatory energy use ‘disclosure policies’ associated with
property transactions are becoming widely adopted by local jurisdictions nationwide. By
making the energy performance of buildings transparent, parties in real estate transactions are
better informed. Most of these policies require commercial building owners to provide their
building’s size, annual Energy Use Intensity (EUI) and Energy Star score. But without monthly
energy bills this information is insufficient for a full performance review. For owners, the
problem is that the Energy Star score, while good for broad comparisons, does not provide any
information on how energy efficiency can be improved.
Some municipalities have created voluntary programs focused on public disclosure of building
energy use and incentivize participation in these programs by giving awards for top energy
performers. In this study, the research team partnered with StopWaste.Org, the City of Berkeley
and two other cities in Alameda County to employ FirstView building evaluation for all 2013
participants6 in their Smart Energy Awards7. The Sensitivity Analysis work in the study described
above was highlighted in a range of publications and presentations to broad audiences. The KPI
data and metrics were part of numerous presentations at conferences such as ACEEE, ASHRAE
and the World Energy Engineering Conference. FirstView continues to be discussed at industry
panels on performance feedback such as the National Market Transformation Conference and
was the basis for the first performance assessments on actual energy feedback to LEED-NC
participants8.
Conclusions. This research clearly indicates that building energy performance is not solely a
product of a building’s design and construction; actual performance is driven in large part by
operations and occupant energy use behaviors. Reviews of 22 California buildings built for high
energy performance clearly showed they were not exceptionally better in measured energy use,
despite their original estimated high performance energy design based on software models.
Programs such as Energy Star use measured performance data from utility bills to compare
energy performance to national benchmarks – an important step in raising awareness of energy
use. But while important, benchmarking programs provide no insights to designers,
operators/owners and tenants about what areas to mine for efficiency improvements. Metering
and audits are expensive and complex. This project demonstrated that with easy-to-use tools,
the simplest data – that found in monthly energy bills – can provide useable energy
performance feedback to guide actions for energy efficiency.
6 FirstView is able to plot an energy signature and disaggregate energy end uses for many
building types. For office buildings the web tool goes further to compare the reference building
to that of other office buildings.
7 http://www.co.alameda.ca.us/sustain/news/awards.htm
8 USGBC Building Performance Partnership

5
Arising from the same issues articulated in this research, approximately 8-12 private sector tools
with remote energy performance review abilities are now available9. The research team
anticipates that the findings, tools and market outreach work of this project will improve
building energy performance by filling the energy use feedback gap and help accelerate market
action toward implementing efficiency improvements.
Project 3: Plug Load Savings Assessment
The objective of the Plug Load Savings Assessment research project was to characterize the
electricity consumption of office equipment plug load devices and identify opportunities for
energy savings. Full details regarding the technical work done for this project are found in
Appendix A-3.
Background. Plug loads (miscellaneous electric devices that plug into wall outlets) are one of
the largest and fastest growing electric end uses in commercial buildings in the United States10.
In California, plug loads on average account for 13% of total electricity consumption in
commercial buildings and 23% in offices specifically11.
Approach. The research team first inventoried the type and quantity of plug load devices
(n=726) in two recently LEED12-certified buildings in California. A subset (n=100) representing a
diversity of office equipment was established. Sensors were used to track power use at one-
minute intervals for one month; these measurements established the baseline energy use and
load profile of the sample set. In the second phase the team implemented energy saving
strategies and measures on a subset of the 100 devices (n=39), then monitored the energy use on
those devices at one-minute intervals for a second month. This enabled the team to estimate the
energy savings effects of each efficiency strategy by plug load device category and overall
annual savings potential for each of the office building sites.
Results: Energy Use. The baseline office equipment energy use, as a percent of the studied set
of plug loads, per device category was measured as: 1) Desktop Computers 70%, 2) Imaging
Equipment 17%, 3) Monitors 9%, and 4) Miscellaneous loads 5%13. The first three items account
for approximately 95% of the measured energy use. The average energy use intensity of the
studied plug loads at the two buildings was 0.7-.94 kWh/ft2 /yr. These findings are significantly
lower than those calculated from office buildings in the CEUS database, which indicates energy
plug load energy intensities of 2.19 kWh/ft2/yr for small offices14. Two factors may account for
9 Examples are Retroficiency, FirstFuel, and Noesis
10 Energy Outlook Report
11 California Commercial Energy Use Survey (CEUS), 2006.
12 U.S. Green Building Council’s Leadership in Energy and Environmental Design Program - LEED
13 The percent of energy use per device category was very similar at both sites.
14 Itron Inc., 2006. Note: one of the sites was a library, which is not a separate category in CEUS; results for
the library were compared to those for a small office, the most similar category.

6
this difference. First, the CEUS office equipment category includes servers and air conditioning
units dedicated to servers. Servers were excluded from this study due to the unique nature of
their energy use and because of liability concerns. Second, the office equipment purchased at
these particular sites was more energy efficient than would be considered typical. For each site,
studied plug loads used about 6% of the building’s total annual energy (electricity plus natural
gas).
Results: Energy Savings Opportunities. The savings solutions employed and evaluated were
based on three categorical approaches: 1) Software-related changes: set all equipment to manage
power to optimize energy savings, or use power management controlled at the information
technology (IT) department level, 2) Hardware additions or replacements: purchase and install
advanced power strips and timers that automatically control loads after business hours and on
weekends, and procure more energy efficient office equipment with only necessary capabilities
during procurement, and 3) Information and reminders (prompts) for occupants: provide
simple, easy-to-understand information that encourage users to change personal practices
(behaviors) so equipment is not left operating unnecessarily.
Five key savings strategy areas that produced immediate plug load savings: 1) Power
Management Changes: set more aggressive power management settings on imaging equipment,
enable computer power management settings, 2) Advanced Plug Strips and Timers: apply
advanced plug strips to stop power flow to peripheral equipment when the primary device is
turned off. Set timers to turn equipment off at the end of the day and weekends, 3) Adjust
Monitor Brightness: adjust the monitor brightness to meet user needs without defaulting to the
maximum brightness, 4) Occupant Behavior: send notices to staff to turn off equipment at the
end of the day and initiate office energy awareness campaigns or competitions, and 5)
Equipment Procurement: at the time of equipment upgrade, purchase the highest efficiency
option (such as those listed through the TopTen15 program).
Measures 1-4 are no- to low-cost savings opportunities, with power management settings
accounting for the lion’s share (71%). Advanced plug strips accounted for 16% of the savings
from the no- to low-cost measures, and occupant behavioral approaches contributed another
10%. Although equipment procurement is an important savings strategy, which in this study
demonstrated energy savings approximately twice that of the no-to low-cost measures, it is not
cost-effective to implement for energy efficiency savings alone. When replacement is necessary,
highly efficient equipment should be purchased. The incremental cost for energy efficient
equipment is usually minimal.
The results of this study show it is possible to significantly reduce plug load energy use in high
performance buildings. At the small office, measures installed on 24 devices reduced the energy
consumption of the affected plug loads by 46%. At the library, measures installed on 15 devices
reduced the energy consumption of the affected plug loads by 17%. Extrapolating these findings
to estimate potential energy savings for a realistic scenario at each site, no- and low-cost energy
savings strategies could save about 19% of total studied plug energy use at the library and 40
15 See www.toptenusa.com.

7
percent of the studied plug load energy use at the small office. Savings opportunities may be
greater in buildings with higher plug load densities. Any strategies that successfully reduce
plug loads will be critical for California to reach a policy goal of zero-net energy for newly
constructed commercial buildings by 2030.
A number of issues exist related to study and quantification of savings strategies for plug load
energy use, chief among them being the lack of a uniform definition for plug loads. Secondly,
meters are sometimes configured in buildings such that several systems or building areas may
be served by the same circuits. This makes device or device category energy use harder to
determine over time, particularly given the existing lack of knowledge regarding individual
device electric load profiles. Thirdly, submetering individual circuits is expensive, limiting the
viability of doing it over extended time periods. As such, it is difficult to know with certainty if
some of the strategies employed in this study will persist over time. These issues are discussed
in the technical report in Appendix A-3, in addition to suggestions for topics meriting further
investigation.
Market Connections. Several key items beyond the full technical report were produced as a
result of this study. Appendix A-3 includes three additional documents: a Plug Load Best
Practices Guide for Offices (Guide), a Methodology for Reporting Office Equipment Plug Load Energy
Use (Methodology Paper) and accompanying Case Study on Office Plug Loads (Case Study), and a
Plug Load Policies: In Place, Pending or Possible (Policy Paper). The Guide helps office managers,
tenants and owners understand their plug loads with the aim of reducing energy use and cost;
it is the nation’s first market-based publication on this topic16. Nearly 20 industry entities
included references to the research results in their e-news, on their websites or in magazine
articles in publications such as Commercial Property Executive’s (which has a readership of over
80,000). Research results were shared at almost a dozen energy and industry events. The Guide
is available from several California utilities and their program implementation contractors. The
Methodology Paper and Case Study have been shared with the Consortium for Energy
Efficiency (CEE) and with ASHRAE members to spur the dialog on consistency of metrics and
measurements related to plug loads. The Policy Paper is available to code developers.
Project 4: Skylight Testing and Validation
The objectives of the Enhanced Skylight Modeling and Validation project (Skylight Modeling
Research) were to define, develop and validate accurate computer simulation methods for
producing skylight photometric data. This alternative to reliance solely on physical measures to
obtain this data would reduce significant constraints on skylight manufacturers who need to
deliver performance information on their products and provide Illuminating Engineering
Society of North America (IESNA) compatible files that are usable in lighting design software.
Full details regarding the technical work done for this project are found in Appendix A-4.
16 The researchers did an internet and industry search for similar materials and could not locate any
simple guide on the topic of plug load best practices aimed at the occupant or office manager.
8
Background. Interior lighting accounts for the largest portion of electricity used in California’s
commercial buildings – almost 30%17. Commercial building skylight and daylighting products,
integrated with controls that lower electric lights in response to daylight, can significantly
reduce lighting energy use. Building and lighting designers are accustomed to using lighting
simulation software to review options for lighting a commercial space and meeting code and
client requirements. Lighting manufacturers produce photometric files for each of their lamp
products (based on an IESNA18-standardized format) and supply the files to the designers and
software program companies.
However, skylight manufacturers have limited information to provide on product performance.
The industry currently relies on taking physical measurements of daylighting systems in
photometric labs to obtain performance data. The physical measurement methods are
constrained by factors including skylight size, sky opening, photometric resolution and
available geographical aspects (solar altitude). These factors consume time and carry significant
costs and accuracy concerns. To increase the use of skylights as a daylighting strategy to reduce
electric lighting, manufacturers need more accurate and affordable methods to produce
photometric data.
Approach. The research had two primary tasks in the development of validated photometric
files: measurement and conducting simulations using the measurement data. The measurement
task collected real-world skylight system photometric data combined with simultaneous
measurement of a variety of sky and solar light conditions. The simulation task used field data
from the measurement phase to perform comparable computer simulations of the skylight
systems. Measurements were conducted at the Velux19 daylighting laboratory in South
Carolina. Three skylight configurations were selected to test a representative range of different
optical complexities and installation configurations. The simulation task developed modeling
protocols and simulation methodologies and validated these by demonstrating correspondence
with the data provided in the measurement tasks.
The researchers created representative computer models of all aspects of the daylighting
system: sky and sun source, skylight system geometry and material characteristics, and near-
field meter locations. Three common lighting simulation software tools - TracePro, Photopia
and Radiance - were reviewed to ensure modeled results were compatible with these programs.
A process of creating detailed reflectance and transmittance information data, known as Bi-
Directional Scatter Distribution Function (BSDF), was a key aspect of the research and involved
collecting detailed measurements from the main optical surfaces of the skylight products. The
17 The California Commercial Energy Use Survey (CEUS), Itron, 2006.
18 IESNA is the recognized technical authority on illumination in the U.S.
19 Velux is a major U.S. skylight manufacturer and a member of the project advisory team. Testing at the
Velux facility was done independently by the research team and included Velux and other
manufacturers’ products.

9
research used various simulation settings and methodologies for BSDF for each software tool;
final simulation results from each tool were compared to the measured data.
Results. The research team successfully demonstrated the ability to use computer models based
on field data to predict skylight systems performance and to produce replicable modeled
results. These findings represent new and validated research outcomes that are transferable to
manufacturers, researchers and academics.
Some of the findings and conclusions from this research are now being discussed by lighting
experts, architects, manufacturers and daylighting designers. Of significant note, these findings
demonstrate that the simulated photometric distributions from this research were found to be
highly reliable in matching the general shape of the physical measurements for simple to
complex optical skylight systems under a range of sky conditions. However, there was a lower
reliability in capturing the exact point by point luminous intensity (the level of light at a given
point from a source of light). The absence of exact point-by-point luminous intensity data can
affect the results of glare analysis but does not reduce the value of the modeled approach for the
overall skylight photometrics; rather, it identifies one area for possible reinvestigation. Finally,
the research demonstrated that the accuracy and detail of any BSDF measurements used to
describe optical materials in the system is critical; the accuracy of the exact system geometry
does not appear to be as critical in evaluating systems lighting effectiveness.
Market Connections. The research findings are already being considered for adoption in testing
methods by one manufacturer (unnamed) and for inclusion in some existing lighting software
programs. Based on the work of this study, research team members will produce a companion
document to a key committee (LM-81-10) within IESNA to propose a new “Approved Method:
Photometric Testing of Skylights” using computer simulation techniques developed from this
research. The team will also encourage IESNA to create a subcommittee to link computer
simulation of skylights to physical measurements. IESNA is a critical pathway to moving the
modeling method into the simulation tools marketplace. Since the National Fenestration20
Rating Council (NFRC) is responsible for setting the standards for the measurement and metrics
associated with windows and skylights, the researchers will present findings from this work to
the NFRC and the idea of system-level BSDFs to NFRC.
Project 5: Fault Detection and Diagnostics
The objective of the Rooftop Unit (RTU) Fault Detection and Diagnostics research project was to
improve the potential energy performance in HVAC RTUs of 5-50 tons21 in California through
three research outcomes: 1) develop and deploy software for evaluating diagnostic protocols
that identify and measure the severity of operating faults in RTUs, 2) conduct a market
assessment on the availability, usability and cost-benefit of commercially available FDD
20 Fenestration refers to the design and characteristics of windows and other exterior openings of a
building.
21 A ton is a unit of heating or cooling for HVAC equipment representing 12,000 BTUs

10
products, and 3) propose a minimum standard for FDD functionality to Title 24 part six of the
California Nonresidential Energy Efficiency Standards (Title 24). Full details regarding the
technical work done for this project are found in Appendix A-5.
Background. Rooftop packaged air conditioners are the predominant HVAC (heating,
ventilation and air-conditioning) system found on commercial building rooftops in California
and throughout the United States – cooling over 60% of the commercial floor space22. These
systems do not often enough receive regular and/or thorough preventative maintenance,
primarily because of lack of perceived value by owners and the HVAC service industry. Service
calls are generally limited to filter changes and visual inspection or occur as an emergency
response to major system component failures that impact occupant comfort. Even in the case of
equipment maintained under formal maintenance contracts, technicians typically only detect
severe and obvious fault conditions because their procedures only involve routine qualitative
assessments. This means non-catastrophic faults that cause significant energy waste can go
unnoticed for years.
While private sector companies provide a variety of tools to measure the performance of newly
installed and operating HVAC equipment, there is no national standard for evaluating the
accuracy of available tools their methods for measuring performance in the field. HVAC service
technicians must discern the specific conditions and appropriate tune-up needs of individual
RTUs. Having the ability to verify the accuracy of their methods will ensure the work is being
done effectively and this will result in energy savings for California.
Approach. The research team first undertook a comprehensive review of available FDD
products, services and facility management behaviors related to HVAC operations and
maintenance to identify and prioritize the faults that can be detected by a set of currently (or
shortly available) diagnostic tools, and to evaluate the available tools. The researchers then
identified the minimum requirements for FDD, including communications options for RTUs
that enable cost-effective energy/demand savings. The full FDD Review Report contains
extensive information on the faults affecting FDDs. The criteria for evaluating the products
includes the magnitude of savings, cost effectiveness, frequency and probability of faults,
reliability of products, maintenance issues and definitions.
The Purdue University team developed a software application which runs on a Windows-based
operating system and can determine the types of faults related to the initial goals for an FDD
tool. Called the FDD Evaluator 0.1.1 (the Evaluator), the tool and all related materials are
publicly available on the Purdue FDD website23. The technical report, A Method for Evaluating
Diagnostic Protocols for Packaged Air Conditioning Equipment (Evaluator Report), user guide and
comments from reviewers can be found in Appendix A-5.
22 W. Wang, et. al. PNNL December 2011 Energy Savings and Economics of Advanced Control Strategies
for Packaged Air-Conditioning Units with Gas Heat, pg. vi
23 https://engineering.purdue.edu/FDD_Evaluator

11
The final phase of the project was facilitating development of a proposal to the 2013 Title 24 part
6 buildings standards for FDD. The research team joined forces with the Codes and Standards
Enhancement (CASE) team supported by the California utilities. The collaborative team initially
looked at 11 potential fault detection functions. A working group of the Western HVAC
Performance Alliance (WHPA) including major HVAC manufacturers, researchers, private
engineering company personnel, utility staff and FDD tool providers, negotiated a Title 24
submission package on FDD. This was proposed as a prescriptive measure option, but further
negotiation led to an approved mandatory measure for all new and replacement RTUs 4.5 tons or
larger which becomes effective in January 2014.
Results: The research met its original scope to develop a software tool for evaluating diagnostic
protocols for FDD that determine a) high or low refrigerant charge, b) high or low evaporator
airflow, and c) condenser coil fouling. Added to these initial FDD conditions (thanks to research
collaboration with NIST24) were three new fault evaluation parameters: liquid line restriction,
non-condensable in the refrigerant circuit, and compressor valve leakage, resulting in nine fault
detection areas for the Evaluator tool. Although few commercial FDD tools currently provide
detection for these last three faults, tool providers may be motivated to add these to gain market
position now that a third-party tool can evaluate their accuracy.
Stakeholders made recommendations for additional development and verification of the
Evaluator. Initial response to the Evaluator and its possible use to provide utilities and
regulators with a quality control check on fault detection tools has been positive, and there is
the potential for the Evaluator to become a formal national standard.
Market Connections. The Evaluator was produced, and the tool and documentation are now
publicly available on the Purdue website25. The Evaluator was reviewed by California
regulatory and utility participants as well as public stakeholders to determine what next step
options were of interest for the Evaluator, its use in California and its implications for the 2013
Title 24 Refrigerant Charge and Airflow (RCA) protocol that will be in force January 2014.
The Title 24 approval led to a Special Projects Committee 207 of ASHRAE to develop a national
standard for laboratory methods of test to prove the accuracy for several FDD features. In
addition, a similar proposal based on this work was made to the 2015 International Energy
Conservation Code (IECC) revision process. It is expected that the Title 24 FDD measure will be
adopted in other states in the coming years and in national energy efficiency standards.
A final meeting with California utilities and regulatory staff was held in February 2013 to
demonstrate the Evaluator, its potential for use as a screening tool for utility quality installation
and maintenance programs, and to discuss issues related to the Title 24 RCA diagnostic
protocol. The attendees were very interested in the potential of the Evaluator for use in utility
programs and by Energy Commission staff as a benchmark for potential revision to Title 24 in
the future.
24 National Institute for Standards and Testing (NIST)
25 Ibid

12
In addition to the overview of the meeting topics and discussion presented here, two
stakeholders provided detailed comments along with recommendations for next steps to further
validate and enhance the Evaluator. These comments and related recommendations for next
steps were sent to the CEC, CPUC, and utility staff in the codes and standards as well as
program evaluation offices. The stakeholder-submitted comments are a part of the Evaluator
Report in Appendix A-5.
13
1. Introduction
This is the Final Program Report (Final Report) for the Evidence-based Design and Operations
research program (Program) led by New Buildings Institute (NBI) on behalf of the California
Energy Commission’s Public Interest Energy Research (PIER) program. The research occurred
between October 2008 and March 2013.
This Final Report provides an overview of the Program background and the projects within the
Program research. Each of the key projects has a Chapter in this Final Report, containing
Background (why the research was needed) , Approach (the research tasks details), Findings,
Benefits to California ratepayers, Conclusions and recommended Next Steps. An Appendix is
included for each research project and contains one or more technical reports. This Final Report
and the accompanying technical Appendices are all publicly available at the CEC PIER and the
NBI websites26.
1.1 Background
Public policy in California is pushing for dramatic improvements in the energy efficiency of
new commercial buildings through advanced codes and incentive programs. However, the
ability of new high performance buildings to achieve their energy efficiency targets is quite
variable, with many substantially underperforming when measured energy use is examined.
This energy performance shortfall can be considerable and must be better understood and
corrected so that efficiency “as designed” comes into alignment with efficiency “as measured.”
The goal of this PIER Program was to improve the measured energy performance of the next
generation of buildings. To accomplish this goal, NBI directed a linked series of projects that
examined the reasons for the variable performance utilizing an evidence-based assessment of
high performance buildings. These assessments were made through a series of project elements
focused on identifying key feedback loops and tools that can better inform designers,
operators/owners and tenants (DOTs) about their role in optimizing building performance. The
fundamental theme of the Program was to ‘connect the DOTs’ by identifying the key areas of
performance related to each party having a role in the ultimate energy use.
1.2 The Projects
NBI was the prime research investigator for the Program and also led the project elements
related to whole-building performance (Project 2) and fault detection and diagnosis (Project 5),
as well as the market connections across all projects. To complete detailed research elements
NBI teamed with a series of organizations having specialized expertise. These organizations
included PECI for more detailed field-based whole-building performance assessment (Projects 2
and 3); Ecova on the field investigation and understanding of plug load contributions to energy
26 www.energy.ca.gov/research/index.html www.newbuildings.org/PIER-research

14
use (Project 3); Architectural Energy Corporation, Daylighting Innovations and the California
Lighting Technology Center on improving daylighting predictability and performance (Project
4); and the Western Cooling Efficiency Center and Purdue University on fault detection and
diagnostics in unitary HVAC systems (Project 5). Following is a brief introduction to each
project.
Project 2: High Performance Building Measured Performance - Documented the performance
of a set of California high performance buildings and identified, through modeling and field
metering, key performance indicators (KPIs) specific to designers, operators/owners and
tenants . A new performance review tool was developed, tested and applied with design firms
and building owners in California. The tool and KPIs help to simplify the prediction of building
performance outcomes and can be used to provide prompt, easily understood, actionable
performance feedback to designers, owners and tenants of commercial buildings.
Project 3: Plug Load Savings Assessment - Conducted an in-depth assessment in two
California office buildings of the energy use of the office equipment plug load items (defined as
things such as computers, monitors, imaging equipment, etc., that plug into wall outlets). The
project then determined the extent to which plug load energy use was reduced through
relatively simple low- and no -cost measures. Findings formed the basis for a new guide entitled
Managing Your Office Equipment Plug Loads and were shared widely with utilities and policy-
making entities to support efforts to reduce this growing area of energy use.
Project 4: Enhanced Skylighting Modeling and Validation - Field-tested skylight product
photometrics (characteristics of their ability to transfer light) and materials to establish their
lighting performance properties. The research then developed a new modeled (rather than
physical) test to produce data on the lighting performance information of skylighting products.
The findings can be used by manufacturers to provide more accurate information on their
products at less cost compared to the current method of taking physical lighting performance
measurements of each skylight product. The research data is also compatible with the IESNA
(Illuminating Engineering Society of North America) file formats used by lighting software
programs. This allows the results to be integrated into programs widely used by design teams
and will lead to more consistent and successful integration of daylighting and electric lighting
in commercial buildings.
Project 5: Rooftop Unit Fault Detection and Diagnostics (FDD) - Developed a consensus FDD
standard, in conjunction with the team from the California Codes and Standards Enhancement
(CASE) effort. The FDD project managed and produced a comprehensive FDD product, market
and benefit-cost assessment and stakeholder outreach to establish the commercial and Title 24
viability. Underpinning the goal of advancing FDD technologies into the market for HVAC
RTUS, the project developed and deployed a new FDD diagnostic protocol evaluator designed
to true up diagnostic service protocols and automated diagnostics.
15
2. High Performance Buildings Measured Performance
This chapter summarizes the findings from Project 2: High Performance Buildings Measured
Performance within the PIER program “Evidence-based Design and Operations.” The research
occurred from 2009-2013 and was led by New Buildings Institute (NBI) and supported by
Portland Energy Conservation Inc. for field monitoring.
2.1 Background
In 2008 NBI conducted a nationwide study27 to determine if green buildings, specifically those
built to the Leadership in Energy and Environmental Design New Construction program
(LEED28-NC) – a voluntary program with points for energy efficiency well beyond code levels -
actually achieved the energy savings intended by their design. While many of these buildings
(121 in the 2008 study) did achieve high energy performance (an average of 28% better than a
code-level building), a significant percentage (25%) did not. Achieving the energy performance
that is designed into buildings is a critical function of ensuring energy resource conservation,
greenhouse gas emissions reduction, healthy indoor air quality and lower energy costs for
California ratepayers.
The design and construction of new ‘high performance’ buildings - those designed to high
energy efficiency targets aimed at using far less energy than comparable or simply code-
compliant buildings - has become increasingly prevalent. Yet there remains an inability to
“connect the DOTs” on measured energy performance. Connecting the DOTs is the theme of
this research and refers to the three key groups with responsibility for a building’s measured
(actual energy use on the utility bills) energy performance – the Designers, Operators/Owners
and Tenants (the DOTs).
In California, the state energy code has become progressively more stringent to encourage
higher energy performance. Title 24 part six is the energy code for newly constructed buildings,
establishing establishes an energy budget for a building based upon its occupancy type and
climate zone. Every three years the code is revised to lower energy budgets (EUIs29)
commensurate with advances in energy efficiency technologies for lighting, heating, ventilation
and air conditioning (HVAC), building envelope and domestic hot water. The overarching goals
of having California-specific building codes and appliance standards is to lower energy costs for
ratepayers, ensure healthy buildings and reduce greenhouse gas emissions that contribute to
climate change.
27 NBI, 2008 Energy Performance of LEED for New Construction Buildings
28 LEED certifies new commercial construction buildings as being more environmentally friendly or
‘green’ in areas that include energy efficiency.
29 An energy budget is expressed as an Energy Use Intensity (EUI) in thousands (kilos) of British thermal
units (BTUs) per square foot (SF) of occupied space per year or kBTUs/sf
16
Efforts like the California utilities’ program for energy efficiency in new commercial
construction - Savings By Design - and the national green building program LEED-NC rely on
the results from energy software (modeling) to estimate energy consumption. By comparing the
modeled energy budget to the energy code, these popular programs use models to determine if
the building ‘as designed’ meets the program criteria for being high performance. Generally,
energy and green building programs target energy use that is 15-30% lower than a building
built to a code level, depending on program.
Once occupied and operating, design teams and owners participating in these efficiency
programs rarely learn if their building met the energy performance predicted in the design.
While utility bills provide some general insight about energy consumption, their ability to help
identify what may be causing differences from targets and potential areas to improve is very
limited.
Only a few broad studies have been performed on the measured energy performance of new
commercial buildings designed for high efficiency. All have shown, like the recent LEED study
cited earlier, a wide range of actual performance levels; some have revealed performance far
worse than design expectations. For example, a 1994 study by Lawrence Berkeley National
Laboratory (LBNL) saw energy use differing by a factor of over four for 28 new commercial
buildings participating in a Northwest program called Energy Edge. A 2003 NBI study of 157
California commercial buildings showed as-constructed savings (using California’s energy code
as a baseline) ranging from -100% to +50%.
This disparity between expectations and apparent energy use can be linked to actions in the
design, construction, commissioning, occupancy and operation stages. At the time this research
was proposed, a good feedback system did not exist for capturing and parsing post-occupancy
energy results in a way that informed each party of the role their actions play and how they
may affect future performance. For designers, that feedback can inform and improve future
designs. It can guide building owners in their investments and direct operation practices. And
occupants can learn how to recognize and change the way their activities are increasing energy
use.
Currently the primary energy review methods involve extensive investments in energy
information systems that monitor all the energy-using parts of a building via sensors, wiring,
computer analysis and/or a physical audit by a professional energy engineering company.
These approaches are beyond the funds, and needs, of most commercial buildings – the
majority of which are small and medium in size30. And while whole-building actual energy use
information arrives each month in the form of a utility bill, it provides no insight on which
aspects of the building are using energy and where to pursue efficiency improvements.
The premise of the research presented in this chapter - Project 2 in “Evidence-Based Design and
Operations” - is that designing a building to high energy standards by itself does not guarantee
high energy performance. Tenant behavior - particularly in the case of the use of plug-in devices
30 Less than 50,000 square feet. Source: Energy Information Agency 2003

17
- as well as facility operations and maintenance practices affect energy use and performance.
Identifying the areas of energy use, level of impact, and metrics and feedback methods
appropriate to each of the DOTs can help close the loop on which actions and activities directly
impact energy performance once a building has been constructed and occupied.
While benchmarking programs like the U.S. Environmental Protection Agency’s (EPA) Energy
Star Portfolio Manager use measured performance data to compare a particular building’s
energy use to national benchmarks for similar buildings, it gives no additional insights into
what areas to investigate for further energy efficiency improvements. Metering and audits are
expensive, and it is difficult to know where to start or what to do to assess and improve energy
performance.
2.1.1 Objective
This project’s objective was to identify typical patterns affecting energy performance outcomes
in high performance buildings and develop easily understood metrics and feedback directed to
the designers, owner/operators and tenants, thus connecting the ‘DOTs’ of energy performance.
Armed with this information, the DOTs can directly and effectively participate in efforts to
improve building performance, increasing the number of buildings that are not only designed
to high performance standards but also truly meet or exceed these goals.
The project tasks included documenting the performance of a set of California high [energy]
performance buildings, developing and using a software tool to identify critical indicators and
simplify the representation of building energy performance (specifically how and why energy is
used). The key indicators are often tied to operational practices and tenant behavior.
The research focus was to design performance reporting via a simple-to-use analysis tool that
provides easily understood and actionable feedback that can lower energy use. This tool has
applications and relevance for the DOTs and other commercial building professionals. This
information will allow these groups to directly and effectively participate in efforts to improve
building performance, thereby increasing the number of buildings that are not only designed to
high performance standards but also truly meet or exceed objectives.
The research involved three tasks: 1) Measured Performance Assessment of a set of recently
constructed buildings in California that targeted high energy performance, 2) Sensitivity
Analysis that assessed how ‘sensitive’ the energy use of buildings is (the magnitude of change)
in response to changes of efficiency measures and practices, and 3) identification and
development of Key Performance Indicators of energy performance relative to each of the
DOTs. This project summary presents each of these areas with a section on Approach,
Outcomes and Findings, and Market Connections, followed by sections on Benefits to California
and Conclusions.
2.2 Measured Performance Assessment
The Measured Performance Assessment task involved two phases: a) an initial view of the
energy performance of buildings – individually and compared to benchmarks, and b) site
assessments of approximately half of the initial set of buildings.

18
2.2.1 Approach
The research team began its work by conducting outreach to utility program managers, design
firms, building operators, the California Chapter of the United States Green Building Council
(USGBC) and American Institute of Architects (AIA) chapters. California commercial buildings
less than five years old and designed to ‘high performance’ standards were recruited for this
study. In this case, ’high performance standards’ meant those buildings designed to incorporate
LEED criteria, Savings by Design targets and/or energy performance targets at least 20% above
the California Title 24 non-residential energy code in place at the time of construction.
An example of LEED energy criteria is Energy and Atmosphere credit 1 (EA 1) that encourages
the building to exceed the mandatory provisions specified in sections of ASHRAE 90.1 in order
to maximize energy performance. Savings by Design is a voluntary incentive program for
design teams and owners within California investor-owned utility service territories to design
buildings that model 15-30% better than the State’s building code. During the outreach phase,
preliminary information on over 75 buildings was gathered, and 22 were selected for the study.
These buildings were constructed from 2004 to 2006, had detailed information on characteristics
and energy use, and expressed interest in participating in the study.
The next step was to compare the energy performance of these relatively newly constructed
buildings to similar buildings in California and the United States. This was done remotely, i.e.,
without a site visit. The team collected and reviewed basic information on building
characteristics, conducted phone interviews with tenants and operators, reviewed utility bills,
and used a new remote energy analysis tool called FirstView™ to better understand how the
buildings were operated and used by tenants. Using FirstView, NBI provided building owners
(and their utilities) with reports specific to their building. Researchers also correlated each
building’s specific design and operational characteristics to actual energy performance.
The remote assessments helped identify the features and systems that would be the most
informative focus of additional data gathering. A further subset of 12 buildings was chosen for
Site Assessments - onsite visits to gather detailed data. This data was used to generate
individual performance assessments, identify strategies to potentially reduce energy use,
estimate potential energy savings from employing those strategies and gain important insight
for understanding cross-cutting lessons that formed the basis for analysis and development of
feedback systems.
2.2.2 Measured Performance Assessment Findings and Outcomes
Common energy efficiency benchmarks against which the energy use of a building is compared
include the as-designed model of the building’s energy use, building energy codes or standards,
scores established under green or energy efficiency programs such as LEED or Energy Star,
and/or similar type occupancy buildings (sometimes referred to as ‘peer’ buildings). Data
sources often cited to provide peer building comparisons include the Commercial Building
Energy Use Survey (CEBES) and the California End Use Survey (CEUS), both of which are
based on data from metered building energy use.
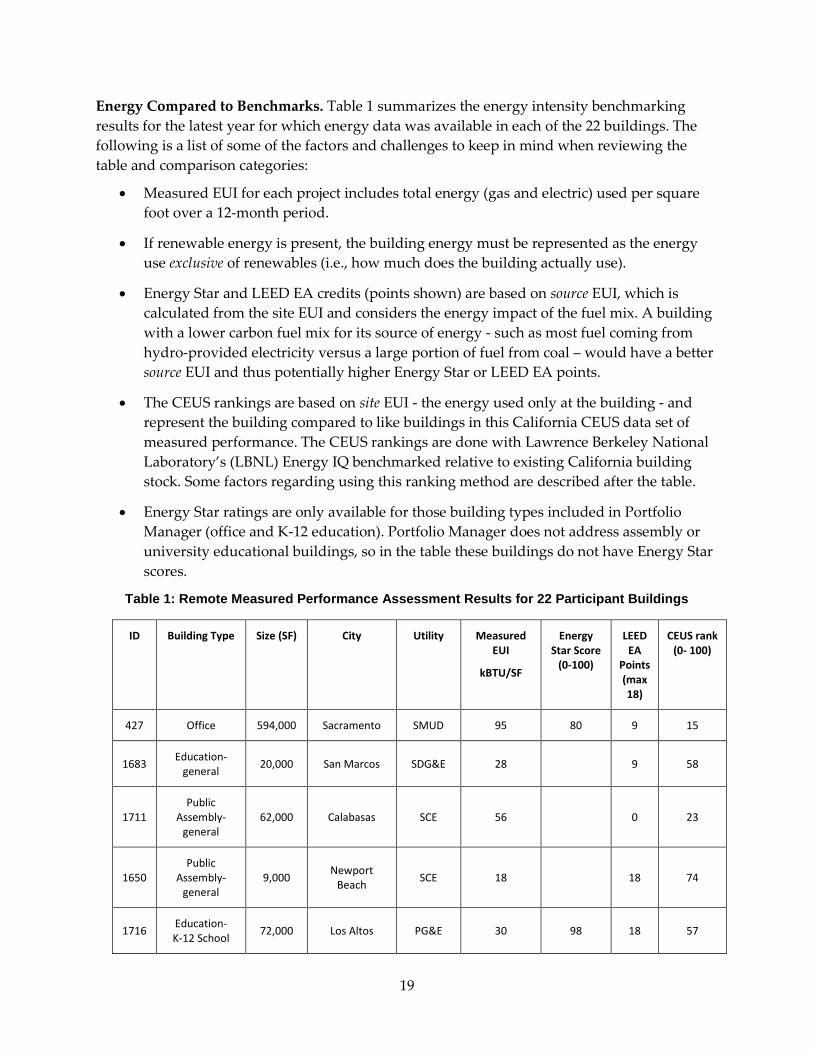
19
Energy Compared to Benchmarks. Table 1 summarizes the energy intensity benchmarking
results for the latest year for which energy data was available in each of the 22 buildings. The
following is a list of some of the factors and challenges to keep in mind when reviewing the
table and comparison categories:
Measured EUI for each project includes total energy (gas and electric) used per square
foot over a 12-month period.
If renewable energy is present, the building energy must be represented as the energy
use exclusive of renewables (i.e., how much does the building actually use).
Energy Star and LEED EA credits (points shown) are based on source EUI, which is
calculated from the site EUI and considers the energy impact of the fuel mix. A building
with a lower carbon fuel mix for its source of energy - such as most fuel coming from
hydro-provided electricity versus a large portion of fuel from coal – would have a better
source EUI and thus potentially higher Energy Star or LEED EA points.
The CEUS rankings are based on site EUI - the energy used only at the building - and
represent the building compared to like buildings in this California CEUS data set of
measured performance. The CEUS rankings are done with Lawrence Berkeley National
Laboratory’s (LBNL) Energy IQ benchmarked relative to existing California building
stock. Some factors regarding using this ranking method are described after the table.
Energy Star ratings are only available for those building types included in Portfolio
Manager (office and K-12 education). Portfolio Manager does not address assembly or
university educational buildings, so in the table these buildings do not have Energy Star
scores.
Table 1: Remote Measured Performance Assessment Results for 22 Participant Buildings
ID Building Type Size (SF) City Utility Measured EUI
kBTU/SF
Energy Star Score
(0-100)
LEED EA
Points (max 18)
CEUS rank (0- 100)
427 Office 594,000 Sacramento SMUD 95 80 9 15
1683 Education-
general 20,000 San Marcos SDG&E 28 9 58
1711 Public
Assembly- general
62,000 Calabasas SCE 56 0 23
1650 Public
Assembly- general
9,000 Newport
Beach SCE 18 18 74
1716 Education- K-12 School
72,000 Los Altos PG&E 30 98 18 57

20
ID Building Type Size (SF) City Utility Measured EUI
kBTU/SF
Energy Star Score
(0-100)
LEED EA
Points (max 18)
CEUS rank (0- 100)
519 Office 72,000 Bakersfield PG&E 75 75 4 7
1715 Office 72,000 Bakersfield PG&E 117 24 0 8
1742 Education- K-12 School
242,000 San Diego SDG&E 46 92 16 14
1652 Education-
general 82,000 Claremont SCE 128 0 1
1658 Courthouse 496,000 Fresno PG&E 54 87 14 73
1719 Library 19,000 San Jose PG&E 84 1 15
1662 Library 96,000 San Mateo PG&E 38 13 32
1678 Education- K-12 School
75,000 Santee SDG&E 33 90 15 48
1679 Education- K-12 School
56,000 Santee SDG&E 26 98 18 61
1680 Education- K-12 School
62,000 Santee SDG&E 24 98 18 65
1681 Education- K-12 School
63,000 Santee SDG&E 21 99 18 70
1682 Education- K-12 School
33,000 Santee SDG&E 35 97 18 32
526 Office 107,000 San Diego SDG&E 38 88 14 59
1642 Recreation 60,000 Rohnert Park PG&E 62 0 22
1677 Office 14,000 Oakland PG&E 49 84 12 39
1651 Office 624,000 Torrance SCE 81 93 17 34
1722 Recreation 32,000 Palo Alto PG&E 58 0 22
Table 1 shows most of these buildings performed much better than the national average for
their type as represented by an Energy Star score. Of those eligible for an Energy Star score,
over 70% are in the top 10% of buildings nationally.

21
The rankings within CEUS shown in Table 1 are highly variable, despite all buildings having
targeted high performance in energy efficiency. For office buildings and schools this
comparison gives a very different impression of performance levels than did Energy Star
ratings, with the results spread across the entire CEUS range rather than being in the top tier
due to their high performance objectives, as seen in Table 1. This difference could be related to
several factors:
For offices, CEUS benchmark varies by size (less or greater than 150,000 square feet), so
it is important to apply the correct reference aligned with the building size.
A lack of normalization in the CEUS percentiles for characteristics such as schedule,
office equipment density, etc.
California’s more aggressive code requirements logically lead to a more challenging peer
group than the national Energy Star benchmark.
The small size of the data sample here, which is only illustrative, is not large enough to
be broadly representative.
Despite these distinctions, this set of buildings was not exceptionally better in measured energy
use than the CEUS buildings despite their high performance energy design intent. The analysis
showed little correlation between measured energy performance (EUI and Energy Star score)
and ratings based on estimates and models such as LEED energy points. As illustrated in Figure
1, buildings with similar LEED energy and atmosphere points (which are based on energy
models, note the building’s diamonds with 14, 12 and 17 LEED points) varied by 25-50% in
EUIs and widely compared to the CEUS benchmarks. The further demonstrates the variations
between how the building was expected to perform and its actual measured outcomes and
validated the need for the research outcomes on measured performance feedback.
Figure 1: Whole Building Energy Performance of Six Studied Offices Compared to CEUS
Efficiency Measures. In addition to monthly utility bills and building characteristics,
participants reported the energy conservation equipment or characteristics found in each of the
22 high performance buildings. Figure 2 summarizes the percentage of buildings reporting the
presence of various efficiency measures.

22
Figure 2: Percent of Buildings Reporting Energy Conservation Measures
Benchmark comparisons as well as system characteristics were summarized in individual
building reports provided to study participants. The reports were intended to provide the first
feedback loop to designers, owners/operators and tenants, helping them understand how their
building is using energy and provide actionable feedback on energy performance. These reports
were based solely on a remote analysis and included feedback from a new tool called FirstView,
piloted as part of this research. The FirstView tool is further explained below.
2.2.3 New Performance Review Tool: FirstView
The initial performance assessments of the 22 buildings were done strictly from data provided
to the research team via email from the design team, owner or operators using an evolving new
tool called FirstView. Because it does not require a site visit, this type of review is often referred
to as a ‘remote’ assessment or ‘touch-less audit’. The ability to determine energy performance
from simple data (monthly bills) and without the cost of a site visit is one of the key objectives
of FirstView and other remote assessment tools.
FirstView Description and Examples. At this phase of the research FirstView was a
sophisticated but limited spreadsheet internal to NBI, developed with initial funding from the
0% 25% 50% 75% 100%
LIGHTINGHigh efficiency lighting
DaylightingOccupancy sensors / Lighting …
Exterior window shadingInterior window blinds
Light sensor controls
HEATING, COOLINGEnergy monitoring systems
High efficiency condensing boilersUnderfloor air distribution
Evaporative coolingEnergy recovery
Other high efficiency equipmentRadiant floor heating
VENTILATIONCO2 Sensors
Natural ventilationIncreased ventilation rate
Operable windowsNight venting
SHELLReflective roofs
High performance glassIncreased insulation
Thermal mass
ON-SITE RENEWABLESSolar PV
Reported Measure Frequency (from total of 22 participants)
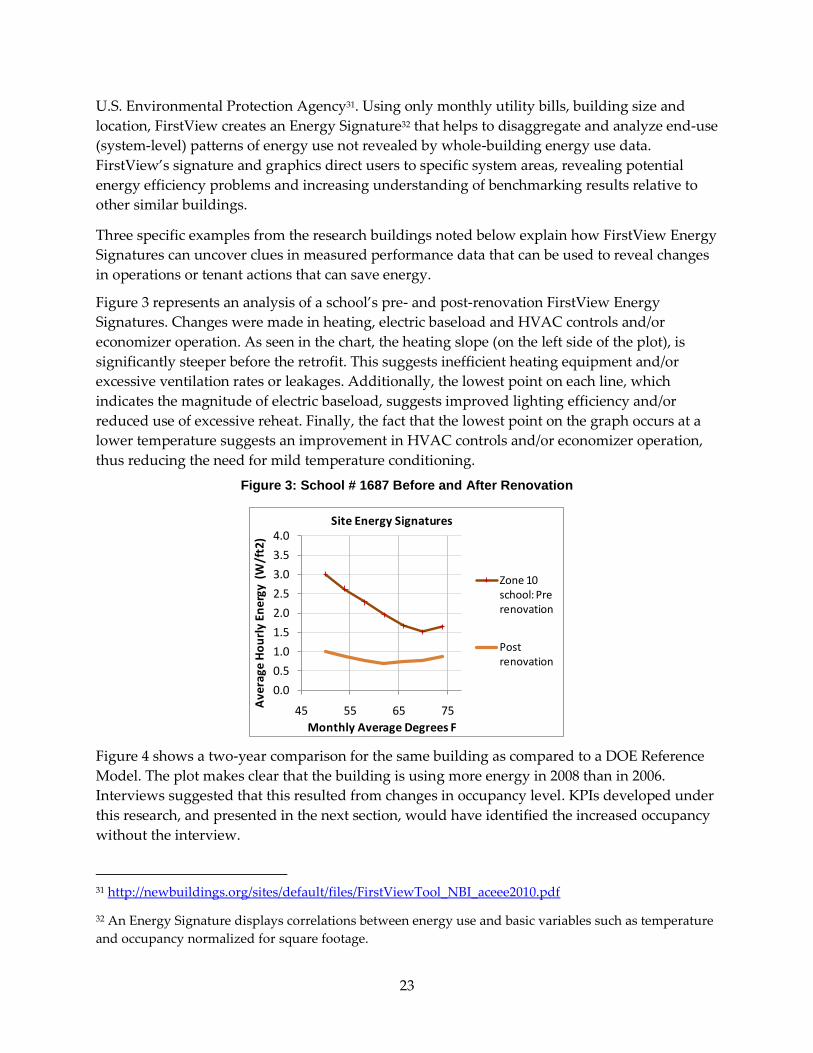
23
U.S. Environmental Protection Agency31. Using only monthly utility bills, building size and
location, FirstView creates an Energy Signature32 that helps to disaggregate and analyze end-use
(system-level) patterns of energy use not revealed by whole-building energy use data.
FirstView’s signature and graphics direct users to specific system areas, revealing potential
energy efficiency problems and increasing understanding of benchmarking results relative to
other similar buildings.
Three specific examples from the research buildings noted below explain how FirstView Energy
Signatures can uncover clues in measured performance data that can be used to reveal changes
in operations or tenant actions that can save energy.
Figure 3 represents an analysis of a school’s pre- and post-renovation FirstView Energy
Signatures. Changes were made in heating, electric baseload and HVAC controls and/or
economizer operation. As seen in the chart, the heating slope (on the left side of the plot), is
significantly steeper before the retrofit. This suggests inefficient heating equipment and/or
excessive ventilation rates or leakages. Additionally, the lowest point on each line, which
indicates the magnitude of electric baseload, suggests improved lighting efficiency and/or
reduced use of excessive reheat. Finally, the fact that the lowest point on the graph occurs at a
lower temperature suggests an improvement in HVAC controls and/or economizer operation,
thus reducing the need for mild temperature conditioning.
Figure 3: School # 1687 Before and After Renovation
Figure 4 shows a two-year comparison for the same building as compared to a DOE Reference
Model. The plot makes clear that the building is using more energy in 2008 than in 2006.
Interviews suggested that this resulted from changes in occupancy level. KPIs developed under
this research, and presented in the next section, would have identified the increased occupancy
without the interview.
31 http://newbuildings.org/sites/default/files/FirstViewTool_NBI_aceee2010.pdf
32 An Energy Signature displays correlations between energy use and basic variables such as temperature
and occupancy normalized for square footage.
0.0
0.5
1.0
1.5
2.0
2.5
3.0
3.5
4.0
45 55 65 75
Ave
rage
Ho
url
y En
erg
y (
W/f
t2)
Monthly Average Degrees F
Zone 10 school: Pre renovation
Post renovation
Site Energy Signatures
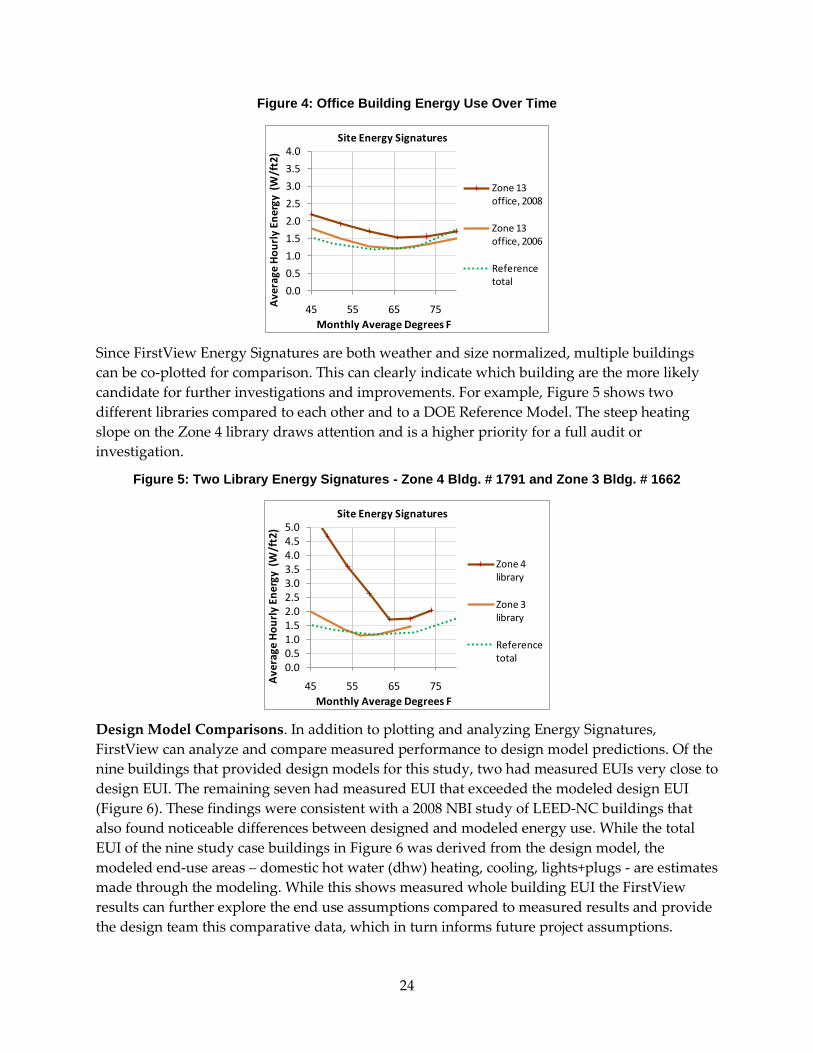
24
Figure 4: Office Building Energy Use Over Time
Since FirstView Energy Signatures are both weather and size normalized, multiple buildings
can be co-plotted for comparison. This can clearly indicate which building are the more likely
candidate for further investigations and improvements. For example, Figure 5 shows two
different libraries compared to each other and to a DOE Reference Model. The steep heating
slope on the Zone 4 library draws attention and is a higher priority for a full audit or
investigation.
Figure 5: Two Library Energy Signatures - Zone 4 Bldg. # 1791 and Zone 3 Bldg. # 1662
Design Model Comparisons. In addition to plotting and analyzing Energy Signatures,
FirstView can analyze and compare measured performance to design model predictions. Of the
nine buildings that provided design models for this study, two had measured EUIs very close to
design EUI. The remaining seven had measured EUI that exceeded the modeled design EUI
(Figure 6). These findings were consistent with a 2008 NBI study of LEED-NC buildings that
also found noticeable differences between designed and modeled energy use. While the total
EUI of the nine study case buildings in Figure 6 was derived from the design model, the
modeled end-use areas – domestic hot water (dhw) heating, cooling, lights+plugs - are estimates
made through the modeling. While this shows measured whole building EUI the FirstView
results can further explore the end use assumptions compared to measured results and provide
the design team this comparative data, which in turn informs future project assumptions.
0.0
0.5
1.0
1.5
2.0
2.5
3.0
3.5
4.0
45 55 65 75
Ave
rage
Ho
url
y En
erg
y (
W/f
t2)
Monthly Average Degrees F
Zone 13 office, 2008
Zone 13 office, 2006
Reference total
Site Energy Signatures
0.00.51.01.52.02.53.03.54.04.55.0
45 55 65 75
Ave
rage
Ho
url
y En
erg
y (
W/f
t2)
Monthly Average Degrees F
Zone 4 library
Zone 3 library
Reference total
Site Energy Signatures

25
Figure 6: Participant Design Models Compared to Measured EUI Totals
FirstView’s disaggregation of both predicted and measured loads can be used to compare to a
model’s results and further pinpoint inconsistencies between expectations and reality. Occupant
schedules, plug loads and the hours of use for lighting are often mentioned as reasons for an
over-prediction of energy savings in models. In many cases this is true. Yet as shown in Figure
7, domestic hot water and cooling energy are also of concern. The ability to pull out this detail
helps pinpoint opportunities to employ specific energy efficiency strategies related to tenant
practices or operations and maintenance.
Figure 7: Design versus Actual End Use Split
Diagnostics. FirstView diagnostics are mathematical thresholds of performance revealed in the
algebra underlying the Energy Signature plot. As part of this work analysts set diagnostic
thresholds for office buildings to allow for comparison in six functional areas (electric baseload,
gas baseload, controls, reheat, heating impact of shell/ventilation and cooling efficiency).
FirstView automatically compares a reference building to these thresholds, identifying which
0
20
40
60
80
100
120
140
EUI
(kB
tu/s
f)
Study Case ID Number
dhw
heating
cooling
lights+plugs
Actual
DOE reference models
Modeled end use
0
10
20
30
40
50
60
70
80
90
519 Design
519 Actual
EUI
(kB
tu/s
f)
Study Case ID Number
dhw
heating
cooling
lights+plugs
Actual
Modeled end use

26
specific sub-areas may hold opportunities for improvement. For example, the total heating
impact of shell and ventilation is graphically represented in the heating slope. When this
heating slope is steeper than expected based on comparison to the reference building FirstView
can ‘flag’ the item. These automated flags make FirstView a valuable tool in communicating
with commercial building professionals because it can quickly direct attention to inefficiencies
associated with high ventilation rates, high lighting and plug load use, controls scheduling,
simultaneous heating and cooling, etc.
Site Assessments. Site assessments on 12 of the 22 buildings provided additional insights into
the performance levels uncovered during the remote assessments. Specifically, site visits
confirmed that operation and maintenance significantly impact energy performance in
relatively-low-energy-use-by-design buildings.
Interviews conducted with occupants onsite found many were unaware of their building’s
design features. In some instances this ignorance led to underutilized strategies (such as natural
ventilation) or disabled strategies (like daylighting controls). When possible, future occupants
should be engaged in the building design process so they are aware of the energy efficiency
design strategies that are effectuated by thoughtful building operations.
With regard to systems, site assessments suggested that complex systems with controls do not
necessarily ensure energy savings. In order to realize energy savings, these systems and their
controls must be thoroughly studied, understood, calibrated and tested (through functional
testing or commissioning) to ensure achievement of energy-related design intent. Optimal
system performance also requires a trained building operator.
Controls continue to be a challenge. On the mechanical side, demand-controlled ventilation
strategies were frequently observed to be nonfunctional (either controls strategies were not set
up properly, or setpoints were overridden). And while lighting systems and occupancy sensors
were functioning 20-30% below code lighting power density (LPD) levels, daylighting controls
designed to use natural light to displace electric lighting during the daytime were either not
installed or nonfunctional at 9 of 12 sites.
Most sites had superior building envelope features; only minimal design flaws and construction
issues were noted by design team or facility staff. Roof and wall insulation levels were typically
observed to be 10-20% better than code-required levels. Low-e glazing, reflective roofing and
window-to-wall ratios lower than 20% were consistently observed. Both automatic and manual
shading devices obtained less than ideal energy savings because occupants didn’t know how or
when to employ them or the systems were made with materials that did not adequately reduce
glare. Finally, researchers noted a wide diversity of plug load devices in use and
underutilization of plug load energy-use reduction strategies, such as computer energy
management software.
FirstView Pilot Test. Once the remote assessments confirmed that FirstView would be a
valuable market tool, the next step was to transform the early spreadsheet version into a ‘beta’
tool accessible via the web. The work to refine and automate FirstView, rigorously test the beta

27
version through a pilot and collect follow-up information via user surveys is a significant
outcome of this project.
More than 70 individuals and entities were solicited to join the FirstView web tool pilot, which
focused on California office buildings that use both gas and electric (two fuel buildings) and
had minimal process loads and constant seasonal occupancy. A total of 28 companies
participated in the pilot, half of which represented firms from or doing business in California.
The pilot test was national in order to a) solicit firms outside of California that do business in
the state, b) increase participation and c) recognize the support of other funders toward
FirstView.
Table 2 lists FirstView pilot participants with work in California and additional participants
whose insights have added to the overall lessons learned in the pilot.
Table 2: FirstView Pilot Test Participants
With Work in California Additional National/International Participants
Organization City State Organization City State
1 Carbon Lighthouse
San Francisco
CA 1 Self-proprietor
Eugene OR
2 Ecology Action Santa Cruz CA 2 Mesa Point Energy
Louisville CO
3 City of San Francisco Dept. of Environment & Energy
San Francisco
CA 3 National Trust for Historic Preservation
Seattle WA
4 Friends of San Francisco Environment
San Francisco
CA 4 Microgrid Portland OR
5 EHDD San Francisco
CA 5 Energy RM Portland OR
6 Cadmus Group
Irvine CA 6 BC Hydro Vancouver BC
7 ZGF Architects Portland OR 7 Cascade Energy
Portland OR

28
With Work in California Additional National/International Participants
Organization City State Organization City State
8 SERA Architects
Portland OR 8 Victoria University
Wellington New Zealand
9 Student San Francisco
CA 9 BOMA Vancouver BC
10 UC Davis Davis CA 10 NorthWrite Lake Oswego
OR
11 Waypoint Building Group
San Francisco
CA 11 National Grid Waltham MA
12 Jonathan Rose Companies
New York NY 12 University of Pennsylvania
Philadelphia PA
13 City Planning Dept.
Berkeley CA 13 Portland State University
Portland OR
14 Glenborough Properties
San Mateo CA 14 Vermont Energy Investment Corp.
Proctor VT
Pilot participants submitted 45 buildings33 representing over 4.6 million square feet of
commercial office real estate, approximately 2.3 million square feet of it in California.
FirstView User Survey. NBI requested all participants in the FirstView beta test take a short
survey to share their thoughts in the following four areas: overall impressions, user experience,
recommended features and improvements, and demographics. Feedback from online surveys
and phone interviews was generally positive. Over 80% of respondents believed FirstView
could become their process for analyzing energy use or be used to enhance existing processes.
Over 70% had been using Energy Star Portfolio Manager or a simple spreadsheet to track
monthly energy use.
Feedback from respondents can be categorized generally into the following key themes:
Target Audience - Results were more meaningful and understood when an experienced
analyst could explain the results and implications. On their own, FirstView reports were
33 Participants were ensured that specific building names, exact size and owners’ input in the FirstView
beta web tool would be confidential.
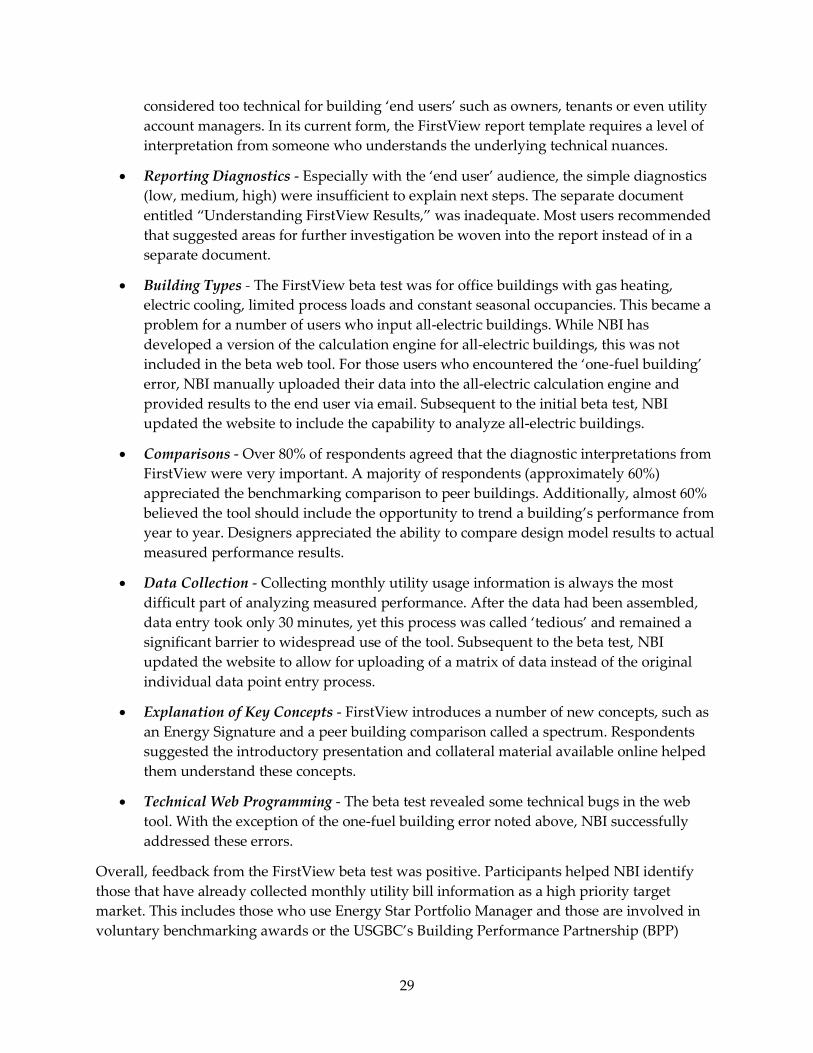
29
considered too technical for building ‘end users’ such as owners, tenants or even utility
account managers. In its current form, the FirstView report template requires a level of
interpretation from someone who understands the underlying technical nuances.
Reporting Diagnostics - Especially with the ‘end user’ audience, the simple diagnostics
(low, medium, high) were insufficient to explain next steps. The separate document
entitled “Understanding FirstView Results,” was inadequate. Most users recommended
that suggested areas for further investigation be woven into the report instead of in a
separate document.
Building Types - The FirstView beta test was for office buildings with gas heating,
electric cooling, limited process loads and constant seasonal occupancies. This became a
problem for a number of users who input all-electric buildings. While NBI has
developed a version of the calculation engine for all-electric buildings, this was not
included in the beta web tool. For those users who encountered the ‘one-fuel building’
error, NBI manually uploaded their data into the all-electric calculation engine and
provided results to the end user via email. Subsequent to the initial beta test, NBI
updated the website to include the capability to analyze all-electric buildings.
Comparisons - Over 80% of respondents agreed that the diagnostic interpretations from
FirstView were very important. A majority of respondents (approximately 60%)
appreciated the benchmarking comparison to peer buildings. Additionally, almost 60%
believed the tool should include the opportunity to trend a building’s performance from
year to year. Designers appreciated the ability to compare design model results to actual
measured performance results.
Data Collection - Collecting monthly utility usage information is always the most
difficult part of analyzing measured performance. After the data had been assembled,
data entry took only 30 minutes, yet this process was called ‘tedious’ and remained a
significant barrier to widespread use of the tool. Subsequent to the beta test, NBI
updated the website to allow for uploading of a matrix of data instead of the original
individual data point entry process.
Explanation of Key Concepts - FirstView introduces a number of new concepts, such as
an Energy Signature and a peer building comparison called a spectrum. Respondents
suggested the introductory presentation and collateral material available online helped
them understand these concepts.
Technical Web Programming - The beta test revealed some technical bugs in the web
tool. With the exception of the one-fuel building error noted above, NBI successfully
addressed these errors.
Overall, feedback from the FirstView beta test was positive. Participants helped NBI identify
those that have already collected monthly utility bill information as a high priority target
market. This includes those who use Energy Star Portfolio Manager and those are involved in
voluntary benchmarking awards or the USGBC’s Building Performance Partnership (BPP)
30
program. Other audiences include resource conservation managers at municipal governments
as well as ‘early-adopter’ engineering and auditing firms.
2.2.4 Measured Performance Assessment Market Connections
The intent of the market connections work was to improve the relevance and applicability of the
research and increase the adoption of findings. NBI connected this research with the market by
engaging market actors directly as advisors, engaging actual buildings in the Measured
Performance Assessments and FirstView beta test and leveraging utility and energy disclosure
programs in California. Additionally, NBI has made efforts to commercialize FirstView,
engaging new customers and new marketplace approaches. While the assessments (22
buildings) and beta test (45 buildings) have already been described in detail, the other market
connections work is described below.
Advisors. NBI assembled the California Advisors on Measured Performance (CAMP), a group
of leading commercial building professionals representing 23 different firms and organizations
that offered their perspectives on various measured performance efforts. CAMP members are
listed in the Acknowledgements Section:
CAMP members provided insights into current best practices in the area of Measured
Performance, identified buildings for participation in the research, and served as a sounding
board for new approaches recommended by NBI.
Utility Program Integration. Program integration is a critical part of the market connections
work. This included connecting back to utility Savings by Design programs and other regional
and national programs promoting the use of measured performance feedback. This includes
presenting the research results to utilities in California and at national conferences like the
American Council for an Energy Efficiency Economy (ACEEE) Summer Study and Market
Transformation Symposium.
As one outreach method the initial building solicitation for participants went through the roster
of California utilities and yielded some of the final participants. Representatives from Pacific
Gas and Electric Company’s (PG&E) Savings by Design, Sempra’s Emerging Technologies
program and the Sacramento Municipal Utility District (SMUD) were all part of CAMP.
California utilities were informed of the participants in their service area and the research
results.
The major utilities - Southern California Edison, PG&E, SMUD and Sempra - participated in
meetings and webinars at which NBI presented the FirstView technology, and they were
invited to participate in the FirstView beta test. NBI followed this up with email correspondence
and multiple phone calls to targeted individuals within the utility. Still, the California utilities
did not directly participate in the FirstView beta test. However, Ecology Action, a consulting
firm that serves as a third-party implementer of utility efficiency programs, did test the tool, as
did as StopWaste.Org, which provides energy efficiency services within Alameda County. They
found it to be quite useful as a ‘no-touch’ diagnostic and a way to potentially priorities and
target efficiency programs.
31
Public Policy Integration. Integration of performance feedback tools like FirstView into local
and state-level [energy performance] disclosure policies is one possible link to codes and
standards demonstrated through this work. The FirstView beta test included a representative
from the City of San Francisco responsible for implementing that city’s mandatory disclosure
policy for commercial buildings. He noted that under their disclosure policy the City receives
an annual portfolio manager score and verification that an engineering audit was performed on
each building. Disclosure currently addresses only large buildings, but since they do not receive
the monthly utility bills as required to run FirstView, it is difficult to integrate it into the current
policy.
The representative from San Francisco suggested NBI coordinate with an EPA Energy Star
Portfolio Manager since most buildings are collecting this information in that format. Another
idea was to create a San Francisco office ‘spectrum’ and require a formal audit only if a building
is above a certain defined threshold. This could minimize the overall cost of implementing the
disclosure policy and focus auditing resources where most needed. NBI’s work that preceded
FirstView began under a contract with the U.S. Environmental Protection Agency, and the
research continues to try to align with EPA regarding integration with the Portfolio Manager
tool. This will continue to be an important market tool to align with and is the reason
FirstView’s input data is the same as that for Energy Star Portfolio Manager.
Other California municipalities are not as far along in disclosure policies as San Francisco. NBI
is currently working with StopWaste.Org and the City of Berkeley on their voluntary disclosure
program. Berkeley and other Alameda County municipalities have asked StopWaste.Org to
organize the information collected as part of mandatory disclosure policies. This could be an
important avenue to connecting the FirstView tool to California public policy.
PIER resources have made FirstView available to those buildings in Alameda County that
participate in an annual Energy Benchmarking awards program. NBI partnered with
StopWaste.Org, the City of Berkeley, and other cities in Alameda County to integrate FirstView
into this Benchmarking program. As outlined in a formal Memorandum of Understanding, NBI
agreed to train local representatives on FirstView and gave them free access and some support
to the web tool for 2013 so they can download data and create reports for their program
participants. NBI also supported the development of a comprehensive communications
platform to promote the awards program
Additional FirstView Users. By leveraging this PIER work, NBI has a number of other partners
who have used or plan to use FirstView.Table 3 summarizes these public partners and the
number of buildings involved.

32
Table 3: Summary of FirstView Tool Users
Partner Organization Number of FirstView Reports
Notes
Alameda County Benchmarking Awards
80 Goal of 40 organizations and 80 buildings in Alameda County
USGBC’s Building Performance Partnership Program
275 86 of the reports were for California buildings
Rocky Mountain Institute’s Portfolio Challenge AT&T Buildings
34 3 of the reports were for California buildings
City of Seattle 50 All city libraries and fire stations analyzed for the staff resource conservation manager
NSTAR 10 Utility is investigating opportunity associated with using FirstView as a way to prioritize energy efficiency programs.
Center for Energy and Environment – Minnesota
30 Estimated number during 2013
Seattle 2030 District 75 Estimated number during 2013
A Path to New Products. Another unique connection of FirstView to the market involves a new
financing structure to create power purchase agreements. This is the focus of a private-sector
firm, Energy Resource Management (ERM). NBI maintains a Memorandum of Understanding
with ERM, which patented the FirstView engine technology and serves as a gateway firm to a
major breakthrough in performance tracking. ERM is currently working with the Oregon Public
Utility Commission, Northwest Energy Efficiency Alliance, Energy Trust of Oregon, Seattle City
Light and others interested in leveraging the FirstView calculation engine to support a
secondary tool – DeltaMeter - to verify savings under a Power Purchase Agreement model.
2.3 Sensitivity Analysis
Once the assessments were completed, researchers attempted to determine what metrics were
most useful to collect, weighing the value of the information gathered and the cost of audits and
metering to obtain the data. A sensitivity analysis helped discern the relative magnitude of
energy impact that modifications to design, operation and tenant behavior measures and
characteristics have on total building energy use.
2.3.1 Approach
Using the U.S. Department of Energy (DOE)/National Renewable Energy Laboratory mid-size
office prototype as a representative building type, researchers defined a set of 28 distinct
features representing physical, operational and occupant characteristics of buildings that affect
total energy use. These characteristics included physical features, heating, ventilation and air-

33
conditioning (HVAC) and lighting system characteristics, operational practices and tenant
behavior patterns. These 28 features are shown below in Figure 8 (19 features relative to design)
and Figure 9 (9 features relative to operations and tenants).
The goal was to identify the physical and operational characteristics that are the most
significant predictors of energy performance (the key performance indicators) for a building in
a particular climate zone.
Essentially, the sensitivity analysis was a modeling exercise where each characteristic (such as
lighting power density or HVAC system type) had a range of values representing poor, baseline
and good practice. Each variable was individually modified from low to high performance; all
other characteristics were kept at the baseline performance level in order to evaluate the impact
on total building energy use. To more accurately represent interactive effects, researchers
analyzed packages of good and poor measures to represent various combinations of these
strategies. The results of 20,000 model runs in 16 different U.S. climate zones showed the range
of performance and sensitivity that each of the characteristics had on performance.
2.3.2 Sensitivity Analysis Findings and Outcomes
Results of the modeling scenarios showed the relative magnitude of various design, operations
and use characteristics on energy use in the climate zone for California used in the analysis -
Los Angeles California Climate Zone 6.
In Figure 8 – building systems - the measures that have the most potential in a building to use
‘more’ (above the 0% line) energy are glazing area, solar heat gain coefficient (SHGC), lighting
controls/loads and HVAC sizing/system (type). All have 10% or more (but less than 20%)
impact, which is significantly more than any other area of the building system itself. With
regard to the HVAC distribution, ground-loop heat exchanger systems with water-to-air heat
pumps saved energy in all climates, but the effect was greater in heating climates such as Los
Angeles. VAV systems increased the energy use in all dry climates due to increased re-heating
demands and fan energy.

34
Figure 8: Sensitivity of Envelope, Lighting and HVAC Measures in Los Angeles
In Figure 9 –building areas affected by occupants – the four areas that exceed 10% impact are
thermostat settings, data centers, occupant schedules and plug loads. Of these, two – data
centers and plug loads – have potential adverse impact on energy use of 50% or more. The
presence of even a small data center has a huge impact on total building energy use, which
implies that the assumptions about data center operating characteristics are critical to any
analysis.
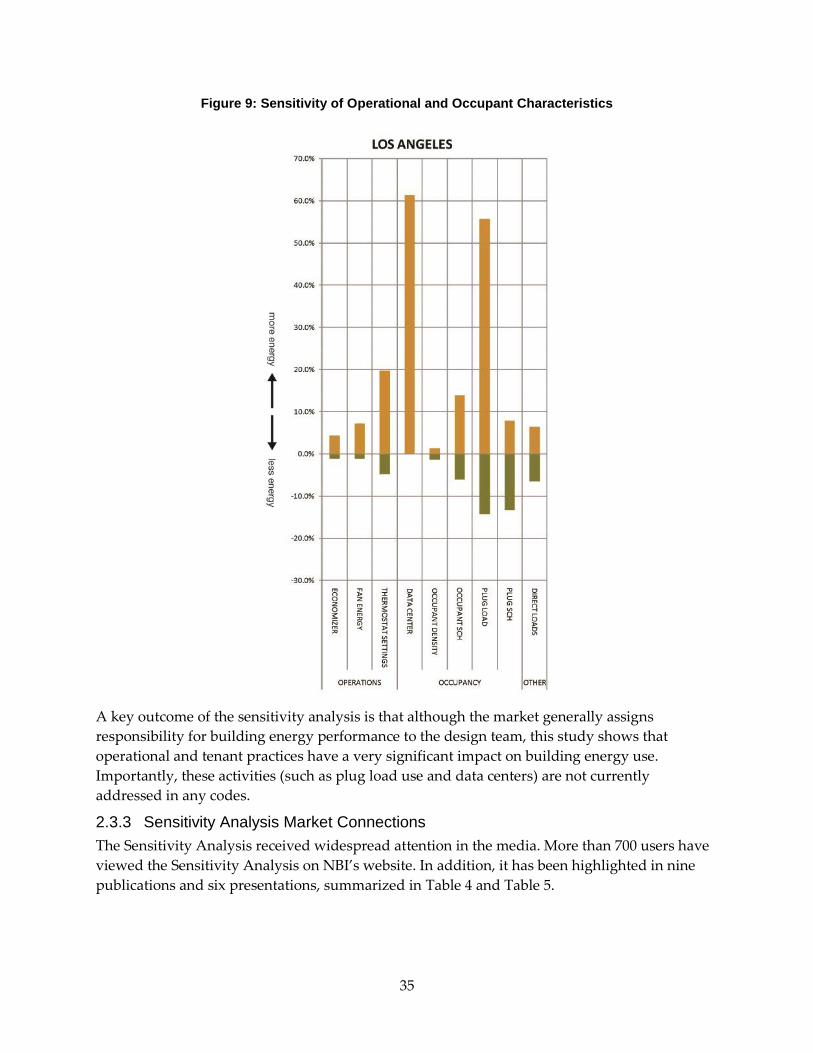
35
Figure 9: Sensitivity of Operational and Occupant Characteristics
A key outcome of the sensitivity analysis is that although the market generally assigns
responsibility for building energy performance to the design team, this study shows that
operational and tenant practices have a very significant impact on building energy use.
Importantly, these activities (such as plug load use and data centers) are not currently
addressed in any codes.
2.3.3 Sensitivity Analysis Market Connections
The Sensitivity Analysis received widespread attention in the media. More than 700 users have
viewed the Sensitivity Analysis on NBI’s website. In addition, it has been highlighted in nine
publications and six presentations, summarized in Table 4 and Table 5.
36
Table 4: Sensitivity Analysis Media – Nov. and Dec. 2011
Publication Title and Hyperlink to Article
GreenSource “The Next Frontier in Green Building”
Environmental Design +
Construction “Impact of Design Decisions, Operations and Tenants on Building Energy Use”
Environmental Building News “Occupant Engagement–Where Design Meets Performance”
RealEstateRama
“NBI study shows impact of design decisions, operations and tenant behavior on building energy use”
FacilitiesNet
“NBI Study: The Impact Of Design Decisions, Operations And Tenant Behavior On Building Energy Use”
Construtech “Paying Attention to Energy Consumption”
BetterBricks Blog “Atlas Shrugged: The Burden of Energy
Performance”
GreenBuilding News “Energy Use Study Examines Design Features,
Operations and Tenant Behavior”
Table 5: Sensitivity Analysis Presentations
Presentation Event Date
NBI Stakeholder Briefing Webinar October 2011
Build Boston Exhibit November 2011
ASHRAE High Performance Building Conference March 2012
ACEEE Symposium on Market Transformation April 2012
ACEEE Summer Study on Buildings August 2012
Emerging Technologies Conference October 2012
37
2.4 Key Performance Indicators
The KPI work used all of the research described above along with system-level metering on two
buildings to expand beyond whole-building metrics. KPIs are specific metrics that can be
compared to ranges of performance that buildings should aim to meet. These are based on
observations of commercial building attributes and the correlating monthly utility metered
data.
2.4.1 Approach
As part of the effort to develop KPIs, NBI instituted system-level34 metering in two office
buildings: a 14,000 sf. office in Oakland, California, and a 5,500 SF office in Vancouver,
Washington. Researchers collected system loads by installing sub-meters (advanced interval
meters downstream of the main utility meter) at key points where system loads were
aggregated.
NBI focused on creating KPIs that could be benchmarked against other buildings, a design
model, or compared against past utility bills or system metering. The work did not seek to
replicate the functionality of more complex and expensive Energy Management Information
Systems (EMIS) that provide day-to-day feedback to building operators, Energy Management
Control Systems (EMCS), Building Automation Control (BAC) systems that provide a level of
control and correction, or occupant dashboards that provide occupant feedback on usage. The
site visits to the two buildings did review building automation system data, however, the focus
was on providing high-level key information in the absence of, or as a complement to, the more
complex and expensive monitoring methods.
The various levels of building performance assessment had distinct levels of detail, time periods
and costs/effort, as shown in Figure 10. The diagram section titled “NBI Protocols for Feedback”
in Figure 10 represents the overlay of the project approach within the larger context of
performance review and metering.
34 Systems are the distinct energy use functions in buildings such as the heating, ventilation and air
conditioning (HVAC), lighting and plug loads.

38
Figure 10: Levels of Metering and Analysis Progressing from Whole Building to Systems
As with any other numerical calculation of energy usage, KPIs are usually only useful when
placed in the context of comparisons to expected or historical behavior. Each indicator provides
a piece of evidence. The intention is that all key indicators be used as clues and combined with
other analyses, such as FirstView, to reveal a final assessment. Broadly these comparisons are to
a large data set of similar buildings (benchmarking), a private portfolio of similar buildings,
historical data and/or design model expectations.
2.4.2 Technical Findings and Outcomes – The KPI Metrics
This section provides an overview of identified KPIs for each of the DOT audiences. The KPIs
were defined based on metered data at the two buildings plus other measured performance
field research conducted by the team over the previous five years35. The first target audience for
feedback is the design team – both architects and engineers. Designers are typically removed
from the actual outcomes of the buildings they design. The whole-building metrics of EUI
described earlier can provide an overall sense of the building compared to their whole-building
design estimates but do little to distinguish what aspects are affecting energy use.
The set of energy key performance indicators in Table 6 shows how nine designer KPIs were
used at one research site located in Oakland, California. Some indicators looked at the big
picture, such as the System Schedule Annual Energy Use Index, while others provided feedback
on areas specific to design such as the Daylighting Effectiveness indictor or the overall Lighting
Design metric.
35 Field metering at NBI Utility Partner Office of the Future sites gave additional data and foundation to the
selection and validation of the PIER KPIs.
KPI Assessment EMS Software
NBI Protocols for Feedback
Sim
ple
r -
dir
ectio
n n
ot
de
tail
Co
mp
lica
ted
/co
stly -
mo
re in
form
ative
Portfolio Mgr. - FirstView
Design Asset Rating
Meters: 1 2 - 3 meters 4-8 meters
ElectricGas
Whole BuildingSystem
(Riser/Panel) End-uses
Cooling eq.Heating eq.
TenantsPV
Elevators
PlugsLights
HVACPV
Data Center
Monthly or Interval Daily or Inteval
Operations/Occupants

39
For example, the Daylighting Effectiveness KPI considered whether lighting is turned off or
reduced when daylight is available. If the design team included daylight controls in the
building, the KPI should indicate a good correlation of reduced electric lighting during daylight
hours. Rather than simply say the building is using more energy than designed based on a
whole-building metric, these KPIs drill down and give feedback on the reasons the energy use
differs from design intent.
Other designer KPIs focused more on occupancy – such as Occupant Stability and Occupant
Usage - paying attention to both weekly and annual patterns and subsystem-level use.
Understanding occupancy-related KPIs assists the design team in learning whether lighting and
plug load KPIs are within expected design parameters. Providing both design and occupancy
KPIs gives a design firm feedback on its role in a building’s energy performance.
Table 6: Example of Designer KPIs Applied to an Oakland Office Building
KPI Inferences Sample Plot
System
Schedule
Annual
Energy Use
Index (EUI)
Oakland building may be occupied
12 hours per day, though the plug-
load schedule infers there is
significant use only 8 hours per day.
One can see that even though the
lighting has a longer schedule, the
plug load is significantly larger.
Occupant
Stability
The magnitude of the plug loads
(diamonds) in the Oakland office
was decreasing slightly while the
schedule hours (squares plotted on
Right Y-axis) remained the same.
This suggests occupancy was
moderately stable with no drastic
changes.
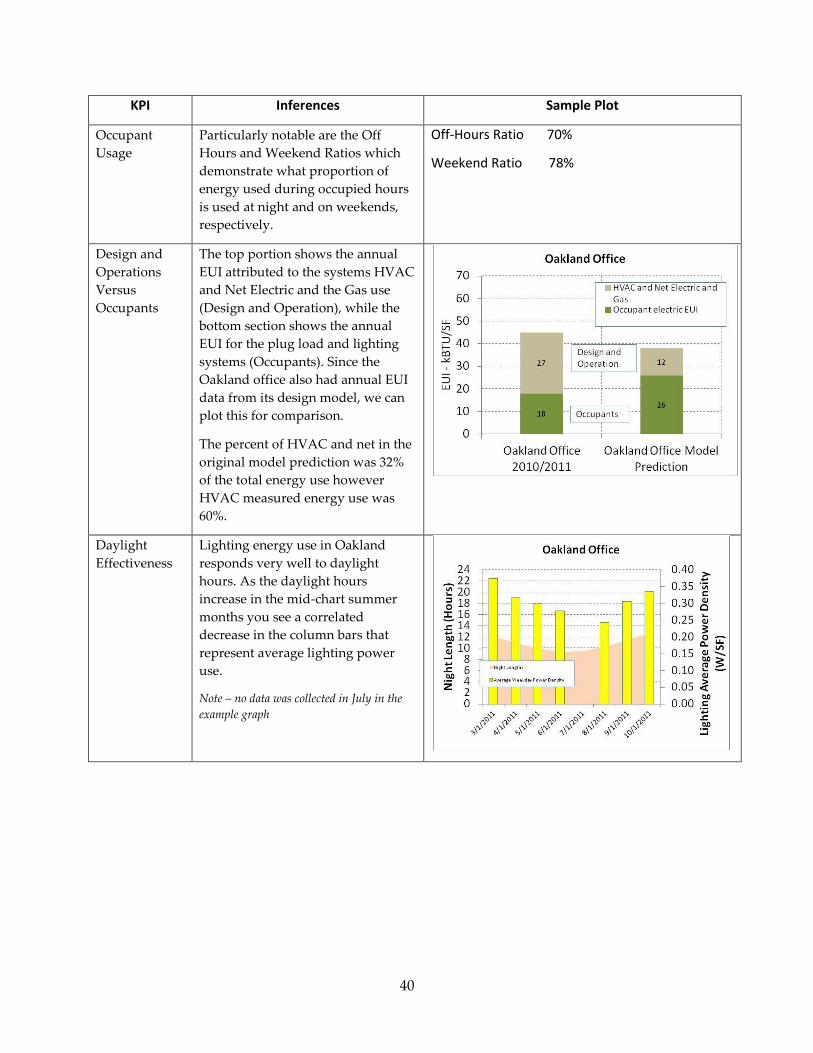
40
KPI Inferences Sample Plot
Occupant
Usage
Particularly notable are the Off
Hours and Weekend Ratios which
demonstrate what proportion of
energy used during occupied hours
is used at night and on weekends,
respectively.
Off-Hours Ratio 70%
Weekend Ratio 78%
Design and
Operations
Versus
Occupants
The top portion shows the annual
EUI attributed to the systems HVAC
and Net Electric and the Gas use
(Design and Operation), while the
bottom section shows the annual
EUI for the plug load and lighting
systems (Occupants). Since the
Oakland office also had annual EUI
data from its design model, we can
plot this for comparison.
The percent of HVAC and net in the
original model prediction was 32%
of the total energy use however
HVAC measured energy use was
60%.
Daylight
Effectiveness
Lighting energy use in Oakland
responds very well to daylight
hours. As the daylight hours
increase in the mid-chart summer
months you see a correlated
decrease in the column bars that
represent average lighting power
use.
Note – no data was collected in July in the
example graph

41
KPI Inferences Sample Plot
Overall
Lighting
Design/
Performance
The lighting performance at the
Oakland site - expressed in lighting
power density (LPD) – is performing
at 50% better than the installed
design LPD (just over 0.3 watts (W)
/sf versus design of 0.8 W/sf)
Lighting and
Plug Load
Design
Equivalence
Oakland data reflects the difference
in the lighting and plug load
schedule seen in the indicators
above. Without this comparison
these indicators only serve as a
further representation of the relative
magnitudes and schedules of the
lighting and plug loads.
HVAC and
Net Electric
Balance Point
This particular indicator was not
clear in the Oakland site.
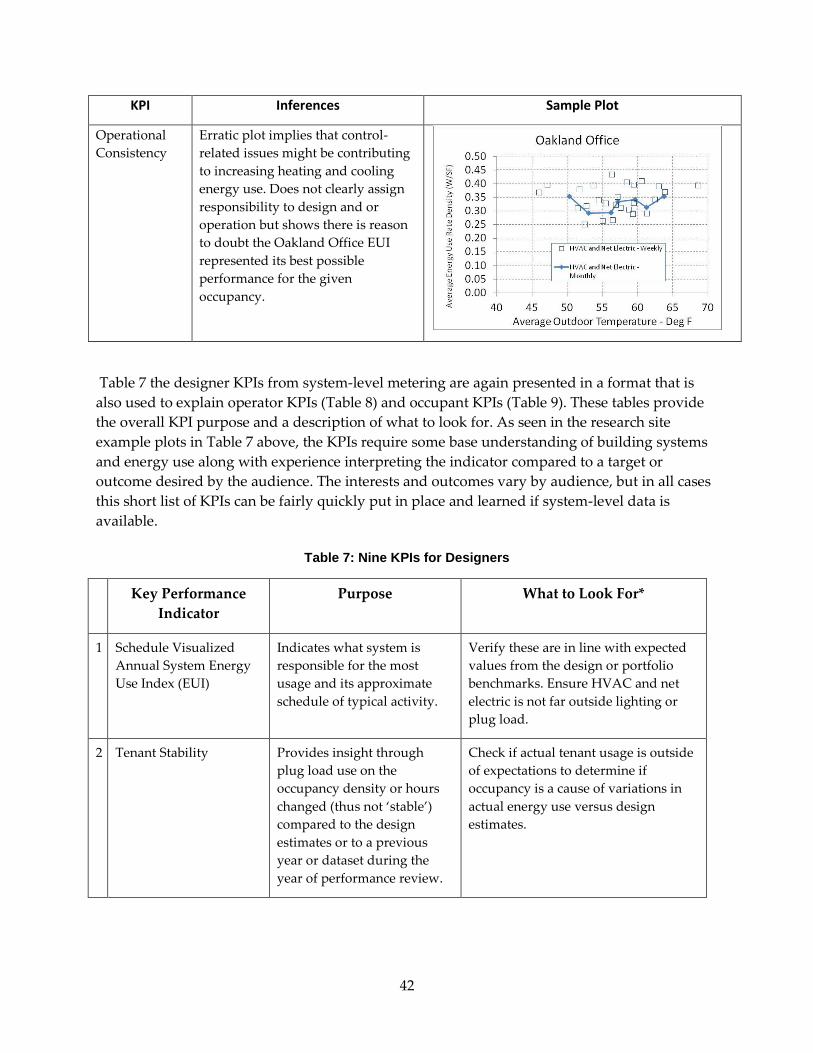
42
KPI Inferences Sample Plot
Operational
Consistency
Erratic plot implies that control-
related issues might be contributing
to increasing heating and cooling
energy use. Does not clearly assign
responsibility to design and or
operation but shows there is reason
to doubt the Oakland Office EUI
represented its best possible
performance for the given
occupancy.
Table 7 the designer KPIs from system-level metering are again presented in a format that is
also used to explain operator KPIs (Table 8) and occupant KPIs (Table 9). These tables provide
the overall KPI purpose and a description of what to look for. As seen in the research site
example plots in Table 7 above, the KPIs require some base understanding of building systems
and energy use along with experience interpreting the indicator compared to a target or
outcome desired by the audience. The interests and outcomes vary by audience, but in all cases
this short list of KPIs can be fairly quickly put in place and learned if system-level data is
available.
Table 7: Nine KPIs for Designers
Key Performance
Indicator
Purpose What to Look For*
1 Schedule Visualized
Annual System Energy
Use Index (EUI)
Indicates what system is
responsible for the most
usage and its approximate
schedule of typical activity.
Verify these are in line with expected
values from the design or portfolio
benchmarks. Ensure HVAC and net
electric is not far outside lighting or
plug load.
2 Tenant Stability Provides insight through
plug load use on the
occupancy density or hours
changed (thus not ‘stable’)
compared to the design
estimates or to a previous
year or dataset during the
year of performance review.
Check if actual tenant usage is outside
of expectations to determine if
occupancy is a cause of variations in
actual energy use versus design
estimates.

43
Key Performance
Indicator
Purpose What to Look For*
3 Tenant Usage Provides more detail and
assessment of how occupant
usage impacts the building
energy use and is a way to
assess the magnitude of
occupant usage compared to
benchmarks.
Look at Off-Hours ratios – which
should be low - to determine if energy
is being consumed in hours of low
occupancy.
4 Design and Operations
Versus Tenants
Provides a numerical
assessment of how close the
design and operation values
are to the tenants’ actual
usage values.
Compare the ratio of design and
operations to occupant usage to assess
if actual energy use is far from
estimates.**
5 Daylight Effectiveness Determines if the daylight
design and controls are
effective.
Lighting energy use should be varying
with the length of nights if controls are
enabled. Use historical trends of this
KPI as the baseline.
6 Overall Lighting Design
Performance
Determines the accuracy of
the lighting design expressed
in lighting power density
(LPD) actual usage.
The actual LPD should be equal to or
less than the design LPD.
7 Lighting and Plug Load
Design Equivalence
Checks the performance of
the lighting and plug load
systems in metrics similar to
those of a design model.
The watts should be as low as possible
(targets are from the design model or
industry standard) and the inactive
values should be a reduction
compared to active.
8 HVAC and Net Electric
Balance Point
Uses an energy signature to
determine a key attribute of
the magnitude of the HVAC
and net electric contribution
toward the building energy
use. Tracks changes in
simultaneous heating and
cooling.
A decreasing balance point indicates
that simultaneous heating and cooling
or common area base load is being
reduced. Should ideally be near zero.
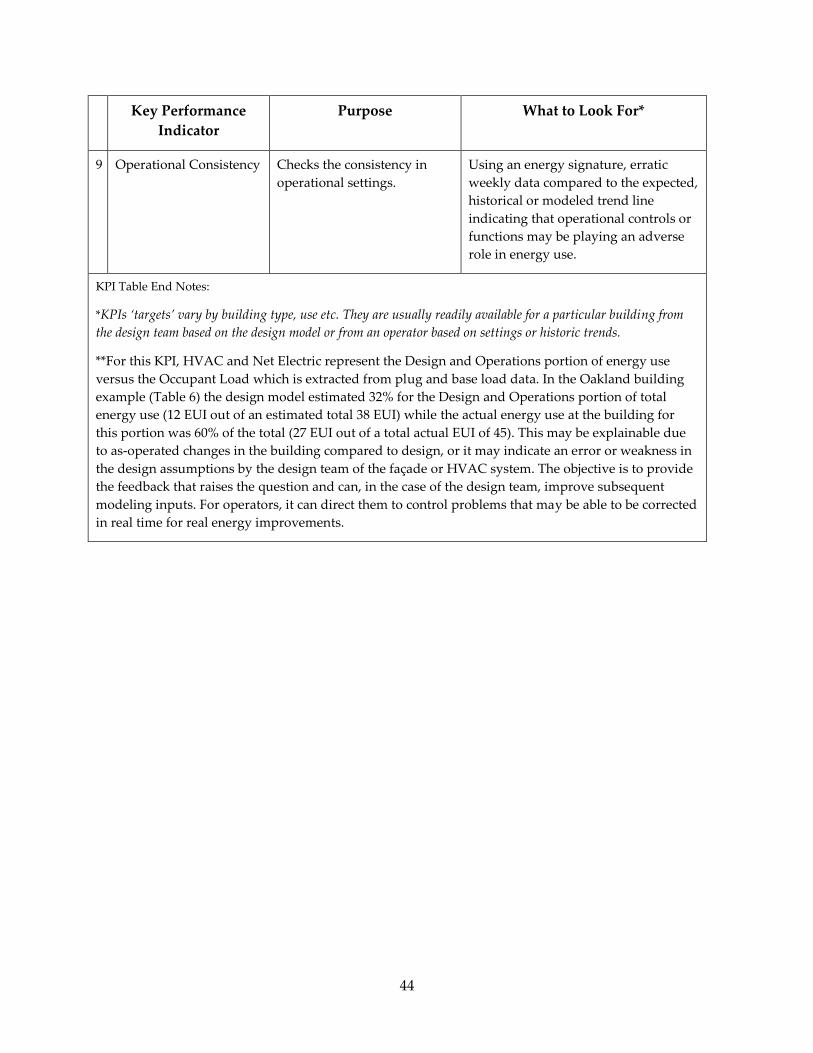
44
Key Performance
Indicator
Purpose What to Look For*
9 Operational Consistency Checks the consistency in
operational settings.
Using an energy signature, erratic
weekly data compared to the expected,
historical or modeled trend line
indicating that operational controls or
functions may be playing an adverse
role in energy use.
KPI Table End Notes:
*KPIs ‘targets’ vary by building type, use etc. They are usually readily available for a particular building from
the design team based on the design model or from an operator based on settings or historic trends.
**For this KPI, HVAC and Net Electric represent the Design and Operations portion of energy use
versus the Occupant Load which is extracted from plug and base load data. In the Oakland building
example (Table 6) the design model estimated 32% for the Design and Operations portion of total
energy use (12 EUI out of an estimated total 38 EUI) while the actual energy use at the building for
this portion was 60% of the total (27 EUI out of a total actual EUI of 45). This may be explainable due
to as-operated changes in the building compared to design, or it may indicate an error or weakness in
the design assumptions by the design team of the façade or HVAC system. The objective is to provide
the feedback that raises the question and can, in the case of the design team, improve subsequent
modeling inputs. For operators, it can direct them to control problems that may be able to be corrected
in real time for real energy improvements.
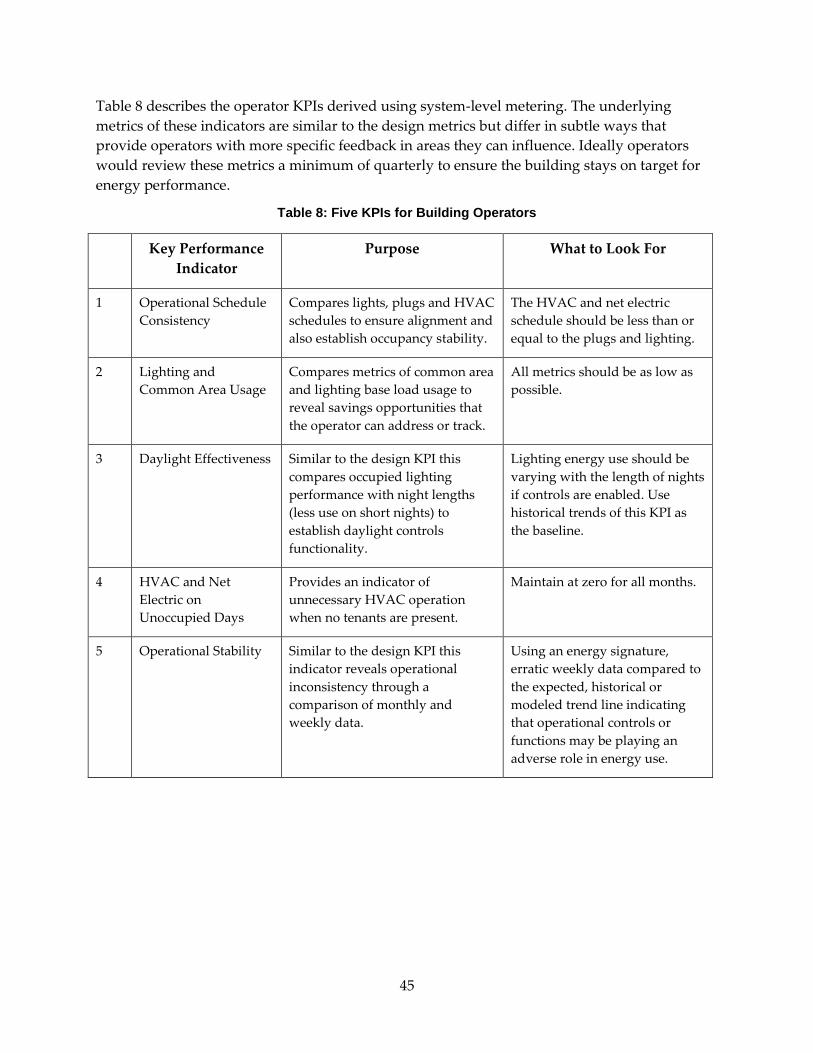
45
Table 8 describes the operator KPIs derived using system-level metering. The underlying
metrics of these indicators are similar to the design metrics but differ in subtle ways that
provide operators with more specific feedback in areas they can influence. Ideally operators
would review these metrics a minimum of quarterly to ensure the building stays on target for
energy performance.
Table 8: Five KPIs for Building Operators
Key Performance
Indicator
Purpose What to Look For
1 Operational Schedule
Consistency
Compares lights, plugs and HVAC
schedules to ensure alignment and
also establish occupancy stability.
The HVAC and net electric
schedule should be less than or
equal to the plugs and lighting.
2 Lighting and
Common Area Usage
Compares metrics of common area
and lighting base load usage to
reveal savings opportunities that
the operator can address or track.
All metrics should be as low as
possible.
3 Daylight Effectiveness Similar to the design KPI this
compares occupied lighting
performance with night lengths
(less use on short nights) to
establish daylight controls
functionality.
Lighting energy use should be
varying with the length of nights
if controls are enabled. Use
historical trends of this KPI as
the baseline.
4 HVAC and Net
Electric on
Unoccupied Days
Provides an indicator of
unnecessary HVAC operation
when no tenants are present.
Maintain at zero for all months.
5 Operational Stability Similar to the design KPI this
indicator reveals operational
inconsistency through a
comparison of monthly and
weekly data.
Using an energy signature,
erratic weekly data compared to
the expected, historical or
modeled trend line indicating
that operational controls or
functions may be playing an
adverse role in energy use.

46
Tenant KPIs provide feedback on energy-use trends in a way that makes for easy comparison to
other, similar sites. Tenant KPIs, shown in Table 9, should be shared with occupants on a
regular basis so they might take actions to reduce their energy usage. The use of consistent
metrics will increase the relevance of comparisons to other facilities.
Table 9: Three KPIs for Tenants
Key Performance
Indicator
Purpose What to Look For
1 Tenant Plug Load
Feedback
Provide a means to show
occupants how their plug load
usage compares to other like-type
occupants and track performance.
As low as possible for all metrics
or in line with benchmark
targets.
2 Tenant Lighting
Feedback
Provide a means to show
occupants how their lighting
usage compares to that of like-type
occupants and track performance.
As low as possible for all metrics
or in-line with benchmark
targets.
Off-Hours Ratio
(embodied within the
two metrics above)
Demonstrates the periods of
occupancy highlighting the energy
use in unoccupied time periods as
a ratio of full occupancy.
The ratio should be very low
with little to no energy use
during unoccupied schedules.
3 Tenant Schedule
Assessment
Provide the tenants with an idea of
how the building is used day to
day.
Watch for consistency. This can
ensure that If the metrics above
change the tenant schedule was
not the cause.
2.4.3 Key Performance Indicators Market Connections
While the formal outreach for the KPI work is just beginning, NBI and its team has brought the
PIER research into many prominent venues (listed in Table 10). In all cases NBI sought to a)
inform attendees about the value of benchmarking and measurement, b) demonstrate actual
data from the research, c) describe methods and tools (KPIs and FV) available or in process and
d) meet with and solicit market partners for the project.
Table 10: Measured Performance, Feedback, KPI and FirstView Presentations
Presentation Event Date
ASHRAE Winter Conference January 2012
NBI Stakeholder Webinar: Office Plug Loads Energy Use and
Savings Opportunities
January 2012

47
Presentation Event Date
ASHRAE High Performance Building Conference March 2012
Garrison Institute Climate, Buildings and Behavior Symposium May 2012
NBI Stakeholder Webinar: FirstView diagnostic tool for building
energy performance
May 2012
PIER Outreach Webinar: FirstView Beta Test June 2012
NBI Stakeholder Webinar: Plug Load Best Practices Guide September 2012
ACEEE Summer Study on Buildings August 2012
World Energy Engineering Conference October 2012
NBI’s website section on Measured Performance includes information on the PIER research as
well as more specifics on KPIs and FirstView. Approximately 200 unique users have viewed the
KPI report, and 384 unique users have visited the FirstView webpage. The two-page FirstView
overview and report example have been downloaded over 30 times and the technical paper
over 60 times. By spring 2013 NBI will have a dedicated page with the most market-relevant
reports, resources and tools from this PIER research, links to related work and promotion to the
7,000-plus efficiency allies on NBI’s communication lists.
Having team members that frequently interact with key stakeholders will continue to bring the
results forward after the formal contract period ends is a highly valuable aspect of the PIER
work.
2.5 Benefits to California
The High Performance Buildings Measured Performance and Feedback research built up the
knowledge, tools and understanding of data associated with measured performance of
buildings in California. As such it worked as a market transformation approach rather than
development a single specific technology with savings per unit. Based on this, specific
quantification of savings to the State of California is not available. Despite the inability to
quantify direct energy savings, the work brings significant benefits to California, as
summarized below.
Measured Performance Assessments. This research is the first of its kind to characterize and
represent the gap between measured and predicted energy performance in newly constructed
high performance buildings in California. It continues to drive attention to the value, yet
absence, of measured performance feedback. This research builds on work NBI has done for the
USGBC and confirms that, for various reasons, buildings do not necessarily perform as energy
models predict. Since most utility efficiency programs are based on predicted performance, this
research has significant implications for future actions.

48
Sensitivity Analysis. The research supported a comprehensive energy modeling exercise that
characterized the variability associated with a wide assortment of building characteristics,
operations and occupant behaviors. The Sensitivity Analysis provides a broad perspective on
how buildings use energy and what aspects of building energy performance deserve more
attention in design, operation and policy strategies. Significantly, the study demonstrates the
dominant impact operational and tenant practices have on building energy use. Without
measured performance feedback these groups have no method to detect possible problems and
potential improvements that can benefit their interests and those of the energy community.
Subsequent work on the topic of energy measure sensitivity in California was funded through
PG&E’s zero-net-energy (ZNE) program. ARUP, the contractor on the PG&E work, referenced
this PIER research and conferred with NBI toward their final analysis..
Key Performance Indicators. The research proposed Key Performance Indicators along with
measurement guidelines and metrics that have broad applicability in California. They included
the reason for ‘designing for meterability’ as a critical pathway so that data can be most easily
collected in a way that best supports a dialogue in the industry and eventually public policy.
This KPI work also identified the impact of plug loads to overall building energy use for the
two sites studied and served as a top-down cross check for the device-level metering outcomes
of Chapter 3 – Plug Load Savings Assessment within this report.
In addition to the KPI report, NBI developed web-based guidance on KPIs and a Metering and
Metrics Protocol. One recommended metric to address plug loads is to consider a ratio of plug-
load equipment left on at night or during presumed unoccupied hours compared to levels kept
on during occupied hours. A lower ratio indicates equipment is being properly controlled
and/or turned off at night or on weekends.
FirstView Performance Feedback. Finally, development of the FirstView tool demonstrated a
scalable and affordable energy performance feedback mechanism. Since many disclosure
policies are dovetailing with Energy Star Portfolio Manager, tools that align with the same data
are in a good position to provide more information about where to target energy audits and
improvements from these limited data inputs. Furthermore, in addition to benchmarking and
disclosure, utilities can utilize remote performance assessment tools to prioritize their efforts in
energy efficiency, thus reducing the programmatic costs associated with managing these
programs.
2.6 Conclusions and Next Steps
The commercial building market knows little about how buildings actually perform. New
construction programs like Savings By Design and LEED rely on modeled energy consumption
(expressed as percentage better than code) to predict performance. This current PIER research
confirmed that the actual performance of even those buildings designed to ‘high performance’
standards varies from predicted results.
This project also demonstrated, by both modeling and site-metered data, that a building’s
energy use is a product not only of its design and construction, but is also driven in great part

49
by operations, occupants and use. Yet there is a critical lack of feedback to designers, tenants
and even operators about how their actions directly impact ongoing building performance,
particularly in the case of existing buildings. This High Performance Buildings Measured
Performance and Feedback research project aimed to close the feedback loop in an effort to identify
measured performance metrics that would be meaningful to designers, operators and tenants.
Some programs such as Energy Star Portfolio Manager rely on measured performance data to
compare to national benchmarks. However, beyond a whole-building benchmarking score they
provide no insights into what areas merit further investigation to mine for energy efficiency
improvements. Metering and audits are expensive, and it is difficult to know where to start or
what to do.
This research investigated a small yet compelling data set that clearly makes the case for the
importance of incorporating measured performance and feedback in a way that informs and
inspires action. It helped identify the metrics, reporting tools and procedures necessary to
ensure prompt, easily understood and actionable performance feedback to each particular
interest group. For example, designers need to know how their newly constructed building’s
measured EUI compares to the predicted EUI. They should also understand how occupancy
patterns vary from market assumptions.
New tools can provide this type of feedback quickly and at low cost. One example is FirstView,
a diagnostic and comparison tool supported through this research. FirstView is unique in that it
creates a simplified and self-calibrating energy model. It automatically segregates monthly
utility bills into energy end-use categories associated with design, operations and occupants. It
provides insights that can determine if a building’s energy performance is on track or off target.
If the latter, FirstView can identify particular areas warranting further investigation.
Based on the same issues and industry needs seen by NBI in its 2008 proposal for this PIER
research, the market has recently progressed from having little to no resources for performance
review to having a number of new and emerging tools. At least 8-12 companies have entered
the market with performance review tools. This validates the research concept but complicates
the role and future of FirstView in a more private-sector market. As a nonprofit, NBI’s focus is
to spur market change where needed and create resources and tools to fill gaps.
The research team anticipates that this work, and the increase in new players in this area, will
more rapidly close this building performance feedback gap, providing understanding and
action toward improvements.
2.6.1 Next Steps
NBI recommends the following next steps to enhance the findings of this research project:
Expand the dataset on measured performance to include more new and existing
buildings.
Focus on buildings that participate in utility incentive programs like Savings by Design.
For buildings that receive funding from these programs, consider standard data
collection approaches so information can be accessed for additional research. Also

50
consider requiring a follow-up submittal of measured performance to confirm that
results align with predictions.
Promulgate standardized industry metrics on measured performance as outlined in the
KPI report. Consider ‘outcome-based codes’ to ensure performance.
Engage in policy discussions about the importance of plug loads, new metrics (as
suggested through this work), and the need to design for easy meterability. Encourage
regulations to address these three topics in future iterations of Title 24.
Encourage the use of diagnostics and advanced benchmarking tools such as FirstView
that use an Energy Signature to analyze benchmarking data. This could include:
o Explain the concept of using Energy Signatures broadly through targeted market
channels and a media strategy, including industry events and media placements.
o Support the integration of FirstView into voluntary and mandatory
benchmarking programs in California. Work with StopWaste.Org, an
organization focused on what to do with collected benchmarking data in
Alameda County; this could serve as a model for others.
o Expand aggregate building data sets so that system-specific diagnostic
thresholds and peer building comparisons expand beyond offices to other
building types.
o Encourage public buildings to use a tool such as FirstView to analyze overall
portfolio performance and identify high-priority opportunities for audits and
further action.

51
3. Plug Load Savings Assessment Final Report
3.1 Background
This chapter summarizes the findings from Project 3: Plug Load Savings Assessment within the
PIER program “Evidence-based Design and Operations.” The research occurred from 2010-2012
and was led by Ecova36 and supported by PECI for field monitoring and New Buildings
Institute (NBI) as project manager and market connections lead.
Plug loads (devices that plug into wall outlets) are one of the largest and fastest growing electric
end uses in commercial buildings in the United States37. Although efficiency improvements are
occurring at the equipment and appliance levels, such as EnergyStar standards for copiers and
monitors, the growing number of office electronics coupled with the need for faster, more
powerful equipment has resulted in an overall increase in plug load energy consumption.
On average, plug loads account for 13% of total electricity consumption in California
commercial buildings and 23% of office building electricity38. Office equipment alone is about
74% of the plug load energy for such things as computers, monitors, imaging equipment and
various peripherals (things such as computer speakers). Plug loads, unlike building design and
major energy systems such as lighting, heating and cooling equipment, are not subject to
statewide energy codes. This is because of the challenge of regulating energy use that occurs
through occupant choices after the issuance of the building permit. This further drives the need
to better understand the energy impact of these growing loads and identify methods to meet
occupant needs with less energy intensity and demand.
This research characterizes the electricity consumption of office equipment plug load devices in
two recently LEED-certified buildings in California and identifies opportunities for plug load
energy savings that may be transferable to offices throughout California.
3.1.1 Objectives
The project objective was to estimate the potential to save energy use by employing strategies
effecting plug load device consumption which included changes to hardware, software and
through deploying information designed to change occupant behavior.
The primary research objectives were to determine the energy used by office equipment plug
load device category and to assess the most effective approaches to reduce plug load energy for
these devices in office buildings. For the successful energy reduction strategies, a secondary
goal was to refine and focus the findings so that utility programs and occupants/owners will
36 While the lead researchers remained consistent throughout the project, Ecos changed mid-project when
it was acquired by Ecova. All work on this project is now attributed to Ecova.
37 U.S. Energy Information Agency 2008 Energy Outlook Report.
38 Itron Inc. study resulting in the California Energy Use Survey (CEUS), 2006.
52
adopt them to create energy savings in California’s commercial office buildings. The
commercial office category for purposes of this study includes a variety of occupancy types.
3.1.2 Approach
The plug load research team performed the majority of the research at two California buildings
- a 95,000 square foot (ft2) public library in San Mateo and a 14,000 ft2 small office in Oakland.
Both of these buildings were designed for high energy and environmental performance relative
to their peer buildings. The design of this study included the following two phases:
1. Inventory, Identify and Meter Existing Equipment: Inventory all plug load equipment
and identify the subset most applicable across offices. This represented 726 plug load
devices. Meter a subset of 100 of the devices representing a diversity of equipment types
and uses; placing the highest priority on computers, monitors, imaging equipment and
computer peripherals39 for one month at one-minute intervals. This step established the
energy use baseline for these 100 devices.
2. Apply Energy Reduction Strategies: Reduce the energy use of a subset of the metered
devices by applying energy efficiency technologies or approaches to the end use and re-
metering the altered device to determine the savings potential of the strategies. The
saving strategies fell into four major categories:
a) Power Management Changes: Computer and imaging equipment have power
management settings which can be enabled to reduce energy use
b) Advanced Plug Strips/Timers: Advanced plug strips stop power flow to peripheral
equipment when the primary device is turned off. Timers can be set to turn
equipment off at the end of the day if it will not be used during the night.
c) Adjust Monitor Brightness: Adjusting monitor brightness to meet user needs
without defaulting to the maximum brightness saves energy.
d) Occupant Behavior (via education and prompts): These approaches include
sending notices to staff to turn off equipment at the end of the day and end of the
week and energy awareness information or campaigns.
3.1.2.1 Measurement Methodology
The team identified plug load devices with high energy use and installed meters on 100 of them.
Left in place for one month, the meters measured and recorded volts, power, power factor,
current and volt amps each minute. Then, 39 of the 100 devices were selected for energy
efficiency hardware and software upgrades. 39 of the 100 devices were then metered for a
second month.
39 Determined as the most numerous devices at the two sites and which use the most significant amounts
of plug load energy (Mercier, C. and Moorefield, L. Ecova, et al., 2011).
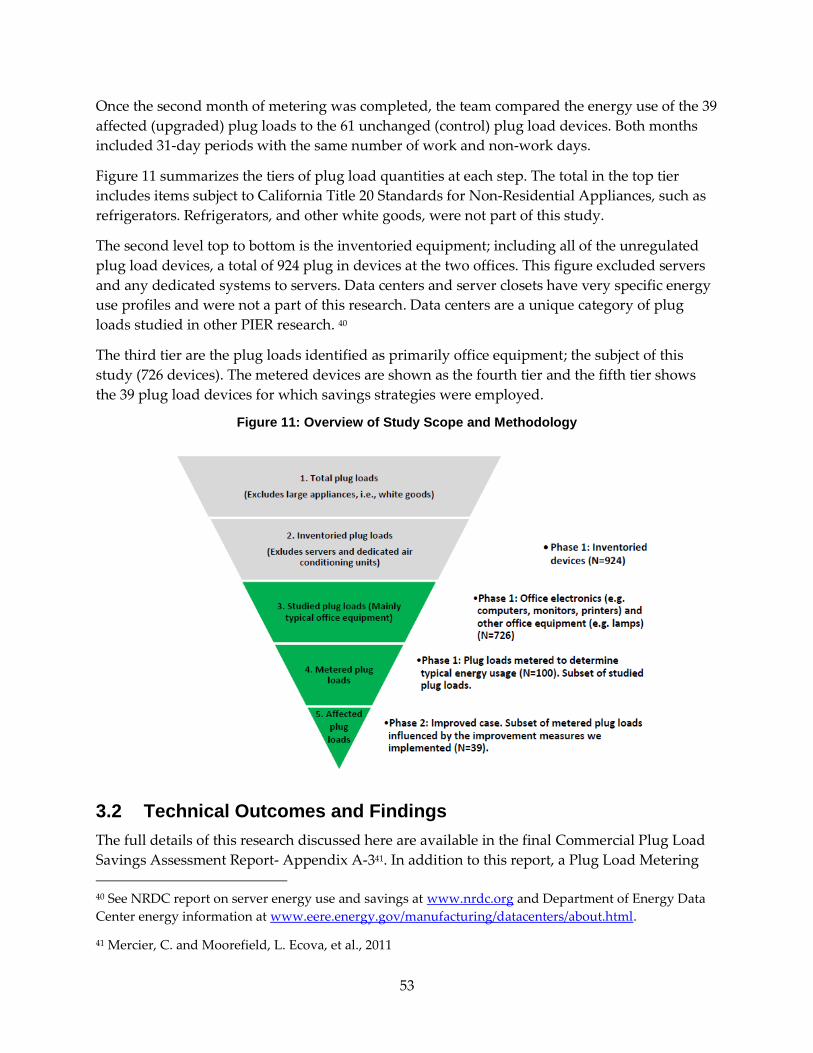
53
Once the second month of metering was completed, the team compared the energy use of the 39
affected (upgraded) plug loads to the 61 unchanged (control) plug load devices. Both months
included 31-day periods with the same number of work and non-work days.
Figure 11 summarizes the tiers of plug load quantities at each step. The total in the top tier
includes items subject to California Title 20 Standards for Non-Residential Appliances, such as
refrigerators. Refrigerators, and other white goods, were not part of this study.
The second level top to bottom is the inventoried equipment; including all of the unregulated
plug load devices, a total of 924 plug in devices at the two offices. This figure excluded servers
and any dedicated systems to servers. Data centers and server closets have very specific energy
use profiles and were not a part of this research. Data centers are a unique category of plug
loads studied in other PIER research. 40
The third tier are the plug loads identified as primarily office equipment; the subject of this
study (726 devices). The metered devices are shown as the fourth tier and the fifth tier shows
the 39 plug load devices for which savings strategies were employed.
Figure 11: Overview of Study Scope and Methodology
3.2 Technical Outcomes and Findings
The full details of this research discussed here are available in the final Commercial Plug Load
Savings Assessment Report- Appendix A-341. In addition to this report, a Plug Load Metering
40 See NRDC report on server energy use and savings at www.nrdc.org and Department of Energy Data
Center energy information at www.eere.energy.gov/manufacturing/datacenters/about.html.
41 Mercier, C. and Moorefield, L. Ecova, et al., 2011

54
Plan (Metering Plan) was a deliverable developed in this project. The Metering Plan can be used
in future plug load related research to guide inventory and assessment protocol in field studies.
Other related items were also developed to facilitate these findings reaching the market or
influence State energy policy and are described in the Section on Market Connections.
The Metering Plan describes: a) the method for conducting base-case metering, b) the
preparation steps taken prior to the site visits c) a list of items that were taken to the sites, d)
interview questionnaire, e) a description of the walk-through survey approach, f) detail on how
meter tracking was installed g) a description of how data was downloaded and transferred
from the devices and lastly) a description of how plug load devices were reconnected. To
summarize, the Plug Load Metering Plan provided full metering detail, inventory lists, surveys
and templates. , This plan can serve as a model that can be applied in future plug load
inventory and metering studies that involve field data collection42.
3.2.1 Commercial Plug Load Savings Assessment
The Savings Assessment Report describes the primary technical finding from the study. It
includes data and information on:
Baseline energy use for the building and for plug load device type categories
Specific descriptions of the energy savings strategies
Estimated savings for each energy savings strategy employed in the study
Total plug load energy savings estimates for each site
A discussion regarding issues that need to be considered when interpreting the data
findings (Data Interpretation Issues)
3.2.1.1 Energy Use – Phase 1
The first step in the study involved determining baseline energy use of a select group of device
categories. Savings were investigated in phase II of the study. To increase confidence that the
metered data collected from the sample was representative of general office equipment energy
use, this data was compared with measurements taken in previous PIER research on office plug
devices by (Ecova) the lead research team on this project.
Annual energy use by device type was estimated by multiplying the average device category
energy use from the one-month metering period in Phase 1 by the total number of those devices
inventoried extrapolated for 12 months.
Four categories of office equipment energy use monitored for this study: 1) desktop computers,
2) imaging equipment and peripherals (primarily computer speakers), 3) computer monitors.
42 The Plug Load Metering Plan is part of Appendix A-4.
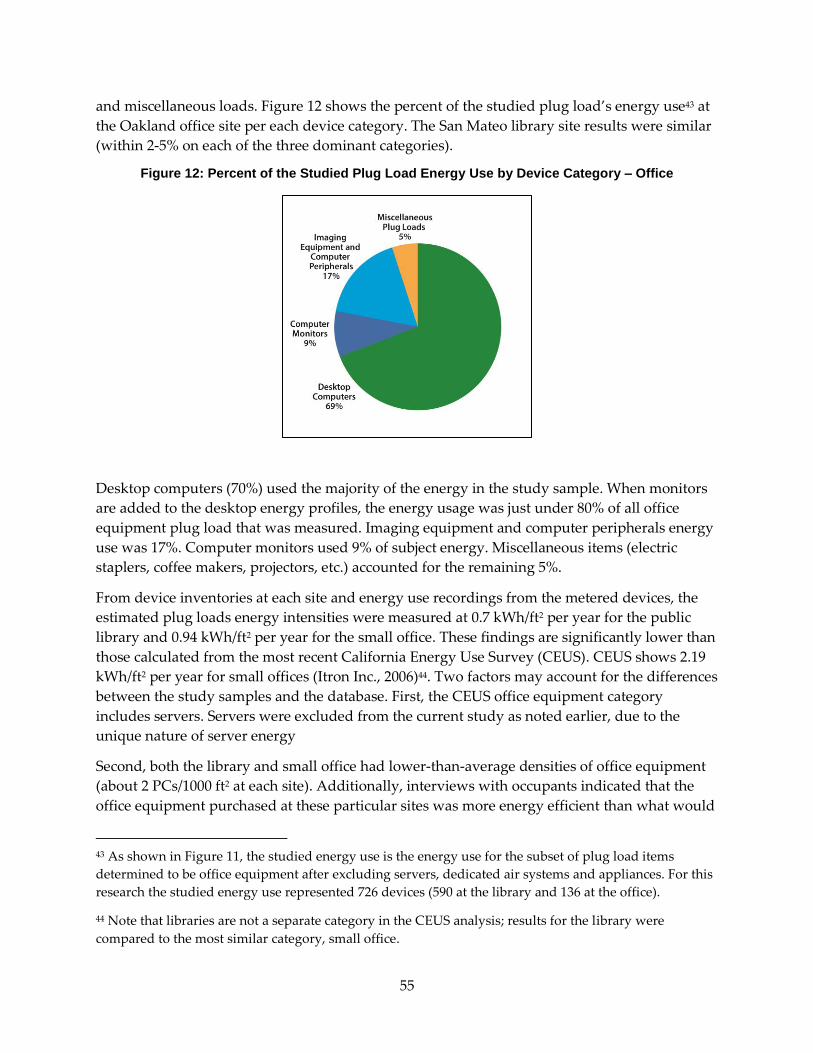
55
and miscellaneous loads. Figure 12 shows the percent of the studied plug load’s energy use43 at
the Oakland office site per each device category. The San Mateo library site results were similar
(within 2-5% on each of the three dominant categories).
Figure 12: Percent of the Studied Plug Load Energy Use by Device Category – Office
Desktop computers (70%) used the majority of the energy in the study sample. When monitors
are added to the desktop energy profiles, the energy usage was just under 80% of all office
equipment plug load that was measured. Imaging equipment and computer peripherals energy
use was 17%. Computer monitors used 9% of subject energy. Miscellaneous items (electric
staplers, coffee makers, projectors, etc.) accounted for the remaining 5%.
From device inventories at each site and energy use recordings from the metered devices, the
estimated plug loads energy intensities were measured at 0.7 kWh/ft2 per year for the public
library and 0.94 kWh/ft2 per year for the small office. These findings are significantly lower than
those calculated from the most recent California Energy Use Survey (CEUS). CEUS shows 2.19
kWh/ft2 per year for small offices (Itron Inc., 2006)44. Two factors may account for the differences
between the study samples and the database. First, the CEUS office equipment category
includes servers. Servers were excluded from the current study as noted earlier, due to the
unique nature of server energy
Second, both the library and small office had lower‐than‐average densities of office equipment
(about 2 PCs/1000 ft2 at each site). Additionally, interviews with occupants indicated that the
office equipment purchased at these particular sites was more energy efficient than what would
43 As shown in Figure 11, the studied energy use is the energy use for the subset of plug load items
determined to be office equipment after excluding servers, dedicated air systems and appliances. For this
research the studied energy use represented 726 devices (590 at the library and 136 at the office).
44 Note that libraries are not a separate category in the CEUS analysis; results for the library were
compared to the most similar category, small office.

56
be considered typical. Studied plug loads at both sites used about 6% of each building’s total
annual energy (electricity plus natural gas)45.
3.2.1.2 Energy Saving Strategies – Phase 2
The research team organized the savings solutions into three areas: software, hardware and
occupant behavior.
Software — Using aggressive power management settings on all equipment (i.e., keeping the
time delay prior to powering down to a lower power mode as short as possible) or using power
management software that is controlled by Information Technology (IT) departments and built-
in settings that will save energy. If power management software is already installed on the
devices as part of the equipment purchase, this solution can be implemented at no cost. This
strategy yielded the largest energy savings for no-to-low-cost choices. An example of possible
power management energy savings at the library is illustrated in Figure 13 where this strategy
yielded a 20% reduction in energy use on a printer.
Figure 13: Savings from Setting Aggressive Power Management (PM) Settings on One Printer
Hardware — There are multiple hardware-related options. The first option employed in this
study was to purchase and install advanced power strips and timers for certain devices. These
hardware options are a fairly low cost solution.
The largest energy savings came from upgrading existing equipment by replacing the
equipment via purchase of more energy efficient models of devices. This only makes financial
sense when equipment upgrade is necessary for other reasons besides energy. In that case this
high first cost is already a planned expense in the procurement schedule. In this research, one
extreme example of least (old) versus most efficient (new) equipment was the replacement of an
older inefficient desktop computer with a new micro‐sized desktop. The new unit featured
basic functionality and was preset or designed to use ultra‐low relative power including
45 See section Error! Reference source not found. on Data Interpretation Issues - this discusses the
challenges of definitions and percent of building energy use for plug loads.
0
50
100
150
200
250
BASELINE CASE IMPROVED CASE - ENABLED PM
Library
An
nu
al E
ne
rgy
Co
nsu
mp
tio
n (k
Wh
)
-20%
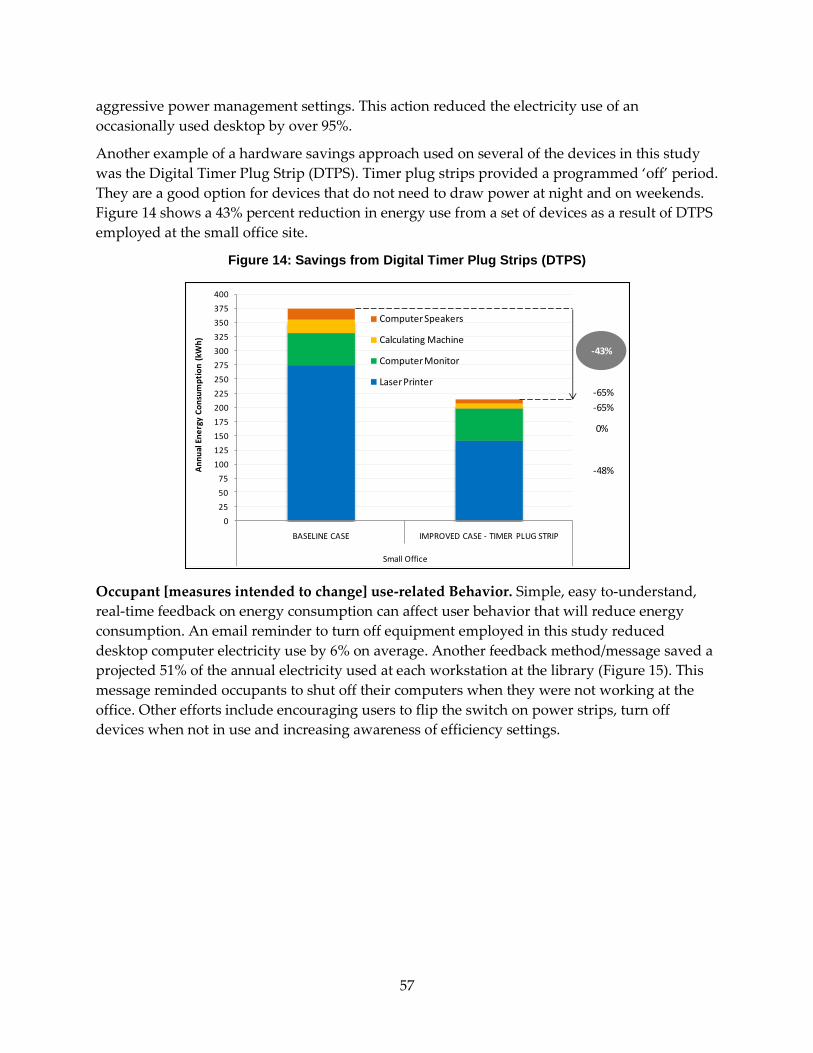
57
aggressive power management settings. This action reduced the electricity use of an
occasionally used desktop by over 95%.
Another example of a hardware savings approach used on several of the devices in this study
was the Digital Timer Plug Strip (DTPS). Timer plug strips provided a programmed ‘off’ period.
They are a good option for devices that do not need to draw power at night and on weekends.
Figure 14 shows a 43% percent reduction in energy use from a set of devices as a result of DTPS
employed at the small office site.
Figure 14: Savings from Digital Timer Plug Strips (DTPS)
Occupant [measures intended to change] use-related Behavior. Simple, easy to-understand,
real-time feedback on energy consumption can affect user behavior that will reduce energy
consumption. An email reminder to turn off equipment employed in this study reduced
desktop computer electricity use by 6% on average. Another feedback method/message saved a
projected 51% of the annual electricity used at each workstation at the library (Figure 15). This
message reminded occupants to shut off their computers when they were not working at the
office. Other efforts include encouraging users to flip the switch on power strips, turn off
devices when not in use and increasing awareness of efficiency settings.
0
25
50
75
100
125
150
175
200
225
250
275
300
325
350
375
400
BASELINE CASE IMPROVED CASE - TIMER PLUG STRIP
Small Office
An
nu
al E
ne
rgy
Co
nsu
mp
tio
n (
kWh
)
Computer Speakers
Calculating Machine
Computer Monitor
Laser Printer
-43%
-65%
0%
-48%
-65%
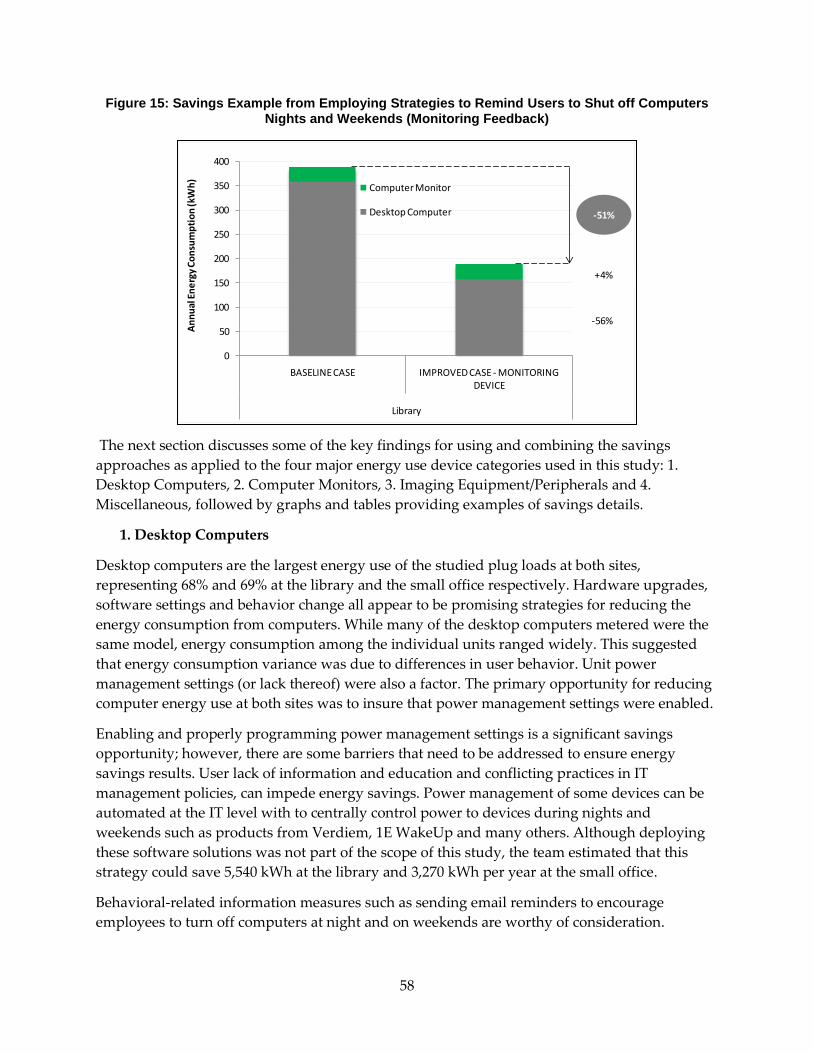
58
Figure 15: Savings Example from Employing Strategies to Remind Users to Shut off Computers Nights and Weekends (Monitoring Feedback)
The next section discusses some of the key findings for using and combining the savings
approaches as applied to the four major energy use device categories used in this study: 1.
Desktop Computers, 2. Computer Monitors, 3. Imaging Equipment/Peripherals and 4.
Miscellaneous, followed by graphs and tables providing examples of savings details.
1. Desktop Computers
Desktop computers are the largest energy use of the studied plug loads at both sites,
representing 68% and 69% at the library and the small office respectively. Hardware upgrades,
software settings and behavior change all appear to be promising strategies for reducing the
energy consumption from computers. While many of the desktop computers metered were the
same model, energy consumption among the individual units ranged widely. This suggested
that energy consumption variance was due to differences in user behavior. Unit power
management settings (or lack thereof) were also a factor. The primary opportunity for reducing
computer energy use at both sites was to insure that power management settings were enabled.
Enabling and properly programming power management settings is a significant savings
opportunity; however, there are some barriers that need to be addressed to ensure energy
savings results. User lack of information and education and conflicting practices in IT
management policies, can impede energy savings. Power management of some devices can be
automated at the IT level with to centrally control power to devices during nights and
weekends such as products from Verdiem, 1E WakeUp and many others. Although deploying
these software solutions was not part of the scope of this study, the team estimated that this
strategy could save 5,540 kWh at the library and 3,270 kWh per year at the small office.
Behavioral-related information measures such as sending email reminders to encourage
employees to turn off computers at night and on weekends are worthy of consideration.
0
50
100
150
200
250
300
350
400
BASELINE CASE IMPROVED CASE - MONITORING DEVICE
Library
An
nu
al E
ne
rgy
Co
nsu
mp
tio
n (k
Wh
) Computer Monitor
Desktop Computer -51%
-56%
+4%

59
However, given the timeframe of this study, persistent energy saving from this strategy could
not be confirmed.
Finally, as with many electronic devices, significant savings are possible by replacing older
computers with highly efficient newest models. The example described above under Hardware,
involved replacing an inefficient desktop with a micro-sized unit that contained basic
functionality, ultra-low power use and enabled power management settings. In this case power
use was reduced by saved 95%. While these computers cannot replace all desktops because of
applications capabilities, these computers used only for relatively straightforward tasks like
email, word processing and internet browsing are suitable candidates for greatly improved
systems at the time upgrades via procurement schedules.
2. Computer Monitors
Computer monitors metered at the sites typically consumed somewhat more electricity per year
than today’s most efficient models. The majority of the monitors were in standby or ‘off’ mode
after business hours and on weekends at both sites, suggesting that power management settings
were enabled on most of them, or that users routinely turn off monitors at the end of the day.
Standby power use on monitors metered in this study was typically less than 2 watts. The key
monitor savings opportunities at both sites were achieved by adjusting brightness settings in to
properly account for ambient light levels and also upgrading equipment at replacement.
3. Imaging Equipment and Computer Peripherals
Most imaging equipment and computer peripherals, such as computer speakers, were used
rarely but drew power continuously. The solid-ink multifunction device46 (MFD) consumed
significantly more energy than other devices. By itself it used 6% of total studied plug load
energy at the small office, and nearly 40% of the electricity used in the all imaging equipment
category at one of the sites.
An external control device can be incorporated on printers without power management settings
so power can be reduced when the device is not in use. These add-on devices are an easy, low-
cost way to eliminate the energy used by often-forgotten computer peripherals and imaging
equipment. Timers and timer plug strips were the most effective at saving energy and saved up
to 43% per workstation and are good options to control imaging equipment that is rarely used
outside of normal business hours.
4. Miscellaneous Plug Loads
Miscellaneous plug loads such as projectors, coffee makers and vending machines were not
numerous, but many of those that were monitored consumed did scale power consumption to
usage.
46 A Multifunction Device (MFD) combines printing, coping, scanning and/or faxing and are becoming
the standard over separate equipment for each of these office needs.
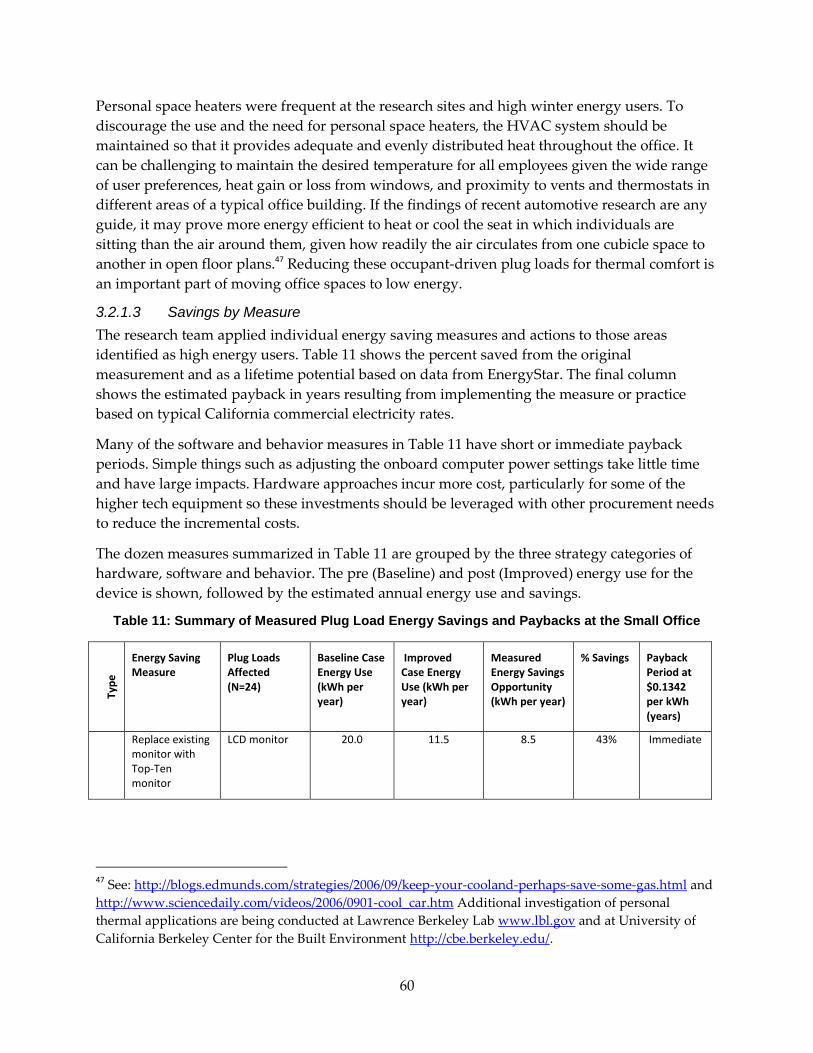
60
Personal space heaters were frequent at the research sites and high winter energy users. To
discourage the use and the need for personal space heaters, the HVAC system should be
maintained so that it provides adequate and evenly distributed heat throughout the office. It
can be challenging to maintain the desired temperature for all employees given the wide range
of user preferences, heat gain or loss from windows, and proximity to vents and thermostats in
different areas of a typical office building. If the findings of recent automotive research are any
guide, it may prove more energy efficient to heat or cool the seat in which individuals are
sitting than the air around them, given how readily the air circulates from one cubicle space to
another in open floor plans.47 Reducing these occupant-driven plug loads for thermal comfort is
an important part of moving office spaces to low energy.
3.2.1.3 Savings by Measure
The research team applied individual energy saving measures and actions to those areas
identified as high energy users. Table 11 shows the percent saved from the original
measurement and as a lifetime potential based on data from EnergyStar. The final column
shows the estimated payback in years resulting from implementing the measure or practice
based on typical California commercial electricity rates.
Many of the software and behavior measures in Table 11 have short or immediate payback
periods. Simple things such as adjusting the onboard computer power settings take little time
and have large impacts. Hardware approaches incur more cost, particularly for some of the
higher tech equipment so these investments should be leveraged with other procurement needs
to reduce the incremental costs.
The dozen measures summarized in Table 11 are grouped by the three strategy categories of
hardware, software and behavior. The pre (Baseline) and post (Improved) energy use for the
device is shown, followed by the estimated annual energy use and savings.
Table 11: Summary of Measured Plug Load Energy Savings and Paybacks at the Small Office
Typ
e
Energy Saving Measure
Plug Loads Affected (N=24)
Baseline Case Energy Use (kWh per year)
Improved Case Energy Use (kWh per year)
Measured Energy Savings Opportunity (kWh per year)
% Savings Payback Period at $0.1342 per kWh (years)
Replace existing monitor with Top-Ten monitor
LCD monitor 20.0 11.5 8.5 43% Immediate
47 See: http://blogs.edmunds.com/strategies/2006/09/keep-your-cooland-perhaps-save-some-gas.html and
http://www.sciencedaily.com/videos/2006/0901-cool_car.htm Additional investigation of personal
thermal applications are being conducted at Lawrence Berkeley Lab www.lbl.gov and at University of
California Berkeley Center for the Built Environment http://cbe.berkeley.edu/.
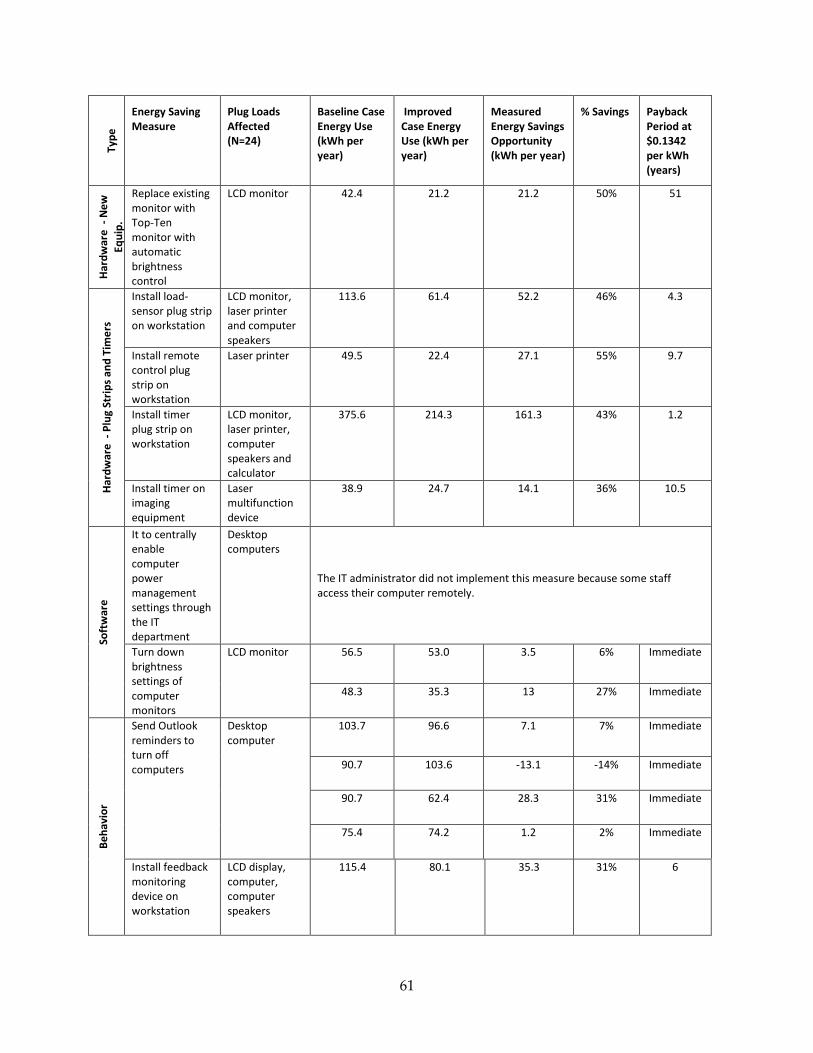
61
Typ
e
Energy Saving Measure
Plug Loads Affected (N=24)
Baseline Case Energy Use (kWh per year)
Improved Case Energy Use (kWh per year)
Measured Energy Savings Opportunity (kWh per year)
% Savings Payback Period at $0.1342 per kWh (years)
Har
dw
are
- N
ew
Equ
ip.
Replace existing monitor with Top-Ten monitor with automatic brightness control
LCD monitor 42.4 21.2 21.2 50% 51
Har
dw
are
- P
lug
Stri
ps
and
Tim
ers
Install load-sensor plug strip on workstation
LCD monitor, laser printer and computer speakers
113.6 61.4 52.2 46% 4.3
Install remote control plug strip on workstation
Laser printer 49.5 22.4 27.1 55% 9.7
Install timer plug strip on workstation
LCD monitor, laser printer, computer speakers and calculator
375.6 214.3 161.3 43% 1.2
Install timer on imaging equipment
Laser multifunction device
38.9 24.7 14.1 36% 10.5
Soft
war
e
It to centrally enable computer power management settings through the IT department
Desktop computers
The IT administrator did not implement this measure because some staff access their computer remotely.
Turn down brightness settings of computer monitors
LCD monitor 56.5 53.0 3.5 6% Immediate
48.3 35.3 13 27% Immediate
Be
hav
ior
Send Outlook reminders to turn off computers
Desktop computer
103.7 96.6 7.1 7% Immediate
90.7 103.6 -13.1 -14% Immediate
90.7 62.4 28.3 31% Immediate
75.4 74.2 1.2 2% Immediate
Install feedback monitoring device on workstation
LCD display, computer, computer speakers
115.4 80.1 35.3 31% 6
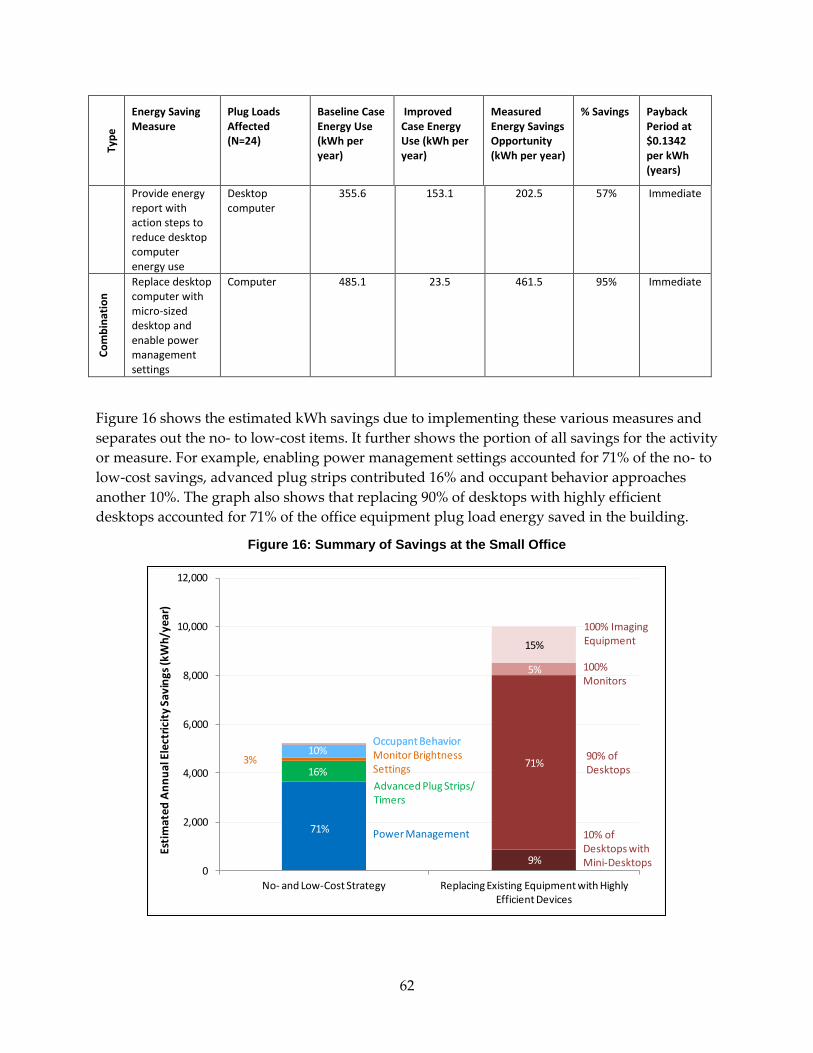
62
Typ
e
Energy Saving Measure
Plug Loads Affected (N=24)
Baseline Case Energy Use (kWh per year)
Improved Case Energy Use (kWh per year)
Measured Energy Savings Opportunity (kWh per year)
% Savings Payback Period at $0.1342 per kWh (years)
Provide energy report with action steps to reduce desktop computer energy use
Desktop computer
355.6 153.1 202.5 57% Immediate
Co
mb
inat
ion
Replace desktop computer with micro-sized desktop and enable power management settings
Computer 485.1 23.5 461.5 95% Immediate
Figure 16 shows the estimated kWh savings due to implementing these various measures and
separates out the no- to low-cost items. It further shows the portion of all savings for the activity
or measure. For example, enabling power management settings accounted for 71% of the no- to
low-cost savings, advanced plug strips contributed 16% and occupant behavior approaches
another 10%. The graph also shows that replacing 90% of desktops with highly efficient
desktops accounted for 71% of the office equipment plug load energy saved in the building.
Figure 16: Summary of Savings at the Small Office
71%
9%
16%3%
10%71%
5%
15%
0
2,000
4,000
6,000
8,000
10,000
12,000
No- and Low-Cost Strategy Replacing Existing Equipment with Highly Efficient Devices
Esti
mat
ed A
nn
ual
Ele
ctri
city
Sav
ings
(kW
h/ye
ar)
Power Management
Occupant Behavior
10% of Desktops with Mini-Desktops
Occupant BehaviorMonitor Brightness Settings
100% Imaging Equipment
100% Monitors
90% of Desktops
Advanced Plug Strips/ Timers

63
Table 12 is a summary of the total energy savings opportunities. It presents the number of
devices studied at each sites, along with the percent of the devices that would be impacted by
each savings strategy. The measured savings opportunity from both sites is shown in the right-
hand column. An individual measure with high savings can be less valuable than one with a
modest savings depending on the number of devices and the baseline energy use for the
devices. An important caveat is that this research represents a very small sample size, reducing
the ability for broad claims of specific achievable savings at other buildings. The findings do,
however, demonstrate consistency in the order of importance of approaches and the key
devices to be addressed (see Table 17) that are transferable to most office spaces.
Table 12: Summary Plug Load Energy Savings Opportunities by Individual Strategy
Typ
e
Strategies Studied Devices Opportunity1 Measured
Savings (%)1
per Device Type
Library Small Office Library Small Office
Re
pla
ce Replace existing monitors with
comparable best-in-class models 218 33 100% 100% 43%
Re
pla
ce
Replace existing monitors with comparable best-in-class models with Automated Brightness Controls
218 33 100% 100% 37%-50%
Re
pla
ce
Replace inefficient MDFs, mailing machines, and laser and inkjet printers, with comparable best-in-class models
40 15 100% 100% 79% Small Office
3
74% Library
3
Re
pla
ce Replace existing desktop
computer with comparable best-in-class models
203 37 100% 100% 88%4
Re
pla
ce Replace desktop computers by
mini-desktops and enabled PM 203 37 20%
4 10%
4 95%
Har
dw
are
Load sensor plug strip with computer laser and computer speakers
17 computers speakers/ 28 laser printers/ 82 private monitors
20 computer speakers 9 laser printers
33 monitors
8/17 of computer speakers 11/28 of laser printers 11/82 monitors
15% of computer speakers 3/9 of laser printers
5
3/33 monitors
46%

64
Ty pe
Strategies Studied Devices Opportunity1 Measured
Savings (%)1
per Device Type
Har
dw
are
Install remote control plug strip with laser printer
12 private laser printers
9 laser printers
11/12 of private laser printer
5/9 of laser printers
55%
Har
dw
are
Load sensor plug strip with laser printer and computer monitor in public space of library
16 public laser printers 136 public monitors
n/a 100% public laser printers 16/136 monitors
n/a 14%
Har
dw
are
Use timer plug strip with computer peripherals and laser printers
17 computer speakers 28 laser printers 82 private monitors
6 calculators 20 computer speakers 9 laser printers 33 monitors
8/17 of computer speakers 11/28 of laser printers 11/82 monitors
3/9 of laser printers 3/33 of monitors 5/20 computer speakers and 5/6 calculators
43%
Har
dw
are
Use timer plug strip and timers with imaging equipment
5 laser MFD 28 laser printers 5 Inkjet printers 2 laser fax
9 laser printers 1 mailing machine 4 Laser MFD 1 Solid Ink MFD
100% imaging equipment
63% laser printer 100% mailing machine, laser MFD and solid ink MFD
10%-36%
Har
dw
are
an
d
IT
Enable power management settings for computer or install centralized software method
203 37 13% 62% 50% per inefficient computer
Be
hav
ior
Enable more aggressive power management settings for imaging equipment
5 laser MFD
27 laser printers
5 Inkjet printers
2 laser fax
9 laser printers 1 mailing machine 4 laser MFD 1 solid Ink MFD
100% 100% 20%
Be
hav
ior Adjust brightness settings of
computer monitors
218
33 100% 100% 12%

65
Ty pe
Strategies Studied Devices Opportunity1 Measured
Savings (%)1
per Device Type
Be
hav
ior Outlook reminders to encourage
manually unplugging computers 203 37 64/203 100% 6%
Notes on table data: 1 Savings opportunities are based on measured savings, except in a few cases where we used assumptions
from previous commercial studies.
2 The “Total Estimated Savings” is the number of inventoried devices multiplied by the measured average
energy consumption for each device type, the opportunity percentage or the percentage of total
inventoried devices that could be affected by this measure, and the measured savings opportunity per
device type (%).
3 This is a weighted average of estimated savings opportunities based in inventoried imaging equipment.
4 Such computers are by no means intended to replace all desktop applications in an office, but desktop
computers that are only employed for relatively straightforward tasks like email, word processing, and
internet browsing, could be easily replaced with much less powerful computers.
5 Load-sensor plug strips can only be installed on printers connected to an individual computer. Also,
savings will only be achieved if the computer is powered down by the user or automatically at night and
on weekends.
3.2.1.4 Total Energy Savings: Studied Plug Loads
The applied strategies and measures showed strong energy reduction opportunities even at
these sites that had already adopted green practices and building design. The sum of the
applied measures reduced the total studied baseline plug loads by 19% at the library and by
40% at the office, as shown in
Figure 17 provides the share that each major savings category contributed to the total reduction
of studied plug load energy use. Power management (which includes simple modifications to
the settings on desktop computers, monitors or imaging equipment) is the greatest contributor
to savings at both sites. For both sites, the second area of greatest savings is Advanced Plug
Strips and Timers. The other two key areas - Adjustments to Monitor Brightness and Occupant
Behavior approaches – contribute less and vary slightly between the two sites but are still two
of the four primary methods for savings.

66
Figure 17: Studied Plug Load Energy Savings from all Strategies and Measures
At the Library At the Office
The important takeaway here is that the three strategies of Power Management, Plug
Strips/Timers and Adjusting Monitor Brightness achieve the lion’s share of low- to no-cost
savings opportunities and should be the first things addressed by any office. Approaches to
Behavioral strategies do need to be a part of improvements, but changes can be simple (a
prompt or reminder sign) or more complicated (ongoing employee engagement, varying
methods of prompts, rewards), so the persistence and cost is highly variable.
What is less obvious, but important to remember, is that percent savings is deceptive and
cannot singularly be used to rank savings opportunities. For example the library has only a 19%
savings, while the office showed a 40% savings. Library actual savings were over 12,000
kWhs/year due to its >65,000 kWhs/year annual studied plug load energy use, while the office
savings were just over 5,000 kWhs/year –40% of approximately 13,000 kWhs/year energy use for
the studied plug loads.
3.2.1.5 Data Interpretation Issues
A number of data interpretation issues arose during this research. These include lack of
definition of plug loads, plug load metering issues, the impact of the IT structure of the office
(cloud vs. in-house server), and that as other building loads decrease, plug loads become a
greater percentage of building energy use. These four issues are briefly defined below.
1. Lack of Definition. Plug loads have historically been outside the purview of code-
setting bodies, and the number of office equipment devices and personal technologies
changes quickly. As a result, there is no industry definition of “Plug Loads.” Table 13
shows how three different references (CBECS, CEUS and PIER) account for plug energy
use in offices. The two most commonly referenced sources for baseline energy use –
CEUS (California) and CBECS (national) - differ significantly in how they categorize
plug energy use. A third reference, a 1999 PIER study that contributed to the 2003 PIER
Impact Assessment study and this NBI/Ecova study, shows yet another categorization.
Due to these varying definitions and percent references, the industry is perplexed and
inconsistent when presenting plug load energy use. For the purpose of this study, the
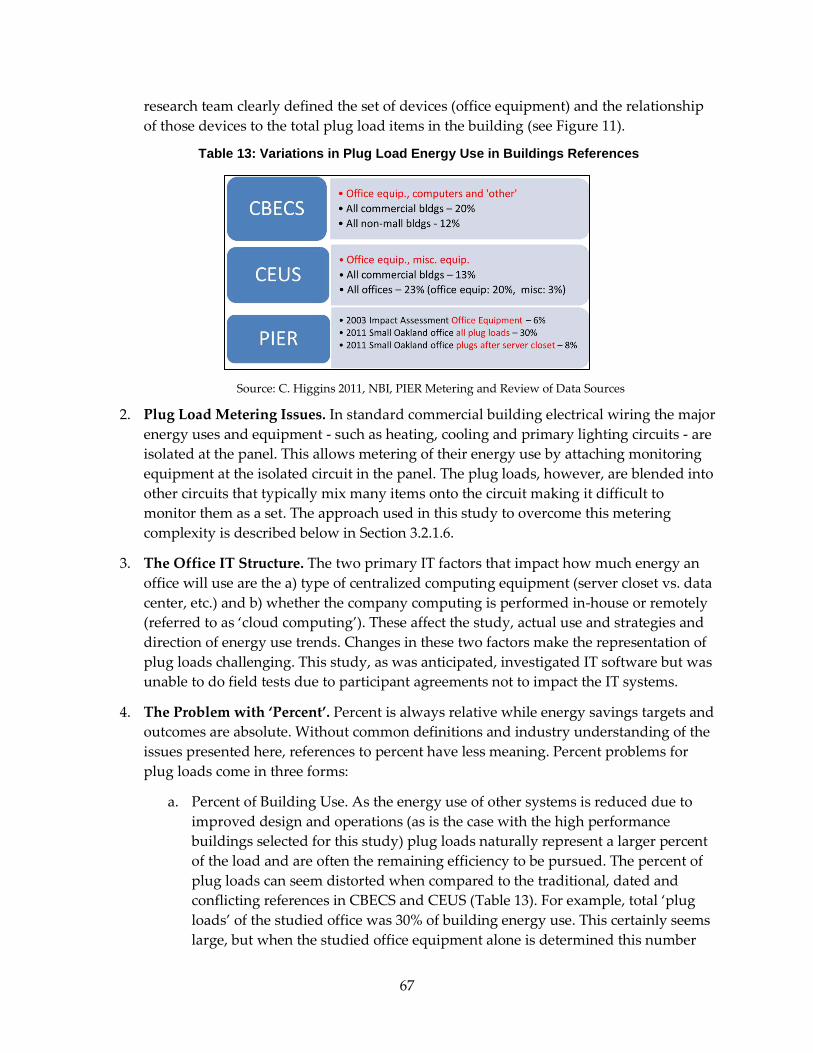
67
research team clearly defined the set of devices (office equipment) and the relationship
of those devices to the total plug load items in the building (see Figure 11).
Table 13: Variations in Plug Load Energy Use in Buildings References
Source: C. Higgins 2011, NBI, PIER Metering and Review of Data Sources
2. Plug Load Metering Issues. In standard commercial building electrical wiring the major
energy uses and equipment - such as heating, cooling and primary lighting circuits - are
isolated at the panel. This allows metering of their energy use by attaching monitoring
equipment at the isolated circuit in the panel. The plug loads, however, are blended into
other circuits that typically mix many items onto the circuit making it difficult to
monitor them as a set. The approach used in this study to overcome this metering
complexity is described below in Section 3.2.1.6.
3. The Office IT Structure. The two primary IT factors that impact how much energy an
office will use are the a) type of centralized computing equipment (server closet vs. data
center, etc.) and b) whether the company computing is performed in-house or remotely
(referred to as ‘cloud computing’). These affect the study, actual use and strategies and
direction of energy use trends. Changes in these two factors make the representation of
plug loads challenging. This study, as was anticipated, investigated IT software but was
unable to do field tests due to participant agreements not to impact the IT systems.
4. The Problem with ‘Percent’. Percent is always relative while energy savings targets and
outcomes are absolute. Without common definitions and industry understanding of the
issues presented here, references to percent have less meaning. Percent problems for
plug loads come in three forms:
a. Percent of Building Use. As the energy use of other systems is reduced due to
improved design and operations (as is the case with the high performance
buildings selected for this study) plug loads naturally represent a larger percent
of the load and are often the remaining efficiency to be pursued. The percent of
plug loads can seem distorted when compared to the traditional, dated and
conflicting references in CBECS and CEUS (Table 13). For example, total ‘plug
loads’ of the studied office was 30% of building energy use. This certainly seems
large, but when the studied office equipment alone is determined this number

68
drops to 6% of total building energy use (see Section 3.2.1.6 below and Figure
18).
b. Measure Savings. To be relevant, savings must have a scale of measures
impacted and baseline assumptions of time and energy. Representing the savings
potential of a single measure using a percentage is incomplete. This study cross-
referenced all savings against the number of devices impacted and the measured
baseline energy.
c. Targets are Absolute. Energy targets – at the project and the policy level – are
typically based on actual savings and outcomes. Saving 40% of a small energy
use device is only valuable if that device is prolific and the savings widely
implemented.
3.2.1.6 The Whole-Building Perspective
The research approach for assessing energy use and savings potential was a very precise
‘bottom-up’ method which included an inventory of all equipment, elimination of IT-based
items (server closet and associated plug in air-conditioner) and major appliances, and direct
device monitoring of all remaining items.
In parallel with this Ecova-led device-level assessment, NBI worked at the small office site on a
‘top-down’ analysis for Project 2 – Key Performance Indicators of High Performance Buildings.
This work started with whole-building total energy use and metering at the panel for
subsystems to identify the gross plug loads, followed by submetering the server closet and
associated air conditioner. This ‘deductive’ method (starting from total building energy and
removing known amounts per metered system) helped identify and verify the plug load
portion of the whole-building energy use and the allotment of ‘office equipment’ plug loads
studied for savings strategies. From this ‘top-down’ metering approach the overall energy use
categories were determined.
At the small office Figure 18 shows this building’s relatively low percent of lighting energy use
(10%48). The plug loads in turn are much higher than the lighting load – representing 30% of
total energy load for the building and reflecting the trend discussed above: when primary loads
are reduced (such as lighting), plug loads become a larger percent. The 30% attributed to Plug
Loads in Figure 18 is based on the system metering NBI installed. This total is predominantly
the energy use of the server and its direct plug-in air conditioning unit. The non-server plug
load energy use is assessed to be 8% of the total at this building, while the studied office
equipment plug loads devices represent a smaller subset of 6% of the whole building after
appliances are removed, as shown below.
48 Average California office lighting = 28% according to CEUS.
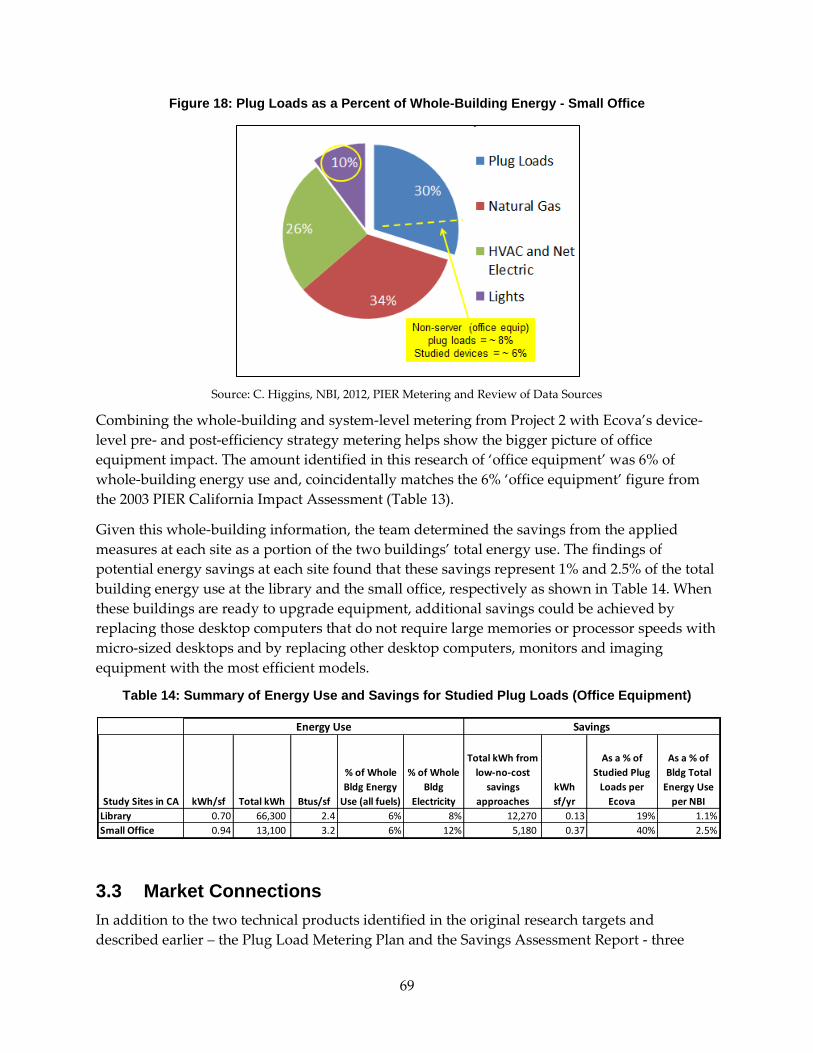
69
Figure 18: Plug Loads as a Percent of Whole-Building Energy - Small Office
Source: C. Higgins, NBI, 2012, PIER Metering and Review of Data Sources
Combining the whole-building and system-level metering from Project 2 with Ecova’s device-
level pre- and post-efficiency strategy metering helps show the bigger picture of office
equipment impact. The amount identified in this research of ‘office equipment’ was 6% of
whole-building energy use and, coincidentally matches the 6% ‘office equipment’ figure from
the 2003 PIER California Impact Assessment (Table 13).
Given this whole-building information, the team determined the savings from the applied
measures at each site as a portion of the two buildings’ total energy use. The findings of
potential energy savings at each site found that these savings represent 1% and 2.5% of the total
building energy use at the library and the small office, respectively as shown in Table 14. When
these buildings are ready to upgrade equipment, additional savings could be achieved by
replacing those desktop computers that do not require large memories or processor speeds with
micro‐sized desktops and by replacing other desktop computers, monitors and imaging
equipment with the most efficient models.
Table 14: Summary of Energy Use and Savings for Studied Plug Loads (Office Equipment)
3.3 Market Connections
In addition to the two technical products identified in the original research targets and
described earlier – the Plug Load Metering Plan and the Savings Assessment Report - three
Study Sites in CA kWh/sf Total kWh Btus/sf
% of Whole
Bldg Energy
Use (all fuels)
% of Whole
Bldg
Electricity
Total kWh from
low-no-cost
savings
approaches
kWh
sf/yr
As a % of
Studied Plug
Loads per
Ecova
As a % of
Bldg Total
Energy Use
per NBI
Library 0.70 66,300 2.4 6% 8% 12,270 0.13 19% 1.1%
Small Office 0.94 13,100 3.2 6% 12% 5,180 0.37 40% 2.5%
Energy Use Savings
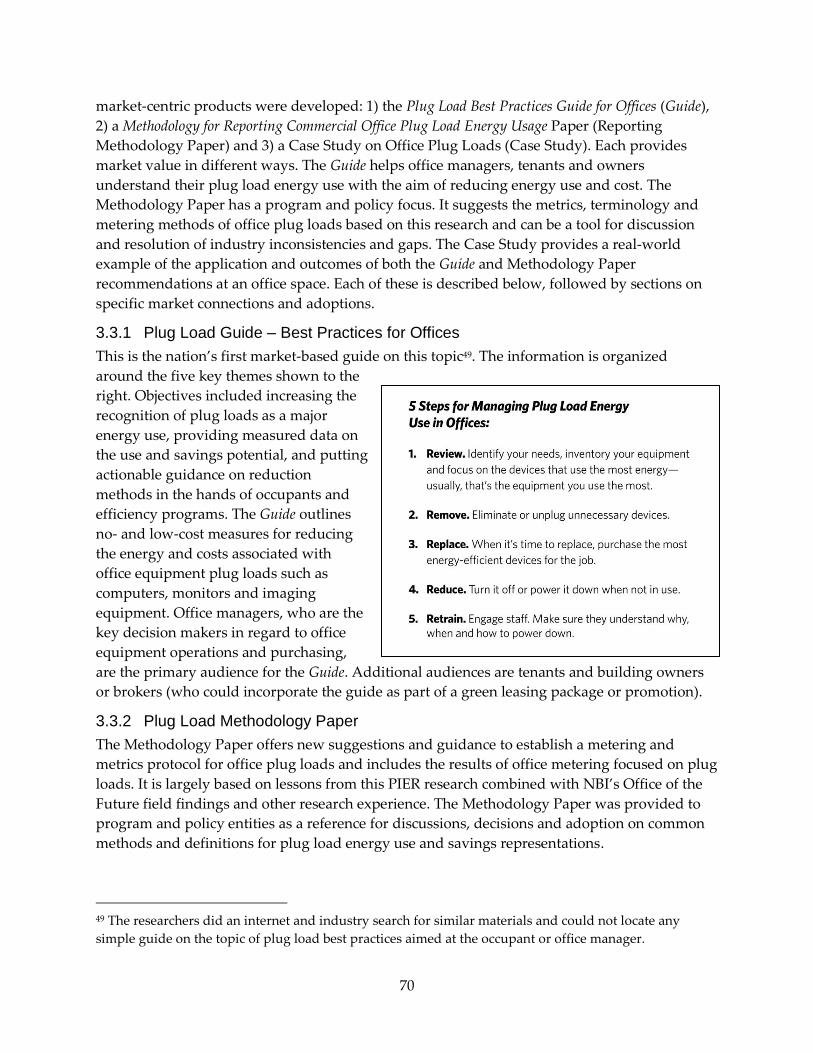
70
market-centric products were developed: 1) the Plug Load Best Practices Guide for Offices (Guide),
2) a Methodology for Reporting Commercial Office Plug Load Energy Usage Paper (Reporting
Methodology Paper) and 3) a Case Study on Office Plug Loads (Case Study). Each provides
market value in different ways. The Guide helps office managers, tenants and owners
understand their plug load energy use with the aim of reducing energy use and cost. The
Methodology Paper has a program and policy focus. It suggests the metrics, terminology and
metering methods of office plug loads based on this research and can be a tool for discussion
and resolution of industry inconsistencies and gaps. The Case Study provides a real-world
example of the application and outcomes of both the Guide and Methodology Paper
recommendations at an office space. Each of these is described below, followed by sections on
specific market connections and adoptions.
3.3.1 Plug Load Guide – Best Practices for Offices
This is the nation’s first market-based guide on this topic49. The information is organized
around the five key themes shown to the
right. Objectives included increasing the
recognition of plug loads as a major
energy use, providing measured data on
the use and savings potential, and putting
actionable guidance on reduction
methods in the hands of occupants and
efficiency programs. The Guide outlines
no- and low-cost measures for reducing
the energy and costs associated with
office equipment plug loads such as
computers, monitors and imaging
equipment. Office managers, who are the
key decision makers in regard to office
equipment operations and purchasing,
are the primary audience for the Guide. Additional audiences are tenants and building owners
or brokers (who could incorporate the guide as part of a green leasing package or promotion).
3.3.2 Plug Load Methodology Paper
The Methodology Paper offers new suggestions and guidance to establish a metering and
metrics protocol for office plug loads and includes the results of office metering focused on plug
loads. It is largely based on lessons from this PIER research combined with NBI’s Office of the
Future field findings and other research experience. The Methodology Paper was provided to
program and policy entities as a reference for discussions, decisions and adoption on common
methods and definitions for plug load energy use and savings representations.
49 The researchers did an internet and industry search for similar materials and could not locate any
simple guide on the topic of plug load best practices aimed at the occupant or office manager.
71
3.3.3 Plug Load Case Study
The Case Study is based on applying the Methodology Paper metrics and recommended
approach to assessing the energy savings and outcomes at the PECI office in Portland, Oregon.
The PECI office served as a test bed for the metering method, metrics, and to add greater data
on the plug load approaches and measured performance for energy efficiency. The Case Study
provides owners or office managers of validation of the recommended strategies and outcomes
through an applied example in a typical office space. The Case Study can also serve as a
supporting document or reference for the program and policy audience in support of the
Methodology Paper.
3.3.4 Research Promotion and Outreach
The Savings Assessment Report results and the Guide, received attention through the research
teams outreach to targeting a variety of users (e.g., building owners, utilities, cities) and
approaches (e.g., media releases, announcements from NBI and its allies, articles and
presentations). A list of the known publications, entities and utilities promoting this PIER
research is shown below; considering the extent of the outreach and the interest, there are
undoubtedly others that have picked up on the media and extended the information across
additional conduits.
Media release, blog postings and Twitter feeds promoting the Guide in July 2012 were
shared by ESource, The Kresge Foundation, The Institute for Market Transformation,
Healthcare Performance Engineering, CB Richard Ellis Green, Rocky Mountain Institute,
Natural Resources Defense Council and PAE Engineers.
Industry articles on, or citing, the results were in Commercial Property Executive (CPE),
Real Estate Rama, Building Operating Management, Environmental Building News, Smart
Energy Universe, The Power Factor, Ecova Insider and the Northwest Conduit
A feature article on commercial plug load trends titled “The Next Frontier” appeared
in the September issue of Commercial Property Executive magazine (CPE); it references the
Guide and includes an interview with a staff member50. CPE has a subscription base of
over 30,000 top-level commercial real estate executives, including a mix of investors,
developers, financiers and service providers from across the nation and spanning the
major property types.
Presentations were made at multiple venues. The Savings Assessment Report findings
were a part of presentations at the 2011 and 2012 Behavior Energy and Climate
Conference (BECC) meetings in Washington D.C. and Sacramento respectively, and at
the October 2012 California Emerging Technology Summit meeting in Irvine. In March
2012 the findings were presented as part of a panel at the ASHRAE High Performance
Conference in San Diego and at the ACEEE Market Transformation Conference in
Washington D.C. in March 2013.
50 A copy of the article can be found at: http://digital.cpexecutive.com/publication/?i=119254
72
Webinars highlighted this work in two important presentations. First to a group of 35
NBI stakeholders, mostly utilities and public-purpose providers interested in advancing
their efforts to incentivize plug load control measures. Second, to over 200 participants
comprised primarily of utilities, consultants, program implementers, and architects and
engineers, through a webinar co-hosted by E-Source. Both webinars addressed questions
from the attendees and generated a number of follow up inquiries and connections to
the research.
3.3.5 Public Programs and Market Adoption
Plug Load Guide. Use of the Guide by utilities and the market is facilitated through its design,
which provides blank areas on the front and back for co-branding. The Guide was co-funded
with support NBI, the Northwest Energy Efficiency Alliance and BC Hydro. CEC recognition
was required in all cases of use within and beyond California. Specific uses of the Guide include:
Utilities. The Guide was, or is in the process of being, co-branded for distribution to
thousands of office building owners and tenants throughout California through several
major utilities (LADWP, SMUD and SCE). PG&E and Sempra received the Guide and
associated files for customization and are considering its use and distribution through
their programs.
The Cities of San Francisco and Berkeley. Both are working on branded versions for
distribution to their constituency and through city efficiency and disclosure programs.
Ecology Action. A PG&E program implementer for small and medium commercial
buildings in seven Northern California counties, Ecology Action has over 12,000
commercial retrofit projects completed. Approximately 40% of their work to date is in
offices where they plan to put the Guide in the hands of owners and tenants on behalf of
PG&E.
Real estate brokers through Waypoint Buildings Group. Waypoint works as a real
estate specialist in sustainability and energy efficiency for commercials buildings. They
plan to use the Guide with clients interested in green tenant leases, and through local
chapters of BOMA.
CB Richard Ellis (CBRE).The world’s largest manager of commercial real estate, CBRE,
has its office of Sustainability in San Francisco. The researchers provided the Director of
Sustainability the Guide as a tool for their tenants.
Consortium for Energy Efficiency (CEE). The research team delivered the Methodology
Paper to CEEE - a key conduit to the utility industry for program research and
alignment on energy efficiency issues and measures - as a topic for their committee work
measured performance.
ASHRAE. ASHRAE considers and makes recommendations on metrics and protocols
for energy efficiency. The Methodology Paper is in the hands of staff at ASHRAE.

73
NBI PIER Research Site. The results of all the key research products are publically
available on the NBI website and through its Advanced Buildings® Program. NBI’s site
receives over 45,000 site visits annually seeking information on commercial building
energy efficiency.
3.4 Benefits to California
As represented in the research, specific energy savings potential are highly variable by office,
and the estimates from this research are based on a very small sample set. Nonetheless, the
research did demonstrate that a 19-40% reduction in the studied office equipment plug loads
was achieved at these two high performance California buildings. To provide some order of
potential impact, on a conservative basis, an estimate of just a 10% reduction to office
equipment energy for office buildings translates into an annual California savings of 316 GWh.
When this is applied to all commercial building types – recognizing that office equipment plug
load energy potential exists in the majority of commercial buildings51 - the savings becomes 478
GWh.
In addition, several non-energy benefits accrue, including: extended equipment life (and
therefore reduced landfill volume and reduced cost for California offices), improved office
comfort due to reduced heat and noise, the potential to downsize HVAC systems due to less
heat from equipment, and the opportunity for space savings due to the typically smaller size of
efficient equipment as compared to their non-efficient counterparts.
The results of extrapolating the savings across buildings in California are shown in Table 15
below.
Table 15: Potential Impact of Office Equipment Plug Load Energy Efficiency in California
Energy Savings Due to Applying a Percentage Savings to California Office
Buildings Plug in Office Equipment (GWh)
Percent Reduction Offices Only All Commercial Buildings
10% 316 478
25% 790 1196
The research team has worked to put the results in the hands of the office owners and
managers, utilities and policymakers; these are groundwork steps toward making potential
savings a reality. The next and final section outlines recommendations for continued progress
toward California’s goals of low- and zero-energy buildings in the area of Plug Loads.
51 Office equipment is typically found in less density in commercial buildings that aren’t offices, but the
estimate is made as an example and is simply an extrapolation of the conservative 10% reduction across
all California commercial buildings.

74
3.5 Conclusions and Next Steps
This research provided the evidence-based data that can be leveraged for market, program and
policy objectives relating to plug load energy use and savings. This research was also valuable
for highlighting data interpretation issues and providing some clarifications and suggestions for
resolution. Some key takeaways are:
Plug load devices are rapidly growing in offices and are unregulated, so their absolute
energy use is increasing.
Server closets and data centers are very large and discrete energy uses requiring specific
approaches.52
This research showed effective approaches to significantly reducing energy use of this
set of office equipment. Although the impacts appear small when seen as a percent of
whole-building energy in this sample, the plug load strategies and opportunities will
likely be greater in other buildings compared with these ‘green’ buildings.
The savings levels, in these sites was 1-3% of total building energy use, represent an
important and largely untouched area of savings. The integrated approach necessary to
achieve the low and zero-net energy building targets across California must include
these savings.
The clear identification of the following easy-to-communicate sets of three findings are a leap
forward in understanding and progress on the sources of plug load energy use and what should
be done to reduce it:
Office equipment plug load energy use in order:
1. Desktop Computers
2. Imaging Equipment and Peripherals
3. Computer Monitors
Approaches to save energy:
1. Software
2. Hardware
3. Occupant Information and Promos
Priority no–low cost strategies and technologies53:
1. Aggressive Power Management Settings
2. Plug Strips and Timers
3. Occupant Information and Prompts
This is the high level of information that benefits California’s efforts to communicate effectively
to the chain of parties responsible and engaged in plug load energy use. NBI has initiated this
52 www.nrdc.org/energy/saving-energy-in-server-rooms.asp 53 Note: Replacing equipment with low-energy models is a high saving strategy and is low or no cost the
time of planned replacement.

75
information disbursement, but the findings remain available and valuable for use by a wide
range of California entities.
3.5.1 Next Steps
The results of this research open new avenues for utility programs and necessitate policy
formation. These results also open the door for additional research that will validate and
expand upon what was found in this research effort. The next steps and recommendations are
presented in three topic areas that align with different audiences: 1) Program Priorities, 2)
Regulatory Approaches and 3) Future Research.
Program Priorities. Utility and public entities such as cities or government offices should
consider the following within their voluntary efficiency programs:
Technology Incentives. Incent advanced plug strips, timers and/or occupancy sensors
focused on computers, monitors and imaging equipment and. IT energy management
software programs.
Occupant Engagement Methods. Include occupant engagement strategies such as
enabling existing energy management settings, disabling unused equipment, education
and awareness campaigns for staff about efficient behaviors and usage patterns, auto
prompts to occupants to turn off equipment, and tenant competitions for low energy
use.
Education and Promotion. Promote the Guide and establish public education based on
the recommendations.
Targeted Procurement. Allow only the top efficient office products to be eligible in the
program and inform office managers about the Top Ten list and site
(www.toptenusa.org). Although EnergyStar labels identify higher efficiency equipment,
the Top Ten list, developed by a national consortium of efficiency organizations, helps
refine the attributes that make an appliance or equipment in the top ten of its class.
Public programs could target, incent or promote the top ten, not just use broad labels
such as ‘buy EnergyStar’.
Cloud Computing. Encourage strategies to move office computing to the ‘cloud’. There
are a range of possible outcomes for efficiencies to be realized by switching to
virtualization and cloud computing alternatives if done correctly. A recent report by the
National Resources Defense Council (NRDC) determined that “running a computer
application in the cloud is generally more energy and carbon efficient than running it in
your server room because cloud commuting can serve more customers at the same time,
achieving economies of scale” (Is Cloud Computing Always Greener 201254).
Regulatory Approaches. The regulatory approaches that could be pursued are highly
dependent on the type of equipment and current mechanisms available. Within this research
54 www.nrdc.org/energy/cloud-computing-efficiency.asp

76
NBI wrote a brief paper titled “Plug Load Policies: in Place, Pending or Possible” (Policy Paper55)
to present the methods underway in California and nationally to reduce plug load energy use
and recommend next steps.
The major policy areas and current status in California are:
Switched Outlets (Control through the Receptacle). This approach requires that a
minimum number of receptacles in a building be on an independent circuit that is
capable of being switched off through the use of a controller. In all cases these controlled
receptacles are required to be easily distinguishable by occupants from the other, non-
controlled receptacles. The three major codes or Standards – ASHRAE, IgCC (within the
IECC), and Title 24 – have some requirements that fall under this approach.
o Title 24 201356: At least one controlled receptacle is to be installed within six feet
of each uncontrolled receptacle in all buildings. Hotels and motels are required
to have at least half of the receptacles in each guest room be controlled.
Appliance Standards (Title 20). Appliance standards are set forth in the National
Appliance Energy Conservation Act (NAECA), Energy Policy Act (EPAct) and the
Energy Independence and Security Act (EISA). In California appliances must meet the
minimum efficiency requirements of Title 20. Title 20 should continue to move toward
technologically feasible lower power limits for appliance standards and expand to
include electronics that feature standby, sleep and idle modes of operation – particularly
for large plug contributors such as computers.
Wiring & Metering Approaches. . The following energy codes and standards feature
requirements, based on use thresholds for the wiring and metering of circuits associated
with plug load energy use. These can facilitate the ability to access plug load data and, in
turn, make that data visible to commercial building occupants. This ‘feedback’ loop is a
major premise of this research.
o Title 24 2013: There are four different energy thresholds with varying levels of
disaggregation requirements for plug load circuits. All commercial buildings
with a plug load service between 50 kVA and 250 kVA need to aggregate plug
loads separately from other loads in the building. Buildings with a plug load
service exceeding 250 kVA need to separate plug loads by floor, type or area. In
addition, groups of plug loads exceeding 25 kVA in an area less than 5,000
square feet also need to be on a separate circuit.
Task Lighting. When accounted for in a larger lighting design, task lighting – portable
lights plugged in at individual work areas - can be an effective way to reduce overall
space lighting energy use by putting the lumens at the work surface. Task lights fall into
the plug load category and are therefore difficult to “touch” from a policy perspective.
55Appendix A-4
56 The Title 24 2013 Standard is scheduled to go into effect January 1, 2014.

77
o Title 24 2013 requires all portable lighting systems to be accounted for in the
lighting power density (LPD) space limit but provides a budget of .3 watts per
square foot for task lighting. The Energy Code of Canada also requires that
“supplemental interior lighting provided by movable or plug-in luminaires” be
accounted for when determining compliance with installed lighting power limits.
Outcome-based Codes Approach. A code approach that relies less on addressing the
building in the construction phase, but more in the operational phase is referred to as an
Outcome-Based Code (OBC). Outcome-based codes rely on demonstration of the
building meeting a specific target for energy consumption, usually based on at least 12
months of measured energy use data. The targets can be set by building energy
simulations or derived from surveys such as CBECS or CEUS.
Though this code approach is only now in the pilot phase at a few municipalities57 it
offers significant promise in the medium to long term to address the most significant
issues around plug loads – their variability among buildings and inability to be
regulated in the construction phase. Several hurdles need to be addressed, chief among
them the question of enforcement mechanisms available long after the building has been
occupied.
Reach (or Stretch) Codes. California’s CalGreen has been adopted by over 100
jurisdictions and requires an energy saving level beyond the base energy code (Title 24).
Similar actions are underway in Massachusetts and Oregon. At this point, none of the
requirements for plug loads in these Reach Codes exceed those in ASHRAE 90.1-2010 or
Title 24, but the Reach Codes provide a mechanism for implementing plug code
requirements on less than, or in advance of, a full statewide mandatory basis.
57 Seattle is in the process of having an Outcome-based code pilot program and other cities are
considering the approach.
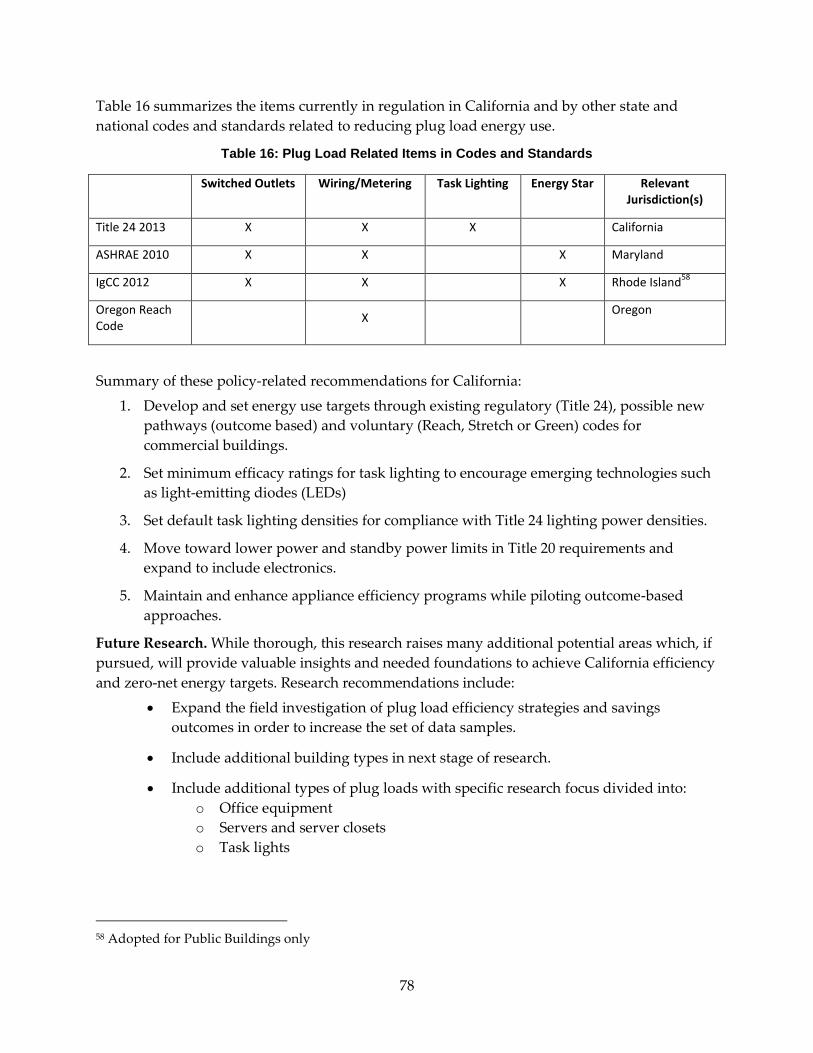
78
Table 16 summarizes the items currently in regulation in California and by other state and
national codes and standards related to reducing plug load energy use.
Table 16: Plug Load Related Items in Codes and Standards
Switched Outlets Wiring/Metering Task Lighting Energy Star Relevant Jurisdiction(s)
Title 24 2013 X X X California
ASHRAE 2010 X X X Maryland
IgCC 2012 X X X Rhode Island58
Oregon Reach Code
X Oregon
Summary of these policy-related recommendations for California:
1. Develop and set energy use targets through existing regulatory (Title 24), possible new
pathways (outcome based) and voluntary (Reach, Stretch or Green) codes for
commercial buildings.
2. Set minimum efficacy ratings for task lighting to encourage emerging technologies such
as light-emitting diodes (LEDs)
3. Set default task lighting densities for compliance with Title 24 lighting power densities.
4. Move toward lower power and standby power limits in Title 20 requirements and
expand to include electronics.
5. Maintain and enhance appliance efficiency programs while piloting outcome-based
approaches.
Future Research. While thorough, this research raises many additional potential areas which, if
pursued, will provide valuable insights and needed foundations to achieve California efficiency
and zero-net energy targets. Research recommendations include:
Expand the field investigation of plug load efficiency strategies and savings
outcomes in order to increase the set of data samples.
Include additional building types in next stage of research.
Include additional types of plug loads with specific research focus divided into:
o Office equipment
o Servers and server closets
o Task lights
58 Adopted for Public Buildings only

79
Perform Designing for Meterability (DFM) field studies and other methods for
system-level metering to isolate the plug load energy use in new and existing
buildings.
Investigate the savings potential from behavioral changes and items as energy use
and feedback displays.
Determine the financial impacts and benefits of plug load measures and especially
the incremental cost of measures.
Identify the specific demand energy impacts.
Research the latest in equipment and technology improvements.
Identify the optimum outreach, education and behavioral efforts and impacts.
The Plug Load Savings Assessment research findings and the market connection products are
valuable resources for today’s work in energy efficiency in California and to build on for
tomorrow’s ongoing efforts.

80
This page deliberately left blank
81
4. Skylight Testing and Validation
The Enhanced Skylight Modeling and Validation research project (Skylight Modeling Research)
aimed to develop and validate computer methods, as a viable alternative to physical
measurements, to produce information on the characteristics of the light from commercial
building skylight products. This type of information can assist lighting design professionals
when considering how and where to use skylights in building design as a strategy to displace
electric lighting with natural light (daylighting).
This report is a summary of the findings from Project 3 - Skylight Modeling Research - funded
by the California Energy Commission’s Public Interest Energy Research (PIER) program within
a broader program called Evidence-based Design and Operation. The research occurred from
2010-2013 and was led by Architectural Energy Corporation (AEC) and the California Lighting
Technology Center (CTLC). Daylighting Innovations (DI) performed the simulation work and
validation analysis and the CLTC was responsible for the physical measurements with support
from DI. Other key technical and match contributors included LTI Optics, Velux, Lambda,
Lawrence Berkeley National Laboratory (LBNL) and Daylight Technologies. New Buildings
Institute (NBI) was the program manager.
An in-depth report titled Enhanced Skylight Modeling and Validation (Skylight Modeling Report)
was developed and is included in this document as Appendix A-4. It provides additional details
on approach, conclusions and recommendations from this research project.
4.1 Background
Interior lighting accounts for the largest portion of electricity use in California’s commercial
buildings – almost 30%59. The last decade of progress in lamp and ballast efficiency is
impressive but it is the integration of daylighting controls – controls that reduce the electric
lighting in response to daylight – that is one component to meeting policy goals for zero net
energy buildings (ZNE) in new construction.
Daylighting designs, which include skylights and daylighting products that are integrated with
controls for the electric lights, are recognized as “best practice” by rating systems such as the
U.S. Green Building Council’s Leadership in Energy and Environmental Design-[for] New
Construction (LEED-NC) and is recognized as important conservation strategy in some State
energy codes and standards. For example, California’s non-residential energy code - Title 24
part six (Title 24) requires daylighting controls in daylit areas larger than 250 ft2. The purpose of
the controls is to lower electricity use through devices such as dimmers, automatic shading
systems, or bi-level lighting switches when sunlight is available as a substitute for electric
lighting. LEED-NC states that daylight should be introduced into at least 75% of regularly
occupied building areas. The Advanced Buildings Core Performance Guide60– used by utility new
59 The California Commercial Energy Use Survey (CEUS), Itron, 2006.
60 http://advancedbuildings.net.

82
construction energy efficiency programs across the nation - requires that electric lights in daylit
areas be designed with control systems to minimize their use with sunlight is available.
Building designers need tools to respond to these best-practice market drivers.
An office building in Oakland, California, that was studied through this PIER program (see
Chapter 2) provides a quick example of the reason for this research which is intended to
increase the use of daylighting in buildings. Occupied in 2006, this building met the standard
requirement Title 24 for ‘installed’ lighting of 0.8 watts per square foot of space (W/sf). Yet due
to daylighting controls the measured lighting energy use during occupied periods was only 0.33
W/sf – a 59% reduction.
Skylights are an important part of the strategy to accomplish energy reduction through
daylighting. Windows by themselves are not always the best source to ‘light’ the space because
daylight quickly diminishes as distance increases away from the window. At least 60% of
nonresidential ceiling area in California is directly below a roof that can potentially provide
access to daylighting, and 90% of new floor space is single-story construction61. Skylight
systems, with controlled electric lights, have a significant potential for saving lighting energy.
Lighting manufacturers provide information about the photometric (light) performance of their
luminaires (light systems) in the form of candlepower62 distribution data. This data is delivered
in a specific format validated by the industry technical authority - IESNA - that allows it to
serve as input to lighting simulation (software) tools. Building and lighting designers are
accustomed to using these simulation tools to review the options for lighting a commercial
space and to meet the code and client requirements.
In contrast, skylight manufacturers have very limited information to provide to building and
lighting design teams in order to assist them with predicting the performance of skylights and
specialty daylighting devices. This is due to a variety of technical, time and cost constraints
specific to the current approach for determining the lighting performance of skylights. This
current determination method requires taking physical measurements for each skylight product
in a photometric laboratory setting.
The absence of widespread photometric information on skylight systems makes it very difficult
to accurately compare the performance of different products. This information is critical to
determining the optimum position and distribution of these devices in a given space and to for
predicting year-round performance of skylights and specialty daylighting devices in building
projects. Increasing the use of skylights in commercial buildings depends in part on creating
more replicable, reliable and industry adopted methods that present the lighting performance
of skylights in file formats compatible with existing design tools.
61 McHugh, 2003. Modular Skylight Wells: Design Guidelines for Skylights with Suspended Ceilings,
PIER Report 500-03-082-A-13
62 Candlepower expresses levels of light intensity in terms of the light emitted by a candle of specific size
and constituents and is a common metric in light design.

83
4.1.1 Objective
The objective of the project was to define, develop and validate accurate computer simulation
methods, as an alternative to physical measurements, for producing skylight candlepower
distributions data and useful optical daylighting system (skylight) photometry information in
an IESNA compatible format. The candlepower distributions would be applicable for a variety
of locations, climates and, provided its material properties are known, skylight types.
This research has the potential to greatly advance both science and technology in the skylight
industry by validating a new method for assessing photometric performance that has been
slowly maturing over the last 20 years. This method only recently has become realistic and cost-
effective due to new measurement and modeling tools. This new method could solve the
limitations that exist when relying on physical measurements, i.e., cost, time and technology.
4.1.2 Approach
The project approach was to compare several physical photometric measurements of optical
daylighting systems (skylights) to computer models, validating the use of computer simulation
to reproduce this photometric information. The project used two main approaches:
measurement tasks and simulation tasks.
4.1.2.1 Measurement Task
The testing facility for this project was an 18’x18’x18’ building owned by the Velux Company
located in Greenwood, South Carolina. Velux, a skylight manufacturer, has developed a unique
facility that allows measurement of skylight candlepower distributions under real sky
conditions. The building shown in Figure 19 was designed to house a custom-built
goniophotometer63 for measuring the luminous intensity distribution that emanates from a
maximum 2’x2’ skylight. The goniophotometer system within the facility is comprised of
sensors, data logging equipment and a computer that controls the overall measurement process
and capture. Measurements were performed in July because sun angles are high then and the
time of year provided a good chance for mixed sky conditions.
Figure 19: Velux Test Facility
63 A device used for measurement of the light emitted from an object at different angles.

84
Three skylight configurations were selected for testing to represent a range of optical
complexities and different manufacturers. These products ranged from ones with very simple
single optics to more complex systems with multiple optical layers. Figure 20 show images of
the three daylight systems that were used.
Figure 20: Skylight Types and Systems Tested
Skylight Type Selected Products Image
1 – Basic Skylight:
Basic skylight:
minimal optics,
“low” aspect ratio
Sunoptics64 pyramid
skylight
Top prismatic lens
White diffuse
lightwell
2 - Moderate
skylight:
dual optics, “med”
aspect ratio
Sunoptics pyramid
skylight “light cube”
Top and bottoms
prismatic lens
Reflective lightwell
3 - Advanced
skylight:
multiple optics,
“high” aspect ratio
Sun Tunnel™65
Top clear lens
Bottom prismatic
lens
Reflective tubular
lightwell
For this study, the sky distribution measurements were taken on the roof during the same
duration of time that the goniophotometer measurements were done inside the building. The
CLTC determined the different measurement devices utilized to accurately capture the sky
resource.
Four groups of measurements were taken: Group 1 - sky luminance at zenith; Group 2 - sky
luminance mapping; Group 3 - global horizontal illuminance; and Group 4 - diffuse horizontal
illuminance. Sky zenith luminance measurements were taken to compare and calibrate the sky
64 Sunoptics Prismatic Skylights, an Acuity Company, http://www.sunoptics.com/
65 Velux, http://www.veluxusa.com

85
luminance mapping. In addition, horizontal and diffuse illuminance measurements were taken
to further compare and calibrate the captured luminance maps.
Simultaneous measurements were taken on the roof using the luminance camera, luminance
meter and horizontal illuminance meter, and in the interior of the facility using the automated
goniometer. The time of each measurement was recorded and referenced to a legal time server.
The research team also worked on illuminance meter calibration and captured material
reflectance measurements.
A total of 32 sets of measurements were taken over three days. The goal was to achieve
measurements with low, medium and high sun angles and with clear, partly cloudy and
overcast skies to obtain a robust data set for thorough validation. Each measurement set yielded
a sky luminance map, assembled from 16 hemispherical photographs taken with different
exposures. These images were then assembled into a single high-dynamic range (HDR) image,
thus providing an accurate luminance map of the scene.
Zenithal sky luminance was measured for each hemispherical image captured, resulting in 16
measurements per test. These showed some variance, particularly for the higher sun angles
with a bright zenith, and were averaged for each test. Both global and diffuse horizontal
illuminance measurements were taken.
Material measurements were taken for any onsite elements that would impact the optics of the
skylight system, particularly for any exposed wood in the roof and skylight framing, the floor
and walls of the goniophotometer room.
Photometric files were obtained for 24 out of the 32 tests. The remaining eight tests had faulty or
otherwise unreliable data and were not used for further validation. Of these 24 tests, 12 were
chosen for final validation with computer simulation: four for each of the three skylight
systems. For each skylight system, a test representing a low, mid and high sun angle was
chosen under a clear sky and a partly cloudy condition. This set of 12 skies is used to validate
the computer-simulated luminous intensity (discussed in the next section).
4.1.2.2 Simulation Task
The simulation task used field data from the measurement phase to perform comparable
computer simulations of the skylight systems. The steps included:
Processing the sky HDR images and recorded diffuse and global illuminance
measurements into complete and calibrated sky luminance maps and sun sources.
Creating ray-sets for use in forward ray-tracing engines from the sky and sun sources as
well as developing the skylight geometric models.
Developing near-field and far-field photometric simulation approaches.
Performing Bi-Directional Scatter Distribution Function (BSDF) measurements of the
skylight materials and developing BSDF models for each critical optical surface.
Creating the photometric files for the three skylight systems.

86
Sky Measurement Processing and Model Creation. Prior to beginning the validation tasks,
data from the physical measurements had to be processed into useable forms that represented a
hemisphere of sky and that could be incorporated for use in ray-tracing software. To
accomplish this, the raw photographs were cropped to represent a perfect hemispherical image
with an angular mapping. A negative masking layer was created and applied to the cropped
sky and adjusted to match measured sky illuminance. A matching Perez sky66 was created for
the current condition, then adjusted for “sky” shading and applied to a positive masking layer
to create a filler patch. Finally, the masked measured and Perez sky models were combined, and
a sun definition was added to create a final sky.
Sky Source Ray Set Creation. The research team then took the calibrated sky luminance map
and direct solar source and turned it into a form that can be used by the forward ray-tracing
programs. Two different approaches were explored in TracePro and Photopia (widely used
lighting design software programs): the creation of a continuous ray-set and the application of
sky luminance patches to a Tregenza sky patch model.
Geometric Model Development. 3D geometric models were created of the three skylight
systems tested (Figure 21). A fairly simple model was created for each skylight system that
includes the basic elements as perfect geometric forms (i.e. pyramids, prisms).
Figure 21: Isometric diagrams of the Sunoptics Light Box and the Sun Tunnel Geometric Models
Near-Field vs. Far-Field Comparisons. With performance luminous intensity measurements, it
is important to measure the intensity far enough away from the source so it acts as a point
source for the given direction. Typically a 5:1 rule (where measurements are taken at least 5x the
distance of the maximum dimension of the source) is followed. The physical luminous intensity
66 A standard used for measured luminance data modeling of the sky named for Richard Perez
(University of Albany 1991).
Top and
Bottom
prismatic
lens Specular
Side Walls
White tube
boot
Prismatic
bottom
lens
Acrylic top
lens
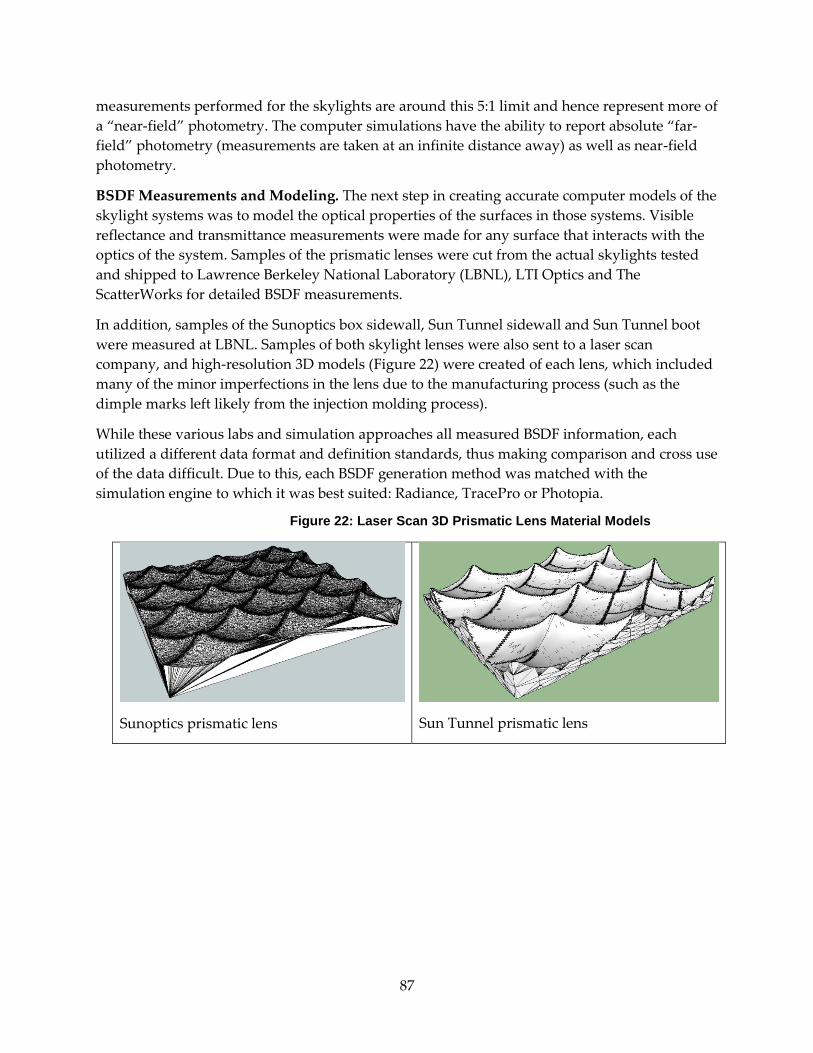
87
measurements performed for the skylights are around this 5:1 limit and hence represent more of
a “near-field” photometry. The computer simulations have the ability to report absolute “far-
field” photometry (measurements are taken at an infinite distance away) as well as near-field
photometry.
BSDF Measurements and Modeling. The next step in creating accurate computer models of the
skylight systems was to model the optical properties of the surfaces in those systems. Visible
reflectance and transmittance measurements were made for any surface that interacts with the
optics of the system. Samples of the prismatic lenses were cut from the actual skylights tested
and shipped to Lawrence Berkeley National Laboratory (LBNL), LTI Optics and The
ScatterWorks for detailed BSDF measurements.
In addition, samples of the Sunoptics box sidewall, Sun Tunnel sidewall and Sun Tunnel boot
were measured at LBNL. Samples of both skylight lenses were also sent to a laser scan
company, and high-resolution 3D models (Figure 22) were created of each lens, which included
many of the minor imperfections in the lens due to the manufacturing process (such as the
dimple marks left likely from the injection molding process).
While these various labs and simulation approaches all measured BSDF information, each
utilized a different data format and definition standards, thus making comparison and cross use
of the data difficult. Due to this, each BSDF generation method was matched with the
simulation engine to which it was best suited: Radiance, TracePro or Photopia.
Figure 22: Laser Scan 3D Prismatic Lens Material Models
Sunoptics prismatic lens
Sun Tunnel prismatic lens
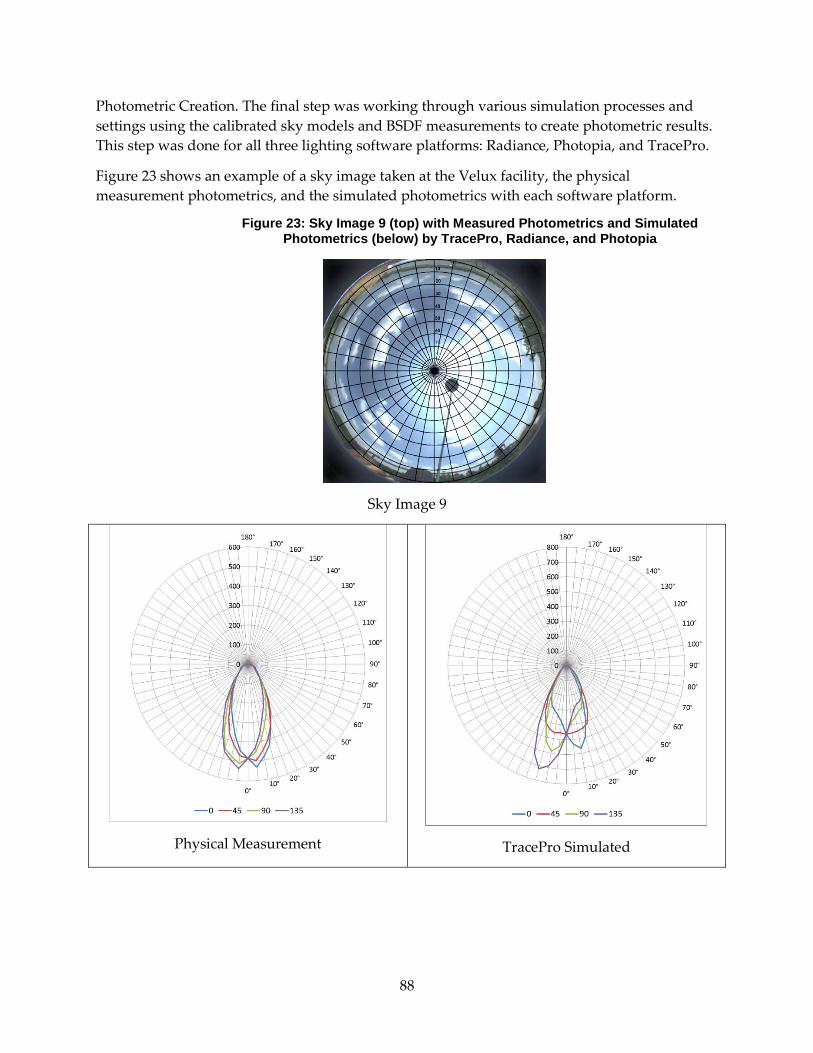
88
Photometric Creation. The final step was working through various simulation processes and
settings using the calibrated sky models and BSDF measurements to create photometric results.
This step was done for all three lighting software platforms: Radiance, Photopia, and TracePro.
Figure 23 shows an example of a sky image taken at the Velux facility, the physical
measurement photometrics, and the simulated photometrics with each software platform.
Figure 23: Sky Image 9 (top) with Measured Photometrics and Simulated Photometrics (below) by TracePro, Radiance, and Photopia
Sky Image 9
Physical Measurement
TracePro Simulated
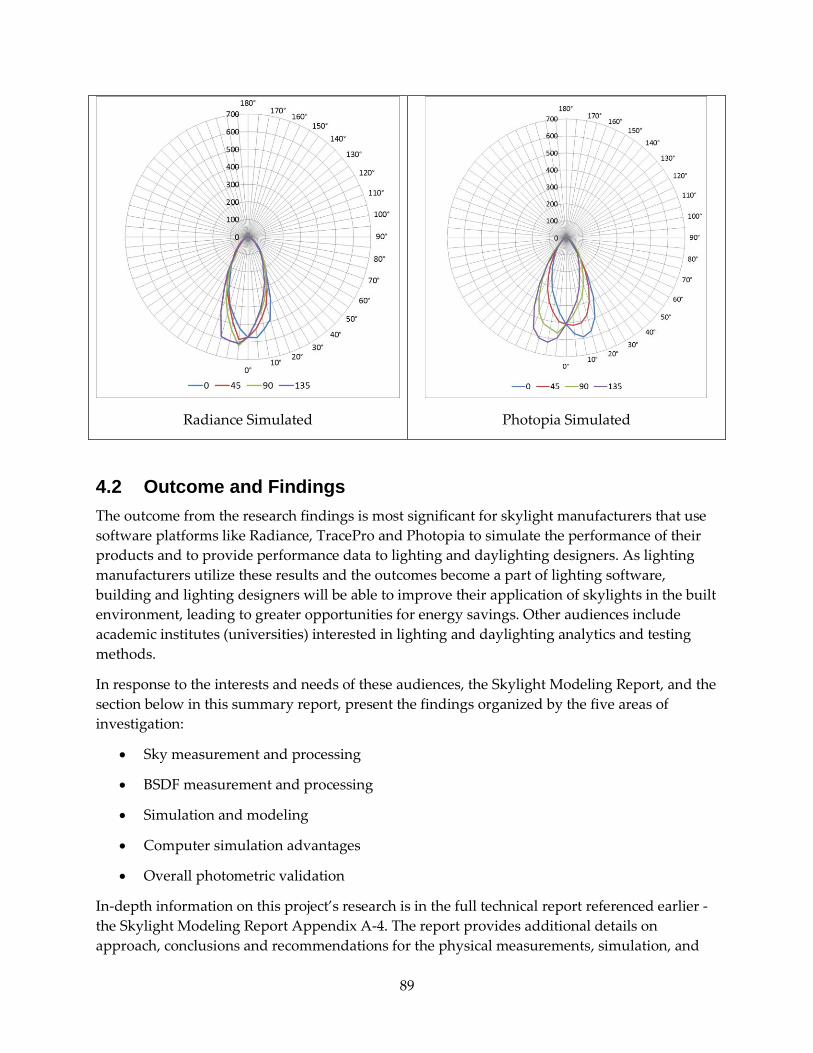
89
Radiance Simulated
Photopia Simulated
4.2 Outcome and Findings
The outcome from the research findings is most significant for skylight manufacturers that use
software platforms like Radiance, TracePro and Photopia to simulate the performance of their
products and to provide performance data to lighting and daylighting designers. As lighting
manufacturers utilize these results and the outcomes become a part of lighting software,
building and lighting designers will be able to improve their application of skylights in the built
environment, leading to greater opportunities for energy savings. Other audiences include
academic institutes (universities) interested in lighting and daylighting analytics and testing
methods.
In response to the interests and needs of these audiences, the Skylight Modeling Report, and the
section below in this summary report, present the findings organized by the five areas of
investigation:
Sky measurement and processing
BSDF measurement and processing
Simulation and modeling
Computer simulation advantages
Overall photometric validation
In-depth information on this project’s research is in the full technical report referenced earlier -
the Skylight Modeling Report Appendix A-4. The report provides additional details on
approach, conclusions and recommendations for the physical measurements, simulation, and

90
validation tasks for the selected skylight systems noted above. Project research activities and the
Skylight Modeling Report received valuable input from a project advisory team (PAC) that
included representatives from LTI Optics, Velux, Lambda, LBNL and Daylight Technologies.
4.2.1 Sky Measurement and Processing
The research determined a new method for capturing hemispherical sky images that results in
valid and useable sky luminance descriptions. Some key findings regarding this new
methodology were that:
The method requires a digital camera with a hemispherical lens and exposure
bracketing ability, a shading disc to obscure the solar disc, and simultaneous global
and illuminance measurements to calibrate the resulting HDR image.
It is important that the shading disc for both the camera and the illuminance meter (for
the diffuse measurement) block the same solid angle of the sky.
The illuminance measurements proved to be more useful for calibration of the skylight
measured performance with the modeled performance than the zenith illuminance
measurements that were more variable.
The new measurement method for cropping, masking, filling in and calibrating the HDR sky
images enabled the creation of a new equi-angular hemispherical luminance map valid for use
in lighting software. The method for using the calibrated sky luminance map to generate a set of
sky and sun rays useable in forward ray-tracing software resulted in a valid sky and sun ray
source adjustable by desired density and resolution.
In all measurements it was important to pay careful attention to the orientation of any
anisotropic and/or asymmetric optics as they greatly impact the exact optical performance of the
system.
4.2.2 BSDF Measurement and Processing
A variety of different visible reflectance and transmittance measurements were taken to access
the properties of the skylight systems and materials. Simulations were performed for the main
optical materials in the three systems at different locations and angles. The most important
locations were the top and bottom prismatic lenses and the side walls of the skylight systems
which are highly reflective.
4.2.3 Simulation and Modeling
Various simulation processes and settings were used in creating photometric results using the
calibrated sky models and BSDF measurements. Some of the simulation and modeling findings
were:
For the tested skylight products, far-field simulation did not vary much from near-field
simulation using TracePro. In forward ray-tracers, far-field simulations and near-field
emulators used by Photopia appear to be acceptable alternatives for collecting
photometric information.

91
An adequate amount of rays is necessary for obtaining smooth and accurate exiting
photometrics, particularly using forward ray-tracers.
For highly specular and reflective systems that exhibit potential for multiple bounces
within the system, it is important to simulate adequate bounces.
Along with a high maximum reflection setting, a low flux threshold setting is
recommended to help capture the flux at sharp incoming and exiting angles.
Using Radiance, adequately high simulation parameters during the generation of both
the lens BSDF definitions and system BSDF definitions is critical for accurate tail-end
simulations.
4.2.4 Computer Simulation Advantages
Overall, a computer simulation approach avoids the disadvantages of using physical
photometric measurements of skylight systems to verify their properties. There are:
No Size constraints – The simulation methods developed using the three different
systems have no size constraints. The daylighting systems could be 1’ to 100’ wide and
the software would deal with the simulation equally. Unless optical elements are added
to the system, these larger sizes will not significantly impact the simulation time.
No Sky condition constraints – The simulation methods can use any sky/sun source
desired and at any time. Captured sky images can be fed in the simulations or standard
algorithmic definitions such as the CIE or Perez standards. Any sky condition can be
simulated at any time or any location.
No Photometric resolution constraints – The simulation methods can produce high
resolution photometrics, but not unlimited resolution. The ultimate resolution is
dependent on the resolution used in defining all BSDF materials in the systems and on
the simulation parameters used.
Fewer Time constraints – The simulations can be carried out at any time and on any
number of computers, drastically improving the accessibility to detailed skylight
performance data.
4.2.5 Photometric Valuation
Overall, the simulated photometric distributions matched the general shape of those measured
quite well, with the following specific findings:
The accuracy and detail of any BSDF measurements used to describe optical materials in
the system is critical. Isotropic and low resolution representations appear to miss critical
optical characteristics of both a single material and an optical system.
The accuracy of the exact system geometry did not appear to be as critical. This was
observed to have a minimal impact on the results where fillets were added to the lens in
the Photopia Sunoptics simulations. Also, the tested skylights likely have many
imperfections relative to scratches and marks on the lenses as well as dents and marks

92
on the reflective tubes. However, there were no noticeable quirks in the photometric
data to indicate any major imperfections in the manufactured geometry.
All simulation engines (lighting software tools had a limited ability to capture high-
angle light leaving the systems.
All the simulation approaches appeared to adequately describe the general shape of
daylight distribution for simple to complex optical skylight systems under a range of sky
conditions.
Time constraints – the simulations can be carried out at any time and on any number of
computers drastically improving the accessibility to detailed skylight performance data.
4.3 Market Connections
The market connection work for this project focused on industry players involved in
daylighting manufacturing and the design and integration of electric lighting and skylighting
systems into the built environment. The following section describes the connections made and
those that hold promise for these results to have impact on reducing energy use in California
buildings.
The research team shared the results through a variety of promotion and outreach methods as
well as through engagement with leading industry and manufactures as described below.
4.3.1 Research Promotion and Outreach
Presentations at various lighting and manufacturer venues will be held in late 2013 and
early 2014 by DI and the CLTC.
Webinars were held by AEC and DI with assistance from the CLTC on the results to
both the project advisors and the daylighting design community in March 2013. The
advisors also joined project webinars in 2011 to review preliminary findings.
Industry involvement and articles citing the results are planned for the Illuminating
Engineering Society of North America. In particular, Daylighting Innovations and LTI
Optics are planning a companion document to the IESNA LM-81-10: “Approved
Method: Photometric Testing of Skylights” using Computer Simulation Techniques. It is
also planned to encourage IESNA to create a subcommittee with the mission of linking
computer simulation of skylights to physical measurements. IESNA is the recognized
technical authority on illumination in the U.S. and a critical pathway to the research
progress on moving the modeling method into simulation tools.
4.3.2 Market Standards and Simulation Tools
Skylighting manufacturers and design teams. Results from this research are publicly
available enabling manufacturers to provide better information about predicted
performance to building design teams. In particular, one major skylighting
manufacturer – remaining anonymous due to the potential advantage use of these
findings may provide - has stated strong interest in funding work to produce this type of

93
data for their spring 2013 product line. This is a major step toward other manufacturers
understanding the significance of the research results and getting involved.
National Fenestration Rating Council (NFRC) is responsible for setting the standards
for the measurement and metrics associated with fenestration67 products. Zack Rodgers,
research team member from DI, will provide the results of this work to the NFRC in
mid-2013 as a reference for the inclusion of daylighting product metrics and the idea of
system-level BSDFs.
Simulation Software for Daylighting Products. Three software platforms - Photopia,
Radiance, TracePro - provide the ability to simulate skylight performance that generally
match physical measurements. Publication of the research results and continued
refinement of the validation methodology and BSDF measurements will increase the
rigor of these tools as well as encourage the development of other new tools.
Other Daylighting Software. The resulting system BSDF files and design day
photometrics can be integrated into many other lighting/daylighting design and analysis
software such as AGI32, Visual, SPOT, OpenStudio, DIVA for Rhino, Energy Plus. At
least these three ray-trace software can be used to create the data but a number of other
software can make use of the data.
Utilities. The results of this research can inform utility program managers for energy
efficiency programs focused on electric lighting and daylighting integration as well as
the ZNE initiatives. Outreach in this area beyond exposure of the program-level
advisory group to the research objectives and findings did not occur during this research
project.
Code Governing and Rating Agencies. Green building rating systems, energy efficiency
codes and standards, and ZNE initiatives provide strong market drivers for adoption of
tools that improve the integration of quality daylight into the built environment. These
should in turn help the manufacturers find a highly interested audience in the design
teams responding to these policy factors.
4.4 Benefits to California
The results and methodologies developed from this project provide more accurate information
about the performance of skylighting products and specialty daylighting devices to lighting and
daylighting designers, energy consultants and building engineers. This will provide the kind of
information necessary for design teams to more consistently and successfully integrate
daylighting and electric lighting in their projects. California sales of skylights and lighting
controls could increase and expand a small niche of work into a larger employment opportunity
based on the large amount of commercial floor space eligible for skylight daylighting.
67 Fenestration refers to the design and characteristics of windows and other exterior openings of a
building.

94
Table 17 presents the estimates for annual energy and peak demand savings potential of a
greater use of skylights in new commercial buildings in California.
Table 17: Potential Annual Energy Savings and Peak Demand Reduction of Greater use of Skylights in New Commercial Building Construction in California
The energy and peak demand savings represented in Table 17 are estimated based on 20%
savings from integrating skylight systems with controls that turn off electric lighting in the
Commercial
Occupancy
Types
Electricity
Consumption
Savings
CA interior lighting
electricity
consumption for
appropriate building
segments and end
uses (GWh/year)
Savings in electricity
consumption from
proposed research
product (%)
Expected
penetration into
building segment and
end use markets (%)
Large Offices 5.89 2,945 20% 1.0%
Small Offices 2.77 1,386 20% 1.0%
Restaurants 1.92 961 20% 1.0%
Retail 21.23 4,246 20% 2.5%
Food Stores 6.17 1,233 20% 2.5%
Warehouses 7.43 1,485 20% 2.5%
Schools 2.56 1,281 20% 1.0%
Colleges 1.58 790 20% 1.0%
Hospital/
Healthcare
2.24
1,119 20% 1.0%
Hotels/ Motels 1.89 945 20% 1.0%
Misc. 5.75 2,874 20% 1.0%
Residential 57.74 28,870 20% 1.0%
Total 117.16 48135
Commercial
Occupancy
Types
Peak Demand
Savings
CA lighting peak
demand for
appropriate building
segments and end
uses (MW/year)
Savings in peak
demand from
proposed research
product (%)
Expected
penetration into
building segment and
end use markets (%)
Large Offices
1.15
575
20% 1.0%
Small Offices
0.79
394
20% 1.0%
Restaurants
0.35
174
20% 1.0%
Retail 3.90 779 20% 2.5%
Food Stores
0.89
177
20% 2.5%
Warehouses
1.56
312 20% 2.5%
Schools 0.84 418 20% 1.0%
Colleges 0.35 177 20% 1.0%
Hospital/
Healthcare
0.34
172 20% 1.0%
Hotels/ Motels
0.30
149 20% 1.0%
Misc. 1.18 591 20% 1.0%
Residential 6.93 3464 20% 1.0%
Total 18.57 7383
95
occupied space of various California commercial building types. Market penetration is
conservatively estimated at between 1% to 2.5% depending on building type. These savings and
penetration estimates result in a potential of 117 gigawatt hours of energy and 18 gigawatts of
peak energy savings per year in California commercial buildings. Non-energy impacts include
increased health and well-being for building occupants and productivity gains. The research
results will be in the hands of the daylighting consultants, skylight manufacturers, utilities and
policymakers who can make these potential impacts a reality.
4.5 Conclusions and Next Steps
The research team successfully demonstrated and documented the ability to use computer
models based on field data to predict skylight performance and produce valid modeled outputs
of the performance. Radiance, TracePro, and Photopia were shown to be valid software for
simulating the performance of skylight systems given accurate input and careful simulation
settings as described in the report.
The research team’s engagement with key committees at IESNA and NFRC – the leading
organizations responsible for setting the technical standards for lighting and windows/skylights
respectively – is a major step toward aligning these standards with the research results. As these
organizations adopt the research recommendations, and the photometry files are put to use by
skylight manufacturers and through lighting software tools, the use of skylights as daylight
strategies to reduce electric lighting will accelerate by design teams.
The simulations can be carried out at any time and on any number of computers drastically
improving the accessibility to detailed skylight performance data. Design teams will able to
respond to client interest for improved indoor environments and ‘green’ buildings68 and help to
meet policy drivers in California such as Title 24 and ZNE targets.
4.5.1 Next Steps
Based on the findings from this study the following next steps are recommended.
1. Form an IESNA daylighting sub-committee to develop and publish a companion
document to the IES LM-81-10 that outlines an approved method for creating optical
daylighting system photometric distributions using computer simulation. The
daylighting sub-committee should also develop an approved annual daylight simulation
methods that takes into account an optical daylighting systems
2. Coordinate with the National Fenestration Rating Council (NFRC) to expand their
rating, certification and labeling efforts to include additional daylighting metrics. Also
work with NFRC to implement system photometric information in future daylighting
product metric and rating efforts. This is likely an expansion of the Visible
68 By 2015, an estimated 40-48% of new nonresidential construction by value will be green. McGraw Hill,
2012
96
Transmittance (VT) metric currently used for fenestration which is a simple
measurement of light transmittance at a single perpendicular angle.
3. Create an openly available benchmark database with the measured sky and photometry
sets for future validation of simulation engines or to validate further refinement of the
methods explored in this report. More daylighting benchmarks in general are needed in
the daylighting simulation industry to ensure reliable data is being produced and
reported to the design industry and this data set could be part of these efforts.
4. Engage and inform daylighting software developers of any daylighting system
photometric standard developments and annual simulation standard developments
accomplished through activity 1 above. Encourage the adoption and development of
software that includes daylighting system photometric data and validated annual
calculations. Work with daylight software developers that are already involved in
related IESNA daylighting committees.
5. Engage and inform the architectural daylighting design community as to the relevance
of having more detailed photometric available when reviewing products and simulating
performance. Likely, their main exposure to these advances will be through new labels
that reports new daylight metrics on daylighting products and new advances in their
lighting software that simply correctly simulates these devices.
97
5. Rooftop Unit Fault Detection and Diagnostics
5.1 Background
This report summarizes the findings from Project 5: Rooftop Unit Fault Detection and Diagnostics
(FDD) within the PIER program “Evidence-based Design and Operations.” The research
occurred from 2009-2013 and was led by New Buildings Institute (NBI) as project manager and
market connections lead with the Western Cooling Efficiency Center and Purdue University as
the major research leads. The full technical reports and products are found in Appendix A-5.
Rooftop packaged air conditioners (RTUs) are the predominant HVAC (heating, ventilation and
air-conditioning) system found on commercial building rooftops in California and throughout
the United States – cooling over 60% of the commercial floor space69. These systems do not often
enough receive regular and/or thorough preventative maintenance, primarily because of lack of
perceived value by owners and the HVAC service industry. Service calls are generally limited
to filter changes and visual inspection or occur as an emergency response to major system
component failures that impact occupant comfort. Even in the case of equipment maintained
under formal maintenance contracts, technicians typically only detect severe and obvious fault
conditions because their procedures only involve routine qualitative assessments. This means
non-catastrophic faults that cause significant energy waste go unnoticed for years.
Fault detection and diagnostics for RTUs is a developing class of products designed to monitor
RTU performance so that faults can be identified and corrected. FDD technology senses key
system operating parameters, detects performance degradation, and triggers an alarm that is
communicated to some form of fault management tool, the zone thermostat, or appropriate
facility personnel. FDDs help maximize the value of investments in energy efficiency systems,
extend the life of RTUs and reduce emissions. California’s Energy Efficiency Strategic Plan
urges the broader application of this technology.
In addition to energy savings benefits, FDD can identify faults in RTUs that can be repaired,
leading to increased occupant comfort due to the appropriate ventilation that is linked to
improved worker productivity. Additionally, addressing RTU performance degradation faults
when they first occur is much less expensive than addressing them when they become
catastrophic (which requires expensive component or whole unit replacement).
While tools that can detect and diagnose faults in RTUs are becoming more widely available for
air conditioning systems in residential and light commercial products, it is not known how
effective these tools are. There is no uniform method or national standard for evaluating how
well they work.
This project addressed the need for 1) diagnostic protocol standards to assure the accuracy of
commercially available rooftop fault detection and diagnostic tools used in California utility
69 W. Wang, et. al. PNNL December 2011 Energy Savings and Economics of Advanced Control Strategies
for Packaged Air-Conditioning Units with Gas Heat, pg. vi
98
HVAC installation and maintenance programs, 2) current information on the commercial
availability of products and services that address the RTU FDD market and 3) a California Title
24 Nonresidential Building Energy Standards code measure supporting FDD being built into
new and replacement RTUs.
Since the start of this project additional policy initiatives for optimizing and maintaining HVAC
system performance have come into place, including California Senate Bill 758 that addresses
deeper energy savings in existing buildings. The FDD work and outcomes described in this
report and related Appendices supports these ambitious policies by creating new tools,
information and codes that can reduce the energy use of RTUs.
5.1.1 Objectives
The project goals were to reduce the energy performance degradation in rooftop HVAC units
(5-50 tons70 in size) in California and support the persistence of energy/demand savings from
utility-sponsored HVAC service programs and high efficiency unit programs. The specific
research objectives were threefold:
Development and deployment of a critically needed software tool for evaluating current
diagnostic protocols. (FDD Protocol Evaluator)
Development and market-wide dissemination of information on the availability,
usability and cost-benefit (energy and non-energy) of commercially available FDD
products that improve RTU field performance and provide ongoing performance
monitoring to building operators. (FDD Technology and Market Review)
Development of a minimum standard for FDD functionality for submission as a
Prescriptive Measure to the 2013 Title 24 part six Nonresidential Building Energy
Efficiency Standards. (FDD Title 24 Proposal)
This summary report is organized with a section addressing each of these key objectives and
describes the approach, outcomes and findings, and market connections. Additional FDD
market efforts are highlighted following these three sections, along with the benefits to
California if FDD were adopted and the conclusions and next steps for FDD.
5.2 FDD Protocol Evaluator
A protocol evaluator for FDD was built to establish an industry-supported method to test
(evaluate) the algorithms that are used in FDD tools (the tool protocols). This test helps ensure
the results from FDD tools to the user are reasonable. The new evaluator test does not include
the tool’s sensor hardware or the hardware interface.
The development of the diagnostic protocol evaluator component was led by Dr. James Braun
with doctoral candidates David Yuill and Howard Cheung, all of Purdue University,
conducting the analysis, development and testing of the evaluator and software application. In
a fortuitous development, researchers from the National Institute of Standards and Technology
70 A ton is a unit of heating or cooling for HVAC equipment representing 12,000 BTUs
99
(NIST) joined the Purdue team. This collaboration resulted in the addition of three new
evaluation test areas in addition to those defined in the original project goals. The tool produced
through this research is called the FDD Evaluator 0.1.1 (Evaluator).
5.2.1 FDD Protocol Evaluator: Approach
The research team input data from a large number of test cases (607) from HVAC equipment set
up in the Purdue HVAC laboratory with various faults induced into beta versions of an FDD
protocol as a means to test and evaluate the protocol responses. Each test case represented a set
of conditions that might be encountered by an FDD tool. For each test case there were five
possible outcomes:
No Response – the FDD can’t be applied, or can’t give a diagnosis.
Correct – the FDD response matched the actual condition.
False Alarm – a fault is indicated when no fault is present.
Misdiagnosis – the wrong fault is diagnosed.
Missed Detection – the FDD indicates no fault when a fault is present.
The raw results for evaluation were organized according to the magnitude of the impact that
the faults would cause on system performance. Results were presented across a wide range of
performance degradation limits. This allowed the research team to choose a fault impact
threshold of interest. For example, if the user wished to tolerate (allow) faults that cause less
than 5% degradation in efficiency, they could then gauge the outcome rates for faults above this
level of degradation.
From an analytic perspective, there were several disadvantages to using experimental data for
FDD evaluation. Most significant is that existing data was quite limited, and generating new
experimental results would have been difficult and costly. To address this, a method was
developed to model unitary systems operating with or without the faults included in this
project. This method is a hybrid of inverse models (those based on experimental data) and
forward models (based on physics alone). The method produces models referred to as ‘gray-
box’ models which use some measurement data, but also use physical laws to extend the model
to conditions that were not tested experimentally. These gray-box models treat each component
(compressor, heat exchangers, expansion device and piping) of an RTU separately.
5.2.2 FDD Protocol: Outcomes and Findings
The Purdue University team developed a software application which runs on a Windows-based
operating system that can determine the types of faults related to the initial target of an FDD
tool. This research product is the FDD Evaluator 0.1.1 (the Evaluator); the tool and all related
materials are publicly available on the Purdue FDD website71. The technical report, A Method for
71 https://engineering.purdue.edu/FDD_Evaluator

100
Evaluating Diagnostic Protocols for Packaged Air Conditioning Equipment (Evaluator Report), user
guide and comments from reviewers can be found in Appendix A-5 to this report.
The research met its original scope to develop a software tool for evaluating diagnostic
protocols for FDD that determine a) high or low refrigerant charge, b) high or low evaporator
airflow, and c) condenser coil fouling. Added to these initial FDD conditions (thanks to the
research collaboration with NIST) were three new fault evaluation parameters: liquid line
restriction, non-condensable in the refrigerant circuit, and compressor valve leakage, resulting
in nine fault detection areas for the Evaluator tool. Although few commercial FDD tools
currently provide fault detection for these last three conditions, tool providers may be
motivated to add these to gain market position now that a third-party tool can represent their
accuracy.
Some of the main conclusions of the Evaluator Report include:
The evaluation method developed here should be applied to FDD protocols of interest to
determine whether their performance is acceptable to potential users.
Model data should be used instead of measurement data in future evaluations to:
o Control the distribution of faults.
o Remove the uncertainty from experimental error.
o Widen the field of potential systems, faults, fault intensities, fault combinations,
and driving conditions.
o Provide datasets that can’t be learned, hence gamed, by unscrupulous
developers.
More understanding of the likely distribution of faults in the field is required.
The Title 24 RCA protocol performs quite poorly, and consideration should be given to
removing it from the Title 24 standard.
FDD Evaluator Example. A full example of the Evaluator software applied to a project is
located in Appendix A-5. A brief view here is that the Evaluator software outputs four plots: 1)
Numerical values tables; 2) False Alarm rates figure; 3) Misdiagnosis rates figure; 4) Missed
Detection rates figure. Figure 24 shows the numerical values tables that contain all the output
data for the three subsequent plots. The data in the output tables may be copied and pasted to
other programs for further analysis.
Figure 25 is an example of the missed detection rates figure with the data listed by percent
groups (bins) of the fault impact ratio. The faults shown are based on input date for
undercharge and overcharge of the air conditioners refrigeration. The impact is represented on
two parts of the air conditioner: the capacity (the amount of cooling being delivered) and COP
(the coefficient of performance that is the metric for the efficiency of the unit). The missed
detection rates for the 95-105% bin are roughly 10% (the horizontal or Y axis). There are no
Missed Detections for cases in which COP is reduced by more than 15%, and none for cases in
which capacity is reduced by more than 25%.
In general, not detecting a fault that has a small impact could be construed as a positive
outcome. However, overcharge of refrigeration for example can present a danger to the
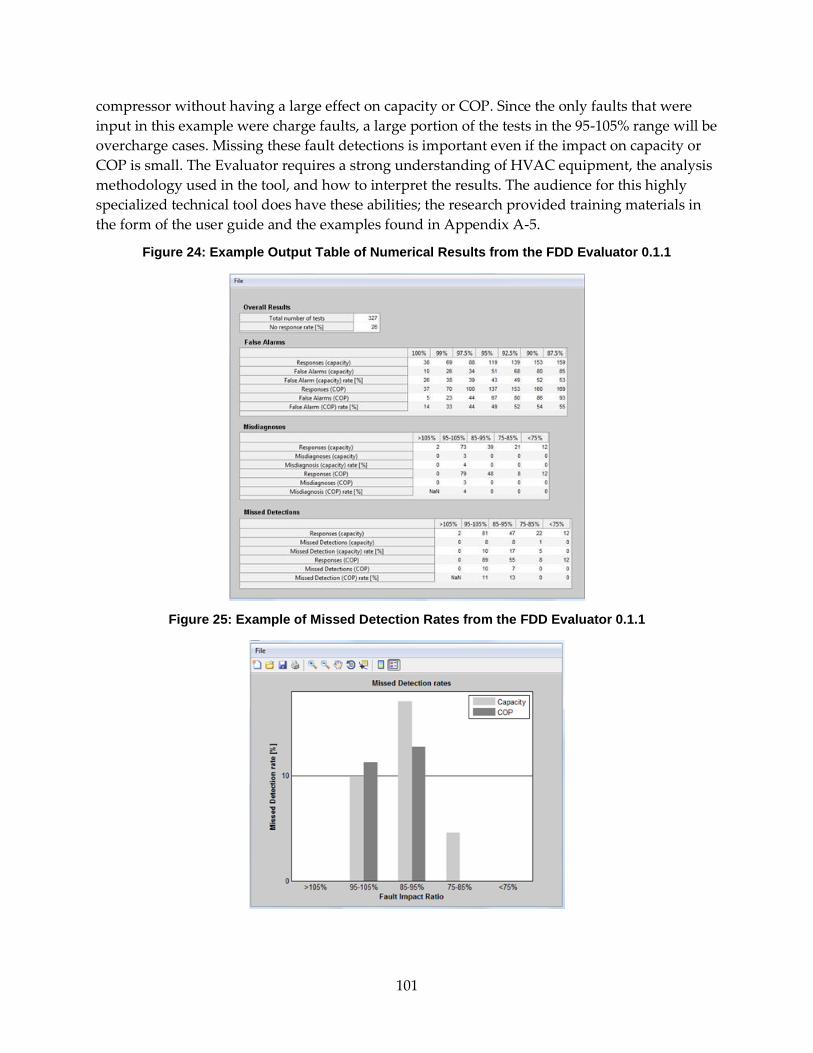
101
compressor without having a large effect on capacity or COP. Since the only faults that were
input in this example were charge faults, a large portion of the tests in the 95-105% range will be
overcharge cases. Missing these fault detections is important even if the impact on capacity or
COP is small. The Evaluator requires a strong understanding of HVAC equipment, the analysis
methodology used in the tool, and how to interpret the results. The audience for this highly
specialized technical tool does have these abilities; the research provided training materials in
the form of the user guide and the examples found in Appendix A-5.
Figure 24: Example Output Table of Numerical Results from the FDD Evaluator 0.1.1
Figure 25: Example of Missed Detection Rates from the FDD Evaluator 0.1.1

102
Review of the Title 24 Refrigerant Charge and Airflow (RCA) Test. The current California
Title 24 (2008) HVAC Refrigerant Charge and Airflow (RCA) diagnostic protocol was used as
an experimental test subject during development of the new FDD evaluation methods. The RCA
protocol will continue to be the protocol for refrigerant and airflow, in a slightly modified form,
in the upcoming Title 24 - 2013 (effective January 2014). This research uncovered some
performance flaws in the current RCA.
The RCA is intended only to detect high or low refrigerant charge and low evaporator airflow
faults. The airflow diagnostic is intended to ensure that the evaporator has sufficient airflow for
the refrigerant charge diagnostics to be applied. This option is available if direct measurement
of the airflow is not taken. The RCA protocol is based primarily on manufacturer’s installation
guidelines and specifications.
Title 24 specifies that the RCA protocol be applied to new residential systems. However, it has
been used to a degree as the basis for utility-incentivized installation programs on residential
and commercial unitary systems (a single system that provides heating and/or cooling). In
addition, the current Title 24 RCA protocol is used by the Home Energy Rating System (HERS)
raters, who provide field verification and diagnostic testing to demonstrate compliance with the
Title 24 standard.
The RCA has varied with each update of Title 24. The 2013 RCA version included ‘looser’
tolerances than past RCA code versions when comparing measured and target values of
superheat, sub-cooling and temperature split. The temperature-split evaporator airflow
diagnostics approach was removed since there are other, easier field methods available to
confirm sufficient airflow prior to diagnosing charge faults by HVAC technicians. These
generally involve showing by direct measurement that the evaporator airflow is above 300 CFM
or in some cases 350 CFM per nominal ton of cooling capacity.
The ‘installer’ label below refers to the Title 24 protocol. The research team conducted tests of
the Title 24 2008 and 2013 and HERS RCA protocols and identified a frequency of missed
diagnosis and missed detections that ranged from 25%-55% (Table 18). As noted in the
Evaluator Report, the research team concluded that the Title 24 (08 and 13) RCA protocol
“performs quite poorly, and consideration should be given to removing it from the standard.”
This recommendation has implications for Title 24 that will need to be considered by California
regulatory interests in a future Title 24 revision process.
Table 18: Summary of Misdiagnosis and Missed Detection Rates for the RCA Protocol
2008 2013
Installer HERS Installer HERS
Misdiagnosis Rate 26% 25% 32% 29%
Missed Detection Rate 32% 39% 37% 55%

103
The Evaluator is intended as a benefit to the FDD tool market nationally, providing a quality
assurance tool to evaluate the operational and accuracy claims of FDD tool developers and
providers. As FDD tool developers see the benefit of testing it is expected they will run their
own internal tests to determine how to improve the accuracy of their products. Moving
forward, it is hoped that the Evaluator can provide a path to improved FDD performance by
illuminating poorly performing FDD approaches, spur further developments and improvement,
and provide a tool for FDD developers to use as they explore improvements in their own
protocols.
5.2.3 FDD Protocol Evaluation: Market Connections
The Evaluator was produced, and the tool and documentation are now publicly available on the
Purdue website72. The Evaluator was reviewed by California regulatory and utility participants
as well as public stakeholders to determine what next step options were of interest for the
Evaluator, its use in California and its implications for the 2013 Title 24 RCA protocol that will
be in force January 2014. A summary of the activities and meetings follow:
FDD tool developers from California and around the nation were invited to submit their
products to the Purdue researchers for proprietary testing as the Evaluator was
developed.
A research paper titled “Evaluating Fault Detection and Diagnostics Protocols Applied
to Air-cooled Vapor Compression Air-conditioners” was presented at an international
HVAC conference at Purdue University in July 2012.
Public access to the Evaluator software on the Purdue University Herrick Laboratories
website and future revisions will be integrated into the Evaluator. Purdue staff may also
pursue ANSI Standard status for the Evaluator.
Researchers held webinars and workshops for invited participants to discuss the
research approach in more detail.
5.2.3.1 Final Stakeholder Meetings Overview
A final meeting with California utilities and regulatory staff was held in February 2013 to
demonstrate the Evaluator, its potential for use as a screening tool for utility quality installation
and maintenance programs, and to discuss issues related to the Title 24 HVAC refrigerant
charge and airflow (RCA) diagnostic protocol. The attendees were very interested in the
potential of the Evaluator for use in utility programs and by the Energy Commission staff as a
benchmark for potential revision to Title 24 in the future.
In addition to the overview of the meeting topics and discussion presented here, two
stakeholders provided detailed comments along with recommendations for next steps to further
validate and enhance the Evaluator. These comments and related recommendations for next
steps were sent to the CEC, CPUC, and utility staff in the codes and standards as well as
72 Ibid

104
program evaluation offices. The stakeholder-submitted comments are a part of the Evaluator
Report in Appendix A-5.
California utilities have the option of applying the Evaluator to residential and commercial FDD
products being considered for use in HVAC-related energy efficiency programs. Both the
California Energy Commission (CEC) and California Public Utilities Commission (CPUC) will
assess their respective interests in the Evaluator and provide guidance or requirements for the
utilities to apply the Evaluator in support of program implementation and evaluation
objectives. Regulatory staff can use the Evaluator to determine the range of accuracy of FDD
tools on the market to determine the usefulness of tools already on the market.
The concept was that HVAC contractors seeking to participate in ratepayer-supported (utility)
HVAC programs would submit diagnostic tools for a pre-qualifying assessment using the
protocol Evaluator. The utilities would establish acceptable accuracy threshold within a plus-
minus range that the contractors’ tools would have to meet. Contractors seeking to participate
in the program would have to pre-qualify their tools and/or protocols, which would in turn
qualify them for program participation. Tools that did not meet the established thresholds
would have to be revised to be eligible for re-test and reconsideration.
The meeting discussions involved a significant concern about the Title 24 2008/2013 RCA
protocols referenced earlier related to the apparent limits of their accuracy as reported in the
Evaluator Report. There were several areas of consensus among participants for what needs to
be considered by various authorities including regulators, utilities, HVAC contractors and
manufacturers, as listed below.
1) Consider development of a performance goal in Title 24 for fault detection protocols for
new HVAC equipment installations to replace the current prescriptive RCA protocol
approach. The metrics for a performance approach should be identified and assessed
with goal development for submission in time for the 2016 Title 24 revision process that
begins in 2013. A key impetus for making this change is the unacceptable rates of missed
faults, misdiagnosis, false alarms and no response found by the Purdue research team
testing the RCA protocol.
An underlying issue is related to the HVAC industry’s superheat table values. While not
all manufacturers subscribe to the table values, many do and the tables are commonly
used in the HVAC contracting industry. A senior HVAC industry engineer noted in a
2006 CEC-sponsored meeting that the superheat values needed a formal industry review
in part because newer equipment had different operating temperatures and pressures
that needed to be accounted for in the tables. PIER-sponsored research on charge
checking at lower temperatures found anomalies in the superheat tables at certain
conditions.73 In addition, the current tables refer primarily to conditions in equipment
charged with R22 refrigerant, which has been replaced in newer units with R410a.
73 Temple, Keith A., Expanded Test Protocols for Low Ambient Testing of Unitary AC Systems, BERG
Project Final Report, Grant 54921 A/06-09B, September 2008 (revision date February 2009)

105
Manufacturers have previously opposed methods that conflicted with their
specifications. In this case, it may be time to move beyond the industry tables to provide
a more useful approach to RCA in California.
2) Engage HVAC manufacturers about the RCA issue noted above around the tables and
their underlying usefulness in both Title 24 as applied to new equipment and proper
application to existing units being addressed in HVAC maintenance programs. The
focus on the RCA and new equipment is primarily corrective. The California investor-
owned utilities have moved beyond the RCA as a program initiative for existing
equipment and now include a comprehensive set of maintenance measures that include
controls, the economizer (for rooftop units) and airflow, with refrigerant charge last on
the list. Stakeholders suggested that the CEC and CPUC, along with the utilities, take the
first step in contacting industry representatives perhaps starting with the leading
industry association, the Air-Conditioning, Heating, and Refrigeration Institute (AHRI).
3) Create a field characterization on the incidence and prevalence of non-condensables,
liquid line restrictions and compressor valve leakage with related simulation analysis to
provide a more robust set of results for inclusion in the Evaluator tool. Some laboratory
work on the energy impact of non-condensables and liquid line restrictions is already
underway through the CPUC.
Due to the potential for refrigerant (a potent greenhouse gas) leakage either from non-
condensables repair that requires evacuating, flushing and refilling the refrigerant lines,
and refrigerant escape through compressor valve leakage, a greenhouse impact
assessment of the magnitude of these leakage pathways should be done. Purdue
University researchers have begun working to model multiple levels of multiple
simultaneous faults. Additional data is needed on multiple fault prevalence, incidence
and energy impacts in order to build a simulation model to move beyond the more
costly experimental approach.
4) Test other vendors HVAC diagnostic tools, many companies want their diagnostic
protocols tested and need assurance that confidentiality will be protected. Purdue has
already implemented a secure test system with one vendor and is offering the same
secure approach to others. Data inputs are sent to the tool vendor, with vendor product
output results provided to Purdue. In this way the researchers have no direct access to
confidential information in the vendors’ protocols.
5) Expand the Evaluator fault data library; for example there is currently only one data set
on faults for non-condensables. Purdue researchers are working to build a simulation
approach that will reduce or eliminate the need for experimental measurements that are
time consuming and expensive, but provide acceptable levels of certainty and accuracy
in the Evaluator. Note: A dataset of test results from 200 HVAC units has been made
available by PG&E (Pacific Gas and Electric Company) staff for use in a demonstration
of the Evaluator that will be made available to stakeholders and the public on the
Purdue University FDD website.
106
Additional Research. Additional financial support from the CEC and/or utilities along with
some continued support from NIST could be used for the following work specific to the
evaluation of FDD protocols:
Evaluation of other fault detection protocols, as a way of testing and refining the
evaluation approach.
Fault evaluations using simulation data.
Assessment of simulation data as a replacement for experimental data.
Assimilation of the simulation data into the application software.
Development of simplified figures of merit for FDD protocols.
Enhanced user interface for the application software.
5.3 FDD Technology and Market Review
Dr. Kristin Heinemeier, Western Cooling Efficiency Center (WCEC) was lead researcher for the
market and technology assessment working with graduate student assistance. The work was to
develop a summary of information on the availability, usability and cost-benefit (energy and
non-energy) of commercially available FDD products. The full research report titled “Rooftop
HVAC Fault Detection and Diagnostics: Technology and Market Review” (FDD Review Report)
is located in Appendix A-5.
5.3.1 FDD Technology and Market Review: Approach
The research team undertook a comprehensive review of available FDD products, services and
facility management behaviors related to HVAC operations and maintenance to identify and
prioritize the faults that can be detected by a set of currently (or shortly) available diagnostic
tools, and to evaluate the available tools. This work was the foundation for defining the
minimum FDD requirements that were proposed, vetted with stakeholders, modified and
ultimately adopted into the 2013 Title 24 California Standards (see Section 5.4).
The approach included input from colleagues and contacts to support the initial identification
of new FDD products or approaches either already in the market or on a path to
commercialization. Interviews with tool developers and HVAC contractors provided important
information on how much contractors and customers currently know about FDD and what does
or does not interest them in this type of functionality.
The project researchers reviewed all the information on RTU FDD products available in the
market through 2011. The field is undergoing rapid change with the introduction of new
products and further refinement of existing products and approaches, so the results do not
represent the complete current state.
A framework of functionality was developed to help define the types of FDD tools currently
available or in development. A set of criteria was developed for the attributes likely to be
successful in the marketplace or to be successfully implemented in California’s Title 24 energy
standard. Project team members sought out examples of FDD tools that are available in the
market and categorized these. The research then determined what faults each can identify and
the kinds of data required for each tool. The results are illustrated in Figure 26.
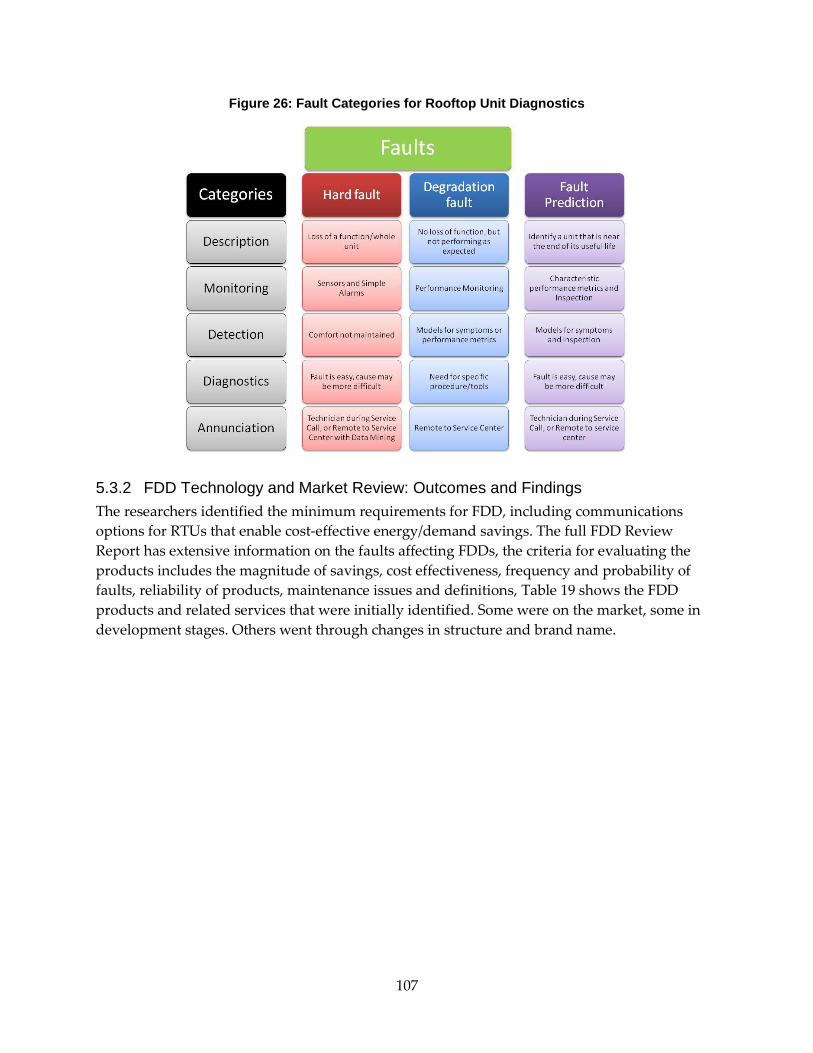
107
Figure 26: Fault Categories for Rooftop Unit Diagnostics
5.3.2 FDD Technology and Market Review: Outcomes and Findings
The researchers identified the minimum requirements for FDD, including communications
options for RTUs that enable cost-effective energy/demand savings. The full FDD Review
Report has extensive information on the faults affecting FDDs, the criteria for evaluating the
products includes the magnitude of savings, cost effectiveness, frequency and probability of
faults, reliability of products, maintenance issues and definitions, Table 19 shows the FDD
products and related services that were initially identified. Some were on the market, some in
development stages. Others went through changes in structure and brand name.

108
Table 19: FDD Products by Developer
Update to the above table: Sensus, MI changed its name to ‘Ezenics.’ Field Diagnostic Services, Inc.
FDD-related products and services have been integrated into a new suite of products. Virtjoule
is available on the market. Pacific Northwest National Laboratory’s (PNNL) low-cost SMDS is
moving toward commercialization.
A list of the faults that each of the above listed tools can detect is shown in Figure 27.
Tool Name Data Model Status Developer
FDSI Insight V.1 Refrigerant Quantitative Available Field Diagnostics, Inc.
Sentinel/Insight Refrigerant Quantitative Beta Field Diagnostics, Inc.
ClimaCheck Refrigerant Quantitative Available ClimaCheck Inc.
SMDS Air Qualitative Pilot Pacific Northwest National Laboratory
Sensus MI Air Qualitative Available University of Nebraska
NILM Power Qualitative Pilot Massachusetts Institute of Technology
Low Cost NILM Power Timeseries Pilot Massachusetts Institute of Technology
Virtjoule Power Timeseries Developing Virtjoule Inc.
Low Cost SMDS Air-Power Timeseries Developing Pacific Northwest National Laboratory

109
Figure 27: Description of Faults Detected by FDD Tools
Table Note: ‘Extended FDD’ indicates the tool has additional fault detection functions that can be specially
enabled if the customer chooses.
More recently, a new product class of RTU retrofits performance monitoring-enabled
controllers and commissioning tools have entered the RTU market: the Honeywell JADE
Economizer product has been on the market in 2012. In February 2013 Belimo announced
availability and pricing of its ZIP Economizer unit. Both offer technician-friendly
communications interfaces which allow the user to either set up a newly installed RTU
including demand control ventilation or provide a customer with continuous automated
maintenance services with limited remote monitoring options. Both tools are fully featured to
dramatically improve the quality of new/replacement RTU installation commissioning as well
as ongoing performance maintenance. In essence, each provides monitoring of critical RTU
functions and can act to a limited degree as a fault detection system.
HVAC Contractor Interview Summary. Interviews were conducted with HVAC contractors in
Sacramento and the San Francisco Bay Area. Contractors were asked about their current
maintenance business and whether or not they could imagine using automated, embedded FDD
of the type being described in this report. Key findings included:
The sale of a maintenance contract and the relationship between the
technician/contractor and the customer is essential. While this type of contract could
form the basis of a diagnostic offering in the marketplace, there is considerable
skepticism about the ability of an automated FDD tool to do what it promises, especially
O Basic FDD
X Extended FDD
O O O O O O O
O O O O O O
O X O O O X
O X X O O O
O X O O O O O O
Excessive Operating Hours O X O O O O
O O O O O O O O
O X O O X O
Incorrect Control Sequence O X O O O O O
O X O O X
Unnecessary Outdoor Air O X X O O X
O X O O O O
O O O O O O O O
O O O O O X
O O O O O O
O O O X
O X O O O O O O
FDSI
Insi
ght
V.1
Pro
du
ctio
n
Unit Not Operational
Lack of Ventilation
Economizer not Functioning
Sensor Malfunction
Control Problems
Failed Compressor
Stuck Damper
Slipping Belt
Leaking Valves
Compressor Short Cycling
Performance Degradation
Low/High Charge
Low Airflow
Insufficient Capacity
Low
Co
st N
ILM
Vir
tjo
ule
Low
Co
st S
MD
S
Sen
tin
el/
Insi
ght
Be
ta T
est
ing
Cli
ma
Ch
eck
SMD
S
Sen
sus
MI
NIL
M
110
to reduce the need for service calls. Few contractors are using anything like automated
or embedded FDD today. There is, however, a perceived benefit to using a given FDD
tool (portable or embedded) if it adds to the customer’s perception of a contractor’s
professionalism and use of state-of-the-art tools. A tool that makes a contractor more
efficient when providing routine servicing will be valued, especially if it can eliminate
the need for service calls in between routine seasonal maintenance.
FDD value should be looked at over the lifetime of a system and a customer relationship
since it may help prepare the customer for equipment replacement decisions. Especially
for certain customer segments, higher quality retail for example, a premium could be
charged for a service contract that was enabled by FDD.
While it is possible to put sensors on almost everything, one would have more issues
with the sensors over time than with the parts.
The economizer is the first thing the contractor will disable, due to complexity versus
benefits. If it costs $500-$1,000 to fix it, the choice will be made to disable rather than
repair it. This is due to a lack of knowledge regarding the value of energy savings and a
price for energy that does not compel action. The economizer is more likely to get fixed
if the customer knows and values the energy that can be saved. The same could be said
of the technician/contractor not knowing the value of a functional economizer.
Contractors are motivated to try to avoid service calls between regular service calls. A
maintenance technician will typically have 20 hours per week to do service. They must
get to as many customers as possible and will typically do 5-6 calls per day. Better FDD
on each system could make the technician faster and more confident.
Most HVAC businesses are not currently using energy performance monitoring tools.
New FDD tools could enable better interaction with the contractor and their customer
due to the ability to professionally represent more detail on the equipment efficiency.
One way contractors could see FDD being delivered is via an automated report
generated on a scheduled basis sent to a designated person. This should not overload
customers and technicians with data. An indication could be provided about overall
performance and another about energy consumption. Different information levels
include: ‘idiot’ light, an alarm if efficiency goes under a certain threshold and
performance efficiency metrics for each unit.
The system must deliver what it promises. One needs to factor in false-alarm rates to
determine whether or not more calls are being avoided or created. False alarms are an
unrecoverable cost for the contractor.
Survey respondents can see a premium of 10% for a very good field diagnostic device,
especially if they have a critical environment or are a more sophisticated customer.
Maintenance contract customers have a long-term view and do analysis on a whole-
building level.

111
5.3.3 FDD Technology and Market Review: Market Connections
The FDD Review Report is available at the Purdue website and at the NBI research website. The
list below describes the activities to disseminate the report:
The HVAC contractors involved in interview phase of the work received notice of the
report availability.
The report was shared with FDD tool providers at Title 24-related meetings, and at
various state and national energy conferences.
The research team has been active in the Western HVAC Performance Alliance (WHPA)
Subcommittee on FDD and has referenced the results and made the report available
through WHPA.
Results and findings from the report have been a part of presentations by FDD tool
developers and researchers including ClimaCheck, Ezenics, Field Diagnostic Services,
Inc., Dr. Haorong Li (University of Nebraska), California utility staff working on
Methods of Test for FDD, and HVAC manufacturers.
5.4 FDD for Title 24 Proposal
NBI’s Mark Cherniack was overall project lead for the work to move FDD findings into code.
NBI and WCEC staff collaborated with Matt Tyler and Amber Buhl, PECI, who had the
responsibility to conduct the FDD savings and benefit-cost analysis for Title 24 on behalf of the
California utilities Codes and Standards Enhancement (CASE) program. The financial and
energy savings analysis was supported by Martyn Dodd, EnergySoft, LLC, who provided the
Title 24 compliant energy analysis software, EnergyPro, to run the cost-effectiveness analysis.
5.4.1 FDD Title 24 Proposal: Approach
The final mandatory measure proposal was negotiated through a working group of the WHPA
FDD Subcommittee including PIER and CASE project team members, utility representatives,
engineering firm representatives, HVAC FDD developers, major HVAC manufacturers and
related researchers. The progress toward a Title 24 proposal and the ultimate approval required
the researchers, along with their CASE colleagues, to conduct the following activities:
Obtain input from industry stakeholders on desired capabilities of FDD tools and
service models for making best use of FDD tools.
Identify appropriate technologies for detecting and diagnosing faults in commercial
building RTUs by inventorying the faults that occur in RTUs and their performance
impacts and frequency.
Determine the requirements for tools in each category in the framework by analyzing
the types of tools that would be found in each category.
Gain industry input on the implementation of FDD through conference calls and site
visits to manufacturing facilities including Lennox, MicroMetl (economizer
manufacturer) and Trane.

112
Determine how much energy would be saved in California RTUs by using FDD tools,
and the cost-effectiveness of this use.
Use an industry-centric consensus approach to develop and negotiate with key
stakeholders to draft a measure for the 2013 California Title 24 Nonresidential Building
Energy Standard that will be implemented in January 2014.
Cost-Effectiveness. The PIER project and CASE program teams collaborated extensively on the
cost-effectiveness analysis with the following approach:
Estimating the impact of various different faults on the efficiency of a single RTU. This
impact was determined from literature on the impacts of various faults imposed in
laboratory conditions on the RTU’s Energy Efficiency Ratio (EER) from previous
research work.
Modeling of the impacts of a reduced EER on the annual energy use and peak demand.
This modeling was done using the US Department of Energy’s EnergyPlus building
energy simulation software for prototypical office buildings in a range of California
climates and then weighted by saturation. Additional modeling with Title 24 compliant
energy simulation software was completed with EnergyPro v5.1.
Calculating the Time-Dependent Value (TDV) of the annual energy savings per ton of
cooling, using CEC procedures (net-present value over the Equipment Useful Life (EUL)
taking the marginal value of energy at any hour of the year into account).
Assuming probabilities for various factors: probability that a fault will occur during a
given year (based on analysis of fault incidences in the PECI RTU AirCare Plus
program), probability that an FDD technique will identify the fault, probability that the
fault would have been detected absent the FDD system, and probability that the fault
will be addressed once detected.
Applying these probabilities to the TDV annual energy savings per ton.
Estimating the cost of implementing an FDD tool.
Estimating the present value of maintenance cost savings.
Calculating a Benefit-to-Cost ratio and Total Resource Cost.
As initially proposed, a Title 24 ‘Prescriptive Measure’ was developed, reviewed by key
stakeholders and submitted for adoption consideration in the 2013 Title 24 Nonresidential
Building Energy Efficiency Standards revision by the CEC. A prescriptive measure is an option
under code that is encouraged but is not required. However, the working group that helped
negotiate the measure came to a consensus decision to focus the RTU FDD measure on
detecting economizer and related airflow faults and submit the proposal as a ‘Mandatory
Measure’ (rather than Prescriptive) for Title 24 thus strengthening the potential impact.
The HVAC industry representatives in the working group were confident that the industry
would be ready by January 2014 to implement economizer FDD, a key area for achieving and

113
maintaining energy savings in RTUs. The proposal stated that every new or replacement RTU
(4.5 tons or larger) requires FDD functionality.
5.4.2 FDD Title 24 Proposal: Outcomes and Findings
The mandatory measure for FDD in RTU units in the state of California (to be effective in
January 2014) was approved by the CEC in May 2012. Field compliance acceptance test
requirements were developed along with a form for a manufacturer’s option to pre-certify
whole equipment lines to meet compliance objectives. This form helps local jurisdictions to
enforce this level of technical compliance with fewer burdens by the certification requirements
and increase compliance checking.
The full mandatory measure language approved by the CEC and an explanation of the
requirements prepared by the research team is in Appendix A-5. A synopsis is:
FDD Title 24 Summary. All newly installed air-cooled unitary direct-expansion units74,
equipped with an economizer and with mechanical cooling capacity of 4.5 tons or more shall
include a Fault Detection and Diagnostics (FDD) system in accordance with criteria specified in
the code subsections. Sensors shall be permanently installed to monitor system operations as
follows: outside air, supply air, and return air, and refrigerant charge. The faults required by
FDD systems under the new Title 24 mandatory measure are listed below, along with a brief
description and why it is important. The fault conditions in the Title 24 FDD requirement are:
A. Air temperature sensor failure/fault. This failure mode is a malfunctioning air temperature
sensor, such as the outside air, discharge air or return air temperature sensor. This could
include miscalibration, complete failure either through damage to the sensor or its
wiring, or failure due to disconnected wiring. Reporting of sensors faults is found in
many RTUs today.
B. Not economizing when it should. In this case, the economizer should be enabled, but for
some reason it is not providing free cooling. This leads to an unnecessary increase in
mechanical cooling energy. Two examples are the economizer high limit setpoint is too
low, say 55degF, or the economizer is stuck closed.
C. Economizing when it should not. This is opposite to the previous case of not economizing
when it should. In this case, conditions are such that the economizer should be at
minimum ventilation position but for some reason it is open beyond the correct position.
This leads to an unnecessary increase in heating and cooling energy. Two examples are
the economizer high limit setpoint is too high, say 80degF, or the economizer is stuck
open.
74 Air-cooled unitary direct expansion units include packaged, split-systems, heat pumps, and
variable refrigerant flow (VRF), where the VRF capacity is defined by that of the condensing
unit.
114
D. Damper not modulating. This issue represents a stuck, disconnected or otherwise
inoperable damper that does not modulate open and closed. It is a combination of the
previous two faults: not economizing when it should and economizing when it should
not.
E. Excess outdoor air. This failure mode is the economizer provides an excessive level of
ventilation, usually much higher than is needed for design minimum ventilation. It
causes an energy penalty during periods when the economizer should not be enabled,
that is, during cooling mode when outdoor conditions are higher than the economizer
high limit setpoint. During heating mode, excess outdoor air will increase heating
energy.
A key component of the Title 24 measure is that notice of a given fault be delivered directly
from the RTU to operating or service personnel or to specific zone thermostat in the building
that is tied to the RTU. Performance degradation faults are more prevalent than catastrophic
faults that can shut down a unit entirely. It is therefore important to provide notice as soon as
possible so they do not go unnoticed until scheduled maintenance. The measures does not
prescribe the method of signaling the fault directly from the rooftop unit. HVAC manufacturers
are free to choose an appropriate option. As a result of the CEC adopting this measure, some
major HVAC manufacturers have indicated they will be ready with the appropriate equipment
integrated with FDD capabilities before the January 2014 implementation of the revised Title 24
standards.
The analysis and outcomes of the cost-effectiveness were promising. The statewide savings
were estimated to be significant, with a 15-year life cycle net savings of over $8M for California
buildings, and a benefit/cost ratio of 2.0 (greater than 1.0 is positive so a 2.0 is a significant
positive benefit). Thus it was found that FDD for RTUs is a cost-effective measure, appropriate
for inclusion in Title 24. The full study of energy and demand savings leading to the cost-
effectiveness conclusions is a part of the FDD Review Report located in Appendix A-5.
5.4.3 FDD Title 24 Proposal: Market Connections
The research team engaged with California and industry stakeholders on the Title 24 proposal
through the following activities:
HVAC manufacturer onsite visits with Lennox, Trane and MicroMetl (major economizer
manufacturer): Tyler, Texas. November 2010.
Nonresidential HVAC Stakeholder Meetings held throughout California in April and
December 2010 and in April 2011.
FDD Roundtable: Western Cooling Efficiency Center, Davis, California. July 2010.
California Emerging Technologies Summit: Pasadena, California. November 2010.
115
ASHRAE75 Winter Meetings and involvement with the ASHRAE Technical Committees
(TC) - TC 8.11 and 7.5 and 90.1 Mechanical Subcommittee: Las Vegas, Nevada. January
2011 and Dallas, Texas. January 2013.
ESource Web Conference sponsored by CEC on Updating Rooftop Unit performance.
December 2011.
California Commissioning Collaborative Technical Seminar Series via webinar. August
2012.
Joint Electric Power Research Institute-Bonneville Power Administration National
Energy Efficiency Technology Summit: Portland, Oregon. September 2012.
California Emerging Technologies Summit: Pasadena, California. October 2012.
Architectural Engineering Institute (AEI)/ASHRAE Expo, Presentation on FDD in RTUs
and Split Systems, Omaha, Nebraska. March 2013.
In addition to the events listed above, the following links addressed the Title 24 measure
following its approval by the CEC in May 2012.
Home Energy Pros Blog http://homeenergypros.lbl.gov/profiles/blogs/ca-title-24-will-
require-rtus-to-have-automated-fault-detection
Western HVAC Performance Alliance http://www.performancealliance.org
Facilities Net http://www.facilitiesnet.com/hvac/article/HVAC-Research-Leads-To-
Revisions-in-Title-24--9894
Engineered Systems http://digital.bnpmedia.com/display_article.php?id=1229183
Western Cooling Efficiency Center Connections http://wcec.ucdavis.edu/wp-
content/uploads/2012/12/2012_Q4_CoolingConnection.pdf
75 American Society of Heating Refrigerating and Air-Conditioning Engineers

116
5.5 Benefits to California
There are multiple benefits from the ability to have FDD present in HVAC equipment. First is
the direct cost-effectiveness from the California utility and ratepayer perspective. The estimated
financial benefit cost for the Title 24 FDD measure for utility ratepayers is projected for a 54,000
Btu/h (5-ton) unit and shown in Table 20.
Table 20: Estimated Financial Benefit for FDD
Area of Assessment Est. Benefit
Incremental Installed Cost $1,600
Incremental Annual Maintenance ($74)
PV of Annual Maintenance ($878)
Total Incremental Cost $722
PV of Energy Savings $1,197
Lifecycle Cost Savings $475
Benefit/Cost Ratio 1.7
The assumed incremental installed cost is believed to be on the high side for the type of FDD
functions that are required in the Title 24 measure. Manufacturers do not provide the material
costs needed for a more precise installed cost estimate. These FDD features can be installed on
both the lower cost electromechanically controlled RTUs and the higher cost microprocessor-
controlled units. The installed cost estimate here provides a margin of error to account for direct
costs and any difference between the costs for installing the measures in the two types of
equipment. The incremental cost used here is likely lower than actual and will result in the FDD
requirement having a better Benefit/Cost Ratio than estimated.
Potential energy and cost savings to California are projected to be 2.01 kWh/sf/yr and
$1.05/sf/yr. Applying the unit estimates to the statewide estimate of new commercial building
construction of 92.79 million square feet per year results in the following statewide savings
estimates, as shown in Table 21.
Table 21: Potential California Energy and Dollar Savings from FDD
Statewide Savings Electricity Savings (kWh)
TDV Total $ Demand Savings (kW)
1st-Year Savings 1,577,138 $551,962 823
15-Year Savings 23,146,289 $6,568,344 12,818

117
The project results are in the hands of the California utilities, policymakers (CEC and CPUC),
diagnostic tool providers, and HVAC manufactures and contractors, all of whom have a role in
making these potential benefits a reality. The principal impacts will be in the small to medium-
size office, public assembly and retail building sectors (<100,000 sf in size), which collectively
represent approximately 60% of commercial buildings types having hundreds of thousands of
RTUs in service.
5.5.1 National Benefits
As noted, one of the fundamental rationales for the FDD project was that there was no national
standard for judging the effectiveness of any FDD tool or approach. However, work on a key
part of a national standard is now underway. Developing a nationally recognized standard
method to test (Method of Test) FDD protocols is critical to help advance the technology. It
would allow regulatory organizations, such as the CEC, and utilities (for energy efficiency
objectives) to give meaningful specifications for FDD requirements. It would guide users of
FDD – including equipment manufacturers, facility managers, utility incentive managers and
equipment owners – to make informed decisions about whether to use FDD, for what purpose,
and which approach might work best for them.
A proposal to establish national standards for Methods of Test for RTU FDD was made by the
NBI-WCEC PIER project team to ASHRAE and was accepted. At its January 2012 meeting
ASHRAE established the Standards Project Committee 207 for “Laboratory Method of Test of
Fault Detection and Diagnostics Applied to Commercial Air-Cooled Packaged Systems.” The
30- member Committee meets in person every year at the two main ASHRAE meetings and
through regular conference calls in the interim. It is hoped that a method can be developed and
agreed upon by 2015, if not sooner.
The national impact of the project has generated high-level visibility in the US HVAC industry,
with a number of HVAC companies represented on the Committee both as voting and non-
voting members. The Committee is active and has formed three ongoing working groups.
The California utilities also need their own Method of Test to satisfy state regulatory
requirements and ensure an accurate approach to evaluating the effectiveness of FDD tools.
Southern California Edison staff, on behalf of the California utilities, has been leading the
development of Methods of Test for both commercial and residential FDD tools. The residential
test is complete and awaiting review by the WHPA Subcommittee on In-field/Onboard Fault
Detection and Diagnostics. The commercial test method is nearing completion and will also go
through Subcommittee review.
Based entirely on the success of the Title 24 RTU FDD mandatory measure, the Pacific
Northwest Energy Codes Group (NW Codes Group) representing Idaho, Montana, Oregon and
Washington has proposed a nearly identical mandatory measure for the 2015 International
Energy Conservation Code (IECC) and the International Green Construction Code (IgCC). The
major difference from the NW Codes Group proposal and the Title 24 measure is a lower
threshold for the requirement. The NW Codes Group proposes setting a 2.75-ton minimum
level rather than the 4.5-ton minimum size limit set in Title 24 for requiring the economizer
118
FDD capabilities.
5.6 Conclusions and Next Steps
Key short and longer-term benefits were achieved in the project. The development of an initial
method to evaluate the accuracy of FDD performance protocols and related tools used in
optimizing the energy performance of HVAC equipment, both for commercial rooftop and
residential systems, is a major step toward improving RTU performance. The FDD Market
Review brought to light existing FDD options and characteristics as well as insights from
HVAC contractors with regard to FDD. This research engagement contributed to requests from
HVAC contractors, made through the various committees and forums noted in this report, to
learn more about FDD products, capabilities and costs.
In January 2014, the RTU FDD mandatory measure for most types of HVAC systems at or larger
than 4.5 tons will come into force. This is a major step forward ensuring better equipment
performance, lower consumer costs and reduced greenhouse gas emissions from power plants.
A number of detailed recommendations have been made by key stakeholders for further
testing, validation and enhancement of the Evaluator. Funding for these recommendations
could be provided through collaboration of the CPUC, CEC and the utilities. These
organizations and staff will need to assess the use of the Evaluator in relation to quality control
objectives in utility HVAC installation and maintenance programs, as well as specific
implications for Title 24 RCA protocol changes. Title 24 is the natural channel to establish and
promote the effectiveness and benefits of the Evaluator given the need to optimize air
conditioning, which is by far the major driver of peak summer electricity demand in California.
There is stakeholder consensus on changing the Title 24 RCA protocol from a prescriptive to a
performance-based protocol. Any direct standards work on a revised protocol will have to be
accomplished within the 2016 Title 24 revision schedule. Utility staff has already expressed
interest in applying the Evaluator to tools and protocols in use in current HVAC efficiency
programs. In addition, the utility and CEC Codes and Standards Enhancement (CASE) program
should consider supporting the specific recommendations for improving and further validating
the Evaluator.
Further steps have been proposed to support the development of compliance acceptance
approaches for field inspections for the 2013 Title 24 mandatory economizer FDD measure. The
HVAC contractors must have a workable method to ensure the FDD is set up and operating
properly at the time of installation. Experienced contractors will help draw up the options for
compliance methods to be sent out to codes training channels for the January 2014 new code
implementation date.
The Title 24 FDD measure has had direct national impact through the formation of an ASHRAE
Special Projects Committee (207) on the “Laboratory Method of Test of Fault Detection and
Diagnostics Applied Commercial Air-Cooled Packaged Systems.” The Committee is actively
working on the technical criteria for defining the fault conditions and thresholds with a goal to
produce a recognized Method of Test by 2015, if not sooner.

119
In California and the Northwest, utility and energy market transformation agencies have been
bringing FDD and related performance monitoring and control products into testing in the field
through emerging technology programs. The increase in general market interest in FDD in
California has been in part driven by the PIER FDD program work from the expected benefits of
having an effective quality control protocol in the diagnostic Evaluator, new products through
the Title 24 RTU FDD measure as well as national standards impacts from the Title 24 FDD
measure. The program has been a clear success in achieving its stated objectives.
For the future, fault detection for other critical HVAC system components, primarily refrigerant
cycle and closely related airflow problems, need to be added as Title 24 requirements for RTUs.
Commercially available products with these fault notices are available now, but only on a very
small number of the highest efficiency and highest cost models.
Several new control and FDD-related products are being studied through California utility
Emerging Technology initiatives. With most new RTUs remaining on the rooftops for 15 or
more years, expanded assessment by the CEC and utilities is needed on how to address the
hundreds of thousands of RTUs not covered by the 2013 Title 24 FDD requirements (since they
apply only to new and replacement units). Retrofit products with some fault detection are
already available, and more will be entering the market on a regular basis.
The potential for FDD to reduce energy consumption and peak power and to improve
equipment life is still largely untapped. New FDD products and methods should continue to be
supported through research and encouraged through policy.
End Note: NBI’s website dedicated to FDD includes all the outcomes of this PIER
research: http://newbuildings.org/fault-detection-and-diagnostics

120
Appedix page 1
E n e r g y R e s e a r c h a n d De v e l o p m e n t Di v i s i o n
Appendices
MARCH 2013 CEC-500-08-049
EVIDENCE-BASED DESIGN AND OPERATIONS PIER PROGRAM
Appendices: A-2: High Performance Buildings A-3: Plug Loads Savings Assessment A-4: Skylight Modeling Validation A-5: RTU Fault Detection and Diagnostics
Due to their file size these appendices are available separately at:
www.energy.ca.gov/research www.newbuildings.org/PIER-research