evidence for using the individual placement and … · include: silvia dwiggins, rosemary baraja,...
TRANSCRIPT
Evidence for Using the Individual Placement and Support
(IPS) Model in CalWORKs Mental Health Programs:
Outcomes from the County of Los Angeles
Submitted to the County of Los Angeles Department of Mental Health
Daniel Chandler, PhD
California Institute for
Behavioral Health Solutions
June 2017

Evidence for Using the Individual Placement and Support (IPS) Model in CalWORKs
Mental Health Programs: Outcomes from the County of Los Angeles
Submitted to the County of Los Angeles Department of Mental Health
Daniel Chandler, PhD
California Institute for Behavioral Health Solutions
2125 19th Street, 2nd Floor
Sacramento, CA 95818
June 2017

Acknowledgments
Many persons have made this study of Individual Placement and Support (IPS) programs possible,
either by their activities in implementing the IPS model for CalWORKs mental health participants in the first place, or in supplying evaluation data.
Key staff in implementing IPS in the January 2014–March 2016 study period
In addition to the Director of the Los Angeles County Department of Public Social Services (DPSS), Sheryl L. Spiller, and the Director of the Los Angeles County Department of Mental Health (DMH), Jonathan E. Sherin, PhD, MD we would like to recognize the Supportive Services Division of the Department of Public Social Services, which has advocated for extra financial support for IPS services since 2012. DMH CalWORKs Mental Health personnel whose work in implementing IPS has been indispensable include: Edward Armstrong, PsyD, Dolorese Daniel, LCSW, Carrie Esparza, PsyD, and Clara Montes., MSW.
Our independent IPS fidelity reviewers and trainers were Sandra Reese and Elizabeth Twamley, PhD; Mary Beth Abella Jacks, MSW, trained staff in motivational interviewing, and Lisa Sennette-Harris coached many providers in job development.
Key staff in providing data
Our deepest thanks go to the participants who agreed to interviews and/or use of their service records—and to the clinical staff who served them and concurrently provided data for the study.
Each study program had a coordinator who obtained informed consents and kept track of participants as they went through their treatment. These coordinators include: Silvia Dwiggins, Rosemary Baraja, Jennifer Gorman, Brenda Thomas, Jonathan Ousley, Cynthia Ulloa, Danielle Williams, Candy Caceres, Glenda Santos, Marianne Klee, Helen Chang, Amber Keating, Jessica Banuelos, and Aileen Garibyan.
The research and information-services staff who have been instrumental in providing DPSS data for the study include: Jenny Zogg, Darling Garcia, Karine Margaryan, Albert E. Saccocia, Juan C. Figueroa, and, before his untimely death, Michael Bono.
We also acknowledge the excellent survey research assistance of the Social Science Research Center, in particular that of Laura Gil-Trejo, Frederick Rose, and Lizette Sanchez.

Table of ContentsExecutive Summary .......................................................................................................................2
Introduction ...................................................................................................................................5
Methodology ...................................................................................................................................7
Study Results ...............................................................................................................................11
Question 1: Will employment reach 50% if IPS is implemented to good fidelity? ...............................11
Question 2: Is higher fidelity associated with better employment outcomes than is lower fidelity? ......12
Question 3: What factors are associated with positive change? .......................................................13
Question 4: Over and above how many persons work, what is the quality of employment and its relationship to education and other productive activities? .......................................................20
Question 5: Among good fidelity program participants, are therapeutic goals met along with employment goals? ...........................................................................................................22
Question 6: How effective is treatment that includes IPS compared to treatment that does not include IPS? ................................................................................................................24
Putting Study Results in Context ...............................................................................................26
Endnotes .......................................................................................................................................28
Appendices
Appendix 1: Differences between the CalWORKS and seriously mentally ill participants in supported employment, by Shirley Glynn, PhD, and Luana Turner, PsyD ..............................35
Appendix 2: Participant survey methodology and representativeness ..............................................36
Appendix 3: Months of available DPSS data and how length of treatment maps to this data .............38
Appendix 4: Fidelity ratings for all Los Angeles CalWORKS mental health programs ......................39
Appendix 5: Pre- and post-predictors of work/no-work using DPSS data ..........................................40
Appendix 6: Using outcome monitoring study data — do recipients of IPS differ from those
who did not receive IPS? ....................................................................................................42
Appendix 7: Operationalizing employment-focused treatment, by Edward Armstrong, PsyD,
Clara Montes, MSW, and Carrie Esparza, PsyD ..................................................................42
2 Evidence for Using the Individual Placement and Support (IPS) Model in CalWORKs Mental Health Programs
Evidence for Using the Individual Placement and Support (IPS) Model in CalWORKs Mental Health Programs: Outcomes from the County of Los Angeles
EXECUTIVE SUMMARY
Background
The California Work Opportunity and Responsibility to Kids (CalWORKs) program is
the California version of the Temporary Assistance for Needy Families (TANF) welfare reform program. Services to remove mental health barriers to employment for CalWORKs participants are provided by the County of Los Angeles Department of Mental
Health (DMH). Funds are allocated to DMH by the county Department of Public Social Services (DPSS) using specific funds from the California Legislature.
In 2007 the California Institute for Behavioral Health Solutions (CIBHS) conducted an evaluation of employment success among 2000 CalWORKs mental health participants using DPSS de-identified administrative data. A total of 18% of participants held jobs during their mental health treatment, and only 23% worked during the six months following treatment termination. In 2012, DMH included in all contracts with providers a requirement that they
provide supported employment in conjunction with mental health treatment. DMH personnel hoped that by using an evidence-based model, Individual Placement and Support (IPS),1 the percentage of participants would increase from the 23% who had worked in the first study to at least 50% in the second study. Appendix 7 is a description by DMH program staff of how the IPS model has been introduced, implemented, supported and monitored.
CIBHS was asked to evaluate the effect of adding IPS to mental health services. Phase I (January 2012–February 2013) of the evaluation was a randomized controlled trial in the first nine programs to implement IPS. Unfortunately, results were not clear cut due to a) flaws in the randomization such that control group members were more likely to have worked in the baseline, and b) a ramp-up time in attaining fidelity to the IPS model that meant very few participants experienced IPS at full strength. “Fidelity” has a specialized meaning here of closely replicating a program model known to be effective. The table on page 3 summarizes Phase I employment results using DPSS data.
Fidelity to IPS also appeared to affect employment rates: in high-fidelity programs 47% worked in at least one month, compared to 39% in fair-fidelity programs (disregarding control group members for whom fidelity was irrelevant).
This report presents results from Phase II of the study. Since all 54 programs had some version of supported employment by the start of Phase II (January 2014–March 2016) no control group was possible.2 We relied on a) testing whether a new sample of nine programs with “fair” or “good” fidelity would achieve the 50% employment rate DMH had set as a criterion measure, and on b) trying to determine whether the “good fidelity” programs had better results than “fair fidelity” programs. Because an outcome monitoring study (October 2014–February 2016) that was implemented concurrently included measures for IPS
Principles of IPS-supported employment• Competitiveemploymentisthegoal• Employmentservicesareintegratedwithtreatment
• Zeroexclusion:Eligibilityisbasedonclientchoice
• Clientpreferencesareprioritized• Benefitscounselingifneeded• Rapidtransitiontojobsearch• Jobdevelopmentsupport• Time-unlimitedsupport
PleaseseeAppendix4formoredetail,ascapturedintheFidelityScaleforIPS.
Outcomes from the County of Los Angeles 3
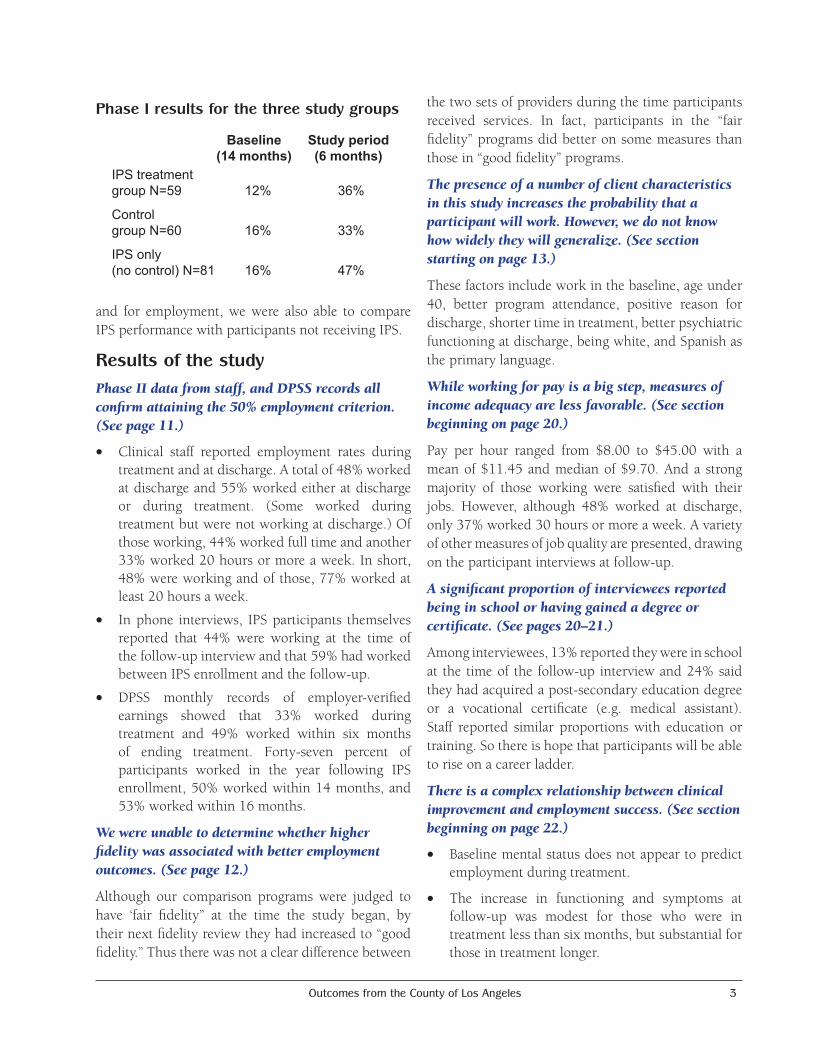
and for employment, we were also able to compare IPS performance with participants not receiving IPS.
Results of the studyPhaseIIdatafromstaff,andDPSSrecordsallconfirmattainingthe50%employmentcriterion.(Seepage11.)
• Clinical staff reported employment rates during treatment and at discharge. A total of 48% worked at discharge and 55% worked either at discharge or during treatment. (Some worked during treatment but were not working at discharge.) Of those working, 44% worked full time and another 33% worked 20 hours or more a week. In short, 48% were working and of those, 77% worked at least 20 hours a week.
• In phone interviews, IPS participants themselves reported that 44% were working at the time of the follow-up interview and that 59% had worked between IPS enrollment and the follow-up.
• DPSS monthly records of employer-verified earnings showed that 33% worked during treatment and 49% worked within six months of ending treatment. Forty-seven percent of participants worked in the year following IPS enrollment, 50% worked within 14 months, and 53% worked within 16 months.
Wewereunabletodeterminewhetherhigherfidelitywasassociatedwithbetteremploymentoutcomes.(Seepage12.)
Although our comparison programs were judged to have ‘fair fidelity” at the time the study began, by their next fidelity review they had increased to “good fidelity.” Thus there was not a clear difference between
the two sets of providers during the time participants received services. In fact, participants in the “fair fidelity” programs did better on some measures than those in “good fidelity” programs.
Thepresenceofanumberofclientcharacteristicsinthisstudyincreasestheprobabilitythataparticipantwillwork.However,wedonotknowhowwidelytheywillgeneralize.(Seesectionstartingonpage13.)
These factors include work in the baseline, age under 40, better program attendance, positive reason for discharge, shorter time in treatment, better psychiatric functioning at discharge, being white, and Spanish as the primary language.
Whileworkingforpayisabigstep,measuresofincomeadequacyarelessfavorable.(Seesectionbeginningonpage20.)
Pay per hour ranged from $8.00 to $45.00 with a mean of $11.45 and median of $9.70. And a strong majority of those working were satisfied with their jobs. However, although 48% worked at discharge, only 37% worked 30 hours or more a week. A variety of other measures of job quality are presented, drawing on the participant interviews at follow-up.
Asignificantproportionofintervieweesreportedbeinginschoolorhavinggainedadegreeorcertificate.(Seepages20–21.)
Among interviewees, 13% reported they were in school at the time of the follow-up interview and 24% said they had acquired a post-secondary education degree or a vocational certificate (e.g. medical assistant). Staff reported similar proportions with education or training. So there is hope that participants will be able to rise on a career ladder.
Thereisacomplexrelationshipbetweenclinicalimprovementandemploymentsuccess.(Seesectionbeginningonpage22.)
• Baseline mental status does not appear to predict employment during treatment.
• The increase in functioning and symptoms at follow-up was modest for those who were in treatment less than six months, but substantial for those in treatment longer.
Baseline Study period (14 months) (6 months) IPS treatment group N=59 12% 36%
Control group N=60 16% 33%
IPS only (no control) N=81 16% 47%
Phase I results for the three study groups
4 Evidence for Using the Individual Placement and Support (IPS) Model in CalWORKs Mental Health Programs
• Improvement in scores on a psychiatric functioning scale does not have a statistically significant effect on the employment rate either in itself or when interacted with time in treatment.
• Working, however, was associated by staff with clinical improvement in participants.
DatafromanoutcomemonitoringstudyconfirmtheemploymentratesfoundinthePhaseIIsampleandestablishthattheyaresubstantiallygreaterthanamongthosenotparticipatinginIPS.(Seesectionbeginningonpage24.)
In the concurrent Outcome Monitoring Study 16% of participants were reported as using IPS services. At admission to treatment, 15% of the IPS participants and 15% of the other participants were working. At discharge (or after one year if not yet discharged), 51% of IPS participants had worked, compared to 26.5% of those who did not receive IPS. These results do not appear to be a consequence of the selection of more employment-ready participants for IPS (sometimes known as “creaming”).
Contextandmeaningofthestudyresults. (Seepage26.)
From one perspective, the findings of this study are very good news. They show that a year after entering IPS employment services in a CalWORKs mental health program 50% of participants have worked for pay—a doubling of previous rates. Some of the other findings, however, are less sanguine, and they are best understood in the larger context of the failure of welfare reform.
LaDonna Pavetti’s 2016 review of welfare reform research since 1997 revealed:
• IncreasedemploymentamongTANFparticipantswas a finding in the late ’90s when the economy was booming. Since then it has not been found.
• Most TANF participants over time did not findstable employment.
Even those working ended up, on average, with less income after leaving welfare.
Themuch-improvedstatisticof50%workingamongparticipantsinthisstudystillleaveshalfwhodidnotworkandhadnoearnedincome.Limitedresultsarecommoninwelfareprogramsattemptingtohelppeoplewithdisabilitiesortoreduceotherbarrierstoemployment.
Earlier CIBHS reports have documented a wide range of family, health, and human capital hurdles that CalWORKs mental health participants face. Pavetti states that “Most recipients with significant barriers to employment never found work even after participating in work programs that were otherwise deemed successful.” Other researchers have shown that for persons with disabilities (including psychiatric diagnoses), work rates under TANF are far lower than for the overall population.
Nonetheless, it is important that this study shows IPS to be more effective than previous approaches for CalWORKs mental health participants. The findings for IPS also exceed those of experiments in other states in attempting help TANF participants overcome barriers.
IPS seems to provide CalWORKs mental health participants the best shot available so far. But largely for reasons that affect TANF programs in general, improvements in work and income associated with IPS are not sufficient to create economic independence for a high proportion of participants.
Program success such as demonstrated by IPS still needs to be supplemented by new approaches from policymakers in Washington to help TANF partici-pants who face mental health and other barriers to independence. For example, employer subsidies have been found to create work opportunities for TANF participants. The result of a failure to re-think safety net provisions for those with significant barri-ers is likely to be a further increase in deep poverty—which has more than doubled since TANF began.

Outcomes from the County of Los Angeles 5
INTRODUCTION
BackgroundWelfare reform in California has set strict time limits for the receipt of assistance under the CalWORKs program and makes rigorous requirements of recipients to search for work or to work 32 hours a week. Many studies have found rates of mental health problems to be higher among welfare recipients than in the general population. The California Legislature has passed special provisions and allocated approximately $80 million per year to county welfare departments in order to identify and serve participants for whom these problems constitute a barrier to employment. In Los Angeles County, the responsibility for treatment is delegated to the Department of Mental Health.
In 2007 CIBHS conducted an evaluation of employment success among 1,938 CalWORKs mental health participants using DPSS de-identified administrative data. Only 18% of participants worked at all during the last six months of their mental health treatment, and only 23% worked during the six months following treatment termination.3
In an attempt to improve these figures, the Department of Mental Health issued an RFP requiring all CalWORKs mental health providers to offer supported employment, an evidence-based model that provides mental health treatment and employment services at the same time in the same site. Supported employment was implemented initially for nine pilot programs, which permitted a randomized trial of the new model compared to treatment without supported employment. All 48 programs (that did not have a pre-existing employment program in their contract) had implemented supported employment by July of 2013.4
Since the Individual Placement and Support (IPS) model of supported employment recommended by DMH is an evidence-based practice, there would seem to be no reason for studying it further. However, all of the considerable evidence for effectiveness comes from studies of persons with serious mental illness, almost all of whom receive income from Supplemental Security Income (SSI). In fact, only one article describes use of supported employment with TANF
(CalWORKs in California) recipients, and it is not an outcome study.5 Differences between CalWORKs participants and persons described as having a severe mental illness are described in Appendix 1.6 Thus, given the contrasts in the population served, it is still to be determined whether IPS supported employment will improve the employment results of CalWORKs participants.
Study purposeThe overall purpose of the research is to determine whether IPS supported employment plus clinical services is more effective for CalWORKs mental health participants than clinical services alone in furthering employment and quality of life outcomes.
Phases of the evaluationPhase I of the research in 2012-2013 randomly assigned participants to supported employment or usual services within five programs and used a pre-post evaluation design for four other programs. A weakness of this study design is that measurement of outcomes coincided with the implementation period for IPS, and none of the programs achieved good fidelity until well after six months from the study start date. By the end of the year-long study period, three of nine programs had achieved a “good” rating of 100 or better, but the overall average was 89, a “fair” score. Thus start-up, implementation, and fidelity issues obscured whether IPS was effective. Phase I ended in February of 2013. The final report and a technical report are available at: http://www.cibhs.org/post/los-angeles-calworks-mental-health-services. Results weakly favored the IPS group:
Overall the percentage working in at least one month increased from 14% in the baseline to 39% in the follow-up period. Results on this and several other measures favor the IPS groups to a moderate degree, but on a number of other measures between-group differences were not statistically significant.7 Hours worked per week favor the control group, but may reflect baseline differences.
Most Phase I participants were not exposed to a program that faithfully reproduced the IPS model. This is consequential because there is experimental
6 Evidence for Using the Individual Placement and Support (IPS) Model in CalWORKs Mental Health Programs
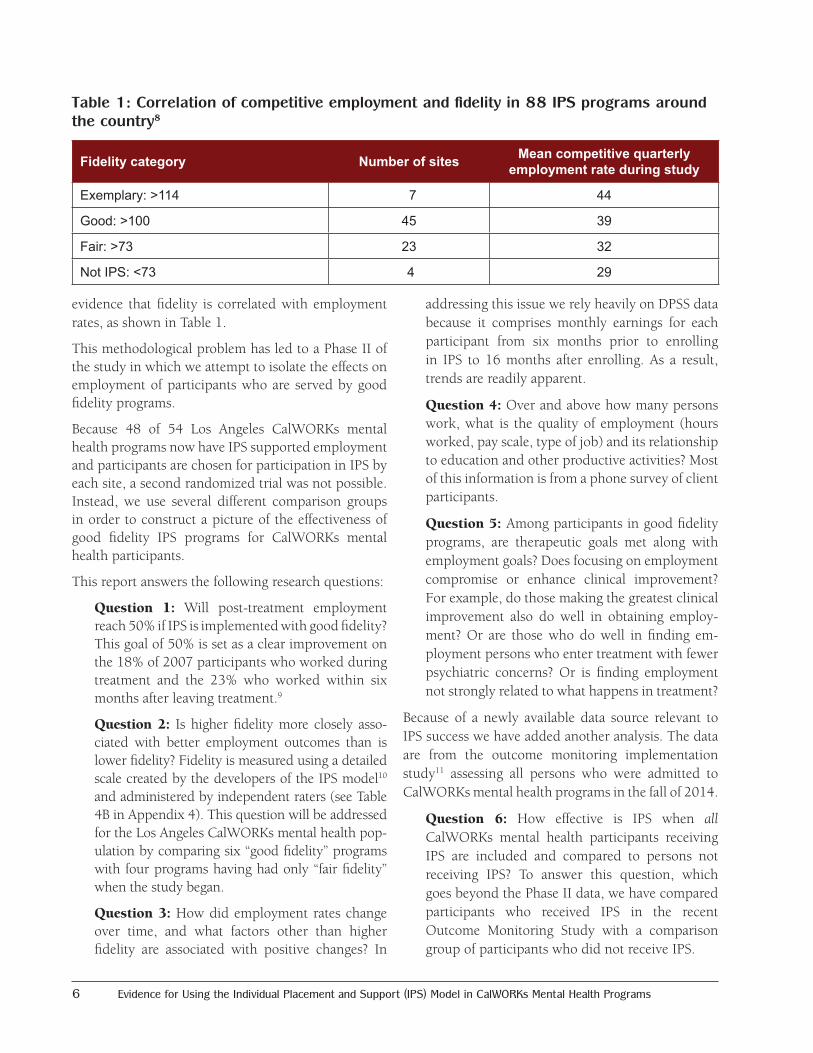
evidence that fidelity is correlated with employment rates, as shown in Table 1.
This methodological problem has led to a Phase II of the study in which we attempt to isolate the effects on employment of participants who are served by good fidelity programs.
Because 48 of 54 Los Angeles CalWORKs mental health programs now have IPS supported employment and participants are chosen for participation in IPS by each site, a second randomized trial was not possible. Instead, we use several different comparison groups in order to construct a picture of the effectiveness of good fidelity IPS programs for CalWORKs mental health participants.
This report answers the following research questions:
Question 1: Will post-treatment employment reach 50% if IPS is implemented with good fidelity? This goal of 50% is set as a clear improvement on the 18% of 2007 participants who worked during treatment and the 23% who worked within six months after leaving treatment.9
Question 2: Is higher fidelity more closely asso-ciated with better employment outcomes than is lower fidelity? Fidelity is measured using a detailed scale created by the developers of the IPS model10 and administered by independent raters (see Table 4B in Appendix 4). This question will be addressed for the Los Angeles CalWORKs mental health pop-ulation by comparing six “good fidelity” programs with four programs having had only “fair fidelity” when the study began.
Question 3: How did employment rates change over time, and what factors other than higher fidelity are associated with positive changes? In
addressing this issue we rely heavily on DPSS data because it comprises monthly earnings for each participant from six months prior to enrolling in IPS to 16 months after enrolling. As a result, trends are readily apparent.
Question 4: Over and above how many persons work, what is the quality of employment (hours worked, pay scale, type of job) and its relationship to education and other productive activities? Most of this information is from a phone survey of client participants.
Question 5: Among participants in good fidelity programs, are therapeutic goals met along with employment goals? Does focusing on employment compromise or enhance clinical improvement? For example, do those making the greatest clinical improvement also do well in obtaining employ-ment? Or are those who do well in finding em-ployment persons who enter treatment with fewer psychiatric concerns? Or is finding employment not strongly related to what happens in treatment?
Because of a newly available data source relevant to IPS success we have added another analysis. The data are from the outcome monitoring implementation study11 assessing all persons who were admitted to CalWORKs mental health programs in the fall of 2014.
Question 6: How effective is IPS when all CalWORKs mental health participants receiving IPS are included and compared to persons not receiving IPS? To answer this question, which goes beyond the Phase II data, we have compared participants who received IPS in the recent Outcome Monitoring Study with a comparison group of participants who did not receive IPS.
Table 1: Correlation of competitive employment and fidelity in 88 IPS programs around the country8
Fidelity category Number of sites Mean competitive quarterly employment rate during study
Exemplary: >114 7 44
Good: >100 45 39
Fair: >73 23 32
Not IPS: <73 4 29
Outcomes from the County of Los Angeles 7
METHODOLOGY
Privacy and consentAll participants in the Phase II IPS study signed detailed study consent and data release forms. This was necessary because we used DPSS data for these participants, to which the mental health program would otherwise not have access.12 The participants in Group I, the good fidelity programs, also needed to consent because they were asked to complete a baseline and a follow-up phone interview. All consent documents had been approved by the DMH Human Subjects Committee as part of the Phase I study.
Participants in the other source of data—the outcomes monitoring evaluation—were not asked to consent because all participants in the system were included, and no personally identifiable data are used in the study; all linking of records over time is performed by using an arbitrary identifier. All data are thus “de-identified.”
Data sourcesInformation used in this report came from:
1. Data collection methods designed specifically for the IPS Phase I and II studies:
a) Staff surveys about participants in either the IPS or Outcome Monitoring Study completed at baseline and at discharge—or the end of the study. In the IPS sample 105 persons had been discharged, and only 3 were still in treatment at the end of the study. The surveys differ somewhat for the IPS sample and the outcomes monitoring sample, but have many items in common. Information from staff was not collected for the participants in “fair” IPS programs.
b) Phone interviews with participants. The same phone interview protocol used in Phase I is used in Phase II. Interviews were conducted by the Social Science Research Center at California State University Fullerton. Participant interview information was not collected for the participants in “fair” IPS programs.13 Follow-up interviews were completed with 75% of participants in “good” IPS programs.
See Appendix 2 for details.
c) Employment data provided by the Department of Public Social Services. DPSS employment data has the advantages of being generally reliable14 and being available for periods prior to and after the formal study period. Thus the “baseline” is not limited to employment at the time of entering the study but rather includes data for six months prior to admission. DPSS data is available for both “good” and “fair” IPS program participants but not for participants in the outcomes monitoring study. The DPSS data is not restricted to periods when study participants were in welfare-to-work programs. Income data, for example, is collected by DPSS if persons are receiving CalWORKs, food stamps, or Medi-Cal. Appendix 4 shows how many persons for whom we have data in six baseline study months and 16 follow-up months. Only one case is missing for the 16 months after IPS enrollment.15 In most analyses we use a 12-month follow-up because that corresponds more closely to the staff ratings and consumer interviews.
2. The outcome monitoring implementation study:
This information is limited to staff reports at baseline, at each of four quarters, and discharge (or after one year if not yet discharged). As noted, no DPSS or participant interview data is available.
Sampling
In Phase II of the IPS study our intent was to measure the effects of good fidelity programs on participant employment. To this end we recruited the programs that by late 2013 had achieved a “good fidelity” score of 100 or above. Because their IPS caseloads were full when the study began, study participants entered slowly over 14 months (from January 2014 to mid-March 2015). As program spots opened up, those entering them were asked to consent to be in the study. There were initially six of these good fidelity programs; one more was added late in 2014 but recruited only two participants. A total of 109 study participants were recruited by these seven programs.

8 Evidence for Using the Individual Placement and Support (IPS) Model in CalWORKs Mental Health Programs
The same process was followed with four sites that had “fair fidelity.” Unfortunately, in these sites—in which the only “participation” was agreeing to share with the researchers DMH and DPSS records—participants were less likely to consent than in the good fidelity group in which each interview participant received a nominal payment of $25. An incentive was added for the fair fidelity group participants late in the recruitment period, but only 44 participants were recruited.
In addition to comparing the good and fair fidelity groups, we have added a research design that employs the outcomes monitoring sample of all persons admit-ted to CalWORKs mental health programs between Oc-tober 1 and December 30, 2014. A complete descrip-tion of the sampling and methodology for this study is available.16 The IPS participants in that study comprise a census of IPS participants admitted to services during the implementation quarter. That is, they represent IPS in all programs, of good, fair, or low fidelity.
InterventionThe intervention in the study is participation in an IPS program, usually of specified fidelity. The detailed criteria for IPS fidelity are available at: http://www.dartmouthips.org/wp-content/uploads/2016/03/ips-fidelity-manual-3rd-edition_2-4-16.pdf
Table 2 shows the fidelity scores for IPS Phase II programs during the IPS II study period. Note the full range of scores: 115–125 represents Exemplary Fidelity; 100–114 for Good Fidelity; 74–99 for Fair Fidelity; and 73 and below is not considered to be supported employment.
Study programs were reviewed primarily by two ex-ternal experts in IPS fidelity. Sandy Reese is employed by Rockville Institute, an independent research orga-nization, to provide technical assistance and fidelity reviews to IPS programs on the west coast. Elizabeth Twamley is director of an IPS program at the Univer-sity of California, San Diego, where she is a professor of psychiatry. Other reviews were done by DMH ad-ministrative staff who had attended reviewer training at Dartmouth and who were further trained by par-ticipating in reviews done by the independent experts.
CalWORKs programs have difficulty scoring in the “Exemplary” category because the fidelity scale advan-tages programs with multiple employment counselors and programs that provide broad penetration of IPS services to participants. Many CalWORKs programs are small, and the funding they receive for IPS permits serving fewer than 20% of participants. That is, the failure of most (but not all) CalWORKs programs to
Table 2: IPS fidelity scores for good and fair programs in Phase II of the study
ProgramBaseline near start of Phase II
Study period review 1
Study period review 2
Study period average
GROUP I “good fidelity” AT BASELINE
Children’s Institute VI 104 102 108 105Children’s Institute IV 102 97 971
El Centro de Amistad 103 108 108
ENKI 103 104 106 105Penny Lane 111 115 114 114.5Shields for Families 100 101 100 100.6
GROUP II “fair fidelity” AT BASELINEChild and Family Guidance Center 92 94 105 99.5Hillview MHC 95 104 98 101Pathways (Providence) 93 107 107
SCHARP 75 88 103 95.5
Outcomes from the County of Los Angeles 9
exceed a fidelity score of 115 is not just a reflection of how well they served their participants, but rather is also an indicator of the inadequacy of funding to serve all participants.
At the inception of the study all programs in the “good fidelity” group had achieved at least one fidelity score of 100 or better. All those in the “fair” group had achieved a score between 74 and 99. These baseline scores are shown in the left column in Table 2. Fidelity reviews continued during the study period, with most programs receiving two. The average score received in the study period is in the right-hand column in Table 2.
Scanning across the columns shows a rapid increase in fidelity among some of the “fair fidelity” programs. While gratifying in itself, the consequence is that the distinction we assumed between the two groups of programs is far less rigid than we had expected. One good fidelity program dropped below 100, and all four of the fair programs attained good fidelity during the study. So we should not expect large differences between the two groups. This is especially true because the recruitment took 14 months, so many of those recruited later in the rapid improvement “fair” programs would actually have experienced a “good” fidelity program.17
In answering question 6, which uses Outcome Monitoring Study data, we compare IPS participants and non-participants in 54 pro-grams. A summary of all IPS fidel-ity scores from program inception in 2012 through 2016 for the 40 programs for which ratings have been done is shown in Appendix 4 An increase in fidelity over time is very apparent.
Programs with no fidelity scores in some cases reflect programs with no IPS yet; in others, ratings are lacking if the employment special-ist recently changed. A few have IPS programs but have not received fidelity reviews yet. And six sites use a form of employment services other than IPS.18
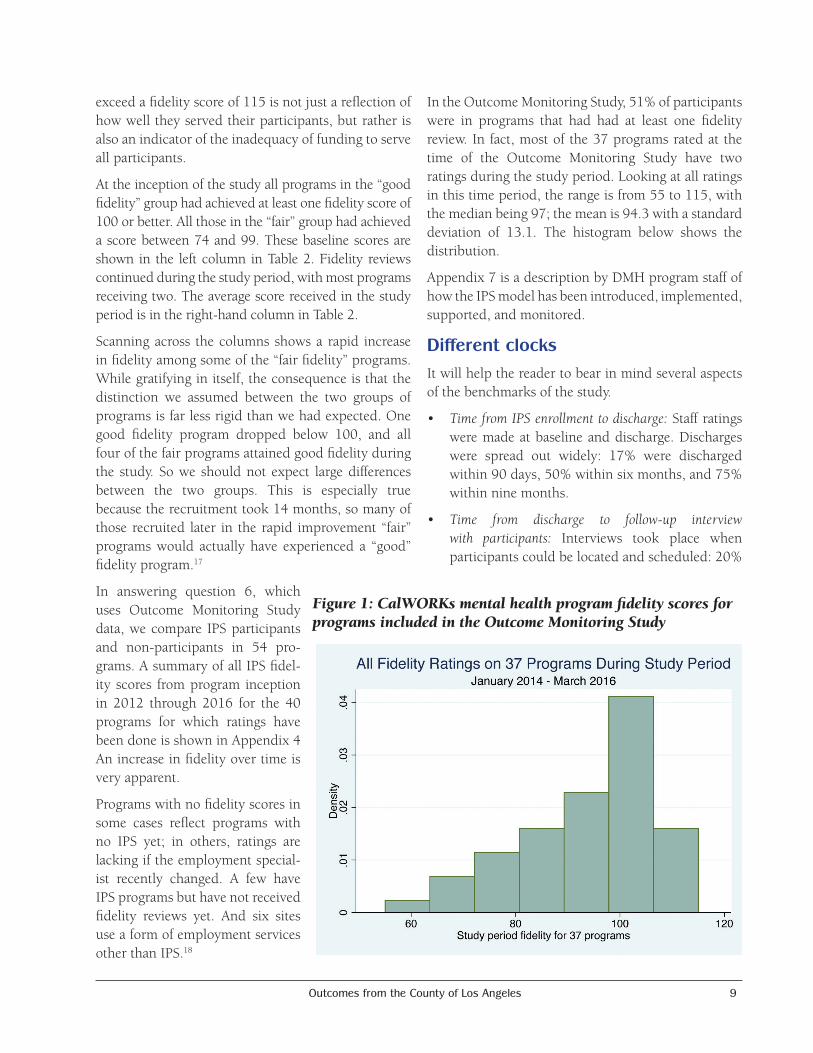
In the Outcome Monitoring Study, 51% of participants were in programs that had had at least one fidelity review. In fact, most of the 37 programs rated at the time of the Outcome Monitoring Study have two ratings during the study period. Looking at all ratings in this time period, the range is from 55 to 115, with the median being 97; the mean is 94.3 with a standard deviation of 13.1. The histogram below shows the distribution.
Appendix 7 is a description by DMH program staff of how the IPS model has been introduced, implemented, supported, and monitored.
Different clocksIt will help the reader to bear in mind several aspects of the benchmarks of the study.
• TimefromIPSenrollmenttodischarge: Staff ratings were made at baseline and discharge. Discharges were spread out widely: 17% were discharged within 90 days, 50% within six months, and 75% within nine months.
• Time from discharge to follow-up interviewwith participants: Interviews took place when participants could be located and scheduled: 20%
Figure1:CalWORKsmentalhealthprogramfidelityscoresforprogramsincludedintheOutcomeMonitoringStudy

10 Evidence for Using the Individual Placement and Support (IPS) Model in CalWORKs Mental Health Programs
within a month of discharge, 50% within 90 days, 75% within 10 months, and 20% took place more than a year after discharge.
• Foroneanalysiswespecificallytriedtomatchanearlier study whose results served as a benchmark. The time frame in that study covered the six months after discharge and used as a baseline the sixth month prior to completing treatment.
• Each of the above time periods varies by individual. Pre- and post-staff ratings might, for
example, be 60 days apart for some participants and a year apart for others. In analyses of DPSS data, though, we used time periods that were the same for each participant. The main such period is 12 months from enrollment, but we also used 16 months from enrollment in order to have more time post-treatment. Sixteen months was the last time period for which we had DPSS data on all 148 participants; after that each month brought more attrition from the data sources. See Appendix 3.
Outcomes from the County of Los Angeles 11
STUDY RESULTSQuestion 1: Will employment reach 50% if IPS is implemented to good fidelity?
DMH judged that achieving a 50% employment rate either during the program or within six months after leaving would be a substantial achievement and would clearly indicate success of the IPS model in this population. This goal is roughly double the historical employment rates found in 2004–2005 among 1,938 CalWORKs mental health participants; 18% were employed during treatment, and 23% in the six months after leaving the program.19 But it is still somewhat below what many research-based IPS programs have achieved with a different population.20 The federal work participation requirement for TANF is 50%,21 but that is a monthly rate whereas the goal here is for that percentage to be involved in working over a period of roughly a year.
We report staff, participant interview, and DPSS data sources for employment rates. The measures used differ somewhat among sources, making them not directly comparable. The DPSS data is of greatest interest because it covers the time periods before and after program attendance. DPSS also uses employment data for making individual participant eligibility decisions and policy decisions, including whether to expand funding for IPS.
Staffreportsshow48%wereworkingatdischargeandanother7%hadworkedduringtreatmentbutwerenotworkingatdischarge.
Staff were asked to report on the discharge form how many hours a week participants were working at the time the client had last visited the clinic.
As seen in Table 3, IPS participants in good fidelity programs come very close to meeting the goal of 50% working. A total of 47.7% were working when discharged. If one counts the single volunteer/trainee, the percentage increases to 48.6.
Of those working, 44% worked full time and another 33% worked more than 20 hours a week. In short, 48% were working and of those, 77% worked at least 20 hours a week (see Table 3 on next page).
We also asked staff to record all the jobs participants had worked by time of discharge. A total of 55% had worked during the period of IPS services or were working at discharge. Eighty percent of those who worked had been employed in only one job, but 16% had worked in two jobs, and 5% in three or more.
ParticipantinterviewresultsayearafterenteringIPSshow59%hadworkedbetweenentryandfollow-upinterviews.
CIBHS contracted with the Social Science Research Center (SSRC) to conduct phone interviews with the 109 “good fidelity” program participants. At baseline, 80 interviews were completed. At follow-up (after discharge from the program) 78 persons were interviewed. However, only 61 participants were interviewed both times. Details of the survey process are in Appendix 2.
Also in Appendix 2 is a comparison of persons whom SSRC was able to interview, vs. those they were unable to interview. The comparison show very few differences between these groups, particularly when using DPSS data to compare work rates. Thus it seems reasonable to take interviewee reports about work, both here and in Question 3, to be representative of the study group as a whole.
At the follow-up interview, 34 (or 44%) of 78 persons were working. In addition, another 12 persons had worked during the study period but were not working at the time of the follow-up interview, which brought to 46 the total of persons who had worked during the study period (or 59% of those with a follow up interview). Cross-referencing with the DPSS data indicates the interview data is reliable.22
DPSSdatashow53%workedwithin16monthsofdischarge.
We used DPSS data to approximate our original goals of substantially improving the 18% working during treatment and 23% within six months after discharge. We mapped the duration of treatment data from the staff reports (months from enrollment to discharge) onto the months from enrollment in the DPSS data.23 During the course of treatment the percentage of those having worked was 33%. If we include the six months after discharge, 49% worked.24

12 Evidence for Using the Individual Placement and Support (IPS) Model in CalWORKs Mental Health Programs
DPSS longitudinal data (consecutive months in a six-month baseline and continuing for at least 16 months) for 148 persons showed an increase from 17% working during the baseline to 48% working within 12 months, 50% working within 14 months, and 53% working within 16 months.25 Compared to the Phase I results of 36% working within 14 months for the IPS group that had a randomized control group there is a moderate increase in Phase II, and compared to the 47% for the IPS group with no control there is a small increase for Phase II.
Question 2: Is higher fidelity associated with better employment outcomes than is lower fidelity?
Since we were unable to have a randomized control group in Phase II, we had one group of participants in programs that in January of 2014 had “good fidelity” and another group of participants in programs with “fair fidelity.” Our hypothesis was that fidelity would matter and employment would be better among Group I participants. However, over the course of the year the “fair fidelity” programs transformed themselves to “good fidelity” programs. The only
source of data we have to compare participants from good and low fidelity programs is from DPSS. That means we are lacking the detail from staff reports and client interviews for the Group II participants. However, the actual employment data from DPSS are highly useful because the data are real time month-by-month reports rather than being cross-sectional or relying on memory. The rates of employment shown in the DPSS data are slightly lower than staff reports for the same people, but that does not matter for the analyses in this section because the DPSS data are the same for both groups. Earnings in the study year were substantial, $389,000 for the two groups together, but they did not differ statistically by study group.
Earnings averaged $2,620 for Group I participants and $2,652 for Group II participants, so nothing in these findings suggests that Group I did better as a result of having been served in somewhat higher fidelity programs.26
Earnings are not the best measure, though: so many persons have zero earnings that averages are mislead-ing. Instead we use percentage with any earned in-come in the study period, and later we will look at
Table 4: Sum of earnings pre and post, by group
Employment status N=109 percent
Employed full time (32 hours a week or more) 21.1
Employed 20–31 hours per week 15.6
Employed 10–19 hours per week 9.2
Employed 1–9 hours per week 1.8
Working as a volunteer or unpaid trainee 0.9
Not working 51.4
Table 3: Participants in good fidelity programs—staff report of employment status at last clinic visit
Group I (N=106) Group II (N=44) Total (N=150)
Baseline 6 months $37,591 $26,336 $63,927Study period 12 months
$277,700 $111,396 $389,096
Outcomes from the County of Los Angeles 13
the number of months in which participants had any earnings.
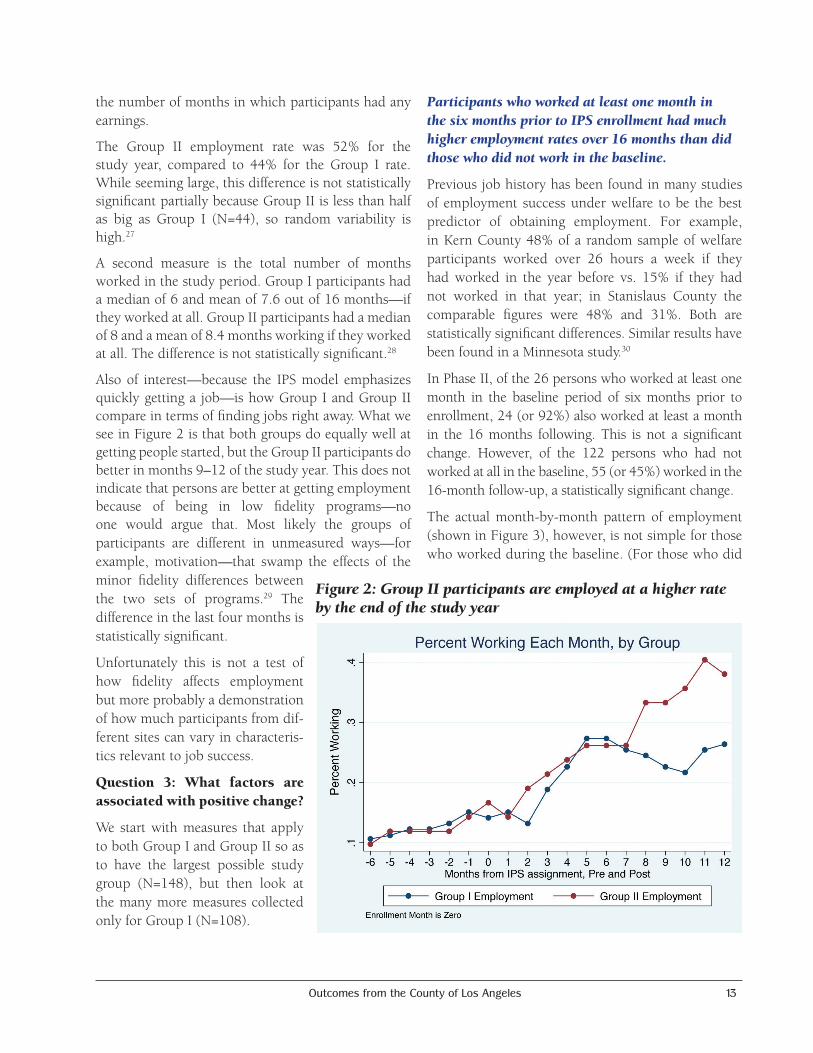
The Group II employment rate was 52% for the study year, compared to 44% for the Group I rate. While seeming large, this difference is not statistically significant partially because Group II is less than half as big as Group I (N=44), so random variability is high.27
A second measure is the total number of months worked in the study period. Group I participants had a median of 6 and mean of 7.6 out of 16 months—if they worked at all. Group II participants had a median of 8 and a mean of 8.4 months working if they worked at all. The difference is not statistically significant.28
Also of interest—because the IPS model emphasizes quickly getting a job—is how Group I and Group II compare in terms of finding jobs right away. What we see in Figure 2 is that both groups do equally well at getting people started, but the Group II participants do better in months 9–12 of the study year. This does not indicate that persons are better at getting employment because of being in low fidelity programs—no one would argue that. Most likely the groups of participants are different in unmeasured ways—for example, motivation—that swamp the effects of the minor fidelity differences between the two sets of programs.29 The difference in the last four months is statistically significant.
Unfortunately this is not a test of how fidelity affects employment but more probably a demonstration of how much participants from dif-ferent sites can vary in characteris-tics relevant to job success.
Question 3: What factors are associated with positive change?
We start with measures that apply to both Group I and Group II so as to have the largest possible study group (N=148), but then look at the many more measures collected only for Group I (N=108).
ParticipantswhoworkedatleastonemonthinthesixmonthspriortoIPSenrollmenthadmuchhigheremploymentratesover16monthsthandidthosewhodidnotworkinthebaseline.
Previous job history has been found in many studies of employment success under welfare to be the best predictor of obtaining employment. For example, in Kern County 48% of a random sample of welfare participants worked over 26 hours a week if they had worked in the year before vs. 15% if they had not worked in that year; in Stanislaus County the comparable figures were 48% and 31%. Both are statistically significant differences. Similar results have been found in a Minnesota study.30
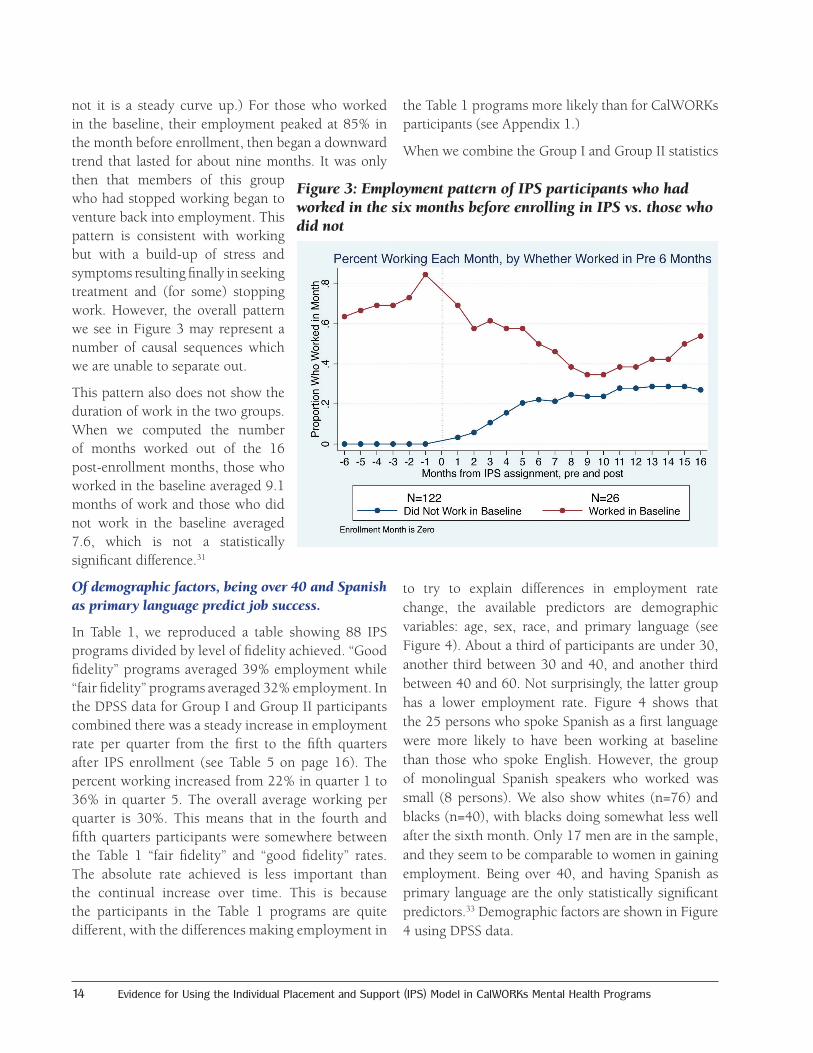
In Phase II, of the 26 persons who worked at least one month in the baseline period of six months prior to enrollment, 24 (or 92%) also worked at least a month in the 16 months following. This is not a significant change. However, of the 122 persons who had not worked at all in the baseline, 55 (or 45%) worked in the 16-month follow-up, a statistically significant change.
The actual month-by-month pattern of employment (shown in Figure 3), however, is not simple for those who worked during the baseline. (For those who did
Figure2:GroupIIparticipantsareemployedatahigherratebytheendofthestudyyear
14 Evidence for Using the Individual Placement and Support (IPS) Model in CalWORKs Mental Health Programs
not it is a steady curve up.) For those who worked in the baseline, their employment peaked at 85% in the month before enrollment, then began a downward trend that lasted for about nine months. It was only then that members of this group who had stopped working began to venture back into employment. This pattern is consistent with working but with a build-up of stress and symptoms resulting finally in seeking treatment and (for some) stopping work. However, the overall pattern we see in Figure 3 may represent a number of causal sequences which we are unable to separate out.
This pattern also does not show the duration of work in the two groups. When we computed the number of months worked out of the 16 post-enrollment months, those who worked in the baseline averaged 9.1 months of work and those who did not work in the baseline averaged 7.6, which is not a statistically significant difference.31
Ofdemographicfactors,beingover40andSpanishasprimarylanguagepredictjobsuccess.
In Table 1, we reproduced a table showing 88 IPS programs divided by level of fidelity achieved. “Good fidelity” programs averaged 39% employment while “fair fidelity” programs averaged 32% employment. In the DPSS data for Group I and Group II participants combined there was a steady increase in employment rate per quarter from the first to the fifth quarters after IPS enrollment (see Table 5 on page 16). The percent working increased from 22% in quarter 1 to 36% in quarter 5. The overall average working per quarter is 30%. This means that in the fourth and fifth quarters participants were somewhere between the Table 1 “fair fidelity” and “good fidelity” rates. The absolute rate achieved is less important than the continual increase over time. This is because the participants in the Table 1 programs are quite different, with the differences making employment in
the Table 1 programs more likely than for CalWORKs participants (see Appendix 1.)
When we combine the Group I and Group II statistics
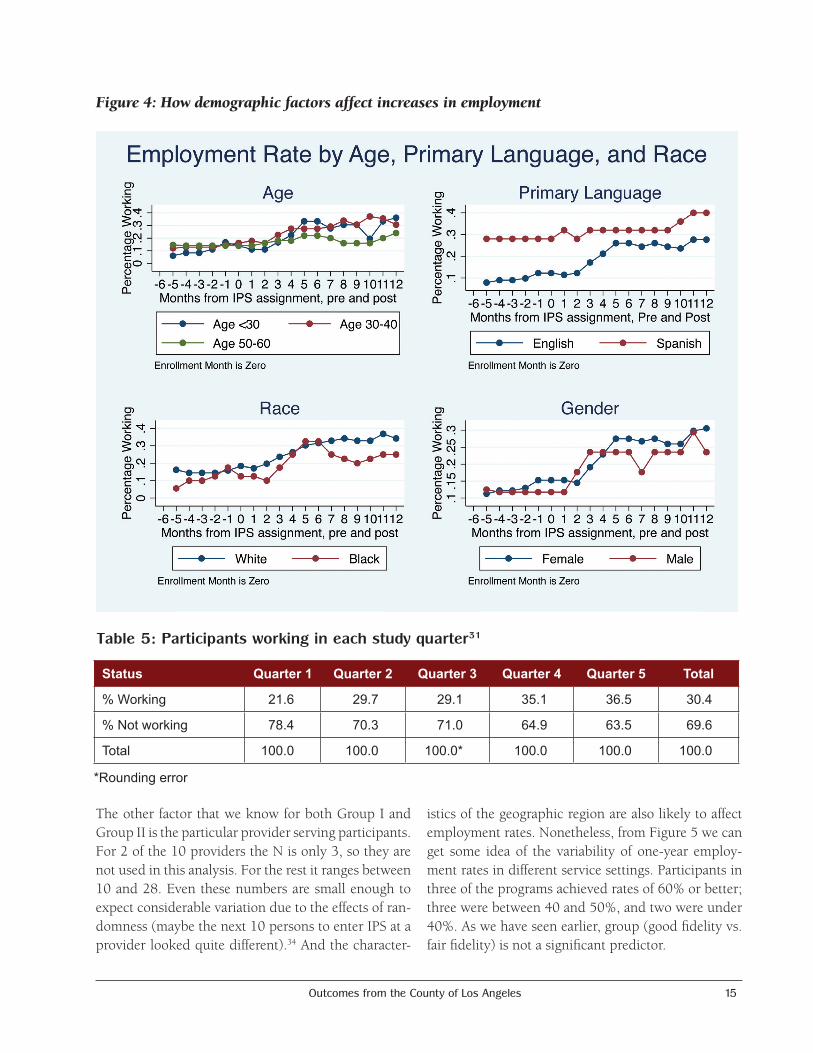
to try to explain differences in employment rate change, the available predictors are demographic variables: age, sex, race, and primary language (see Figure 4). About a third of participants are under 30, another third between 30 and 40, and another third between 40 and 60. Not surprisingly, the latter group has a lower employment rate. Figure 4 shows that the 25 persons who spoke Spanish as a first language were more likely to have been working at baseline than those who spoke English. However, the group of monolingual Spanish speakers who worked was small (8 persons). We also show whites (n=76) and blacks (n=40), with blacks doing somewhat less well after the sixth month. Only 17 men are in the sample, and they seem to be comparable to women in gaining employment. Being over 40, and having Spanish as primary language are the only statistically significant predictors.33 Demographic factors are shown in Figure 4 using DPSS data.
Figure3:EmploymentpatternofIPSparticipantswhohadworkedinthesixmonthsbeforeenrollinginIPSvs.thosewhodid not
Outcomes from the County of Los Angeles 15
The other factor that we know for both Group I and Group II is the particular provider serving participants. For 2 of the 10 providers the N is only 3, so they are not used in this analysis. For the rest it ranges between 10 and 28. Even these numbers are small enough to expect considerable variation due to the effects of ran-domness (maybe the next 10 persons to enter IPS at a provider looked quite different).34 And the character-
istics of the geographic region are also likely to affect employment rates. Nonetheless, from Figure 5 we can get some idea of the variability of one-year employ-ment rates in different service settings. Participants in three of the programs achieved rates of 60% or better; three were between 40 and 50%, and two were under 40%. As we have seen earlier, group (good fidelity vs. fair fidelity) is not a significant predictor.
Figure4:Howdemographicfactorsaffectincreasesinemployment
Table 5: Participants working in each study quarter31
Status Quarter 1 Quarter 2 Quarter 3 Quarter 4 Quarter 5 Total
% Working 21.6 29.7 29.1 35.1 36.5 30.4
% Not working 78.4 70.3 71.0 64.9 63.5 69.6
Total 100.0 100.0 100.0* 100.0 100.0 100.0
*Rounding error

16 Evidence for Using the Individual Placement and Support (IPS) Model in CalWORKs Mental Health Programs
Merging staff-supplied data with DPSS data for Group I participants allows us to examine a large number of fac-tors to see if they predict working during the study period.
For Group I (“good fidelity”) the DPSS data can be matched to all the variables contained in the staff ratings. So we can examine a large number of factors that may be associated with higher vs. lower employment rates.
Usingstaffdata,thelengthoftimeintreatmentwasnotassociatedwiththerateatwhichparticipantsworkedpriortodischarge.UsingDPSSdata,though,thosestayingintreatmentlongesthadthelowestemploymentrate.
On the face of it, those staying in treatment longer should be more successful in gaining employment. However, it is not this simple. Many people leave treat-ment when they find work (for a variety of reasons, but managing work and therapy is complicated for single parents). Also, if participants have been in treat-ment more than a year, it may signal that the problems facing them are much more severe or intractable.
If we divide those who left the program during the 12 month study period (97%) into quartiles of about
25 persons each, this reflects times in the program of up to 112 days, 112–196 days, 196–286 days, and greater than 286 days. Using the measure of having worked that includes anyone who worked during their time in the program, staff reported that of those who left before 112 days, 58% worked; among those leaving after 112–196 days in treatment, 56% worked; in the group treated for 196–286 days, 50% worked; and for those in treatment more than 286 days, 56% worked prior to discharge.35 So the employment rate changes little with time in treatment.
Clearly, though, time in treatment could be confounded with level of functioning at baseline. A baseline
GAF (Global Assessment of Functioning) score of 53 was found for participants leaving within the shortest period, a GAF of 54 for those leaving between 112 and 96 days, 50 for those leaving 197–286 days, and GAF of 45 for those in treatment more than 286 days. That is, those in treatment longest had statistically significantly lower functioning at baseline.36
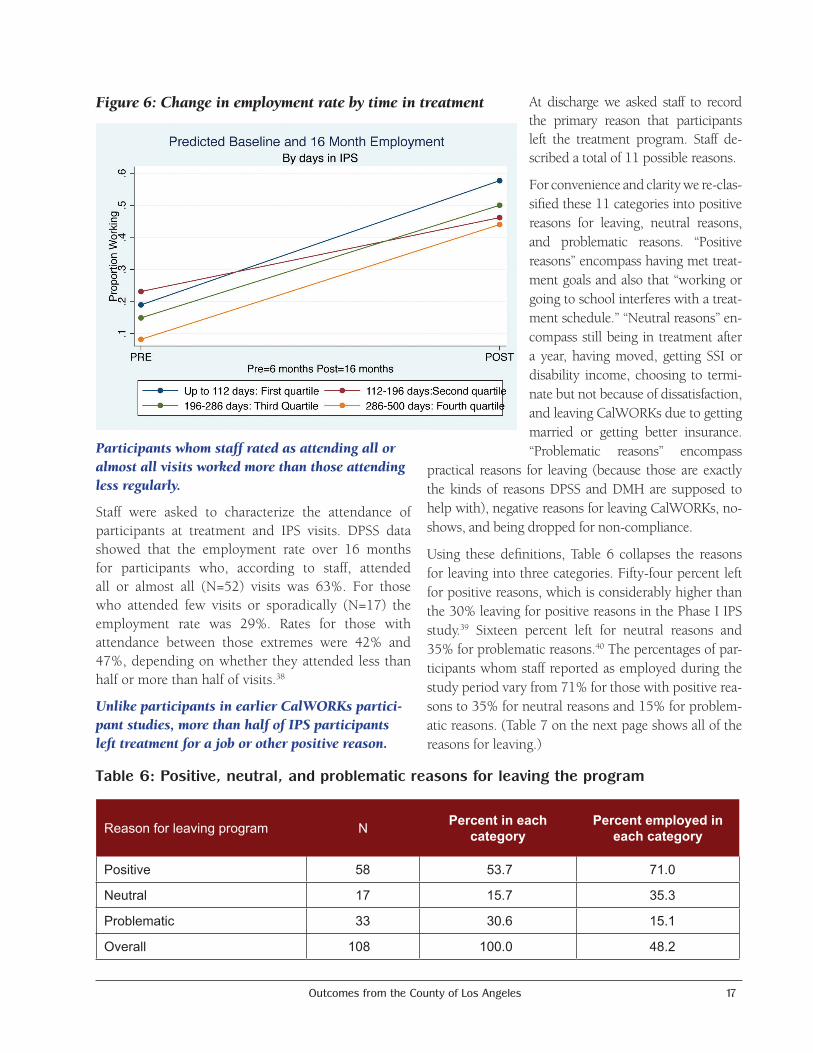
With the GAF scores in mind, let us look at the association between time in treatment and whether or not participants worked within 16 months of IPS enrollment, using DPSS data (Figure 6). The amount of change in the percentage working from baseline through 16 months for each group is: a 49% increase for those leaving within the first 112 days; a 23% increase for the 113–196 days group; a 35% change for the 197–286 days group; and a 36% change for the group in treatment 287–500 days. The overall change from baseline is, of course, statistically significant, but within the four categories only the second (113–196 days) is significantly different from (lower than) the overall mean.37 By 16 months the group in treatment longest, which was lowest functioning at baseline, has caught up in terms of increase in employment but not in terms of absolute rate.
Figure5:Providerandgroupeffectsonworkingwithinayearfrom IPS enrollment
Outcomes from the County of Los Angeles 17
Participantswhomstaffratedasattendingalloralmostallvisitsworkedmorethanthoseattendinglessregularly.
Staff were asked to characterize the attendance of participants at treatment and IPS visits. DPSS data showed that the employment rate over 16 months for participants who, according to staff, attended all or almost all (N=52) visits was 63%. For those who attended few visits or sporadically (N=17) the employment rate was 29%. Rates for those with attendance between those extremes were 42% and 47%, depending on whether they attended less than half or more than half of visits.38
UnlikeparticipantsinearlierCalWORKspartici-pantstudies,morethanhalfofIPSparticipantslefttreatmentforajoborotherpositivereason.
At discharge we asked staff to record the primary reason that participants left the treatment program. Staff de-scribed a total of 11 possible reasons.
For convenience and clarity we re-clas-sified these 11 categories into positive reasons for leaving, neutral reasons, and problematic reasons. “Positive reasons” encompass having met treat-ment goals and also that “working or going to school interferes with a treat-ment schedule.” “Neutral reasons” en-compass still being in treatment after a year, having moved, getting SSI or disability income, choosing to termi-nate but not because of dissatisfaction, and leaving CalWORKs due to getting married or getting better insurance. “Problematic reasons” encompass
practical reasons for leaving (because those are exactly the kinds of reasons DPSS and DMH are supposed to help with), negative reasons for leaving CalWORKs, no-shows, and being dropped for non-compliance.
Using these definitions, Table 6 collapses the reasons for leaving into three categories. Fifty-four percent left for positive reasons, which is considerably higher than the 30% leaving for positive reasons in the Phase I IPS study.39 Sixteen percent left for neutral reasons and 35% for problematic reasons.40 The percentages of par-ticipants whom staff reported as employed during the study period vary from 71% for those with positive rea-sons to 35% for neutral reasons and 15% for problem-atic reasons. (Table 7 on the next page shows all of the reasons for leaving.)
Figure6:Changeinemploymentratebytimeintreatment
Table 6: Positive, neutral, and problematic reasons for leaving the program
Reason for leaving program N Percent in each category
Percent employed in each category
Positive 58 53.7 71.0
Neutral 17 15.7 35.3
Problematic 33 30.6 15.1
Overall 108 100.0 48.2

18 Evidence for Using the Individual Placement and Support (IPS) Model in CalWORKs Mental Health Programs
The DPSS data for 12 months from enrollment only partially correspond with the staff reports for each of these groups. In DPSS data, those with positive reasons for leaving worked at a rate of 53%, those with neutral reasons had a 13% employment rate, and those with problematic reasons had a 42% employment rate.40 However, the discrepancies between staff rates and DPSS rates of the percent who worked if leaving for positive, negative, or problematic reasons are at this point not explained.42 Figure 7 shows the change in employment rate using DPSS data over the baseline and 12 month-study period.
This is the first time in a number of CIBHS CalWORKs studies, including Phase I of this study, that we have
found positive results for persons with problematic rea-sons for leaving. It may suggest that even if reasons for leaving are problematic, skills may have been learned that permit two fifths of these participants to find a job.43
Acomprehensivemodelofwhichfactorsareassociatedwithwhetherparticipantsworkornotinthe12monthsafterenrollmentishighlyexplanatory.
In the sections above we have looked at the effect of several individual variables on whether or not participants in IPS actually worked during the study year or 16 months. At this point it is important to look comprehensively at predictors of work. This can
Table 7: Reasons for leaving CalWORKs mental health program and associated percent working: Participants in “good fidelity” programs
Reason for leaving program Cases Percent of total
Percent of category employed
1. Client and clinician agree that client has met goals relevant to removing mental health barriers to employment 39 36.1 59.0
2. Client chooses to terminate even though all goals were not at-tained; choice is not based on dissatisfaction with services 8 7.4 25.0
3. Client is transferring to SSI, SSDI, or other income source 1 0.9 100.0
4. Client is working regularly or going to school full-time, and time or place of work or school interfered with attendance at mental health services
19 17.6 95.0
5. Client moved out of program service area 2 1.8 0.0
6. Discontinued treatment due to practical difficulties, including such things as transportation, child care, child health, illness, becoming homeless, raising several young children, or assuming responsibility for more children
3 2.8 0.0
7. Loss of CalWORKs eligibility due to not meeting program require-ments, no longer having eligible children, having timed off welfare, being sanctioned, or declared exempt
12 11.1 16.7
8. No shows for a period of more than 30 days; failed to respond to calls or letters 11 10.2 18.2
9. Other loss of CalWORKs or Medi-Cal eligibility, including becoming eligible for other insurance through a job or marriage 3 2.8 33.3
10. Provider has decided to terminate services due to client non-compliance with treatment requirements or client not having a mental disorder that is a barrier to work
7 6.5 14.3
11. Client still in the program after 1 year 3 2.8 66.7
Total 108 100.0 48.2

Outcomes from the County of Los Angeles 19
be done only with the Group I participants because only for them do we have a wide range of explanatory variables provided by staff ratings both at baseline and discharge.
Appendix 5 shows a model developed from this Phase II Study that investigates the factors associated with working and predicts the likelihood of working based on those factors. The model ended up with only three baseline participant characteristics as statistically significant predictors of working (in addition to the baseline history of work itself). However, it also included six characteristics at discharge. Also shown in Appendix 5 are the predicted proportions of those working for each of these characteristics. The model, in producing an estimate for each characteristic, holds constant the other characteristics. So these predicted characteristics differ from the raw data (which we have seen up to now). The advantage of holding other characteristics constant is that we see the predicted effect of each variable in a way that is more likely to be the effect in other populations (that might have a different set of characteristics). For example, as we will see, there is an effect of time in treatment, but also one for living in your own apartment at baseline. In order to generalize, we need to know the effect of time in treatment regardless of whether the participant lives
in an apartment of their own or has another living arrangement. Below is the list of statistically significant predictors that make up the model. Each variable is a statistically significant predictor of work or no-work during the yearlong study period:
• Baseline work (DPSS data)
• Highcapacitytocareforchildren(staffratingpre)
• Ownapartmentatadmit(staffreportpre)
• White
• Nodomesticabuse(staffratingpre)
• PrimarylanguageSpanish
• Shortertimeintreatment
• Substancemisuse(staffratingpost)
• Highhopeforfutureatdischarge(staffratingpost)
• Less impaired clinical global impressions scalerating (staff rating post)
• Globalassessmentoffunctioningscale(staffratingpost)
While most of these predictors appear to affect work as might be expected, some do not. Although having worked during the baseline is a very good predictor of a participant working in the study year, having a high capacity for caring for her children and living in her own apartment at baseline are seemingly
paradoxical. Both of these “good” characteristics are associated with lower levels of work in the study period. Additionally, participants judged to be clinically normal at baseline using a psychiatric rating scale were less likely to work.43 The other seemingly paradoxical finding is that those with some substance misuse issues are more likely to find employment than those without.45 (See the predicted proportion working for all these predictors in Appendix 5.)
As is also shown in Appendix 5, this model has a pseudo-R2 of .40, a standard measure of a model that fits the data well.46 Another metric is given by graphing how accurately
Figure7:Negativereasonsforleavingtreatmentdonothavealargeimpactoverthefullstudyyear
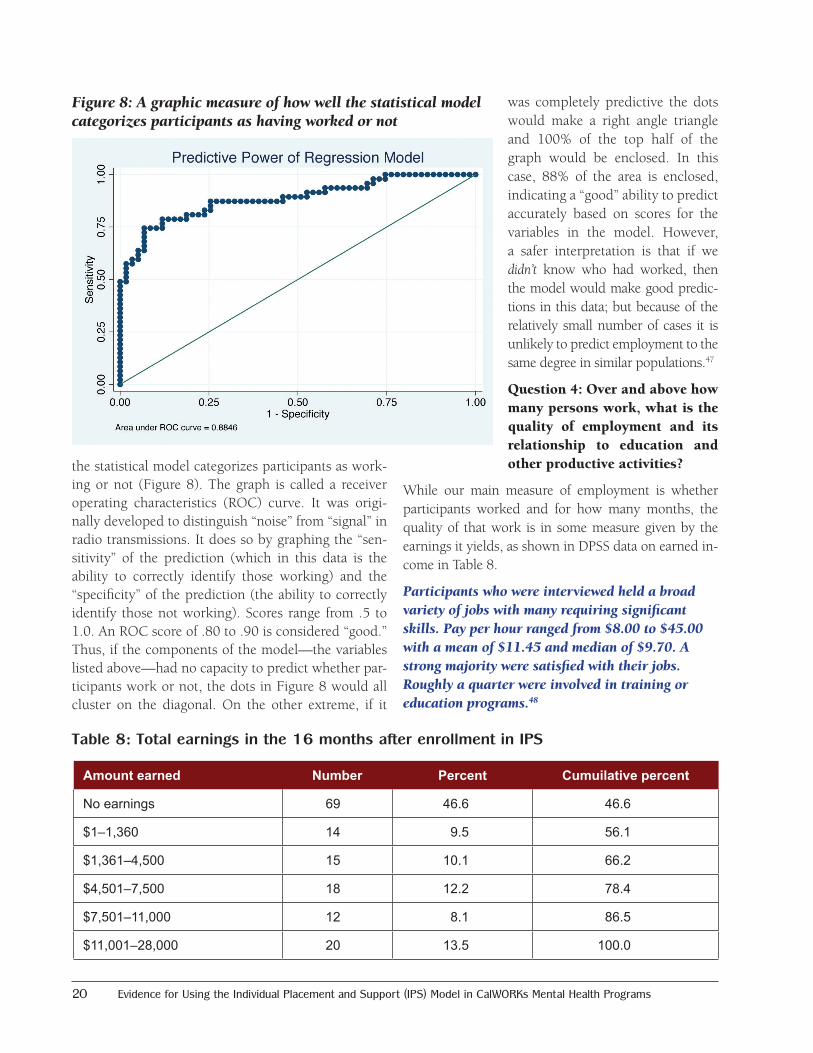
20 Evidence for Using the Individual Placement and Support (IPS) Model in CalWORKs Mental Health Programs
the statistical model categorizes participants as work-ing or not (Figure 8). The graph is called a receiver operating characteristics (ROC) curve. It was origi-nally developed to distinguish “noise” from “signal” in radio transmissions. It does so by graphing the “sen-sitivity” of the prediction (which in this data is the ability to correctly identify those working) and the “specificity” of the prediction (the ability to correctly identify those not working). Scores range from .5 to 1.0. An ROC score of .80 to .90 is considered “good.” Thus, if the components of the model—the variables listed above—had no capacity to predict whether par-ticipants work or not, the dots in Figure 8 would all cluster on the diagonal. On the other extreme, if it
was completely predictive the dots would make a right angle triangle and 100% of the top half of the graph would be enclosed. In this case, 88% of the area is enclosed, indicating a “good” ability to predict accurately based on scores for the variables in the model. However, a safer interpretation is that if we didn’t know who had worked, then the model would make good predic-tions in this data; but because of the relatively small number of cases it is unlikely to predict employment to the same degree in similar populations.47
Question 4: Over and above how many persons work, what is the quality of employment and its relationship to education and other productive activities?
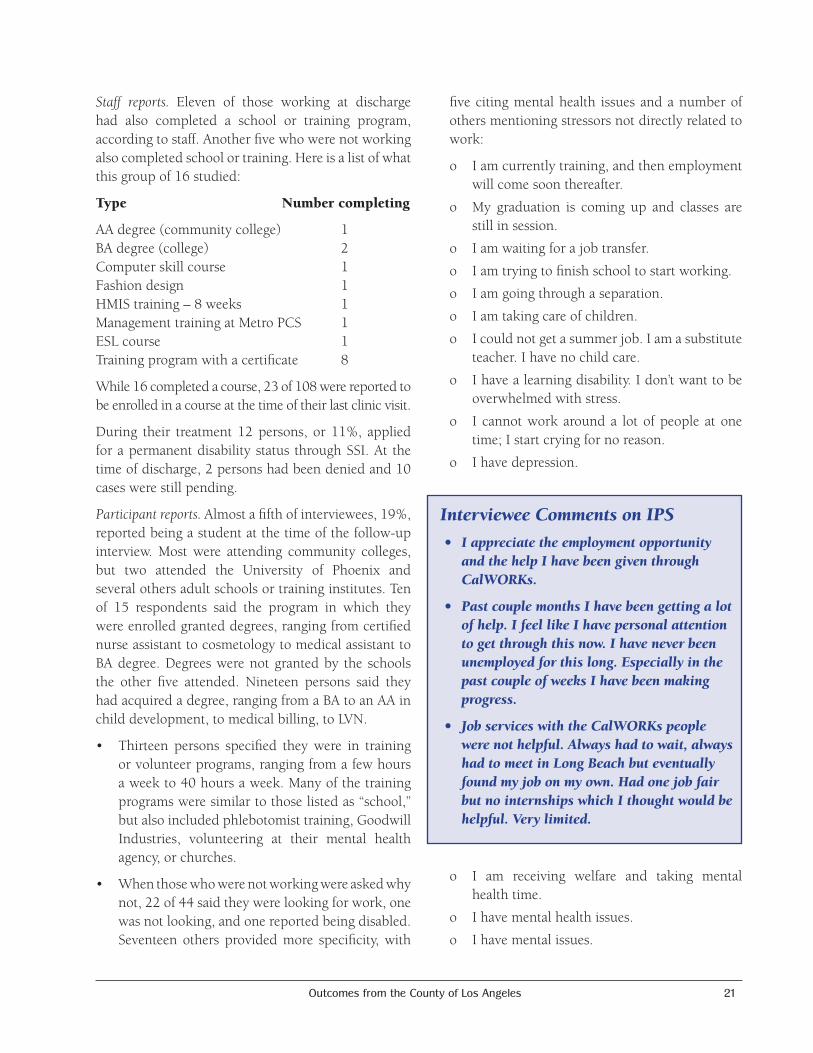
While our main measure of employment is whether participants worked and for how many months, the quality of that work is in some measure given by the earnings it yields, as shown in DPSS data on earned in-come in Table 8.
Participantswhowereinterviewedheldabroadvarietyofjobswithmanyrequiringsignificantskills.Payperhourrangedfrom$8.00to$45.00withameanof$11.45andmedianof$9.70.Astrongmajorityweresatisfiedwiththeirjobs.Roughlyaquarterwereinvolvedintrainingoreducationprograms.48
Table 8: Total earnings in the 16 months after enrollment in IPS
Amount earned Number Percent Cumuilative percent
No earnings 69 46.6 46.6
$1–1,360 14 9.5 56.1
$1,361–4,500 15 10.1 66.2
$4,501–7,500 18 12.2 78.4
$7,501–11,000 12 8.1 86.5
$11,001–28,000 20 13.5 100.0
Figure8:Agraphicmeasureofhowwellthestatisticalmodelcategorizesparticipantsashavingworkedornot
Outcomes from the County of Los Angeles 21
Staff reports. Eleven of those working at discharge had also completed a school or training program, according to staff. Another five who were not working also completed school or training. Here is a list of what this group of 16 studied:
Type Number completing
AA degree (community college) 1BA degree (college) 2Computer skill course 1Fashion design 1HMIS training – 8 weeks 1Management training at Metro PCS 1ESL course 1Training program with a certificate 8
While 16 completed a course, 23 of 108 were reported to be enrolled in a course at the time of their last clinic visit.
During their treatment 12 persons, or 11%, applied for a permanent disability status through SSI. At the time of discharge, 2 persons had been denied and 10 cases were still pending.
Participant reports. Almost a fifth of interviewees, 19%, reported being a student at the time of the follow-up interview. Most were attending community colleges, but two attended the University of Phoenix and several others adult schools or training institutes. Ten of 15 respondents said the program in which they were enrolled granted degrees, ranging from certified nurse assistant to cosmetology to medical assistant to BA degree. Degrees were not granted by the schools the other five attended. Nineteen persons said they had acquired a degree, ranging from a BA to an AA in child development, to medical billing, to LVN.
• Thirteen persons specified theywere in trainingor volunteer programs, ranging from a few hours a week to 40 hours a week. Many of the training programs were similar to those listed as “school,” but also included phlebotomist training, Goodwill Industries, volunteering at their mental health agency, or churches.
• Whenthosewhowerenotworkingwereaskedwhynot, 22 of 44 said they were looking for work, one was not looking, and one reported being disabled. Seventeen others provided more specificity, with
five citing mental health issues and a number of others mentioning stressors not directly related to work:
o I am currently training, and then employment will come soon thereafter.
o My graduation is coming up and classes are still in session.
o I am waiting for a job transfer.
o I am trying to finish school to start working.
o I am going through a separation.
o I am taking care of children.
o I could not get a summer job. I am a substitute teacher. I have no child care.
o I have a learning disability. I don’t want to be overwhelmed with stress.
o I cannot work around a lot of people at one time; I start crying for no reason.
o I have depression.
o I am receiving welfare and taking mental health time.
o I have mental health issues.
o I have mental issues.
IntervieweeCommentsonIPS
• IappreciatetheemploymentopportunityandthehelpIhavebeengiventhroughCalWORKs.
• PastcouplemonthsIhavebeengettingalotofhelp.IfeellikeIhavepersonalattentiontogetthroughthisnow.Ihaveneverbeenunemployedforthislong.EspeciallyinthepastcoupleofweeksIhavebeenmakingprogress.
• JobserviceswiththeCalWORKspeoplewerenothelpful.Alwayshadtowait,alwayshadtomeetinLongBeachbuteventuallyfoundmyjobonmyown.HadonejobfairbutnointernshipswhichIthoughtwouldbehelpful.Verylimited.
22 Evidence for Using the Individual Placement and Support (IPS) Model in CalWORKs Mental Health Programs
o I moved.
o I was recently homeless.
o My knees hurt too much.
o I cannot stand or walk for long because of feet problems.
• More than30%of the46 intervieweeswhohadworked during the study period found their current or most recent job on their own, with 13% crediting the IPS program. Only two persons mentioned GAIN or the welfare department. Friends were common sources of jobs.
• Askedtospecifythenameofthejob,averydiverselist was mentioned including working at a health club, caregiving, work at a hotel, a senior center, a Salvation Army facility, a pawn shop, a pizza parlor, massage therapy, a barbeque restaurant, the City of Covina, Taco Bell, being a house cleaner, a PBX phone operator in a business, and various retail establishments.
• For 16 of 46 persons who worked during thestudy period, work at the most recent job involved a 40-hour week; four persons worked more than that, 12 worked between 20 and 40 hours, and nine worked less than 20 hours a week.
• Thirty-eight persons disclosed their most recenthourly wage. The range was $8.00 to $45.00, with the median being $9.70 and the mean $11.45 (standard deviation $6.41).
• The34personsworkingatthetimeofthefollow-up interview answered a question about how many jobs they currently held. Thirty reported one, two persons reported holding two jobs, and two others said they had three or more.
• Whenaskedtoreporthowmuchtimetheyspendtraveling to their current or most recent job during the study period, the range was from 0 (working at home) to 120 minutes, with a median of 30, a mean of 41.6, and a standard deviation of 33.4.
• Asked how satisfied they were with the currentor most recent job in the study period, 37% said
“extremely,” 22% said “considerably,” 26% said “moderately,” and the other 15% were only slightly satisfied or not at all.
Question 5: Among good fidelity program participants, are therapeutic goals met along with employment goals?
Here we ask whether focusing on employment compromises, enhances, or is independent of clinical improvement?49
Baselinementalstatusdoesnotappeartopredictemploymentduringtreatment.
We used logistic regression modeling to see if baseline mental health status predicted employment at discharge (or during treatment). Baseline psychiatric status as rated by staff (with other covariates held constant: health, homeless status, SSI application, staff judgment of capacity to work, and reason for leaving treatment) was not a statistically significant predictor of employment success.50 Baseline ratings of the participant self-report mental health scales, the K10 and the RAS, were also not associated with the likelihood of current work at follow-up.
Scoresonstaff-ratedandintervieweementalhealthscalesincreaseduptodischarge,buttherelation-shipofthesechangestoemploymentiscomplex.
When IPS-supported employment programs began in the 1990s, most participants had previously been served in day treatment. Many clinicians were concerned that an employment program—supported or not—would be stressful and cause clinical deterioration among participants. Several studies showed this was not the case.
A related concern arises in the CalWORKs context: how does a coordinated focus on employment and psychiatric disability affect both employment and psychiatric status? And are rates of improvement parallel?51
TheincreaseinGlobalAssessmentofFunctioning(GAF)andClinicalGlobalImpressions(CGI)scoresatfollow-upwasmodestforthosewhowereintreatmentlessthansixmonths,butsubstantialforthoseintreatmentlonger.
Outcomes from the County of Los Angeles 23
The staff reports include two measures of psychiatric status.52 We computed change scores for both. Overall, the GAF showed a 6-point improvement on a 100-point scale. The CGI showed a .73 improvement on a 5-point scale.53 The changes from baseline to discharge on both scales were statistically significant over time.54 And there were “moderate” effect sizes55 of .56 for the GAF scale and a near “large” effect size for the CGI of .72.
We saw above that employment rates at discharge were nearly identical regardless of how long participants had stayed in the program. This is not true of psychiatric sta-tus, which improved over time. The exit GAF score in-creased over the entrance GAF score by 2.7 points for the first quartile (up to 112 days in treatment), by 2.4 points for the second quartile (113–196 days), by 6.3 points for the third quartile (197–286 days), and by 12.3 points for those in the fourth quartile (more than 286 days).
ImprovementinGAFscoredoesnothaveastatisti-callysignificanteffectontheemploymentrateshowninDPSSdataeitherinitselforwheninteractedwithtimeintreatment.TheCGIchangeisalsonotassoci-atedwithachangeinemploymentrate.
There appear to be two time clocks: one clock for time to getting a job and the other a clock measuring time to improved psychiatric status. They are not synchronous: time in treatment has a limited effect on success in finding a job but a big impact on psychiatric improvement.
Staffreportthatsimplyworkingincreasedmentalhealthstatusforsome.Similarly,amongthosenotworkingatbaseline,GAFscoresincreasedtwiceasmuchforthosewhoworkedduringthestudyperiodasforthosewhodidnot.Asimilareffectwasfoundfortheself-reportK10scaleamonginterviewees.
Lack of employment has been found in other studies to cause “poorer mental health and psychological well-being, more psychological distress, [and] minor psychological/psychiatric morbidity.”56 So simply getting a job and working can have the effect of alleviating symptoms. This is an effect that has been documented in a variety of studies.57 For a number of years CalWORKs mental health staff have noted that participants frequently stop treatment when they find work. In this study, staff judged the capacity to work to have declined for one person, stayed the same for 13, and improved for 94 by discharge. When participants were discharged, staff offered comments to explain how and why their rating of client capacity to work had changed. Several of these noted positive changes due to working, as indicated in these representative remarks:
• AlthoughclientismonolingualSpanish,shecom-prehends English well and is currently in a CNA training program. Symptoms improved once cli-ent was accepted to training program, since she wants a career as a CNA.
• Clientdemonstratedexcellentworkperformanceonce she began working.
• Clientidentifiedworkastherapyforher(keptheraway from depressive symptoms of isolation).
• Clientovercamepersonalfearsandgainedconfi-dence once she began working.
• Client’s symptomswerebeing aggravateddue tobeing unemployed. Client’s symptoms decreased as soon as he knew he obtained employment.
Intervieweecommentsontreatment
• Iamgood.IfeelmymindisbeingdevelopedandfeelalotbetterthanwhenIstartedmytherapy.Feelalotofreliefaftergoingtothesetalks.
• Iwasdoingreallybad,butwhenIstartedcounselingwiththementalhealthagencyitchangedmywholeperspectiveonmysituation.WithoutthatIwouldnotbeinthesituationthatIaminnow.
• Iwouldliketothankthem.Theyhavehelpedmealot.IgotwhatIwantedtogainoutoftheprogram.TheyhelpedmealotwiththesituationoflifethatIwasnotpreparedfor.
• Theyreallyhelpedmethroughabadtimeofmylife.WasareallypositiveexperienceandI’mgladthatIwasapartofit.
24 Evidence for Using the Individual Placement and Support (IPS) Model in CalWORKs Mental Health Programs
• Havingastable,fixed-schedule jobhelpedclientimprove client’s capacity to work.
• Moodhasimprovedsincestartedworking.
• Noticeablethatsymptomsofdepressiondecreasedonce participant started working.
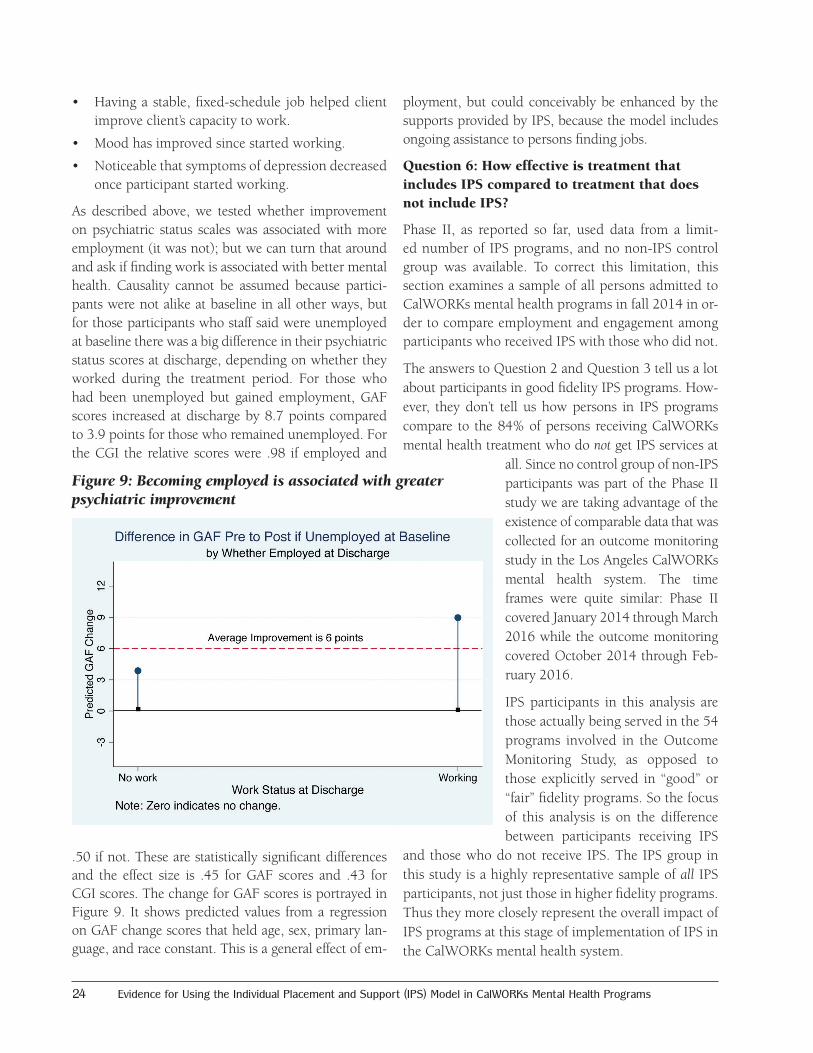
As described above, we tested whether improvement on psychiatric status scales was associated with more employment (it was not); but we can turn that around and ask if finding work is associated with better mental health. Causality cannot be assumed because partici-pants were not alike at baseline in all other ways, but for those participants who staff said were unemployed at baseline there was a big difference in their psychiatric status scores at discharge, depending on whether they worked during the treatment period. For those who had been unemployed but gained employment, GAF scores increased at discharge by 8.7 points compared to 3.9 points for those who remained unemployed. For the CGI the relative scores were .98 if employed and
.50 if not. These are statistically significant differences and the effect size is .45 for GAF scores and .43 for CGI scores. The change for GAF scores is portrayed in Figure 9. It shows predicted values from a regression on GAF change scores that held age, sex, primary lan-guage, and race constant. This is a general effect of em-
ployment, but could conceivably be enhanced by the supports provided by IPS, because the model includes ongoing assistance to persons finding jobs.
Question 6: How effective is treatment that includes IPS compared to treatment that does not include IPS?
Phase II, as reported so far, used data from a limit-ed number of IPS programs, and no non-IPS control group was available. To correct this limitation, this section examines a sample of all persons admitted to CalWORKs mental health programs in fall 2014 in or-der to compare employment and engagement among participants who received IPS with those who did not.
The answers to Question 2 and Question 3 tell us a lot about participants in good fidelity IPS programs. How-ever, they don’t tell us how persons in IPS programs compare to the 84% of persons receiving CalWORKs mental health treatment who do not get IPS services at
all. Since no control group of non-IPS participants was part of the Phase II study we are taking advantage of the existence of comparable data that was collected for an outcome monitoring study in the Los Angeles CalWORKs mental health system. The time frames were quite similar: Phase II covered January 2014 through March 2016 while the outcome monitoring covered October 2014 through Feb-ruary 2016.
IPS participants in this analysis are those actually being served in the 54 programs involved in the Outcome Monitoring Study, as opposed to those explicitly served in “good” or “fair” fidelity programs. So the focus of this analysis is on the difference between participants receiving IPS
and those who do not receive IPS. The IPS group in this study is a highly representative sample of all IPS participants, not just those in higher fidelity programs. Thus they more closely represent the overall impact of IPS programs at this stage of implementation of IPS in the CalWORKs mental health system.
Figure9:Becomingemployedisassociatedwithgreaterpsychiatricimprovement
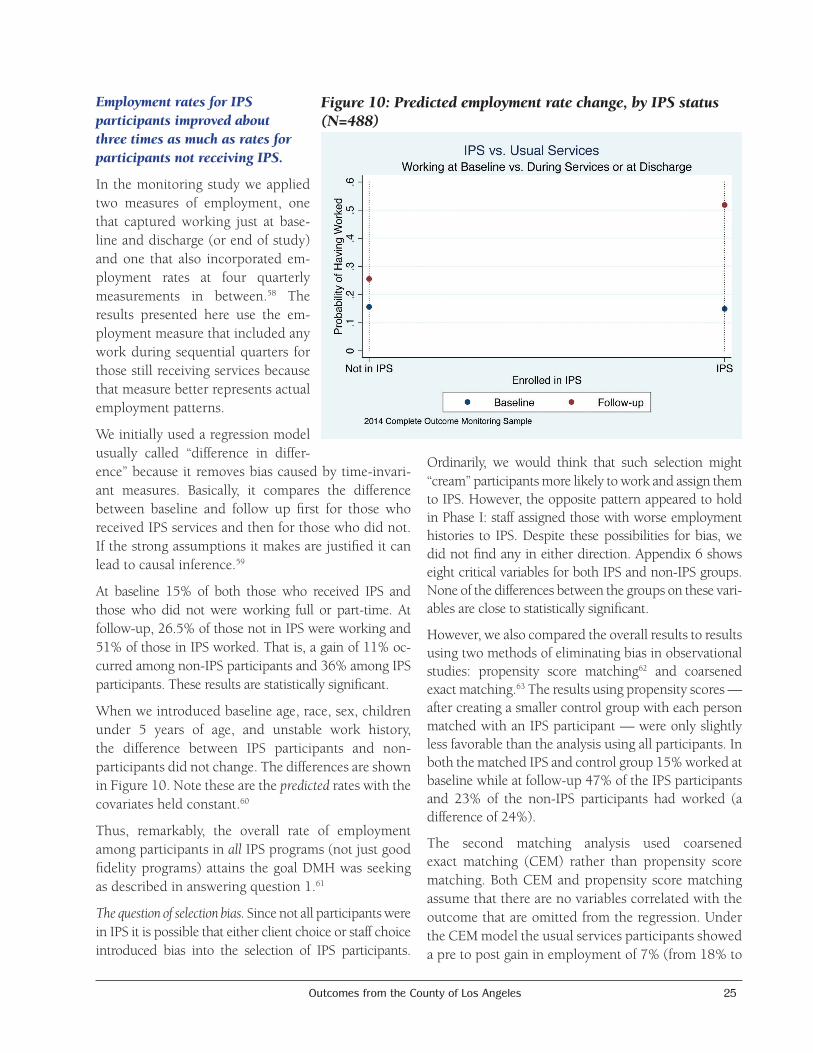
Outcomes from the County of Los Angeles 25
EmploymentratesforIPSparticipantsimprovedaboutthreetimesasmuchasratesforparticipantsnotreceivingIPS.
In the monitoring study we applied two measures of employment, one that captured working just at base-line and discharge (or end of study) and one that also incorporated em-ployment rates at four quarterly measurements in between.58 The results presented here use the em-ployment measure that included any work during sequential quarters for those still receiving services because that measure better represents actual employment patterns.
We initially used a regression model usually called “difference in differ-ence” because it removes bias caused by time-invari-ant measures. Basically, it compares the difference between baseline and follow up first for those who received IPS services and then for those who did not. If the strong assumptions it makes are justified it can lead to causal inference.59
At baseline 15% of both those who received IPS and those who did not were working full or part-time. At follow-up, 26.5% of those not in IPS were working and 51% of those in IPS worked. That is, a gain of 11% oc-curred among non-IPS participants and 36% among IPS participants. These results are statistically significant.
When we introduced baseline age, race, sex, children under 5 years of age, and unstable work history, the difference between IPS participants and non-participants did not change. The differences are shown in Figure 10. Note these are the predicted rates with the covariates held constant.60
Thus, remarkably, the overall rate of employment among participants in all IPS programs (not just good fidelity programs) attains the goal DMH was seeking as described in answering question 1.61
The question of selection bias. Since not all participants were in IPS it is possible that either client choice or staff choice introduced bias into the selection of IPS participants.
Ordinarily, we would think that such selection might “cream” participants more likely to work and assign them to IPS. However, the opposite pattern appeared to hold in Phase I: staff assigned those with worse employment histories to IPS. Despite these possibilities for bias, we did not find any in either direction. Appendix 6 shows eight critical variables for both IPS and non-IPS groups. None of the differences between the groups on these vari-ables are close to statistically significant.
However, we also compared the overall results to results using two methods of eliminating bias in observational studies: propensity score matching62 and coarsened exact matching.63 The results using propensity scores —after creating a smaller control group with each person matched with an IPS participant — were only slightly less favorable than the analysis using all participants. In both the matched IPS and control group 15% worked at baseline while at follow-up 47% of the IPS participants and 23% of the non-IPS participants had worked (a difference of 24%).
The second matching analysis used coarsened exact matching (CEM) rather than propensity score matching. Both CEM and propensity score matching assume that there are no variables correlated with the outcome that are omitted from the regression. Under the CEM model the usual services participants showed a pre to post gain in employment of 7% (from 18% to
Figure10:Predictedemploymentratechange,byIPSstatus(N=488)
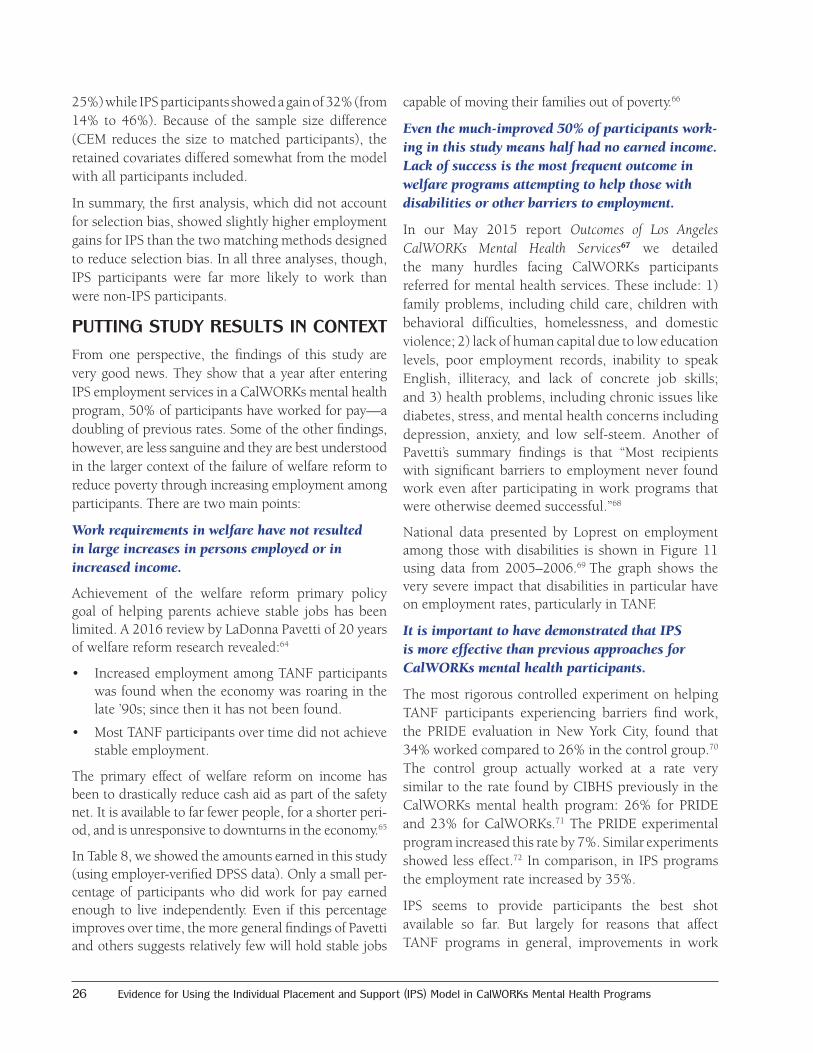
26 Evidence for Using the Individual Placement and Support (IPS) Model in CalWORKs Mental Health Programs
25%) while IPS participants showed a gain of 32% (from 14% to 46%). Because of the sample size difference (CEM reduces the size to matched participants), the retained covariates differed somewhat from the model with all participants included.
In summary, the first analysis, which did not account for selection bias, showed slightly higher employment gains for IPS than the two matching methods designed to reduce selection bias. In all three analyses, though, IPS participants were far more likely to work than were non-IPS participants.
PUTTING STUDY RESULTS IN CONTEXTFrom one perspective, the findings of this study are very good news. They show that a year after entering IPS employment services in a CalWORKs mental health program, 50% of participants have worked for pay—a doubling of previous rates. Some of the other findings, however, are less sanguine and they are best understood in the larger context of the failure of welfare reform to reduce poverty through increasing employment among participants. There are two main points:
Workrequirementsinwelfarehavenotresultedinlargeincreasesinpersonsemployedorinincreasedincome.
Achievement of the welfare reform primary policy goal of helping parents achieve stable jobs has been limited. A 2016 review by LaDonna Pavetti of 20 years of welfare reform research revealed:64
• IncreasedemploymentamongTANFparticipantswas found when the economy was roaring in the late ’90s; since then it has not been found.
• MostTANFparticipantsovertimedidnotachievestable employment.
The primary effect of welfare reform on income has been to drastically reduce cash aid as part of the safety net. It is available to far fewer people, for a shorter peri-od, and is unresponsive to downturns in the economy.65
In Table 8, we showed the amounts earned in this study (using employer-verified DPSS data). Only a small per-centage of participants who did work for pay earned enough to live independently. Even if this percentage improves over time, the more general findings of Pavetti and others suggests relatively few will hold stable jobs
capable of moving their families out of poverty.66
Eventhemuch-improved50%ofparticipantswork-inginthisstudymeanshalfhadnoearnedincome.Lackofsuccessisthemostfrequentoutcomeinwelfareprogramsattemptingtohelpthosewithdisabilitiesorotherbarrierstoemployment.
In our May 2015 report Outcomes of Los Angeles CalWORKs Mental Health Services67 we detailed the many hurdles facing CalWORKs participants referred for mental health services. These include: 1) family problems, including child care, children with behavioral difficulties, homelessness, and domestic violence; 2) lack of human capital due to low education levels, poor employment records, inability to speak English, illiteracy, and lack of concrete job skills; and 3) health problems, including chronic issues like diabetes, stress, and mental health concerns including depression, anxiety, and low self-steem. Another of Pavetti’s summary findings is that “Most recipients with significant barriers to employment never found work even after participating in work programs that were otherwise deemed successful.”68
National data presented by Loprest on employment among those with disabilities is shown in Figure 11 using data from 2005–2006.69 The graph shows the very severe impact that disabilities in particular have on employment rates, particularly in TANF.
ItisimportanttohavedemonstratedthatIPSismoreeffectivethanpreviousapproachesforCalWORKsmentalhealthparticipants.
The most rigorous controlled experiment on helping TANF participants experiencing barriers find work, the PRIDE evaluation in New York City, found that 34% worked compared to 26% in the control group.70 The control group actually worked at a rate very similar to the rate found by CIBHS previously in the CalWORKs mental health program: 26% for PRIDE and 23% for CalWORKs.71 The PRIDE experimental program increased this rate by 7%. Similar experiments showed less effect.72 In comparison, in IPS programs the employment rate increased by 35%.
IPS seems to provide participants the best shot available so far. But largely for reasons that affect TANF programs in general, improvements in work
Outcomes from the County of Los Angeles 27
and income associated with IPS are not sufficient to create economic independence for a high proportion of CalWORKs mental health participants.
Program success such as demonstrated by IPS still needs to be supplemented by new approaches from policymakers in Washington to help TANF participants who face mental health and other barriers to independence. For example, Sheldon Danziger and colleagues have proposed the following changes to TANF: increased employer subsidies for creating
work opportunities for TANF participants; increased child care subsidies; changes in the block grant to make cash assistance accessible to a larger percentage of eligible parents, particularly during recessions; and the provision of new part-time or temporary disability benefits for those with significant employment barriers.73 The result of a failure to re-think safety net provisions for those with barriers is likely to be a further increase in deep poverty—which has more than doubled since TANF began.74
Figure11:Nationaldataonthosecurrentlyemployedbydisabilityandpopulationgroup:Reprintedfrom“DisabilitiesAmongTANFRecipients:EvidenceFromtheNHIS”

28 Evidence for Using the Individual Placement and Support (IPS) Model in CalWORKs Mental Health Programs
Endnotes1 The principles of IPS are listed in the textbox on this
page. They summarize the full statement found at: https://www.dartmouth.edu/~ips/page48/page79/files/ips-practice-principles-002880029.pdf
The principles preclude many common practices in employment services for persons with disabilities, such as finding jobs in non-competitive or sheltered settings, focusing for long periods on job “readiness,” selecting only the most functional participants for employment services, and geographically separating employment staff from treatment staff.
2 Six programs had their own version of employment services, so were initially not required to have supported employment.
3 Chandler, D., Meisel, J., & Jordan, P. (2007, June). Improving mental health outcomes for CalWORKs participants in Los Angeles County. Sacramento: California Institute for Mental Health, 2030 J Street, Sacramento, CA 95814. The same data were used for the peer-reviewed article: Chandler, D. C. (2011). Work therapy: Welfare reform and mental health in California. Social Service Review, 85(1), 109–33.
4 The initial requirement was for “supported employment.” However, the Los Angeles County Department of Mental Health has urged programs to implement the evidenced-based Individual Placement and Support (IPS) model. In 20 randomized control trials, the mean rate of competitive employment for individuals receiving IPS services was 58%. In these studies, those not receiving IPS services had an average rate of 24%. Most CalWORKs mental health programs implemented the IPS model voluntarily, and IPS has now been made a contract requirement.
5 Marrone, J., Foley, S., & Selleck, V. (2005). How mental health and welfare to work interact: The role of hope, sanctions, engagement, and support. American Journal of Psychiatric Rehabilitation, 8(1), 81–101.
6 In recent years IPS has been used with young people having their first episode of schizophrenia or other serious mental illness. In some ways these young people are similar to parts of the CalWORKs population in that they are just starting their work life or are wanting to re-engage with school. In some cases they may be
able to work and thus avoid depending on SSI. IPS is particularly important in making that possible.
7 “Statistically significant” means we formulate a “null” hypothesis that between-group differences actually reflect random differences in the population. Confusingly, the null hypothesis is what we wish to disprove. Being statistically significant means there is evidence to reject the null hypothesis that differences are only random. A “p-value” of 0.05, a common standard, means there is only a 1 in 20 chance the differences in our sample arose through random processes from a population in which the true differences are minimal. Being statistically significant does not tell us anything about the strength of an association nor about the practical utility of a difference of the size found. In recent years the whole concept of statistical significance has been widely questioned. See for example, Greenland, S., Senn, S. J., Rothman, K. J., Carlin, J. B., Poole, C., Goodman, S. N., & Altman, D. G. (2016). Statistical tests, P values, confidence intervals, and power: a guide to misinterpretations. European Journal of Epidemiology, 31, 337–350. http://doi.org/10.1007/s10654-016-0149-3. We find statistical significance still to be useful since it does indicate an unusual result. We also try to show confidence intervals and to portray differences graphically as most people can judge for themselves what is substantively significant. We also sometimes report an “effect size” measure which, unlike statistical significance, is not dependent on sample size (see footnote 52).
8 Bond, G. R., Peterson, A. E., Becker, D. R., & Drake, R. E. (2012). Validation of the revised individual placement and support fidelity scale (IPS-25). Psychiatric Services, 63(8), 758–763.
9 Chandler, D. C. (2011). Work therapy: Welfare reform and mental health in California. Social Service Review, 85(1), 109–33.
10 See the resources available at the developers’ website: http://www.dartmouth.edu/~ips/page19/page19.html
11 Chandler, D. (2016, July) CalWORKs mental health outcome monitoring: Implementation and demonstration study. Sacramento: California Institute for Behavioral Health Solutions. Available for download at: http://www.cibhs.org/calworks
12 CIBHS has a separate contract with Los Angeles County DPSS that regulates use and security of the DPSS data.

Outcomes from the County of Los Angeles 29
13 Since the only purpose of including the “fair fidelity” programs was to use DPSS employment data to compare employment rates with “good fidelity” programs, we did not collect staff or participant data for the “fair fidelity” programs.
14 How accurate are DPSS’s administrative data on income? Mistakes are possible. Welfare rules on income reporting are complicated and may be difficult to follow if jobs are low wage and unstable. Or women may live with a partner who does not tell them about their earnings or forbids them to report them. Swan, RS.; Shaw, Linda L.; Cullity, Sharon; Halpern, Joni; Humphrey, Juliana; Limbert, Wendy M.; & Roche, Mary. (2008). The untold story of welfare fraud. Journal of Sociology & Social Welfare, 35(3, article 8). Available at: http://scholarworks.wmich.edu/jssw/vol35/iss3/8. Some participation in the large L.A. shadow economy is also possible. However, “data integrity” for the income data we use is critical to the mission of DPSS, so a great deal of effort is expended on achieving low error rates, including the use of approximately 110 Los Angeles County investigators who annually find 5,000 to 8,000 fraud cases out of about 4 million recipients of food stamps, CalWORKs, or Medi-Cal (http://dpss.lacounty.gov/wps/portal/dpss/main/programs-and-services/welfare-fraud-prevention-and-investigation/). In general, we believe that DPSS income reports are considerably more reliable than those obtained in research that relies only on participant reports. (Participant surveys typically under-report income compared to administrative data: Moore, J. C., Stinson, L. L., & Welniak, E. J. [2000]. Income measurement error in surveys: A review. Journal of Official Statistics, 16[4], 331–361. Available at: https://www.census.gov/srd/papers/pdf/sm97-05.pdf). In any case, these data are the currency in which the case must be made that IPS is effective, since DPSS funds CalWORKs mental health programs. Nonetheless, we also report staff and participant information on incomes because (a) it covers specific time frames of interest and (b) we obtain much more detail about the nature of the jobs than is available through DPSS data.
15 Because participants entered programs over time rather than all at once, we have converted chronological months to study months that count back 6 months from enrollment (baseline) and count out 16 months from enrollment (follow-up).
16 Op cit. Chandler, D. (2016, July). CalWORKs mental health outcome monitoring: Implementation and demonstration study. Available for download at: http://www.cibhs.org/calworks
17 The second Children’s Institute site was not enrolled in the study until very late, December 2015. Only two participants were enrolled. Unfortunately, during the study period the program experienced fidelity that was in the “Fair” range.
18 The Statement of Work in 2011 did not specify the IPS model of supported employment. The 2017 SOW will specify IPS.
19 At the time of the baseline study, the unemployment rate in Los Angeles County was 6.5% (in February 2004) and 6.0% (in February 2005). For this study, the unemployment rate in February 2015 was 7.4% and in 2016 it was 5.4%. Statistics are from the United States Department of Labor, Local Area Unemployment Statistics Map which gives county data by year and month. https://www.bls.gov/data/
20 Many studies have shown IPS-supported employment to produce higher employment rates than usual services or other employment models. A recent multisite study of more than 2,000 participants found IPS participants had an employment rate of 60% vs. 40% for the randomized control group. Drake, R. E., Frey, W., Bond, G. R., Goldman, H. H., Salkever, D., Miller, A., Moore T., A., Riley, J., Karakus, M., & Milfort R. (2013). Assisting Social Security Disability Insurance beneficiaries with schizophrenia, bipolar disorder, or major depression in returning to work. American Journal of Psychiatry 170(12), 1433–41. doi:10.1176/appi.ajp.2013.13020214. In 11 randomized trials, the competitive employment rate was 61% for IPS, compared to 23% for controls. See Bond, G. R., Drake, R. E., & Becker, D. R. (2008). An update on randomized controlled trials of evidence-based supported employment. Psychiatric Rehabilitation Journal, 31(4), 280–90. However, as Table 1 demonstrates, employment rates less than 50% were found in one multi-site study. The explanation for the difference, as noted earlier, is that the higher rates measure employment in a study period, which might range from 6 months to multiple years. The lower rates reflect employment (at least one day) within a quarter.

30 Evidence for Using the Individual Placement and Support (IPS) Model in CalWORKs Mental Health Programs
21 While the required rate is 50% working (in general) 30 hours a week, states are given credit for caseload reductions, so many states have actual work participation rates as low as 15–30%. See report by Elizabeth Basch: http://www.clasp.org/resources-and-publications/publication-1/TANF-101-Work-Participation-Rate.pdf, accessed Feb. 6, 2017.
22 Using the DPSS 16-month data, we compared the rate of having worked among Group I participants with a follow-up interview with the rate among all Group I participants. For the total group the rate was 50.9% while for those who had a follow-up interview it was 53.8%. Although the dates don’t correspond exactly, the comparison gives us confidence in the reliability of the interviewees.
23 Since DPSS data cover a whole calendar month we have no way to apportion partial months that result when a person enrolled in IPS in mid-month. Therefore the actual month of enrollment is not counted as either baseline or study period.
24 Note that these rates apply to Group I participants, for whom we have staff ratings; for Group II we have only the DPSS data and provider. We use the term “approximate” because the study period does not map exactly to the DPSS months. So for example, we don’t use data from the month of enrollment because enrollment could have occurred on day 1 or day 31. Another issue when calculating the employment rate within the period of enrollment to 6 months after discharge is that for the few participants who entered midway in the enrollment period and who were in treatment around a year, the time period needed exceeds the time available in the data. So the table that shows the discharge plus 6 months rate has an N of 97 rather than 106.
25 All 148 were present in the DPSS data for all 16 months. During the baseline all were present for at least 4 months, and a few had no data in the 5th and 6th months prior to IPS enrollment. See Appendix 3 on DPSS data.
26 The small difference is not at all close to being statistically significant: p<0.97.
27 The statistical significance of group interacted with time (pre-post) was modeled using longitudinal logistic regression in Stata 14.2 with age, sex, race, and primary language as controls. The interaction was not significant: p<0.57.
28 P=0.001
29 These unmeasured variables probably include measures associated with different providers. See the end of the section dealing with question 3 for information about differences by provider.
30 Chandler, D., Meisel, J., & Jordan, P. (2002). Effects on
employment and welfare tenure after one year. Sacramento: California Institute for Mental Health. Stellmack, A. L., & Wanberg, C. R. (2000, December). Predictors
of success at leaving the Minnesota Family Investment
Program. Minneapolis: University of Minnesota Center for Regional and Urban Affairs (CURA). Accessed February 6, 2017 at: http://www.cura.umn.edu/sites/cura.advantagelabs.com/files/publications/30-4-Stellmack-Wanberg.pdf
31 P=0.27
32 As noted earlier, a critical factor is how the employment rate is measured. In Table 1 we see rates of 39% and 44% for good and exemplary IPS programs. That is the percentage of persons who worked at least one day in a quarter. More typically, studies cite a rate that is based on working at any time in the follow-up period, which varies widely up to five years. In these studies the rate for IPS is 60% or higher.
33 The race and ethnicity variables supplied by DPSS are inaccurate with respect to Latinos. Fewer Latinos are shown than are recorded as having Spanish as primary language.
34 However, since we have 18 monthly data points for each person, statistical power is higher than with a simple pre-post design.
35 Results are similar if we use the measure of employment that focuses only on whether a participant was working at discharge. Of those working, 43% were working full time and another 32% worked at least 20 hours a week. One person worked competitively but got an extra stipend; in one other case the employer got a stipend for employing the client.
36 P=0.04
37 Only those leaving after more than 286 days are not different to a statistically significant degree from the other groups regarding employment.
38 P=0.07
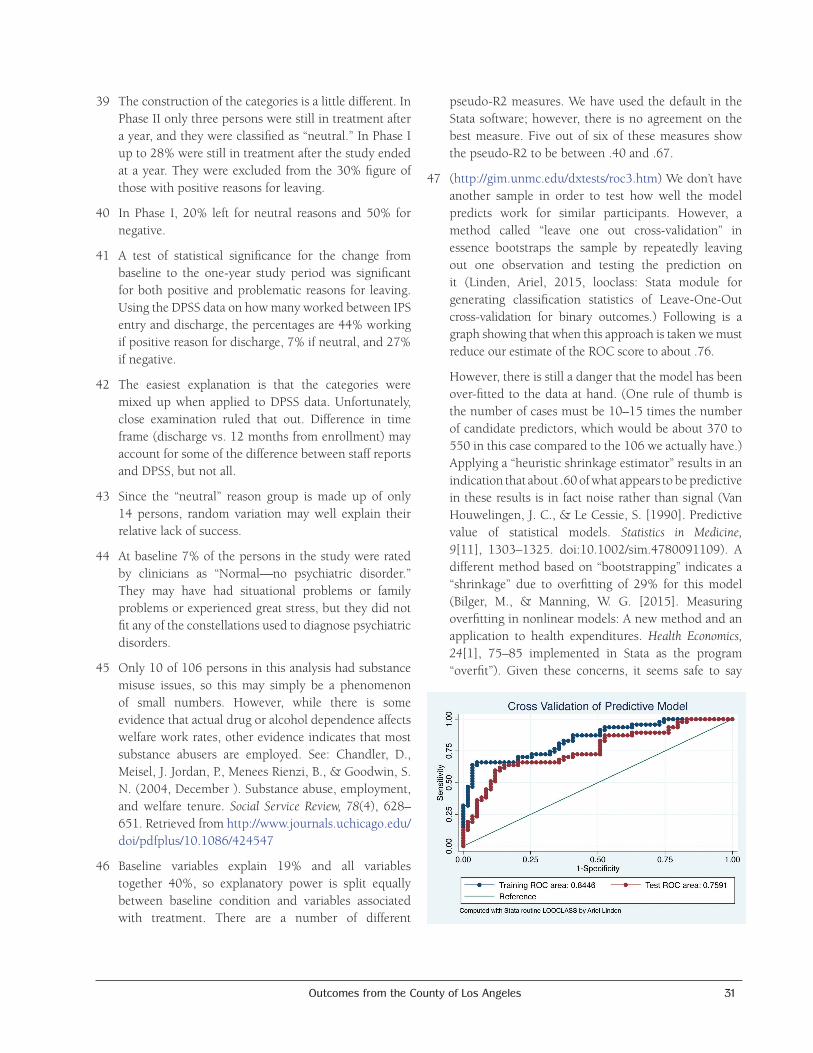
Outcomes from the County of Los Angeles 31
39 The construction of the categories is a little different. In Phase II only three persons were still in treatment after a year, and they were classified as “neutral.” In Phase I up to 28% were still in treatment after the study ended at a year. They were excluded from the 30% figure of those with positive reasons for leaving.
40 In Phase I, 20% left for neutral reasons and 50% for negative.
41 A test of statistical significance for the change from baseline to the one-year study period was significant for both positive and problematic reasons for leaving. Using the DPSS data on how many worked between IPS entry and discharge, the percentages are 44% working if positive reason for discharge, 7% if neutral, and 27% if negative.
42 The easiest explanation is that the categories were mixed up when applied to DPSS data. Unfortunately, close examination ruled that out. Difference in time frame (discharge vs. 12 months from enrollment) may account for some of the difference between staff reports and DPSS, but not all.
43 Since the “neutral” reason group is made up of only 14 persons, random variation may well explain their relative lack of success.
44 At baseline 7% of the persons in the study were rated by clinicians as “Normal—no psychiatric disorder.” They may have had situational problems or family problems or experienced great stress, but they did not fit any of the constellations used to diagnose psychiatric disorders.
45 Only 10 of 106 persons in this analysis had substance misuse issues, so this may simply be a phenomenon of small numbers. However, while there is some evidence that actual drug or alcohol dependence affects welfare work rates, other evidence indicates that most substance abusers are employed. See: Chandler, D., Meisel, J. Jordan, P., Menees Rienzi, B., & Goodwin, S. N. (2004, December ). Substance abuse, employment, and welfare tenure. Social Service Review, 78(4), 628–651. Retrieved from http://www.journals.uchicago.edu/doi/pdfplus/10.1086/424547
46 Baseline variables explain 19% and all variables together 40%, so explanatory power is split equally between baseline condition and variables associated with treatment. There are a number of different
pseudo-R2 measures. We have used the default in the Stata software; however, there is no agreement on the best measure. Five out of six of these measures show the pseudo-R2 to be between .40 and .67.
47 (http://gim.unmc.edu/dxtests/roc3.htm) We don’t have another sample in order to test how well the model predicts work for similar participants. However, a method called “leave one out cross-validation” in essence bootstraps the sample by repeatedly leaving out one observation and testing the prediction on it (Linden, Ariel, 2015, looclass: Stata module for generating classification statistics of Leave-One-Out cross-validation for binary outcomes.) Following is a graph showing that when this approach is taken we must reduce our estimate of the ROC score to about .76.
However, there is still a danger that the model has been over-fitted to the data at hand. (One rule of thumb is the number of cases must be 10–15 times the number of candidate predictors, which would be about 370 to 550 in this case compared to the 106 we actually have.) Applying a “heuristic shrinkage estimator” results in an indication that about .60 of what appears to be predictive in these results is in fact noise rather than signal (Van Houwelingen, J. C., & Le Cessie, S. [1990]. Predictive value of statistical models. Statistics in Medicine, 9[11], 1303–1325. doi:10.1002/sim.4780091109). A different method based on “bootstrapping” indicates a “shrinkage” due to overfitting of 29% for this model (Bilger, M., & Manning, W. G. [2015]. Measuring overfitting in nonlinear models: A new method and an application to health expenditures. Health Economics, 24[1], 75–85 implemented in Stata as the program “overfit”). Given these concerns, it seems safe to say

32 Evidence for Using the Individual Placement and Support (IPS) Model in CalWORKs Mental Health Programs
that the variables in the regression model are the factors associated with work found in these data and that these variables would be a useful starting place for predicting who would be likely to work in a different sample.
48 The importance of involvement in education is due to welfare reform studies that compared the long-range outcome of “work first” approaches like that in Riverside County with approaches emphasizing training and education. The Riverside results appear in retrospect to have been due to a very strong temporary local employment market. Results after six years favor the training and education used in other counties. See the review article. See Ziliak, J. P. (2016, November). Temporary assistance for needy families. In R. A. Moffitt (Ed.), Economics of means-tested transfer programs in the United States, Volume 1. Chicago: University of Chicago Press. Retrieved from http://papers.nber.org/books/moff14-1
49 This section applies only to the Group I participants as it is based on staff forms and interview measures available only for this group.
50 As noted, the reason for leaving treatment was a statistically significant predictor of employment. The other covariates were not.
51 We use data from staff reports in this section. For several reasons, the “baseline” for participant interviews was usually at least a month after entering IPS and often much longer. Thus the “pre” scores on psychological tests did not really reflect a baseline status.
52 The Global Assessment of Functioning is a scale that staff use to judge both psychiatric symptoms and family and work functioning. It is part of several Diagnostic Standard Manuals used by psychiatrists and insurance companies, but with the introduction of DSM V it was dropped in favor of a scale that measures functioning only. Reliability is good if staff are trained. The other scale, the Clinical Global Impressions (CGI) scale, has been used for decades, most often in judging improvement in drug trials. It has a Cronbach’s alpha reliability score in this study of .88, which is quite good.
53 A change score is a convenient way of presenting change that is actually better measured and tested with longitudinal regression modeling, which is how we derived the statistical significance and effect sizes presented here.
54 CGI changes: Up to 112 days = .46; 113–196 days = .33; 197–286 days = 1.0; over 286 = 1.0. Change was statistically significant for GAF at P<0.0002 and for the CGI at P<0.03.
55 Effect size tells us practical differences. The “moderate” and “large” effect size designations of .5 and .8 derive from Jacob Cohen, who was the early developer of effect size concepts. One big advantage of effect sizes is that they are not dependent on sample size as statistical significance is. Effect sizes standardize on standard deviations. This translates to saying that a .71 effect size is essentially a difference between baseline and discharge (in this case .73 points) that is equal to .71 of the standard deviation (99 points) for the baseline distribution.
56 Waddell, G., & Kim, B. J. (2006). Is work good for you? Norwich, England: TSO (The Stationery Office). Retrieved from http://iedereen-aandeslag.nl/wp-content/uploads/2016/07/hwwb-is-work-good-for-you.pdf
57 ibid. The conclusion of these studies is summarized as: “Re-employment of unemployed adults improves psychological distress and minor psychiatric morbidity. [Page 19]”. A welfare-specific study with excellent data concludes: “[E]ntering employment affects health positively, mainly through a substantial increase in mental health.” Huber, M., Lechner, M., & Wunsch, C. (2011). Does leaving welfare improve health? Evidence for Germany. Health Economics, 20(4), 484–504. doi:10.1002/hec.1615. However, another author cautions that this relationship may not hold with poor single mothers. Zabkiewicz, D., & Schmidt, L. (2009). The mental health benefits of work: Do they apply to welfare mothers with a drinking problem? Journal of BehavioralHealthServices&Research, 36(1), 96–110.
58 The employment rates compared were baseline and discharge (or end of study). However, we also made use of the longitudinal nature of the data (besides baseline and discharge data there was data for each of four quarters following the baseline.) Using all five measurements we were able to determine if a person had ever been in IPS during the study year, not just whether they were in baseline or at discharge. We also determined whether they had worked (and how many hours a week) using the four quarters and discharge data. This was advisable because the employment measure was employment during the week before the
Outcomes from the County of Los Angeles 33
rating. So some participants worked during the year, but that was not captured by the discharge/end of study rating.
59 The primary assumption is that at baseline the two groups are indistinguishable and in particular that the trajectory over time would have been the same for the treatment group as it is for the control group. It also assumes that all the factors that lead to being in one group or another are measurable and included in the model. These strong assumptions are what led us to explore using propensity score matching to ensure that the assumptions are met as much as possible.
60 While none of the covariates (these or others) were predictive of IPS status, all of those included in this model did predict employment, hence the differences from the model with no covariates. The model with covariates is a longitudinal random effects model, produced in Stata with the xtlogit command. The predicted change for non-IPS was 15% employed at baseline to 25% employed during services (up to and including discharge); for IPS recipients it was 15% to 52%.
61 There is one caveat, however. Although we had 488 persons with matched baseline and discharge data, there were another 171 persons for whom staff did not or could not complete the discharge form. Did they do better, worse, or just about the same as the 488? We cannot know for sure, but we can look at baseline data to see if the 488 looked different from the 171 in important ways. Surprisingly, of the 171 persons, 19 were actually in IPS at the baseline compared to 21 among the 488 matched persons. So it appears that the IPS participants in the matched group may drop out less than do those who were missing a discharge form. Those in the matched 488 were also more likely to be white than were the 171 unmatched persons. While these variables were individually statistically significant, together they predicted a very small amount of the difference between the groups. So it seems unlikely that having data for the 171 with missing data would significantly change the results found among the 488 persons with pre and post data.
62 Propensity score matching (PSM) is a statistical technique for using baseline covariates to assign a probability that a case is in a treatment rather than a control group. Treatment and control cases are then matched on the propensity score, resulting in balanced covariates. Individuals that do not match closely may be
dropped. PSM assumes that no unmeasured variables are also correlated with the outcome (confounders). We used the routine implementing PSM in Stata called “diff.” Villa, J.M. (2016). diff: Simplifying the estimation of difference-in-differences treatment effects. Stata Journal 16, 52–71.
63 Matching can be thought of as a technique for finding ideal experimental data hidden within an observational data set.” King, G., & Nielsen, R. (2016). Why propensity scores should not be used for matching. https://gking.harvard.edu/publications/why-propensity-scores-should-not-be-used-formatching Coarsened exact matching approximates a fully blocked randomized experiment. We use the Stata implementation of the approach, called cem: Blackwell, M., Iacus, S., King, G., & Porro, G. (2010). cem: Coarsened exact matching in Stata. Stata Journal 9(4): 524–546. Retrieved from http://nrs.harvard.edu/urn-3:HUL.InstRepos:4314511
64 Pavetti, L. (2016). Work requirements don’t cut poverty, evidence shows. Center on Budget and Policy Priorities. Available at: http://www.cbpp.org/research/poverty-and-inequality/work-requirements-dont-cut-poverty-evidence-shows
65 Only 4 million persons, a majority of whom are children, receive TANF cash aid. In 1994 there were almost 14 million recipients of cash aid. (Recent models have shown at least half the reduction in caseload is from reduced applications rather than recipients finding work.) Compare the 4 million receiving TANF cash aid to the 59 million receiving Medicaid or the 26 million receiving food stamps. Additionally, TANF no longer has the capacity to expand to respond to economic crises like economic downturns. These points are found in the most comprehensive review of the history and effects of TANF to date: Ziliak, J. P. (2016). Temporary assistance for needy families (available from http://www.nber.org/chapters/c13483). In R. A. Moffitt (Ed.), Economics of means-tested transfer programs in the United States, volume 1. Chicago: University of Chicago Press. Available from http://papers.nber.org/books/moff14-1
66 Other recent publications making these points include: Morgen, S., Acker, J., & Weigt, J. (2013). Stretched thin: Poor families, welfare work, and welfare reform. Cornell University Press. R. A. Moffitt (Ed.) (2016). Economics of means-tested transfer programs in the United States, volume 1, Chapter 1. University of Chicago Press (p. 1–19). Zedlewski, S. (2012, April). Welfare reform: What have we learned after 15 years? Washington, DC:
34 Evidence for Using the Individual Placement and Support (IPS) Model in CalWORKs Mental Health Programs
Urban Institute. Retrieved October 26, 2014, from http://www.urban.org/UploadedPDF/412539-Welfare-Reform-What-Have-We-Learned-in-Fifteen-Years.pdf. Ziliak, J. P. (Ed.). (2009). Welfare reform and its long-term consequences for America’s poor (introduction; see p.19). Cambridge University Press. Ahn, H. (2015). Economic well-being of low-income single-mother families following welfare reform in the USA. International Journal of Social Welfare, 24(1), 14–26. Retrieved March 23, 2017 from https://www.researchgate.net/profile/Haksoon_Ahn/publication/261719895. Not all analysts agree. Ron Haskins, one of the policymakers who worked with Congress to create TANF, believes work requirements have increased income. See his congressional testimony at: https://www.brookings.edu/wp-content/uploads/2016/06/2-11-15-lowincome-families-haskins-testimony.pdf.
Effects of welfare reform on income show a gain for highly skilled or educated participants but a net loss for less skilled and unskilled participants. See: Ziliak, J. P., (2016). Temporary assistance for needy families (http://www.nber.org/chapters/c13483). In Moffitt, R. (Ed.), Economics of means-tested transfer programs in the United States, Volume 1. Chicago: University of Chicago Press. Available at http://papers.nber.org/books/moff14-1
67 Chandler, D. Available at: http://www.cibhs.org/publication/outcomes-los-angeles-calworks-mental-health-services
68 Ibid. Other recent references showing failure of TANF programs to help those with significant barriers include: Danziger, S. K., Danziger, S., Seefeldt, K. S., & Shaefer, H. L. (2016). Increasing work opportunities and reducing poverty two decades after welfare reform. Journal of Policy Analysis and Management, 35(1), 241–244. Danziger, S. K., Danziger, S., Seefeldt, K. S., & Shaefer, H. L. (2016). From welfare to a work-based safety net: An incomplete transition. Journal of Policy Analysis and Management, 35(1), 231–238.
69 Loprest, P. J., & Maag, E. (2009). Disabilities among TANF recipients: Evidence from the NHIS. Washington, DC: The Urban Institute. Retrieved from http://www.urban.org/sites/default/files/publication/30326/411883-disabilities-among-tanf-recipients-evidence-from-the-nhis.pdf
70 Bloom, D., Miller, C., & Azurdia, G. (2007). Results from the personal roads to individual development and employment (PRIDE) program in New York City. Washington, DC: Administration for Children and Families, U.S. Department of Health & Human Services.
71 Chandler, D. C. (2011). Work therapy: Welfare reform and mental health in California. Social Service Review, 85(1), 109–33.
72 Bloom, D., Loprest, P. J., & Zedlewski, S. R. (2011). TANF recipients with barriers to employment. Washington, DC: The Urban Institute. Temporary Assistance for Needy Families Program Research Synthesis Brief. Available from http://www.urban.org/sites/default/files/publication/25396/412567-TANF-Recipients-with-Barriers-to-Employment.PDF
73 Danziger, S. K., Danziger, S., Seefeldt, K. S., & Shaefer, H. L. (2016). Increasing work opportunities and reducing poverty two decades after welfare reform. Journal of Policy Analysis and Management, 35(1), 241–244. Danziger, S. K., Danziger, S., Seefeldt, K. S., & Shaefer, H. L. (2016). From welfare to a work-based safety net: An incomplete transition. Journal of Policy Analysis and Management, 35(1), 231–238. These options are intended to move persons quickly to working, not as “hoops” to jump through prior to “real” jobs. Ultimately the goal is expanding the proportion of persons finding work by meeting needs that are currently ignored.
74 Shaefer, H. L., Edin, K., & Talbert, E. (2015). Understanding the dynamics of $2-a-day poverty in the United States. RSF, 1(1), 120–138. Accessed March 23, 2017 at http://www.rsfjournal.org/doi/pdfplus/10.7758/RSF.2015.1.1.07
Outcomes from the County of Los Angeles 35
* Drs. Glynn and Turner, who work with and evaluate IPS at UCLA, were trainers in Phase 1. Dr. Turner conducted several of the fidelity reviews.
AppendicesAPPENDIX 1: Differences between the CalWORKs and seriously mentally ill participants in supported employment, by Shirley Glynn, PHD, and Luana Turner, PsyD.*
CALWORKsparticipantshavemorechallengeswithtreatmentengagement.
Traditional IPS participants are usually receiving care at a community mental health program, and have often been doing so for years. Many have been hospitalized and are on Social Security disability. Thus, they are often more socialized into mental health treatment and more connected to the mental health facility where they receive treatment. This ongoing relationship facilitates engagement into IPS, which is typically co-located at the mental health agency. CalWORKs participants are generally not receiving disability from Social Security. They seem to have a more tenuous commitment to treatment—leaving treatment (and thus IPS) prematurely. Two CalWORKs patterns are particularly pervasive: 1) initial failure to engage with the employment specialist (and often overall treatment); and, 2) quitting supported employment (and mental health care) as soon as the participant starts a job.
CalWORKsparticipantsneedasalarytosupporteconomicself-sufficiency.
Again, because they are adjudicated disabled, many traditional IPS participants see their IPS work income as supplemental and they are often open to accepting entry-level jobs that pay minimum wage. CalWORKs participants typically have higher expectations for initial wages (probably because they have a goal of economic self-sufficiency) and many do not want to accept entry-level jobs (probably because they have better work histories than traditional IPS participants).
CalWORKsparticipants’motivationtowork.
The primary entry criterion for traditional IPS is the client desire to work (at least part time). There is no such requirement for mandated CalWORKs participation. IPS has limited strategies to promote motivation to work, and yet the motivation of many of the CalWORKs participants is unclear, which leaves the CalWORKs employment specialists struggling with relatively few tools to address motivation issues.
CALWORKsparticipantsoftenhavecompetingcaretakingroles.
CalWORKs provides financial support for families. Thus, it is not surprising that CalWORKs participants appear to be more likely to be caretakers of children living with them compared to traditional IPS participants. Work issues therefore are complicated by the need to find child care — often at peak employment hours such as evenings and weekends when child care is more difficult to secure — and with little lead time when offered a job. This situation was further complicated because it was not the IPS worker, but the GAIN (DPSS) worker, who usually was coordinating the child care, leaving opportunities for communication failures and role diffusion.
CalWORKsparticipantsaremorelikelytolackinvolvementoffamilymembersorlovedones.
Traditional IPS participants and treatment teams often rely on support from loved ones during the engagement period and during periods of high stress. In general, CalWORKs participants appear to lack this type of support system, which often can be helpful with participation and maintenance of the IPS model.
CalWORKsparticipantsmaypreferbehind-the-scenesassistance.
IPS workers are encouraged to spend time in the com-munity, which often involves disclosing information about potential employees on their caseloads when meeting with potential employers. Traditional IPS par-ticipants often are willing to allow this level of “front-line” work because they see its advantages and they have limited experience obtaining jobs. However, many CalWORKs participants preferred to have IPS personnel work “in the background.” While IPS staff

36 Evidence for Using the Individual Placement and Support (IPS) Model in CalWORKs Mental Health Programs
members can accommodate working in the foreground or background, when they take a background role there is more onus on the participants to be active in the job search. Many CalWORKs participants (who perhaps struggled with motivational and logistical obstacles to job seeking as described above) seemed to have diffi-culty “taking the lead” on their job-seeking efforts.
CalWORKshasatreatmentdurationlimitation.
IPS is meant to be time unlimited, if needed. Regu-lations concerning CalWORKs funding or agency requirements (CalWORKs/DMH contract ends/time runs out; no longer eligible) meant participants were often discharged from mental health services or Cal-WORKs services early, contrary to this IPS principle.
APPENDIX 2: Participant survey methodology and representativenessA.Methodologyandattritionofthephonesurvey.
Phone interviews were conducted by the Social Science Research Center (SSRC): Laura Gil-Trejo, Director; Frederic Rose, Research Operations Coordinator; and Lizette Sanchez, Office Manager.
Social Science Research Center California State University, Fullerton 800 N. State College Blvd, MH-038 Fullerton, CA 92834Telephone: (657) 278-7691 Fax: (657) 278-4153E-mail: [email protected]
Below we present extracts from the Technical Report submitted by SSRC at the conclusion of the study. The full report is available by request.
Between March 29, 2014, and September 3, 2015, the SSRC collected baseline data on 80 individuals who consented to participate in the Supported Employ-ment Research Project through their mental health agency’s caseworker. As an incentive for completing the baseline survey, respondents were offered a $20 gift card to Target. Follow‐up interviews were then conducted with all willing and eligible participants who participated in baseline data collection, as well as new participants who had not completed a baseline interview. Between July 17, 2014, and April 22, 2016, the SSRC conducted 78 interviews with individuals
from these two groups, 61 of which (78.2%) were with respondents who had completed a baseline interview and 17 (21.8%) of them with new individuals. These survey completers were offered a $25 gift card to Target.
The baseline survey instrument was drafted by CIBHS and refined by SSRC for comprehensiveness, flow, length, and factors that influence respondent cooperation and interest. This instrument was identical to the one used in the 2013 Phase I administration of the survey. The final instrument was programmed for administration using computer-assisted telephone interviewing (CATI) software. Respondents were asked approximately 40 questions about their living situation, overall physical and mental health, drug use, employment status, and income. The follow‐up survey instrument was nearly identical to the baseline instrument; however, a few items were revised to assess changes in outcomes over time.
Baseline and follow‐up interviews were conducted between 9:00 a.m. and 9:00 p.m. local time Monday through Thursday, and between 11:00 a.m. and 7:00 p.m. local time Saturday and Sunday. The length of time required to complete each baseline telephone interview ranged from 13 (n = 2, 2.5%) to 46 (n = 1, 1.3%) minutes. The mean baseline survey administration time was 21 minutes and 56 seconds, and the median (the point above which and below which half of the values occur) was 21 minutes. The length of time to complete each follow‐up interview ranged from 15 (n = 2; 2.6%) to 41 minutes (n = 1; 1.0%) with a mean administration time of 23 minutes and 17 seconds, and a median of 23 minutes.
Excluding six individuals who opted out or were dropped from the study between baseline and follow‐up survey administration, a total of 94 were included in the follow‐up sample. An additional 10 new individuals (who never took a baseline survey) were also included, bringing the total sample for the second phase to 104 potential respondents.
The Response Rate for the baseline sample was 88.3%, while the cooperation rate was 100.0% (meaning there were no refusals with records included in the sample). In all, completed surveys comprised 80.0% (n = 80) of all records attempted (N = 100). The next largest pro-portion of all records attempted resulted in contact with voicemail or an answering machine (n = 7 or 7.0%).

Outcomes from the County of Los Angeles 37
Seventy‐eight follow‐up surveys were collected (75%). A slightly larger proportion of follow‐up surveys were administered in English (n = 69; 88.5%) compared with baseline administration. About a third of the 78 respondents (n = 28; 36.8%) who completed the follow‐up survey self‐identified as Latino. This discrepancy between baseline (42.5% Latino) and follow‐up (36.8%) was due to both a large number of Latino respondents dropping out during the study and a large number of non‐Latino respondents completing
only the follow‐up survey. The age of respondents ranged from 20 (n = 1; 1.3%) to 60 (n = 1; 1.3%). The mean age of participants was 36.3, and the median was 36.5 years old. Of those interviewed at follow up, 85.9% were female (n = 67).
Nearly half of all follow‐up surveys (n = 37, 47.4%) were completed in five or fewer call attempts. Nonetheless, as with the baseline survey, about one fifth (n = 17; 21.8%) took 20 or more attempts to complete.
Table 2A: Characteristics of persons interviewed vs. not-interviewed if interviewed both at baseline and follow (N=61) and if interviewed at follow-up(N=78)
Measure Interviewed pre and post N=61
Not interviewed pre and post N= 47
Interviewed post N=78
Not interviewed post N=30
CONTINUOUS MEASURES MEAN MEAN MEAN MEAN
GAF at baseline 50 51 50 53
GAF at discharge 57 56 56 59
CGI scale at baseline 3.42 3.53 3.50 3.46
CGI scale at discharge 2.61 2.91 2.71 2.80
CATEGORICAL MEASURES PERCENT PERCENT PERCENT PERCENT
Live in own apartment at base-line 49% 40% 47% 40%
Live in own apartment at follow-up 28% 42% 32% 40%
No health problems baseline 59% 49% 54% 56%
No health problems follow-up 36% 13%*** 29% 17%
Rated capacity to work is high at baseline
56% 45% 51% 50%
Rated capacity to work is high at discharge
75% 21%** 69% 57%
Enrolled in school at baseline 16% 22% 15% 27%Race is white 47% 38% 46% 35%Age over 40 39% 26% 38% 20%Primary language is Spanish 13% 17% 14% 16%High self-esteem at baseline 13% 8% 13% 6%High self-esteem at discharge 31% 6% 26% 6%High motivation to work, at base-line
74% 50%*** 68% 52%
DPSS shows worked in baseline 21% 11% 17% 18%DPSS shows worked in year after IPS enrollment
51% 36% 45% 43%
P<=0.01=*** p<=0.05=**
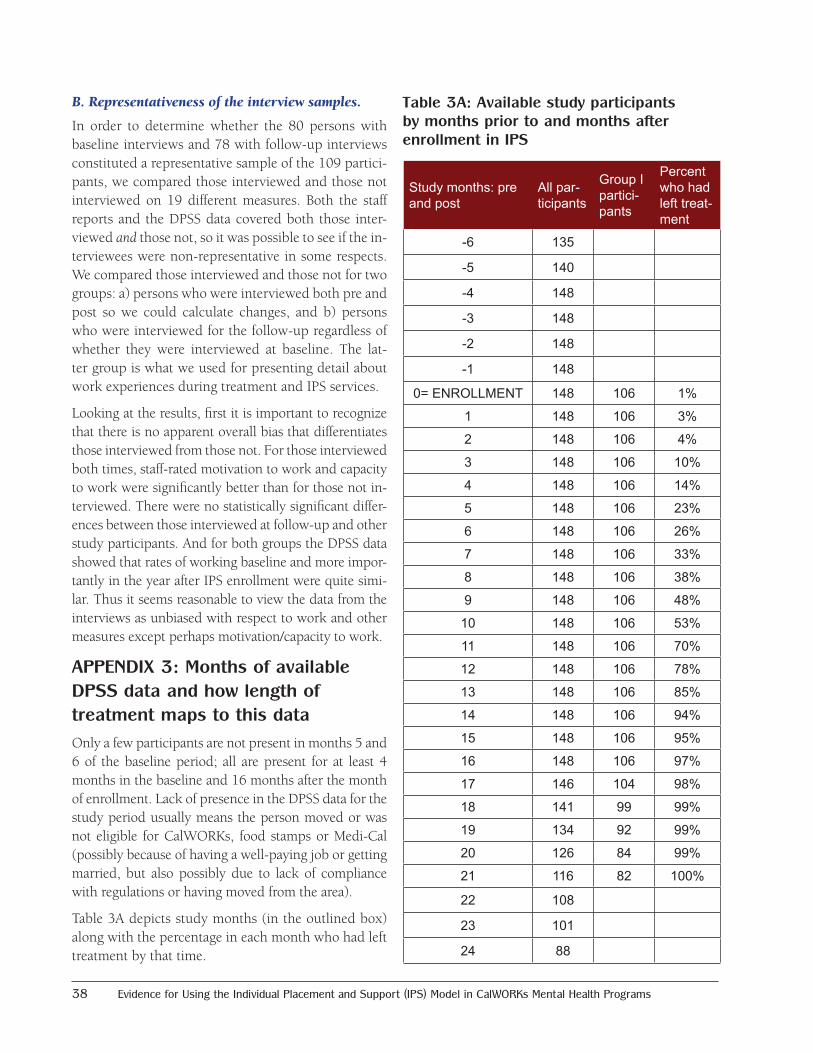
38 Evidence for Using the Individual Placement and Support (IPS) Model in CalWORKs Mental Health Programs
B.Representativenessoftheinterviewsamples.
In order to determine whether the 80 persons with baseline interviews and 78 with follow-up interviews constituted a representative sample of the 109 partici-pants, we compared those interviewed and those not interviewed on 19 different measures. Both the staff reports and the DPSS data covered both those inter-viewed and those not, so it was possible to see if the in-terviewees were non-representative in some respects. We compared those interviewed and those not for two groups: a) persons who were interviewed both pre and post so we could calculate changes, and b) persons who were interviewed for the follow-up regardless of whether they were interviewed at baseline. The lat-ter group is what we used for presenting detail about work experiences during treatment and IPS services.
Looking at the results, first it is important to recognize that there is no apparent overall bias that differentiates those interviewed from those not. For those interviewed both times, staff-rated motivation to work and capacity to work were significantly better than for those not in-terviewed. There were no statistically significant differ-ences between those interviewed at follow-up and other study participants. And for both groups the DPSS data showed that rates of working baseline and more impor-tantly in the year after IPS enrollment were quite simi-lar. Thus it seems reasonable to view the data from the interviews as unbiased with respect to work and other measures except perhaps motivation/capacity to work.
APPENDIX 3: Months of available DPSS data and how length of treatment maps to this dataOnly a few participants are not present in months 5 and 6 of the baseline period; all are present for at least 4 months in the baseline and 16 months after the month of enrollment. Lack of presence in the DPSS data for the study period usually means the person moved or was not eligible for CalWORKs, food stamps or Medi-Cal (possibly because of having a well-paying job or getting married, but also possibly due to lack of compliance with regulations or having moved from the area).
Table 3A depicts study months (in the outlined box) along with the percentage in each month who had left treatment by that time.
Table 3A: Available study participants by months prior to and months after enrollment in IPS
Study months: pre and post
All par-ticipants
Group I partici-pants
Percent who had left treat-ment
-6 135
-5 140
-4 148
-3 148
-2 148
-1 148
0= ENROLLMENT 148 106 1%
1 148 106 3%
2 148 106 4%
3 148 106 10%
4 148 106 14%
5 148 106 23%
6 148 106 26%
7 148 106 33%
8 148 106 38%
9 148 106 48%
10 148 106 53%
11 148 106 70%
12 148 106 78%
13 148 106 85%
14 148 106 94%
15 148 106 95%
16 148 106 97%
17 146 104 98%
18 141 99 99%
19 134 92 99%
20 126 84 99%
21 116 82 100%
22 108
23 101
24 88

Outcomes from the County of Los Angeles 39
APPENDIX 4: Fidelity ratings for all Los Angeles CalWORKs mental health programsRatings were done for 40 programs between 2012 and 2016. Many programs had multiple ratings. The current number of programs with IPS programs is 46. The remainder have other forms of employment services. The most apparent trend is increased mean fidelity ratings over time, so that by 2015 the mean was 95, at the high end of “fair fidelity.” A few programs
had achieved ratings of 115 or more. “Good” is 100 to 114, with 115 to 125 being “Exemplary.”
The Fidelity Scale Score Sheet is included below as Table 4B so that readers can get a sense of the scope and content of the criteria used by fidelity reviewers. A review ordinarily takes two reviewers two days and another day for writing up the results.
The detailed version of the fidelity scale scoring sheet and a manual for conducting fidelity reviews are available from https://www.dartmouth.edu/~ips/page19/page19.html
Table 4A: Fidelity Scores for 40 IPS sites in Los Angeles County mental health programs
Year Number of reviews
Mean overall rating
Median overall rating
Minimum overall rating
Maximum overall rating
2012 8 65 66 48 802013 20 89 90 71 1112014 20 92 93 67 1152015 28 95 98 63 1142016 26 92 94 55 119
Overall total 102 90 93 48 119
Table 4B: Fidelity Scale Score Sheet

40 Evidence for Using the Individual Placement and Support (IPS) Model in CalWORKs Mental Health Programs
APPENDIX 5: Pre- and post-predictors of work/no-work using DPSS data
Predicting work in the study period using baseline and follow-up variablesModel I: Baseline predictors of DPSS job in study year
Model 2: Baseline and follow-up predictors of DPSS job in study year
coefficient t statistic coefficient t statistic
DPSS: Job in 6-month baseline 2.62*** (3.48) 3.31*** (3.42)
Own apartment at admit -1.14* (-2.30) -1.58* (-2.41)
Race is white 0.63 (1.37) 1.22* (2.04)
No domestic violence at admit 0.86 (1.55) 1.67* (2.25)
High capacity for caring for children at admit -0.58 (-1.16) -1.75* (-2.33)
Monolingual in Spanish 0.61 (0.91) 2.19 (1.90)
Reference category is Less than 118 days in treatment
118–196 days in treatment -1.75 (-1.85)
197–286 days in treatment -2.50** (-2.82)
Over 286 days in treatment -1.85* (-2.34)
No substance use issues at discharge -2.70* (-2.41)
High hopes for future at discharge 2.71*** (3.46)
Reference category is Normal at discharge
Borderline ill at discharge 2.27* (2.02)
Mildly ill, clear symptoms at discharge 2.16* (2.10)
Moderately ill, functional impairment at discharge 1.51 (1.33)
Global Assessment of functioning at discharge 0.036 (1.27)
Constant -0.77 (-1.19) -2.07 (-0.94)
Npseudo R-sq
1060.193
1060.400
Table 5A: Results of two statistical models that predict having worked in the 16 months following IPS enrollment
=* p<0.05 ** p<0.01 *** p<0.001
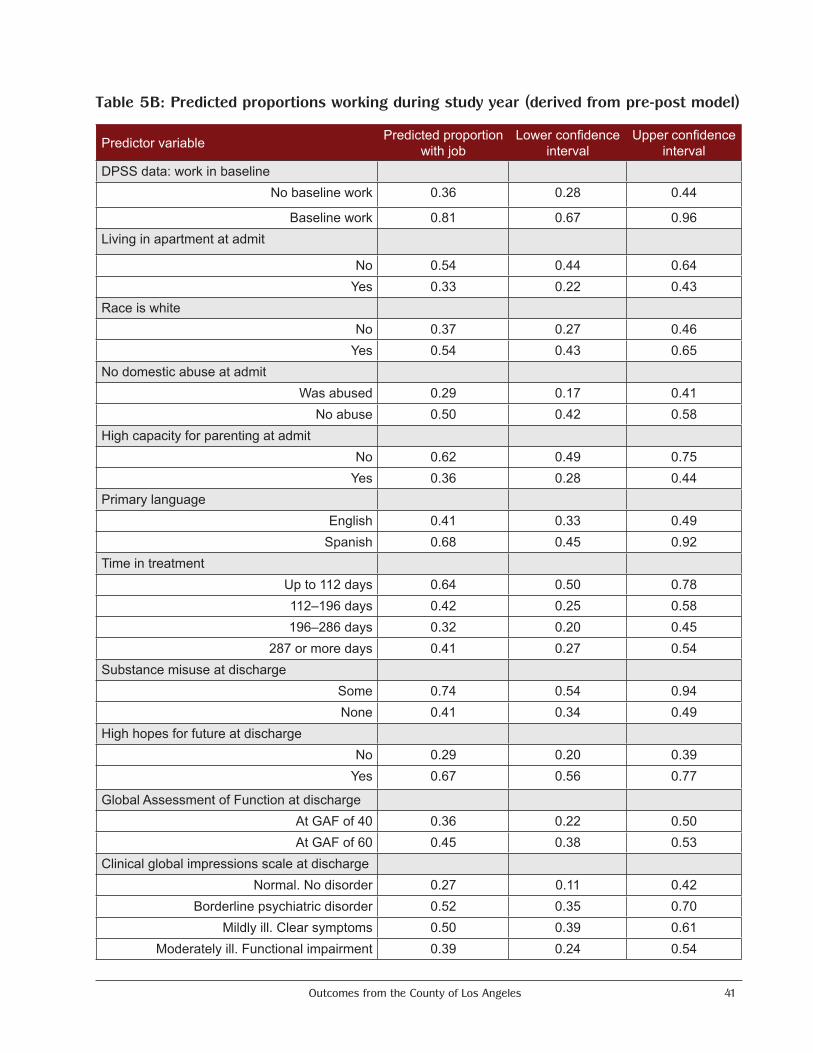
Outcomes from the County of Los Angeles 41
Table 5B: Predicted proportions working during study year (derived from pre-post model)
Predictor variable Predicted proportion with job
Lower confidence interval
Upper confidence interval
DPSS data: work in baselineNo baseline work 0.36 0.28 0.44
Baseline work 0.81 0.67 0.96Living in apartment at admit
No 0.54 0.44 0.64Yes 0.33 0.22 0.43
Race is whiteNo 0.37 0.27 0.46
Yes 0.54 0.43 0.65No domestic abuse at admit
Was abused 0.29 0.17 0.41No abuse 0.50 0.42 0.58
High capacity for parenting at admitNo 0.62 0.49 0.75
Yes 0.36 0.28 0.44Primary language
English 0.41 0.33 0.49Spanish 0.68 0.45 0.92
Time in treatmentUp to 112 days 0.64 0.50 0.78112–196 days 0.42 0.25 0.58196–286 days 0.32 0.20 0.45
287 or more days 0.41 0.27 0.54Substance misuse at discharge
Some 0.74 0.54 0.94None 0.41 0.34 0.49
High hopes for future at dischargeNo 0.29 0.20 0.39
Yes 0.67 0.56 0.77
Global Assessment of Function at dischargeAt GAF of 40 0.36 0.22 0.50At GAF of 60 0.45 0.38 0.53
Clinical global impressions scale at dischargeNormal. No disorder 0.27 0.11 0.42
Borderline psychiatric disorder 0.52 0.35 0.70Mildly ill. Clear symptoms 0.50 0.39 0.61
Moderately ill. Functional impairment 0.39 0.24 0.54
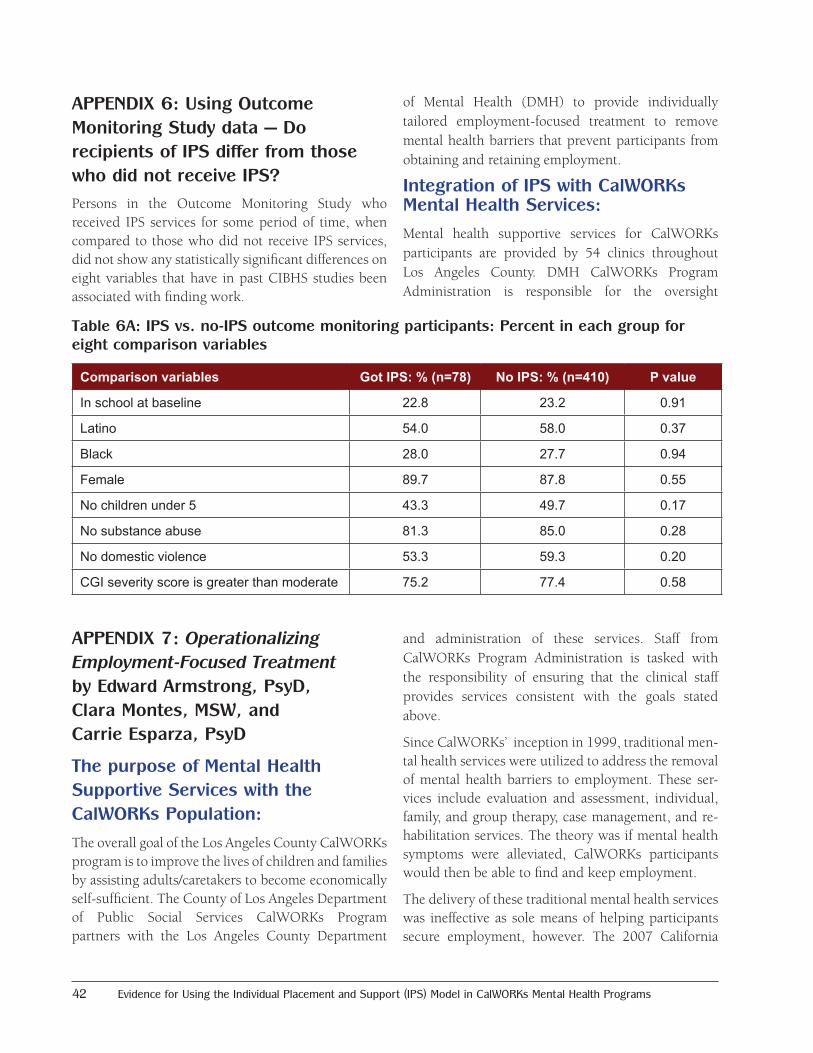
42 Evidence for Using the Individual Placement and Support (IPS) Model in CalWORKs Mental Health Programs
APPENDIX 6: Using Outcome Monitoring Study data — Do recipients of IPS differ from those who did not receive IPS?Persons in the Outcome Monitoring Study who received IPS services for some period of time, when compared to those who did not receive IPS services, did not show any statistically significant differences on eight variables that have in past CIBHS studies been associated with finding work.
APPENDIX 7: Operationalizing Employment-Focused Treatment by Edward Armstrong, PsyD, Clara Montes, MSW, and Carrie Esparza, PsyD
The purpose of Mental Health Supportive Services with the CalWORKs Population:
The overall goal of the Los Angeles County CalWORKs program is to improve the lives of children and families by assisting adults/caretakers to become economically self-sufficient. The County of Los Angeles Department of Public Social Services CalWORKs Program partners with the Los Angeles County Department
of Mental Health (DMH) to provide individually tailored employment-focused treatment to remove mental health barriers that prevent participants from obtaining and retaining employment.
Integration of IPS with CalWORKs Mental Health Services:
Mental health supportive services for CalWORKs participants are provided by 54 clinics throughout Los Angeles County. DMH CalWORKs Program Administration is responsible for the oversight
and administration of these services. Staff from CalWORKs Program Administration is tasked with the responsibility of ensuring that the clinical staff provides services consistent with the goals stated above.
Since CalWORKs’ inception in 1999, traditional men-tal health services were utilized to address the removal of mental health barriers to employment. These ser-vices include evaluation and assessment, individual, family, and group therapy, case management, and re-habilitation services. The theory was if mental health symptoms were alleviated, CalWORKs participants would then be able to find and keep employment.
The delivery of these traditional mental health services was ineffective as sole means of helping participants secure employment, however. The 2007 California
Table 6A: IPS vs. no-IPS outcome monitoring participants: Percent in each group for eight comparison variables
Comparison variables Got IPS: % (n=78) No IPS: % (n=410) P value
In school at baseline 22.8 23.2 0.91
Latino 54.0 58.0 0.37
Black 28.0 27.7 0.94
Female 89.7 87.8 0.55
No children under 5 43.3 49.7 0.17
No substance abuse 81.3 85.0 0.28
No domestic violence 53.3 59.3 0.20
CGI severity score is greater than moderate 75.2 77.4 0.58
Outcomes from the County of Los Angeles 43
Institute of Behavioral Health Solutions (CIBHS) study of 2,000 CalWORKs mental health participants revealed that only a total of 18% of participants worked at all during their mental health treatment and only 23% worked during the six months following treatment termination. Based on these findings, it was recommended that the evidence-based practice Individual Placement and Support (IPS) - Supported Employment be integrated with the traditional mental health services.
Given the large number of clinics that required a shift in their service delivery, it was important to use a staged approach to implement and integrate this evidence-based practice. Three cohorts received IPS training over a one-year period. The first group of 14 clinics received training in January of 2012. The second group of 8 clinics were trained in June 2012. The final cohort of 24 clinics received training in January 2013.
Although the IPS training was conducted by staff outside of DMH, CalWORKs Program Administration staff assumed the primary responsibility of ensuring the integration of these services. IPS was originally developed to address the needs of persons with severe and persistent mental illness. Because the majority of CalWORKs participants do not meet the severe and persistent mental illness criteria that constitute the focus of the IPS model, staff from CalWORKs Program Administration worked closely with the IPS trainers.
The initial IPS trainings took place over a two-and-a-half-day period. Days one and two were classroom-based and the half day was set aside for field-based job development training. Job development training also represented a significant aspect of IPS integration. The role of employment specialist was a new component introduced to the existing CalWORKs service model. Prior to IPS implementation, paraprofessional staff primarily performed case management and rehabilitation services. While these services provided support to the clinical treatment team toward the removal of barriers to employment, they were not field-based and did not include interaction with employers. This new service approach mandated
routine interaction with employers in the community, requiring specialized training in job development.
Following the formal trainings, CalWORKs Program Administration conducted individualized Technical-Assistance (TA) visits with every provider. The TA visits were facilitated in order to help reinforce adherence to the fidelity of the model. This was done by analyzing each of the provider’s strengths while providing strategies and recommendations to improve areas of weakness. TA visits were also conducted prior to all baseline fidelity reviews and as needed.
Supportive Strategies to Ensure Successful Implementation
Developing a Supportive Infrastructure
A crucial strategy that helped to ensure successful implementation and integration of IPS was the support from the Los Angeles County Department of Public Social Services (DPSS). At the urging of CalWORKs Program Administration Staff, DPSS offered both financial and administrative support for the inclusion implementation of the model. At the initial phase of implementation, DPSS made additional funds available for a select number of providers to hire Employment Specialists, rather than utilizing the case managers who were already on staff. In addition, DMH and DPSS recognized there were systemic barriers in place that would prevent participants from fulfilling their potential to obtain employment via IPS. As a result, a number of protocols were established within the DPSS infrastructure to provide additional support and resources for participants who were receiving IPS services. Changes related to participants receiving individualized benefits counseling and increasing their access to childcare and transportation for all job-search activities were instrumental in helping to ensure successful implementation.
Building Support from Providers
In addition to securing support from DPSS, CalWORKs Program Administration staff had the task of endorsing the efficacy of this model to agency leadership countywide. Several meetings took place prior to implementation promoting the potential

44 Evidence for Using the Individual Placement and Support (IPS) Model in CalWORKs Mental Health Programs
benefits of the IPS model. These meetings represented another critical aspect of successful integration because of the challenges associated with transforming services by introducing an evidence-based practice. It is understood that evidence-based practices are more accepted by line staff when they are supported and encouraged by agency leadership.
Transitioning Staff
Early on in the implementation process, most CalWORKs programs did not have the funding to hire an additional staff member to fill the role of employment specialist. As a result, CalWORKs Program Administration allowed for the transition of case managers into the role of employment specialist in order to ensure that all agencies had a fully functioning IPS program integrated with their mental health services.
The job activities of a case manager, however, greatly differ from those of an employment specialist. For example, case managers are responsible for linking participants to needed resources (regarding housing, substance abuse, food access, education, medical support, etc.) and facilitating rehabilitation and support groups. The employment specialist’s role is specifically designed to address employment services needs. Employment specialists are responsible for engaging and developing relationships with participants, collaborating with mental health practitioners to develop individualized employment plans, building relationships with employers in the community to make strategic matches that meet participants’ needs and interests, and providing follow-along supports to participants who obtain employment.
While some new employment specialists were comfortable with a shift in their roles and remained on staff, other employment specialists had a difficult time transitioning, which caused a significant increase in staff turnover during the first year of implementation. Throughout the transition period, however, agency leadership learned to identify the right applicant that met the requirements of an employment specialist. The job does not require a specific degree or employment
experience, but it does call for the applicant to work effectively with a team, be comfortable working in the field, and obtain the skills necessary to engaging a diverse group of individuals. Further, to help fill the need of case managers in the agencies, agency leadership called on therapists to take on many of these case management duties. It is important to note that CalWORKs Program Administration played a critical role in helping to support the transitioning of staff by providing a variety of training and support.
Fidelity Review Monitoring
CalWORKs Program Administration uses IPS Fidelity Reviews to monitor agencies’ fidelity to the model. IPS Fidelity Reviews evaluate three areas of IPS implementation: staffing, organization, and services. Based on a 125-point scale, a score of 73 or below is “Not Supported Employment,” 74–99 is “Fair Fidelity,” 100–114 is “Good Fidelity,” and 115–125 is “Exemplary Fidelity.” An agency’s score determines the date of its next IPS Fidelity Review. Agencies with a score of 99 or below are evaluated every six months. Agencies with score of 100 or above are evaluated annually.
CalWORKs Program Administration uses the IPS Fidelity Review scores to evaluate agencies’ strengths and weaknesses. This information is then used to create individualized action plans designed to identify methods to increase fidelity to the model. Since implementation in 2012, the average fidelity score has increased nearly 30 points. Due to the fact that the agencies were trained in three different cohorts, CalWORKs Program Administration gradually conducted IPS reviews allowing each cohort of agencies the same amount of time to implement IPS after the trainings were complete. In 2012, eight agencies received IPS Fidelity Reviews with average score of 65 (“Not Supported Employment”). In 2013, 13 agencies were reviewed with an average score of 85 (“Fair Fidelity”). In 2014, the average score jumped to 92 (“Fair Fidelity”) and it increased again to 95 in 2015. In 2016, the average score was 93, with one agency scoring a CalWORKs record high of 122.

Outcomes from the County of Los Angeles 45
Other Monitoring Efforts
The DMH CalWORKs Program Administration cre-ated additional methods to monitor the efficiency and effectiveness of the model. To ensure that CalWORKs programs are maximizing available IPS services, Cal-WORKs Program Administration began tracking IPS enrollment rates. When CalWORKs Program Admin-istration began tracking this data in 2016, enrollment rates were at a low 20%. Alarmed by this figure, Cal-WORKs Program Administration began investigating the possible causes. CalWORKs Program Administra-tion found that therapists, who are the gatekeepers of the program as they most often make IPS referrals, were allowing some of their unconscious biases to pre-vent them from referring. For example, some thera-pists felt that a participant who was addicted to drugs or was experiencing severe mental health symptoms would be unable to keep a job (even though studies have proven that work often reduces drug use and al-leviates mental health symptoms). In order to protect these clients from the disappointment of losing their jobs, therapists preferred to provide more therapeu-tic interventions to get the participant “ready” to work before referring them to IPS.
As a result, CalWORKs Program Administration made a targeted effort to work with agencies across the county and their therapists to ensure that they were adhering to the model’s “zero exclusion” criterion. CalWORKs Program Administration held various trainings to shift therapists’ previous notions toward the belief that work is not only part of the recovery process, but work pro-motes it. Of note, Motivational Interviewing training was provided countywide to help address participant engagement and enrollment along with other trainings that focused on transitioning therapists’ understanding of the IPS program. Further, rather than associating IPS with clients who are “ready to work,” CalWORKs Pro-gram Administration promoted IPS as an “employment preparedness program.” This means that just because a participant is enrolled in IPS, he or she will not neces-sarily start work immediately; the employment special-ist will allow the participant to guide the pace of the employment preparedness process, which could in-clude discussing employment goals, building a resume,
practicing interview skills, and other steps. While en-rollment rates have increased slightly to 28% by the end of 2016, obtaining high enrollment numbers remains an ongoing training objective.
CalWORKs Program Administration also began tracking job start rates – after all, employment outcomes are the focus of the program. After one year of tracking, CalWORKs Program Administration found that IPS participation in CalWORKs programs had a 48% job start rate in 2016. With this positive outcome, along with the favorable data outlined in this report (51% of CalWORKs IPS participant worked at discharge), CalWORKs Program Administration hopes that DPSS will continue to provide financial support for IPS and continue to improve its implementation with systemic protocols that strengthen its infrastructure.
Administrative Enhancements to the CalWORKs IPS Program
Currently, all aspects of CalWORKs mental health ser-vices reflect the incorporation and inclusion of IPS. In addition to improving the implementation of the pro-gram at each agency, as discussed above, CalWORKs Program Administration has successful executed ad-justments on the administrative level. IPS has now transitioned to the forefront of CalWORKs. Therefore, all CalWORKs Program Administration staff is trained to conduct IPS Fidelity Reviews. The team is also re-quired to execute four IPS Fidelity Reviews per month, which allows CalWORKs Program Administration to comply with the Fidelity Review timeline as outlined by the IPS model and monitor the implementation practices at each of its 48 IPS programs.
Additionally, IPS now serves as the foundation for all CalWORKs trainings and provider meetings. While CalWORKs has always held quarterly Provider Meetings for its 54 agencies, the agenda for these meetings is now employment-focused rather than traditionally clinical or administrative. In addition to the CalWORKs Provider Meetings, CalWORKs Program Administration has implemented quarterly IPS Provider Meetings, which are attended by its 48 IPS programs, to create a forum focused on IPS-specific issues, including fidelity items that are deficient across
46 Evidence for Using the Individual Placement and Support (IPS) Model in CalWORKs Mental Health Programs
agencies, job development strategies, and benefits counseling. Both the CalWORKs Provider Meetings and the IPS Provider Meetings also include employer and IPS participant panels to connect providers more closely to the employers’ and participants’ experience. Further, CalWORKs Program Administration holds trainings and meetings that are targeted for specific audiences. For example, DMH’s Directly Operated clinics were convened to discuss IPS enrollment rates, and specific agencies were brought together by geographic area to learn engagement strategies and share their experiences working with participants in their region. Moreover, CalWORKs Program Administration held its first CalWORKs Symposium in
2013, which was a conference designed for over 200 CalWORKs participants to enhance their job search skills and strengthen their self-efficacy regarding employment. CalWORKs Program Administration is currently planning its second CalWORKs Symposium, scheduled for January 2018.
After five years of overseeing the CalWORKs IPS pro-gram, with the support of DPSS, CalWORKs Mental Health Program Administration has successfully im-plemented IPS in 48 CalWORKs mental health agen-cies. CalWORKs Program Administration’s ongoing support and oversight, as outlined above, has been instrumental to the successful outcomes highlighted in this Phase II IPS Study.
The California Institute for Behavioral Health Solutions (CIBHS) is a non-profit agency that helps health professionals, agencies and funders improve the lives of people with mental health and substance use challenges through policy, training, evaluation, technical assistance, and research.
CIBHS was established as the California Institute for Mental Health (CiMH) in 1993 to promote excellence in mental health services. Local mental health directors founded CiMH to work collaboratively with all mental health system stakeholders. The commitment to collaboration has led the board to expand board membership to include consumers, family members, and other interested persons representing the public interest.
On July 1, 2014, CiMH merged with the Alcohol and Other Drug Policy Institute (ADPI) to form the California Institute for Behavioral Health Solutions.
California Institute for Behavioral Health Solutions • (916) 556-3480 • www.cibhs.org
2125 19th Street, 2nd Floor Sacramento, CA 95818(916) 556-3480 • www.cibhs.org