evidence gathering low carbon heating technologies · (gtm research, 2015 ... renewable energy...
TRANSCRIPT

Evidence Gathering – Low Carbon Heating Technologies
Hybrid Solar Photovoltaic Thermal Panels
Image courtesy of Electric Corby, 2015
Evidence Gathering – Low Carbon Heating Technologies Hybrid Solar Photovoltaic Thermal Panels
Acknowledgements
This report has been prepared in collaboration with BRE National Solar Centre and Delta-ee. The views expressed in this report are those of the authors, and do not necessarily reflect those of the Department for Business, Energy and Industrial Strategy. This report was commissioned to inform BEIS’s evidence base for future policy development. Evidence Gathering – Low Carbon Heating Technologies - Hybrid Solar Photovoltaic Thermal Panels © Crown copyright 2016 You may re-use this information (not including logos) free of charge in any format or medium, under the terms of the Open Government Licence. To view this licence, visit www.nationalarchives.gov.uk/doc/open-government-licence/ or write to the Information Policy Team, The National Archives, Kew, London TW9 4DU, or email: [email protected]. Any enquiries regarding this publication should be sent to us at [email protected].

Contents
Report Summary ........................................................................................................................ 5 Executive summary .................................................................................................................... 6
PV-T products ....................................................................................................................... 6 PV-T performance................................................................................................................. 7
Market & costs ...................................................................................................................... 7 Future growth and barriers .................................................................................................... 8
Introduction ................................................................................................................................ 9 Hybrid Solar Photovoltaic Thermal Panels (PV-T) .................................................................. 10 PV-T and domestic heating in the UK..................................................................................... 11
Development of PV-T Technology .......................................................................................... 13
Report scope .......................................................................................................................... 13
Research methodology ........................................................................................................... 14 Current state of the art ............................................................................................................. 16
Types of PV-T modules .......................................................................................................... 16 Type 1a - Unglazed without thermal insulation ................................................................... 17
Type 1b - Unglazed, without thermal insulation, heat exchanger as a separate unit under PV module .......................................................................................................................... 18
Type 2 - Unglazed with thermal insulation .......................................................................... 20 Type 3 - Glazed PV cells are placed on the absorber ......................................................... 21 Type 4 - Glazed PV cells are placed right under the transparent insulation/glass pane ..... 22
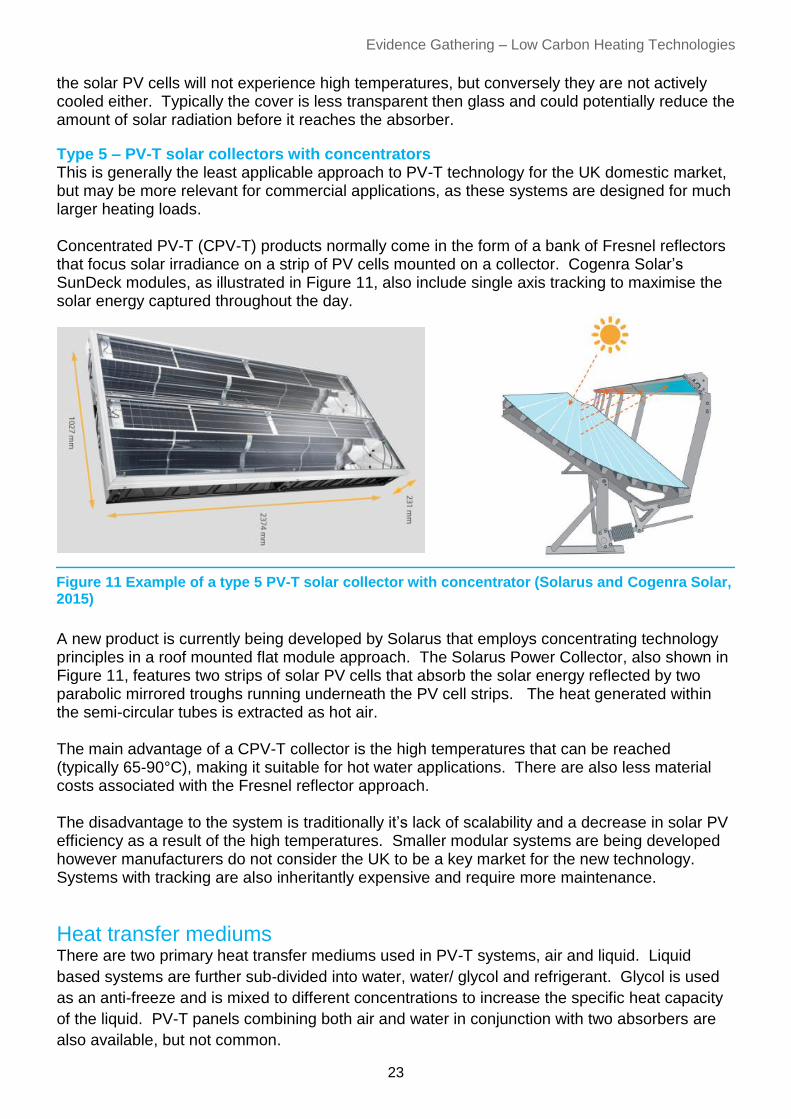
Type 5 – PV-T solar collectors with concentrators .............................................................. 23 Heat transfer mediums ........................................................................................................... 23
PV-T water panels .............................................................................................................. 24 PV-T water/ glycol panels ................................................................................................... 24
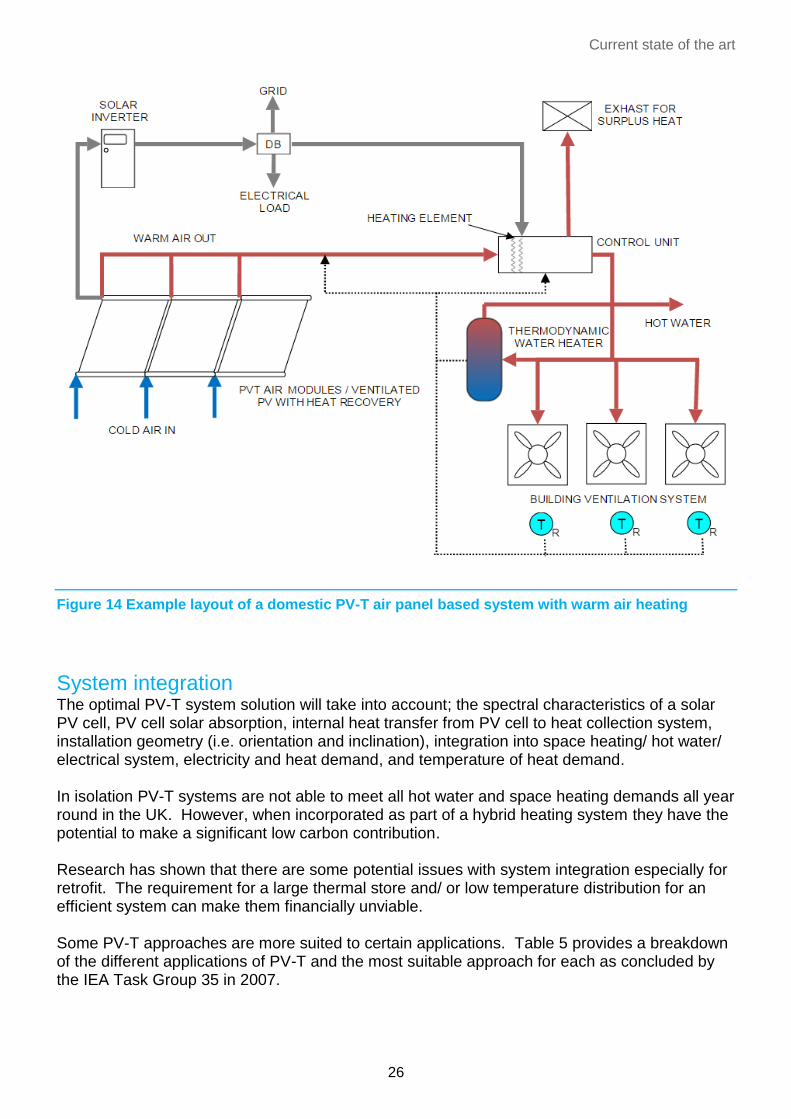
PV-T air panels ................................................................................................................... 25 System integration .................................................................................................................. 26
Future technical developments ............................................................................................... 28
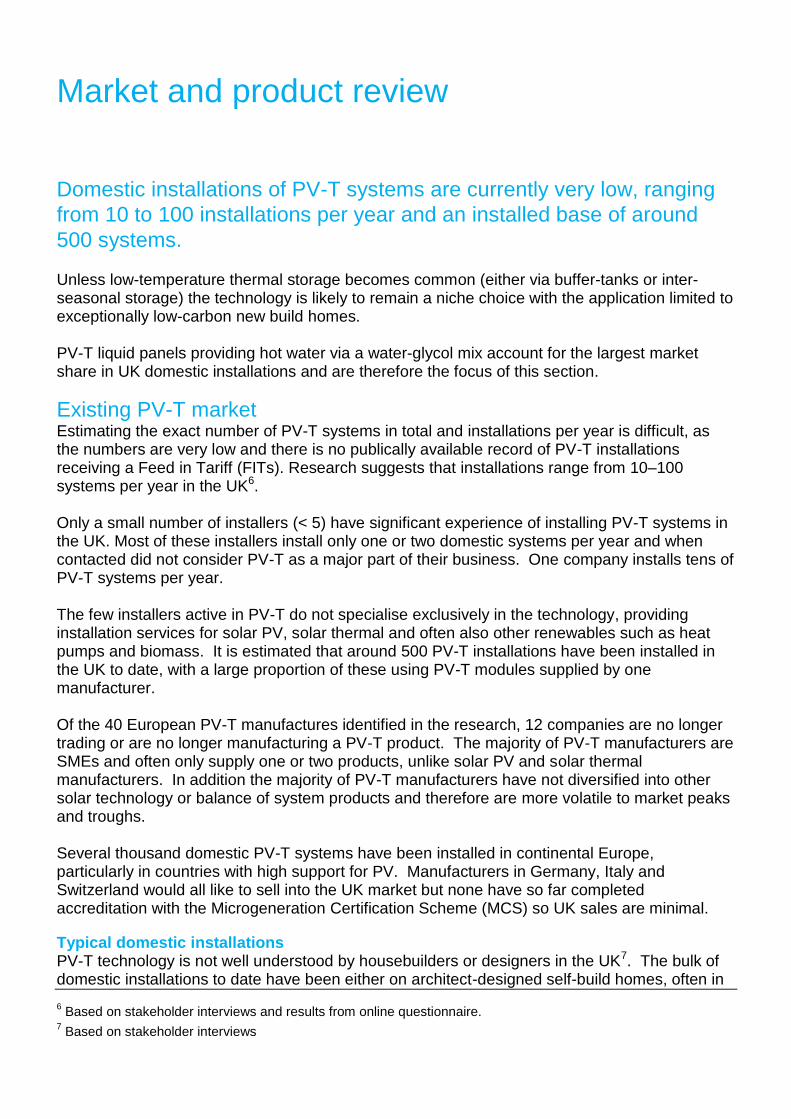
Market and product review ....................................................................................................... 29 Existing PV-T market .............................................................................................................. 29
Typical domestic installations ............................................................................................. 29 Domestic market potential ...................................................................................................... 31
Roof space optimisation / zero carbon homes .................................................................... 31
Thermal demand scenarios ................................................................................................ 32 Technical standards for PV-T ................................................................................................... 35
Certification and testing .......................................................................................................... 36 Energy Related Products (ErP) Directive ............................................................................... 37
PV-T performance .................................................................................................................... 38
How PV-T performance is measured...................................................................................... 39 Performance modelling........................................................................................................... 39
Manufacturer’s claims............................................................................................................. 40 Performance of PV-T in the UK .............................................................................................. 41
Assessing low carbon generation ........................................................................................... 42 Technology lifetime ................................................................................................................ 43 Monitoring for performance .................................................................................................... 44 Opportunities for performance improvements ........................................................................ 44
Costs ........................................................................................................................................ 45 Current Costs ......................................................................................................................... 45
Barriers to deployment ............................................................................................................. 51
Evidence Gathering – Low Carbon Heating Technologies
3
Technical barriers to deployment ........................................................................................... 51 PV-T panel physical properties ........................................................................................... 51
System design complexity .................................................................................................. 52 PV-T system installation complexity.................................................................................... 54 Installer availability .............................................................................................................. 54
Commercial and economic barriers ........................................................................................ 54 Standard hot water cylinders – very limited market............................................................. 55 Lack of proven payback (particularly without incentive support) ......................................... 55 Awareness and perception ................................................................................................. 55
Gap analysis ............................................................................................................................ 56
PV-T product data ............................................................................................................... 56 In-use performance data ..................................................................................................... 56 Cost data ............................................................................................................................ 57 Future market for PV-T ....................................................................................................... 57
Conclusion ............................................................................................................................... 59
References ............................................................................................................................... 63
Appendix A – Case Studies ..................................................................................................... 65 Zero Energy Bills (ZEB) home with PV-T system - Corby ...................................................... 65
PV-T retrofit system for suppling domestic hot water – Tyne & Wear .................................... 66 Hybrid PV-T system with inter-seasonal storage to supply heating and hot water – Leicester ............................................................................................................................................... 67
List of Figures Figure 1 UK domestic energy consumption for heating and hot water by fuel type in 2013 ......... 9
Figure 2 Operational range of spectrum for solar PV cells ......................................................... 10 Figure 3 IV curves of a solar PV module under different operating temperatures ...................... 11 Figure 4 Summary of assessment of PV-T technology by international and European research & development programmes ......................................................................................................... 14 Figure 5 Example of a type 1a unglazed PV-T liquid module without insulation (CGA Technologies, 2015) .................................................................................................................. 17 Figure 6 Example of a type 1b unglazed PV-T module, without thermal insulation, heat exchangers as a separate unit under PV module (GSE Air’System and C.Bösch Solator, 2015) ................................................................................................................................................... 19
Figure 7 Example of a type 2 unglazed PV-T module with insulation (Solar Angel, 2015) ......... 20 Figure 8 Example of a type 3 glazed PV-T module where the PV cells placed on an absorber and Naked Energy's Virtu vacuum tube PV-T (Naked Energy, 2015) ........................................ 21 Figure 9 Example of solar ventilation systems (TwinSolar and Solar Venti, 2015) .................... 22 Figure 10 Example of a type 4 glazed PV-T module where the PV cells placed right under the transparent insulation/glass pane (Energyntegration, 2015) ...................................................... 22 Figure 11 Example of a type 5 PV-T solar collector with concentrator (Solarus and Cogenra Solar, 2015) ............................................................................................................................... 23 Figure 12 Serpentine pipe and harp pipe absorber configurations (Aste, Del Pero, & Leonforte, 2012) .......................................................................................................................................... 24
Figure 13 Example layout of a domestic PV-T liquid panel based system ................................. 25 Figure 14 Example layout of a domestic PV-T air panel based system with warm air heating... 26 Figure 15 Example of a facade mounted PV-T system (SolarWall, 2015) ................................. 27 Figure 16 Domestic installation of PV-T. Image courtesy of Anthony Morgan. ......................... 30
Figure 17 Installation of PV-T to provide heat for a swimming pool. Image courtesy of Anthony Morgan. ...................................................................................................................................... 32 Figure 18 An earth energy bank installed underneath a new build property with PV-T. Image courtesy of Caplin Homes. ......................................................................................................... 33 Figure 19 Sankey diagram comparing system efficiencies of single solar technology systems and a PV-T system .................................................................................................................... 38

Report Summary
4
Figure 20 IESD's PV-T test system and panel layout. Image courtesy of IESD. ....................... 42 Figure 21 Estimated range of CO2 offset by different scales of PV-T systems installed in the UK ................................................................................................................................................... 43 Figure 22 Cost components (including margin) of typical domestic PV-T installation (nominally 2 kWp electric) .............................................................................................................................. 46
Figure 23 Breakdown of solar PV module manufacturing costs (GTM Research, 2014) ........... 46 Figure 24 Global installed capacity and average solar PV system installed costs, 2013-2020E (GTM Research, 2015) .............................................................................................................. 50 Figure 25 The relative effect of temperature on the electrical output of solar PV ....................... 52 List of Tables Table 1 Breakdown of contributors to research by stakeholder type .......................................... 15 Table 2 Manufacturers product information of type 1a unglazed PV-T liquid module without insulation .................................................................................................................................... 18 Table 3 Manufacturers product information of type 1b unglazed PV-T module, without thermal insulation, heat exchangers as a separate unit under PV module ............................................. 19
Table 4 Manufacturers product information of type 2 unglazed PV-T module with insulation .... 20 Table 5 Potential applications of PV-T technology ..................................................................... 27
Table 6 UK companies currently developing alternative PV-T products .................................... 34 Table 7 Current British, European and international standards for solar PV and solar thermal technologies ............................................................................................................................... 35 Table 8 Comparison of PV-T and single solar technology panel cost ........................................ 45
Table 9 Physical properties of example PV-T, solar PV and solar thermal panels ..................... 52

Report Summary
Hybrid solar photovoltaic thermal (PV-T) panels combine two well established renewable energy technologies, solar photovoltaics (PV) modules and solar thermal collectors, into one integrated component that removes generated heat from the solar PV thereby improving electrical efficiencies. However, there will always be a system efficiency trade-off between electrical and heat generation due to the effect temperature has on the efficiency of solar electricity generation. Solar electrical efficiencies have been seen to improve by 4-12% when compared to a solar PV only scenario. Domestic PV-T systems can be installed to contribute to hot water demand and/ or low temperature space heating as well as supplying renewable electricity. Generally domestic scale PV-T systems are not able to generate sufficient heat all year round to cover all the heating requirements of a home and therefore need to be operated in conjunction with another heating technology. There are number of different approaches to the technology including whether the panel is glazed or insulated, the heat transfer medium used (i.e. liquid or air) and how it is integrated into a building (i.e. on-roof, building integrated etc.). Product choice is limited in comparison to other solar technologies. There are approximately 40 European manufacturers of PV-T products, but only one manufacturer has Microgeneration Certification Scheme accredited products. Five British companies are currently developing new products for the UK domestic PV-T market in 2016. The UK has a very small PV-T market with an estimated 10 - 100 systems being installed each year and a total of ~500 PV-T systems installed to date, the majority of which use an unglazed and insulated panel with water/glycol. These systems are normally installed on zero carbon self-build homes or on social housing trying to achieve low or zero bills for tenants. PV-T systems are more often installed on new build properties then as a retro-fit solution. Most domestic systems are sized for the provision of hot water during the summer without overheating. Typically this is 3-6 kWth (thermal) capacity and 1-3 kWp (electric) capacity. Costs range from 1.5 – 2 times more than an equivalent solar PV system and 1 – 1.5 times more than an equivalent solar thermal system, with an estimated payback of 15-21 years excluding any policy support. PV-T technology only makes technical and commercial sense where there is a suitable use for the low-temperature heat that the system can provide or there is limited space for maximising renewable energy generation from other solar technologies. Market barriers include:
More complex system design and requirement for additional thermal storage capacity to ensure the system operates efficiently
More technically demanding installation and installer availability
Lack of awareness of the technology
Longer financial payback than other solar technologies
Executive summary
6
Executive summary
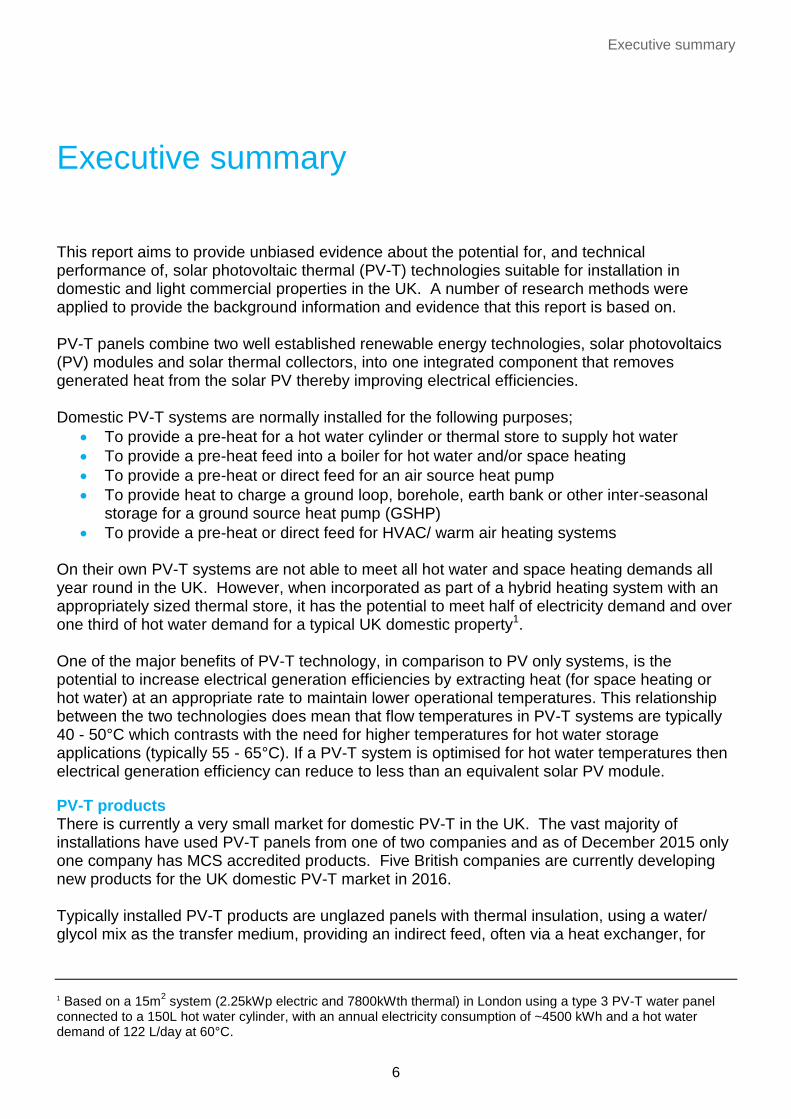
This report aims to provide unbiased evidence about the potential for, and technical performance of, solar photovoltaic thermal (PV-T) technologies suitable for installation in domestic and light commercial properties in the UK. A number of research methods were applied to provide the background information and evidence that this report is based on. PV-T panels combine two well established renewable energy technologies, solar photovoltaics (PV) modules and solar thermal collectors, into one integrated component that removes generated heat from the solar PV thereby improving electrical efficiencies. Domestic PV-T systems are normally installed for the following purposes;
To provide a pre-heat for a hot water cylinder or thermal store to supply hot water
To provide a pre-heat feed into a boiler for hot water and/or space heating
To provide a pre-heat or direct feed for an air source heat pump
To provide heat to charge a ground loop, borehole, earth bank or other inter-seasonal storage for a ground source heat pump (GSHP)
To provide a pre-heat or direct feed for HVAC/ warm air heating systems
On their own PV-T systems are not able to meet all hot water and space heating demands all year round in the UK. However, when incorporated as part of a hybrid heating system with an appropriately sized thermal store, it has the potential to meet half of electricity demand and over one third of hot water demand for a typical UK domestic property1. One of the major benefits of PV-T technology, in comparison to PV only systems, is the potential to increase electrical generation efficiencies by extracting heat (for space heating or hot water) at an appropriate rate to maintain lower operational temperatures. This relationship between the two technologies does mean that flow temperatures in PV-T systems are typically 40 - 50°C which contrasts with the need for higher temperatures for hot water storage applications (typically 55 - 65°C). If a PV-T system is optimised for hot water temperatures then electrical generation efficiency can reduce to less than an equivalent solar PV module.
PV-T products There is currently a very small market for domestic PV-T in the UK. The vast majority of installations have used PV-T panels from one of two companies and as of December 2015 only one company has MCS accredited products. Five British companies are currently developing new products for the UK domestic PV-T market in 2016. Typically installed PV-T products are unglazed panels with thermal insulation, using a water/ glycol mix as the transfer medium, providing an indirect feed, often via a heat exchanger, for
1 Based on a 15m
2 system (2.25kWp electric and 7800kWth thermal) in London using a type 3 PV-T water panel
connected to a 150L hot water cylinder, with an annual electricity consumption of ~4500 kWh and a hot water demand of 122 L/day at 60°C.

Evidence Gathering – Low Carbon Heating Technologies
7
domestic hot water and/or space heating. With an average energy output ratio of 3:1, thermal to electric. The detail and definition of PV-T product information varies from manufacturer to manufacturer, making it difficult for consumers, and in some cases system designers, to compare different products and approaches to PV-T. A lack of standards means that performance indicators cannot necessarily be impartially compared between products.
PV-T performance It has only been possible to identify a small percentage of the estimated 500 PV-T systems installed in the UK, and very few of these have any credible method of monitoring performance, efficiency even less so. As a result the performance data reviewed can only be taken as a rough guide to the actual performance of PV-T in the UK. System design is considered to be the main reason for poor performance of PV-T systems, followed by poor system control. The approach to system design will vary from application to application depending on the load requirements and integration of the system. Temperature control is important to preserve the lifespan of the panels. The performance of a PV-T product in isolation is hard to define. Theoretically a combined system efficiency of 60–80% can be achieved in low temperature applications, however from the data gathered there has been no demonstration that UK solar PV-T systems realise this. Overall specific yield is improved in PV-T systems on new build properties. This is most likely as a result of the system being designed as an integral part of the building, optimising system layout, distribution design, integration with other heating technologies and control. The electrical performance of more recently installed PV-T systems does show an overall increase in the annual (electrical) energy output of 4-12%2 in comparison with modelled solar PV systems in the same situation. Smaller PV-T systems (1-2 kWp) and systems employing micro-inverters or DC optimisers show the largest improvement. The main opportunities for improvement in PV-T performance under current rates of deployment are considered to be using PV-T as part of a hybrid energy solution e.g. in combination with a heat pump.
Market & costs Domestic installations of PV-T systems are currently very low, ranging from 10 to 100 installations per year. Typical applications are;
Zero or near zero carbon private new build homes or refurbishments
Social/ local housing associations and builders wanting to reduce household energy bills to almost zero
Unless large thermal stores and/ or low temperature distribution becomes common in UK domestic properties, PV-T is likely to remain a niche choice, with application limited to exceptionally low carbon new build homes. Typical installed costs (which include installation, plus inverters and pipework, but excluding thermal storage) are around £2,250-3,000/kWp electric. In comparison with separate solar technologies the cost of PV-T can be considered to be;
2 Based on the monitored data from 6 domestic PV-T installations in the UK of different scales and with varying
heat loads.
Executive summary
8
1.5 – 2 times the cost of an equivalent rated solar PV system
1 – 1.5 times the cost of an equivalent rated good quality solar thermal system. The financial payback of a system is highly dependent on self-consumption of generated electricity and heat. For domestic installations where 50% of electricity and 100% of heat generated off-sets imported energy, payback is in the region of 15-21 years without any policy support.
Future growth and barriers PV-T technology only makes technical and commercial sense where there is a suitable use for the low-temperature heat that the system can provide and therefore market growth will depend on how storage and heat demand change over time, and would require policy support. The possible growth markets for PV-T in the longer term are considered to be;
Where there is limited roof space for installation (including zero carbon homes)
High hot water demand (particularly in the summer)
Potential barriers to the uptake of PV-T technology include;
More complex system design and requirement for additional thermal storage capacity to ensure the system operates efficiently
More technically demanding installation and installer availability
Lack of awareness of the technology
Longer financial payback than other solar technologies under current incentive rates
A number of areas have been identified where further evidence is required to provide a higher level of assurance in the outcomes of this report such as; comparability of PV-T product data, reliability of in-use performance data, integrity of cost data and the effect other markets may have on the future of PV-T.
Introduction
There is an opportunity for a variety of distributed low carbon
technologies to replace traditional heating fuels in homes; reducing
associated carbon emissions, potentially generating energy more
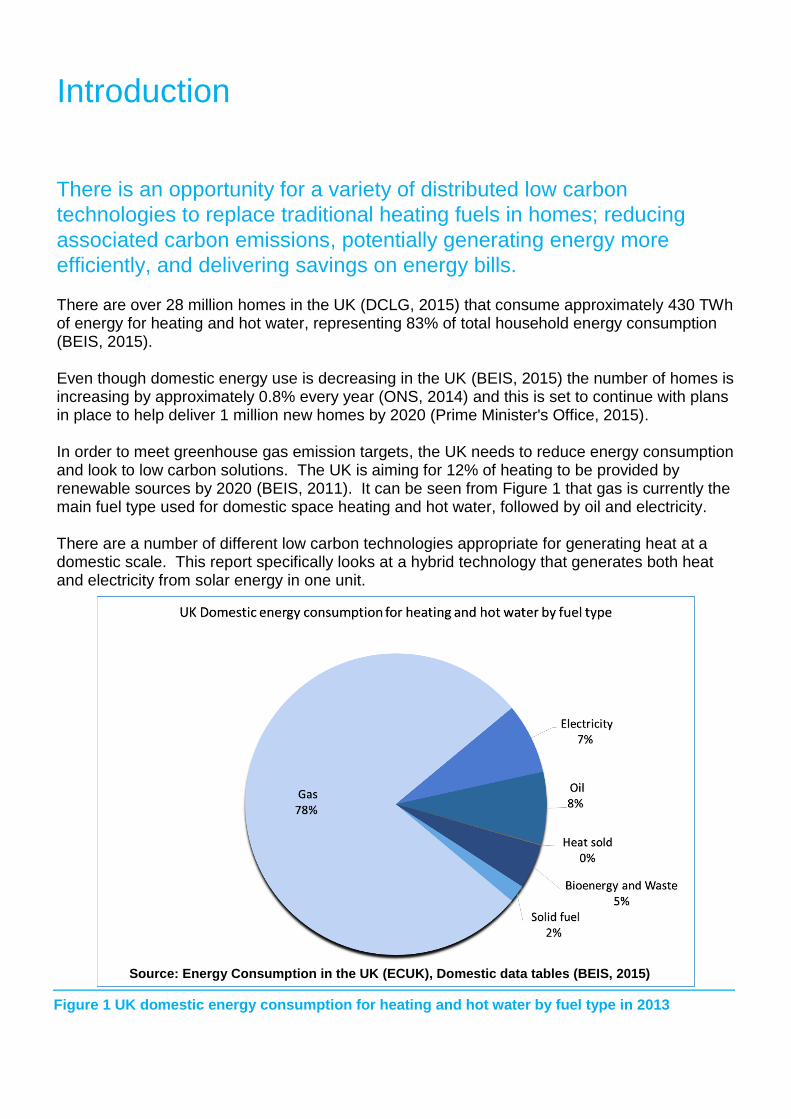
efficiently, and delivering savings on energy bills. There are over 28 million homes in the UK (DCLG, 2015) that consume approximately 430 TWh of energy for heating and hot water, representing 83% of total household energy consumption (BEIS, 2015). Even though domestic energy use is decreasing in the UK (BEIS, 2015) the number of homes is increasing by approximately 0.8% every year (ONS, 2014) and this is set to continue with plans in place to help deliver 1 million new homes by 2020 (Prime Minister's Office, 2015). In order to meet greenhouse gas emission targets, the UK needs to reduce energy consumption and look to low carbon solutions. The UK is aiming for 12% of heating to be provided by renewable sources by 2020 (BEIS, 2011). It can be seen from Figure 1 that gas is currently the main fuel type used for domestic space heating and hot water, followed by oil and electricity. There are a number of different low carbon technologies appropriate for generating heat at a domestic scale. This report specifically looks at a hybrid technology that generates both heat and electricity from solar energy in one unit.
Source: Energy Consumption in the UK (ECUK), Domestic data tables (BEIS, 2015)
Figure 1 UK domestic energy consumption for heating and hot water by fuel type in 2013

Introduction
10
Hybrid Solar Photovoltaic Thermal Panels (PV-T) PV-T panels combine two well established renewable energy technologies, solar photovoltaic (PV) modules and solar thermal collectors, into one integrated component that generates both low carbon electricity and heat from the same renewable energy source. Typically installed as a roof mounted technology, heat is extracted by either passing air or a liquid across the back of the panel, essentially drawing the heat away as it is generated and transferring it either indirectly (e.g. into a domestic hot water cylinder or space heating circuit) or directly (e.g. direct air space heating). In order for a PV-T system to function there needs to be a temperature differential between the panel and the thermal store. By combining these two technologies the generation potential per square meter can be substantially increased (Treberspurg, Djalili, & Staller, 2011). This is particularly advantageous when space for installation can be limited, such as on domestic roofs. In some systems it is possible to obtain the same energy output as a side-by-side installation of solar PV and solar thermal in 40% less area (Treberspurg, Djalili, & Staller, 2011). In addition the percentage of solar irradiation converted into useable energy is potentially increased due to the individual technologies operating in different ranges of the solar spectrum. Solar PV cells are spectrally selective absorbers that operate in a wavelength range of 350-1200nm (i.e. mainly visible light, UVA and the lower end of infrared) as illustrated in Figure 2. The solar energy outside this range can then be collected in the form of heat (Santbergen & van Zolingen, 2007) and co-generation conversion can reach 80% (IEA, 2011).
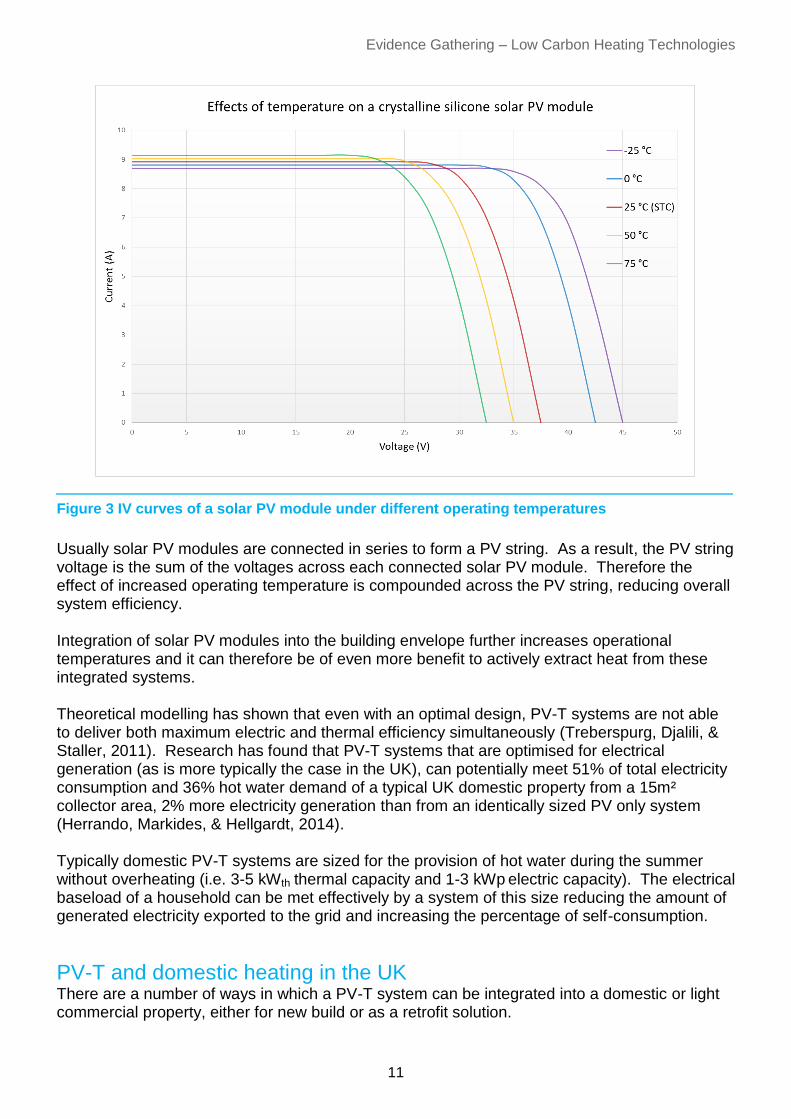
The other key advantage of a hybrid system is the synergy between the two technologies with respect to temperature. The voltage of a solar PV module is affected by temperature. Heat is produced in a solar PV cell as a result of absorbing electromagnetic radiation. As module temperatures increase voltage decreases, which reduces the energy generated, as depicted in the I-V curve in Figure 3. Typical temperature power co-efficients3 for crystalline silicon PV modules are in the range of -0.30 to -0.50%/°C (DGS, 2009). Essentially a solar PV cell produces both renewable electricity and waste heat. Therefore having a combined technology that removes heat from the PV cells can improve the effciency of a sollar PV module as it will be operating at a lower temperature, thereby enabling it to generate more energy.
3 For maximum power point (MPP) power under standard test conditions (STC) defined as 1000W/m² irradiance,
25°C module temperature, AM1.5g spectrum.
Figure 2 Operational range of spectrum for solar PV cells
Evidence Gathering – Low Carbon Heating Technologies
11
Usually solar PV modules are connected in series to form a PV string. As a result, the PV string voltage is the sum of the voltages across each connected solar PV module. Therefore the effect of increased operating temperature is compounded across the PV string, reducing overall system efficiency. Integration of solar PV modules into the building envelope further increases operational temperatures and it can therefore be of even more benefit to actively extract heat from these integrated systems. Theoretical modelling has shown that even with an optimal design, PV-T systems are not able to deliver both maximum electric and thermal efficiency simultaneously (Treberspurg, Djalili, & Staller, 2011). Research has found that PV-T systems that are optimised for electrical generation (as is more typically the case in the UK), can potentially meet 51% of total electricity consumption and 36% hot water demand of a typical UK domestic property from a 15m² collector area, 2% more electricity generation than from an identically sized PV only system (Herrando, Markides, & Hellgardt, 2014). Typically domestic PV-T systems are sized for the provision of hot water during the summer without overheating (i.e. 3-5 kWth thermal capacity and 1-3 kWp electric capacity). The electrical baseload of a household can be met effectively by a system of this size reducing the amount of generated electricity exported to the grid and increasing the percentage of self-consumption.
PV-T and domestic heating in the UK There are a number of ways in which a PV-T system can be integrated into a domestic or light commercial property, either for new build or as a retrofit solution.
Figure 3 IV curves of a solar PV module under different operating temperatures
Introduction
12
Generally PV-T systems need to be operated in conjunction with another heating system as the levels of heat and electricity generated in a domestic scale system in the UK are not normally sufficient to meet all space heating and hot water requirements, especially in the winter months when system performance is at its lowest and space heating demand is at its highest. The average UK home uses approximately 15,270 kWh4 of energy for space heating and hot water per year (BEIS, 2015). The most commonly installed central heating system in UK domestic properties are gas fuelled. Different types of PV-T technologies can be integrated into different types of space heating and/or hot water systems. The method in which heat is extracted i.e. by air or liquid, will often dictate the best type of heating systems to integrate with. Some PV-T products have been designed to integrate only with a specific type of space heating or hot water system, and often the heat generated by PV-T will only contribute to either space heating or hot water. In order for a PV-T system to provide the most benefit it is necessary to have some form of thermal storage within the property, preferably a solution that can accommodate all of the heat generation available from the PV-T system. As a result of this requirement PV-T systems are often operated as part of a hybrid heating system, combining one or more traditional and/or other low carbon heating technologies. Domestic PV-T systems are normally installed for the following purposes;
To provide a pre-heat for a hot water cylinder or thermal store to supply hot water
To provide a pre-heat feed into a boiler for hot water and/or space heating
To provide a pre-heat or direct feed for an air source heat pump
To provide heat to charge a ground loop, borehole, earth bank or other inter-seasonal storage for a GSHP
To provide a pre-heat or direct feed for HVAC/ warm air heating systems
Typically the flow temperatures that are achieved by PV-T panels range between 40 – 50°C, making it suitable for use with low temperature heating systems which operate at 35 – 45°C. Most PV-T panels are temperature rated up to 80°C making them suitable for hot water applications, however this temperature is normally only reached during peak production times (i.e. summer) and additional temperature control measures need to be put in place to ensure L8 compliance5. The seasonal disparity between peak heat generation and peak heat demand does mean that PV-T will only ever cover a portion of domestic space heating/ hot water requirements. In situations where the heat store (i.e. hot water cylinder, buffer tank, heating circuit) has reached its temperature set point, the PV-T panels can start to stagnate (depending on the control system in place – some systems have a method of venting/ dumping excess heat). Sustained high temperatures in a PV-T system will affect electrical output and can effect component lifespan. Increasing heat storage capacity can overcome this issue, however in
4 Calculated from ECUK Domestic data tables (2015 update), Table 3.07 temperature corrected average energy
consumption of gas and electricity in 2013, Table 3.05 energy consumption by end use and fuel type in 2013(P). 5 HSE Guidance Note L8, Legionnaires Disease, The control of legionella bacteria in water systems, Approved
Code of Practice and Guidance

Evidence Gathering – Low Carbon Heating Technologies
13
periods of low heat generation (i.e. winter) an oversized tank will consume more mains energy to maintain the required temperature and reduce the overall annual efficiency of the system.
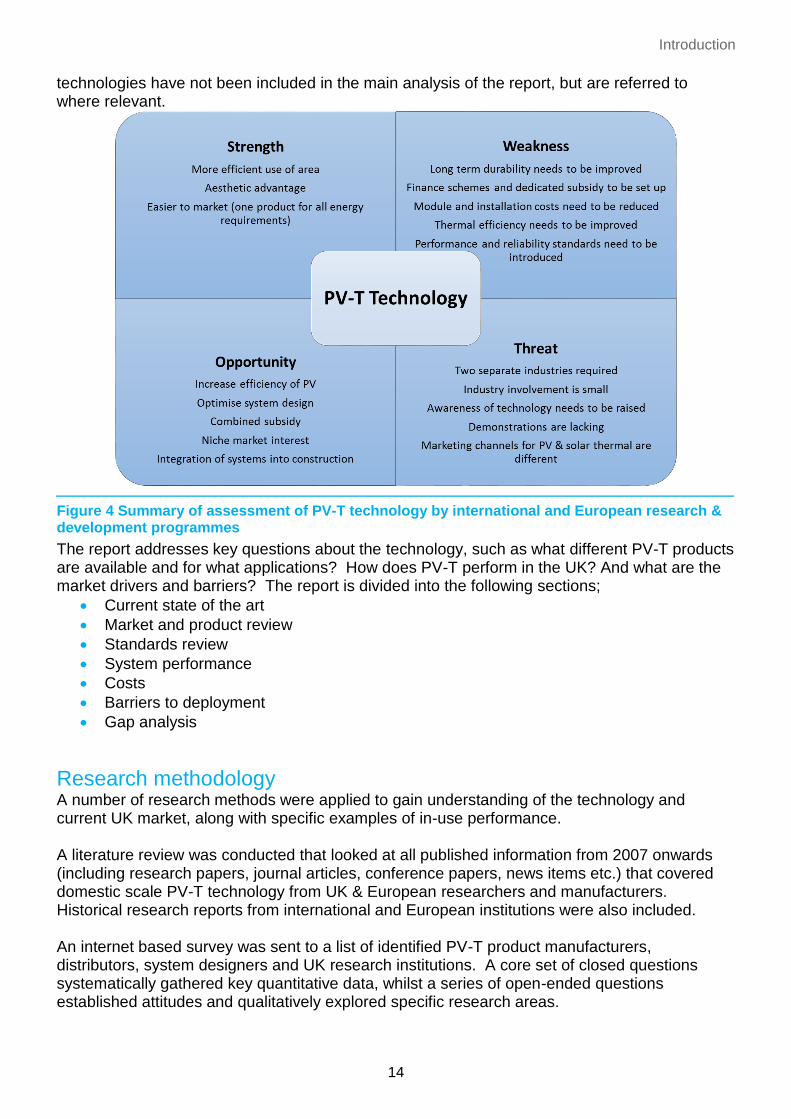
Development of PV-T Technology PV-T technology has been in development since the 1970s (Chow, 2010), mainly in the academic field. The number and variation of commercially available products has increased in the last 15 years, currently there are approximately 40 European manufacturers of PV-T products. There are approximately 500 installations in the UK to date in all scales and applications and PV-T is still considered a ‘new’ technology. A number of international and European funded projects have looked at the technology, identifying routes to market, potential technical barriers and assessing what support is required to help increase the take-up of PV-T. In 2002 the International Energy Agency (IEA) assessed the potential of PV-T technology as part of one of it’s programmes of international energy co-operation. The IEA Photovoltaic Power Systems Programme (PVPS) Task 7 primarily focused on the integration of the technology into architectural design and identification of barriers to future development (IEA, 2002). The PVT Forum Project was launced in 2003 as part of the European coordination action ‘PV-Catapult’. The project created the PVT Roadmap, an action plan for the large-scale introduction of PVT technology in Europe (Zondag, et al., 2005). As a result of the initial scoping work completed by PVPS in 2002, the IEA set up a PV-T specific research and development group, Task Group 35, under the Solar Heating & Cooling Programme in 2005. The project found that the domestic sector was the largest market for the technology, with the combination of PV-T and heat pumps the most promising concept (Hansen, Sorensen, Bystrom, Collins, & Karlsson, 2007). Task Group 35 also set out long term aspirations to use PV-T for industrial and agricultural applications and for solar cooling. The conclusions drawn from these three projects are summarised in Figure 4. The PVT-Norm project was set up in 2014 to address one of the key weaknesses identified by the IEA research – performance and reliability standards. The project involves German testing and certification service providers such as TÜV Rheinland and Fraunhofer-Gesellschaft. The aim of PVT-Norm is to establish the standardisation of multi-functional PV-T collectors by analysing working conditions and providing a testing base. The project is currently developing a draft test standard for PV-T modules to be sent to the International Electrotechnical Commission (IEC) Technical Committee 82 for consultation and potential adoption as a new international standard.
Report scope This report aims to provide unbiased evidence about the technical potential and performance of PV-T technologies suitable for domestic and light commercial installations in the UK. Only European manufactured products that are either currently available on the market or are near market (i.e. Technology Readiness Level 9) have been included in the research. There are a number of other technologies that are similar to PV-T and can provide the same combined energy output, but these are not sold as a single unit that includes solar PV cells and a heat transfer mechanism, such as solar PV mounting systems with heat recovery. These
Introduction
14
technologies have not been included in the main analysis of the report, but are referred to where relevant.
The report addresses key questions about the technology, such as what different PV-T products are available and for what applications? How does PV-T perform in the UK? And what are the market drivers and barriers? The report is divided into the following sections;
Current state of the art
Market and product review
Standards review
System performance
Costs
Barriers to deployment
Gap analysis
Research methodology A number of research methods were applied to gain understanding of the technology and current UK market, along with specific examples of in-use performance. A literature review was conducted that looked at all published information from 2007 onwards (including research papers, journal articles, conference papers, news items etc.) that covered domestic scale PV-T technology from UK & European researchers and manufacturers. Historical research reports from international and European institutions were also included. An internet based survey was sent to a list of identified PV-T product manufacturers, distributors, system designers and UK research institutions. A core set of closed questions systematically gathered key quantitative data, whilst a series of open-ended questions established attitudes and qualitatively explored specific research areas.
Figure 4 Summary of assessment of PV-T technology by international and European research & development programmes
Evidence Gathering – Low Carbon Heating Technologies
15
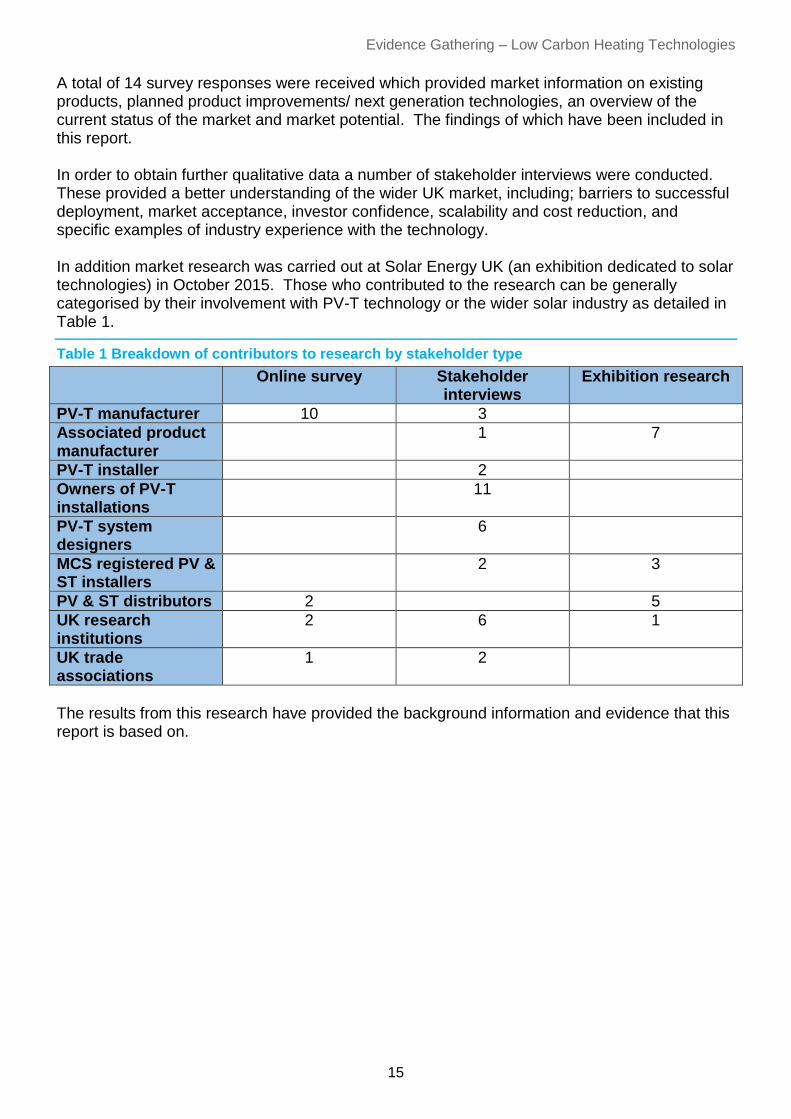
A total of 14 survey responses were received which provided market information on existing products, planned product improvements/ next generation technologies, an overview of the current status of the market and market potential. The findings of which have been included in this report. In order to obtain further qualitative data a number of stakeholder interviews were conducted. These provided a better understanding of the wider UK market, including; barriers to successful deployment, market acceptance, investor confidence, scalability and cost reduction, and specific examples of industry experience with the technology. In addition market research was carried out at Solar Energy UK (an exhibition dedicated to solar technologies) in October 2015. Those who contributed to the research can be generally categorised by their involvement with PV-T technology or the wider solar industry as detailed in Table 1.
Table 1 Breakdown of contributors to research by stakeholder type
Online survey Stakeholder interviews
Exhibition research
PV-T manufacturer 10 3
Associated product manufacturer
1 7
PV-T installer 2
Owners of PV-T installations
11
PV-T system designers
6
MCS registered PV & ST installers
2 3
PV & ST distributors 2 5
UK research institutions
2 6 1
UK trade associations
1 2
The results from this research have provided the background information and evidence that this report is based on.

Current state of the art
PV-T modules can be categorised in a number of ways; by their heat
transfer medium (i.e. liquid or air), the relative positioning of the solar
PV cells and the absorber, whether they are glazed or unglazed,
whether they are insulated or not and how they are mounted (i.e. on-
roof, in-roof, façade mounted, etc.).
Types of PV-T modules Over the last 40 years a number of different approaches to combining solar PV and solar thermal have been investigated. However the majority of these have been prototype units developed by academics with a smaller number of system architectures becoming market ready. PV-T can be described as a PV module and thermal collector combined to remove generated heat from the solar PV to improve electrical efficiencies. The PVT-Norm project has categorised the different approaches to PV-T panels as follows;
1a - Unglazed without thermal insulation
1b - Unglazed, without thermal insulation, heat exchanger as a separate unit under PV
module
2 - Unglazed with thermal insulation
3 - Glazed PV cells are placed on the absorber
4 - Glazed PV cells are placed right under the transparent insulation/glass pane
5 - PV-T solar collectors with concentrators
Despite worldwide activities, the number of commercially available PV-T panels and systems is still very limited (Treberspurg, Djalili, & Staller, 2011). Of the 40 European PV-T manufactures identified in the research, 12 companies are no longer trading or are no longer manufacturing a PV-T product, only 13 seem to have any market presence in the UK, and only a few products are actually being installed or specified in the UK. The key differentiators between products are whether additional glazing has been added in addition to the toughened glass cover of a PV module, and whether the panel is insulated. More than 80% of commercially available PV-T modules are unglazed - these are more suitable for low temperature applications such as pre-heating or pool heating (Althuas, Bott, & Fritzsche, 2014). Typically the products installed in the UK have been either type 1a or type 2 PV-T products, using either liquid or air as the heat transfer medium. However, there has been a recent increase in the number of type 1b products (heat exchanger as a separate unit under PV module) available as a result of the applicability to retrofit to an existing installed PV system. A technical description, product examples and the relative advantages and disadvantages of each PV-T approach are discussed below. Where possible comparable data has been provided with respect to electrical and thermal ratings, efficiencies and operational temperatures. However, as there are no standards currently in place for assessing the performance of PV-T
Evidence Gathering – Low Carbon Heating Technologies
17
products there is potential that these technical characteristics have all been determined by different methods and can therefore not necessarily be compared like for like.
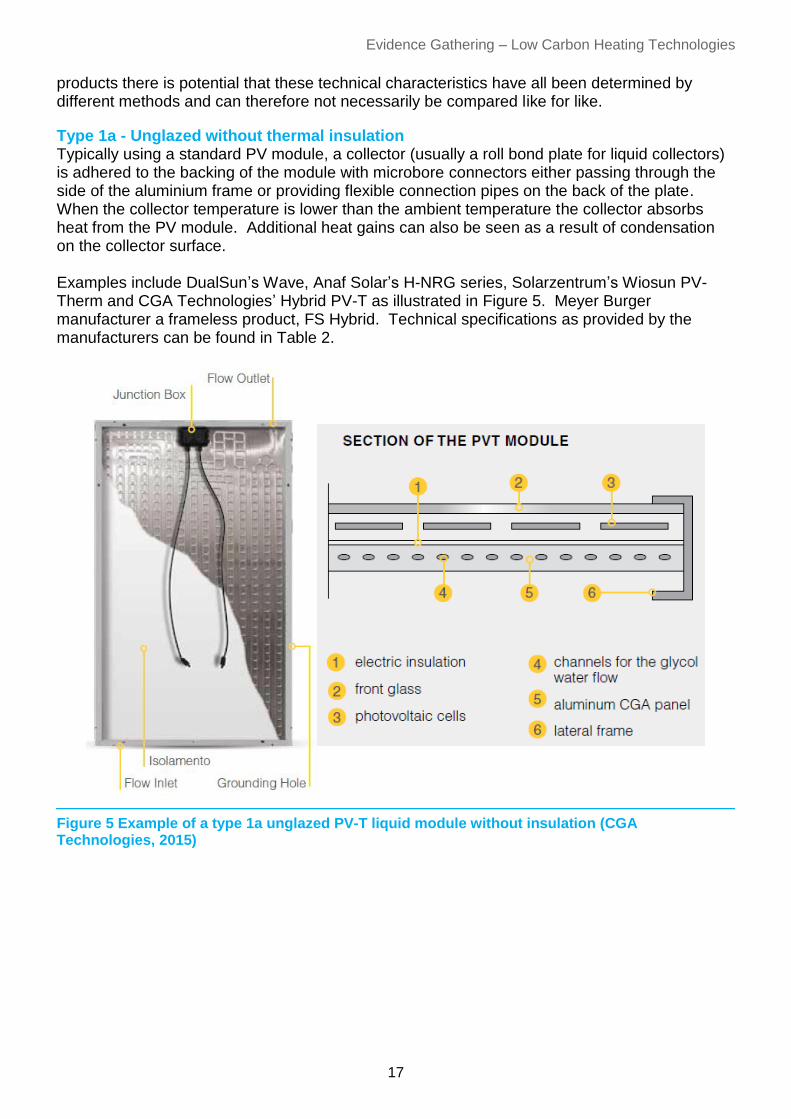
Type 1a - Unglazed without thermal insulation Typically using a standard PV module, a collector (usually a roll bond plate for liquid collectors) is adhered to the backing of the module with microbore connectors either passing through the side of the aluminium frame or providing flexible connection pipes on the back of the plate. When the collector temperature is lower than the ambient temperature the collector absorbs heat from the PV module. Additional heat gains can also be seen as a result of condensation on the collector surface. Examples include DualSun’s Wave, Anaf Solar’s H-NRG series, Solarzentrum’s Wiosun PV-Therm and CGA Technologies’ Hybrid PV-T as illustrated in Figure 5. Meyer Burger manufacturer a frameless product, FS Hybrid. Technical specifications as provided by the manufacturers can be found in Table 2.
Figure 5 Example of a type 1a unglazed PV-T liquid module without insulation (CGA Technologies, 2015)

Current state of the art
18
The advantage of this approach is the relatively simple construction, providing an efficient method of cooling the solar PV cells. The technology is modular and therefore scalable (to a point), allowing systems to be sized effectively for different hot water/ space heating/ hybrid energy system requirements. By using standard solar PV modules it is possible to use standard mounting systems and integrate the systems within a larger solar PV array, providing a uniform aesthetic. The low profile of the PV-T modules also make it possible to integrate into a roof or façade. The main disadvantage of a type 1a unglazed module in comparison with a type 2 glazed module is the heat losses. Heat losses are inherently higher, reducing overall efficiency of the thermal side of the system, but assisting the electrical efficiency for systems with lower flow rates.
Table 2 Manufacturers product information of type 1a unglazed PV-T liquid module without insulation
Type 1b - Unglazed, without thermal insulation, heat exchanger as a separate unit under PV module This type of product normally comprises only the thermal collector (heat exchanger) element of the PV-T system, allowing any solar PV module to be hybridised into a PV-T module. Generally this type of product comes in two forms; either a ventilated PV with heat recovery system, or a retrofit collector insert. An example of each is provided in Figure 6.
Manufacturer Anaf Solar CGA Technologies
Dual Sun Meyer Burger
Wiosun
Product H-NRG Hybrid Wave Hybrid PV-Therm
PV Cell Poly - Mono Mono Mono/ Poly
PV rating 230 Wp - 250 Wp 275-285 Wp 190-205 Wp
Electrical efficiency
13.9 % - 15.4 % 16.8-17.4 % 14.5-15.2 %
Thermal output
400 Wth 800 Wth 912 Wth 900 Wth 781 Wth
Thermal efficiency
51.3 % (ƞ0) 44.3 % (µ0) 55 % (α0) 60 % 71.5 % (ƞ0)
Max. pressure 3 bar 4 bar 1.2 bar 6 bar 1.5 bar
Flow rate 1.2 l/min - - 0.83-1.67 l/min
0.5-1.67 l/min
Unit area 1.65 m2 1.65 m2 1.66 m2 1.64 m2 1.33 m2
Mass 34 kg 34 kg 31.7 kg 29 kg 40 kg
Max. temp. 80 °C 80 °C 74.7 °C ~80 °C 75 °C

Evidence Gathering – Low Carbon Heating Technologies
19
Some systems provide trays in which to sit solar PV modules, others are part of a roof mounting solution. Either air or liquid are used as the transfer medium. Examples include C. Bosch’s Solator (a thermal cooling unit that is similar to the collectors used in type 1a products), GSE’s Air’System and Systovi’s R-Volt (a ventilation system that contains an electric element to boost temperatures if required for warm air heating, with options for hot water integration). Systovi’s packaged system also includes a standard solar PV module. Technical specifications for these products can be found in Table 3. The advantages of this approach are similar to those of type 1a, providing a scalable system that is easily integrated into a roof. Type 1b products generally allow more flexibility with regards to the choice of solar PV module that is used, meaning they can be retrofitted to existing PV systems.
Table 3 Manufacturers product information of type 1b unglazed PV-T module, without thermal insulation, heat exchangers as a separate unit under PV module
Manufacturer C. Bösch Systovi GSE
Product Solator - PVTherm R-Volt Air’System
PV Cell Mono/ not supplied Mono Not supplied
PV rating 280-300 Wp 250Wp Typically 250 Wp
Electrical efficiency 17.11-18.3 % 16.5 % -
Thermal output 902-908Wth peak 411 Wth Not stated
Thermal efficiency 55-56 % (ƞ0) Not stated Not stated
Max. temperature 80 °C 65 °C 57 °C
Max. pressure 6 bar - -
Flow rate 50-120 l/hr 100-400 m³/hr 200-240 m³/hr
Unit area 1.62-1.65 m2 1.53 m² Min 6 units per
system
1.68 m² Min 6 units per
system
Mass 28 kg 17.5 kg Not stated
The main disadvantage of a type 1b system is that they do not necessarily maximise the heat transfer between the two elements, resulting in a lower heat transfer coefficient. In addition some systems are limited in their application only providing one method of heating system integration i.e. warm air.
Figure 6 Example of a type 1b unglazed PV-T module, without thermal insulation, heat exchangers as a separate unit under PV module (GSE Air’System and C.Bösch Solator, 2015)
Current state of the art
20
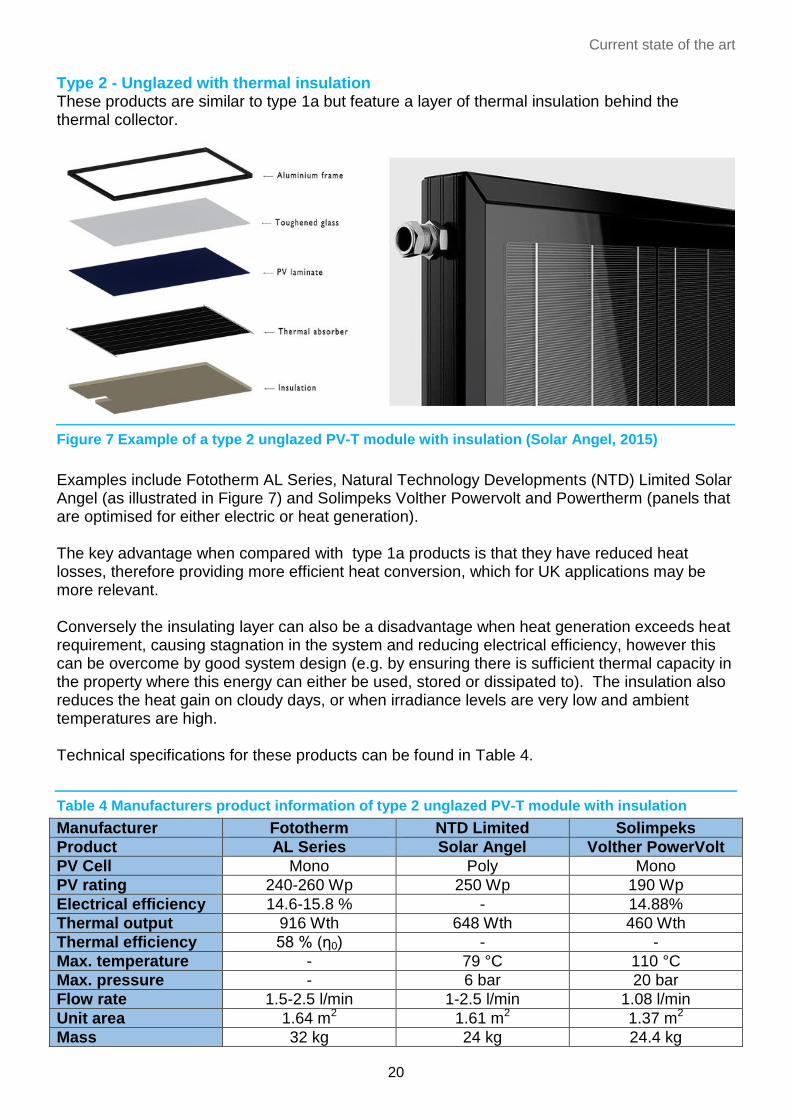
Type 2 - Unglazed with thermal insulation These products are similar to type 1a but feature a layer of thermal insulation behind the thermal collector.
Examples include Fototherm AL Series, Natural Technology Developments (NTD) Limited Solar Angel (as illustrated in Figure 7) and Solimpeks Volther Powervolt and Powertherm (panels that are optimised for either electric or heat generation). The key advantage when compared with type 1a products is that they have reduced heat losses, therefore providing more efficient heat conversion, which for UK applications may be more relevant. Conversely the insulating layer can also be a disadvantage when heat generation exceeds heat requirement, causing stagnation in the system and reducing electrical efficiency, however this can be overcome by good system design (e.g. by ensuring there is sufficient thermal capacity in the property where this energy can either be used, stored or dissipated to). The insulation also reduces the heat gain on cloudy days, or when irradiance levels are very low and ambient temperatures are high. Technical specifications for these products can be found in Table 4.
Table 4 Manufacturers product information of type 2 unglazed PV-T module with insulation
Manufacturer Fototherm NTD Limited Solimpeks
Product AL Series Solar Angel Volther PowerVolt
PV Cell Mono Poly Mono
PV rating 240-260 Wp 250 Wp 190 Wp
Electrical efficiency 14.6-15.8 % - 14.88%
Thermal output 916 Wth 648 Wth 460 Wth
Thermal efficiency 58 % (ƞ0) - -
Max. temperature - 79 °C 110 °C
Max. pressure - 6 bar 20 bar
Flow rate 1.5-2.5 l/min 1-2.5 l/min 1.08 l/min
Unit area 1.64 m2 1.61 m2 1.37 m2
Mass 32 kg 24 kg 24.4 kg
Figure 7 Example of a type 2 unglazed PV-T module with insulation (Solar Angel, 2015)
Evidence Gathering – Low Carbon Heating Technologies
21
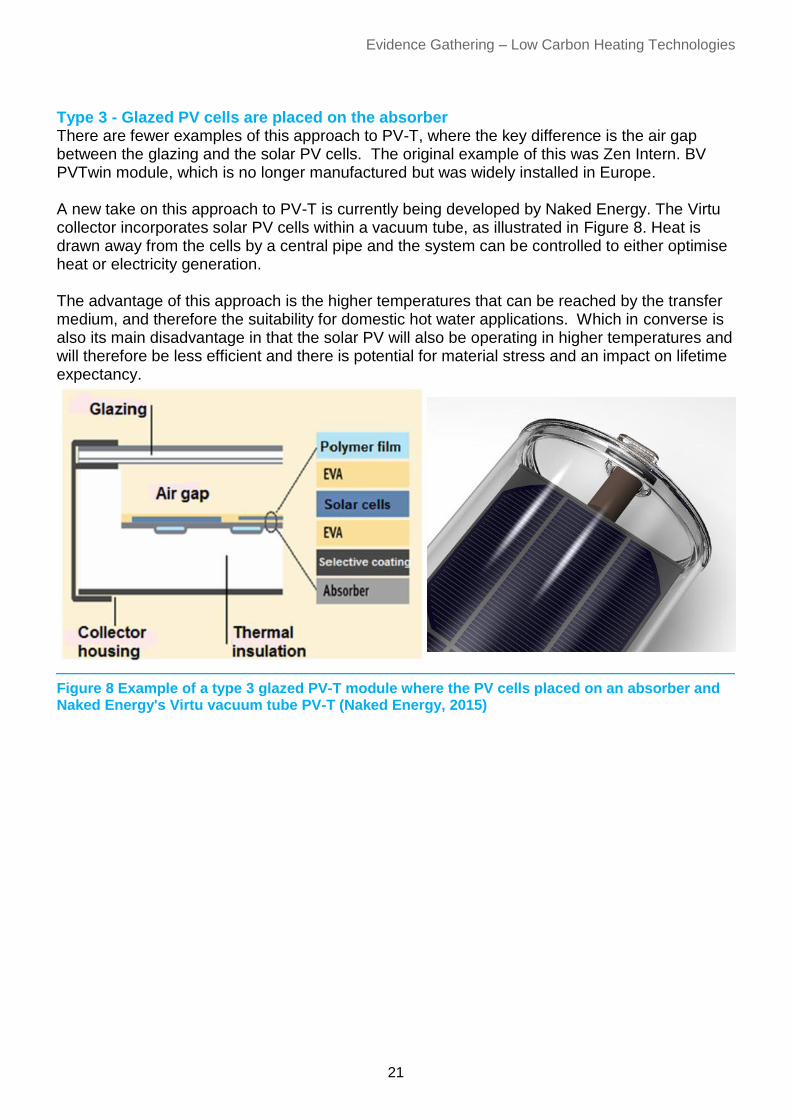
Type 3 - Glazed PV cells are placed on the absorber There are fewer examples of this approach to PV-T, where the key difference is the air gap between the glazing and the solar PV cells. The original example of this was Zen Intern. BV PVTwin module, which is no longer manufactured but was widely installed in Europe. A new take on this approach to PV-T is currently being developed by Naked Energy. The Virtu collector incorporates solar PV cells within a vacuum tube, as illustrated in Figure 8. Heat is drawn away from the cells by a central pipe and the system can be controlled to either optimise heat or electricity generation. The advantage of this approach is the higher temperatures that can be reached by the transfer medium, and therefore the suitability for domestic hot water applications. Which in converse is also its main disadvantage in that the solar PV will also be operating in higher temperatures and will therefore be less efficient and there is potential for material stress and an impact on lifetime expectancy.
Figure 8 Example of a type 3 glazed PV-T module where the PV cells placed on an absorber and Naked Energy's Virtu vacuum tube PV-T (Naked Energy, 2015)

Current state of the art
22
Another variation on a type 3 PV-T product is solar powered ventilation systems. Grammer Solar’s Twin Solar and SolarVenti’s Air Collectors are classified as PV-T products but they only provide ventilation, dehumidification and space heating, as illustrated in Figure 9. The solar PV cells incorporated into the system are purely used to power the fans and control system providing autonomous operation but do not provide an electrical output outside the system.
Type 4 - Glazed PV cells are placed right under the transparent insulation/glass pane There are many variations in the types of products that fit into this category. Some are similar in appearance to type 2 PV-T solar panels, whereas others are adaptations of roofing materials and are therefore well suited for integrating into a domestic application and are easily scalable. A number of PV-T roofing products are currently being developed that feature heat collectors integrated into a roofing tile with solar PV cells affixed to the surface. Energyntegration’s EY-Hybrid PV-T tile is one example (and is available in a number of coloured finishes) as illustrated in Figure 10. Examples of module based approaches are Sela Solar’s M-240PVT and Hörmann’s Solar Hybrid Collector.
Due to the construction of the type 4 panels (that feature the solar PV cells bonded directly to the transparent module cover rather than the thermal collector) it is generally considered that
Figure 9 Example of solar ventilation systems (TwinSolar and Solar Venti, 2015)
Figure 10 Example of a type 4 glazed PV-T module where the PV cells placed right under the transparent insulation/glass pane (Energyntegration, 2015)
Evidence Gathering – Low Carbon Heating Technologies
23
the solar PV cells will not experience high temperatures, but conversely they are not actively cooled either. Typically the cover is less transparent then glass and could potentially reduce the amount of solar radiation before it reaches the absorber.
Type 5 – PV-T solar collectors with concentrators This is generally the least applicable approach to PV-T technology for the UK domestic market, but may be more relevant for commercial applications, as these systems are designed for much larger heating loads. Concentrated PV-T (CPV-T) products normally come in the form of a bank of Fresnel reflectors that focus solar irradiance on a strip of PV cells mounted on a collector. Cogenra Solar’s SunDeck modules, as illustrated in Figure 11, also include single axis tracking to maximise the solar energy captured throughout the day.
A new product is currently being developed by Solarus that employs concentrating technology principles in a roof mounted flat module approach. The Solarus Power Collector, also shown in Figure 11, features two strips of solar PV cells that absorb the solar energy reflected by two parabolic mirrored troughs running underneath the PV cell strips. The heat generated within the semi-circular tubes is extracted as hot air. The main advantage of a CPV-T collector is the high temperatures that can be reached (typically 65-90°C), making it suitable for hot water applications. There are also less material costs associated with the Fresnel reflector approach. The disadvantage to the system is traditionally it’s lack of scalability and a decrease in solar PV efficiency as a result of the high temperatures. Smaller modular systems are being developed however manufacturers do not consider the UK to be a key market for the new technology. Systems with tracking are also inheritantly expensive and require more maintenance.
Heat transfer mediums There are two primary heat transfer mediums used in PV-T systems, air and liquid. Liquid
based systems are further sub-divided into water, water/ glycol and refrigerant. Glycol is used
as an anti-freeze and is mixed to different concentrations to increase the specific heat capacity
of the liquid. PV-T panels combining both air and water in conjunction with two absorbers are
also available, but not common.
Figure 11 Example of a type 5 PV-T solar collector with concentrator (Solarus and Cogenra Solar, 2015)

Current state of the art
24
PV-T water panels These are typically used for direct feed domestic hot water or pool heating systems. The water
is circulated around a sheet and tube circuit on the back of the solar PV module. The absorber
tubes can be either round or rectangular in form and laid out in a serpentine, harp, ladder or T
bar arrangement, examples of which are shown in Figure 12. Matching the electrical circuit
layout with the absorber layout can help improve panel efficiencies.
A water to water heat pump can convert the low grade heat into high grade heat for storage in a
highly insulated tank. This type of system is not common in the UK due to the risks of freezing.
PV-T water/ glycol panels This is the most commonly used PV-T transfer medium for installations in the UK, providing an indirect feed, often via a heat exchanger, to a thermal store which in turn provides domestic hot water and/or low temperature space heating e.g. underfloor heating. The absorber layout is the same as water only panels.
Figure 12 Serpentine pipe and harp pipe absorber configurations (Aste, Del Pero, & Leonforte, 2012)

Evidence Gathering – Low Carbon Heating Technologies
25
Typically these systems will be used in conjunction with other heating systems such as; immersion heaters, boilers, or heat pumps. A representative system layout using a type 1a or type 2 PV-T panel is shown in Figure 13.
PV-T air panels PV-T air panels are usually employed for space heating applications such as HVAC or warm-air
heating systems, or used in conjunction with an air to water heat pump (typically for domestic
hot water). Usually a separate thermal storage system is not incorporated into an air based
space heating system. Excess heat can be vented outside to prevent stagnation. Open-loop
(single pass) and closed-loop (double pass) systems are both available. A typical layout of an
open-loop system using a type 1b PV-T collector is illustrated in Figure 14.
Using air as a heat transfer medium has its advantages. There are no issues with respect to
freezing, boiling, corrosion or leaking. High pressure protection is not required and generally
the systems are less complicated and can be easily incorporated into commercial ventilation
systems.
The key disadvantage to air based systems is its lower heat capacity, therefore providing a
lower heat transfer rate, which in turn requires a higher flow rate (Adnan, Yusof Othman, Hafidz
Ruslan, Mat, & Sopian, 2011).
Figure 13 Example layout of a domestic PV-T liquid panel based system
Current state of the art
26
Figure 14 Example layout of a domestic PV-T air panel based system with warm air heating
System integration The optimal PV-T system solution will take into account; the spectral characteristics of a solar PV cell, PV cell solar absorption, internal heat transfer from PV cell to heat collection system, installation geometry (i.e. orientation and inclination), integration into space heating/ hot water/ electrical system, electricity and heat demand, and temperature of heat demand. In isolation PV-T systems are not able to meet all hot water and space heating demands all year round in the UK. However, when incorporated as part of a hybrid heating system they have the potential to make a significant low carbon contribution. Research has shown that there are some potential issues with system integration especially for retrofit. The requirement for a large thermal store and/ or low temperature distribution for an efficient system can make them financially unviable. Some PV-T approaches are more suited to certain applications. Table 5 provides a breakdown of the different applications of PV-T and the most suitable approach for each as concluded by the IEA Task Group 35 in 2007.

Evidence Gathering – Low Carbon Heating Technologies
27
Table 5 Potential applications of PV-T technology
Type of application L
iqu
id
mo
du
les
gla
ze
d (
4)
Liq
uid
mo
du
les
un
gla
ze
d (
1a
)
Air
mo
du
les
gla
ze
d (
3)
Air
mo
du
les
un
gla
ze
d (
2)
Ve
nti
late
d P
V
wit
h h
ea
t
rec
ove
ry (
1b
)
PV
-T
co
nce
ntr
ato
r
(5)
Do
mes
tic Hot water X
Space heating & hot water X X
Collective hot water X X
Collective heating & hot water X X
Pool heating X
Co
mm
erc
ial Collective hot water X X
Collective space heating & hot water
X X X
Office space heating X X X X
Solar cooling X X X X
Public pool heating X X
Ind
us
tria
l Solar drying X X
Hot water X X
Industrial process heat X X X
Industrial space heating X X
Solar Cooling X Source: Market, modelling, testing and demonstration in the framework of IEA SHC Task 35 on PV/Thermal Solar Systems (Hansen, Sorensen, Bystrom, Collins, & Karlsson, 2007)
System mounting methods also vary. The majority of PV-T systems designed for domestic applications are roof mountable, whether on-roof or in-roof. Other systems are designed to be only façade mounted, such as the SolarWall PV/Thermal system shown in Figure 15.
Figure 15 Example of a facade mounted PV-T system (SolarWall, 2015)
Current state of the art
28
Future technical developments There are some remaining challenges that may well be solved in future product developments (IES, 2012) such as;
Reducing heat losses
Protection against over-heating
Improving economics
New PV-T products are currently being developed for the domestic PV-T market. Some manufacturers are researching how to improve the electricity generation potential by taking advantage of advances in solar PV cell technology, such as incorporating cells that have lower temperature coefficients (i.e. are less affected by temperature) and higher electrical efficiencies than standard crystalline silicon cells. Other manufactures are looking at developing PV-T and heat pump packaged systems for a domestic scale aimed at the new build market. Technical developments in thermal storage is likely to also assist the growth of the PV-T market.
Market and product review
Domestic installations of PV-T systems are currently very low, ranging
from 10 to 100 installations per year and an installed base of around
500 systems. Unless low-temperature thermal storage becomes common (either via buffer-tanks or inter-seasonal storage) the technology is likely to remain a niche choice with the application limited to exceptionally low-carbon new build homes. PV-T liquid panels providing hot water via a water-glycol mix account for the largest market share in UK domestic installations and are therefore the focus of this section.
Existing PV-T market Estimating the exact number of PV-T systems in total and installations per year is difficult, as the numbers are very low and there is no publically available record of PV-T installations receiving a Feed in Tariff (FITs). Research suggests that installations range from 10–100 systems per year in the UK6. Only a small number of installers (< 5) have significant experience of installing PV-T systems in the UK. Most of these installers install only one or two domestic systems per year and when contacted did not consider PV-T as a major part of their business. One company installs tens of PV-T systems per year. The few installers active in PV-T do not specialise exclusively in the technology, providing installation services for solar PV, solar thermal and often also other renewables such as heat pumps and biomass. It is estimated that around 500 PV-T installations have been installed in the UK to date, with a large proportion of these using PV-T modules supplied by one manufacturer. Of the 40 European PV-T manufactures identified in the research, 12 companies are no longer trading or are no longer manufacturing a PV-T product. The majority of PV-T manufacturers are SMEs and often only supply one or two products, unlike solar PV and solar thermal manufacturers. In addition the majority of PV-T manufacturers have not diversified into other solar technology or balance of system products and therefore are more volatile to market peaks and troughs. Several thousand domestic PV-T systems have been installed in continental Europe, particularly in countries with high support for PV. Manufacturers in Germany, Italy and Switzerland would all like to sell into the UK market but none have so far completed accreditation with the Microgeneration Certification Scheme (MCS) so UK sales are minimal.
Typical domestic installations PV-T technology is not well understood by housebuilders or designers in the UK7. The bulk of domestic installations to date have been either on architect-designed self-build homes, often in 6 Based on stakeholder interviews and results from online questionnaire.
7 Based on stakeholder interviews
Market and product review
30
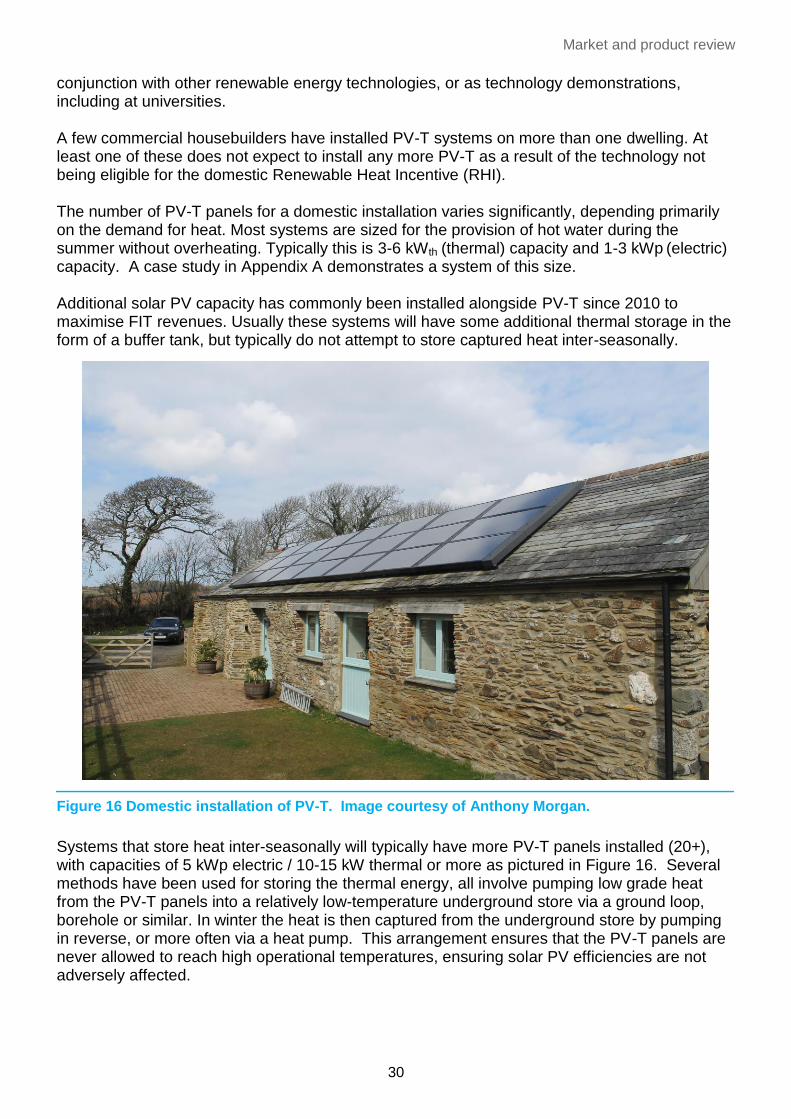
conjunction with other renewable energy technologies, or as technology demonstrations, including at universities. A few commercial housebuilders have installed PV-T systems on more than one dwelling. At least one of these does not expect to install any more PV-T as a result of the technology not being eligible for the domestic Renewable Heat Incentive (RHI). The number of PV-T panels for a domestic installation varies significantly, depending primarily on the demand for heat. Most systems are sized for the provision of hot water during the summer without overheating. Typically this is 3-6 kWth (thermal) capacity and 1-3 kWp (electric) capacity. A case study in Appendix A demonstrates a system of this size. Additional solar PV capacity has commonly been installed alongside PV-T since 2010 to maximise FIT revenues. Usually these systems will have some additional thermal storage in the form of a buffer tank, but typically do not attempt to store captured heat inter-seasonally.
Systems that store heat inter-seasonally will typically have more PV-T panels installed (20+), with capacities of 5 kWp electric / 10-15 kW thermal or more as pictured in Figure 16. Several methods have been used for storing the thermal energy, all involve pumping low grade heat from the PV-T panels into a relatively low-temperature underground store via a ground loop, borehole or similar. In winter the heat is then captured from the underground store by pumping in reverse, or more often via a heat pump. This arrangement ensures that the PV-T panels are never allowed to reach high operational temperatures, ensuring solar PV efficiencies are not adversely affected.
Figure 16 Domestic installation of PV-T. Image courtesy of Anthony Morgan.

Evidence Gathering – Low Carbon Heating Technologies
31
Domestic market potential PV-T technology only makes technical and commercial sense where there is a suitable use for the low-temperature heat that the system can provide. Most of the focus is therefore on commercial and industrial installations where there is year-round heat demand and adequate space for hot water cylinders, thermal stores etc. Good applications for PV-T are considered to be leisure centres, sports facilities, nursing homes and small industrial sites requiring pre-heated water. Relatively few domestic properties have large enough hot water cylinders and hot water demand, to make retrofitting PV-T an economic proposition. Domestic PV-T does however make more sense in situations where there is a heat load in summer, such as for swimming pools. But the market is only likely to increase to thousands of installations per year if inter-seasonal thermal stores become more common or if policy support for renewable heating revolutionises the installation of thermal stores alongside solar thermal or PV-T. There is significant evidence that both the PV-T supply and installation industries had been expecting to install hundreds of PV-T systems per year before the announcement that the technology would not be eligible for both FIT and domestic RHI. Installers and solar industry associations do see some potential for domestic PV-T growth in the short term as energy conscious householders carefully consider how to maximise the energy yield from their roof with minimal subsidies available. 64% of the participants in the survey saw potential for the UK PV-T market to increase in the next five years. The possible growth markets for PV-T in the longer term have been identified as installations that have the potential combination of:
Where there is limited roof space for installation (including zero carbon homes)
High hot water demand (particularly in the summer)
Roof space optimisation / zero carbon homes PV-T clearly can make sense if a housebuilder or owner is keen to maximise low carbon generation on a property with a smaller area of south-facing roof space; particularly if there is a high hot water demand, and thermal stores / inter-seasonal storage is used. Bespoke self-builds A small number of domestic PV-T systems have been installed on private new build homes or complete refurbishments of existing homes where the home has been designed to be zero or near zero carbon. This remains a key market for PV-T installers in the absence of specific policy incentive. These homes are exceptionally well insulated with very little space heating requirement, meaning that inter-seasonal storage of solar thermal energy is viable for space heating. A case study in Appendix A provides an example of this type of application. In 2014, 9,550 new homes were self-built in the UK (around 8% of all new builds). The Government aims to more than double this total, but without policy change it is unlikely that PV-T will become significantly more common. Social Housing A few social/ local housing associations and builders have shown particular interest in PV-T technology as a way to help reduce household energy bills, as detailed in a case study in Appendix A. PV-T has also been installed as a retrofit technology to reduce the electricity bills of social housing tenants with all electric heating. These installations have generally been

Market and product review
32
installed at zero cost to the landlord or tenant under a rent-a-roof type scheme, whereby a third-party owns the system and claims the FIT. However it is unlikely that more systems will be installed under this business model due to the lower FIT rates. Housing Developers Housing developers build 70% of all new houses in the UK. The current costs of procuring and installing PV-T does not balance any uplift in house value. PV-T may become more relevant as a result of the requirement of the recast of the Energy Performance of Buildings Directive (EPBD) to build near zero energy buildings (NZEB) by 2021.
Thermal demand scenarios Swimming pools – summer demand for low-temperature heat The Swimming Pool and Allied Trades Association (SPATA) estimates that there are 240,000 private homes with swimming pools in the UK. PV-T technology could be an attractive technology for a large proportion of these where roof-space is limited on pool-side buildings, as demonstrated in Figure 17. As new PV-T products become available and are marketed in the UK this niche market is likely to increase if there is a financial incentive to generate electricity as well as heat.
Inter-seasonal storage (solar recharging) In general, only community scale district heating schemes have commonly attempted to store solar heat inter-seasonally. However a significant proportion of the domestic PV-T systems installed in the UK to date have used domestic scale underground inter-seasonal stores to provide winter heating to individual homes. At present fewer than ten of these systems are installed each year, but the technology is not inherently expensive (especially if a GSHP would be used in any case). It is possible that borehole or earth energy bank (EEB) storage systems
Figure 17 Installation of PV-T to provide heat for a swimming pool. Image courtesy of Anthony Morgan.

Evidence Gathering – Low Carbon Heating Technologies
33
(as shown in Figure 18) could become relatively common on new build housing estates that are off the gas grid. If the installed cost became cost competitive with an equivalent area of PV and solar thermal then PV-T could take up a significant proportion of this market. Delta-ee estimates8 that 23% of new build homes are off the gas grid. In 2014, nearly 140,000 new homes were completed, of which approximately 32,000 would be off the gas grid and therefore more suited to inter-seasonal storage that could make PV-T financially attractive.
Pre-heat to hot water cylinders/ buffer tanks Buffer tanks are additional warm water tanks that provide pre-heated water to a boiler, or a heat source for a heat pump. They are not common in UK homes. Large buffer tanks, potentially built into the foundations or structure of a house, are likely to become more common in high-specification new builds, particularly as they work very well in conjunction with solar thermal technologies (including PV-T). In conjunction with heat-pumps, particularly, large buffer tanks have the capability to store several hours of heat load, offering significant potential for demand shifting (UKERC, 2014) in electric heating applications. Minus7’s ‘endothermic’ roof system is designed to work with a large buffer tank as a core part of the design. It has good potential if drivers related to zero carbon (or zero bill) homes or electrical demand shifting emerge. As shown in Table 6, Minus7 are currently testing the incorporation of solar PV cells into their roofing product, technically categorising it as a PV-T product with attractive installation characteristics for new build properties. A lack of space is currently a major barrier to buffer tank (or even ordinary hot water cylinder) installations in existing and new build homes. Innovative condensed thermal storage technologies, such as phase change material (PCM) stores which range from TRL 4-7, could provide a way to incorporate high kW thermal storage into limited space but currently available
8 Delta Energy & Environment’s Microgeneration Research Service
Figure 18 An earth energy bank installed underneath a new build property with PV-T. Image courtesy of Caplin Homes

Market and product review
34
PCM stores cannot efficiently absorb the low temperature heat generated by well-designed PV-T systems.
Products available for UK domestic installations Many PV-T products are available in Europe that are technically appropriate for UK installation, however only Minimise Generation (part of Minimise Group UK) has had a PV-T product accredited with the Microgeneration Certification Scheme (Solimpeks ‘Volther’ panels). Non-accredited panels can be installed but would not be eligible for any government financial incentive support, which has meant that the majority of installations in the UK post 2010 to date have used Solimpeks panels. One other manufacturer is currently seriously targeting the UK market, a SME from north-east England, NTD Limited. The ‘Solar Angel’ panel has been installed on a number of demonstration projects as featured in a case study in Appendix A. The vast majority of domestic PV-T installations in the UK have used PV-T panels from one of these two companies. Technical specifications for which can be found in Table 4. Both of these products use commercially available crystalline silicon solar PV modules, factory bonded to a thermal absorber at the back. The heated transfer fluid can be indirectly fed into hot water cylinders, buffer tanks or underground stores. As previously discussed the majority of panels sold in the UK are unglazed (type 1a or type 2) and are designed to maximise electrical output rather than thermal output. Solimpeks Volther Powertherm product is a glazed panel (type 3) that is designed to maximise thermal output at a ratio of 3:1 (with a small reduction in average solar PV efficiency). NTD Limited and Minimise Generation (in association with Solimpeks) are both actively developing new PV-T panels with improved performance. Three other British companies have been identified as developing PV-T systems of various sorts, as detailed in Table 6, but these products are not yet market ready. Most are conceptually distinct from the type 2 PV-T products distributed by Minimise Generation and NTD Limited.
Table 6 UK companies currently developing alternative PV-T products
Manufacturer Product concept Availability Possible market
Naked Energy Maximum possible thermal capture (high temperatures) evacuated tube with solar PV inside, see Figure 8. Uses refrigerant for heat transfer.
Currently testing prototype
Likely commercial – some domestic
Minus7 ‘Endothermic Tileplanks’
Endothermic roofing product (‘roof-source heat pump’) with bonded solar PV as an option
Currently testing prototype
Domestic – low temperature heat delivery
Flint Engineering ‘Flint heat mat’
Maximum thermal capture, roofing product with bonded solar PV as an option. Uses refrigerant for heat transfer.
Currently testing prototype
Domestic and light commercial – low temperature space heating
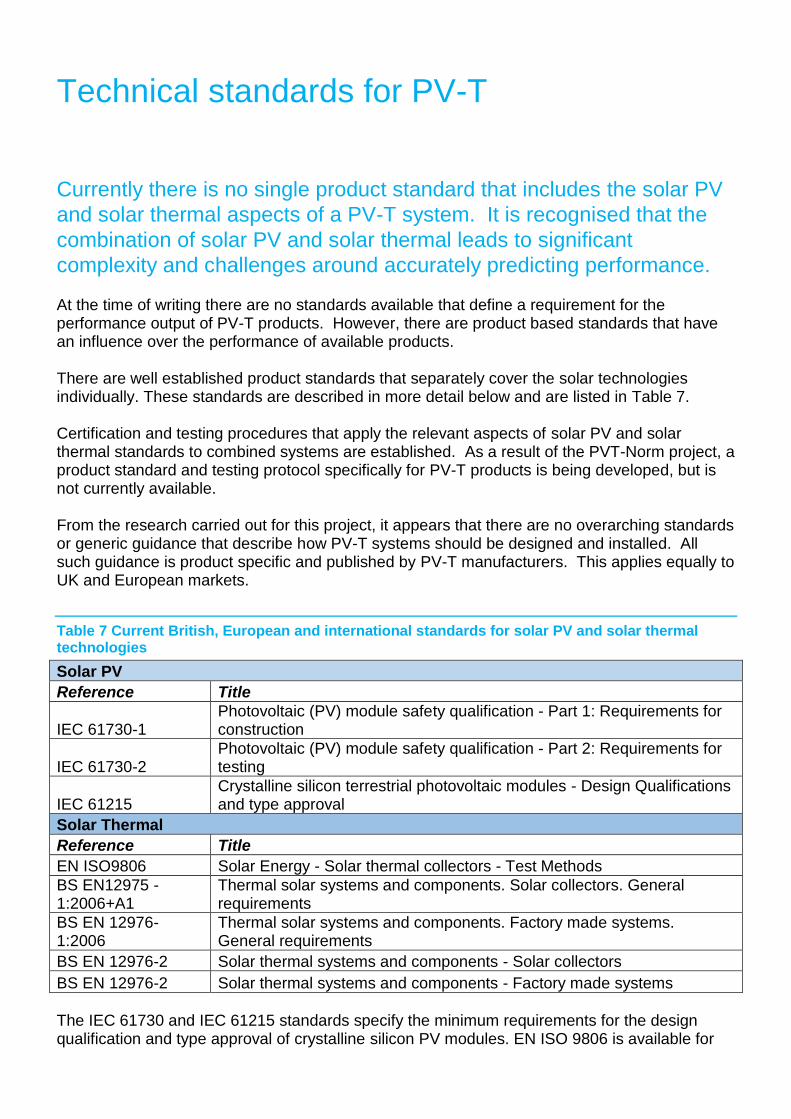
Technical standards for PV-T
Currently there is no single product standard that includes the solar PV
and solar thermal aspects of a PV-T system. It is recognised that the
combination of solar PV and solar thermal leads to significant
complexity and challenges around accurately predicting performance. At the time of writing there are no standards available that define a requirement for the performance output of PV-T products. However, there are product based standards that have an influence over the performance of available products. There are well established product standards that separately cover the solar technologies individually. These standards are described in more detail below and are listed in Table 7. Certification and testing procedures that apply the relevant aspects of solar PV and solar thermal standards to combined systems are established. As a result of the PVT-Norm project, a product standard and testing protocol specifically for PV-T products is being developed, but is not currently available. From the research carried out for this project, it appears that there are no overarching standards or generic guidance that describe how PV-T systems should be designed and installed. All such guidance is product specific and published by PV-T manufacturers. This applies equally to UK and European markets.
Table 7 Current British, European and international standards for solar PV and solar thermal technologies
Solar PV
Reference Title
IEC 61730-1 Photovoltaic (PV) module safety qualification - Part 1: Requirements for construction
IEC 61730-2 Photovoltaic (PV) module safety qualification - Part 2: Requirements for testing
IEC 61215 Crystalline silicon terrestrial photovoltaic modules - Design Qualifications and type approval
Solar Thermal
Reference Title
EN ISO9806 Solar Energy - Solar thermal collectors - Test Methods
BS EN12975 - 1:2006+A1
Thermal solar systems and components. Solar collectors. General requirements
BS EN 12976-1:2006
Thermal solar systems and components. Factory made systems. General requirements
BS EN 12976-2 Solar thermal systems and components - Solar collectors
BS EN 12976-2 Solar thermal systems and components - Factory made systems
The IEC 61730 and IEC 61215 standards specify the minimum requirements for the design qualification and type approval of crystalline silicon PV modules. EN ISO 9806 is available for
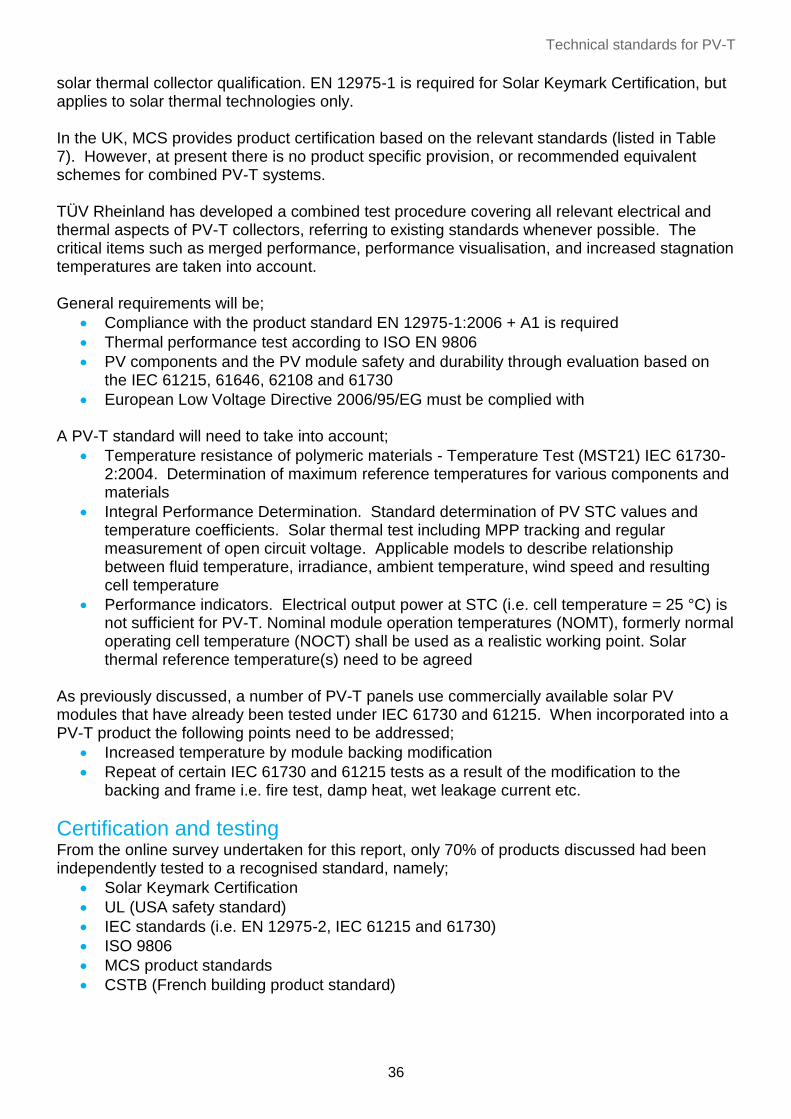
Technical standards for PV-T
36
solar thermal collector qualification. EN 12975-1 is required for Solar Keymark Certification, but applies to solar thermal technologies only. In the UK, MCS provides product certification based on the relevant standards (listed in Table 7). However, at present there is no product specific provision, or recommended equivalent schemes for combined PV-T systems. TÜV Rheinland has developed a combined test procedure covering all relevant electrical and thermal aspects of PV-T collectors, referring to existing standards whenever possible. The critical items such as merged performance, performance visualisation, and increased stagnation temperatures are taken into account. General requirements will be;
Compliance with the product standard EN 12975-1:2006 + A1 is required
Thermal performance test according to ISO EN 9806
PV components and the PV module safety and durability through evaluation based on the IEC 61215, 61646, 62108 and 61730
European Low Voltage Directive 2006/95/EG must be complied with
A PV-T standard will need to take into account;
Temperature resistance of polymeric materials - Temperature Test (MST21) IEC 61730-2:2004. Determination of maximum reference temperatures for various components and materials
Integral Performance Determination. Standard determination of PV STC values and temperature coefficients. Solar thermal test including MPP tracking and regular measurement of open circuit voltage. Applicable models to describe relationship between fluid temperature, irradiance, ambient temperature, wind speed and resulting cell temperature
Performance indicators. Electrical output power at STC (i.e. cell temperature = 25 °C) is not sufficient for PV-T. Nominal module operation temperatures (NOMT), formerly normal operating cell temperature (NOCT) shall be used as a realistic working point. Solar thermal reference temperature(s) need to be agreed
As previously discussed, a number of PV-T panels use commercially available solar PV modules that have already been tested under IEC 61730 and 61215. When incorporated into a PV-T product the following points need to be addressed;
Increased temperature by module backing modification
Repeat of certain IEC 61730 and 61215 tests as a result of the modification to the backing and frame i.e. fire test, damp heat, wet leakage current etc.
Certification and testing From the online survey undertaken for this report, only 70% of products discussed had been independently tested to a recognised standard, namely;
Solar Keymark Certification
UL (USA safety standard)
IEC standards (i.e. EN 12975-2, IEC 61215 and 61730)
ISO 9806
MCS product standards
CSTB (French building product standard)

Evidence Gathering – Low Carbon Heating Technologies
37
However, these tests and associated certification processes are conducted on the basis of either a standalone solar PV module or solar thermal collector, as a combined PV-T test standard does not currently exist. The TÜV Rheinland combined test procedure is a commercially available test, which combines solar PV module and solar thermal collector test standards as far as is reasonably possible.
Energy Related Products (ErP) Directive Particular attention should be paid to the standards of the Energy Related Products (ErP) Directive, how these technologies fit within this framework, and the implication of any changes to existing standards currently in place. The ErP Directive lays down the ‘ecodesign’ requirements for specific energy related products. The ErP is a European Directive implemented via commission regulations and is a CE Marking Directive. The Directive has been brought in to UK law through the Energy Related Products Regulations 2010 SI 2010 No. 2617 as amended by statutory instrument SI 2015 No. 469 (BEIS, 2015). In the context of PV-T systems, the ErP EU commission regulation scope includes “packages of water heater and solar device” – as such PV-T is likely to be within the scope (EC, 2013). The UK transposition of the EU requirement, the ErP Regulations 2010, include provision for “water heaters and hot water storage tanks”. These regulations come into effect when a given product type exceeds sales in excess of 200,000 units per year in the EU common market. As such the regulations are likely to apply to PV-T at some point in the longer term when overall EU sales increase to more than 200,000 units per year. The implication for manufacturers of the equipment and the end customers includes a number of requirements in relation to performance labelling. ErP is likely to require an assessment of product efficiency for the thermal component of PV-T systems which will be based on a standard test methodology. In the UK, the MCS product certification service may need to be extended to include different types of PV-T systems. Alternatively, the thermal aspect of PV-T systems could be tested in isolation. The ErP will take into account the lifecycle impacts of PV-T products, hence an assessment of embodied energy will be required. The requirement for manufacturers will be set out by the ErP when applied to PV-T products. The requirement is likely to include provision of information on the follow aspects in relation to a given PV-T product;
Energy consumption in use, including heat loss from storage tanks
Efficiency in use
Sound levels in use
Greenhouse gas emission from any heat pump systems coupled to PV-T
Information for end of life recycling and disassembly
Manufacturers will be required to provide this information for individual products.
PV-T performance
38
PV-T performance
The design concept of a PV-T system is to produce heat and electricity
as efficiently as possible, maximising the amount of solar energy that is
converted into useful energy. Theoretically, a combined system
efficiency of 60–80% can be achieved in low temperature applications.
However, few PV-T systems installed in the UK are provided with an
adequate means of assessing performance and therefore it is not
possible to determine whether or not systems ever achieve this level of
efficiency. The overall efficiency and performance of a system is affected by the design of the PV-T module, the design of the secondary system (i.e. thermal storage, pumps, pipework etc.), the system integration, operation and control. Figure 19 details losses for typical solar PV and solar thermal systems in comparison with a PV-T system. PV-T modules are designed to be less thermally efficient due to the requirement to operate at lower temperatures than standard solar thermal collectors.
Even though a PV-T system can provide the same output as separate solar PV and solar thermal systems, the approach to system design is different and will vary from application to application depending on the load requirements and integration of the system. The results of the online survey highlighted that system design is the main reason for poor
performance of PV-T systems, followed by poor system control. There is a common
misconception that a solar thermal hot water system design approach is suitable for PV-T
Figure 19 Sankey diagram comparing system efficiencies of single solar technology systems and a PV-T system

Evidence Gathering – Low Carbon Heating Technologies
39
systems, i.e. the thermal store should have the capacity of at least 80% of the daily hot water
demand or 25 litres for every square metre of collector area (HMG, 2013).
PV-T systems that are specified to supply domestic hot water are normally sized for summertime peak load and storage requirements, using a glazed PV-T module with a slightly higher stagnation temperature. This will minimise the potential for stagnation during times of peak generation and lower demand. Research has shown that retrofitting PV-T as a pre-heat to an existing standard heating and hot water system does impact on the PV-T systems thermal efficiency, with a considerable amount of thermal energy being lost due to the length of pipe runs, insufficient thermal storage and insufficiently sized radiators for low temperature systems. For larger low temperature applications such as pool heating or ground charging, systems are
normally specified to be more electrically focused employing unglazed PV-T modules with a
lower stagnation temperature.
How PV-T performance is measured The performance of a PV-T system can be described in the following ways;
Electrical generation (kWh/yr.)
Thermal generation (kWh/yr.)
System efficiency (%)
Energy savings (kWh/yr.)
Cost benefit (£/yr., payback in years, ROI %)
Environmental benefit (kg CO2 offset)
Performance as a building material - for building integrated products
Lifecycle assessment (CO2e/kWh)
The performance of a PV-T product in isolation is, however harder to define. Understanding the tapping profile of a specific heat demand and degree of utilisation can help assess the thermal efficiency of a system. As discussed in the technical standards section of this report, there are currently no standards available that define the requirement for the performance of a PV-T panel or system, and no method in which to test ‘in-use’ or ‘on load’ performance of PV-T. The testing methodology as proposed by the PVT-Norm project will provide a merged performance indicator that combines the annual collector output based on EN 12975 test results and annual electrical output (defined using nominal module operation temperature), and performance visualisation (Fritzsche, Althaus, & Bott, 2014). The test results should provide a method to compare PV-T products under operational conditions and also allow system designers to select appropriate products for the application of the technology.
Performance modelling There is usually a trade off in performance for either heat or electrical production. As discussed
previously some PV-T panels are designed specifically with an electrical or thermal bias and
system flow rate can be controlled to optimise either electrical or thermal efficiencies depending
on the load demand and generation potential. However the technology does have its limits
(maximum temperatures, flow rates etc.) with which system designs need to fit within to ensure
long term operation.

PV-T performance
40
In 2012, the Phototherm project evaluated the potential and performance of PV-T for domestic
hot water applications. A prototype PV-T glazed liquid collector exhibited thermal efficiencies of
up to 80% whilst achieving electrical efficiencies of 8.8% under laboratory conditions, however,
when the system was installed in real life environment conditions, the thermal performance
reduced to 36.5% and electrical efficiencies remained relatively constant (Haurant, Menezo, &
Dupeyrat, 2014).
Theoretical modelling of a PV-T system on a London terraced house (with no other energy
efficiency measures included) estimated that a realistically sized system (15m2) would
contribute to 51% of electricity demand and 36% domestic hot water demand of a blended UK
energy consumption profile. When modelled, it was estimated that an identical sized PV only
system would only provide 49% of electricity demand (Herrando, Markides, & Hellgardt, 2014),
demonstrating the theoretical increases in PV efficiency in a well designed PV-T system.
System performance modelling can help to optimise the size a PV-T system needs to be to
meet a specified energy demand or to work effectively and efficiently in conjunction with other
heating technologies. Unlike solar PV and solar thermal there are relatively few available
performance modelling tools that accommodate PV-T technologies and none that are easily
accessible to consumers to gauge the potential performance of a system sized for their
requirement.
Two freeware programmes (RETScreen and System Advisory Model (SAM)) and two
commercially available software packages (TRNSYS and Polysun) have the capability to model
PV-T system performance to some degree, but require a fairly high level of understanding to
use effectively (Elliott, 2011). Two PV-T manufacturers offer a very basic online tool to
demonstrate the contribution a PV-T system could make to domestic energy, but these are
utilised more as a marketing tool and do not accommodate site specific information.
Manufacturer’s claims The detail and definition of PV-T product information varies from manufacturer to manufacturer,
meaning it is difficult for consumers, or even system designers, to compare different products
and approaches to PV-T.
From the data reviewed system performance was described in the following ways;
Product performance
Electrical and/ or thermal efficiency of the product
Peak energy production (kWh/day)
Percentage increase in electrical efficiency
Life expectancy (years)
System performance
Thermal output (kW) for specific system sizes i.e. 2kW/ 3kW/ 5kW at different temperatures/ seasons/ irradiance levels
System size required to heat a specific space i.e. 10m2/ 15m2/ 20m2 or to meet the hot water demands of a specified number of people
Effect of PV-T system on heat pump COP
Thermal and electrical output and combined efficiency at different temperature differences (ΔT)
Performance comparison with other technologies
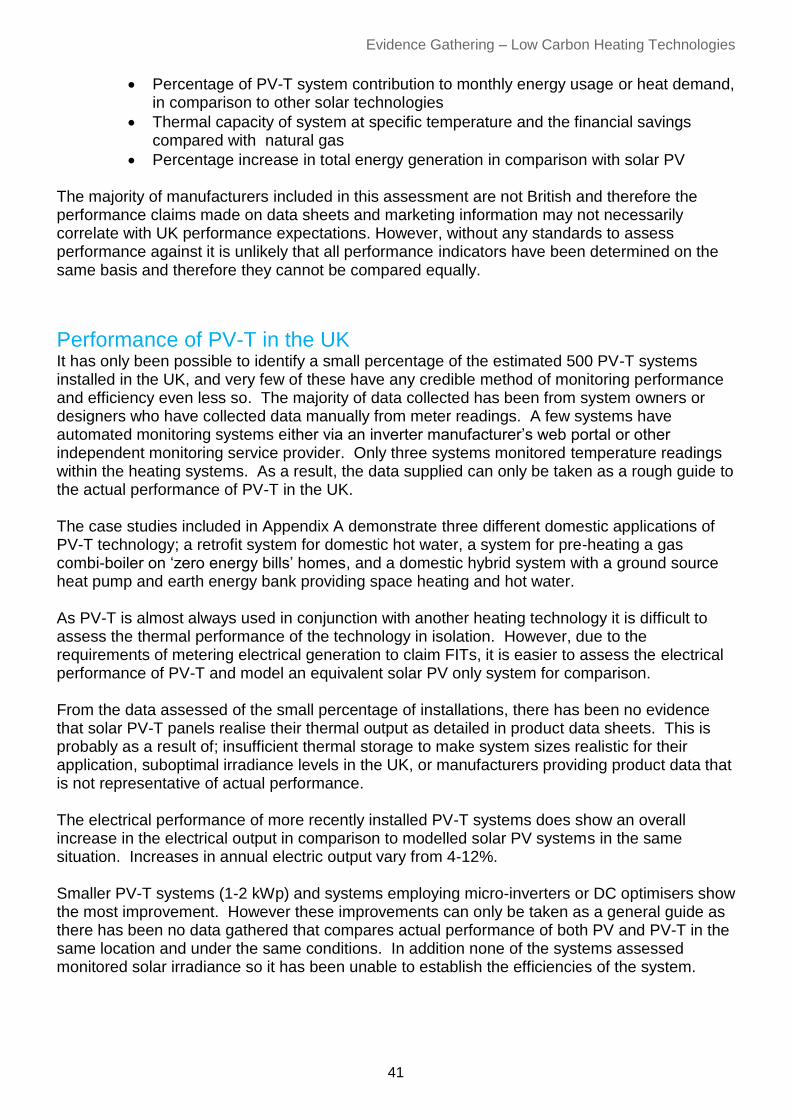
Evidence Gathering – Low Carbon Heating Technologies
41
Percentage of PV-T system contribution to monthly energy usage or heat demand, in comparison to other solar technologies
Thermal capacity of system at specific temperature and the financial savings compared with natural gas
Percentage increase in total energy generation in comparison with solar PV
The majority of manufacturers included in this assessment are not British and therefore the performance claims made on data sheets and marketing information may not necessarily correlate with UK performance expectations. However, without any standards to assess performance against it is unlikely that all performance indicators have been determined on the same basis and therefore they cannot be compared equally.
Performance of PV-T in the UK It has only been possible to identify a small percentage of the estimated 500 PV-T systems installed in the UK, and very few of these have any credible method of monitoring performance and efficiency even less so. The majority of data collected has been from system owners or designers who have collected data manually from meter readings. A few systems have automated monitoring systems either via an inverter manufacturer’s web portal or other independent monitoring service provider. Only three systems monitored temperature readings within the heating systems. As a result, the data supplied can only be taken as a rough guide to the actual performance of PV-T in the UK. The case studies included in Appendix A demonstrate three different domestic applications of PV-T technology; a retrofit system for domestic hot water, a system for pre-heating a gas combi-boiler on ‘zero energy bills’ homes, and a domestic hybrid system with a ground source heat pump and earth energy bank providing space heating and hot water. As PV-T is almost always used in conjunction with another heating technology it is difficult to assess the thermal performance of the technology in isolation. However, due to the requirements of metering electrical generation to claim FITs, it is easier to assess the electrical performance of PV-T and model an equivalent solar PV only system for comparison. From the data assessed of the small percentage of installations, there has been no evidence that solar PV-T panels realise their thermal output as detailed in product data sheets. This is probably as a result of; insufficient thermal storage to make system sizes realistic for their application, suboptimal irradiance levels in the UK, or manufacturers providing product data that is not representative of actual performance. The electrical performance of more recently installed PV-T systems does show an overall increase in the electrical output in comparison to modelled solar PV systems in the same situation. Increases in annual electric output vary from 4-12%. Smaller PV-T systems (1-2 kWp) and systems employing micro-inverters or DC optimisers show the most improvement. However these improvements can only be taken as a general guide as there has been no data gathered that compares actual performance of both PV and PV-T in the same location and under the same conditions. In addition none of the systems assessed monitored solar irradiance so it has been unable to establish the efficiencies of the system.

PV-T performance
42
The Institute of Energy and Sustainable Development (IESD) at De Montfort University is currently studying the performance of a PV-T and GSHP hybrid system on one of the campus properties, as shown in Figure 20. Each PV-T panel is connected to its own individual micro inverter. A single solar PV module of the same type that is used within the PV-T panel has also been connected to the system. Through closely monitoring the system IESD hope to provide quantifiable evidence on the differences in electrical performance.
The effect of stagnation and therefore increased cell temperatures, can be seen on occasion in the electrical performance on some systems, however this is only seen in times of peak production (i.e. midday in the height of summer). In order to reduce the risk of Legionella in stored hot water, it is recommend that a store temperature of at least 60°C must be reached for a minimum period of one hour once per day. This can be achieved through good system design and control. Both electrical and heat output (kWh/kW installed) has improved in the UK in more recently installed systems. This could be as a result of better products (i.e. more efficient PV cell technologies, better collector configurations and heat transfer coefficients) or better system integration, design and installation practices. PV-T systems installed as part of a new hybrid heating system (i.e. on energy efficient new builds) exhibit better overall system performance than retrofit systems. This could be as a result of the system being designed as an integral part of the building from the start, therefore optimising system layout, distribution design, integration with other heating technologies and control.
Assessing low carbon generation From the data gathered it is estimated that PV-T systems can cover approximately 5-20% of domestic heating loads and 40-50% of electrical loads. The significance of the contribution varies with system size and annual consumption providing a range of 1-5%/kWth and 7-25%/kWp.
Figure 20 IESD's PV-T test system and panel layout. Image courtesy of IESD.
PV
PV-T
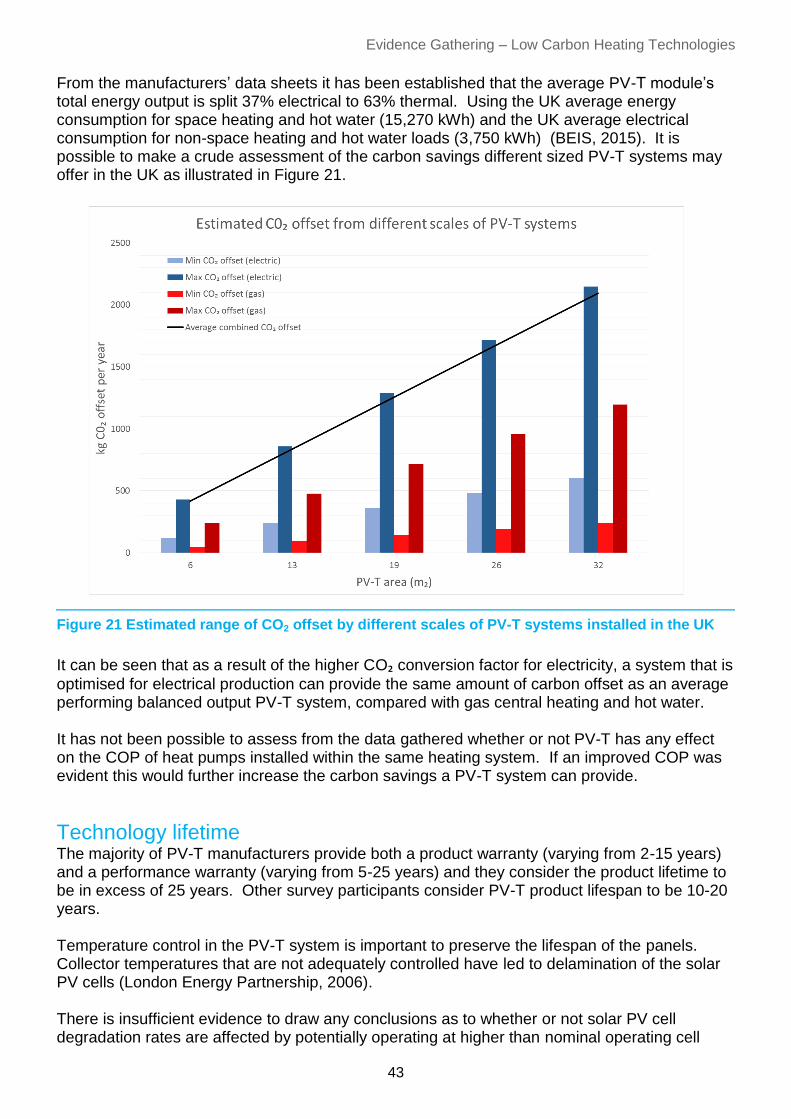
Evidence Gathering – Low Carbon Heating Technologies
43
From the manufacturers’ data sheets it has been established that the average PV-T module’s total energy output is split 37% electrical to 63% thermal. Using the UK average energy consumption for space heating and hot water (15,270 kWh) and the UK average electrical consumption for non-space heating and hot water loads (3,750 kWh) (BEIS, 2015). It is possible to make a crude assessment of the carbon savings different sized PV-T systems may offer in the UK as illustrated in Figure 21.
It can be seen that as a result of the higher CO₂ conversion factor for electricity, a system that is
optimised for electrical production can provide the same amount of carbon offset as an average performing balanced output PV-T system, compared with gas central heating and hot water. It has not been possible to assess from the data gathered whether or not PV-T has any effect on the COP of heat pumps installed within the same heating system. If an improved COP was evident this would further increase the carbon savings a PV-T system can provide.
Technology lifetime The majority of PV-T manufacturers provide both a product warranty (varying from 2-15 years) and a performance warranty (varying from 5-25 years) and they consider the product lifetime to be in excess of 25 years. Other survey participants consider PV-T product lifespan to be 10-20 years. Temperature control in the PV-T system is important to preserve the lifespan of the panels. Collector temperatures that are not adequately controlled have led to delamination of the solar PV cells (London Energy Partnership, 2006). There is insufficient evidence to draw any conclusions as to whether or not solar PV cell degradation rates are affected by potentially operating at higher than nominal operating cell
Figure 21 Estimated range of CO2 offset by different scales of PV-T systems installed in the UK

PV-T performance
44
temperature for sustained periods of time. However, well designed systems should avoid such issues. As with standard liquid collector solar thermal systems there is an expectation that the glycol solution will degrade overtime and may require replacing periodically to ensure the efficiency of the system.
Monitoring for performance As with any renewable energy technology, monitoring is an important part of establishing a systems performance. As mentioned previously, with the current FIT scheme there is a requirement for PV-T systems to be fitted with a generation meter to claim incentive payments, but there are no other requirements for monitoring. Building Energy Management Systems (BEMS) provide a method of integrating the monitoring (and control) of a PV-T system. However this tends to only be common for new buildings of a high energy efficiency specification and for medium to large commercial properties. By monitoring the following operational values it is possible to assess the performance of a PV-T system and establish its efficiency;
Electrical generation – generation meter on the AC side of the inverter
Heat generation – heat meter measuring the heat energy captured by the collector
Useful heat transfer – heat meter measuring the useful energy transferred to the heating system, thermal store, etc.
Flow and return temperatures – temperature sensors at either end of the array
Buffer/ storage temperature – temperature sensor at the top of the tank (and near the position of the flow input from the collector
Solar irradiance – in plane reference cell adjacent to the array
Only two of the PV-T manufacturers included in the research offer a monitoring system option for their product, other manufacturers expect the system designer to specify and supply any monitoring required. As with traditional solar thermal systems, control is generally provided by a temperature differential controller that uses a relay to operate a solar pump. Temperature sensor input and control interface varies depending on the system and how it integrates into the existing heating infrastructure.
Opportunities for performance improvements Participants in the survey felt that there are opportunities for improvement in PV-T performance
under current rates of deployment. The main opportunities were considered to be using PV-T
as part of a hybrid energy solution, such as;
PV-T and heat pump systems for space heating in winter
PV-T and absorption refrigeration for cooling in summer
PV-T and phase change material (PCM) storage
Other recommendations were to standardise testing for in use performance and to develop
better system control for varying load profiles (e.g. when systems are passed on to different
home owners).

Costs
It is difficult to generalise PV-T costs when the unit sales (and therefore
manufacturing rates) are very low. The installed cost of PV-T modules
is between 150-200% of the cost of solar PV alone and a 100-150% of
the cost of solar thermal alone. Payback without any policy support and
without measures to divert electricity from export is likely to be above
15-21 years for homes with high hot water usage.
Current Costs The costs in this section come from a combination of sources; the list prices for a small number of commercially available PV-T panels, conversations with manufacturers and installers who provide PV-T systems, responses to a survey (including European manufacturers and installers), and conversations with related organisations, including installers who do not currently provide PV-T systems. Typical PV-T panel costs range from £280 to £420 per unit, as detailed in Table 8. This equates to £1,400 - £2,000 per kWp electric. Typical installed costs (which include installation, plus inverters and pipework, but excluding thermal storage) are around £2,250 - £3,000 per kWp electric.
Table 8 Comparison of PV-T and single solar technology panel cost
PV-T module type Typical panel price (per unit)
Cost relative to equivalently sized
solar PV (i.e. 250 Wp module)
Cost relative to solar thermal
(i.e. ~2m2 collector)
Unglazed panels (Type 1a or 2)
£280-£400 (bulk purchase)
~£500 RRP
150-200% 100-150%
Glazed panels (Type 3 or 4)
£300-£420 (bulk purchase)
~£500 RRP
160-210% Roughly equivalent
Total system costs for a domestic PV-T system (excluding thermal storage) cost between 150-200% in comparison to an equivalent solar PV system (installed capacity kWp). PV-T distributors are aiming for cost equivalence with high end solar thermal systems. In practice at present a PV-T system costs approximately 100-150% of an equivalent sized good quality domestic solar thermal system. System component costs The cost breakdown of a ‘typical’ domestic PV-T system is shown in Figure 22. In practice the proportions of the different cost components will vary significantly, depending on the manufacturer (there is significant variation in the manufacturing cost of thermal components, depending on quality and design), on the system size (all margins and installation costs per kWp will be lower for larger systems) and on the existing heating infrastructure.
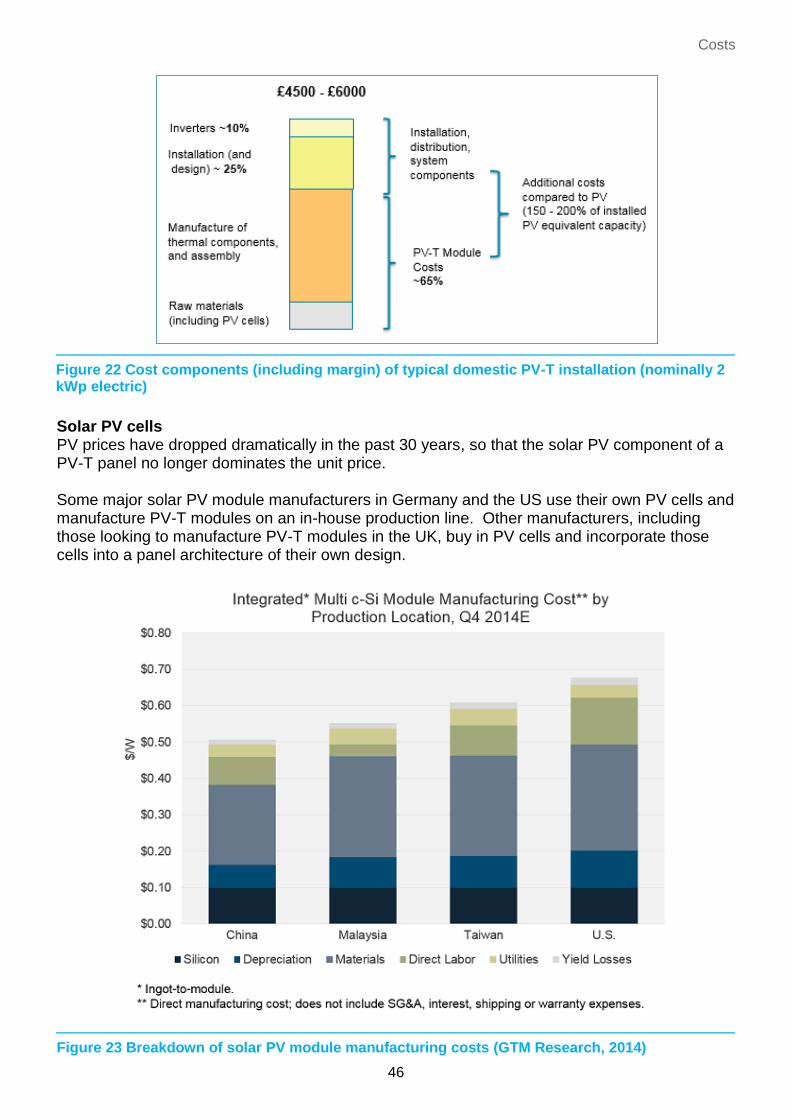
Costs
46
Solar PV cells PV prices have dropped dramatically in the past 30 years, so that the solar PV component of a PV-T panel no longer dominates the unit price. Some major solar PV module manufacturers in Germany and the US use their own PV cells and manufacture PV-T modules on an in-house production line. Other manufacturers, including those looking to manufacture PV-T modules in the UK, buy in PV cells and incorporate those cells into a panel architecture of their own design.
Figure 22 Cost components (including margin) of typical domestic PV-T installation (nominally 2 kWp electric)
Figure 23 Breakdown of solar PV module manufacturing costs (GTM Research, 2014)

Evidence Gathering – Low Carbon Heating Technologies
47
It can be seen from Figure 23 that the manufacturing cost of a solar PV module is made up of approximately; 20% silicon costs, 40% materials cost (i.e. frame, backing, junction box, diodes, solder etc.) and 40% labour and associated manufacturing costs. It is estimated that the PV element represents around 35% of the total manufacturing costs of a typical PV-T module, making PV a major item on the bill of materials for a PV-T manufacturer. However it is estimated that the PV element only makes up 15-20% of the total installed costs of a PV-T system, as shown in Figure 22. Thermal component The cost differential between a standard solar PV module and an equivalent PV-T panel is the heat recovery system. The approach of these systems varies from product to product, with more complex architectures (which are designed to achieve a more even heat extraction, and therefore avoid hot-spots in the solar cells) costing more to manufacture. The frame is typically designed to be as visually similar as possible to a standard solar PV module. It is estimated that the thermal component raw materials (generally copper or stainless steel), assembly, and framing of a PV-T panel make up the remaining 65% of the manufacturing costs, or some 30-35% of the total installed costs (depending on margin and non-manufacturing components of sale price). Installation (and design) PV-T systems are more complex than single solar technology systems. Designing a system to capture the maximum useful heat throughout the year, while minimising over heating requires more design effort than single technologies. At current low rates of deployment this extra complexity adds time and therefore cost to PV-T installations and is probably limiting interest in PV-T amongst potential installers9. Realising PV-T projects will always require an installation team with a range of skills i.e. electricians and plumbers. In many situations the installer will also need some degree of roofing skills. In practice most PV-T installers have experience in both the fields of solar PV and solar thermal, so no inherently new skills are required. However the need for both skill-sets will become more relevant if the PV-T market grows, probably limiting the installer base to multi-employee companies. Installers’ report that project delivery times for a PV-T system, including design time, vary enormously with some projects taking no longer than an equivalent solar PV only system. However installers also report that installing PV-T takes on average around twice as long as installing equivalent sized solar PV system and contributes to approximately 20% of the total installed cost. Additional Components PV-T systems need the additional equipment associated with both solar thermal systems and solar PV systems. On the thermal side of the system this generally consists of insulated pipework, heat exchangers (typically an extra coil in the hot water cylinder), and a pump and control system. The electrical side of the system requires a string inverter (or multiple micro-inverters), cabling and switchgear.
9 Badly-designed systems that have failed to perform as expected, or have required extensive modification, have
certainly created a reputation-problem for PV-T in some circles.

Costs
48
The additional costs of any additional thermal storage have not been included in the totals above, as these are highly variable from installation to installation. Typical costs can range from near zero (if a large hot water cylinder is to be or has already been installed than the only extra cost is a solar coil) through to thousands of pounds for an inter-seasonal domestic thermal store. Although even in this case, it would be incorrect to attribute the whole cost to the PV-T system. In a typical new build PV-T installation 25-35% of the total installed cost can be contributed to additional components. Maintenance and operation Maintenance costs for a PV-T system during a standard lifetime should be minimal. In theory PV-T system should be designed so that high temperatures do not degrade the glycol-water mix and therefore may never need to be replaced. In practice many installations have required significant post-build adjustment, but this has primarily been about optimising performance rather than maintaining the system. It is widely considered that PV-T maintenance costs should not be any higher than solar thermal maintenance costs. Manufacturer’s product and performance warranties are generally provided, however there is little detail as to what they cover and how a claim can be made. ‘Payback’ case to householder The ‘payback time’ for a domestic or small commercial PV-T installation, excluding policy support, will depend on how much of the electricity generated is used to displace imported electricity and how much of the heat generated is actually useful. The ~500 domestic PV-T systems installed in the UK to date vary in scale and application, and are generally not monitored to a level that facilitates demonstration of actual savings from the PV-T array in everyday use. A ‘typical’ domestic PV-T array rated at 2 kWp electric and around 5 kW thermal has been modelled to assess the likely financial payback of the system with respect to off-set electricity and gas consumption at a nominal domestic rate10. The calculations have taken into account an uplift in electrical generation of 4-12% and an installed system cost of £4,500 - £6,000 (as per Figure 22, excluding the cost of additional thermal storage) and therefore result in a payback range. 11 Without any policy support the best-case payback is estimated to be 10-14 years. This assumes that the homeowner is engaged with their energy generation and adapt their usage to consume all electricity generated and all heat generated, therefore displacing grid electricity and gas consumed by an efficient boiler. A more realistic scenario, in which PV-T is installed without any additional measures to ensure self-use of the energy generated, payback is estimated to be 15-21 years. This assumes that 50% of the electricity generated would otherwise have been imported from the grid, and also that all the heat displaces gas import.
10
Electricity and fuel prices for the three scenarios are: 15p/kWh domestic retail electricity; 5p/kWh domestic gas
retail (around 10% above average to represent some boiler losses). 11
The simple payback model assumes electricity generation of 1857 – 2000 kWh per year. Solar PV performance
calculated using the ‘Standard Estimation Method’ for a 38o south-facing installation in Sheffield (MCS Zone 11)
with no shading. Solar thermal output of 2964 kWh per year, calculated using The Government’s Standard
Assessment Procedure for Energy Rating of Dwellings (SAP), 2012, Appendix H: Solar water heating and MCS
Solar Domestic Hot Water Energy Calculation (MCS 024 Issue 1.1))

Evidence Gathering – Low Carbon Heating Technologies
49
An interim scenario, where a solar energy diverter is used to convert the 50% of ‘spare’ electricity to heating hot water, thereby displacing gas, estimates a payback of 13-18 years. These example scenarios should be considered as the minimum likely payback for each situation, as they all assume that the full 2,964 kWh of heat produced by the PV-T array is used in the home12 (without ever over-heating the PV-T panel or effecting the electrical efficiency). The heat generated is above the average UK domestic energy consumption for hot water, but is well within the range for family homes. In practise, though, little is known about the impact of domestic occupancy rates on PV-T performance (both PV performance and how much heat is actually useful). Use of PV-T for pool heating or with an inter-seasonal store would ensure that the lower payback period is relevant for each situation, as the thermal store temperature will be low.13
Opportunities for cost reduction The installed base, and the number of installations per year, for PV-T in the UK are very low compared with other low-carbon heating or microgeneration technologies. There is clearly potential for the economic case for PV-T to improve if installation volumes increase significantly, both from cost reductions via economies of scale (reduced manufacturing and installation costs) and from design improvements. Solar PV sale volumes are expected to continue to increase worldwide, and improvements in both performance and cost per kWp of solar PV will continue to increase the attractiveness of PV-T compared with a no-renewables baseline. Continued solar PV cost reduction, however, will increase the relative cost of PV-T compared with solar PV only. Cost reduction from design The two main UK distributors of PV-T panels are both working on improving the performance of their products. The main focus is on maximising the electrical efficiency, by using high efficiency solar PV cells with lower temperature degradation. This performance improvement is dependent on growth in the global PV market, which is many degrees of magnitude bigger than the global PV-T market. There is also scope for cost reduction from better design-for-manufacture. The newer PV-T designs mentioned above are likely to be expensive when first released but have good scope for cost reduction in time via cheaper manufacturing processes. Cost reduction from volume The cost of solar PV – estimated at 35% of total PV-T module costs, or around 15-20% of total installed system costs - has fallen dramatically over the past 40 years. The initial part of this reduction started to make PV-T systems a feasible economic proposition for homes. Solar PV costs continue to fall, as illustrated in Figure 24 as global manufacturing capacity increases to
12
The simple payback model also does not include any annual operating costs. PV-T systems should be
maintenance free in most situations, but in practise some will require maintenance, which would increase the
average payback. 13
Typically pool or inter-seasonal store systems would be considerably bigger than the 2 kWp / 5 kWth system
assumed here, though, so the lower capex rate is likely.

Costs
50
multiple gigawatts. We therefore predict a continued fall in the price and installed cost of PV-T panels.
Cost reductions from economies of scale in manufacturing, assembly of the thermal components, and improvements in installer awareness and experience, are also likely as sales volumes increase. In the short term these reductions are likely to come from sales increases in the non-domestic sector in the UK, or from non-UK market growth.
Figure 24 Global installed capacity and average solar PV system installed costs, 2013-2020E (GTM Research, 2015)

Barriers to deployment
A PV-T panel is capable of providing more renewable energy than
separate solar PV and solar thermal modules of equivalent area.
However, PV-T technology has failed to achieve significant market
share in the domestic and light commercial sectors. Figures from MCS show that for the year ended 31 August 2015 ca. 150,000 solar PV and 1,000 solar thermal installations were registered on the MCS Installation Database (MID) (MCS, 2015). This contrasts with UK domestic sales of ca. 50 PV-T systems reported to be installed in the same timeframe. This section explores the barriers specific to the installation of PV-T panels, compared with the installation of solar PV and solar thermal modules, which may be preventing the widespread deployment of PV-T technology. In the domestic and light commercial sectors the PV-T format of choice is liquid filled panels (glazed and unglazed) since the majority of heating systems are liquid rather than air based. PV-T air panels are generally installed where the heat generated may be transferred directly to HVAC or other air-based heating systems. PV-T panels with solar concentrators are seldom used in the domestic and light commercial sectors since they generally have thermal outputs in excess of local requirements and often require solar tracking systems which adds significantly to their cost.
Technical barriers to deployment Potential technical barriers to the installation of PV-T panels include;
More complex system design
More technically demanding installation
Each of the above may be sub-divided into specific technical barriers. These are identified and discussed below.
PV-T panel physical properties PV-T panels, whether liquid or air filled, need to accommodate both electricity and heat generating elements and so have a more complex construction compared with standard solar PV or solar thermal modules. This might be expected to cause issues with the size and weight of the panels. Indeed, when compared with standard solar PV modules the weight of PV-T panels is significantly higher. This will preclude installation of PV-T in some locations where the load bearing capability of the available supporting structure is sufficient for solar PV modules only. Table 9 gives the physical properties of examples of PV-T, solar PV and solar thermal panels that are typical for the UK market.
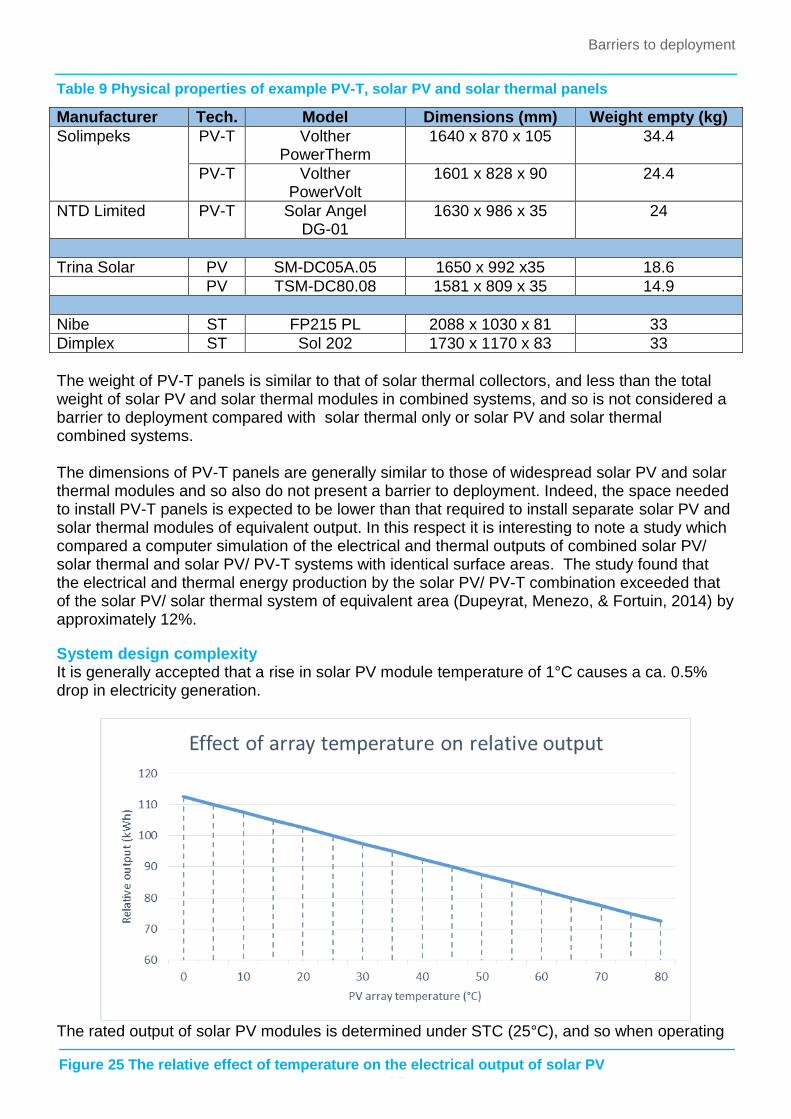
Barriers to deployment
52
Table 9 Physical properties of example PV-T, solar PV and solar thermal panels
The weight of PV-T panels is similar to that of solar thermal collectors, and less than the total weight of solar PV and solar thermal modules in combined systems, and so is not considered a barrier to deployment compared with solar thermal only or solar PV and solar thermal combined systems. The dimensions of PV-T panels are generally similar to those of widespread solar PV and solar thermal modules and so also do not present a barrier to deployment. Indeed, the space needed to install PV-T panels is expected to be lower than that required to install separate solar PV and solar thermal modules of equivalent output. In this respect it is interesting to note a study which compared a computer simulation of the electrical and thermal outputs of combined solar PV/ solar thermal and solar PV/ PV-T systems with identical surface areas. The study found that the electrical and thermal energy production by the solar PV/ PV-T combination exceeded that of the solar PV/ solar thermal system of equivalent area (Dupeyrat, Menezo, & Fortuin, 2014) by approximately 12%.
System design complexity It is generally accepted that a rise in solar PV module temperature of 1°C causes a ca. 0.5% drop in electricity generation.
The rated output of solar PV modules is determined under STC (25°C), and so when operating
Manufacturer Tech. Model Dimensions (mm) Weight empty (kg)
Solimpeks PV-T Volther PowerTherm
1640 x 870 x 105 34.4
PV-T Volther PowerVolt
1601 x 828 x 90 24.4
NTD Limited PV-T Solar Angel DG-01
1630 x 986 x 35 24
Trina Solar PV SM-DC05A.05 1650 x 992 x35 18.6
PV TSM-DC80.08 1581 x 809 x 35 14.9
Nibe ST FP215 PL 2088 x 1030 x 81 33
Dimplex ST Sol 202 1730 x 1170 x 83 33
Figure 25 The relative effect of temperature on the electrical output of solar PV
Evidence Gathering – Low Carbon Heating Technologies
53
at 65°C, for example, a solar PV module rated at 250W may be generating only 200W. Furthermore, solar PV arrays will reach higher temperatures than the ambient air so that module temperatures of 100°C+ are possible. Figure 25 illustrates the effect of PV module temperature on electrical output. One of the major benefits of PV-T technology is that by extracting heat from the PV-T panels the temperature of the panel may be maintained at a lower level than a standard PV module thereby enhancing electricity generation. This may also be a barrier for certain applications of the technology, however, since the need to maintain the temperature of the solar PV cells of a PV-T panel at relatively low levels means that flow temperatures in PV-T systems are typically 40 - 50°C. This contrasts with the need for higher temperatures for hot water storage applications (typically 55 - 65°C). This is not a problem for solar thermal collectors which can easily operate at the upper limits of temperature for stored hot water. Consequently PV-T systems, if they are to benefit from higher electrical efficiency, need to be designed to include a supplementary heating system that is capable of raising the temperature of stored hot water to required levels. While a significant consideration, in practice this is no different from solar thermal only system design since solar thermal systems must also incorporate supplementary heating systems for periods when the solar resource on its own is insufficient to meet hot water demand, e.g. during the winter months. In addition to the above, in order to ensure that the solar PV element of the PV-T panel is maintained at lower temperatures, it is preferable that the heat sink (i.e. where heat generated by the PV-T system is stored) is sufficiently large that it is able to accept the heat generated from the PV-T module at all times. A standard domestic hot water cylinder or thermal store is unlikely to be sufficiently large for this purpose, particularly during the summer months when heat generation is at its peak and heat demand is low. Hence the design of the PV-T system will need to include a larger, and potentially more expensive, heat sink. Otherwise it will be necessary either to dump the excess heat, which is wasteful, or to allow the temperature of the PV-T panel to rise above the desired levels thereby reducing electricity generation. In the latter case, so-called stagnation mode, PV-T panels may reach temperatures of the order of 80°C. By comparison stagnation temperatures for solar thermal systems can exceed 200°C. Dumping heat from air-filled PV-T systems is relatively straightforward, often simply requiring appropriate venting, whereas dumping heat from liquid-filled PV-T systems may require the installation of an additional heat exchanger. Some innovative solutions to the requirement for a large heat sink for PV-T systems have been developed. These include storing excess heat in the ground beneath the building on which the PV-T is installed. This heat is then utilised during the colder months by a GSHP. Other solutions include using a swimming pool (and its enclosure) as the heat sink or boosting the capacity of a thermal store through the use of PCM. Some manufacturers also enable design flexibility through the provision of PV-T panels optimised either for heat or electricity production. For example Solimpeks manufacture PowerTherm and PowerVolt variants of their Volther PV-T panels, which are optimised for heat and electricity generation respectively. While the complexities in system design described above represent a potential barrier to deployment of PV-T in comparison with separate solar PV and solar thermal systems they are
Barriers to deployment
54
not considered insurmountable, as evidenced by the solutions that have been developed (as detailed earlier in the report).
PV-T system installation complexity Installing a PV-T system requires both DC electrical and hydraulic connections and so is more complicated than installing a single solar technology system. However, the training and competence required to install PV-T systems, in addition to roofing experience to check the ability of the supporting roof structure to withstand additional static and dynamic loads, is no different from the combined training and skills required to install solar PV and solar thermal systems individually. In fact, because PV-T systems have lower stagnation temperatures (ca. 80°C vs ca. 200°C) standard plumbing techniques may be used for their installation. This contrasts with the installation of conventional solar thermal which requires specialist knowledge of high temperature pipe jointing and insulation. The use of liquids in proximity to DC generated by the solar PV element of PV-T systems (not a problem for air filled systems) means the consequences of leaks may be more severe, but given the nature of renewable energy system installation this is not considered to place a greater burden on the quality control and management of the installation than already exists for the installation of individual solar technology systems. Hence the complexity of installation of PV-T systems is not considered a barrier to their deployment.
Installer availability According to statistics from the MCS website there are currently over 2,600 MCS certificated solar PV installers and over 1,000 MCS certificated solar thermal installers with 700 installers certificated for both solar PV and solar thermal (MCS, 2015). It is important to remember that MCS certificated companies are not individuals and so the numbers of individual installers deemed competent to install PV-T systems is likely to be higher. However, feedback from owners of PV-T systems has shown that installer experience is key and there are only a few installers with PV-T experience in the UK. If it is assumed that clients would insist that systems are installed by an MCS certificated installer (in order to be eligible for FITs) then these figures suggest the availability of suitable installers might be a barrier to the deployment of PV-T system compared with single solar technology systems.
Commercial and economic barriers Deployment of PV-T systems in domestic (or commercial or industrial situations) is very low compared with many other technologies, particularly solar PV only systems, but also when compared with solar thermal systems. There are technical issues, mentioned previously, that make a PV-T installation more complicated than solar PV or solar thermal systems. In practice these act as commercial barriers to the installation of PV-T by increasing total system costs. These complications are likely to be more significant for retrofit situations than for new builds, in which roofing work is being completed in any case, as evidenced by the fact that the majority of PV-T systems to date have been installed on new build homes. The requirement for significantly more thermal storage capacity (or exceptionally high thermal demand) is the major complication affecting domestic deployment. The majority of UK domestic PV-T installations to date have been installed in a situation with a non-standard thermal store

Evidence Gathering – Low Carbon Heating Technologies
55
(often either buffer tanks, including thermal stores also taking heat from other sources, or inter-seasonal storage). The total market for these situations is currently low (although much higher than the total number of domestic PV-T installations).
Standard hot water cylinders – very limited market PV-T could be, and has been in a small number of installations, installed to pre-heat the water in a ‘typical’ household hot water cylinder of say 200 litres. A PV-T system properly designed for this size of cylinder will be small, typically less than 10 panels, with an electrical rating of 2kWp and thermal rating of 4kWth. Retrofitting the solar thermal aspect of this system to an existing 200 litre cylinder is possible (via an immersion replacement solar coil) but is both expensive (with respect to components and labour) and impacts on performance. The additional costs of the PV-T panels, relative to solar PV only systems, are very unlikely to be paid back by the savings on gas for domestic hot water heating. For new homes, the fact that gas boilers with separate hot water cylinders are rapidly being replaced by combi-boilers with no hot water cylinder is another barrier to PV-T deployment. Fewer conventional or system boilers are installed each year in the UK (i.e. systems with hot water cylinder), when compared with 1.3 million combi-boilers (without any hot water cylinder).
Lack of proven payback (particularly without incentive support) The ‘payback’ time for a domestic or small commercial PV-T installation without any policy support will depend on how much of the electricity generated is used to displace imported grid electricity and how much of the heat generated is actually useful. A simple analysis of the costs against savings suggest that PV-T payback is approximately 15-21 years at current prices. (Although lack of performance data in actual homes makes this conclusion very uncertain.) The attractiveness of PV-T compared to solar PV or solar thermal alone is also extremely dependent on the specific situation: without additional financial support for the heat generation capabilities of PV-T, it is unlikely to be a financially attractive technology option unless there is limited roof space in conjunction with a particular desire/ requirement to save heating fuel.
Awareness and perception Other, non-technical, barriers to the uptake of PV-T technology domestically have also been reported during this research. These can be summarised as;
Lack of awareness of the technology; both amongst homeowners (and designers/ builders) and amongst specialist renewable energy installers. This issue is clearly surmountable, but is another factor limiting market growth at the moment.
A perception amongst some potential installers or designers that PV-T doesn’t work. This is largely the result of some badly designed systems that have not performed as planned, including some where the PV output has been lower, rather than higher, than solar PV alone because of low heat offtake (or poorly designed thermal stores). It is also true that some PV-T marketing has overplayed the potential for improvement of solar PV performance in UK conditions, meaning that some customers have been disappointed. (It has been noted that the more established distributors of PV-T technology in the UK do not appear to do this)
Gap analysis
The scope of the technology to be included in this study was defined as
European manufactured PV-T products of a scale that is suitable for
providing domestic space heating and/ or hot water in the UK. Due to
the range of approaches to PV-T there is a lack of consistency in the
product information provided and how performance is assessed. This section of the report highlights any gaps in the evidence gathered throughout the research task to provide a full and accurate answer to key questions posed about the technology. A number of areas have been identified where further evidence is required to provide a higher level of assurance in the outcomes of the report. Where applicable, recommendations have been made as to how these evidence gaps can be filled through further study and additional evidence gathering. This report reviews a wide range of current evidence that was available at the time. The methodology employed to gather data was designed to ensure evidence gaps were minimised and qualitative and quantitative data provided a broad understanding of the UK market, whilst also understanding specific technology limitations. The results from this research have provided the background information and evidence that this report is based on.
PV-T product data Due to the lack of standards for assessing PV-T performance, there is potential that the manufacturer’s data has been determined under different operational conditions, reducing the confidence in comparing different product characteristics. Especially with non-British manufactured products there is no certainty that the basis for establishing PV-T product characteristics, such as electrical and thermal rating, temperature coefficients etc., is uniform or representative of UK operational conditions. An international/ European/ British standard needs to be established along with a testing protocol for assessing PV-T performance. When this is available independent testing to these standards will provide the impartial evidence required to compare products with any level of confidence.
In-use performance data It has only been possible to identify a small percentage of the estimated 500 PV-T systems installed in the UK, and very few of these include any credible method of monitoring performance, efficiency even less so. As a result the data supplied can only be taken as a rough guide to the actual performance of PV-T in the UK. As mentioned previously in the report in order to assess performance and efficiency it is necessary to understand;
energy input (i.e. solar irradiance)
energy output (i.e. heat and electricity)
ambient temperature
system control (i.e. operational temperatures, flow rates etc.)
thermal storage capacity

Evidence Gathering – Low Carbon Heating Technologies
57
system losses before the heat/ generation meter None of the 8 systems assessed provided all of this data in full. The majority of data sets only provided 1 or 2 of these and was collected manually (as opposed to automatically by a monitoring/ data logging system) from meter readings, therefore providing aggregated data. As a result of the nature of the data analysed it has only been possible to compare monthly system outputs providing a general understanding of the system performance. The systems assessed vary in size and type, therefore it is very hard to draw conclusions as thermal storage and heat demand profiles also affect the performance of a PV-T system, and no two systems were similar enough to disregard this effect. In order to impartially assess the effect of PV-T on solar PV efficiency it would be necessary to have two systems installed in similar locations (experiencing the same environmental conditions/ solar resource etc.) with similar heat loads. It has not been possible to obtain data for any PV installations of the same size (i.e. kWp rating) near any of the PV-T systems assessed. There are a number of new PV-T installations with comparable solar PV only installations nearby that have the potential to provide the data required to make an assessment in the future. However not all required performance indicators are being monitored, which can leave the data open to interpretation. A side by side trial of different PV-T technologies and traditional PV systems in an outdoor test centre will provide the data required to make an unbiased assessment. In this type of environment it is possible to assess other factors that have the potential to affect performance, such as energy consumption profiles and different thermal storage technologies. At present there do not appear to be any trials of this kind taking place in the UK for PV-T.
Cost data The costs of PV-T systems fluctuate dramatically from system to system. Due to the low number of system specifiers and installers in the UK, the data behind the cost section has been based on information provided by <10 companies. As a result of the range of hybrid applications for the technology, it has not always been possible to obtain cost data for a ‘typical’ PV-T system, as generally all systems are site/ customer specific. By dividing a PV-T system into different sections it was possible to get a range of costs for each section, but when combined were not necessarily representative of system cost. A number of manufacturers supply PV-T panels only and therefore can only provide an estimate on the cost of other system components, potentially skewing aggregated results. A number of costs included in a PV-T system will be closely linked to; raw material costs, impact of other markets (i.e. solar PV market), import duties, exchange rates, etc., that provides an additional risk of cost fluctuation. It is very difficult to account for this in the analysis. Uncertainty in costs could be overcome by obtaining quotations for a specific system description (i.e. providing an energy consumption profile, existing heating infrastructure layout). System designers may provide different solutions (i.e. different approaches to thermal storage), however this would provide more of a realistic view of likely costs to the end client.
Future market for PV-T There are a number of associated markets that are outside the scope of this report but have a bearing on the potential future of PV-T in the UK.

Gap analysis
58
Thermal storage as a technology in its own right is an emerging market that could potentially help with the development of the PV-T market. Developments in thermal storage are currently being driven by economics/ running costs (which is largely linked to demand shifting via variable tariffs) but the results could help provide better storage solutions for PV-T applications, making it a more attractive investment. The types of heating systems being installed will also have an effect on the PV-T market. At present combi boilers are the most popular heating technology to install. Although a PV-T system can be integrated into this type of system the most it will contribute is a pre-heated feed which is not an effective use of PV-T. Competition and interaction with other heating technologies and demand side management could also affect the future market for PV-T. For example the use of energy diverters with solar PV systems, diverting surplus energy into an immersion heater for domestic hot water. A levelised cost assessment of PV-T in combination with other heating and thermal storage technologies for different energy consumption (tapping) profiles will provide a method to compare different approaches and how other market developments may affect the future market for PV-T.

Conclusion
At present PV-T is a niche technology. Due to the complex nature of
system integration and the requirement for adequate thermal storage to
operate systems efficiently, PV-T lends itself better to new build
applications (especially in conjunction with highly efficient buildings)
than to retrofit. Without specific policy support to encourage the take up
of PV-T the UK market will remain small.
PV-T panels combine two well established renewable energy technologies into one integrated
component that generates both low carbon electricity and heat from the same renewable energy
source.
The advantages of the technology can be summarised as;
Higher energy yield per m2, allowing a higher percentage of energy to be self-generated
on properties with smaller roofs
Provide a more uniform look to the building than separate solar PV and solar thermal
systems
Can generate a lot of low grade heat from a domestic scale system and complements a
number of other low carbon heating technologies
Has the potential to make a significant contribution to heating and hot water when
designed and installed as part of an energy efficient new build
Reduction in material costs within module unit and shared infrastructure materials i.e.
roof mounting
The disadvantages of the technology are considered to be;
The trade-off required in efficiency terms between the thermal and electrical output
Technically more complex to retrofit systems into existing heating distribution systems
Systems require a secondary heating system to meet all year round domestic space
heating and hot water demand.
Large storage capacity is required to keep electrical efficiencies high
Limited product choice and experienced installers
40 European PV-T manufactures were identified in the research, 13 of which seem to have a market presence in the UK, but only 2 products have had any real market penetration and are actively being specified and installed in the UK by Minimise Generation and NTD Limited. PV-T panels generally fall into 1 of 6 categorises (as defined by the PVTNorm Project) depending on their heat transfer medium (i.e. liquid or air), the relative positioning of the solar

Conclusion
60
PV cells and the absorber, whether they are glazed or unglazed, whether they are insulated or not and how they are mounted (i.e. on-roof, in-roof, façade mounted, etc.). More than 80% of commercially available PV-T modules are unglazed which are more suitable for low temperature applications. Typically the products installed in the UK have been either type 1a or type 2 PV-T products (unglazed flat plate panels with or without thermal insulation) using a water/glycol mix as the heat transfer medium. There are opportunities for improvement in PV-T performance under current rates of deployment. Future product developments are looking to;
Reduce heat losses
Provide protection against over-heating
Incorporate the latest in high efficiency solar cells
Provide packaged systems with domestic scale heat pumps and new thermal storage technologies
Improve system economics
It is estimated that there are approximately 500 domestic PV-T installations in the UK. With an annual deployment in the range of 10 to 100 systems per year. There is potential for the number of installations to increase as new products are developed and energy-efficiency begins to dominate the roof-top renewables market, rather than subsidy driven financial returns. Good applications for PV-T are considered to be leisure centres, sports facilities, nursing homes and small industrial sites requiring pre-heated water. However, relatively few domestic properties have large enough hot water cylinders and hot water demand, to make PV-T an economic proposition, this is further complicated by the growth in popularity of combi-boilers. The possible growth markets for PV-T in the longer term have been identified as installations that have the potential combination of:
Where there is limited roof space for installation (including zero carbon homes)
High hot water demand (particularly in the summer)
Currently there is no technical standard for PV-T. It is recognised that the combination of solar
PV and solar thermal leads to significant complexity and challenges around accurately
predicting performance due to the complexity of the interaction between the individual functions.
Through the PVT-Norm project a combined test procedure covering all relevant electrical and
thermal aspects of PV-T collectors, referring to existing standards whenever possible. The draft
test standard is to be sent to the IEC Technical Committee 82 for consultation and potential
adoption as a new international standard shortly.
It is likely that PV-T fits within the scope of the ErP Directive, however these regulations only
come into effect when a given product type exceeds sales in excess of 200,000 units per year in
the EU common market, which may not be achieved by PV-T in the short term.
The design concept of a PV-T system is to produce heat and electricity as efficiently as possible, maximising the amount of solar energy converted into usable energy. Theoretically a combined system efficiency of 60–80% can be achieved in low temperature applications. However, few PV-T systems installed in the UK are provided with an adequate means of

Evidence Gathering – Low Carbon Heating Technologies
61
assessing performance and therefore it is not possible to determine whether or not systems ever achieve this level of efficiency. From performance data gathered of a small percentage of UK installations it can be seen that PV-T systems can cover approximately 5-20% of domestic heating loads and 40-50% of electrical loads. PV-T systems installed as part of a new hybrid heating system (i.e. on energy efficient new builds) exhibit the better overall system performance. The average PV-T panels total energy output is split 37% electrical to 63% thermal. The electrical performance of more recently installed PV-T systems does show an overall increase in the electrical output in comparison to modelled solar PV systems in the same situation. Increases in annual output vary from 4-12%. Smaller PV-T systems (1-2 kWp) and systems employing micro-inverters or DC optimisers show the most improvement. As PV-T is almost always used in conjunction with another heating technology it is very difficult to assess the thermal performance of the technology in isolation. There has been no evidence from the data assessed, that solar PV-T panels realise their thermal output as detailed in product data sheets. The majority of PV-T manufacturers provide both a product warranty and performance warranty and they consider the product lifetime to be in excess of 25 years. Typical PV-T panel costs range from £280 to £420 per unit. Typical installed costs (which include installation, plus inverters and pipework, but not any new thermal storage needed) are around £2,250 - £3,000 per kWp electric. The cost of a typical PV-T system is estimated to be divided into the following elements;
15-20% solar PV component
30-35% material cost of thermal component and panel frame
20% design and installation labour
25-35% additional components (i.e. buffer tank, pipework, inverter, cabling, mounting and
control system)
There is clearly potential for the economic case for PV-T to improve if installation volumes increase significantly, both from cost reductions via economies of scale (reduced manufacturing and installation costs) and from design improvements. The relative cost difference of a domestic PV-T system in comparison to installing both a separate solar PV and solar thermal system at the same time are marginally lower, but this can vary on installation specifics and storage requirements. Potential technical and market barriers to the deployment of PV-T systems in UK domestic and light commercial applications have been reviewed. Overall the technical challenges associated with the installation of PV-T systems are no different from those installing combined solar PV and solar thermal systems. In some cases the technical requirements are actually reduced (e.g. area required for the installation of modules). When PV-T is compared to solar thermal systems these include;
Conclusion
62
Lower flow temperatures in PV-T systems leading to the requirement to include an additional heating system to raise stored water temperatures to required levels. However, it is noted that this is also often required for solar thermal systems.
Lower availability of MCS certificated installers
Higher heat sink capacity or ability to dump heat.
When PV-T is compared to solar PV systems these include;
Significantly lower availability of MCS certificated installers
Greater weight of modules requiring stronger support which may not always be possible
Electrical output may be lower if flow temperatures are not regulated correctly (e.g. if heat sink is too small)
The requirement for significantly more thermal storage capacity (or exceptionally high thermal demand) is the major complication affecting domestic deployment. The additional cost of the PV-T panels, relative to solar PV only systems, are very unlikely to be paid back by the savings on gas for domestic hot water heating. Other market barriers include: lack of awareness; a negative perception of the technology. A gap analysis on the research completed identified that the establishment of standards to assess the performance of PV-T and provide a framework on how to define product characteristics is key to allow products to be impartially compared. The in use data gathered was not sufficiently detailed to provide a real assessment of typical system performance in the UK, or establish the effect PV-T has on PV efficiency. Side-by-side outdoor testing of PV-T and solar PV modules with known operational parameters and typical energy consumption profiles will provide impartial evidence on performance. Due to the many variations of integrating PV-T and the extent of what is considered to be included within the PV-T system it has been difficult to collect with any degree of certainty comparable PV-T costs. There are also a number of influencing factors that can impact on the installed cost of PV-T. A number of associated markets not included in the scope of this research (i.e. thermal storage, other heating technologies and demand side management) will also have a bearing on the future market for PV-T.

References
Althuas, J., Bott, M., & Fritzsche, U. (2014). Qualification of PVT Collectors - Current Status. Koln: TUV Rheinland Energie and Umwelt GmbH.
Aste, N., Del Pero, C., & Leonforte, F. (2012). Thermal-electrical optimization of the configuration a liquid PVT collector. Energy Procedia 30, 1-7.
Cartmell, B. P., Shankland, N. J., Fiala, D., & Hanby, V. (2004). A multi-operational ventilated photovoltaic and solar air collector: application, simulation and initial monitoring feedback. Solar Energy 76, 45-53.
Chow, T. T. (2010). A review on photovoltaic/thermal hybrid solar technology. Applied Energy, 365-379.
Cronemberger, J., Rodriguez, E., Martin, C. E., Garcia Santos, A., & Vega Sanchez, S. (2009). Methodology in Research on Photovoltaic Cogeneration Integrated in Buildings. Madrid: UPM.
DCLG. (2015, April 23). Statistical data set - Live tables on dwelling stock (including vacants). Retrieved from GOV.UK: https://www.gov.uk/government/statistical-data-sets/live-tables-on-dwelling-stock-including-vacants
BEIS. (2011). Renewable Heat Incentive. London: Department of Energy & Climate Change. BEIS. (2015). Energy Consumption in the UK (2015). London: Department of Energy & Climate
Change. BEIS. (2015). Energy Consumption in the UK (ECUK). Domestic data tables, 2015 update.
London: Department for Energy and Climate Change. BEIS. (2015, November 15). Government Guidance - Ecodesign: placing energy related
products on the UK market. Retrieved from Gov.uk: https://www.gov.uk/guidance/placing-energy-related-products-on-the-uk-market
BEIS. (2015, July 30). Official Statistics - Energy consumption in the UK. Retrieved from GOV.UK: https://www.gov.uk/government/uploads/system/uploads/attachment_data/file/449107/3._domestic_data_tables.xlsx
DGS. (2009). Planning and installing photovoltaic systems: a guide for installers, architects, and engineers - 2nd edition. London: Earthscan.
Dupeyrat, P., Menezo, C., & Fortuin, S. (2014). Study of thermal and electrical performances of PVT solar hot water systems. Energy and Buildings 68, 751-755.
EC. (2013, August 2). COMMISSION REGULATION (EU) No 814/2013 of 2 August 2013 implementing Directive 2009/125/EC of the European Parliament and of the Council with regard to ecodesign requirements for water heaters and hot water storage tanks.
Elliott, D. (2011). PV/T Software Coherence and Applicability. Glasgow: University of Strathclyde.
Fiorentini, M. (2013). Solar thermal UK: World renewables 2013. Bracknell: BSRIA. Fritzsche, U., Althaus, J., & Bott, M. (2014). Qualification of PVT collectors - current status.
Koln: TUV Rheinland. GTM Research. (2014). PV Pulse. Boston: Greentech Media. GTM Research. (2015). PV Balance of Systems 2015: Technology Trends and Markets.
Boston: Greentech Media. Hansen, J., Sorensen, H., Bystrom, J., Collins, M., & Karlsson, B. (2007). Market, modelling,
testing and demonstration in the framework of IEA SHC Task 35 on PV/Thermal Solar Systems. Paris: IEA.

References
64
Haurant, P., Menezo, C., & Dupeyrat, P. (2014). The PHOTOTHERM project: full scale experimentation and modelling of a photovoltaic-thermal (PV-T) hybrid system for domestic hot water applications. Energy Procedia, 581-587.
Herrando, M., Markides, C. N., & Hellgardt, K. (2014). A UK-based assessment of hybrid PV and solar-thermal systems for domestic heating and power: System performance. Applied Energy, 288-309.
HM Government. (2013). Domestic Building Services Compliance Guide. Newcastle Upon Tyne: National Building Specification.
IEA. (2002). Photovoltaics/thermal Solar Energy Systems - Status of the technology and roadmap for future development. Task 7 Report IEA PVPS T7-10:2002. Paris: International Energy Agency.
IEA. (2011). Solar Energy Perspectives. Paris: International Energy Agency. IES. (2012). Technology Roadmap - Solar heating and cooling. Paris: International Energy
Agency. IPCC. (2012). Renewable Energy Sources and Climate. New York: Cambridge University
Press. London Energy Partnership. (2006). Towards Zero Carbon Developments – Supportive
Information to Boroughs. London: London Energy Partnership. MCS. (2015, November 13). MCS Installation Database. Retrieved from Microgeneration
Certification: https://certificate.microgenerationcertification.org/ MCS. (2015, November 13). MCS Installer Database. Retrieved from Microgeneration
Certification: http://www.microgenerationcertification.org/consumers/installer-search OECD/IEA. (2012). Technology Roadmap: Solar Heating and Cooling. Paris: IEA. ONS. (2014). Trends in the United Kingdom Housing Market, 2014. Newport: Office for National
Statistics. ONS. (2015). Statistical Bulletin - Families and Households, 2015. Newport: Office for National
Statistics. Prime Minister's Office. (2015, October 12). Prime Minister: Councils must deliver local plans for
new homes by 2017. London, UK. Radziemska, E. (2009). Performance analysis of a photovoltaic-thermal integrated system.
International Journal of Photoenergy. Santbergen, R., & van Zolingen, R. (2007). The absorption factor of crystalline silicon PV cells:
A numercial and experimental study. Solar Energy Materials and Solar Cells. Technologies, C. (2015, November 13). Alternative Energy Products. Retrieved from CGA
Technologies: http://www.cgaspa.it/ViewNews.aspx?IDCategoria=10 Treberspurg, M., Djalili, M., & Staller, H. (2011). New technical solutions for energy efficient
buildings - State of the Art Report - Photovoltaic/Thermal Systems (PV/T). SCI-Network. UKERC. (2014). The future role of thermal energy storage in the UK Energy System. London:
UKERC. van Helden, W. G., van Zolingen, R. J., & Zonday, H. A. (2004). PV Thermal Systems: PV
panels supplying renewable electricity and heat. Progress in Photovoltaics: Research and Applications, 415-426.
Zhang, B., Lv, J., Yang, H., Li, T., & Ren, S. (2015). Peformance analysis of a heat pipe PV/T system with different circulation tank capacities. Applied Thermal Engineering, 89-97.
Zondag, H. A., van Helden, W. G., Bakker, M., Affolter, P., Eisenmann, W., Fechner, H., . . . Tripanagnostopoulos, Y. (2005). PVT Roadmap: a European guide for the development and market introduction of PVT technology. Barcelona: 20th European Photovoltaic Solar Energy Conference.

Appendix A – Case Studies
Zero Energy Bills (ZEB) home with PV-T system - Corby
Installed: September – November 2015 Reason: One of multiple energy saving technologies integrated into the design of 8 basic Code 3 houses to achieve an affordable ZEB home. System description: 15 x Solimpeks Volther PowerVolt PV-T modules (3kWp electric & 6.9kW thermal) per house providing a pre-heat feed to a gas combi-boiler feeding heating and hot water. Connected to a home automation monitoring and management system. Energy load: Energy efficient 3 bedroom semi-detached house. Performance: The system is estimated to meet a large proportion of the energy requirements of the house with income generated by FIT to offset gas consumption. Energy modelling has estimated that the system will achieve an average increase in PV electricity generation of 15%. These systems are fully monitored and the results are to be reported by Electric Corby in 2016.
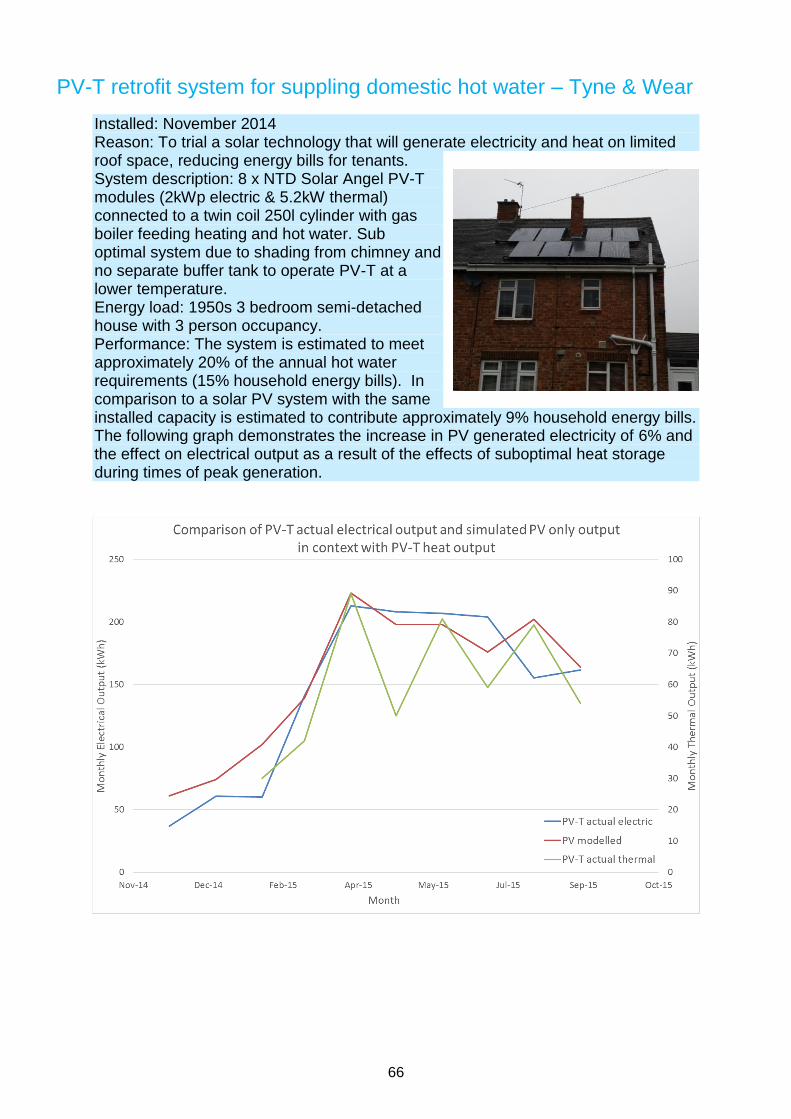
66
PV-T retrofit system for suppling domestic hot water – Tyne & Wear
Installed: November 2014 Reason: To trial a solar technology that will generate electricity and heat on limited roof space, reducing energy bills for tenants. System description: 8 x NTD Solar Angel PV-T modules (2kWp electric & 5.2kW thermal) connected to a twin coil 250l cylinder with gas boiler feeding heating and hot water. Sub optimal system due to shading from chimney and no separate buffer tank to operate PV-T at a lower temperature. Energy load: 1950s 3 bedroom semi-detached house with 3 person occupancy. Performance: The system is estimated to meet approximately 20% of the annual hot water requirements (15% household energy bills). In comparison to a solar PV system with the same installed capacity is estimated to contribute approximately 9% household energy bills. The following graph demonstrates the increase in PV generated electricity of 6% and the effect on electrical output as a result of the effects of suboptimal heat storage during times of peak generation.

Evidence Gathering – Low Carbon Heating Technologies
67
Hybrid PV-T system with inter-seasonal storage to supply heating and
hot water – Leicester
Installed: January 2014 Reason: To combine a cost effective inter-seasonal storage system to store solar energy for use in the heating season. System description: 28 x Solimpeks Volther Powertherm PV-T modules (5.6kWp electric & 12.88 kW thermal), connected to an EEB with 56 x 1.5m bore holes and a 6.5kW heat pump. The system is controlled to prioritise hot water production and charging the EEB. Energy load: Highly efficient new build detached house. Performance: The highest uplift temperature recorded on the PV-T system was 18.54°C whilst the ambient temperature was 22.4°C and the PV-T return temperature was 50.73°C. The PV-T system contributes ~17% to the heating and hot water load and over 40% to the electrical loads.

© Crown copyright 2016 Department for Business, Energy and Industrial Strategy 3 Whitehall Place London SW1A 2AW www.gov.uk/beis