evidence on igras - stop tb · pdf file1 in 3 hiv-infected patients with active tb will be...
TRANSCRIPT

Evidence on IGRAs in Low & Middle Income Countries
Madhukar Pai, MD, PhD
McGill University, Montreal

Disclosure
No industry/financial conflicts
I co-chair the Stop TB Partnership’s New Diagnostics Working Group
I consult for the Bill & Melinda Gates Foundation I have participated in the WHO Expert Group meetings on
IGRAs and serodiagnostics

Rationale In recent years, IGRAs have become widely endorsed in high-income
countries for diagnosis of LTBI and several guidelines on their use have been issued.
Currently, there are no guidelines for their use in high TB- and HIV-burden settings, where IGRAs are being promoted, especially in the private sector.
IGRA performance differs in high- versus low TB and HIV incidence settings
Majority of IGRA studies have been performed in high-income countries and extrapolation to low- and middle-income settings may not be appropriate.
WHO Stop TB Department therefore convened a Expert Group meeting on IGRAs on July 20 & 21, 2010
WHO commissioned 6 systematic reviews on the use of IGRAs in low- and middle-income settings, in pre-defined target groups, with funding support from the TDR and TREAT-TB/Union.

Hierarchy of evidence on IGRAs developed by the systematic review team and shared with Expert Group prior to the meeting

27 studies (17 QFT-GIT, 10 T-SPOT) evaluating 590 HIV-uninfected and 844 HIV-infected TB suspects were included.
Metcalfe JZ et al. Journal Infect Dis (in press)

Sensitivity of QFT-GIT and T-SPOT.TB in HIV-uninfectedpersons with confirmed active TB in low- and middle-income countries
.
.
QFT-GITAabye 2009Chegou 2009Chen (a) 2009Dheda (d) 2009Katiyar 2008Pai 2007Raby 2008Tahereh 2010Tsiouris 2006Subtotal (I-squared = 59.8%, p = 0.011)
TSPOTDheda (c) 2009Ozekinci (a) 2007Shao-ping 2009Soysal (a) 2008Subtotal (I-squared = 27.5%, p = 0.247)
authoryear
TanzaniaSouth AfricaChinaSouth AfricaIndiaIndiaZambiaIranSouth Africa
South AfricaTurkeyChinaTurkey
country
81 (71, 88)96 (78, 100)85 (71, 94)73 (45, 92)95 (87, 99)74 (60, 84)84 (68, 94)77 (59, 90)77 (46, 95)84 (78, 91)
93 (68, 100)93 (76, 99)91 (71, 99)81 (72, 88)88 (81, 95)
Sensitivity (95% CI)
15.1512.8112.025.2617.8311.8011.099.025.02100.00
15.4726.1318.9539.45100.00
Weight%
81 (71, 88)96 (78, 100)85 (71, 94)73 (45, 92)95 (87, 99)74 (60, 84)84 (68, 94)77 (59, 90)77 (46, 95)84 (78, 91)
93 (68, 100)93 (76, 99)91 (71, 99)81 (72, 88)88 (81, 95)
Sensitivity (95% CI)
15.1512.8112.025.2617.8311.8011.099.025.02100.00
15.4726.1318.9539.45100.00
Weight%
0 20 40 60 80 100

Sensitivity of QFT-GIT and T-SPOT.TB in HIV-infected persons with confirmed active TB in low- and middle-income countries
.
.
QFT-GITAabye (h) 2009Kabeer 2009Leidl (b) 2009Markova (b) 2009Raby (h) 2008Tsiouris (h) 2006Veldsman 2009Subtotal (I-squared = 76.2%, p = 0.000)
TSPOTCattamanchi 2010Jiang 2009Leidl (a) 2009Markova (a) 2009Oni 2010Subtotal (I-squared = 71.8%, p = 0.007)
authoryear
TanzaniaIndiaUgandaBulgariaZambiaSouth AfricaSouth Africa
UgandaChinaUgandaBulgariaSouth Africa
country
65 (52, 76)66 (50, 80)74 (49, 91)92 (64, 100)63 (49, 75)65 (44, 83)30 (15, 49)65 (52, 77)
54 (45, 64)66 (47, 81)89 (67, 99)62 (32, 86)68 (57, 78)68 (56, 80)
Sensitivity (95% CI)
16.2715.0512.3013.5915.8313.0713.89100.00
25.2318.5819.7311.8824.58100.00
Weight%
65 (52, 76)66 (50, 80)74 (49, 91)92 (64, 100)63 (49, 75)65 (44, 83)30 (15, 49)65 (52, 77)
54 (45, 64)66 (47, 81)89 (67, 99)62 (32, 86)68 (57, 78)68 (56, 80)
Sensitivity (95% CI)
16.2715.0512.3013.5915.8313.0713.89100.00
25.2318.5819.7311.8824.58100.00
Weight%
0 20 40 60 80 100
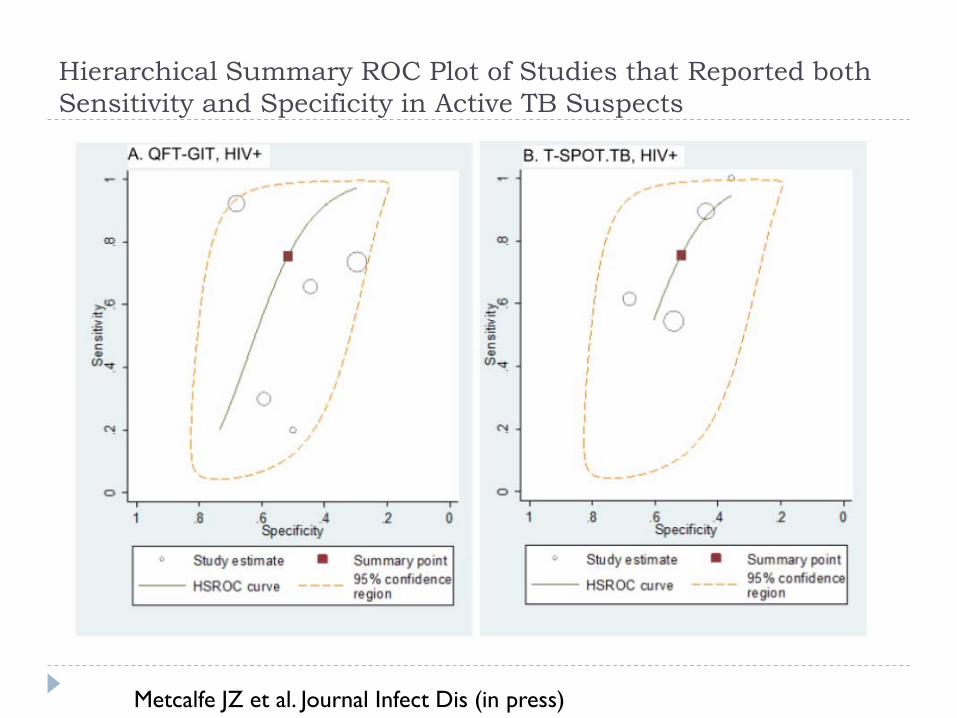
Hierarchical Summary ROC Plot of Studies that Reported both Sensitivity and Specificity in Active TB Suspects
Metcalfe JZ et al. Journal Infect Dis (in press)

Added value of IGRA in smear-negative TB work-up
779 sputum smear-negative HIV-infectedpersons screened for TB prior to IPT
Rangaka MX et al. CDC Late Breaker Session, IUATLD, Berlin 2010
Take home message
1 in 3 HIV-infected patients with active TB will be IGRA-negative 1 in 2 patients without active TB will be IGRA-positive In low- and middle-income countries, IGRAs are inadequate
rule-out or rule-in tests for active TB in adults, especially in the setting of HIV co-infection
IGRAs do not offer added value beyond conventional tests for active TB
IGRAs should not replace microbiological tests for active TB

37 studies included 5736 HIV-infected individuals investigated for LTBI
Cattamanchi A et al. JAIDS 2011


Key findings
Both IGRAs have suboptimal sensitivity in HIV-infected persons with culture-confirmed TB
Neither IGRA was consistently more sensitive than the tuberculin skin test (TST) in head-to-head comparisons.
While TSPOT appeared to be less affected by immunosuppression than QFT-GIT and TST, overall, differences between the three tests were small or inconclusive.
Cattamanchi A et al. JAIDS 2011

Percent sensitivity difference between IGRA and TST results
.
.
QFT-GITKabeer 2009Katiyar 2008Raby (h) 2008Raby 2008Tsiouris (h) 2006Tsiouris 2006Subtotal (I-squared = 78.0%, p = 0.000)
TSPOTJiang 2009Ozekinci (a) 2007Soysal (a) 2008Subtotal (I-squared = 82.1%, p = 0.004)
authoryear
IndiaIndiaZambiaZambiaSouth AfricaSouth Africa
ChinaTurkeyTurkey
country
0.41 (0.22, 0.60)0.18 (0.08, 0.29)0.07 (-0.11, 0.26)0.03 (-0.15, 0.21)-0.19 (-0.42, 0.04)-0.16 (-0.43, 0.11)0.07 (-0.09, 0.23)
0.50 (0.29, 0.71)0.11 (-0.06, 0.28)0.11 (-0.01, 0.23)0.23 (0.00, 0.45)
Difference (95% CI)Sensitivity
16.8720.1116.9417.1615.2013.73100.00
30.2833.0336.69100.00
Weight%
0.41 (0.22, 0.60)0.18 (0.08, 0.29)0.07 (-0.11, 0.26)0.03 (-0.15, 0.21)-0.19 (-0.42, 0.04)-0.16 (-0.43, 0.11)0.07 (-0.09, 0.23)
0.50 (0.29, 0.71)0.11 (-0.06, 0.28)0.11 (-0.01, 0.23)0.23 (0.00, 0.45)
Difference (95% CI)Sensitivity
16.8720.1116.9417.1615.2013.73100.00
30.2833.0336.69100.00
Weight%
-.4 0 .4 .8
There was no significant evidence that either IGRA was more sensitive than the TST for active TB diagnosis, but T-SPOT appeared to be more sensitive.

Impact of CD4+ cell count on the proportion of positive IGRA results
Difference = (% positive CD4 <200 cells/μl) – (% positive CD4 ≥200 cells/μl)
Int J Tuberc Lung Dis 2011 (in press)

Key findings
33 studies were included (mostly from high income countries)
For the diagnosis of active TB, the overall sensitivity of both IGRAs and the TST was similar when assessed in children with all categories of active TB combined All tests were suboptimal to rule-out active TB in children
When assessed across a gradient of exposure, TST and both IGRAs showed a very similar performance
Overall, available data suggest that TST and IGRAs have similar accuracy for the detection of TB infection or the diagnosis of disease in children
Mandalakas A et al. Int J Tuberc Lung Dis (in press)

Performance of IGRAs and TST across a gradient of exposure
Mandalakas A et al. Int J Tuberc Lung Dis (in press)

IGRAs in healthcare workers
Thorax, 2011

Predictive Value of interferon-gamma release assays for incident active TB disease in low,middle and high-income countries: A
systematic review
MX Rangaka, KA Wilkison, D. Ling, JR Glynn, J. Mwansa, K Fielding, D. Menzies, RJ Wilkinson, M. Pai
University of Cape Town, Cape Town, South Africa
London School of Hygiene and Tropical Medicine, London, U.K
McGill University, Montreal, Canada
20Rangaka MX et al. Under review.

11 Cohort studies were included (mostly contacts)
Country, Year published, Income Class.
Adults or Children (Age distribution)
HIV infected sample (%)
àStudy Design Original N evaluated
àN entered follow-up
*IPT given: % TB diagnoses included
Ethiopia 2001, LIC [24] Adults (15-65) No; exclusion
TB case-contacts
38 24 No Smear & culture
Gambia 2008, LIC [29] Adults and Children (0.5-25+) Yes (2%) TB case-contacts
2381 2348 No TST, smear & culture
Turkey 2008, MIC [23] Children (0-16) Not stated TB case-contacts
1024 908 1Yes: 76% Smear & culture
Austria 2009, HIC [25] Adults (IQR:31-46) Yes (100%) HIV infected outpatients
834 822 2No. IGRA & Culture
Netherlands 2009, HIC [26]
Adults (16-45+) No; exclusion
TB case-contacts
433 339 No; exclusion Smear & culture
Colombia 2009, MIC [27] Adults and Children (<4-65+) Unknown TB case-contacts
2060 2060 No Smear & culture
Senegal 2010, LIC [28] Adults and Children (IQR:10-31)
Unknown TB case-contacts
2762 2679 Yes: % Not stated
Smear & culture
Japan 2010, HIC [33] Adults and Children (0-60+) Unknown Retrospective; TB case-contacts
Not stated 5676 3Yes: 20% of 3102
**IGRA
China 2010, MIC [30] Adults (mean 60) Unknown Silicosis outpatients
331 308 4Yes: 33% of 203
Smear & culture
Norway 2010, HIC [31] Adults (18-50+) Unknown Asylum seekers Not stated 823 5Yes: 3% **IGRA Germany 2010, HIC [34] Adults and Children (0-50+) No;
exclusion TB case-contacts
1417 1335 5Yes: Total started not stated
TST, IGRA & culture
5 ELISPOT (2 T.SPOT-TB) 7 WBA/ELISA (5 QFT-Gold In Tube )

Results: Incidence rates of TB by IGRA status
22
Incidence rate per 1000 person-years
Majority of IGRA positives did not progress to TB disease during follow-up
Results: Crude Incidence Rate Ratio for IGRA+ vs. IGRA-
23
IGRA positives have moderate association with incident TB compared to IGRA negatives

Results: Cumulative Incidence Risk Ratio for IGRA+ vs. IGRA-
24
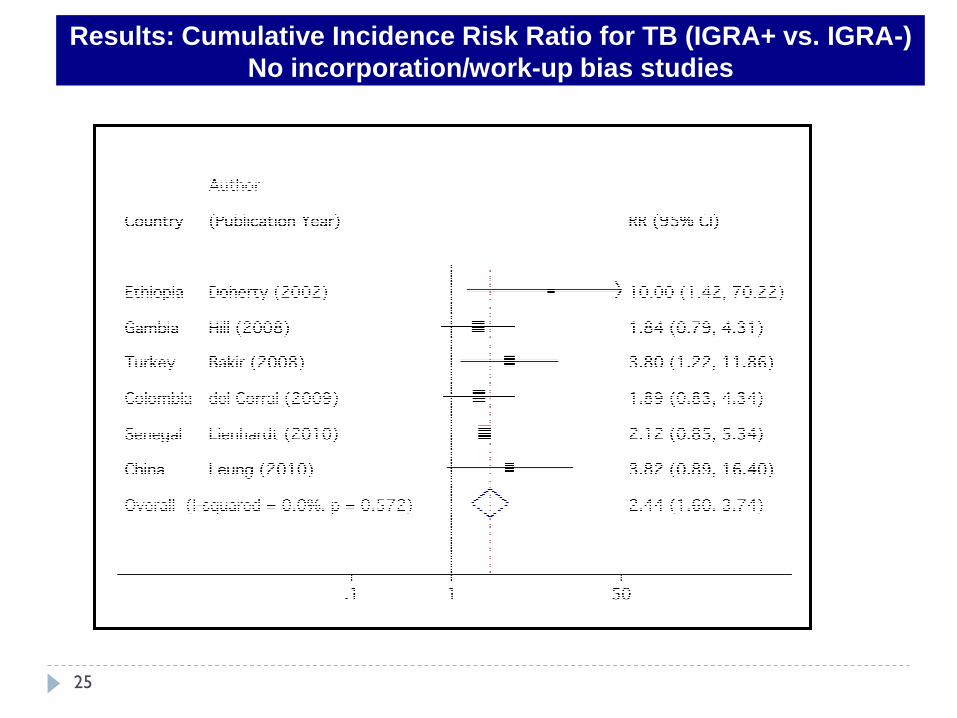
Results: Cumulative Incidence Risk Ratio for TB (IGRA+ vs. IGRA-)No incorporation/work-up bias studies
25

Results:IGRA vs TST: Which has greater predictive ability?
26
IGRA+ and TST+ have a similar strength of association with subsequent TB compared to test negative individuals

Results:IGRA vs TST: Patient-relevant OutcomesHSROC summary estimates of sensitivity, specificity…
Test N at analysis (No. of studies)
Sensitivity % (95% CI)
Specificity % (95% CI)
FPR (1- Specificity) % (95% CI)
ELISPOT Studies
ELISPOT 4,144 (5) 73 (58-84) 48 (38-58) 52 (42-62)
TST 4,638 (5) 72 (58-83) 41 (30-54) 59 (46-70)
27
ELISPOT HSROC TST HSROC (ELISPOT STUDIES)
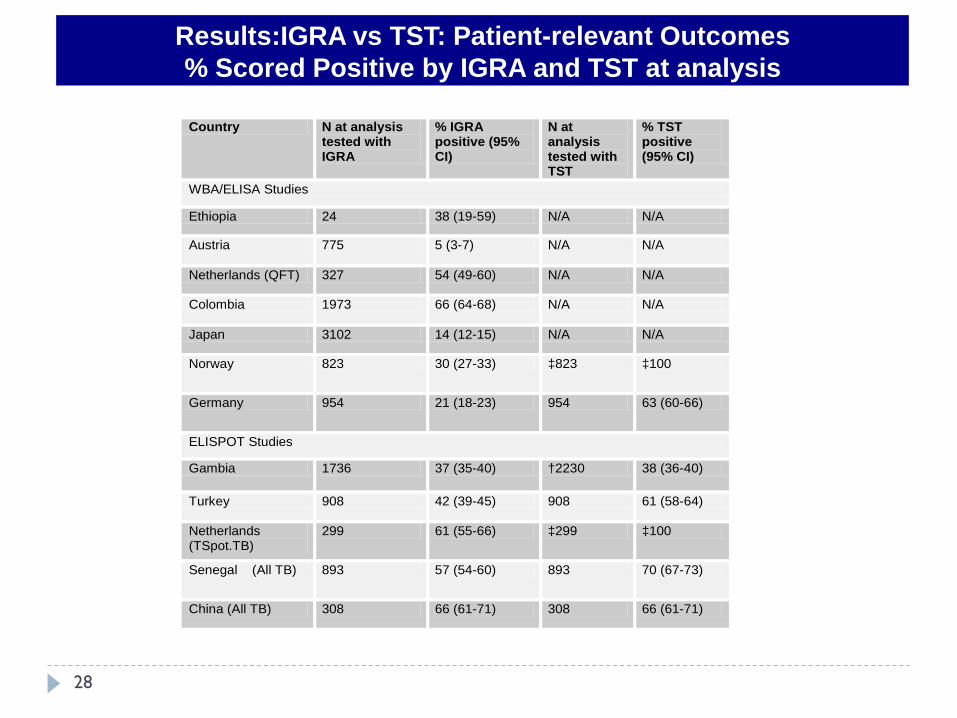
Results:IGRA vs TST: Patient-relevant Outcomes% Scored Positive by IGRA and TST at analysis
28
Country N at analysis tested with IGRA
% IGRA positive (95% CI)
N at analysis tested with TST
% TST positive (95% CI)
WBA/ELISA Studies
Ethiopia 24 38 (19-59) N/A N/A
Austria 775 5 (3-7) N/A N/A
Netherlands (QFT) 327 54 (49-60) N/A N/A
Colombia 1973 66 (64-68) N/A N/A
Japan 3102 14 (12-15) N/A N/A
Norway 823 30 (27-33) ‡823 ‡100
Germany 954 21 (18-23) 954 63 (60-66)
ELISPOT Studies
Gambia 1736 37 (35-40) †2230 38 (36-40)
Turkey 908 42 (39-45) 908 61 (58-64)
Netherlands (TSpot.TB)
299 61 (55-66) ‡299 ‡100
Senegal (All TB) 893 57 (54-60) 893 70 (67-73)
China (All TB) 308 66 (61-71) 308 66 (61-71)

Conclusions
•All existing LTBI tests (TST and IGRAs) appear to have only modest predictive value and may not help identify those who are at highest risk of progression to disease.
•Based on the evidence thus far, IGRAs appear to have similar predictive value as the TST.
•In some settings, the % IGRA+ will be less than % TST+, reducing the number needed for IPT
•Incidence rates of TB, even in IGRA positive individuals, are low, suggesting that a vast majority (>95%) of IGRA+ individuals do not progress to TB disease during follow-up. This is similar to the TST.
•IFN-g alone is not sufficient as a biomarker for disease progression
•The search for predictive biomarkers must continue
29

Updated NDWG pipeline for diagnostics
2015: new target for predictive LTBI test

IGRAs: resources and operational issues in low and middle income countries
Benefits and desired effects
Risks or undesired effects
Resource implications (cost, lab capacity, power outages, temperature monitoring, portable incubators, etc)
Values and preferences
All of these, plus evidence from systematic reviews and expert opinion was used to formulate recommendations which were endorsed by STAG in September 2010WHO policy is forthcoming
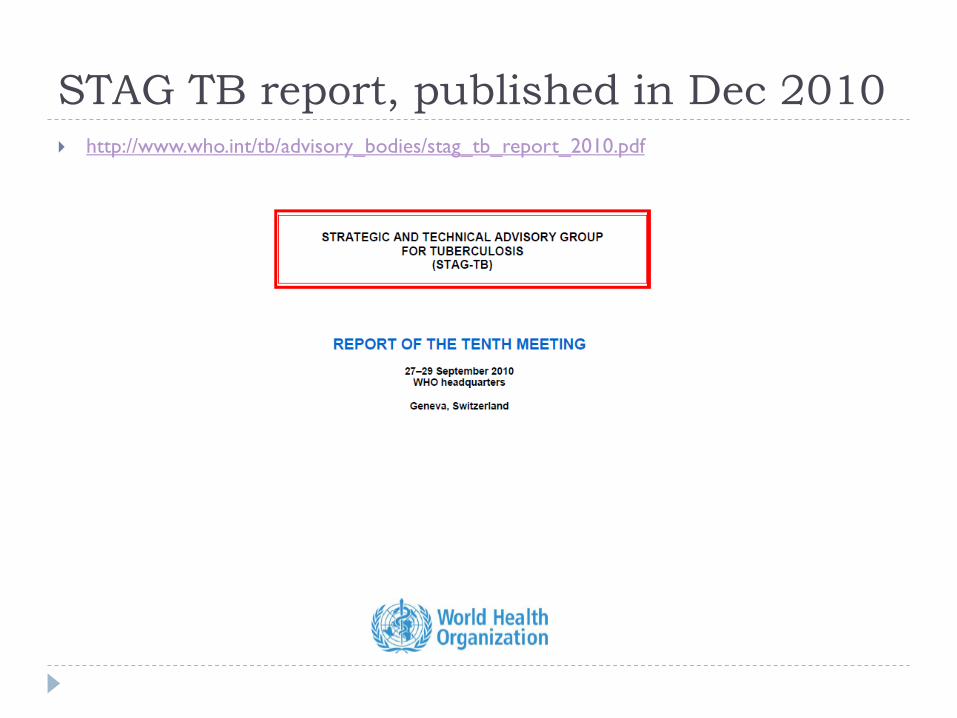
STAG TB report, published in Dec 2010 http://www.who.int/tb/advisory_bodies/stag_tb_report_2010.pdf
Thank you
Karin Weyer, Stop TB Department of WHO Andy Ramsay, TDR Rick O’Brien, FIND WHO Expert Group on IGRAs All the systematic reviewers, in particular, Karen Steingart,
Adithya Cattamanchi, John Metcalfe, Lele Rangaka, Alice Zwerling, Anna Mandalakas, Anne Detjen & Dick Menzies