evo an 031 modem web based built in test...
TRANSCRIPT
PARADISE DATACOM APPLICATION NOTE
Modem Web based Built In Test Equipment
EVO_AN_031 Issue 2
TELEDYNE PARADISE DATACOM Ltd, 1, WHEATON ROAD,
WITHAM, ESSEX, CM8 3UJ,
ENGLAND. Tel: +44 (0) 1376 533791 Fax: +44 (0) 1376 533764

AN-031 Modem Web based Built In Test Equipment 16th June 2011
2 of 20
INTRODUCTION All Teledyne Paradise Datacom modems are equipped with an inbuilt webserver, which allows monitor and control of the modem, plus it also provides access to a range of Built In Test Equipment. The BITE comprises; Spectrum Analyser, Constellation Monitor, Bit Error Rate Tester and graph based data-logging facilities. The BITE will be shown to be suitable for the initial alignment of the terminal, link performance testing, fault finding and also for longer term data-logging and monitoring of the link quality for use with Service Line Agreement data collection. CONNECTION TO THE MODEM WEBSERVER Access to the modem web server is simple and can be made either by direct connection to a Laptop / PC or by connecting the modem into an existing Ethernet IP network. The modem has two Ethernet connectors on the rear of the chassis. Using a straight Ethernet cable connect the cable to the lower Ethernet port labelled Remote M&C and the other end into the PC or into the network, typically via an Ethernet hub or switch. The Modem Ethernet IP address then needs to be configured. This is set via the Modem front panel keyboard. From the Modem main menu select the following commands;
• 2: Edit. • 4: Unit. • 3: M&C. • 1: Control: In this menu select Takeaway by using the up/down arrow keys and
then press the enter key. Note: Takewaway mode allows any user in the network access to the modem.
• 8: IP Address. At this point the Modem will require an M&C address, netmask and gateway addresses. If the Modem is being connected into a network, which has the ability to automatically provide the address via a DHCP server, then this is greatly simplified. The user needs to enter; M&C IP address 000.000.000.000 netmask 255.255.000.000 (or to suit users network) gateway 000.000.000.000 (or to suit users network) The Modem IP address will be automatically provided by the network and will be displayed on the modem unit configuration menu. To get to this information from the modem the user needs to enter;
• 3: View. • 6: Config. • 3: Unit; In this menu press the down arrow key twice to get to the IP address.
If the modem is being connected to a laptop or PC then the IP address of both the modem and PC needs to be configured. The exact address information needs to be determined by the user, an example of a typical address is shown below; Laptop/PC IP address 192.168.000.010 Modem IP address 192.168.000.011 Modem & PC netmask 255.255.000.000 Modem & PC gateway 000.000.000.000
AN-031 Modem Web based Built In Test Equipment 16th June 2011
3 of 20
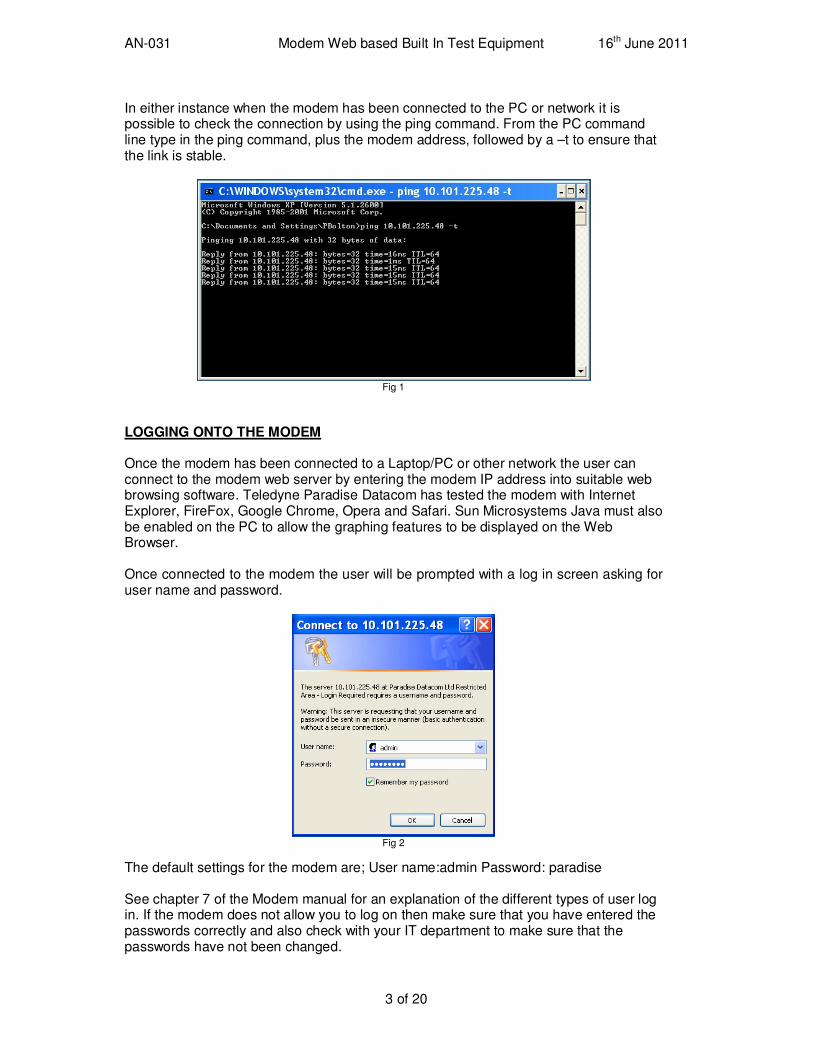
In either instance when the modem has been connected to the PC or network it is possible to check the connection by using the ping command. From the PC command line type in the ping command, plus the modem address, followed by a –t to ensure that the link is stable.
Fig 1
LOGGING ONTO THE MODEM Once the modem has been connected to a Laptop/PC or other network the user can connect to the modem web server by entering the modem IP address into suitable web browsing software. Teledyne Paradise Datacom has tested the modem with Internet Explorer, FireFox, Google Chrome, Opera and Safari. Sun Microsystems Java must also be enabled on the PC to allow the graphing features to be displayed on the Web Browser. Once connected to the modem the user will be prompted with a log in screen asking for user name and password.
Fig 2
The default settings for the modem are; User name: admin Password: paradise See chapter 7 of the Modem manual for an explanation of the different types of user log in. If the modem does not allow you to log on then make sure that you have entered the passwords correctly and also check with your IT department to make sure that the passwords have not been changed.
AN-031 Modem Web based Built In Test Equipment 16th June 2011
4 of 20
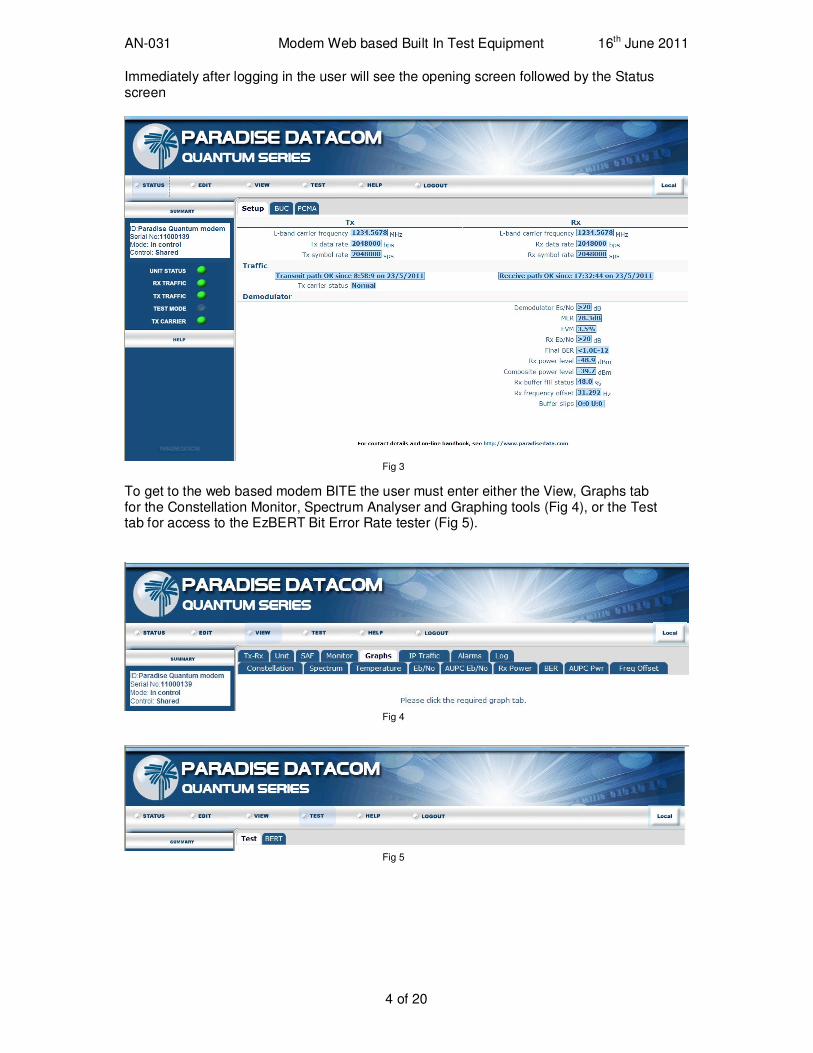
Immediately after logging in the user will see the opening screen followed by the Status screen
Fig 3
To get to the web based modem BITE the user must enter either the View, Graphs tab for the Constellation Monitor, Spectrum Analyser and Graphing tools (Fig 4), or the Test tab for access to the EzBERT Bit Error Rate tester (Fig 5).
Fig 4
Fig 5
AN-031 Modem Web based Built In Test Equipment 16th June 2011
5 of 20
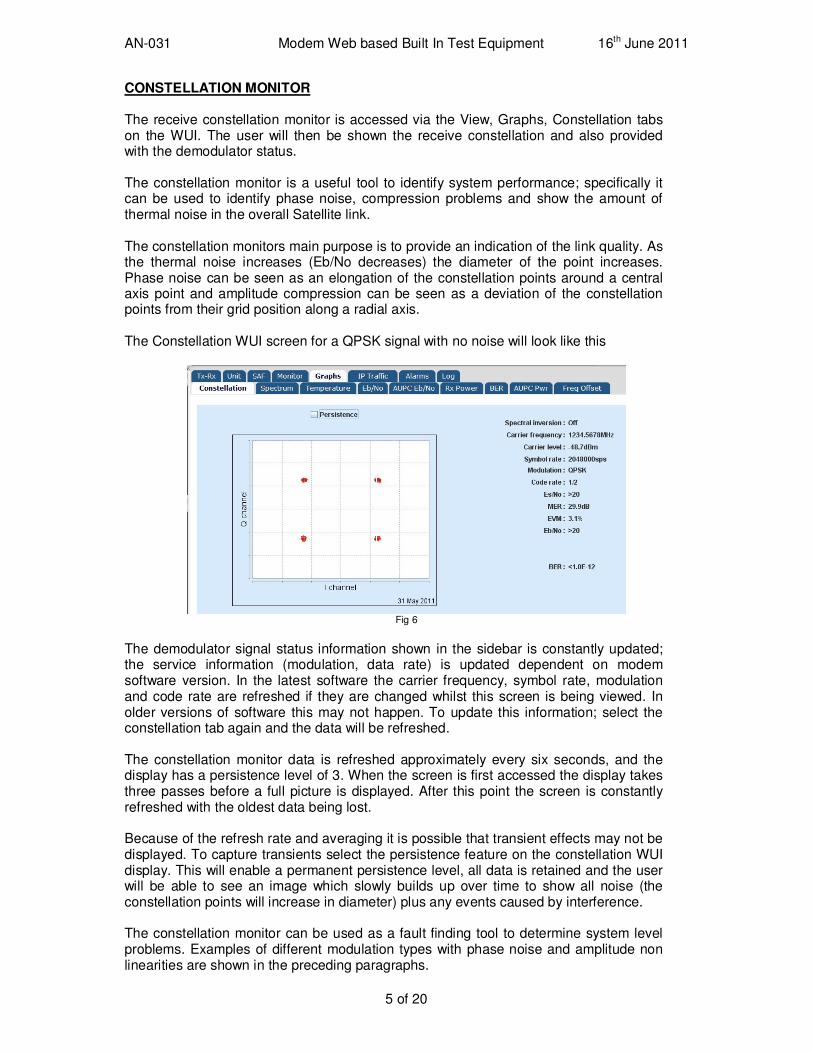
CONSTELLATION MONITOR The receive constellation monitor is accessed via the View, Graphs, Constellation tabs on the WUI. The user will then be shown the receive constellation and also provided with the demodulator status. The constellation monitor is a useful tool to identify system performance; specifically it can be used to identify phase noise, compression problems and show the amount of thermal noise in the overall Satellite link. The constellation monitors main purpose is to provide an indication of the link quality. As the thermal noise increases (Eb/No decreases) the diameter of the point increases. Phase noise can be seen as an elongation of the constellation points around a central axis point and amplitude compression can be seen as a deviation of the constellation points from their grid position along a radial axis. The Constellation WUI screen for a QPSK signal with no noise will look like this
Fig 6
The demodulator signal status information shown in the sidebar is constantly updated; the service information (modulation, data rate) is updated dependent on modem software version. In the latest software the carrier frequency, symbol rate, modulation and code rate are refreshed if they are changed whilst this screen is being viewed. In older versions of software this may not happen. To update this information; select the constellation tab again and the data will be refreshed. The constellation monitor data is refreshed approximately every six seconds, and the display has a persistence level of 3. When the screen is first accessed the display takes three passes before a full picture is displayed. After this point the screen is constantly refreshed with the oldest data being lost. Because of the refresh rate and averaging it is possible that transient effects may not be displayed. To capture transients select the persistence feature on the constellation WUI display. This will enable a permanent persistence level, all data is retained and the user will be able to see an image which slowly builds up over time to show all noise (the constellation points will increase in diameter) plus any events caused by interference. The constellation monitor can be used as a fault finding tool to determine system level problems. Examples of different modulation types with phase noise and amplitude non linearities are shown in the preceding paragraphs.
AN-031 Modem Web based Built In Test Equipment 16th June 2011
6 of 20
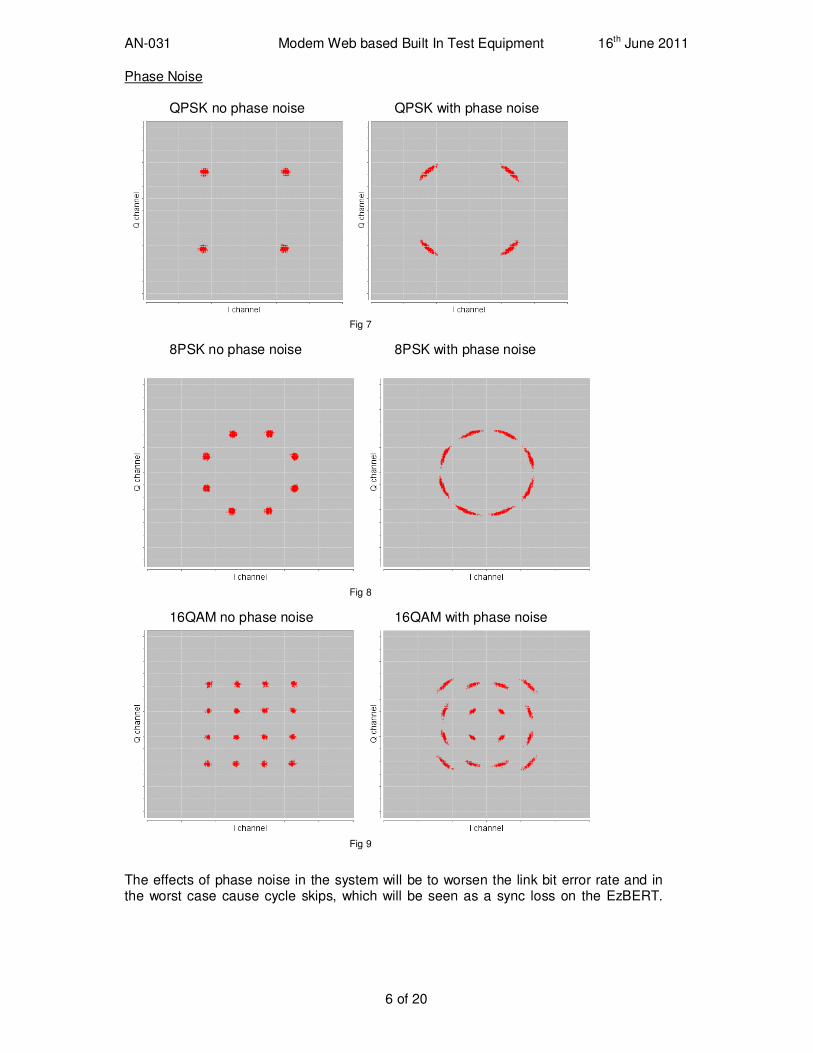
Phase Noise
QPSK no phase noise QPSK with phase noise
Fig 7
8PSK no phase noise 8PSK with phase noise
Fig 8 16QAM no phase noise 16QAM with phase noise
Fig 9
The effects of phase noise in the system will be to worsen the link bit error rate and in the worst case cause cycle skips, which will be seen as a sync loss on the EzBERT.
AN-031 Modem Web based Built In Test Equipment 16th June 2011
7 of 20
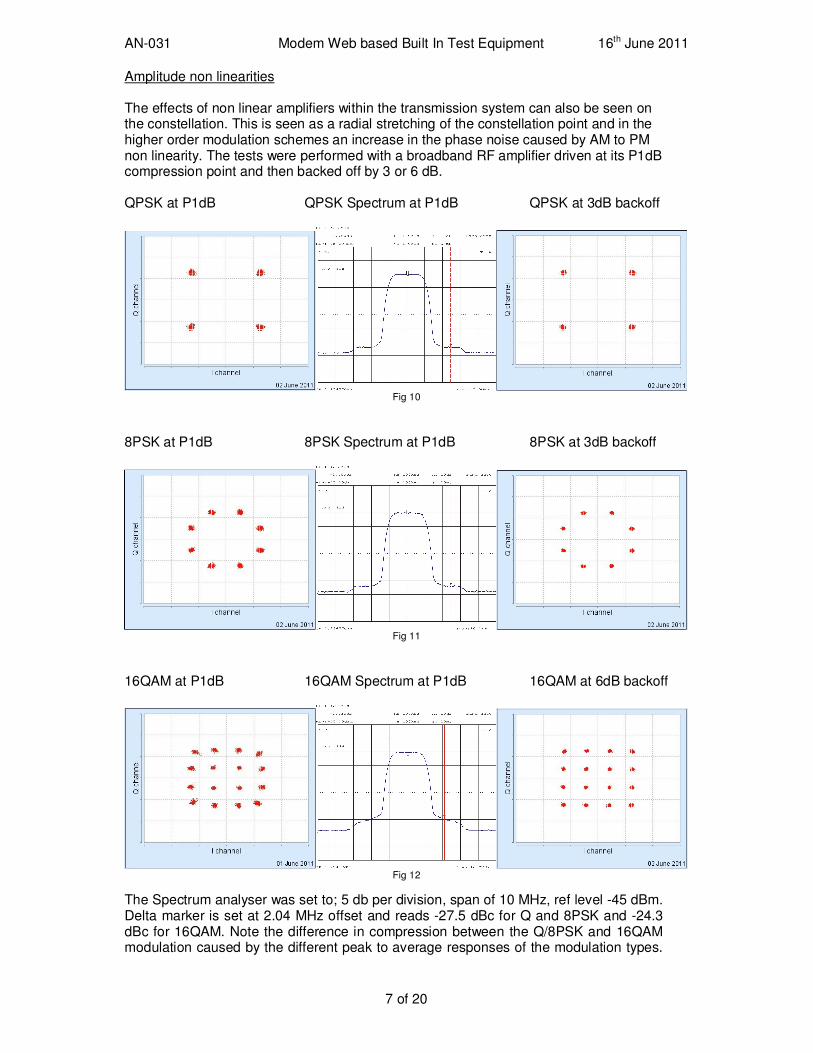
Amplitude non linearities The effects of non linear amplifiers within the transmission system can also be seen on the constellation. This is seen as a radial stretching of the constellation point and in the higher order modulation schemes an increase in the phase noise caused by AM to PM non linearity. The tests were performed with a broadband RF amplifier driven at its P1dB compression point and then backed off by 3 or 6 dB. QPSK at P1dB QPSK Spectrum at P1dB QPSK at 3dB backoff
Fig 10
8PSK at P1dB 8PSK Spectrum at P1dB 8PSK at 3dB backoff
Fig 11
16QAM at P1dB 16QAM Spectrum at P1dB 16QAM at 6dB backoff
Fig 12
The Spectrum analyser was set to; 5 db per division, span of 10 MHz, ref level -45 dBm. Delta marker is set at 2.04 MHz offset and reads -27.5 dBc for Q and 8PSK and -24.3 dBc for 16QAM. Note the difference in compression between the Q/8PSK and 16QAM modulation caused by the different peak to average responses of the modulation types.
AN-031 Modem Web based Built In Test Equipment 16th June 2011
8 of 20
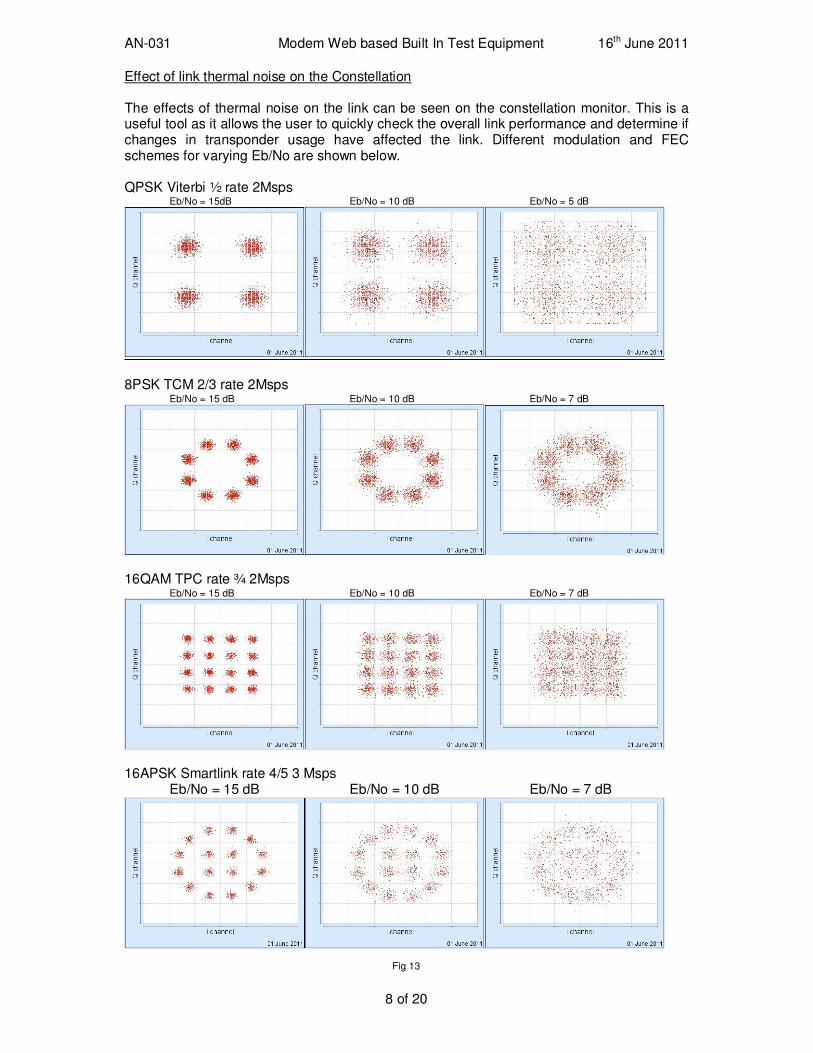
Effect of link thermal noise on the Constellation The effects of thermal noise on the link can be seen on the constellation monitor. This is a useful tool as it allows the user to quickly check the overall link performance and determine if changes in transponder usage have affected the link. Different modulation and FEC schemes for varying Eb/No are shown below. QPSK Viterbi ½ rate 2Msps Eb/No = 15dB Eb/No = 10 dB Eb/No = 5 dB
8PSK TCM 2/3 rate 2Msps Eb/No = 15 dB Eb/No = 10 dB Eb/No = 7 dB
16QAM TPC rate ¾ 2Msps Eb/No = 15 dB Eb/No = 10 dB Eb/No = 7 dB
16APSK Smartlink rate 4/5 3 Msps Eb/No = 15 dB Eb/No = 10 dB Eb/No = 7 dB
Fig 13
AN-031 Modem Web based Built In Test Equipment 16th June 2011
9 of 20
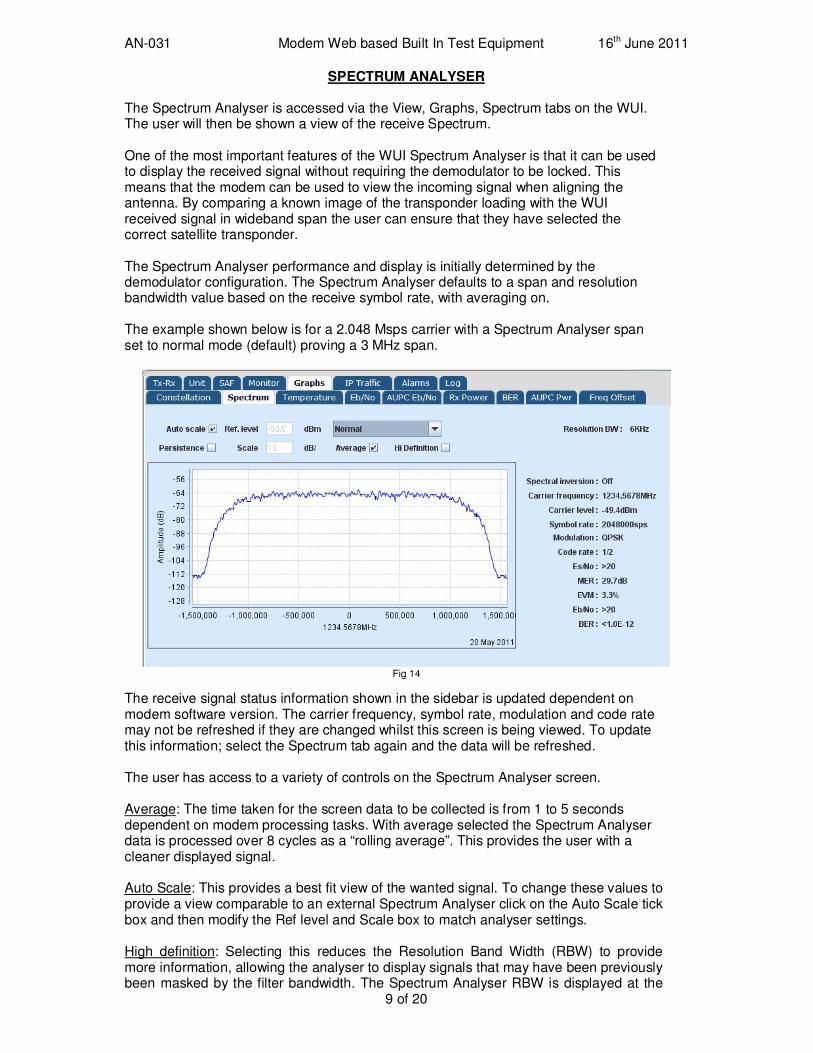
SPECTRUM ANALYSER The Spectrum Analyser is accessed via the View, Graphs, Spectrum tabs on the WUI. The user will then be shown a view of the receive Spectrum. One of the most important features of the WUI Spectrum Analyser is that it can be used to display the received signal without requiring the demodulator to be locked. This means that the modem can be used to view the incoming signal when aligning the antenna. By comparing a known image of the transponder loading with the WUI received signal in wideband span the user can ensure that they have selected the correct satellite transponder. The Spectrum Analyser performance and display is initially determined by the demodulator configuration. The Spectrum Analyser defaults to a span and resolution bandwidth value based on the receive symbol rate, with averaging on. The example shown below is for a 2.048 Msps carrier with a Spectrum Analyser span set to normal mode (default) proving a 3 MHz span.
Fig 14
The receive signal status information shown in the sidebar is updated dependent on modem software version. The carrier frequency, symbol rate, modulation and code rate may not be refreshed if they are changed whilst this screen is being viewed. To update this information; select the Spectrum tab again and the data will be refreshed. The user has access to a variety of controls on the Spectrum Analyser screen. Average: The time taken for the screen data to be collected is from 1 to 5 seconds dependent on modem processing tasks. With average selected the Spectrum Analyser data is processed over 8 cycles as a “rolling average”. This provides the user with a cleaner displayed signal. Auto Scale: This provides a best fit view of the wanted signal. To change these values to provide a view comparable to an external Spectrum Analyser click on the Auto Scale tick box and then modify the Ref level and Scale box to match analyser settings. High definition: Selecting this reduces the Resolution Band Width (RBW) to provide more information, allowing the analyser to display signals that may have been previously been masked by the filter bandwidth. The Spectrum Analyser RBW is displayed at the
AN-031 Modem Web based Built In Test Equipment 16th June 2011
10 of 20
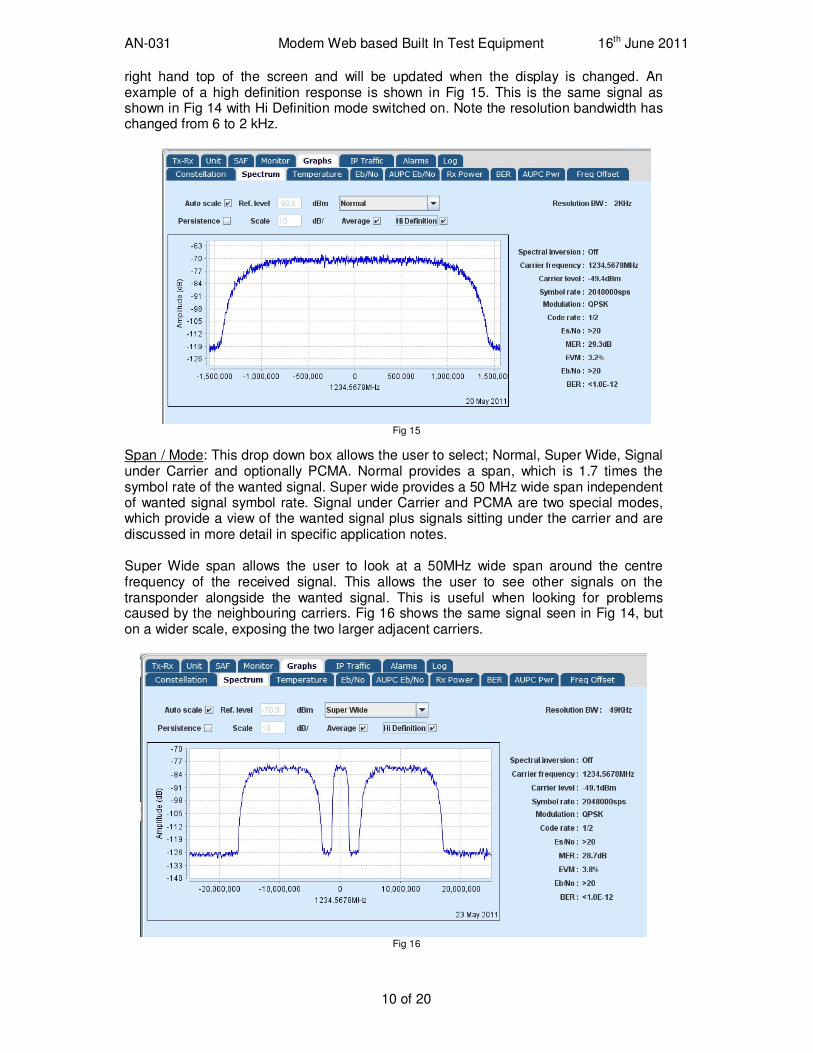
right hand top of the screen and will be updated when the display is changed. An example of a high definition response is shown in Fig 15. This is the same signal as shown in Fig 14 with Hi Definition mode switched on. Note the resolution bandwidth has changed from 6 to 2 kHz.
Fig 15
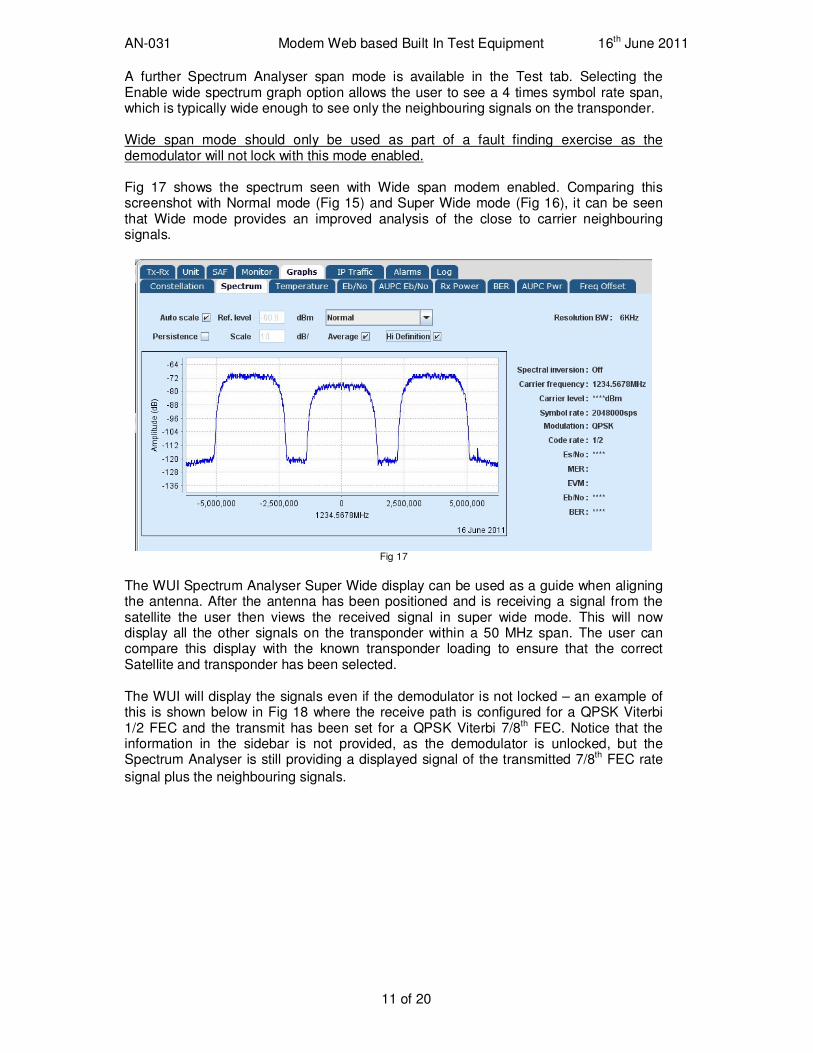
Span / Mode: This drop down box allows the user to select; Normal, Super Wide, Signal under Carrier and optionally PCMA. Normal provides a span, which is 1.7 times the symbol rate of the wanted signal. Super wide provides a 50 MHz wide span independent of wanted signal symbol rate. Signal under Carrier and PCMA are two special modes, which provide a view of the wanted signal plus signals sitting under the carrier and are discussed in more detail in specific application notes. Super Wide span allows the user to look at a 50MHz wide span around the centre frequency of the received signal. This allows the user to see other signals on the transponder alongside the wanted signal. This is useful when looking for problems caused by the neighbouring carriers. Fig 16 shows the same signal seen in Fig 14, but on a wider scale, exposing the two larger adjacent carriers.
Fig 16
AN-031 Modem Web based Built In Test Equipment 16th June 2011
11 of 20
A further Spectrum Analyser span mode is available in the Test tab. Selecting the Enable wide spectrum graph option allows the user to see a 4 times symbol rate span, which is typically wide enough to see only the neighbouring signals on the transponder. Wide span mode should only be used as part of a fault finding exercise as the demodulator will not lock with this mode enabled. Fig 17 shows the spectrum seen with Wide span modem enabled. Comparing this screenshot with Normal mode (Fig 15) and Super Wide mode (Fig 16), it can be seen that Wide mode provides an improved analysis of the close to carrier neighbouring signals.
Fig 17
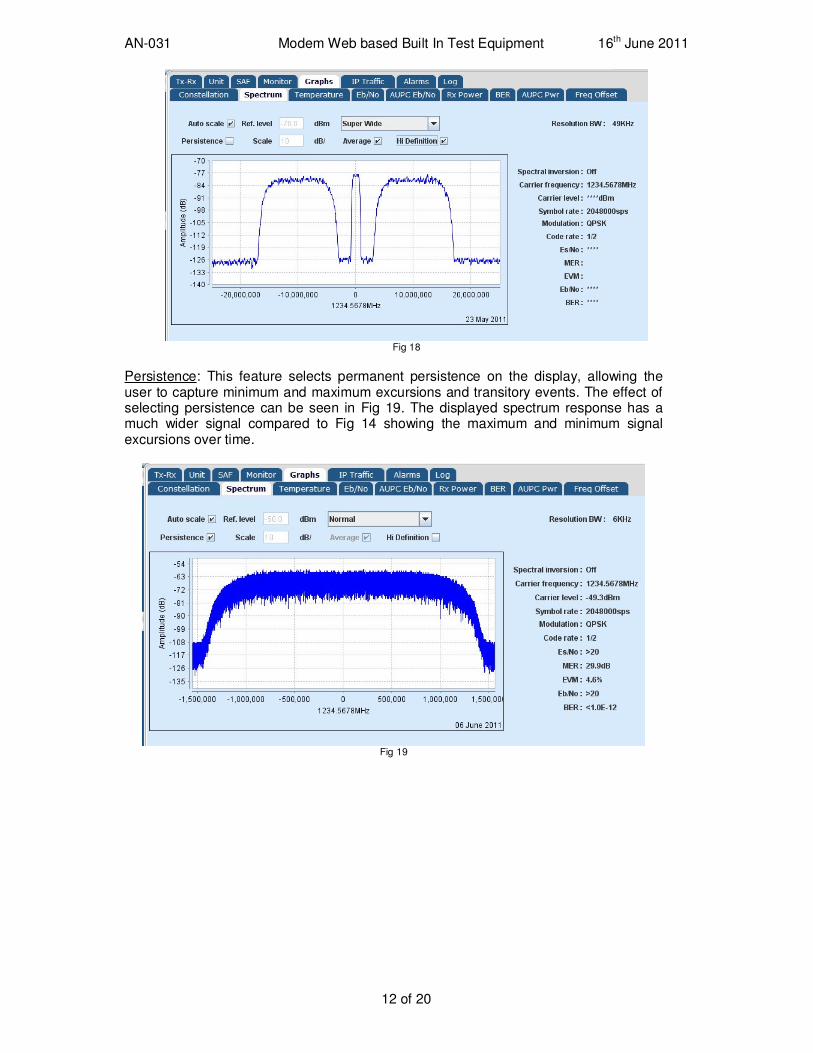
The WUI Spectrum Analyser Super Wide display can be used as a guide when aligning the antenna. After the antenna has been positioned and is receiving a signal from the satellite the user then views the received signal in super wide mode. This will now display all the other signals on the transponder within a 50 MHz span. The user can compare this display with the known transponder loading to ensure that the correct Satellite and transponder has been selected. The WUI will display the signals even if the demodulator is not locked – an example of this is shown below in Fig 18 where the receive path is configured for a QPSK Viterbi 1/2 FEC and the transmit has been set for a QPSK Viterbi 7/8th FEC. Notice that the information in the sidebar is not provided, as the demodulator is unlocked, but the Spectrum Analyser is still providing a displayed signal of the transmitted 7/8th FEC rate signal plus the neighbouring signals.
AN-031 Modem Web based Built In Test Equipment 16th June 2011
12 of 20
Fig 18
Persistence: This feature selects permanent persistence on the display, allowing the user to capture minimum and maximum excursions and transitory events. The effect of selecting persistence can be seen in Fig 19. The displayed spectrum response has a much wider signal compared to Fig 14 showing the maximum and minimum signal excursions over time.
Fig 19
AN-031 Modem Web based Built In Test Equipment 16th June 2011
13 of 20
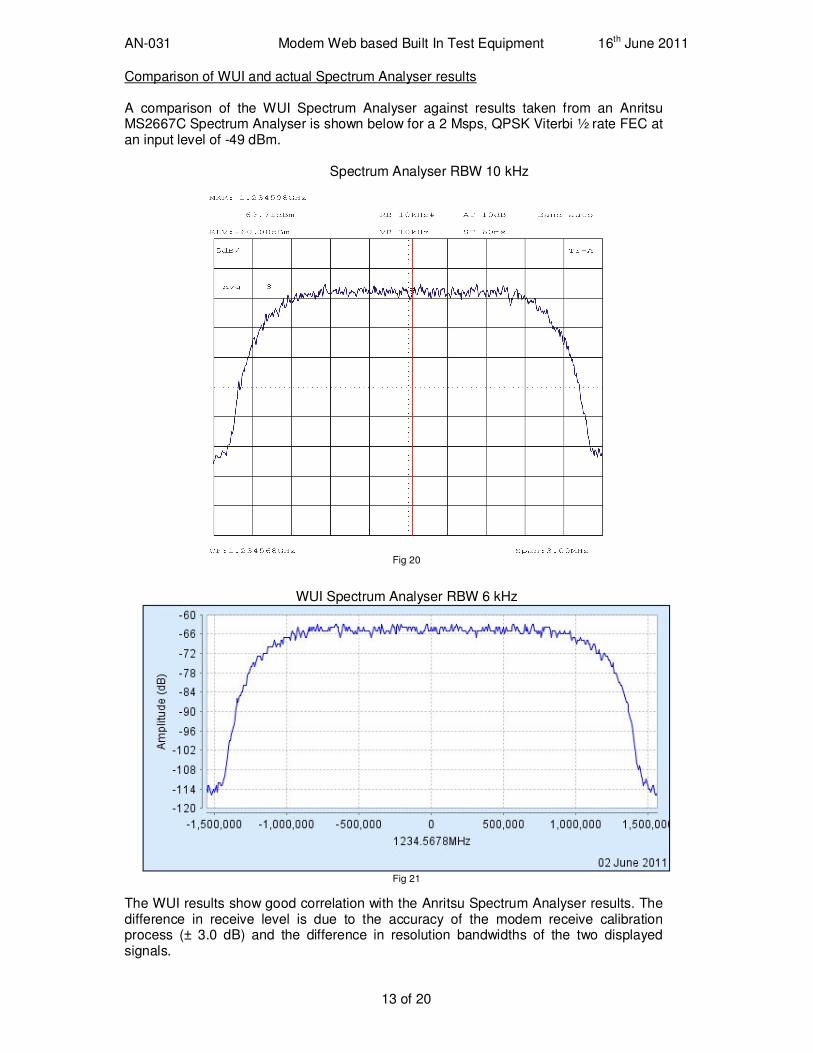
Comparison of WUI and actual Spectrum Analyser results A comparison of the WUI Spectrum Analyser against results taken from an Anritsu MS2667C Spectrum Analyser is shown below for a 2 Msps, QPSK Viterbi ½ rate FEC at an input level of -49 dBm.
Spectrum Analyser RBW 10 kHz
Fig 20
WUI Spectrum Analyser RBW 6 kHz
Fig 21
The WUI results show good correlation with the Anritsu Spectrum Analyser results. The difference in receive level is due to the accuracy of the modem receive calibration process (± 3.0 dB) and the difference in resolution bandwidths of the two displayed signals.
AN-031 Modem Web based Built In Test Equipment 16th June 2011
14 of 20
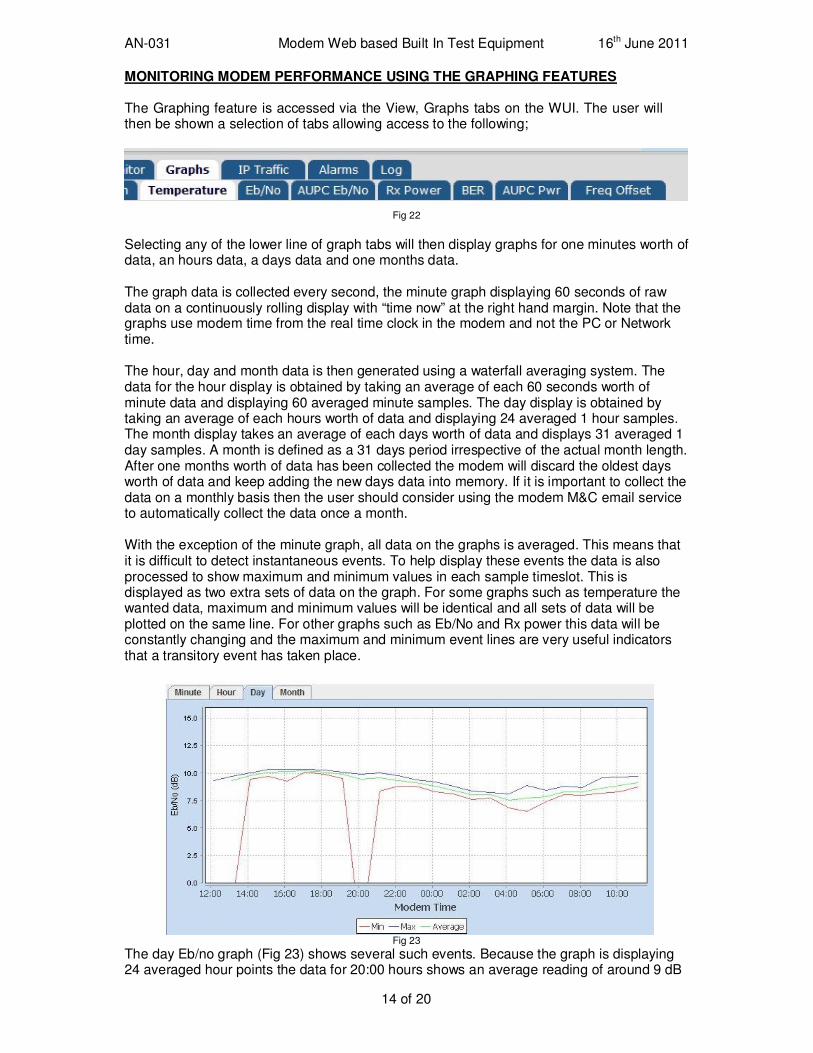
MONITORING MODEM PERFORMANCE USING THE GRAPHING FEATURES The Graphing feature is accessed via the View, Graphs tabs on the WUI. The user will then be shown a selection of tabs allowing access to the following;
Fig 22
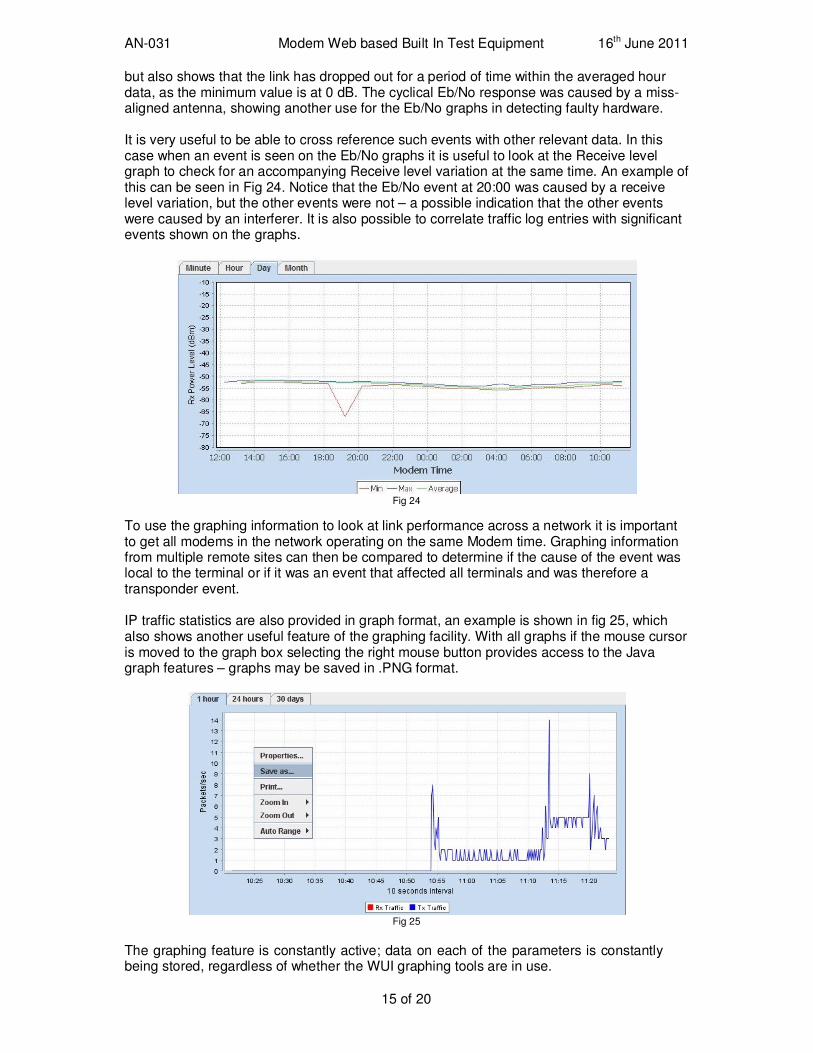
Selecting any of the lower line of graph tabs will then display graphs for one minutes worth of data, an hours data, a days data and one months data. The graph data is collected every second, the minute graph displaying 60 seconds of raw data on a continuously rolling display with “time now” at the right hand margin. Note that the graphs use modem time from the real time clock in the modem and not the PC or Network time. The hour, day and month data is then generated using a waterfall averaging system. The data for the hour display is obtained by taking an average of each 60 seconds worth of minute data and displaying 60 averaged minute samples. The day display is obtained by taking an average of each hours worth of data and displaying 24 averaged 1 hour samples. The month display takes an average of each days worth of data and displays 31 averaged 1 day samples. A month is defined as a 31 days period irrespective of the actual month length. After one months worth of data has been collected the modem will discard the oldest days worth of data and keep adding the new days data into memory. If it is important to collect the data on a monthly basis then the user should consider using the modem M&C email service to automatically collect the data once a month. With the exception of the minute graph, all data on the graphs is averaged. This means that it is difficult to detect instantaneous events. To help display these events the data is also processed to show maximum and minimum values in each sample timeslot. This is displayed as two extra sets of data on the graph. For some graphs such as temperature the wanted data, maximum and minimum values will be identical and all sets of data will be plotted on the same line. For other graphs such as Eb/No and Rx power this data will be constantly changing and the maximum and minimum event lines are very useful indicators that a transitory event has taken place.
Fig 23
The day Eb/no graph (Fig 23) shows several such events. Because the graph is displaying 24 averaged hour points the data for 20:00 hours shows an average reading of around 9 dB
AN-031 Modem Web based Built In Test Equipment 16th June 2011
15 of 20
but also shows that the link has dropped out for a period of time within the averaged hour data, as the minimum value is at 0 dB. The cyclical Eb/No response was caused by a miss-aligned antenna, showing another use for the Eb/No graphs in detecting faulty hardware. It is very useful to be able to cross reference such events with other relevant data. In this case when an event is seen on the Eb/No graphs it is useful to look at the Receive level graph to check for an accompanying Receive level variation at the same time. An example of this can be seen in Fig 24. Notice that the Eb/No event at 20:00 was caused by a receive level variation, but the other events were not – a possible indication that the other events were caused by an interferer. It is also possible to correlate traffic log entries with significant events shown on the graphs.
Fig 24
To use the graphing information to look at link performance across a network it is important to get all modems in the network operating on the same Modem time. Graphing information from multiple remote sites can then be compared to determine if the cause of the event was local to the terminal or if it was an event that affected all terminals and was therefore a transponder event. IP traffic statistics are also provided in graph format, an example is shown in fig 25, which also shows another useful feature of the graphing facility. With all graphs if the mouse cursor is moved to the graph box selecting the right mouse button provides access to the Java graph features – graphs may be saved in .PNG format.
Fig 25
The graphing feature is constantly active; data on each of the parameters is constantly being stored, regardless of whether the WUI graphing tools are in use.
AN-031 Modem Web based Built In Test Equipment 16th June 2011
16 of 20
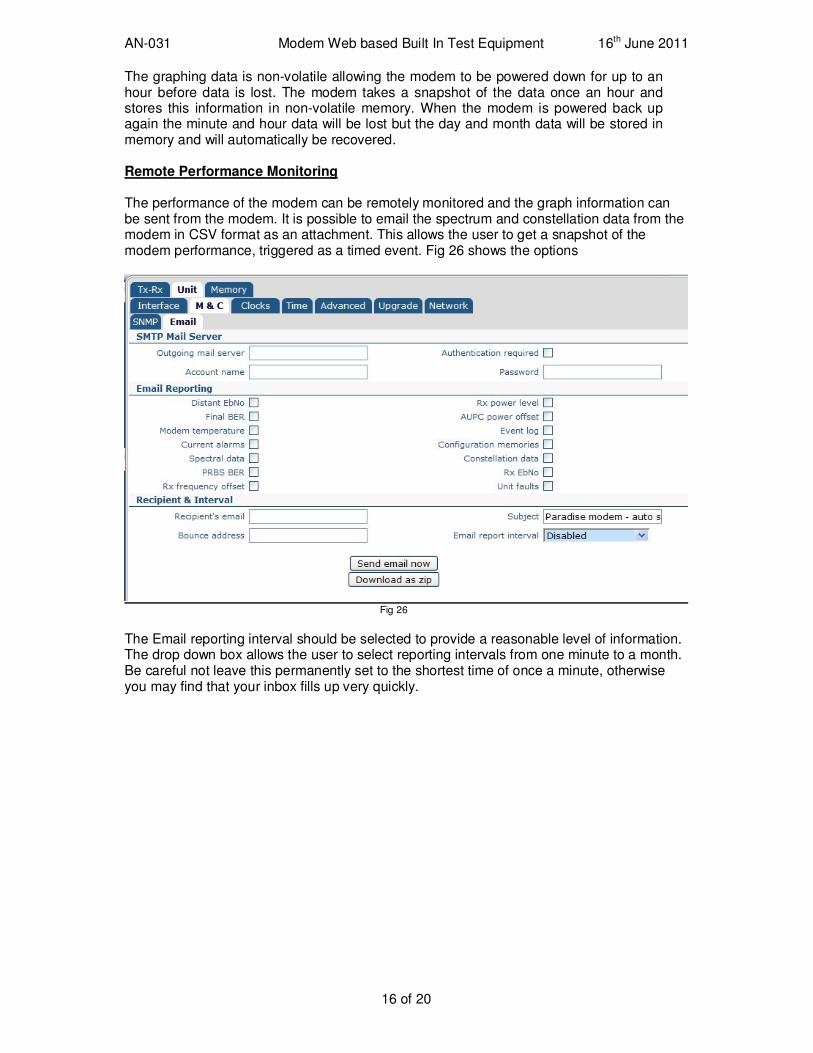
The graphing data is non-volatile allowing the modem to be powered down for up to an hour before data is lost. The modem takes a snapshot of the data once an hour and stores this information in non-volatile memory. When the modem is powered back up again the minute and hour data will be lost but the day and month data will be stored in memory and will automatically be recovered. Remote Performance Monitoring The performance of the modem can be remotely monitored and the graph information can be sent from the modem. It is possible to email the spectrum and constellation data from the modem in CSV format as an attachment. This allows the user to get a snapshot of the modem performance, triggered as a timed event. Fig 26 shows the options
Fig 26
The Email reporting interval should be selected to provide a reasonable level of information. The drop down box allows the user to select reporting intervals from one minute to a month. Be careful not leave this permanently set to the shortest time of once a minute, otherwise you may find that your inbox fills up very quickly.
AN-031 Modem Web based Built In Test Equipment 16th June 2011
17 of 20
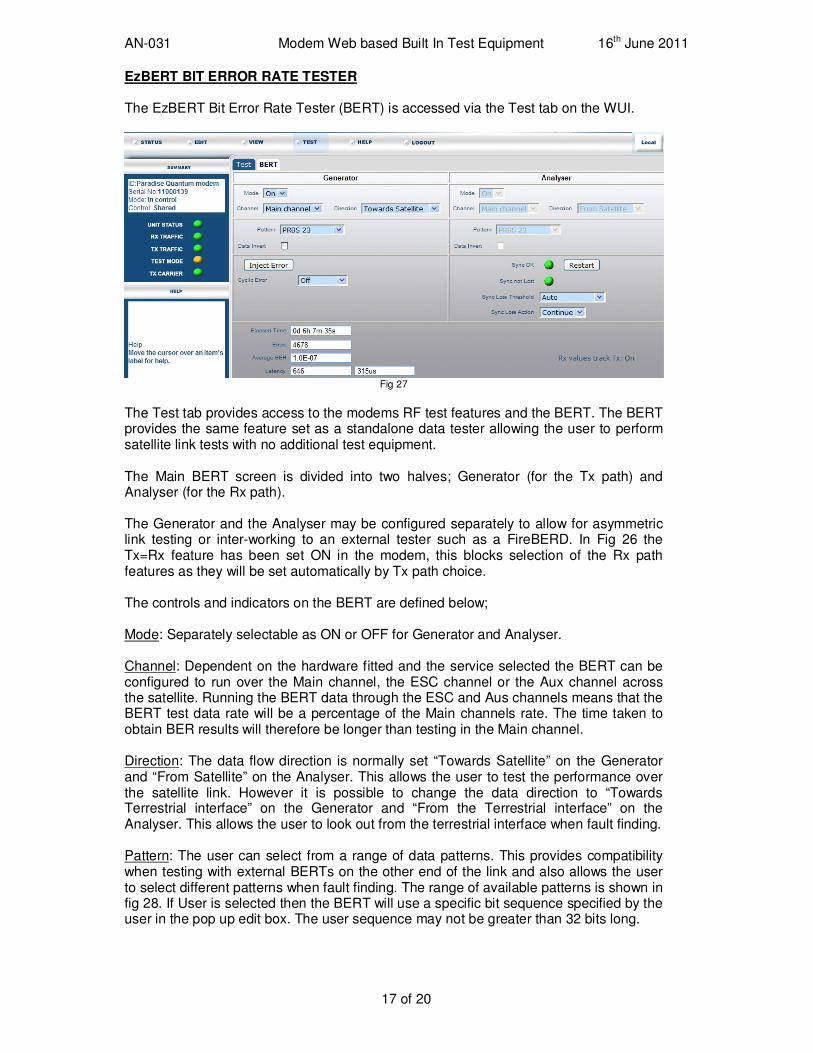
EzBERT BIT ERROR RATE TESTER The EzBERT Bit Error Rate Tester (BERT) is accessed via the Test tab on the WUI.
Fig 27
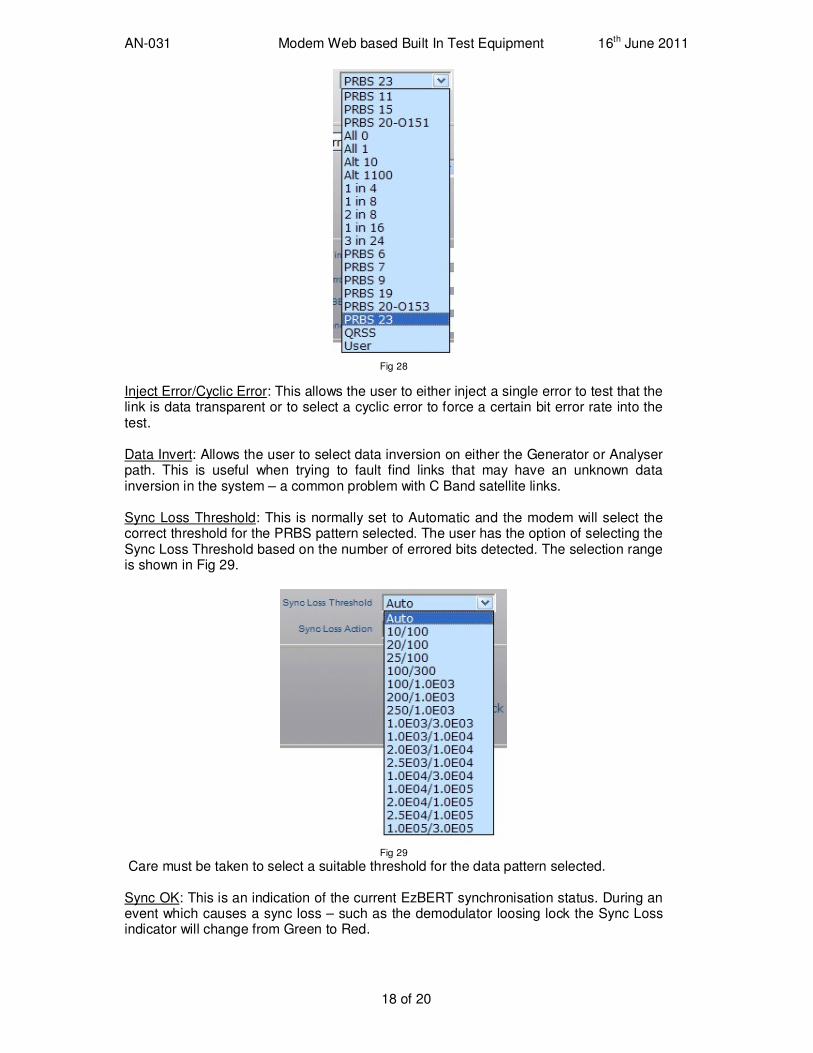
The Test tab provides access to the modems RF test features and the BERT. The BERT provides the same feature set as a standalone data tester allowing the user to perform satellite link tests with no additional test equipment. The Main BERT screen is divided into two halves; Generator (for the Tx path) and Analyser (for the Rx path). The Generator and the Analyser may be configured separately to allow for asymmetric link testing or inter-working to an external tester such as a FireBERD. In Fig 26 the Tx=Rx feature has been set ON in the modem, this blocks selection of the Rx path features as they will be set automatically by Tx path choice. The controls and indicators on the BERT are defined below; Mode: Separately selectable as ON or OFF for Generator and Analyser. Channel: Dependent on the hardware fitted and the service selected the BERT can be configured to run over the Main channel, the ESC channel or the Aux channel across the satellite. Running the BERT data through the ESC and Aus channels means that the BERT test data rate will be a percentage of the Main channels rate. The time taken to obtain BER results will therefore be longer than testing in the Main channel. Direction: The data flow direction is normally set “Towards Satellite” on the Generator and “From Satellite” on the Analyser. This allows the user to test the performance over the satellite link. However it is possible to change the data direction to “Towards Terrestrial interface” on the Generator and “From the Terrestrial interface” on the Analyser. This allows the user to look out from the terrestrial interface when fault finding. Pattern: The user can select from a range of data patterns. This provides compatibility when testing with external BERTs on the other end of the link and also allows the user to select different patterns when fault finding. The range of available patterns is shown in fig 28. If User is selected then the BERT will use a specific bit sequence specified by the user in the pop up edit box. The user sequence may not be greater than 32 bits long.
AN-031 Modem Web based Built In Test Equipment 16th June 2011
18 of 20
Fig 28
Inject Error/Cyclic Error: This allows the user to either inject a single error to test that the link is data transparent or to select a cyclic error to force a certain bit error rate into the test. Data Invert: Allows the user to select data inversion on either the Generator or Analyser path. This is useful when trying to fault find links that may have an unknown data inversion in the system – a common problem with C Band satellite links. Sync Loss Threshold: This is normally set to Automatic and the modem will select the correct threshold for the PRBS pattern selected. The user has the option of selecting the Sync Loss Threshold based on the number of errored bits detected. The selection range is shown in Fig 29.
Fig 29
Care must be taken to select a suitable threshold for the data pattern selected. Sync OK: This is an indication of the current EzBERT synchronisation status. During an event which causes a sync loss – such as the demodulator loosing lock the Sync Loss indicator will change from Green to Red.
AN-031 Modem Web based Built In Test Equipment 16th June 2011
19 of 20
Sync not lost: This is an indication that a sync loss has occurred. When the sync loss takes place the indicator changes from green to red and remains red until the Restart button is selected. Restart: This resets the BER counters to zero and starts the BER test. A restart is required at the beginning of each test to ensure that the test is performed with valid data. Sync Loss Action: On detecting a synchronisation loss the modem can take one of three actions regarding the BERT counter status; Continue, Freeze or Reset. If the user selects Continue (default configuration) the BERT will report a sync loss but continue with the bit error rate test count. Selecting Freeze halts the BER counter at the point the failure occurred. Selecting Reset re-sets the counter when a sync loss failure occurs and allows a true BER value to continue to be obtained. Elapsed time: This shows the time that the test has been running – this is dependent on the Sync loss action selected, the user needs to take note of this selection when analysing the data. Errors: A count of the number of errors obtained during the test. Average BER: Based on the elapsed time and errors counted an average BER figure is presented. Note the previous comments regarding Sync loss Action mode selected on the accuracy of the displayed figure. Latency: There are two values displayed. The first is the raw number of bits involved in the measurement and the second value is the latency in microseconds.
AN-031 Modem Web based Built In Test Equipment 16th June 2011
20 of 20
CONCLUSION The Web User Interface Built In Test Equipment, available as standard on the Teledyne Paradise Datacom modems have been shown to provide the user with a fully featured set of tools for installation, link performance measurement and fault finding. These measurements can be made remotely, logging into the modem from another location, removing the need to send a Field Service Engineer to site and with no additional test equipment.
Paradise Datacom Limited 1 Wheaton Road, Witham, Essex, CM8 3UJ, England Telephone +44 (0)1376 515 636 Facsimile +44 (0)1376 533 764 E-mail [email protected] www.paradisedata.com
Paradise Datacom LLC 328 Innovation Blvd., State College, PA 16803, U.S.A. Telephone +1 814 238 3450 Facsimile +1 814 238 3829 E-mail [email protected] www.paradisedata.com