evolution of crystal sizes in the series of dissolution
TRANSCRIPT

Journal of Volcanology and Geothermal Research 177 (2008) 997–1010
Contents lists available at ScienceDirect
Journal of Volcanology and Geothermal Research
j ourna l homepage: www.e lsev ie r.com/ locate / jvo lgeores
Evolution of crystal sizes in the series of dissolution and precipitation events in openmagma systems
A.G. Simakin a,⁎, I.N. Bindeman b
a Institute of Experimental Mineralogy RAS, Chernogolovka, Moscow Oblast, 142432, Russiab Geological Sciences, 1272 University of Oregon, OR 97403-1272, USA
⁎ Corresponding author. Tel.: +7 496 52 49687; fax: +E-mail addresses: [email protected] (A.G. Simakin),
(I.N. Bindeman).
0377-0273/$ – see front matter © 2008 Elsevier B.V. Aldoi:10.1016/j.jvolgeores.2008.07.012
a b s t r a c t
a r t i c l e i n f oArticle history:
We propose a model that Received 14 January 2008Accepted 21 July 2008Available online 30 July 2008Keywords:zirconquartzcrystallizationripeningBishop tuffYellowstonecaldera-forming eruption
describes the evolution of crystal sizes and crystal size distributions (CSD) ofigneous phenocrysts in a sequence of dissolution and crystallization events. This model is based onthe assumption that crystal dissolution is rate-limited by diffusion in melt while crystal growth is controlledby the slower kinetic of new nucleation and growth. As a result, the dissolution rate is inversely proportionalto crystal size coming into effect through the curvature of the crystal's surface, but the growth rate does notdepend on the crystal size. Closed-form analytical solution of equation for CSD is obtained. We apply resultsof modeling to quartz and zircon, two prime minerals in silicic igneous systems that are widely used ingeochemical and isotopic investigations. The time-series of multiple solution–reprecipitation episodesgenerate concave-downward CSDs and this result fits well with experimental and natural observations onthe abundant concave-down CSD in silicic igneous rocks. We suggest that maturation of crystal populationswith sizes above several micrometers can not be caused by a size effect on the solubility of the crystals(Ostwald ripening), but is rather driven by thermal oscillations in experiments and in nature. The modelpredicts that mean crystal size increases with time proportionally to ∼ t0.20, which is very close tothe published experimental results for quartz maturation with the exponent of 0.19–0.22. Our proposedmodel gives an opportunity to use natural CSDs for interpretation of pre-eruptive magma history, whensolubilities and diffusion data are available for constituent elements of the dissolving mineral. In particular,we present time estimates for maturing zircon populations in large volume ignimbrites and estimate that ittakes 100–1000 yrs to mature an initially exponential CSD to a lognormal CSD.
© 2008 Elsevier B.V. All rights reserved.
1. Introduction
Magmatic crystals are extensively used for trace elemental andisotopic studies in many applications of petrology and geochemistry.With the advance, and with easy accessibility of in situ microbeamtechniques such as electron- and ion microprobes, and laser ablationICP-MS, the picture of chemical and isotope zoning and disequilibriahas arisen (e.g., Davidson et al., 2007; Putirka and Tepley, in press).Cathodoluminescent imaging of quartz and zircon for example,records single or multiple solution–reprecipitation episodes thatrecord temperature fluctuations as demonstrated recently usingutilized Ti concentrations in these two minerals (e.g., Andersonet al., 2000; Hoskin and Schaltegger 2003;Watson and Harrison 2005;Wark and Watson, 2006).
Surprisingly, textural characterizations of igneous rocks have notkept pace with the geochemical advances (e.g. Jerram and Davidson,2007). It seems obvious that we can not successfully interpret the
7 496 52 [email protected]
l rights reserved.
wealth of isotopic and trace elemental information stored in crystals ifwe ignore crystallization and recrystallization dynamics.
Crystal sizes and size distributions of magmatic minerals canprovide important insights into the conditions in magma chambersduring crystal growth and dissolution. It has been long known thatCSDs of crystals appearing on the liquidus in basic to intermediatevolcanic rocks either as a result of cooling in lava lakes and flows, ordegassing in conduits, often have exponential shapes with increasingdensities at smaller sizes (Cashman and Marsh 1988; Mock et al.,2003) [ see Fig. 1a].
Contrary to the basic rocks, crystal size distributions in many silicicrocks, especially from large magma bodies exhibit concave-downdistributions with a deficiency or lack of smaller crystals (see Fig. 1a).Bindeman (2003) and Gualda et al. (2004), Gualda (2006) documen-ted this for zircon and quartz phenocrysts in pumice, extracted andimaged in three-dimensions by a variety of techniques. Zircon, animportant accessory mineral in the most silicic igneous rocks has longbeen known to possess concave-down CSD in volcanic and plutonicrocks (Poldervaart, 1956; Bindeman, 2003). If developed fromexponential CSD, these abundant concave-down CSD in silicic rocksmay point to the importance of dissolution–reprecipitation processes

Fig. 1. Examples of the crystal size distributions in nature and experiments. a) Measured crystal size distributions of quartz in individual pumice clasts in silicic igneous rocks.Products of major caldera-forming eruptions: BT — Bishop tuff, LBT — Lower Bandelier tuff, HRT — Huckleberry Ridge tuff, LCT — Lava Creek tuff, data are from Bindeman (2003).Plutonic example is for shallow rhyolitic laccolith data is fromMock et al. (2003); crystals smaller than 1 mm size were not measured due to technique used. Quartz crystals from thevolcanic rocks have smaller sizes and volume abundance and are characterized by lognormal CSDs b) Distributions normalized to themaximum crystal size andmaximum abundancecalculated in accordance with Slyozov–Lifshits–Wagner theory of Ostwald ripening (from Ayers et al., 2003). Three ripening mechanisms are portrayed: continuous line: controlledby interface kinetics, dotted line: by volume diffusion, dashed line: by grain boundary diffusion. Notice that Ostwald ripening processes are skewed to the right while natural CSD in(a) are skewed to the left.
998 A.G. Simakin, I.N. Bindeman / Journal of Volcanology and Geothermal Research 177 (2008) 997–1010
or annealing. However no simple theory has explained the originof the lognormal-like CSD (see Eberl et al., 2002 and Higgins, 2006for discussion).
Several processes are capable of producing concave-down (log-normal) CSDs in magmatic systems, most common of which isripening following growth (Cashman and Ferry, 1988; Higgins, 1998,2006). Size dependent growth with growth rate increasing withcrystal size has also been hypothesized to be applicable to magmaticsystems, and was demonstrated in experiments of calcite growthaccording to the “law of proportionate effects” (Kile and Eberl, 2003).Low-intensity crystal fragmentation and dissolution of smallerfragments may lead to lognormal CSD (e.g., Kolmogorov, 1941;Bindeman, 2005), and crystal fragmentation is an important compo-nent of particle dynamics of many magmatic systems.
This paper provides description and solution of possibly the mostgeneral and common of these processes — ripening of the crystalpopulation in the oscillating temperature regime that affects small and
large crystals differently, and, as we demonstrate below, is capable ofgenerating the concave-down CSDs. We concentrate below on quartzand zircon, common major and accessory minerals in silicic igneousrocks. We demonstrate that several cycles of solution–reprecipitationin oscillating temperature (solubility) regime, that recycles 10–40% ofcrystal mass is sufficient to explain natural data and processes inmagma bodies.
1.1. Theories of ripening processes
Ripening, or increase of the larger crystals at the expense of thesmallest ones, is based on the size effect on solubility as was firstdemonstrated by Ostwald in 1896. This ripening process makes CSDplot concave-downward with left side truncation (Fig. 1b), i.e. lack ofthe smallest crystals. However, it has been demonstrated in experi-ments with silicic melts that this effect is only applicable in thesmallest crystal size range of ripening of crystals ≤ 1–5μm in size

Fig. 2. Crystal size solubility effect in degree Celsius of a small crystal of spherical shapeas effective superheating relative to the equilibrium flat crystal face (see Eq. (2); energyof the crystal-melt interface γ is measured in J/m2). a) for quartz b) for zircon.
999A.G. Simakin, I.N. Bindeman / Journal of Volcanology and Geothermal Research 177 (2008) 997–1010
(Cabane et al., 2001, 2005). It would take 105–109 years (Nemchin etal., 2001) to affect larger crystal sizes because the Ostwald ripeningprocess mostly affects crystals comparable in size to the criticalnucleus of a crystal in the melt.
The general and quantitative theory of Ostwald ripening wasdeveloped by Lifshits–Slyozov–Wagner (LSW), (e.g., Lifshitz andSlyozov, 1961). According to this theory, crystals larger than somecritical size grow while smaller crystals dissolve resulting in CSDwith asymptotic shape, skewed to the right (Fig. 1b). The LSW theoryis based on the following assumptions: 1) diffusion process ofnutrients through the melt is described as the steady-state approx-imation for diluted suspension; 2) the surface concentration isdefined by crystal size, and 3) the distant content of the dissolvingcomponent common for all particles is calculated in accordance withglobal mass balance that accounts for sinks (growing crystals) andsources (dissolving crystals). It follows from the LSW theory and isobserved in experiments with zircons (e.g., Ayers et al., 2003) that apreexisting CSD will evolve into a different one due to the growth oflarger crystals at the expense of smaller ones, yielding concave-downat small sizes CSD.
In accordance with LSW theory, time evolution of CSD by Ostwaldripening leads to the asymptotic distribution (e.g. curves in Fig. 1b)and the number of crystals depends asymptotically on time as 1/t andthe average crystal size R ̄ as t0.5÷0.333. The asymptotic dependence,among other things, means that CSD becomes this asymptoticfunction F(ζ) of the similarity variable ζ = R/tn , with time; it justshifts to the larger sizes keeping its skewed to the right shape, that isquite different from natural CSDs skewed to the left.
Recently the LSW theory was developed further with inclusion ofthe distribution of growing and dissolving crystals in space (Commu-nicating Neighbors Theory — CN) and correspondent complexdiffusion field (Higgins, 1998). In all these ripening models, matura-tion of the crystal population is considered in a static temperaturefield and involving long geologic times. Furthermore, while theseripening theories are applicable to mafic magmas with low viscositiesand higher diffusivities of nutrient elements, and higher growth ratesof crystals, it is doubtful that crystal ripening in the size range up to100µm to several mm would happen in silicic magmas at realisticgeologic time (e.g. Cabane et al., 2001, 2005).
In this paper, we suggest that the dissolution–precipitationprocesses of crystals in silicic or more basic systems are driven bythe external temperature oscillations that are inherently and inevi-tably present in natural magma chambers. Any realistic magmasystem is characterized by temperature oscillations with amplitudelarger than Ostwald's driving force — characteristic effective super-heating for common crystal sizes. We consider examples of ripeningof quartz and zircon in large volume rhyolites and demonstratethat rather large, tens of degrees temperature oscillations recyclingtens of percent of crystal mass is a preferred explanation for theirCSDs. We briefly discuss implications for the processes in severallarge magma bodies parental to Yellowstone and Bishop tuff caldera-forming eruptions.
1.2. Size effect of solubility on examples of quartz and zircon
Crystal sizes in any magmatic system vary from b 1μm to themicroscopic scale. The contribution of the interface energy to the bulkthermodynamic properties is more important for the smaller crystals.This crystal size effect gives rise to the notion of the critical size duringnucleation, which needs to be exceeded for thermodynamically stablephase transition to occur. This critical size is equally applicable to thenucleation of bubbles or crystals in the melt or for the formation of thecenter of growth on the flat crystal face. When we consider a melt as asolvent for the crystallizing phase, crystal solubility depends on thecrystal size. Crystal solubility (S) can be expressed through the surfaceenergy of the crystal/melt interface (e.g., Lasaga, 1998), the effective
radius R (in spherical approximation) and equilibriummacro-solubility(So) of the sufficiently large crystals or formally at R = ∞:
ln S=Soð Þ ¼ 2γXℜTR
ð1Þ
where γ— surface energy (J/m2), T is absolute temperature, R is radiusof curvature (m), Ω is molar volume of dissolved phase (m3/mol),ℜ isgas constant (J/mol/K). It can be demonstrated (see Cabane et al., 2005,for details) that the size effect on solubility equals to the onset of theeffective superheating for the smaller crystals that has an order:
ΔTeff ¼2γTmRΔHmρ
ð2Þ
here ρ denotes the density of a crystal (kg/m3), ΔHm is meltingenthalpy (J/kg), Tm stands for the melting temperature, ΔTeff is in K.Calculated effective superheating as a function of the crystal radiusand energy of the melt/solid interface for quartz and zircon is shownin Fig. 2. Surface energy γ is the least constrained parameter in Eqs. (1)and (2))). At the numerical modeling of the Ostwald ripening of zircon

1000 A.G. Simakin, I.N. Bindeman / Journal of Volcanology and Geothermal Research 177 (2008) 997–1010
in migmatites Nemchin et al. (2001) used values of γ in the range of0.1–0.3J/m2, while Cabane et al. (2005) used γ = 0.5J/m2 for theirestimates of Ostwald ripening parameters for quartz. However, onecould expect that energy of the crystal phase/granitic melt is lowerthan the surface energy of the fluid bubbles/melt interface of 0.1J/m2
in hydrous rhyolitic melt (Mourtada-Bonnefoi and Laporte, 2004) dueto the lower density and structural contrast between a crystal and amelt phases. Therefore, we vary γ in the range 0.02–0.1J/m2 asestimated experimentally by Hammer, (2004) for solid phasesnucleated from the hydrous granite melt. As it follows from Eq. (1)effective superheating is proportional to γ so that its estimate mayvary almost on the order of magnitude due to uncertainty in the valueof the surface energy. Other parameters in Eq. (2) are well known.Zircon has high density of 4650kg/m3 and dissolution enthalpy ΔHm =584.1kJ/kg (estimated based on the temperature dependence ofsolubility from Watson and Harrison, 1983). Because parameters inthe denominator typically have the large values, Eq. (2) indicates arather small effective superheating, of no more than 0.1–0.3°C, forcrystals that are in the submicron size range. Quartz, on the otherhand, is less dense (ρ = 2500kg/m3) and has lower ΔHm = 63.6kJ/kg(Jackson et al., 1967). As a result, driving force of Ostwald ripeningduring effective superheating is larger, 1–3°C at submicron sizes.Therefore we observe that the above mentioned physical propertiesmay lead to variable intensity of maturation of different minerals.
1.3. A “realistic” magma system
In the most magma bodies there are significant to moderatevariations in crystal super- and undersaturations caused by anumber of factors such as temperature fluctuations, volatile drivenundersaturations, and release of the latent heat of crystallization(e.g., Hort, 1998; Blundy et al., 2006). These fluctuations willvariably affect different crystal sizes of different minerals. In thispaper we postulate that conditions for oscillating super and undersaturations are invariably present in any magmatic system. In ourtreatment below we describe these conditions as being driven bytemperature fluctuations; this is done for simplicity and similarresults would follow if equivalent super and undersaturations werecaused by oscillating volatile regime, for example (e.g., Simakin andBotcharnikov, 2001).
It seems obvious that there are oscillations of temperature due tothe thermal and compositional convection in magma chambers, evenif in thermally-insulated magma bodies (mushy or liquid), thesevariations may be as little as several degrees (e.g., Marsh, 1989;Brandeis and Marsh, 1989). Temperature variations could be muchlarger for magmas upon ascent. Even larger amplitude temperaturefluctuations are expected due to heating by fresh hot magma influxes.Such periodic temperature increases and decreases would affectsaturation conditions which, in turn, will influence the evolution ofthe CSD of resident crystals suspended in a magma body.
Let's consider a process consisting of dissolution and precipitationstages. Dissolution may be caused by the influx of the fresh hottermagma of the same composition or by underplating of a magmachamber with the denser and hotter fresh magma. Depending on aparticular temperature-composition diagram, a certain amount ofheat supplied, will result in different amount of the temperatureincrease. For example, a near-eutectic silicic compositions will suffermuch smaller temperature increase, and near-isothermal melting cantake place. Nonetheless, major and accessory minerals, such as zircon,would dissolve due to dilution by melted cotectic or eutectic mineralsassemblage in this case, followed by crystallization upon cooling /heatremoval. This sequence of the dissolution/precipitation events is oftenreflected in CSD as suggested in Higgins and Roberge (2003), and isreflected in the internal structure of magmaticminerals revealed by CLor trace elemental imaging (e.g. Hoskin Schaltegger, 2003; Wark andWatson 2006; Wark et al., 2007).
Cooling is expected to be more prolonged than episode of heating,because dissipation of heat happens through the chamber walls.We should note however that hydrothermal refrigeration is a majorcomponent of many meteoric magma systems. If magma parcels thatunderwent superheating get surrounded by circulating hydrothermalfluids, then cooling may happen quite rapidly, sometimes leading tohydrothermal quench. However hydrothermal quench happens on thecontact and quenched material will insulate main volume of magma.
We further suggest that temperature fluctuations may characterizemany “experimental”magma systems. Small temperature fluctuations(and thus dissolution–reprecipitation) are unavoidable in experi-ments of long durations. In experiments temperature is keptapproximately constant by regulators that cause oscillations aroundthe desired value by manipulation with heating elements. However, itis known by many experimentalists that in the Internally HeatedPressure Vessels amplitude of oscillations can be several degreesdepending on the design of apparatus (e.g., Eurotherm http://www.eurotherm.com/products/controllers ).
It can be suggested, therefore, that a magma chamber, natural orexperimental, is characterized by temperature fluctuations as a ruleand not as an exception and thus conditions of super and undersaturation, or the driving forces for recrystallization, are expected tobe larger than those caused by isothermal differences in surfaceenergy between crystal of different sizes, i.e. Ostwald ripening forces.
In the following discussion,we describe the evolution of crystal sizesin the series of the dissolution and growth events.We demonstrate thatcalculated dependence of the averaged CSD parameters (such as meancrystal size, volume content of crystals) from time correlate well withpublished experimental data.
2. Model
2.1. General formulation of the model
In general form, equation for CSD for the set of the growing and/ordissolving crystals in the heterogeneous magma can be written as(e.g., Marsh, 1998),
An t;Rð ÞAt
þ A nV ΔT;Rð Þð ÞAR
¼ 0 ð3Þ
where n(R,t) is a population density of crystals per 1m3 of melt, V is agrowth rate in m/s, and R is a crystal radius. Crystals are assumedspherical for simplicity. This equation neglects the sedimentationprocess that would additionally affect particle dynamics of crystal-lizing systems, because small crystals do not settle much in viscousrhyolitic magmas given model timescales considered in this work.
Boundary condition describes formation of the newcrystalswith thesizeR = 0 in themoment t. The crystal size density atR = 0 is a ratio of thenucleation rate J(t) to the growth rate V(t), since the faster the growthrate, the faster crystals gain larger size and leave the smallest bin class:
n R ¼ 0; tð Þ ¼ J tð Þ=V tð Þ ð4Þ
For a particular case when nucleation rate J(t) = 0, crystal densityfunction n(R = 0,t) = 0; The homogeneous nucleation rate J(t) stronglydepends on the driving force of crystallization as exp(− a/ΔT2) (Tammann,1898), which could be expressed as undercooling, supersaturation, orGibbs potential difference (e.g., Hammer, 2004). Such strong dependenceon the degree of undercooling leads to a threshold undercooling ofminimum 25–50°C for silicic magmas (James, 1985; Hammer, 2004) forhomogeneous volumenucleation to start. Next, expansion of Eq. (3) yieldsthe following expressionwith rates of growth and dissolution V(R) being,in a general case, a certain function of the crystal size:
AnAt
þ V Rð Þ AnAR
þ nAV Rð ÞAR
¼ 0 ð5Þ

1001A.G. Simakin, I.N. Bindeman / Journal of Volcanology and Geothermal Research 177 (2008) 997–1010
Obviously, for the rate of growth that is independent of crystal size,the last term is equals to 0, and the remaining equation is thepopulation balance equation as defined by Marsh (1988, 1998).
2.2. Method of solution
Eq. (5) is hyperbolic and can be solved on the characteristics inclosed-form. Method of characteristics consists in the reducing PartialDifferential Equations (PDE) to Ordinary Differential Equations (ODE)—on some curves in the solution space. This method is widely used in thesolution of hyperbolic PDE of gasdynamics (Scott, 2003). Characteristicsof Eq. (5) are curves in (R,t) space defined by dR/dt = V(R) (see Fig. 3). TheV(R), velocity of crystal growth or dissolution, is a variable quantity thatdepends on crystal size. In other words these are trajectories of thecrystals growing with rate V(R), on which PDE (5) is reduced to ODEdescribing variation of the distribution density for crystals with initialsize R(0) = R0
dndt
þ ndV R tð Þð Þ
dR¼ 0; ð6Þ
where time derivate now is in Lagrangian coordinates (moving withparticle coordinate frame). It is obvious that when the growth ratedoes not depend on the crystal size, trajectories of individual crystalsare parallel so that CSD function is translated from the smaller to thelarger sizes along trajectories. If trajectories diverge, the densityfunction drops and vice versa. In Fig. 3 crystals grow in time withgrowth rate being a function of size reaching a maximum at somecrystal radius R = Rmax. Crystals with sizes less than Rmax start growingwith dV/dR N 0; their trajectories diverge in (R,t) space and distributiondensity of their CSD drops in accordance with Eq. (6). After Rmax isreached, the dependence of growth rate on size changes sign dV/dR b 0,trajectories start converging, and a number of crystals n starts to rise.Crystals with initial sizes above Rmax move by converging trajectoriesfrom the initial moment. In our artificial example CSD with maximumwill form from the initially uniform distribution. We considerimplication of this below.
2.3. CSD solution for sequence of dissolution and growth events
Here, we describe CSD evolution for a preexisting crystal popula-tionwith an initially exponential CSD (Fig.1b), similar to ones found inmany igneous systems (e.g. Cashman andMarsh,1988), when there aresmall fluctuations of growth/dissolution driving force (e.g., tempera-ture) around a relatively constant temperature. Given relatively largeundercooling required for new volume homogeneous nucleation to
Fig. 3. General view of growing crystal trajectories in (R,t) space plotted to illustrate howmethod of characteristicsworks inCSD case. An abstract dependence of growth rate on thecrystal radiusV(R)withmaximumat someR=Rmax is taken. For reference it is plotted alongwith R axis. Trajectories of the sample crystals in (R,t) space deviate at dV/dRN0 for RbRmax
providing decrease of the CSD population density function. In the region where dV/dRb0trajectories of crystals are crowded providing growth of CSD density.
start in silicicmagmas (see above and James,1985; Hammer, 2004), weassume that new homogenous nucleation does not happen at smalltemperature fluctuations, but instead these systems are characterizedby heterogeneous nucleation, or growth of the existing and survivinglarger crystals. Let's consider dissolution and growth stages.
2.3.1. Dissolution stageDuring the initial melt fraction or the temperature increase, the
dissolution rate of a particular crystal is taken to be inversely pro-portional to its size. This happens due to dependence of the diffusionflux from curvature of the dissolving crystal surface (see Appendix A fordetails):
V ¼ −a tð Þ=R or dV=dR ¼ a tð Þ=R2 ð7Þ
a ¼ D Cb−C0ð Þρl= Cs−C0ð Þρs ð7aÞ
where V is the dissolution rate, D is the diffusion coefficient of theslowest diffusing component that comprises dissolving solid in themelt, and a is the constant proportional to the degree of undersat-uration (Cb − Co), where Cb is solubility of the slowest diffusingcomponent in the melt or its concentration on the crystal boundary,Co is content of this component in the melt away from the boundary,Cs is component content in the solid. Diffusive crystal dissolution isprimarily rate-limited by the diffusion of the slowest component inmelt (Zhang et al., 1989). Hence, the radius of crystal is getting reducedwith time as a square root of time:
R ¼ffiffiffiffiffiffiffiffiffiffiffiffiffiffiffiffiffiffiffiffiffiffiffiffiffiR20−2∫a tð Þdt
qð8Þ
Generally, crystal size density n(R,t) depends both on the crystalradius R and time t. On the characteristics, density n depends on time,while the radius is also a known function of time (see Eq. (3)).Substituting dependence R(t) on the characteristics Eq. (8) into (6)using Eq. (7) yields the following solution:
n R; tð Þ ¼ no R0; t ¼ 0ð ÞR R0; tð ÞR0 R; tð Þ ð9Þ
Here the radius R (in the moment of time t) corresponds to somelarger radius R0 in the initial moment of the dissolution event.
Alternatively we can express the initial size R0 corresponding tothe current R as function of time and insert into Eq. (9) to get
f1=2 ¼ n R; Tð Þ ¼ no
ffiffiffiffiffiffiffiffiffiffiffiffiffiffiR2 þ c
p� � RffiffiffiffiffiffiffiffiffiffiffiffiffiffiR2 þ c
p ; ð10Þ
where f1/2 designates the distribution corresponding to the firststage of the dissolution-growth cycle and coefficient c = 2at = 2D(T)(Cb − Co)ρlt / ρs(Cs − Co) at the approximately constant under-saturation and diffusion coefficient. When some linear scale forcrystal size R0 is set, coefficient c gets non-dimensional form c = 2D(T)(Cb − Co)ρlt / ρs(Cs − Co)R02.
2.3.2. Overgrowth stageGenerally at slow conductive cooling that is controlled by the heat
loss into country rocks, crystallization would proceed in the regimecontrolled by the kinetics of slow crystal growth rather than be rate-limited by diffusion through themelt (Lasaga,1998;Hort,1998). On thecontrary, upon fast cooling, crystal growth is controlled by diffusiontowards the growing crystal faces, edges, and vertices. Dendrites andhopper morphology crystals are attributes of this diffusion control(e.g., Donaldson, 1976 for olivine; Simakin and Chevychelov, 1995 forfeldspar), since elongated, and narrower crystals grow faster due toenhanced diffusion transport at their tips (e.g., Lofgren, 1980). At theinterface-controlled growth, perfectly-faceted crystals develop and

Fig. 4. An example of the calculated CSDs after several dissolution/precipitation steps. a)evolution of CSD in series of five steps, in each step 0.25 of the crystals volume isdissolved and reprecipitated, while crystal mass is conserved: lowering of themaximum value of the CSD is compensated by its overall shift to the larger meancrystal size values. At each cycle of re-precipitation of 25% of crystal mass, parameter ckgets different values. Notice that shapes of distributions are similar to natural ones(Fig. 1a). b) series of CSDs with different initial exponential distributions n(R)=n0exp(−γR). In all cases crystals comprise 0.3 of volume and matured in the course of threecycles reprecipitating 0.3 of crystal mass.
1002 A.G. Simakin, I.N. Bindeman / Journal of Volcanology and Geothermal Research 177 (2008) 997–1010
the larger crystals tend to grow faster. It can be caused by requirementsof the spiral growth mechanism that needs crystal faces that areextended enough (e.g., Lasaga,1998). Spiral parameters depends on thesupersaturation, spirals at the growth of magmatic minerals some-times have surprisingly high step height (much more than the severalatomic layer sizes) (Sunagawa, 1984). There are reasons why largercrystals would grow faster in a kinetic regime (e.g., growth rate isproportional to the number of the growth spirals on the flat face).However, there are convincing examples of the growth rate beingindependent on the crystal size, as is demonstrated by the slowovergrowth of garnet in metamorphic conditions using 3D imagingand analysis by Cheng et al. (2008). Here for simplicity in the solutionwewill use growth rate not dependent on the crystal size. Then, at thegrowth stage, all crystals would gain increment in their size δR = ∫Vdt.Density of crystal size distribution at such process is shifted to a largersize without shape distortion so that its value corresponds to thevalues at the end of dissolution stage n(R −δR). Combining growth anddissolution stage (Eq. (10)) we get a recursive relation between CSDafter one dissolution-growth step:
nk ¼nk−1
ffiffiffiffiffiffiffiffiffiffiffiffiffiffiffiffiffiffiffiffiffiffiffiffiffiffiffiR−δRkð Þ2þck
q� �R−δRkð Þffiffiffiffiffiffiffiffiffiffiffiffiffiffiffiffiffiffiffiffiffiffiffiffiffiffiffi
R−δRkð Þ2þckq ð11Þ
where parameter c is defined above (see Eq. (10)) relates to theamount of dissolved material and does not depend on the crystalradius.
At two dissolution/precipitation events the initially exponentialdistribution noexp(− γR) becomes:
n2 ¼ n0
exp −γ
ffiffiffiffiffiffiffiffiffiffiffiffiffiffiffiffiffiffiffiffiffiffiffiffiffiffiffiffiffiffiffiffiffiffiffiffiffiffiffiffiffiffiffiffiffiffiffiffiffiffiffiffiffiffiffiffiffiffiffiffiffiffiffiffiffiffiffiffiffiffiffiffiffiffiffiffiffiffiffiffiffiffiffiffiffiffiffiffiffiffiffiffiffiffiffiffiR−δR1þ2ð Þ2þc1
q−δR2
� �2
þc2
s0@
1A ffiffiffiffiffiffiffiffiffiffiffiffiffiffiffiffiffiffiffiffiffiffiffiffiffiffiffiffiffiffiffiffi
R−δR1þ2ð Þ2þc1q
−δR2
� �ffiffiffiffiffiffiffiffiffiffiffiffiffiffiffiffiffiffiffiffiffiffiffiffiffiffiffiffiffiffiffiffiffiffiffiffiffiffiffiffiffiffiffiffiffiffiffiffiffiffiffiffiffiffiffiffiffiffiffiffiffiffiffiffiffiffiffiffiffiffiffiffiffiffiffiffiffiffiffiffiffiffiffiffiffiffiffiffiffiffiffiffiffiffiffiffi
R−δR1þ2ð Þ2þc1q
−δR2
� �2
þc2
s
ð12Þ
Calculations at number of events k N 2 are tedious and wereperformed with symbolic manipulator Maple (http://en.wikipedia.org/wiki/Maple_computer_algebra_system ).
Two distinct regimes of recrystallization can be recognized. Thesetwo cases represent two likely end-members during magma convec-tion and temperature change.
1) Equilibrium. Total amount of the dissolved material dMdissolved, canbe set as some fraction of the initial mass of crystals beforedissolution, dMdissol/M0 = const At the end of dissolution stage, theequilibrium saturation level is attained for the final temperature.This case applies when duration of the heating event is larger thantime necessary to achieve equilibrium at dissolution. Equilibriumdissolution time is approximately proportional to ck , the variablethat depends on the current CSD parameters.
2) Non-equilibrium. Amount of the dissolved material is proportionalto time during the dissolution stage or ck = const, and is only afraction of the equilibrium dMdissol. This case applieswhen the timebetween temperature fluctuations is short, and slow kineticsprevents the required equilibrium mass to be dissolved duringeach dissolution episode to achieve saturation level, and thendissolution is forced to stop (quenched) at the subsequent coolingstage.
In these two cases, the small increment of crystal size change δRduring each step of precipitation (δRk) is calculated to keep crystalsmass balance constant and identical to the initial crystal mass asdefined by the initial CSD. In otherwords, themass of all crystals at theend of each precipitation episode equals the initial mass Mo.
In order to calculate the parameter ck in k the equilibriumdissolutionstep (Case 1), and the parameter δRk, we solve numerically equationsinvolving the mass of the crystals for a given size distribution
Mk ¼ ∫Rmax
4=3πR3nkdR
Rmin
ð13Þ
The minimum crystal size for the initial exponential CSD is set tozero. After the first growth step, the minimum size becomes δR1.During the next steps Rmin and δRk are calculated in accordancewith the amount of the dissolved and reprecipitated material foreach initial CSD and crystal mass. An example of the evolution of asequence of the calculated CSDs is shown in Fig. 4a. It is evident thatmaximumof the distribution is shifted to the larger sizes and becomeswider with increasing number of the dissolution–precipitation cycles.Initial steepness of the starting exponential CSD affects evolution ofthe CSD shape. This effect is illustrated in Fig. 4b depicting evolution ofthree initially different CSDs in which crystals volume content is 0.3;these CSDs are subjected to the equal sequence of three dissolution–precipitation events each recycling 30% of the crystal mass. It can be

Fig. 6.Dependence of themean crystal radius (a) and the volume number content (b) on
1003A.G. Simakin, I.N. Bindeman / Journal of Volcanology and Geothermal Research 177 (2008) 997–1010
seen that if the initial distribution has greater fraction of the smallestcrystals, the resultant CSD will have narrow maximum at the smallestsize on the CSD plots. The larger size shoulder of CSDs changes initialslope only when maximum is sufficiently shifted and widen.
2.3.2.1. The potential role of size dependent growth caused by crystalsettling. If growth rate is proportional to the crystal size (e.g., Eberlet al., 2002) then it may lead to somewhat faster growth of larger thecrystals while minimally affecting the smallest crystal sizes that areundergoing dissolution. In natural systems, diffusive mass transportcan be accelerateddue to Stokes crystal settling. The larger crystals sinkfaster andhavenarrower boundary layer that facilitates diffusion of thedissolving components from their crystal surface. This effect can bequantified with scaling relationships obtained experimentally andtheoretically decades ago (Bowman et al., 1961; Brauer and Schmidt-Traub,1973). In Fig. 5 our estimates for quartz and zircon (seeAppendixB for details) are displayed demonstrating that in the granite melt,diffusive flux and dissolution rate are inversely proportional to thecrystal radius until some threshold value that primarily depends on thedensity of settling crystals. For a crystal settling in the granite withviscosity of 105Pa s, the effect of accelerated dissolution caused bycrystal settling starts playing a role for zircon crystals larger than 20μmin radius, for the less dense quartz crystals this radius is about 0.5mm.For crystals greater than the quoted sizes, effect of accelerating of therelative flow due to increase of R merely compensates decrease in thediffusive flow for increasing curvature so that dissolution rate becomesalmost constant. Therefore, we neglect the effect of flow in our model,because most dissolution/reprecipitation ripening happen at sizessmaller than the quoted sizes.
3. Applications of the model
3.1. Experimental coarsening
We start with consideration of experimental data on the coarsen-ing of the fine crystals suspension in the melt by dissolution–precipitation mechanism in order to see if these can be explained byoscillating temperatures. Crashing of the mineral grains with mortar
Fig. 5. Dependence of the total mass flux (q) from the surface of the spheremoving withconstant velocity through the viscous liquid calculated in accordance with a model ofBrauer and Schmidt-Traub (1973). Constant concentration on the sphere surface Cb isset, flux (in cm/s=cm3/cm2/s) is normalized on the ΔC=Cb−C∞. Stokes settling velocitiesfor quartz and zircon in the granitemelt with viscosity 105 poise are used, with densitiesof quartz at 2650 kg/m3, and zircon at 4800 kg/m3. Notice that at given parameters forzircon crystal sizes (2R)Nca 40–50 μm and quartz greater than about 0.4–0.5 mmdissolution is independent on settling rate.
time in the series of five small amplitude dissolution–precipitation events. Time (t) isset approximately proportional to the number of cycles (n) multiplied on the non-dimensional rate parameter c in Eq. (10) (T=100cn). Parameter c is proportional todissolution time at constant superheating. Parameter c=0.1 on the plot corresponds tothe oscillations with the largest period. Notice that there is no difference in the endresult on weather the dissolutions were small in number but intense or if there werelarge number of smaller-degree dissolutions.
and pestle prior to experiments may yield exponential CSD (Djamaraniand Clark, 1997), fractal or Weibull CSDs, with subtly concave-downshape in semi-logarithmic coordinates (e.g. Bindeman, 2005), all havingplentiful small crystals.When for example anexponential CSD is allowedto anneal in experiments involving a melt or fluid, it develops concaveup, lognormal CSDas is observed in experimentswith duration fromdayto weeks on fluid driven metamorphic zircon maturation affectingzircon crystals in the size range 0.1 b R b 2μm (e.g. Ayers et al., 2003).Wesuggest that the annealing and CSD transformation in experiments maybe better explained by temperature fluctuations rather than by Ostwaldripening, because of the reasons outlined above and below.
The effect of the particle size on solubility (driving forcefor Ostwald ripening) can be expressed in terms of effective super-heating in degrees of Celsius relative to a flat crystal face of a givenmineral in equilibrium with melt (see Eqs. (1) and (2)). It can becalculated to be about one degree for quartz and 0.1°C for zircon inthe granitic melt based on the Eq. (2) above. Therefore crystals withradius of several microns and more will recrystallize faster at thetemperature oscillations with amplitude of several degrees inexperimental systems than at the classic isothermal Ostwald ripening.
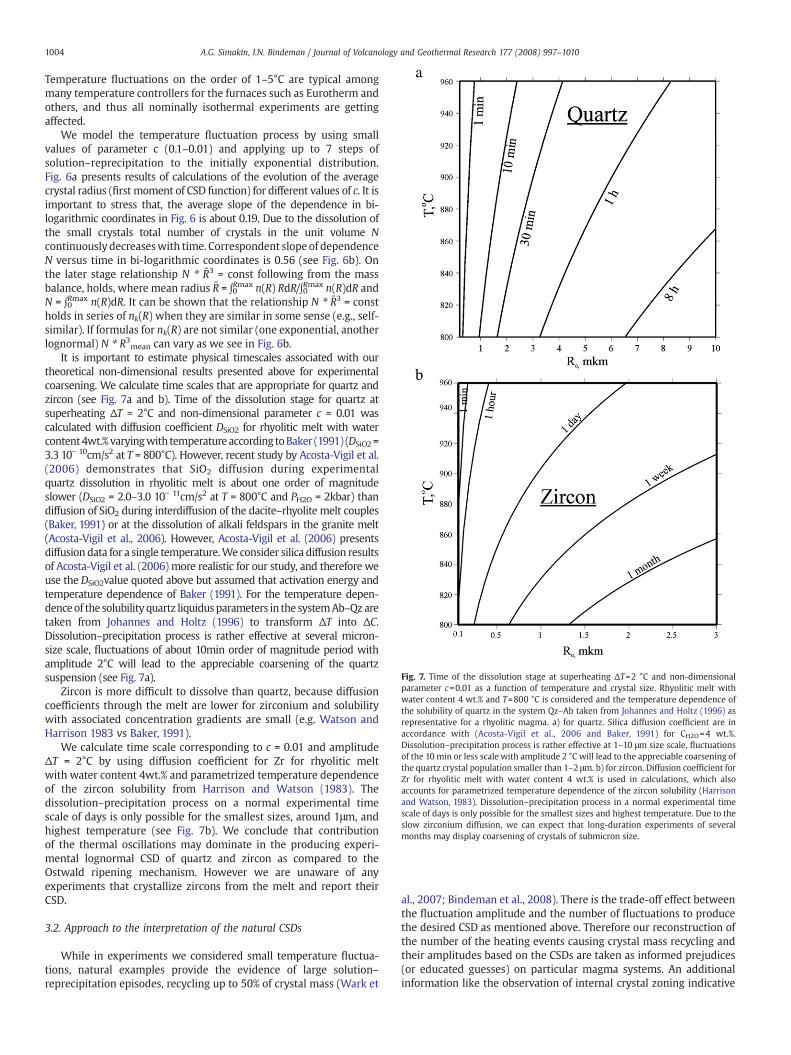
Fig. 7. Time of the dissolution stage at superheating ΔT=2 °C and non-dimensionalparameter c=0.01 as a function of temperature and crystal size. Rhyolitic melt withwater content 4 wt.% and T=800 °C is considered and the temperature dependence ofthe solubility of quartz in the system Qz–Ab taken from Johannes and Holtz (1996) asrepresentative for a rhyolitic magma. a) for quartz. Silica diffusion coefficient are inaccordance with (Acosta-Vigil et al., 2006 and Baker, 1991) for CH2O=4 wt.%.Dissolution–precipitation process is rather effective at 1–10 μm size scale, fluctuationsof the 10 min or less scale with amplitude 2 °C will lead to the appreciable coarsening ofthe quartz crystal population smaller than 1–2 μm. b) for zircon. Diffusion coefficient forZr for rhyolitic melt with water content 4 wt.% is used in calculations, which alsoaccounts for parametrized temperature dependence of the zircon solubility (Harrisonand Watson, 1983). Dissolution–precipitation process in a normal experimental timescale of days is only possible for the smallest sizes and highest temperature. Due to theslow zirconium diffusion, we can expect that long-duration experiments of severalmonths may display coarsening of crystals of submicron size.
1004 A.G. Simakin, I.N. Bindeman / Journal of Volcanology and Geothermal Research 177 (2008) 997–1010
Temperature fluctuations on the order of 1–5°C are typical amongmany temperature controllers for the furnaces such as Eurotherm andothers, and thus all nominally isothermal experiments are gettingaffected.
We model the temperature fluctuation process by using smallvalues of parameter c (0.1–0.01) and applying up to 7 steps ofsolution–reprecipitation to the initially exponential distribution.Fig. 6a presents results of calculations of the evolution of the averagecrystal radius (first moment of CSD function) for different values of c. It isimportant to stress that, the average slope of the dependence in bi-logarithmic coordinates in Fig. 6 is about 0.19. Due to the dissolution ofthe small crystals total number of crystals in the unit volume Ncontinuously decreaseswith time. Correspondent slope of dependenceN versus time in bi-logarithmic coordinates is 0.56 (see Fig. 6b). Onthe later stage relationship N ⁎ R3̄ = const following from the massbalance, holds, where mean radius R ̄ = ∫0Rmax n(R) RdR/∫0Rmax n(R)dR andN = ∫0Rmax n(R)dR. It can be shown that the relationship N ⁎ R̄3 = constholds in series of nk(R) when they are similar in some sense (e.g., self-similar). If formulas for nk(R) are not similar (one exponential, anotherlognormal) N ⁎ R3mean can vary as we see in Fig. 6b.
It is important to estimate physical timescales associated with ourtheoretical non-dimensional results presented above for experimentalcoarsening. We calculate time scales that are appropriate for quartz andzircon (see Fig. 7a and b). Time of the dissolution stage for quartz atsuperheating ΔT = 2°C and non-dimensional parameter c = 0.01 wascalculated with diffusion coefficient DSiO2 for rhyolitic melt with watercontent4wt.%varyingwith temperatureaccording toBaker (1991) (DSiO2 =3.3 10− 10cm/s2 at T = 800°C). However, recent study by Acosta-Vigil et al.(2006) demonstrates that SiO2 diffusion during experimentalquartz dissolution in rhyolitic melt is about one order of magnitudeslower (DSiO2 = 2.0–3.0 10− 11cm/s2 at T = 800°C and PH2O = 2kbar) thandiffusion of SiO2 during interdiffusion of the dacite–rhyolite melt couples(Baker, 1991) or at the dissolution of alkali feldspars in the granite melt(Acosta-Vigil et al., 2006). However, Acosta-Vigil et al. (2006) presentsdiffusion data for a single temperature.We consider silica diffusion resultsof Acosta-Vigil et al. (2006) more realistic for our study, and therefore weuse the DSiO2value quoted above but assumed that activation energy andtemperature dependence of Baker (1991). For the temperature depen-denceof the solubility quartz liquidusparameters in the systemAb–Qzaretaken from Johannes and Holtz (1996) to transform ΔT into ΔC.Dissolution–precipitation process is rather effective at several micron-size scale, fluctuations of about 10min order of magnitude period withamplitude 2°C will lead to the appreciable coarsening of the quartzsuspension (see Fig. 7a).
Zircon is more difficult to dissolve than quartz, because diffusioncoefficients through the melt are lower for zirconium and solubilitywith associated concentration gradients are small (e.g. Watson andHarrison 1983 vs Baker, 1991).
We calculate time scale corresponding to c = 0.01 and amplitudeΔT = 2°C by using diffusion coefficient for Zr for rhyolitic meltwith water content 4wt.% and parametrized temperature dependenceof the zircon solubility from Harrison and Watson (1983). Thedissolution–precipitation process on a normal experimental timescale of days is only possible for the smallest sizes, around 1μm, andhighest temperature (see Fig. 7b). We conclude that contributionof the thermal oscillations may dominate in the producing experi-mental lognormal CSD of quartz and zircon as compared to theOstwald ripening mechanism. However we are unaware of anyexperiments that crystallize zircons from the melt and report theirCSD.
3.2. Approach to the interpretation of the natural CSDs
While in experiments we considered small temperature fluctua-tions, natural examples provide the evidence of large solution–reprecipitation episodes, recycling up to 50% of crystal mass (Wark et
al., 2007; Bindeman et al., 2008). There is the trade-off effect betweenthe fluctuation amplitude and the number of fluctuations to producethe desired CSD as mentioned above. Therefore our reconstruction ofthe number of the heating events causing crystal mass recycling andtheir amplitudes based on the CSDs are taken as informed prejudices(or educated guesses) on particular magma systems. An additionalinformation like the observation of internal crystal zoning indicative

Fig. 8. Crystal size distributions for zircon extracted from pumice in large volumepyroclastic tuff deposits (data from Bindeman, 2003) normalized on the maximumcrystal size and maximum CSD value. For comparison experimental data on the zirconCSD matured in the nominally isothermal hydrothermal ripening experiment withinquartzite are shown (data from Ayers et al., 2003). In experiments, zircon ripeningoccurred presumably due to multiple, low amplitude temperature oscillations. Noticethat experimental and natural CSDs are comparable, but in experiments CSD hasflattened top with maximum shifted to the smaller size compared with naturaldistributions, see text for discussion.
Fig. 9. Interpretation of CSDs for quartz and zircon from the Huckleberry Ridge tufferuption of Yellowstone, Members A (a) and C (b). Model curves were fit to best describemeasured values and present proportion of crystal mass recycled in each of thedissolution/precipitation cycles, while keeping the overall crystal mass the same. Noticethat zircon in Member A has exponential distribution in the contrast to quartz in thesame sample and requires no annealing. Quartz and zircon of the Member C can beexplained by two dissolution/precipitation episodes of approximately the samemagnitude. See text for discussion.
1005A.G. Simakin, I.N. Bindeman / Journal of Volcanology and Geothermal Research 177 (2008) 997–1010
of dissolution–precipitation events in individual crystals can be usedto constrain the number of cycles. If independent data is availableabout the timing between different cycles, then a total time for crystalmaturation can be estimated from a CSD.
In our applications to the natural CSD, we consider CSD of quartzand zircons in individual pumice clasts from large volume caldera-forming eruptions that were reported in Bindeman (2003). Whilezircon exhibits no evidence for postcrystallizational breakage,melt inclusion decrepitation is the leading cause of quartz breakagegenerating fractal or lognormal fragment size distributions (Binde-man, 2005). However the present work only discusses CSDs ofunbroken crystal populations (Bindeman, 2003). The list of unitsdiscussed here include: Huckleberry Ridge tuff (HRT, Members A andC), Mesa Falls tuff (MFT), Lava Creek tuff (LCT, Member A and B), andBishop tuff (BT, Early and Late). The first three tuff units were eruptedin the course of 2.04, 1.3, and 0.64Ma caldera-forming eruptions ofYellowstone, while BT was a product of 0.75Ma eruption of LongValley Caldera, California. Since zircon and quartz were rapidlyquenched by eruption, the extracted populations of whole crystalsand their CSD reflect quenched, pre-eruptive conditions of crystalgrowth and dissolution and thus may provide useful informationabout initiation of their respective caldera-forming eruptions. It isparticularly noteworthy that CSD of quartz and zircon are lognormal inall cases, and we suggest that this is a result of the annealing of aninitially exponential CSD in the course of preeruptive temperaturespike in each pre-climactic magma chamber.
In order to compare shapes of crystal size distributions of quartzand zircon for samples of different crystal content andmedian size, wenormalized these two parameters to the maximum density value andmaximum crystal size in each sample (see set of the distributions forzircon in Fig. 8). Such procedure does not change the shape of the CSDand allows us to discuss annealing progress recorded in shape as afunction of the number of solution–reprecipitation steps, n. Shapes ofthe CSDs differ by the width of the D/Dm size spectrum (flatness),position of the maximum (shifted to smaller or larger relative sizes),and steepness of the small size shoulder. For example, the CSD of MFTzircons have most flattened shape, while CSD for BT-Early have thesteepest.
We explore what number of the relatively large amplitudetemperature oscillations and correspondent dissolution–precipitationevents will result in the CSD of a given shape. Exponential distributiondemonstrated by zircons fromHRT-A tuff is typical for as-grown crystalsnot subjected to recrystallization. It is reported for the magma bodieswith simple thermal history such as solidified lava lakes (Cashman andMarsh, 1988), rhyolitic laccoliths (Mock et al., 2003), some intrusions(Higgins,1998), and selected silicic eruptive products (Bindeman, 2003;Higgins and Roberge, 2003). However for the majority of other tuffs anumber of episodes of temperature oscillations, and dissolution ofsmaller crystals is required (Figs. 8 and 9). In order to fit the natural datafor each eruption, we started with the initially exponential distributionas defined by the slope of the right-hand side shoulder of the naturaldistribution and undertook a modeling by trial and error to obtain abest-fit solution for details of the concave-down, lognormal shape ofcrystals in each eruption.
We notice that only one to three episodes are sufficient toreproduce the lognormal shape, and fine-tuning of this model usuallyrequires 1–2 additional smaller steps of dissolution rather than a

Fig. 10. Interpretation of CSDs for quartz and zircon from the Bishop tuff pumice clastsa) from early BT; b) from late BT. BT-late quartz is pronouncedly more matured than BT-early quartz in agreement with observations of the quartz cathodoluminecence and Ticoncentration zonality from BT (Peppard et al., 2001; Wark et al., 2007). Zircon CSDs inearly and late BTare quite similar by their normalized shape and require two episodes ofdissolution/reprecipitation to match measured CSD shapes. In the Late BT, twocomparable episodes of the total mass of zircon crystals per cm3 of magma is larger. Itmeans that less intensivemelting involving quartz dissolutionwill act strongly on zirconCSD in BT-early as more intensive melting at higher mass of zircon crystals in BT-late).
1006 A.G. Simakin, I.N. Bindeman / Journal of Volcanology and Geothermal Research 177 (2008) 997–1010
single episode that recycles a significant portion of the original crystalmass. Overall, a moderate (i.e. 10% total mass) to significant (e.g. 60% )of total crystal mass is required to be dissolved and then reprecipitatedin order to explain the observed concave-down CSD shape and itsdetails as is observed on Figs. 8 and 9. As a rule of the thumb, a singlereheating–recycling episode leads to very steep truncation of the lefthand CSD shoulder, than a series of smaller dissolution–reprecipita-tion episodes, because in the latter case there is a greater chance forsmaller crystals to survive dissolution regrow between reheatingepisodes and thus the CSD is able to recover toward a smoother shape.
We attributed small temperature oscillations to details of magmaconvection in subliquidus magma bodies (e.g. Marsh, 1989), or spikedepisode of latent heat released/hydrothermal refrigeration by mushy-state, near solidus magma bodies but the proportions of crystal massrecycling required to explain our natural data are more in linewith rather large reheating episodes. It is known that in subvolcanicmagma chambers resident silicic magma can be subjected to severalreheating events by an intruding basaltic magma; such events arerecorded in the mineral zoning and clearly exemplified by magmamixing textures. Therefore we consider such reheating episodes to bethe main driving force of recrystallization and transformation of theinitially exponential CSD into lognormal one in several dissolution–precipitation cycles.
However, another variation of the theme that are likely to becharacteristic of natural system: is when—the temperature increasesare too rapid for dissolving crystals to achieve the equilibriumdissolution fraction, before the next episode of temperature decreasecauses crystal overgrowth. This corresponds to the case 2 above andmay characterize recrystallization of zircon in nature. Due to therelatively faster diffusion of silica vs. zirconia in melts (Baker, 1991and Watson and Harrison, 1983), quartz dissolution may follow theequilibrium model (i.e. case 1 above); zircon dissolution may still beincomplete when the temperature drops, and thus its dissolutionmay be ceased before the next episode of overgrowth. However,equilibrium or not, the final CSD will look similarly lognormal andbelow we present case studies from the natural examples of the samelarge silica rhyolites. We demonstrate that only a few, one to three,episodes are required to explain the observed natural CSD for quartzand zircon.
3.3. Quartz and zircon examples from Huckleberry Ridge tuff, Bishop tuff,and Mesa Falls tuff
We consider CSDs for both quartz and zircon in these three largevolume tuffs. Products of the early stage of eruption that produced theHuckleberry Ridge tuff —Member A (Fig. 9a) are characterized bymoderately matured quartz CSD with maximum at D/Dm ≈ 0.33 thatare best obtained in only two cycles of dissolution–precipitationepisodes each recycling 0.50 and 0.20 fraction of quartz crystals bymass. However, zircon crystals in this sample demonstrates almostexponential distribution and requires little annealing: maximum isdefined only by one left point on the CSD plot and distribution can betreated as practically exponential or as a result of pure grown uponcooling or degassing. Zirconium concentration is the lowest in theHRT-A compare to the other units, while this is the most silica richsample of HRT (e.g. Bindeman et al., 2008). Therefore quartz is likely toappear before zircon and have suffered episodes of solution andreprecipitation. Zircon may suffer even larger dissolution at the strongheating preceding HRT supereruption so that there were too fewsurvived crystals and new ones nucleate and grow just before or in thefinal eruption stage to yield exponential CSD.
Products of the late stage of the eruption corresponding toHuckleberry Ridge tuff — Member C (see Fig. 9b) are characterized bysimilarly lognormal CSDs for quartz and zircon. Their shapes can berespectively interpreted as result of the re-precipitation of the 0.36 × 2 forquartz crystals volume, and 0.40 and 0.55 dissolution–reprecipitation
episodes for zircon. Practically concordant behavior of quartz and zirconin HRT-C rhyolites may be interpreted that quartz and zircons sharedcommon history in the HRT-C magma body, and be caused by twoepisodes of rhyoliticmagma heating by basicmagmas. It should be notedthat in HRT-A and especially HRT-C zircons many zircon cores survivedremelting and recycling and reflect ages and oxygen isotopic values ofthat of precursor rocks (e.g. Bindeman et al., 2008).
In contrast to HRT-A, zircon CSD in the products of the early Bishoptuff eruption looks more matured than quartz CSD from the samesample (see Fig. 10a). Modeling demonstrates that CSD of quartzwould be consistent with two weak episodes of dissolution–reprecipitation recycling 0.25 and 0.12 of quartz mass to match CSDwith observed parameters. However, two episodes that recycle 0.45and 0.47 of zircon mass is required to explain zircon CSD in early BT.
At the same time, quartz and zircon in the products of the late Bishoptuff eruption have quite similar normalized CSDs (see Fig. 10b). We canmatchbothCSDswith only two cycles of dissolution/precipitation 0.42 +0.32 for quartz and 0.55 + 0.55 for zircon. Apparently the fact that zirconis more matured than quartz in the early BT can be linked to smallcontent of zircon crystals (only 28 crystals per 1cm3 in Early BT vs. 37–98

Fig.11. Interpretation of CSDs for quartz and zircon from theMesa Falls Tuff. Both phasesdemonstrate rather concordant distributions that are best interpreted as result of thethree intensive solution/reprecipitation episodes.
1007A.G. Simakin, I.N. Bindeman / Journal of Volcanology and Geothermal Research 177 (2008) 997–1010
crystals in late BT, Bindeman, 2003, Appendix); as a result that meltingof the even small fraction of quartz would cause more substantialdissolution of zircon. Late erupted BT tuff probably represents bottomlayer of magma, thermally activated due to thermal interaction withunderplating basalts (e.g. Wark et al., 2007). Thermal reactivation of thedeep layers in large silicic magma bodies by an underplating basicmagma seems to be essential feature of voluminous rhyolitic eruptionsas suggested in many studies (e.g. Annen and Sparks, 2002).
The CSDs for quartz and zircon in the Mesa Falls Tuff are mostmature and demonstrate the largest crystal sizes and crystal meansizes. They demonstrate concordant behavior of quartz and zircon in amagma stored before eruption and subjected to at least threeintensive episodes of solution–reprecipitation, recycling 0.4 + 0.5 +0.5 mass fraction (see Fig. 11). It appears that both quartz and zirconsshare the same dissolution–reprecipitation history in the MFT.
Examples above presented contrasting cases that may characterizerecycling of two mineral phases one major and one accessory in thesame rock that shows their discordant and concordant behavior.Mineral growth rates and diffusion rates of their constituent elementsdiffer by several times and discordant behavior is expected for a non-equilibrium dissolution (case 2 above). Nonetheless, it appears that afew large scale recycling episodes are sufficient to explain our data.
3.4. Can a mature lognormal CSD tell time?
In the above calculations we controlled the number of cycles n togenerate a particular CSD and made no inference on the time it takesto achieve the final (observed) CSD. Any time estimate based on thelognormal CSD will only represent a minimum residence time since agiven populationmay reside in a largemagma chamber for a long timeat constant temperature or if there are only small temperatureoscillations, affecting the smallest crystals. We demonstrated abovethat small temperature oscillations of 1–2° can explain experimentalcoarsening of micron-size crystals of zircon, tens to hundreds ofmicron crystals of zircons require much more significant oscillationsof several tens of degrees C.
However if there is no idle time in each magma chamber history,and temperature oscillations come one after another, then physicaltime can be set proportional to product n and parameter c in Eq. (11)above since c = 2DZr(T)(Cb − Co)ρltsct / ρs(Cs − C0)R02 is proportional tothe time scale of dissolution stage. We plot in Fig. 6 calculatedmean crystal radius as a function of T = n × c for different values of c(due to for example different period of temperature oscillations tscl atconstant supersaturation Cb − Co).
We can estimate order of magnitude of the characteristic time of thedissolution stage based on the CSD analysis. Parameter c = 2DZr or SiO2
(T)ΔCρltscl / ρs(Cs − C0)R02 controls dissolution process. For quartzparameter ΔC(ΔT) = Cb(To + ΔT) − Co is defined via inverse liquidusslope (∂C / ∂T) of quartz for particular system. Rhyolitic magma can beapproximated by ∂Cqz / ∂T ÷ 0.001wt. fract. K− 1(defined using data fromJohannes and Holtz, 1996) or ΔC ≈ ΔT ∂Cqz / ∂T ≈ 0.1 at ΔT = 100°C. Theconcentration parameter for zircon dissolution is defined not only byincreasing temperature of the melt but also by dilution by rock-formingzirconium-free minerals through mass balance equation:
ΔC ¼ C To þ ΔTð Þɛ1−C Toð Þɛoɛ1
; ð14Þ
where C(T) is solubility of ZrSiO4 at the temperature T, ε— is a fractionof the melt in the magma. Solubility of zircon in the granite melt iswell-constrained experimentally (Watson and Harrison,1983). Typicalvalue ofΔC associatedwith increasing of themelt fraction from ε = 0.35to ε = 0.75 at heating from 750°C to 850°C is 2.510− 4. The characteristicradius R0 links non-dimensional calculated distribution with a givennatural CSD, it was set to 500μm for quartz and 50μm for zircon.
When we use diffusion coefficients of 3.9 ⁎ 10−15m2/s for 850°Cand 4wt.% water, (recalculated from Acosta-Vigil et al., 2006 asdescribed above) we obtain time necessary for dissolution of half ofquartz crystals of 2 to 3.5yrs. Assuming similar water contents andtemperatures, and taking diffusion and solubility model of zirconfrom Watson and Harrison, (1983) we obtain the correspondingdissolution–reprecipitation time to generate zircon's CSD of 26yrs. Inthis calculation the melt fraction increases from 0.35 to 0.75 uponheating from 800 to 860°C. If we set heating from 760 to 800°C withthe same increase of the melt content time scales increases to178years, because of the slower zirconium diffusion at lowertemperatures.
4. Discussion
It is possible to check consistency of our interpretation oflognormal quartz CSDs measured in Bishop tuff (Bindeman, 2003;Gualda and Rivers, 2006) andmodeled in this study with independentestimates of proportions of magmatic recycling derived from zoning ofquartz crystals. Wark et al. (2007) measured cathodoluminesence (CL)intensity and TiO2 concentrations in quartz phenocrysts and esti-mated temperature of their crystallization. They found that in the latesequence of Bishop quartz has high temperature overgrowth (T = 800–820°C) over rounded dissolved cores (T = 700–720°C). While heatingand dissolution are explained by a basaltic intrusion, overgrowthat high temperature is explained by T–X–XH2O–CO2 compositionalrelations specific to Bishop tuff. If their interpretation is correct, thenthis provides another degree of freedom in our model since theamount of the precipitated material is not directly defined by theamount of the dissolved at heating material but melting relations inthe melt with variable water content. On published CL images ofquartz crystals from the Late Bishop tuff (Peppard et al., 2001; Warket al., 2007), only a few typically two to three dissolution surfaces canbe seen. It is only evident that Late BT quartz underwent more severedissolution and was precipitated due to water extraction into CO2
bubbles and was not due to cooling. Residence time of the hot magmain the lower layer was estimated by Wark et al. (2007) through theshape of TiO2 distribution on the boundary between core andovergrowth to be several hundreds years. It is semi-quantitativelyconsistent with our estimates based on the CSD analysis of the late BTCSD.
CL imagingof zircons in Yellowstone tuffs and lavas that collectivelydefine lognormal CSD patterns also demonstrates rather simple zoningpattern (Bindemanet al., 2008). Isotopically diverse coreswith variablydark CL and with diverse oxygen isotope values are surrounded by

1008 A.G. Simakin, I.N. Bindeman / Journal of Volcanology and Geothermal Research 177 (2008) 997–1010
light-CL, eruption-age rim, and investigation of zircon zoning patternsreveals that nomore than two episodes of solution–reprecipitation hastaken place. The remelting episodes are interpreted to representblending different magma batches together followed by the preer-uptive overgrowth by a single equilibrium rim. The amount of re-melting based on CL imaging and also on oxygen isotope balancebetween cores and rims of bulk zircons is estimated to be in the 10–60%range. Based on oxygen isotope zoning, the time required to recyclezircons was estimated to be between ~ 103 and 104years. It is possiblethat multiple solution–reprecipitation episodes recycled the outer-most few percent of zircons but the last major episode of solution–reprecipitation erased the prior recycling memory, and truncated leftside of the CSD to proportions required by the present model.
Let's consider experimental data on quartz and zircon with ourtheoretical estimates of the time evolution of CSDs. In experiments ofAyers et al. (2003) on zircon coarsening in water bearing quartzite,temperature was held constant at 1000°C. Initially crushed zirconcrystal population annealed in “metamorphic conditions” via diffu-sion through the fluid phase distributed in the quartzite porous space.However, such annealing process is similar to the magmatic annealingbecause both are controlled by diffusion of nutrients through themelt/fluid and no gravity settling occurs. Experimental annealing ofzircon by Ayers et al. (2003) yielded CSD shape that is close to log-normal distribution, similar to what is observed in most naturalexamples (e.g. Bindeman, 2003). The lognormal shape with deficiencyof the smallest crystals obtained in the CSD of zircon in annealingexperiments differs significantly from the shape predicted by the LSWmodel showing small crystal size tail (see Fig. 1b).
For quartz, there are experimental data on quartz coarsening ingranite melt that can be taken from a recent work by Cabane et al.(2001). These authors find that the mean radius of quartz crystalsat recrystallization can be approximated as a power of time R ∝ tk
with k ≈ 0.2. Again, our model of temperature fluctuations comparesnicely with these experimental results: our estimate of k is 0.19 (seeFig. 6a). Moreover, mean volumetric content of crystals Nv varies withtime exponent − k = 0.41–0.51, in good agreement with our estimate0.56 (see Fig. 6b). At the same time LSWmodel predicts k = 0.5–0.33 inthe crystal size dependence that is substantially larger than observedexperimental values. Obviously our model provides better fit to theobservations than the ripening theory based on the LSW approach.Furthermore, the results and predictions of the present model providebackground for experimental testing in order to verify that thepresented solution with at all its assumptions and simplificationscatches the essence of natural processes and provides time exponentsof CSD evolution correctly in a wide parameters range.
5. Conclusions
1) The simplified model based on the size dependent dissolution ratefor crystals in the melt and constant slow overgrowth rate isproposed here to describe evolution of the CSD in the series of thedissolution–precipitation events.
2) The model can explain abundant lognormal CSD of quartz andzircon in natural systems by solution–reprecipitation after only afew cycles of melting-crystallization.
3) Quartz and zircon CSD in the same sample may experience differentproportions of the dissolution dependingonparticular composition–melting relations for each mineral and zirconium concentrationaffecting solubilities.
4) Predicted by the model duration of the dissolution stage of about100years for zircon based on the measured CSD for upper Bishoptuff unit is comparable with one extracted from the quartz zonality(Wark et al., 2007).
5) Power exponent of the mean radius growth with time obtained inexperiments on the quartz maturation is close to the obtained in ourmodel for series of the low-intensity dissolution–precipitation events.
Acknowledgements
AGS was partially supported by the RFBR grant # 07-05-00629,University of Oregon, and NSF.EAR 0537872). We thank Keith Putirka,and an anonymous reviewer for providing careful reviews of thepaper.
Appendix A. Dissolution rate at diffusion control
It is well known that at the control of dissolution by diffusiondissolution rate is inversely proportional to the particle size (radiusin spherical approximation). This is valid for various geometries, forillustration we consider solution for the steady-state diffusion forsphere. Assume that small spherical source is placed inside sphericalshell and constant concentration is set on the surface of the internalsphere. Diffusion equation at steady-state is reduced to the Laplacianof concentration or in spherically symmetrical case:
ddR
dCdR
R2� �
=R2 ¼ 0 ðA1Þ
Solution for the shell boundary conditions C(R0) = Co, C(R1) = C1(R1 N R0) is
C Rð Þ ¼ C1R1−C0R0
R1−R0−
C1−C0ð ÞR0R1
R1−R0ð ÞR ðA2Þ
In the case of infinite space (R1 = ∞) C(R) = C1 + R0(C0 − C1) / R.Strictly saying moving boundary of the dissolving core substantiallycomplicates solution of the diffusion problem. Here for brevity wewillneglect effect of the moving boundary that is physically reasonable forslow dissolution processes considered. Diffusion flux from the surfaceof particle is fed by the dissolution so that
DdCdR
¼ udisρs
ρlCs−C0ð Þ; udis ¼ D
C1−C0
R0 Cs−C0ð Þρl
ρsðA3Þ
where ρs and ρl are densities of the solid and melt respectively, D isdiffusion coefficient, Co− is content of dissolved component atinfinity, Co is solubility and Cs is slow-diffusing component content.Dependence of radius of dissolving particle from time can be foundby integration of Eq. (A3) by taking udis = dR0 / dt. It is easy to showthat
R0 tð Þ ¼ffiffiffiffiffiffiffiffiffiffiffiffiffiffiffiffiffiffiffiffiffiffiffiffiffiffiffiffiffiffiffiffiffiffiffiffiffiffiffiffiffiffiffiffiffiffiffiR0 0ð Þ2−2D C0−C1ð Þρl
Cs−C0ð Þρst
sðA4Þ
Forfinite distance between crystalsfiniteR1 should be kept, resultingin the model similar to the communicating neighbors. Diffusive fluxfrom the dissolved particles immersed in the finite shell of the meltapproximately (R0 is indeed lessen) equals
q ¼ exp −6DR0t
R0 þ 2R1ð Þ R1−R0ð Þ2 !
C1−C0ð ÞR1
R1−R0ð ÞR0ðA5Þ
It is obvious that at t = 0 and R1 = ∞ formula (A5) transforms intoEq. (A3).
Appendix B. Influence of the settling flow on the dissolution rate
At diffusion control the maximum dissolution rate is associatedwith large curvature (small particles or sharp edges of large ones). Ifmelt has low enough viscosity crystals settle with appreciable velocity,diffusion mass-transfer is accelerated for the larger sinking particles.Diffusion field around sinking particle is affected by the Stokes liquidflow resulting in the increasing of the concentration gradients at

1009A.G. Simakin, I.N. Bindeman / Journal of Volcanology and Geothermal Research 177 (2008) 997–1010
the particle surface and enhancing of the dissolution rate. The totaldiffusive flux from the settling particle scaled on the half of the steadydiffusive flux from fixed sphere of the same diameter is calledSherwood number (She). The total flux (J) is integral of the local flux(q) over the particle surface:
q ¼ −DACAr
� �; J ¼ ∫∫
Sqds ðB1Þ
Reference diffusive flux is defined as
Jo ¼ D Cg−Co� �
S2R
; ðB2Þ
where S is surface of the particle, Cg is dissolving componentconcentration on the surface, C0 is content in the infinity, then non-dimensional Sherwood number is:
She ¼ J=SΔCD=2R
ðB3Þ
At the negligible flow Sherwood number becomes She = 2.Influence of flow can be estimated via parametric dependence of ShefromPeclet number equals settling rate scaled on the diffusion velocityscale:
Pe ¼ RVsed=D
For lowReynolds numbers (low velocity of flowallows to neglect withinertia effects in the liquid flow) and low Peclet numbers (0 b Pe b 1000)Brauer and Schmidt-Traub (1973) theoretically found relationship:
She ¼ 2þ 0:333Pe0:840
1þ 0:331Pe0:507; ðA2Þ
where Stokes sedimentation velocity Vsed = 2R2Δρsl / 9η can be used.This relationship is in agree with low Pe limit: She = 2 + aPe and highPe limit She = aPe1/3 derived in Bowman et al. (1961) and Friedlander(1957).
To estimate influence of the settling effect on the dissolution rate inthe silicic melt we set viscosity η = .105 poise and calculate Sherwoodnumber for zircon and quartz crystals with variable size (see Fig. 5). Inthe size range of interest effect of the flow is weak enough to neglectwith it as the first approximation.
References
Acosta-Vigil, A., London, D., Morgan VI, G.B., Dewers, T.A., 2006. Dissolution of quartz,albite, and orthoclase in H2O-saturated haplogranitic melt at 800°C and 200MPa:diffusive transport properties of granitic melts at crustal anatectic conditions.J. Petrol. 47 (2), 231–254.
Annen, C., Sparks, R.S.J., 2002. Effects of repetitive emplacement of basaltic intrusions onthermal evolution andmelt generation in thecrust. Earth Planet. Sci. Lett. 203, 937–955.
Anderson, A.T., Davis, A.M., Lu, F., 2000. Evolution of Bishop Tuff rhyolitic magma basedon melt and magnetite inclusions and zoned phenocrysts. J. Petrol. 41, 440–473.
Ayers, J.C., Delacruz, K., Miller, C., Switzer, O., 2003. Experimental study of zirconcoarsening in quartzite – H2O at 1.0GPa and 1000°C, with implications forgeochronological studies of high-grade metamorphism. Am. Mineral. 88, 365–376.
Baker, D.R., 1991. Interdiffusion of hydrous dacitic and rhyolitic melts and the efficacy ofrhyolite contamination of dacitic enclaves. Contrib. Mineral. Petrol. 106, 462–473.
Bindeman, I.N., 2003. Crystal sizes in evolving silicic magma chambers. Geology 31,367–370.
Bindeman, I.N., 2005. Fragmentation phenomena in populations of magmatic crystals.Am. Mineral. 90 (11–12), 1801–1815.
Bindeman, I.N., Fu, B., Kita, N., Valley, J.W., 2008. Origin and evolution of Yellowstonesilicic magmatism based on ion microprobe analysis of isotopically-zoned zircons.J. Petrol. 49, 163–193.
Blundy, J., Cashman, K., Humphreys, M., 2006. Magma heating by decompression-driven crystallization beneath andesite volcanoes. Nature 443 (7107), 76–80.
Bowman, C.W., Ward, D.M., Johnson, A.I., Trass, O., 1961. Mass transfer from fluid andsolid spheres at low Reynolds numbers. Can. J. Chem. Eng. 2, 9–13.
Brandeis, G., Marsh, B.D.,1989. The convective liquidus in a solidifyingmagma chamber:a fluid dynamic investigation. Nature 339, 613–616.
Brauer, H., Schmidt-Traub, H., 1973. Kopplung von Stofftransport und chemischerReaktion an Platten und Kugeln sowie in Poren. Chem. Ing. Technik 45, 341–344.
Cabane, H., Laporte, D., Provost, A., 2001. Experimental investigation of the kinetics ofOstwald ripening of quartz in silicic melts. Contrib. Mineral. Petrol. 142, 361–373.
Cabane, H., Laporte, D., Provost, A., 2005. An experimental study of Ostwald ripening ofolivine and plagioclase in silicate melts: implications for the growth and size ofcrystals in magmas. Contrib. Mineral. Petrol. 150 (1), 37–53.
Cashman, K.V., Ferry, J.M., 1988. Crystal size distribution (CSD) in rocks and the kineticsand dynamics of crystallization. 3. Metamorphic crystallization. Contrib. Mineral.Petrol. 99 (4), 401–415.
Cashman, K.V., Marsh, B.D., 1988. Crystal size distribution (CSD) in rocks and the kineticsanddynamics of crystallization. 2.Makaopuhi lava lake. Contrib.Mineral. Petrol. 99 (3),292–305.
Cheng, H., Zhou, Z., Nakamura, E., 2008. Crystal-size distribution and composition ofgarnets in eclogites from the Dabie orogen, central China. Am.Mineral. 93, 124–133.
Davidson, J.P., Morgan, D.J., Charlier, B.L.A., 2007. Isotopic microsampling of magmaticrocks. Elements 3 (4), 253–259.
Djamarani, K.M., Clark, I.M., 1997. Characterization of particle-size based on fine andcoarse fractions. Powder Technol. 93, 101–108.
Donaldson, C.H., 1976. Experimental investigation of olivine morphology. Contrib.Mineral. Petrol. 57 (2), 187–213.
Eberl, D.D., Kile, D.E., Drits, V.A., 2002. On geological interpretations of crystal sizedistributions: constant vs. proportionate growth. Am.Mineral. 87 (8–9), 1235–1241.
Friedlander, S.K., 1957. Mass and heat transfer to single spheres and cylinders at lowReynolds numbers. AIChE J. 3, 43–48.
Gualda, G.A.R., 2006. Crystal size distributions derived from 3D datasets: sample sizeversus uncertainties. J. Petrol. 47 (6), 1245–1254.
Gualda, G.A.R., Rivers, M., 2006. Quantitative 3D petrography using x-ray tomography:application to Bishop Tuff pumice clasts. J. Volcanol. Geotherm. Res. 154, 48–62.
Gualda, G.A.R., Cook, D.L., Chopra, R., Qin, L., Anderson Jr., A.T., Rivers, M., 2004.Fragmentation, nucleation and migration of crystals and bubbles in the Bishop TuffRhyolitic Magma. Transactions of the Royal Society of Edinburgh: Earth Sciences.Special volume, 5th Hutton Symposium on the Origin of Granites and RelatedRocks, pp. 358–375.
Hammer, J.E., 2004. Crystal nucleation in hydrous rhyolite: experimental data applied toclassical theory. Am. Mineral. 89 (11–12), 1673–1679.
Harrison, T.M., Watson, E.B., 1983. Kinetics of zircon dissolution and zirconium diffusionin granitic melts of variable water-content. Contrib. Mineral. Petrol. 84 (1), 66–72.
Higgins,M.D.,1998. Origin of anorthosite by textural coarsening: quantitativemeasurementsof a natural sequence of textural development. J. Petrol. 39, 1307–1323.
Higgins, M.D., 2006. Quantitative textural measurements in igneous and metamorphicpetrology. Cambridge University Press. 270 pp.
Higgins, M.D., Roberge, J., 2003. Crystal size distribution of plagioclase and amphibolefrom Soufriere Hills Volcano Montserat: evidence for dynamic crystallization —
textural coarsening cycles. J. Petrol. 44 (8), 1401–1411.Hort, M., 1998. Abrupt change inmagma liquidus temperature because of volatile loss or
magma mixing: effects on nucleation, crystal growth and thermal history of themagma. J. Petrol. 39, 1063–1076.
Hoskin, P.W.O., Schaltegger, U., 2003. The composition of zircon and igneous andmetamorphic petrogenesis. In: Hanchar, J.M., Hoskin, P.W.O. (Eds.), Zircon. Rev.Mineral. Geochem., vol. 53, pp. 27–62.
James, P.F., 1985. Kinetics of crystal nucleation in silicate glasses. J. Non-Cryst. Solids 73,517–540.
Jackson, K., Uhlmann, D., Hunt, J., 1967. On the nature of crystal growth from the melt.J. Cryst. Growth 1, 1–36.
Jerram, D.A., Davidson, J.P., 2007. Frontiers in textural and microgeochemical analysis.Elements 3 (4), 235–238.
Johannes, W., Holtz, F., 1996. Petrogenesis and Experimental Petrology of Granitic Rocks.Springer Verlag, Berlin-Heidelberg.
Kile, D.E., Eberl, D.D., 2003. On the origin of size-dependent and size-independentcrystal growth: influence of advection and diffusion. Am. Mineral. 88 (10),1514–1521.
Kolmogorov, A.N.,1941. On the lognormal distribution law of the dimensions of particlesunder pulverization. Dokl. Akad. Sci. USSR 31, 99–101.
Lasaga, A.C., 1998. Reaction kinetics in geosciences. Princeton University Press, Princeton,New Jersey. 811 p.
Lifshitz, I.M., Slyozov, V.V., 1961. The kinetics of precipitation from supersaturated solidsolution. J. Phys. Chem. Solids. 19, 35–50.
Lofgren, G.E., 1980. Experimental studies on the dynamic crystallization of silicatemelts. Physics of Magmatic Processes. Princeton University Press, pp. 487–551.
Marsh, B.D., 1988. Crystal size distribution (CSD) in rocks and the kinetics and dynamicsof crystallization .1. Theory. Contrib. Mineral. Petrol. 99 (3), 277–291.
Marsh, B.D., 1989. Magma chambers. Annu. Rev. Earth Planet. Sci. 17, 439–474.Marsh, B.D., 1998. On the interpretation of crystal size distributions in magmatic
systems. J. Petrol. 39, 553–599.Mock, A., Jerram, D.A., Breitkreuz, C., 2003. Using quantitative textural analysis to
understand the emplacement of shallow-level rhyolitic laccoliths — a case studyfrom Halle volcanic complex, Germany. J. Petrol. 44, 833–849.
Mourtada-Bonnefoi, C.C., Laporte, D., 2004. Kinetics of bubble nucleation in a rhyolitic melt:an experimental study of the effect of ascent rate. Earth Planet. Sci. Lett. 218 (3–4),521–537.
Nemchin, A.A., Giannini, L.M., Bodorkos, S., Oliver, N.H.S., 2001. Ostwald ripening as apossible mechanism for zircon overgrowth formation during anatexis: theoreticalconstraints, a numerical model, and its application to pelitic migmatites of theTickalara Metamorphics, northwestern Australia. Geochim. Cosmochim. Acta 65 (16),2771–2787.

1010 A.G. Simakin, I.N. Bindeman / Journal of Volcanology and Geothermal Research 177 (2008) 997–1010
Peppard, B.T., Steele, I.M., Davis, A.M., Wallace, P.J., Anderson, A.T., 2001. Zoned quartzphenocrysts from the rhyolitic Bishop Tuff. Am. Mineral. 86, 1034–1052.
Poldervaart, A., 1956. Zircon in rocks: 2. Igneous rocks. Am. J. Sci. 254, 521–554.Putirka, K., Tepley, F. (Editors). (in press) Minerals, Inclusions and Volcanic Processes.
Reviews in Mineralogy and Geochemistry.Scott, A.S., 2003. The method of characteristics with applications to conservation laws.
J. Online Math. Appl. (JOMA) 3 February 2003.Simakin, A.G., Chevychelov, V.Yu., 1995. Experimental study of Fsp crystallization from
the granite melt with different water content. Geochemistry 2, 216–238.Simakin, A.G., Botcharnikov, R., 2001. Degassing of stratified magma by compositional
convection. J. Volcanol. Geotherm. Res. 105, 207–224.Tammann, G., 1898. Uber die Abhangigkeit der Zajl der Kerne. Z. Phys. Chem. 25,
441–479.
Sunagawa, I., 1984. Growth of crystals in Nature. Materials of the Earth's Interior. Tokyo.TERRAPUB. 63–105pp.
Wark, D., Watson, E.N., 2006. TitaniQ: a titanium-in-quartz geothermometer. Contrib.Mineral. Petrol. 152 (6), 743–754.
Wark, D.A., Spear, F.S., Cherniak, D.J., Watson, E.B., 2007. Pre-eruption recharge of theBishop magma system. Geology 35 (3), 235–238.
Watson, E.B., Harrison, T.M., 1983. Zircon saturation revisited: temperature and composi-tional effects in a variety of crustal magma types. Earth Planet. Sci. Lett. 64, 295–304.
Watson, E.B., Harrison, T.M., 2005. Zircon thermometer reveals minimum meltingconditions on earliest Earth. Science 308 (5723), 841–844.
Zhang, Y.X., Walker, D., Lesher, C.E., 1989. Diffusive crystal dissolution. Contrib. Mineral.Petrol. 102, 492–513.