evolution of it, management and industrial engineering
TRANSCRIPT

Scientia Iranica E (2021) 28(3), 1830{1852
Sharif University of TechnologyScientia Iranica
Transactions E: Industrial Engineeringhttp://scientiairanica.sharif.edu
Evolution of IT, management and industrialengineering research: A topic model approach
M. Rabieia, S.-M. Hosseini-Motlagha;�, A. Haeria, and B. Minaei Bidgolib
a. School of Industrial Engineering, Iran University of Science and Technology (IUST), University Ave. Narmak, 16846-13114,Tehran, Iran.
b. School of Computer Engineering, Iran University of Science and Technology (IUST), University Ave. Narmak, 16846-13114,Tehran, Iran.
Received 15 May 2019; received in revised form 24 July 2019; accepted 22 February 2020
KEYWORDSResearch evolution;Topic modeling;Trend analysis;InformationTechnology (IT);Industrial engineering;Management.
Abstract. Information Technology (IT), management and industrial engineering arecorrelated academic disciplines whose publications have risen signi�cantly over the lastdecades. The aim of this study is to analyze the research evolution, determine the importanttopics and areas, and depict the trend of interdisciplinary topics in these domains. Toaccomplish this, text mining techniques are used and a combination of bibliographic analysisand a topic modeling approach are applied to relevant publications in the Web of Science(WoS) repository over the last 20 years. In the topic extraction process, a heuristicfunction was suggested for key extraction, and some new applicable criteria were de�ned tocompare the topics. Moreover, a novel approach was proposed to determine the high-levelcategory for each topic. The results determined the hot-important topics, and incremented,decremented and �xed topics are identi�ed. Subsequently, a comparison between high-levelresearch areas con�rmed strong scienti�c relationships between them. This study presentsa deep knowledge about the internal research evolution of domains and illustrates the e�ectof topics on each other over the past 20 years. Furthermore, the methodology of this studycould be applied to determine interdisciplinary topics and observe the research evolutionof other academic domains.© 2021 Sharif University of Technology. All rights reserved.
1. Introduction
Management, Information Technology (IT) and Indus-trial Engineering are academic research disciplines witha high amount of correlation. In many universities,Industrial Engineering and Management are blendedtogether and consist of both engineering programs
*. Corresponding author. Tel.: +98 21 73225000-1;Fax: +98 21 73225098E-mail addresses: mo [email protected] (M. Rabiei);[email protected] (S.-M. Hosseini-Motlagh);[email protected] (A. Haeri); b [email protected] (B.Minaei Bidgoli)
doi: 10.24200/sci.2020.53582.3312
(e.g. mathematics, engineering analysis and design,manufacturing processes, and quality assurance andcontrol) and managerial courses (e.g. cost analysis,Human Resources (HR), and business and marketing).
The close link between Industrial engineering andmanagement has led to the creation of business schoolsand some new academic disciplines, such as MBA de-grees, in top U.S. universities and institutes, to producee managers trained in the new science of businessadministration [1]. On the other hand, IT and com-puter science have been regarded as undeniable partsof these disciplines. Porter and Rafols [2] illustratedthat science is indeed becoming more interdisciplinaryand the connections between distant cognitive areas aremodestly increasing.

M. Rabiei et al./Scientia Iranica, Transactions E: Industrial Engineering 28 (2021) 1830{1852 1831
The strength of linkage between these domainsand the dramatic growth of their publications overthe last decades [3{7] has created a diversity ofresearch into several investigative lines and has ledto constructing new paradigms in the research areasof these domains [5,8]. Creation of new paradigmscreates di�culty for researchers and policymakers inunderstanding and monitoring the evolution of theserelated domains.
The aim of this study is the analysis of theevolution of Management, Industrial Engineering, andIT studies and determination of the important topicsand trends of each domain over the last 20 years.Moreover, this research tries to illustrate the growth,decline and change in common research areas in thesethree interrelated domains in a single window. Todo this, a hybrid method and some new criteriaare introduced to make the inter-relation and intra-relation of the research domains and topics visible andcomparable. The results of the present investigationare applicable for scholars, students, journal editorsand scienti�c policymakers of these three domains, inorder to analysis the historical evolution and futuredevelopment of these disciplines. They could use theresults of this study to obtain a deep knowledge aboutthe most important topics and extract the commontopics which bind these areas together. The methodand process of analyzing the correlated research domainin this study are also applicable to other domains.
The structure of this research is as follows: In thenext section, the previous scientometric studies in thesedomains are reviewed. Then, the methodology of thisresearch is described. After that, a bibliographic anal-ysis of relevant publications is presented. In the \Topicmodeling" section, the steps of topic modeling areexplained. Then, the results of the previous section arereported and discussed in the \Results and discussion"section. Finally, the main conclusions are summarizedand some suggestions for future studies are outlined.
2. Literature review
Wagner et al. [9,10] claim that interdisciplinary re-search (IDR) derives from a typology presented at the�rst international conference on IDR and teaching in1970. They also believe that IDR could be consideredas an evolution, rather than a state. Therefore, many ofstudies have been undertaken to illustrate the evolutionof science in the various domains.
More than half century ago, direct citation link-ages were used to show the evolutionary pathwayswithin a research [11]. Later, Small [12] clustered thehighly co-cited documents to detect the hot topics.Co-citation is not the only clustering approach thathas been used to identify emerging topics. Usingbibliographic information is another common method
that is applied widely to detect the emerging topicsin a domain. Refs. [4,13,14] are just some cases ofthis method. In recent years, some studies appliedtext mining or a topic modeling approach to detectimportant topics in the research studies [15{19].
Furrer et al. [20] used the content analysis methodto investigate the strategic management research pub-lished in 1980{2005, and illustrated the relationshipsbetween the sub�elds of strategic management. Theythen depicted the evolution of the literature in �veperiods of time. The bibliographic analysis is appliedto the forty year publication of the Computers &Industrial Engineering (CIE) journal for identi�cationof the leading topics, institutions and countries inthe industrial engineering domain [21]. In anotherresearch [22], the associations between standardizationand evolution of the Information and CommunicationsTechnology (ICT) industry is examined. To do this, co-occurrence between ICT research areas and ICT stan-dards are analyzed and the relation of ICT opennessor concentration with the number of standards in thisdomain is investigated.
Studies on the evolution of the intellectual struc-ture of management as an academic discipline arelacking in the literature, and the dynamics of theinternal evolution of its research topics is also vaguefor the researchers [6]. In the same way, this gap isapparent for the IT and industrial engineering studies.In addition, the search to �nd a comprehensive researchthat compares the topics and trends of these relateddomains in a single window has had no results. Ta-ble 1 classi�es some important previous scientormetricstudies in these domains.
Regardless of the method or approach for topicdetection, which have been mentioned above, previousresearch analyses in these domains are limited tonarrow research areas or are undertaken for a speci�clocation. For example, international business [23],industrial productivity [5], supply chain resilience [24],public private partnership [14], information privacy[16], cloud computing [4], health IT [25], green build-ing based studies [26], and multiple criteria decisionmaking [27] were analyzed. In some cases, analyzingthe research status of a domain in a speci�c locationhas been considered; environmental science in Iran [28],biomedical engineering in Thailand [18] and manage-ment in Latin America and the Caribbean [6] are somesamples.
In comparison with previous studies, this researchapplies a combination of bibliographic analysis and atopic modeling approach to identify hot and importanttopics and to monitor the evolution of internal researchlines in three correlated domains. In addition, becauseof the close relationship between management, indus-trial engineering and IT disciplines, the scope of thisstudy is wide and all three domains are considered.

1832 M. Rabiei et al./Scientia Iranica, Transactions E: Industrial Engineering 28 (2021) 1830{1852
Table 1. Previous scientometric studies in these domains.
Domain Method Sources Duration Ref.
General science Citation Analysis SCI-EXPANDED 1970{1974 [12]Green building based Citation & Bibliographic Analysis Web of Science 2002{2018 [26]Cloud computing Bibliographic Analysis Scopus 2008{2013 [4]Antarctic Bibliographic Analysis SCI-EXPANDED 1900{2012 [13]Public-private partnership Bibliographic Analysis Scopus 1990{2013 [14]Industrial engineering Bibliographic Analysis Journal of CIE 1976{2016 [21]Medical big data Bibliographic Analysis Web of Science 1991{2017 [29]MCDM Bibliographic Analysis Web of Science 1993{2018 [27]Supply Chain Resilience (SCR) Bibliographic & Content Analysis Google Scholar & Scopus 2002{2017 [24]Strategic management Content Analysis Four related Journals 1980{2005 [20]ICT Content Analysis Korean patents & standards 1977{2010 [22]Management in Latin America Content Analysis Web of Science 1988{2013 [6]International Business (IB) Content Analysis Top eight IB journals 1991{2015 [23]
Industrial productivity Content Analysis & Interviews Scopus 1970{2013 [5]
Biomedical engineeringBibliographic Analysis &Topic Modeling
Scopus 1980{2010 [18]
Information privacy Topic Modeling Scopus 1972{2015 [16]Big data in marketing Topic Modeling Science Direct 2010{2015 [15]7 scienti�c areas Topic Modeling Web of Science Not Given [19]Statistics Topic Modeling Three related journals 2000{2010 [17]
This study will try to answer these questions:What are the bibliographic characteristics of researchstudies in these three domains over the past 20 years?What are the important topics in each domain? Whathappened to important topics of each domain within20 years? Which high-level research areas are coveredalone by these domains or what do they have incommon with them?
3. Methodology
To make the corpus of publication for management,industrial engineering, and IT domains, the Web ofScience (WoS) repository was used. The WoS isa quality controlled repository which is used as adata source to make the corpus in a wide rangeof scientometric studies [6,19,26,27,29,30]. At the�rst step, in order to choose an appropriate datasetfor each domain and after consulting with domainexperts, some indicator terms are selected for theOrganization and the Sub organization �elds of WoS.To do this, \information", \computer", \knowledge",and \software" are used as indicators of organizations'names that have done research in the IT domain.
In the same way, \industr�" and \management�" aresearched, respectively, as indicators of the industrialengineering and the management domains. All queriesare restricted to the English language and Articlespublished in the last 20 years (from 1998 to 2017).Moreover, documents that are indexed in the ScienceCitation Index Expanded (SCI-EXPANDED) or theSocial Science Citation Index (SSCI) are considered.The result of this query contains a large number ofarticles from various subject categories. To makethe results more homogenous and avoid the e�ects ofoutlier data, the top 20 WoS subject categories of eachdomain are identi�ed. Every journal and book coveredby WoS is assigned to at least one of the subjects listedin this category [31]. Using WoS subject categoriesin the process of dataset selection is widely used inscientometric analysis studies [14,32{35]. Table 2reports these subject categories for each domain. Inthis table, \#" and \%" indicate, respectively, thenumber and percentage of articles covered by eachcategory. Obviously, some articles are assigned to morethan one subject and some subjects are common forboth or all three of the domains. Therefore, the sumof the \%" column is more than 100. Consequently, 43

M. Rabiei et al./Scientia Iranica, Transactions E: Industrial Engineering 28 (2021) 1830{1852 1833
Table 2. Top 20 Web of Science (WoS) subject categories for each domain.
Mng Ind ITWoS categories # % # % # %
1 Engineering, Industrial 13999 4.0 72165 83.7 { {2 Operations research management science 26533 7.6 30046 34.8 1063 2.43 Management 3347 12.4 7954 9.2 { {4 Engineering, Manufacturing 9016 2.6 27961 32.4 { {5 Environmental sciences 27434 7.8 { { { {6 Economics 23024 6.6 2673 3.1 { {7 Business 24107 6.9 { { { {8 Computer Science, Interdisciplinary Applications 9111 2.6 9895 11.5 2441 5.59 Computer Science, Information Systems 10601 3.0 { { 6919 15.510 Computer Science, Arti�cial Intelligence 10432 3.0 { { 5767 13.011 Engineering, Electrical & Electronic 9088 2.6 - - 6159 13.812 Psychology, Applied 7919 2.3 6744 7.8 { {13 Industrial Relations & Labor - - 13068 15.2 { {14 Public, Environmental & Occupational Health 12008 3.4 { { 923 2.115 Ecology 11918 3.4 { { { {16 Materials Science, Multidisciplinary { { 11236 13.0 { {17 Water resources 10302 2.9 { { { {18 Health Care sciences & Services 9119 2.6 { { 893 2.019 Environmental studies 8602 2.5 { { { {20 Engineering, Environmental 8272 2.4 { { { {21 Business, Finance 8068 2.3 { { { {22 Ergonomics { { 7729 9.0 { {23 Health Policy & Services 7264 2.1 { { { {24 Computer Science, Software Engineering { { { { 7019 15.825 Computer Science, Theory & Methods { { { { 6715 15.126 Engineering, Multidisciplinary { { 3604 4.2 987 2.227 Psychology { { 3695 4.3 { {28 Multidisciplinary sciences - - 2199 2.6 1061 2.429 Engineering, Civil { { 3098 3.6 { {30 Telecommunications { { { { 3075 6.931 Business { { 2828 3.3 { {32 Computer Science, Hardware & Architecture { { { { 2255 5.133 Construction & Building Technology - { 2249 2.6 { {34 Automation & Control Systems { { 1354 1.6 806 1.835 Mathematics, Applied { { { { 2033 4.636 Statistics & Probability { { 1811 2.1 { {37 History { { 1348 1.6 - {38 Robotics { { 1291 1.5 - {39 Mathematics { { { { 846 1.940 Mathematics, Interdisciplinary Applications { { { { 807 1.841 Mathematical & Computational Biology { { { { 697 1.642 Medicine, General & Internal { { { { 690 1.643 Information Science & Library Science { { { { 672 1.544 Other categories 142636 40.7 12217 14.1 13868 31.0

1834 M. Rabiei et al./Scientia Iranica, Transactions E: Industrial Engineering 28 (2021) 1830{1852
unique subject categories are identi�ed and the resultsof previous queries are restricted to these categories.
The results of the above queries contain articleswith a variety of citations. Some have been cited morethan 1000 times. In contrast, many articles have notyet received any citation. To balance this heterogeneityand to ensure repeatability of the paper, which isan indicator of the accuracy of its information [36],Total Citation (TC) is applied. The TC is one of themost corresponding indicators in bibliographic analyses[5,12,13,32]. Therefore, this paper has concentrated onthe �rst quarter of the most cited articles. Because ofthe accumulative feature of TC, the papers which werepublished in recent years will have a lower portion ofthe results. To solve this problem, a quarter of themost cited articles published in the last 4 years areextracted separately for each year. For the last year,if the number of papers which have been cited is lessthan 25% of all papers, only the cited articles are con-sidered. Finally, duplicated records in each domain areremoved and the \Mng" dataset (73,840 documents)for the management domain, the \Ind" dataset (25,687documents) for the industrial engineering domain, andthe \IT" dataset (10,246 documents) for the IT domainare constructed. The schematic for data selection isshown in Figure 1.
The combination of bibliographic analysis andtopic modeling is applied in this study to extract thetopics and monitor the research evolution in these threedomains. Topic models are probabilistic models thatcould observe the terms from a generative probabilisticprocess and the hidden topics are identi�ed usingposterior inference from a textual corpus [37]. Topicdiscovery, document clustering, information retrieval,and predicting in uential research studies are justsome examples of topic modeling applications [38]. Inthis respect, there are various algorithms for topicmodeling. The �rst one was presented as Latent
Semantic Analysis (LSA) [39] and, after one year, theProbabilistic Latent Semantic Analysis (PLSA) [40]was proposed. Latent Dirichlet Allocation (LDA) [41]was presented to solve the over �tting problem of PLSAand some derivatives of LDA, such as HierarchicalLatent Dirichlet Allocation (HLDA) [42], CorrelatedTopic Models (CTM) [43], and Relational Topic Mod-eling (RTM) [44], have been proposed in recent years toaddress some constraints in the LDA. In this paper, theLDA algorithm is relied upon because it provides morethan a topic explanation for each paper. Additionally,the overlapping between topics that are extracted byLDA helps one to �nd the topic correlations, whichis one of the main goals of this study. All analysesare undertaken using R software, which is one of themost powerful tools for data and text mining, statisticalanalysis, and Natural Language Processing (NLP).Figure 2 shows the steps of the methodology of thisresearch.
4. Bibliographic analysis
Table 3 shows the top 10 countries based on thea�liation of publications on the selected datasets. Inthis case, if the authors of the same paper come fromdi�erent countries, that paper is counted separately foreach country. Therefore, the sum of the number of allcountries is more than the total number of papers inthe corpora.
As is shown in Table 3, USA, China, England,Canada, and Taiwan are the 5 top countries in theresearch of both management and industrial engineer-ing domains. In the IT domain, China has taken �rstposition, with the USA, Canada, Germany, and Francefollowing. An important note is that either Americaor China is present in about 50% of the highly citedpapers and American researchers participate in 45% ofthe highly cited management papers.
Figure 1. Schematic of dataset selection for each domain.

M. Rabiei et al./Scientia Iranica, Transactions E: Industrial Engineering 28 (2021) 1830{1852 1835
Figure 2. The steps of the research method.
Table 3. Top 10 countries based on the a�liation of publications in each domain.
Mng Ind ITCountry # % Country # % Country # %
USA 33390 45 USA 7600 30 China 3100 30China 10167 14 China 3173 12 USA 2864 28
England 8390 11 England 2524 10 Canada 1428 14Canada 5654 8 Canada 1560 6 Germany 1068 10Taiwan 5449 7 Taiwan 1354 5 France 1034 10
Germany 5109 7 France 1259 5 England 911 9Italy 4838 7 South Korea 1090 4 Spain 543 5
France 4471 6 Australia 1064 4 Italy 484 5South Korea 2637 4 Denmark 1014 4 Norway 442 4
Australia 2544 3 Germany 1012 4 Denmark 344 3Others 42858 58.0 Others 13254 51.5 Others 7001 68.3
Table 4 lists the top 5 countries with the highestgrowth rate in the number of publications in eachdomain. This table reports the number of publicationsin four periods of time. The top countries are identi�edamong those that have at least 1% of publications ofa domain and their Growth Rate is maximized. TheGrowth Rate is de�ned as the amount of publicationin the last period divided by the �rst periods' publica-tions.
As seen in Table 4, China and France are identi-�ed as countries with the highest growth in all threedomains. Spain, Italy, and Iran are also marked ashigh growth countries in management and industrialengineering science. A fact to consider is that Iran, asa developing country, is identi�ed as having more than
54% and 13% growth in management and industrialengineering domains, respectively.
Analyzing the journal names of the datasetsindicates that 3572 journals are present in the selecteddatasets. In this list, some journals such as JAMA, Sci-ence, Nature, Strategic Management Journal, and NewEngland Journal of Medicine have the highest numberof articles with more than 500 citations. Table 5 showsthe top 10 journals based on the number of articles ineach domain.
Moreover, there are 82 journals that containarticles in all three domains. Table 6 presents the top5 journals with the most articles in all three domains.
WoS uses two �elds to cover the document key-words. The �rst one is DE (Descriptor) that contains

1836 M. Rabiei et al./Scientia Iranica, Transactions E: Industrial Engineering 28 (2021) 1830{1852
Table 4. Top 5 countries with the highest growth rate.
Domain Country 1998{2002 2003{2007 2008{2012 2013{2017 Growth rate Percent oftotal publication
Mng
Iran 10 29 334 548 54.8 1.2Italy 115 259 854 1409 12.2 3.5Spain 81 151 612 949 11.7 2.4China 636 1158 3365 5008 7.8 13.7France 164 271 890 1219 7.4 3.4
Ind
Iran 18 69 260 241 13.3 2.2China 321 443 1091 1318 4.1 12.3Spain 65 166 307 204 3.1 2.8Italy 124 200 407 359 2.8 4.2
France 154 197 375 338 2.1 4.1
IT
China 64 248 1037 1751 27.4 30.2Norway 9 28 124 100 11.1 2.5
Hong Kong 23 37 125 239 10.4 4.1France 16 26 117 139 8.7 2.9India 16 22 74 135 8.4 2.4
Table 5. Top 10 journals based on the number of articles in each domain.
Mng Ind ITJournal # Journal # Journal #
European journal ofoperational research
1434 Journal of materialsprocessing technology
4492 PLOS one 215
Expert systems withapplications
972 International journal ofproduction economics
2174 Information Sciences 179
PLOS one 936 International journal ofproduction research
1797 Journal of systems andsoftware
173
International journal ofproduction economics
887 Computers & operationsresearch
1555 IEEE transactions onsoftware engineering
144
Journal of appliedpsychology
763 Reliability engineering &system safety
1338 Expert systems withapplications
141
Journal of cleanerproduction
735 Computers & industrialengineering
1210 Neurocomputing 141
Environmental science &technology
684 IEEE transactions onindustrial informatics
778 Information and softwaretechnology
121
Management Science 661 Ergonomics 778 IEEE software 118
Journal of business ethics 624 CIRP annals-manufacturingtechnology
778 Pattern recognition 112
Tourism management 614 Safety Science 755 Knowledge-based systems 103

M. Rabiei et al./Scientia Iranica, Transactions E: Industrial Engineering 28 (2021) 1830{1852 1837
Table 6. Top 5 journals based on the most articles in all three domains.
No. Journal Mng Ind IT Total
1 Journal of materials processing technology 83 4492 9 45842 International journal of production economics 887 2174 8 30693 International journal of production research 578 1797 11 23864 Computers & operations research 417 1555 18 19725 Computers & industrial engineering 385 1210 11 1606
the authors original keywords and the second one is ID(Identi�er) or Keyword Plus that consists of words andphrases harvested from the title of the cited articles[45]. A comparative study of semantic similaritiesbetween keywords generated automatically from thedatabase and controlled vocabulary (e.g. thesaurus)illustrates that both usually cover the main conceptsin an article [46]. To extract the most frequentkeywords, author keyword (DE) and keyword plus (ID)are analyzed separately. In the analyzing process, it isfound that some keywords are presented in the datasetin both plural and singular forms (e.g. Algorithm andAlgorithms). Therefore, to solve this problem, if thesingular form of a keyword exists in the dataset, theplural form has been converted to the singular and itsfrequency changed to the sum of its plural and singularfrequencies. The comparison between the author key-words (DE) and the keyword plus (ID) shows that ID ismore generalized. The number of unique DE keywordsin all three domains is at least 1.5 times more than thenumber of unique ID keywords (106,651 versus 70,510for Mng, 39,904 versus 19,601 for Ind, and 22,850 versus14,672 for IT). Consequently, the average amount of IDfrequency is higher than DE (7.0 versus 2.6 for Mng, 5.7versus 2.3 for Ind, and 2.9 versus 1.6 for IT). Therefore,the amount of the Total column in Table 7 is a�ectedmore by ID and the result of top keywords based onTotal is almost same as the ID. Table 7 presents themost frequent keywords (DE and ID) in each domain.
As Table 7 shows, \Model", \System", \Per-formance", \Scheduling", \Genetic algorithm", and\Management" are common frequent keywords in allthree domains. Moreover, there are some keywordsthat are frequent in two domains. \Supply ChainManagement" (SCM), \Innovation", \Impact", and\Behavior" are frequent in the management and in-dustrial engineering domains. Similarly, \Design" iscommon in IT and industrial engineering and \Infor-mation" is seen in both IT and management. A noteto consider is that these common terms may have adi�erent meaning or denote di�erent concepts in dif-ferent domains. For example, the \Genetic algorithm"is widely used as an applicable tool and a solutionapproach in various areas of production and operationmanagement [47], and it is also used in a wide rangeof optimization problems in industrial engineering [48].
It is, however, used in IT and computer science as animportant concept and fundamental part of arti�cialintelligence and evolutionary algorithms [49]. In thesame way, the term \Scheduling" in management andindustrial engineering denote the time management injob scheduling or the production line. However, in theIT domain, it is often referred to the CPU or memoryallocation as a basic task of the operating system.Another consideration is the inconsistency of the term\China" as the name of a country with other keywordsin Mng. As mentioned before, \ID" is a descriptor termassigned by the author to the article. Therefore, it isnot unpredictable for Chinese authors to use \China"as a descriptor in less than 10% of their publications.
Because of the close relationship between themanagement and industrial engineering disciplines,many keywords are common in these domains. Butsome terms such as \Cloud computing", \Wireless sen-sor networks" and \Security" are identi�ed as frequentkeywords, especially for the IT domain.
5. Topic modeling
5.1. PreprocessingIn order to cluster the documents into appropriategroups (topics), each document is represented by a listof conjunct terms (bag-of-words). The quality of thisBag-of-Words (BoWs) and the process of selecting therepresentative terms are very important to the resultof clustering [38]. To generate a high quality BoWs,a method called term clumping is used. This methodincludes three steps: a) �elds selection, b) appropriateterm extraction, and c) terms cleaning [50].
In the �rst step of term clumping, the appropriate�elds are selected as a source of term extraction. Inthe scientometric studies, based on the research aimsand scopes, sometimes the descriptive �elds (Authors'Organization, Department, Journal name, Conferencename,...) or content �elds (Title, Abstract, Keywords,Results,...) or a combination of them are chosen as thesource �elds. The second step is the term extractionprocess. In this phase, the terms or phrases areextracted from the texts. After the �rst and secondsteps of term clumping, a large number of terms areextracted. Therefore, in the third step, many ofstepwise methods are prescribed for terms cleaning and

1838 M. Rabiei et al./Scientia Iranica, Transactions E: Industrial Engineering 28 (2021) 1830{1852
Table 7. Top 10 keywords based on the DE and ID in each domain.
Domain Based on DE frequencies Based on ID frequenciesKeyword DE ID Total Keyword DE ID Total
Mng
China 860 649 1509 Model 128 7936 8064Supply chain management 798 195 993 Performance 468 6200 6668Innovation 651 1866 2517 Management 192 5138 5330Climate change 589 1 590 System 30 4052 4082Genetic algorithm 518 536 1054 Impact 22 3266 3288Performance 468 6200 6668 Behavior 44 2961 3005Trust 432 728 1160 Perspective 7 2774 2781Sustainability 428 309 737 Firm 12 2334 2346Scheduling 416 0 416 Information 51 2264 2315Uncertainty 368 1012 1380 Organization 78 2170 2248Total 5528 11496 17024 Total 1032 39095 40127
Ind
Supply chain management 678 372 1050 Model 43 2735 2778Genetic algorithm 509 509 1018 System 14 2216 2230Scheduling 494 0 494 Performance 142 1911 2053Simulation 377 487 864 Design 90 1478 1568Optimization 314 845 1159 Management 39 1390 1429Heuristic 311 0 311 Algorithm 36 979 1015Microstructure 240 225 465 Optimization 314 845 1159Reliability 233 255 488 Impact 12 730 742Innovation 231 533 764 Industry 7 597 604Inventory 223 153 376 Behavior 6 590 596Total 3610 3379 6989 Total 703 13471 14174
IT
Machine learning 126 0 126 System 0 771 771Cloud computing 117 0 117 Model 18 663 681Wireless sensor net 110 59 169 Algorithm 62 577 639Data mining 106 0 106 Design 50 363 413Classi�cation 81 299 380 Classi�cation 81 299 380Genetic algorithm 81 110 191 Network 15 282 297Security 76 74 150 Information 2 263 265Scheduling 70 0 70 Management 23 258 281Support vector machine 68 70 138 Performance 50 226 276Feature selection 65 0 65 Framework 6 214 220Total 900 612 1512 Total 307 3916 4223
reducing the huge dataset to a more meaningful anduser-friendly dataset. These methods are: applyinga thesaurus for removing common terms (stop words,non-alphabetic characters, and meaningless terms),using NLP techniques to combine terms with a similarstructure (e.g. stemming terms, eliminating pluralforms of the words, and coordinating di�erent spelling),combining (removing the top general terms, replacingsimilar terms with shorter ones, and term clustering),
pruning (eliminating the terms which appear in a singlerecord), screening (e.g. using Term Frequency (TF)as a weighting method for screening the common andunimportant terms), and �nally, the clustering step(using dimension-reduction tools such as PCA (Princi-pal Component Analysis) or term relevancy detectionmodels such as Topic Modeling to dramatically reducethe number of terms) [50].
In this study, in the term clumping phase, to
M. Rabiei et al./Scientia Iranica, Transactions E: Industrial Engineering 28 (2021) 1830{1852 1839
construct an appropriate BoW for each document, thefocus was on keywords (DE and ID). The challengeis the managing of missing values. In about 20% ofrecords (24% of Mng, 19% of Ind and 25% of IT) theDE �eld is null, and in about 15% of records (7%of Mng, 17% of Ind and 20% of IT) the ID has novalue. Choosing a combination of ID and DE createsthe better condition, but the result is not satisfactory(2% of Mng, 3% of Ind and 7% of IT still are missing).To resolve this problem, a keyword extraction methodis required to extract BoW from the title of articles.There are several automated or semi-automated waysproposed for keyword extraction. These ways arecomplicated and some are based on expert knowledgeor require domain speci�c thesauri or ontologies [51,52],and some need a large corpus of the related text tolearn the semantic of terms [53,54]. To avoid thesecomplexities, a simple heuristic key extraction functionis developed in this study. Because of the length andnature of the title and keywords, the terms that occurin these �elds are more valuable than those seen in theabstract. Therefore, this function constructs a BoWset for each document from its keywords or title. Theextracted terms should exist in a prede�ned dictionary(Dic). This dictionary consists of all the DE andID which are edited (e.g. eliminating punctuation,converting plural terms to singular and so on) tobecome more valuable. To extract the keywords fromthe title, the biggest adjacent sequence of words (n-gram) that existed in the Dic is considered. An n-gram is a contiguous sequence of n items from a text orspeech. The idea comes from the fact that the greaterthe number of components of a phrase (n), the moreimportant it is [55]. In this approach, a term is locatedin the BoWs of a record if it exists in the ID or theDE keywords. In cases where both ID and DE areempty, the Term is selected as BoW if it is a part ofthe document's title and exists in the Dic and thereis not another term (Term0) with the above conditionsand the biggest n in its n-gram. The BoWs for record iis de�ned formally by Eq. (1) as shown in Box I. Afterusing the above key extraction function and makinga BoWs for each record, almost every record of alldomains are covered by at least one keyword (99.99%of Mng, 99.99% of Ind and 99.94% of IT).
5.2. The input parameters for LDAThe �rst input object of LDA is a document-term-
matrix that contains the TF value of each term for eachdocument that describes the frequency of terms thatoccur for a document in the corpus. In this matrix,rows correspond to documents (papers) and columnsdenote terms. To avoid using scarce terms, the termswhich have been seen more than 5 times in the BoWsset are selected.
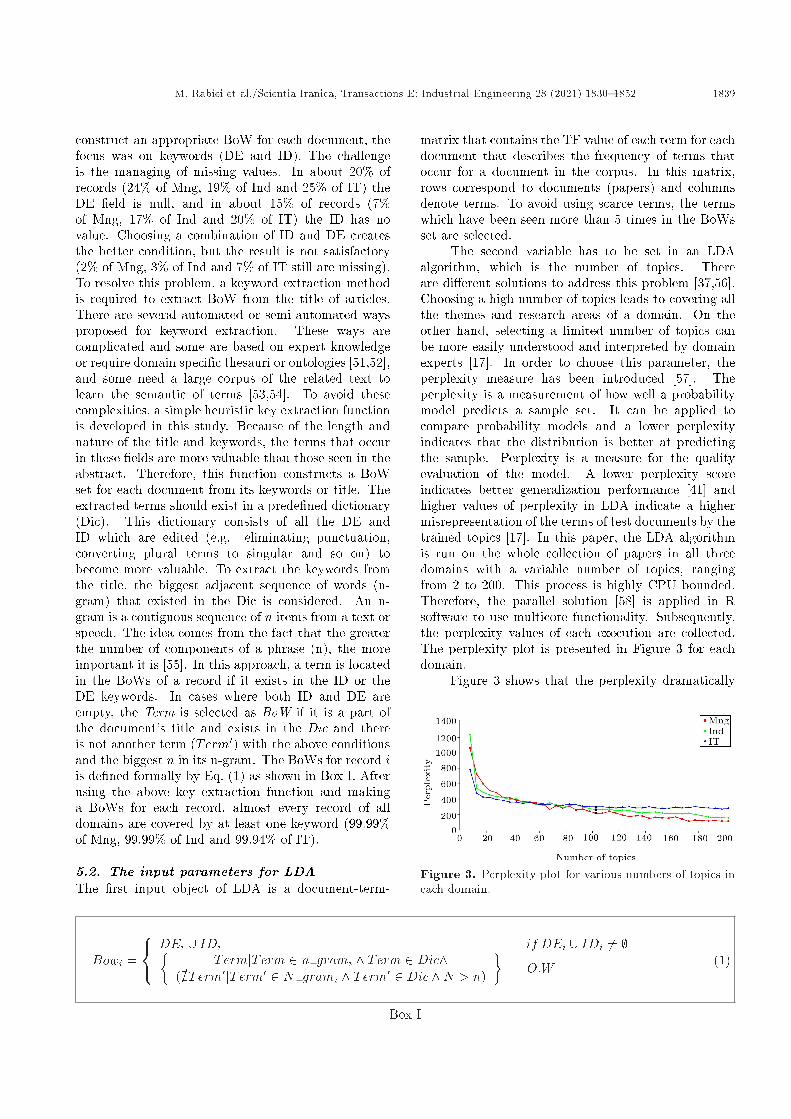
The second variable has to be set in an LDAalgorithm, which is the number of topics. Thereare di�erent solutions to address this problem [37,56].Choosing a high number of topics leads to covering allthe themes and research areas of a domain. On theother hand, selecting a limited number of topics canbe more easily understood and interpreted by domainexperts [17]. In order to choose this parameter, theperplexity measure has been introduced [57]. Theperplexity is a measurement of how well a probabilitymodel predicts a sample set. It can be applied tocompare probability models and a lower perplexityindicates that the distribution is better at predictingthe sample. Perplexity is a measure for the qualityevaluation of the model. A lower perplexity scoreindicates better generalization performance [41] andhigher values of perplexity in LDA indicate a highermisrepresentation of the terms of test documents by thetrained topics [17]. In this paper, the LDA algorithmis run on the whole collection of papers in all threedomains with a variable number of topics, rangingfrom 2 to 200. This process is highly CPU bounded.Therefore, the parallel solution [58] is applied in Rsoftware to use multicore functionality. Subsequently,the perplexity values of each execution are collected.The perplexity plot is presented in Figure 3 for eachdomain.
Figure 3 shows that the perplexity dramatically
Figure 3. Perplexity plot for various numbers of topics ineach domain.
Bowi =
8<: DEi [ IDi if DEi [ IDi 6= ;�TermjTerm 2 n grami ^ Term 2 Dic^
(/9Term0jTerm0 2 N grami ^ Term0 2 Dic ^N > n)
�O:W (1)
Box I

1840 M. Rabiei et al./Scientia Iranica, Transactions E: Industrial Engineering 28 (2021) 1830{1852
decreases from 5 topics to 20 topics. Then, thedecrement continues slowly from 20 to 100 topics andbecomes more or less stable for values higher than 100.Since it is preferred to have a low level of perplexity;on the other hand, keeping the number of topics as lowas possible, 100 was chosen for the number of topics inall three domains.
5.3. Explanation thresholdEach topic returned by the LDA is associated witheach paper with a speci�c amount of relevancy. Inother words, paper p is explained by topic t withthe explanation level of �(p; t). In this approach, athreshold needs to be set for the explanation level todetermine which papers are explained by a speci�ctopic. If this threshold is set at a low amount level,the topics can explain more papers and the coverageof the corpus become acceptable; on the other hand,many papers are explained by a topic with a lowlevel of explanation relevancies. Therefore, the topicsand papers will be connected loosely to each other.Applying the explanation threshold, it can be saidthat p is explained by topic t if � (p; t) � the. Todetermine the appropriate the two parameters areaddressed. These two parameters are corpus coverageand explanation quality [17]. The corpus coverage is thefraction of papers in the corpus that is explained by atleast one extracted topic. Therefore, for the corpus P ,extracted topics set T and explanation threshold the,the explained set E contains all explained papers andthe relevance set R is de�ned as all couples of (pi; tj)that pi is explained by tj . More formally:
E=�piji 2 f1; 2; 3; : : : ; jP jg ;9tj ; j 2 f1; 2; 3; : : : ; jT jg
� (pi; tj) � the�;
R =�
(i; j) ji 2 f1; 2; 3; : : : ; jP jg ; j 2 f1; 2; 3; : : : ; jT jg ;
� (pi;tj) � the�: (2)
And CtheP;T , which is the coverage of corpus P , extractedtopics set T and explanation threshold the, is de�nedas:
CtheP;T=jEjjP j : (3)
Consequently, explanation quality EQtheP;T , whichis the average relevance level of papers that are ex-plained by at least one topic, is de�ned as:
EQtheP;T =
P(i;j)2R
�(pi;tj)
jRj : (4)
Figure 4. Corpus coverage (C) and Explanation Quality(EQ) of domains for di�erent explanation threshold.
In the above equation, the numerator is the sumof all relevancies between all topics and papers thatare higher than or equal to the explanation threshold.And the denominator is the count of these relevanciesbetween papers and topics that pass the explanationthreshold. The aim is to �nd an appropriate expla-nation threshold that can maximize both the corpuscoverage and the explanation quality. To do this, theLDA algorithm was applied with k = 100 topics on thedocument-term-matrix of each domain. To apply LDAto the term-document-matrix, some papers which haveno terms in their BoWs that appear more than 5 timesin the term dictionary are ignored. Therefore, the totalnumbers of papers in these matrices are lower thanthe total number of papers in the corpora. Figure 4presents the corpus coverage (C) and the ExplanationQuality (EQ) for each domain. As illustrated in Fig-ure 4, to determine the appropriate the, the points thatmaximize both the corpus coverage and the explanationquality are selected for each domain. In this way,the = 22, which covers 57% of the Mng corpus (41,520papers), is selected for the management domain. Inthe same way, for industrial engineering, the = 0:25covers 63% of the Ind corpus (15,656 papers), and forthe IT domain, the = 0:14 covers 49% of its corpus(4,576 papers).
6. Results and discussion
6.1. Hot-important topicsAs reported in the previous section, the LDA algorithmis applied to each domain to extract 100 topics. Todistinguish some topics and to explain in more detail,ten hot-important topics were chosen in each domain.Because all corpora in this research contain 100 topics,an important topic is de�ned as a topic which coversmore than 1% of its corpus. It can be assumed thatstudies receiving more than an average number ofcitations have high importance and representativeness[5,13]. Klavans and Boyack [59] reported that [12] iden-ti�ed the hot �elds based on the number of citationsand from 1997{2007, new thresholds were determinedto identify the hot, warm and cold topics based on

M. Rabiei et al./Scientia Iranica, Transactions E: Industrial Engineering 28 (2021) 1830{1852 1841
the number of citations. Therefore, in this study,the hot-important topics are assumed as importanttopics whose average amount of citations is maximized.Hence, topics will be analyzed at separate periods oftime; this assumption also being applicable for newphenomena in these domains. In the other words, EP;tis de�ned as the set of explained papers of corpus Pby topic t, IP;T is the important topics of corpus P ,AvgCiteP;t is the average citation of papers in topic.Finally, HIP;k contains k number of important topicswith the maximum amount of average citation. Moreformally:EP;t= fpiji 2 f1; 2; 3; : : : ; jP jg ; � (pi; t) � theg ;IP;T= ftiji 2 f1; 2; 3; : : : ; jT jg ; jEP;ti j � (jP j=jT j)g ;
AvgCiteP;t =
Ppi2EP;t
Citation(pi)
jEP;tj : (5)
Now, suppose that f : I ! I is a set function as follows:
f (I) = Infargmaxt2TAvgCiteP;tg;fk (I) = fofo � � � of| {z }
k
(I):
Therefore:
HIP;k= Infk (I) :
Based on the above measurement, ten hot-importanttopics (HIP;10) are reported in Table 8.
In Table 8, topics are labeled by domain expertsto make them meaningful and understandable for moreanalysis. The experts choose the labels by focusingon the related terms of each topic. The most relevantterms of a topic enable the researcher to identify thecontent of that and manually assign it a label [19]. Nineexperts (three in each domain) were chosen from the
Table 8. Ten hot-important topics in each domain.
Topics # Most relevant terms
Mng
T38: Cooperation & partnership 1068 Trust, cooperation, strategic alliance, outsourcing, joint ventureT26: Technology management 929 Adoption, user acceptance, planned behavior, acceptanceT11: HR 875 Personality, job performance, individual di�erences, 5-factor modelT6: Health management 1151 Intervention, cancer, quality of care, blood pressure, self-managementT43: Environmental health 1269 Mortality, risk factor, smoking, environmental factorT20: Financial management 794 Investment, acquisition, pro�tability, �nance, market valueT97: Stock market 1360 Stock returns, volatility, liquidity, stock price, uctuationsT10: Resource & capacity 1126 Competitive advantage, resource-based view, absorptive capacityT99: Occupational health 846 Prevalence, prevention, depression, mental health, telemedicineT94: Job performance 1441 Job satisfaction, social support, procedural justice, employee turnover
Ind
T25: R&D 204 R&D, Development projects, development cycle time, JapaneseT9: Manufacturing 373 Machining, surface integrity, tyool life, chip formation, hard turningT94: MCDM 402 Analytic hierarchy process, supplier selection, criteria, TOPSIST17: Information systems 191 Information system, enterprise system, Internet of Things (IOT), WebT54: HR (sociology) 290 Gender, earnings, inequality, sex di�erences, discriminationT59: HR (psychology) 211 Job satisfaction, ownership, Korea, performance appraisalT83: Safety management 196 Safety climate, safety culture, safety management, accident preventionT5 : Innovation 210 Product development, creativity, radical innovation, innovationT97: Environmental Mng 241 Green, environmental management, environmental performanceT18: CRM 189 Behavior, perception, personality, loyalty, planned behavior
IT
T18: Health technology 65 Clinical practice guideline, systematic reviews, health services researchT31: Machine learning 73 Machine learning, neural network, ensemble learningT72: Health care 61 Quality of life, care, public health, evidence-based medicine, doctorsT26: Data mining 40 Data mining, classi�cation, clustering, boosting, pattern discoveryT30: Computational biology 47 Discovery, microarray data, human genome, RNA, ant colonyT8: General medicine 103 Therapy, prevention, glycemic control, diabetes, insulinT3: Cloud computing 58 Cloud computing, Web service, Service composition, VirtualizationT29: Occupational health 113 Risk factors, coronary heart disease, blood pressure, mental healthT100: Internal medicine 49 Death, Breast cancer, Surgery, tumor, pregnancyT61: Health services 52 Care, intervention, clinical trial, engagement, empirical evidence

1842 M. Rabiei et al./Scientia Iranica, Transactions E: Industrial Engineering 28 (2021) 1830{1852
faculty members of management, industrial engineeringand IT departments. The topics of each domain wereassigned independently to two related experts. Foreach topic, a list of the �rst 20 more related terms waspresented to the domain experts. The rank of the termsis important for experts to choose the appropriate label.Therefore, sometimes two topics with similar relatedterms get di�erent labels. Moreover, the similaritybetween topics, which is calculated based on the Cosinemeasure [60], informed experts about the relationbetween the topics and helped them to determine thoselabels that could explain the topics in the best way. Inthis process, if both domain experts suggest a similarlabel for a topic (42 topics for Mng, 38 topics for Indand 47 topics for IT), that label is chosen for that topic.But in cases where labels are di�erent, the third expertchooses one of the suggested labels. For two topicsof Mng, three topics of Ind and �ve topics of IT, thethird expert could not make a certain decision. Forthese topics, the appropriate label is assigned after theaggregation session that is held by all three domainexperts.
An important point in Table 8 is the role of\Health Science" in the IT and management do-mains. There are two important reasons for thisstrong participation. The �rst reason is that manystudies [61,62] show that the use of Electronic MedicalRecords (EMRs) by physicians has increased over thepast decade and Health Information Technology (HIT)has been widely used in medical centers since 2000.Most published HIT implementation studies reportpositive e�ects on the quality, safety, and e�ciencyof healthcare [25]. For example in the IT domain,keywords such as \Classi�cation", \Feature Selection",\Genetic Algorithm", \Support Vector Machine", etc.,which could extract pure machine learning or datamining publications in the older publications of theused dataset, led to the extraction of health relatedtopics after 2008. It means that machine learning ordata mining have shifted from a technical concept incomputer science to applicable tools and approachesin other domains (especially in the health domain). Anoted fact is that health related topics in the IT domainare extracted via computer science based keywords(such as Support Vector Machine (SVM), Clustering,Sensor, Information System ...), but the most relevantterms of these topics in the above table are obtainedafter the process of topic extraction.
The second reason is that based on Eq. (5),citation is a critical factor to choose the hot importanttopics of each domain. As known, publications of thehealth domain often have high citations in comparisonto the computer science domain. Therefore, 6 hotimportant topics of the IT domain in the above tableare associated with the health domain.
Table 8 indicates that these three domains have
some similar or common topics. For example, hu-man resources (HR) is common between industrialengineering and management. Some concepts suchas work improvement, occupational safety, and healthmanagement are mixed together, and are mentioned inboth domains. Some studies illustrated that there hasbeen a growing trend in occupational health research,risk management and occupational safety over the last20 years [63,64].
6.2. Comparing topics trendTo compare topic trends, the corpus of each domainis divided into four periods of time. The total corpuscontains the papers of the last 20 years (from 1998 to2017). Therefore, each divided corpus contains �veyears of publications. Analyzing the research trendsbased on �ve year periods is prevalent [65]. Aftercreating the time-based corpora, a document-term-matrix is constructed for each corpus and the topicdistributions for papers and the term distributionsfor topics are obtained for all corpora based on theprevious LDA results of total papers in each domain.Then, PortionP;t is de�ned for each topic in a corpusP as the number of papers explained by t divided bythe size of P as follows:
PortionP;t=jEP;tjjP j : (6)
The properties of each divided corpus are reportedin Table 9. It is notable that the Average citationof a divided corpus in Table 9 refers to the averageamount of all citations of that corpus and does notrefer to that part of citations of papers cited in thatTime period. Because of the increment feature ofcitation, Table 9 indicates that the average citationfor older corpus is higher than the average citations ofrecent publications. This limitation of citation analysismotivates researchers to work on the concept called the\Time window" [66,67] for research evaluation based oncitation criteria.
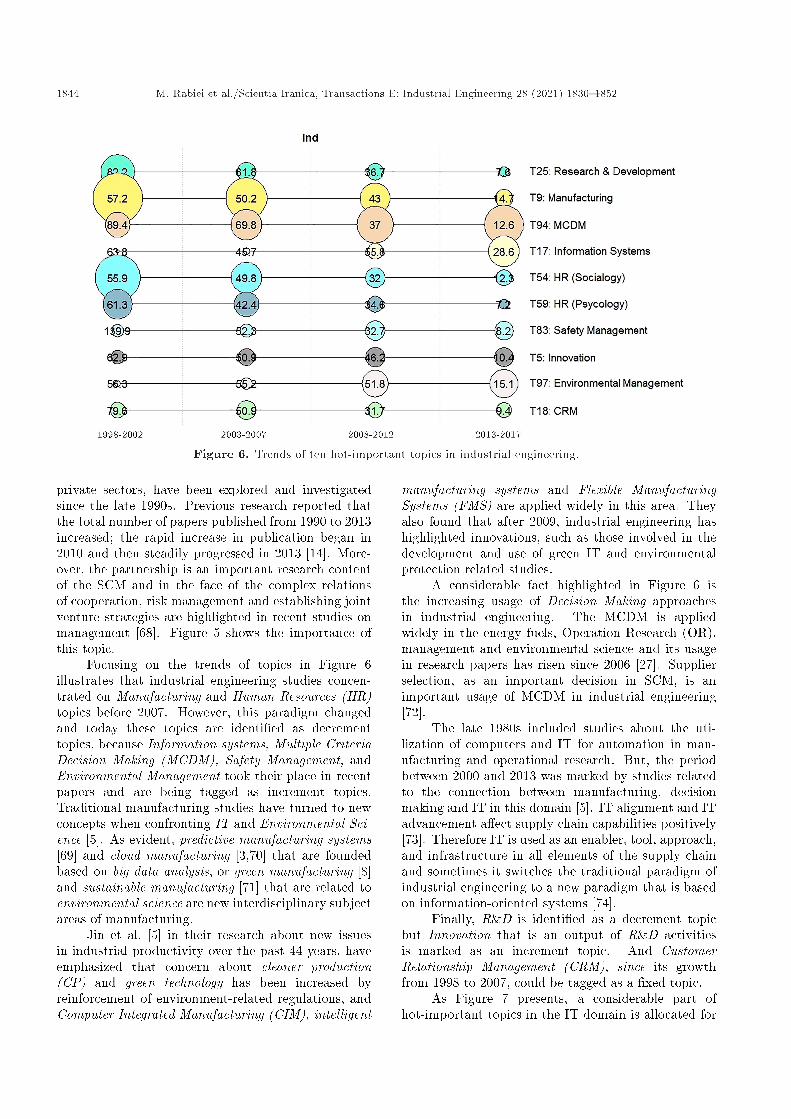
Figures 5{7 show the trends of hot-importanttopics mentioned in Table 8 separately. In these �gures,each circle represents a topic in a certain time period.The size of the circles indicates the portion of the topic(number of papers explained by topics in that period oftime divided by all papers of the corpus in that period)that shows the share of a topic from the whole corpusin a speci�c period of time. The number in each circleis the average citation of papers in the related topic.Based on changes in the size of the circles, each topiccould be marked as an increment, �xed or decrementtopic. An important note is that the size of eachcircle only, which shows the portion of papers on thattopic in the corpus, could not determine the trend ofa topic, and the changes in its average citation is alsoimportant.

M. Rabiei et al./Scientia Iranica, Transactions E: Industrial Engineering 28 (2021) 1830{1852 1843
Table 9. Properties of divided corpus for each domain.
Divided corpus Time period # of papers Portion AvgCite
Mng
Mng-Q1 1998 { 2002 10,924 15% 76.5Mng-Q2 2003 { 2007 17,855 24% 62.3Mng-Q3 2008 { 2012 21,888 30% 44.9Mng-Q4 2013{2017 23,176 31% 13.8
Total 1998 { 2017 73,840 100% 44.0
Ind
Ind-Q1 1998 { 2002 5,781 23% 45.4Ind-Q2 2003 { 2007 7,507 29% 41.5Ind-Q3 2008 { 2012 6,777 26% 34.0Ind-Q4 2013{2017 5,622 22% 11.8Total 1998 { 2017 25,687 100% 33.9
IT
IT-Q1 1998 { 2002 1,195 12% 45.3IT-Q2 2003 { 2007 2,020 20% 39.5IT-Q3 2008 { 2012 3,335 32% 36.7IT-Q4 2013{2017 3,696 36% 14.8Total 1998 { 2017 10246 100% 30.3
Figure 5. Trends of ten hot-important topics in management.
As Figure 5 shows, in the management domain,some topics such as HR, �nancial management, StockMarket and Job Performance (as a branch of HR)are identi�ed as decrement topics. Nevertheless, thehigh amount of average citation of these topics isreliable evidence that this reduction does not meana decrease in the importance of these topics. Inother words, these topics play a fundamental role inthe management domain. In contrast, the health-
related topics have a considerable share in managementresearch and Environmental, Occupational Health, andResource & Capacity are marked as increment topicsin the management domain. Although TechnologyManagement has the highest amount of citation, itcould be identi�ed as a �xed topic based on its portion.
Cooperation and Partnership is a major researchinterest in the management domain [14], and di�erentareas of partnership, especially between public and
1844 M. Rabiei et al./Scientia Iranica, Transactions E: Industrial Engineering 28 (2021) 1830{1852
Figure 6. Trends of ten hot-important topics in industrial engineering.
private sectors, have been explored and investigatedsince the late 1990s. Previous research reported thatthe total number of papers published from 1990 to 2013increased; the rapid increase in publication began in2010 and then steadily progressed in 2013 [14]. More-over, the partnership is an important research contentof the SCM and in the face of the complex relationsof cooperation, risk management and establishing jointventure strategies are highlighted in recent studies onmanagement [68]. Figure 5 shows the importance ofthis topic.
Focusing on the trends of topics in Figure 6illustrates that industrial engineering studies concen-trated on Manufacturing and Human Resources (HR)topics before 2007. However, this paradigm changedand today these topics are identi�ed as decrementtopics, because Information systems, Multiple CriteriaDecision Making (MCDM), Safety Management, andEnvironmental Management took their place in recentpapers and are being tagged as increment topics.Traditional manufacturing studies have turned to newconcepts when confronting IT and Environmental Sci-ence [5]. As evident, predictive manufacturing systems[69] and cloud manufacturing [3,70] that are foundedbased on big data analysis, or green manufacturing [8]and sustainable manufacturing [71] that are related toenvironmental science are new interdisciplinary subjectareas of manufacturing.
Jin et al. [5] in their research about new issuesin industrial productivity over the past 44 years, haveemphasized that concern about cleaner production(CP) and green technology has been increased byreinforcement of environment-related regulations, andComputer Integrated Manufacturing (CIM), intelligent
manufacturing systems and Flexible ManufacturingSystems (FMS) are applied widely in this area. Theyalso found that after 2009, industrial engineering hashighlighted innovations, such as those involved in thedevelopment and use of green IT and environmentalprotection related studies.
A considerable fact highlighted in Figure 6 isthe increasing usage of Decision Making approachesin industrial engineering. The MCDM is appliedwidely in the energy fuels, Operation Research (OR),management and environmental science and its usagein research papers has risen since 2006 [27]. Supplierselection, as an important decision in SCM, is animportant usage of MCDM in industrial engineering[72].
The late 1980s included studies about the uti-lization of computers and IT for automation in man-ufacturing and operational research. But, the periodbetween 2000 and 2013 was marked by studies relatedto the connection between manufacturing, decisionmaking and IT in this domain [5]. IT alignment and ITadvancement a�ect supply chain capabilities positively[73]. Therefore IT is used as an enabler, tool, approach,and infrastructure in all elements of the supply chainand sometimes it switches the traditional paradigm ofindustrial engineering to a new paradigm that is basedon information-oriented systems [74].
Finally, R&D is identi�ed as a decrement topicbut Innovation that is an output of R&D activitiesis marked as an increment topic. And CustomerRelationship Management (CRM), since its growthfrom 1998 to 2007, could be tagged as a �xed topic.
As Figure 7 presents, a considerable part ofhot-important topics in the IT domain is allocated for

M. Rabiei et al./Scientia Iranica, Transactions E: Industrial Engineering 28 (2021) 1830{1852 1845
Figure 7. Trends of ten hot-important topics in IT.
Health. This �gure indicates that publications of thisdomain have been shifting from pure computationaltopics (such as data mining and machine learning)to application of computer science in other domains(especially in the health domain, for example) [75{77].Moreover, In the last years, individuals working atthe intersection of IT and medicine have developedand computer applications to improve health careservices have increased [16]. Moreover, a growingbody of scienti�c evidence supports the use of thistechnology in the clinical decision-making process[25,34,61]. On the other hand, the movement of healthcare to patient-centered care has empowered patientsand changed the role of IT in healthcare [78]. Thedevelopment of new technology such as Web 2.0 and3.0 and the rapid growth of social media provide newopportunities for individuals to access and exchangehealth information [78].
Jones et al. [25] in research about the investigationof HIT studies between 1995 and 2013 found that thenumber of published health IT evaluation studies isincreasing rapidly. This study explored that such areasin HIT increased by approximately 13% per year before2007, and roughly 25% per year from 2008 to 2012.Approximately, the same result is �gured in health-related topics in Figure 7.
Although Figure 7 shows that the portions ofData Mining and Machine Learning topics becomesmaller in previous periods, the high amount of averagecitations of these topics indicates that data miningand machine learning are applied widely as usefulapproaches or tools in the other topics or domains.For example, life sciences, biomedicine, computationalbiology, and health care are increasingly turning into
a data-intensive science. Therefore, data mining andconsequently machine learning should be used to dis-cover knowledge from the huge amount of generateddata [79]. Moreover, some new terms have been mergedwith basic concepts and new topics or concepts havebeen constructed. For example, Big Data Mining isintroduced instead of traditional data mining [80].
Cloud Computing as a new phenomenon thathas joined with other concepts such as Big Data,Internet of Things (IoT), and social media is rising inrecent studies and the huge number of publications inthis area of research is undertaken by interdisciplinaryresearchers [4]. Cloud computing is one of the mostsigni�cant shifts in ICT and service that eliminates theneed for expensive hardware and dedicated space [81].
In conclusion, Health-related topics and CloudComputing are known as increment topics; conversely,Machine Learning and Data Mining with considerableamounts of citation are marked as decrement topicsand Computational Biology could be tagged as a �xedtopic.
6.3. Comparing high-level categoriesTo compare all three domains in a single perspective,it is necessary to assign a high-level category to thetopics. To do this, the �eld \SC" that denotes theresearch areas of WoS is applied. The high-level cate-gories for each topic are identi�ed by counting the SCcontent of the documents which are explained by thattopic. To make these high-level categories comparableamong di�erent domains, some applicable criteria arerequired. Previous criteria are usually used to describethe trends, importance, density or evolution of topicsin a domain. This study endeavours to describe these,
1846 M. Rabiei et al./Scientia Iranica, Transactions E: Industrial Engineering 28 (2021) 1830{1852
in their correlated domains. Each domain has itsspeci�c characteristics. For example, Table 8 indicatesthat average citation of the �rst time period for theManagement domain is more than 75 instead of about45 for Industrial Engineering and IT. Therefore, using\Citation" as a common measure for topic evaluation isnot appropriate, especially for evaluation of a categoryamong two or three domains. In this approach, torespect the TC of a paper, this attribute is used asa factor of counting, and to normalize the di�erentamounts of TC in each domain and time period, theTC is divided into its related AvgCiteP , as mentionedin Table 9. WCP is de�ned as all research areas inthe corpus P . Based on this approach, Frp (cat), asthe frequency of a research area category for paper pand RelP;t (cat) for topic t in corpus P , are proposedformally as:
Frp (cat) =
8><>:TC
AvgCiteP if cat 2WCP
0 if cat =2 WCP
Re lp;t(cat) =
Ppi2Ep;t
Frpi(cat)Pcat2WCP
Ppi2EP;t
Frpi(cat)(7)
Therefore, Cat1P;t and Cat2P;t as the �rst and secondhigh-level categories for topic t in corpus P are identi-�ed as:
Cat1P;t= argmaxcat2WCPRelP;t (cat)
Cat2P;t = argmaxcat2(WCP nCat1(P;t))RelP;t (cat) ;
After that, for topic t, the relevance of a high-levelcategory HlRelP;t is assumed as its RelP;t (cat) whenthe cat is marked as Cat1P;t or Cat2P;t. Consequently,HlRelp (cat) that is the relevance of a high-level cate-gory for corpus P is proposed as:
HlRelP;t (cat) =8><>:RelP;t (cat) cat 2 fCat1P;t; Cat2P;tg
0 O:W
HlRelP (cat) =Xt2T
HlRelP;t(cat) (8)
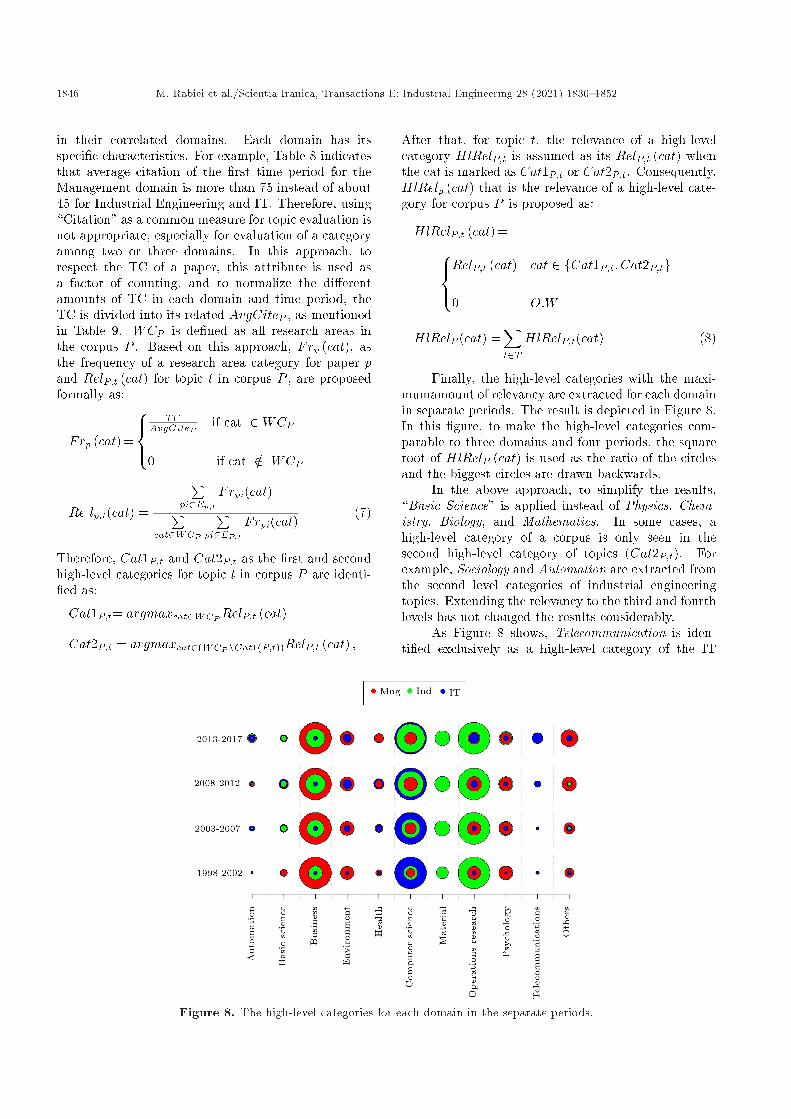
Finally, the high-level categories with the maxi-mumamount of relevancy are extracted for each domainin separate periods. The result is depicted in Figure 8.In this �gure, to make the high-level categories com-parable to three domains and four periods, the squareroot of HlRelP (cat) is used as the ratio of the circlesand the biggest circles are drawn backwards.
In the above approach, to simplify the results,\Basic Science" is applied instead of Physics, Chem-istry, Biology, and Mathematics. In some cases, ahigh-level category of a corpus is only seen in thesecond high-level category of topics (Cat2P;t). Forexample, Sociology and Automation are extracted fromthe second level categories of industrial engineeringtopics. Extending the relevancy to the third and fourthlevels has not changed the results considerably.
As Figure 8 shows, Telecommunication is iden-ti�ed exclusively as a high-level category of the IT
Figure 8. The high-level categories for each domain in the separate periods.

M. Rabiei et al./Scientia Iranica, Transactions E: Industrial Engineering 28 (2021) 1830{1852 1847
domain and relevant research studies have increasedsigni�cantly. Material science is also explored solelyfor industrial engineering with no serious change inits importance. In the Automation category, IT andindustrial engineering have the more important role.The previous research [5] indicates this role as theutilization of computers and IT systems for automationin the manufacturing process. Basic Science is coveredsimilarly by all three domains. Biology is addressedmore by management and IT, whereas Physics andChemistry are used widely in industrial engineeringstudies. Finally, Mathematics is applied in the researchstudies of these domains as an essential tool or theo-retical approach.
Although the Business category is one of the corestudies in management science, and previous research[6] indicates that it has high centrality and mediumor high density in studies during the last 25 yearsfor this domain, industrial engineering researchers aretrying to undertake further research in this category.In the same way, Operational Research is marked asa fundamental research area of industrial engineering.However, management has a considerable share in thiscategory and recently many studies in the IT domainhave focused on this subject.
Computer Science as an essential �eld of IT isapplied by management and industrial engineering. Asmentioned before, industrial engineering researchershave applied computer science in many aspects of theirresearch. Its usage is undeniable in many studies inthe �eld of industrial engineering that are related toautomation, problem-solving, decision making, simula-tion, evaluation, forecasting, planning, and informationmanagement [5].
In the Environment and Health category, manage-ment and IT have a more important role. In both ofthem, IT usage has a rapid increment and sometimesnew paradigms are born in these areas. Research on theimportant role of social media and knowledge manage-ment systems in the enhancement of public knowledgeregarding global environmental changes [82,83], andapplying new IT-based tools for the prediction andmonitoring of environmental research issues [28,82]are some examples of this increment in environmentalstudies in recent years. In the same way, the use ofcomputer science in the research management of thehealth domain [18], applying a data mining approach indisease prediction [84{86] and the widespread adoptionof healthcare information systems for health manage-ment [87] are clear evidence for the IT increment trendin the health �eld.
Lastly, in Psychology science, all three domainsexist, but management and industrial engineering havea dominant presence. This category contains studiesthat are more about the psychological aspects of humanresource management [88] or concepts about tech-
nology acceptance, customer relationship management(CRM), and Organizational Psychology [89].
The results depicted in Figure 8 indicate that inthe 9 categories, all three domains are present and someareas in a domain are common or very close to otherdomains. This fact con�rms the strong relationshipsbetween these domains and veri�es the e�cacy of topicsin these domains on each other.
7. Conclusions
The purpose of the current study was to illustrate theevolution of Information Technology (IT), managementand industrial engineering studies as three academicand research domains. To achieve this purpose, thebibliographic data of 20 years (from 1998 to 2017) ofpublications from the Web of Science (WoS) repositoryin each domain were extracted. A new approach, whichconsists of a combination of bibliographic analysis anda topic modeling approach, was applied in this researchto identify topic trends, determine the important topicsand describe the research evolution in each domain. Inthe topic modeling process, a novel simple heuristicmethod was suggested for key extraction for eachrecord. In addition, some new criteria were de�nedto compare the topics. Proposing the new methodto determine the high-level category for each topic isanother innovation of this study. The bibliographicanalysis indicated that the USA, China, England,Canada and Taiwan have the most publications inthese domains. USA researchers participate in 45%of the management studies and USA or China ispresent in about half of these three domain studies. Inaddition, China and France are marked as countrieswith high growth in all three domains and Iran isidenti�ed as a country with the maximum growth ratein management and industrial engineering research.Moreover, bibliographic analysis identi�ed the journalswith the maximum number of articles in each domain.In this process, 82 journals were discovered to containarticles in all three domains. The keyword analysis wasthe last step of bibliographic analysis for these corpora.This step reported that \Model", \System", \perfor-mance", \Scheduling", \Management", and \Geneticalgorithm" are common frequent keywords in all threedomains. In addition, \Supply chain management",\Innovation", \Impact", and \Behavior" were identi-�ed as common frequent keywords in the managementand industrial engineering domains. In the sameway, \Design" was marked as a common keyword inIT and industrial engineering and \Information" wasrecognized in both IT and management. On theother hand, some frequent keywords such as \Cloudcomputing" and \Wireless sensor networks" are speci�cto the IT domain.
To determine the Bag-of-Words (BoW) for each

1848 M. Rabiei et al./Scientia Iranica, Transactions E: Industrial Engineering 28 (2021) 1830{1852
record, the key extraction method constructed theBoW from the combination of keywords and the biggestn-gram of the title. After that, the Latent DrichletAllocation (LDA) algorithm is used to extract thetopics and the hot-important topics were extracted foreach domain. The most obvious �nding of this part isthe greater importance of the role of \Health Science"in IT and management domains over the last 20 years.Another result of extracting hot-important topics wasthe identi�cation of common or similar topics in thesedomains. For example, Human Resources (HR) and itsrelated topics are common in both management andindustrial engineering research. Similarly, Health is anincremental research topic in both IT and managementdomains.
To make the topics comparable, two new criteria(Portion and AvgCite) were proposed. The corpus ofeach domain was divided based on four periods of time,and topic trends were described based on these criteriafor each topic in a divided corpus. Cooperation andPartnership was marked as the most hot-importanttopic of management research. In addition, Health-related topics were recognized as incremental topicsin recent years for management and IT domains. Inthe industrial engineering domain, the concentrationof researchers has changed from Manufacturing andHR to Information Systems, Multiple Criteria DecisionMaking (MCDM) and Environmental Management.The trends also illustrated that Computer Science hasbeen widely applied in industrial engineering studies inthe last 10 years. In the IT domain, Data Mining andMachine Learning are applied widely in other topics ordomains and Cloud Computing, as a new phenomenon,has changed some traditional research topics.
Finally, to answer the last question of this study,high-level categories were explored. In the 9 categoriesfrom the 11 explored categories, all three domainsare presented and it con�rms that there is a strongrelationship between these three domains. The resultsalso indicated that Telecommunication, Automation,Health and Computer Science are incremental researchareas in these domains.
Some topics extracted in these domains are sim-ilar to each other or sometimes topics with the samelabel in two domains have a di�erent meaning or coverdi�erent subjects. For example, \Data Mining" in theIT domain focuses on pure algorithms and conceptsof knowledge extracted from raw data. But thistopic in industrial engineering denotes application ofthese algorithms as tools or approaches in industrialinformation management. Moreover, some keywordshave ambiguity in the meaning. For instance, NLP inthe IT domain refers to Natural Language Processing,but in industrial engineering, it is the abbreviation ofnon-linear planning. Managing the challenges aboveand analyzing the correlation between topics and de-
termining the multidisciplinary topics between thesedomains are suggested for future studies.
Acknowledgement
The authors gratefully acknowledge the Iranian Re-search Institute for Information Science and Tech-nology (IRANDOC) and especially acknowledge thesupport of the IRANDOC Text Mining and MachineLearning Laboratory.
References
1. Pfei�er, A., Close Link Between Engineering andBusiness Management, in The New York Times (2009).
2. Porter, A. and Rafols, I. \Is science becoming moreinterdisciplinary? Measuring and mapping six research�elds over time", Scientometrics, 81, pp. 719{745(2009).
3. He, W. and Xu, L. \A state-of-the-art survey of cloudmanufacturing", International Journal of ComputerIntegrated Manufacturing, 28, pp. 239{250 (2015).
4. Heilig, L. and Vo�, S. \A scientometric analysis ofcloud computing literature", IEEE Transactions onCloud Computing, 2, pp. 266{278 (2014).
5. Jin, J., Leem, C., and Lee, C. \Research issuesand trends in industrial productivity over 44 years",International Journal of Production Research, 54, pp.1273{1284 (2016).
6. Ronda-Pupo, G. \Knowledge map of Latin Amer-ican research on management: Trends and futureadvancement", Social Science Information, 55, pp. 3{27 (2016).
7. Sedighi, M. and Jalalimanesh, A. \Mapping re-search trends in the �eld of knowledge management",Malaysian Journal of Library & Information Science,19, pp. 71{85 (2017).
8. Seth, D., Seth, D., Shrivastava, R., Shrivastava, S.,and Shrivastava, S. \An empirical investigation ofcritical success factors and performance measures forgreen manufacturing in cement industry", Journal ofManufacturing Technology Management, 27, pp. 1076{1101 (2016).
9. Wagner, C., Roessner, J., Bobb, K., et al. \Approachesto understanding and measuring interdisciplinary sci-enti�c research (IDR): A review of the literature",Journal of Informetrics, 5, pp. 14{26 (2011).
10. Wagner, A., Roessner, J., Bobb, K., et al. \Approachesto understanding and measuring interdisciplinary sci-enti�c research (IDR): A review of the literature",Journal of Informetrics, 5, pp. 14{26 (2011).
11. Gar�eld, E., Sher, I., and Torpie, R. \The use of cita-tion data in writing the history of science," Institutefor Scienti�c Information Inc Philadelphia, PA (1964).

M. Rabiei et al./Scientia Iranica, Transactions E: Industrial Engineering 28 (2021) 1830{1852 1849
12. Small, H. \A co-citation model of a scienti�c specialty:A longitudinal study of collagen research", SocialStudies of Science, 7, pp. 139{166 (1977).
13. Fu, H. and Ho, Y. \Highly cited Antarctic articlesusing science citation index expanded: a bibliometricanalysis", Scientometrics, 109, pp. 337{357 (2016).
14. Osei-Kyei, R. and Chan, A. \Review of studies on thecritical success factors for Public-Private Partnership(PPP) projects from 1990 to 2013", InternationalJournal of Project Management, 33, pp. 1335{1346(2015).
15. Amado, A., Cortez, P., Rita, P., and Moro, S.\Research trends on big data in marketing: A textmining and topic modeling based literature analysis",European Research on Management and Business Eco-nomics, 24, pp. 1{7 (2018).
16. Choi, H.S., Lee, W.S., and Sohn, S. \Analyzingresearch trends in personal information privacy usingtopic modeling", as Computers & Security, 67, pp.244{253 (2017).
17. De Battisti, F., Ferrara, A., and Salini, S. \A decadeof research in statistics: a topic model approach",Scientometrics, 103, pp. 413{433 (2015).
18. Gerdsri, N., Kongthon, A., and Puengrusme, S. \Pro-�ling the research landscape in emerging areas usingbibliometrics and text mining: A case study of biomed-ical engineering (BME) in Thailand", InternationalJournal of Innovation and Technology Management,14, p. 1740011 (2017).
19. Yau, C.-K., Porter, A., Newman, N., and Suominen, A.\Clustering scienti�c documents with topic modeling",Scientometrics, 100, pp. 767{786 (2014).
20. Furrer, O., Thomas, H., and Goussevskaia, A. \Thestructure and evolution of the strategic management�eld: A content analysis of 26 years of strategicmanagement research", International Journal of Man-agement Reviews, 10, pp. 1{23 (2008).
21. Cancino, C., Merig�o, J.M, Coronado, F., Dessouky,Y., and Dessouky, M. \Forty years of Computers& Industrial Engineering: A bibliometric analysis",Computers & Industrial Engineering, 113, pp. 614{629 (2017).
22. Lee, W.S. and Sohn, S.Y. \E�ects of standardiza-tion on the evolution of information and communica-tions technology", Technological Forecasting and SocialChange, 132, pp. 308{317 (2018).
23. Gaur, A. and Kumar, M. \A systematic approach toconducting review studies: An assessment of contentanalysis in 25 years of IB research", Journal of WorldBusiness, 53, pp. 280{289 (2018).
24. Hosseini, S., Ivanov, D., and Dolgui, A. \Reviewof quantitative methods for supply chain resilienceanalysis", Transportation Research Part E: Logisticsand Transportation Review, 125, pp. 285{307 (2019).
25. Jones, S.S., Rudin, R.S., Perry, T., and Shekelle,P.G. \Health information technology: an updatedsystematic review with a focus on meaningful use",Annals of Internal Medicine, 160, pp. 48{54 (2014).
26. Shi, Y. and Liu, X. \Research on the literature of greenbuilding based on the web of science: A scientometricanalysis in CiteSpace (2002-2018)", Sustainability, 11,p. 3716 (2019).
27. Mork�unait_e, �Z., Kalibatas, D., and Kalibatien_e, D.\A bibliometric data analysis of multi-criteria decisionmaking methods in heritage buildings", Journal ofCivil Engineering and Management, 25, pp. 76{99(2019).
28. Rabiei, M., Hosseini-Motlagh, S.-M., and Haeri, A.\Using text mining techniques for identifying researchgaps and priorities: a case study of the environmentalscience in Iran", Scientometrics, 110, pp. 815{842(2017).
29. Liao, H., Tang, M., Luo, L., Li, C., Chiclana, F., andZeng, X.J. \A bibliometric analysis and visualizationof research", Sustainability, 10, p. 166 (2018).
30. Sedighi, M. and Jalalimanesh, A. \Mapping re-search trends in the �eld of knowledge management",Malaysian Journal of Library & amp; InformationScience, 19, pp. 71{85, 2017-03-22 (2017).
31. Thomson-Results (2017, 8/12/2017). Web ofScienceTM Core Collection Help. Available:http://images.webofknowledge.com/WOKRS524B8/help/WOS/hp subject category terms tasca.html
32. Elango, B. and Ho, Y.S. \Top-cited articles in the�eld of tribology : A bibliometric analysis", Journalof Scientometrics and Information Management, 12,pp. 289{307 (2018).
33. Kim, M.C. and Zhu, Y. \Scientometrics of sciento-metrics: mapping historical footprint and emergingtechnologies in scientometrics", in Scientometrics, Ed:IntechOpen, p. 9 (2018).
34. Klarenbeek, T. and Bosho�, N. \Measuring multidis-ciplinary health research at South African universities:a comparative analysis based on co-authorships andjournal subject categories", Scientometrics, 116, pp.1461{1485 (2018).
35. Lin, H., Zhu, Y., Ahmad, N., and Han, Q. \A scien-tometric analysis and visualization of global researchon brown�elds", Environmental Science and PollutionResearch, 26, pp. 17666{17684 (2019).
36. Fu, H-Z., Wang, M-H., and Ho, Y-S. \The most fre-quently cited adsorption research articles in the ScienceCitation Index (Expanded)", Journal of Colloid andInterface Science, 379, pp. 148{156 (2012).
37. Blei, D.M. \Probabilistic topic models", Communica-tions of the ACM, 55, pp. 77{84 (2012).
38. Hu, Z., Fang, S., and Liang, T. \Empirical studyof constructing a knowledge organization system ofpatent documents using topic modeling", Scientomet-rics, 100, pp. 787{799 (2014).
39. Landauer, T.K., Foltz, P.W., and Laham, D. \Anintroduction to latent semantic analysis", DiscourseProcesses, 25, pp. 259{284 (1998).

1850 M. Rabiei et al./Scientia Iranica, Transactions E: Industrial Engineering 28 (2021) 1830{1852
40. Hofmann, T. \Probabilistic latent semantic indexing",in Proceedings of the 22nd Annual International ACMSIGIR Conference on Research and Development inInformation Retrieval, pp. 50{57 (1999).
41. Blei, D.M., Ng, Andrew, Y., and Jordan, M.I. \LatentDirichlet allocation", Journal of Machine LearningResearch, 3, pp. 993{1022 (2003).
42. Gri�ths, T.L., Jordan, M.I., Tenenbaum, J.B., andBlei, D.M. \Hierarchical topic models and the nestedChinese restaurant process", in Advances in NeuralInformation Processing Systems, pp. 17{24 (2004).
43. La�erty, J.D. and Blei, D.M. \Correlated topic mod-els", in Advances in Neural Information ProcessingSystems, pp. 147{154 (2006).
44. Chang, J. and Blei, D.M. \Relational topic models fordocument networks", in International Conference onArti�cial Intelligence and Statistics, pp. 81{88 (2009).
45. Bosman, J., Mourik, I.V., Rasch, M., Sieverts, E., andVerhoe�, H. \Scopus reviewed and compared: Thecoverage and functionality of the citation databaseScopus, including comparisons with Web of Scienceand Google Scholar", Universiteitsbibliotheek, pp. 31{63 (2006).
46. Qin, J. \Semantic similarities between a keyworddatabase and a controlled vocabulary database: Aninvestigation in the antibiotic resistance literature",Journal of the Association for Information Science andTechnology, 51, pp. 166{180 (2000).
47. Chaudhry, S.S. and Luo, W. \Application of genetic al-gorithms in production and operations management: areview", International Journal of Production Research,43, pp. 4083{4101 (2005).
48. Gen, M. and Cheng, R., Genetic Algorithms and En-gineering Optimization, 7, John Wiley & Sons (2000).
49. Dasgupta, D. and Michalewicz, Z., Evolutionary Algo-rithms in Engineering Applications, Springer Science& Business Media (2013).
50. Zhang, Y., Porter, A.L., Hu, Z., Guo, Y., and New-man, N.C. \`Term clumping' for technical intelligence:A case study on dye-sensitized solar cells", Techno-logical Forecasting and Social Change, 85, pp. 26{39(2014).
51. Thukral, A., Jain, A., Aggarwal, M., and Sharma, M.,Semi-automatic Ontology Builder Based on RelationExtraction from Textual Data, Singapore, pp. 343{350(2018).
52. Mohapatra, P., Deng, Y., Gupta, A., \Domain knowl-edge driven key term extraction for IT services",Cham, 11236, pp. 489{504 (2018).
53. Duari, S. and Bhatnagar, V. \sCAKE: semanticconnectivity aware keyword extraction", InformationSciences, 477, pp. 100{117 (2019).
54. Huh, J. \Big data analysis for personalized healthactivities: machine learning processing for automatickeyword extraction approach", Symmetry, 10, p. 93(2018).
55. Momtazi, S. and Moradiannasab, O. \A statisticalapproach to knowledge discovery: Bootstrap analysisof language models for knowledge base population fromunstructured text", Scientia Iranica, 26, pp. 26{39(2019).
56. Hall, D., Jurafsky, D., and Manning, C.D. \Studyingthe history of ideas using topic models", in Proceedingsof the Conference on Empirical Methods in NaturalLanguage Processing, pp. 363{371 (2008).
57. Hornik, K. and Gr�un, B. \Topicmodels: An R packagefor �tting topic models", Journal of Statistical Soft-ware, 40, pp. 1{30 (2011).
58. Weston, S. and Calaway, R. \Getting Started withdoParallel and foreach", Date of Access, 30 (2017).
59. Klavans, R. and Boyack, K.W. \Which type of citationanalysis generates the most accurate taxonomy ofscienti�c and technical knowledge?", Journal of theAssociation for Information Science and Technology,68, pp. 984{998 (2017).
60. Singhal, A. \Modern information retrieval: A briefoverview", IEEE Data Eng. Bull., 24, pp. 35{43(2001).
61. Gronsbell, J., Minnier, J., Yu, S., Liao, K., andCai, T. \Automated feature selection of predictors inelectronic medical records data", Biometrics, 75, pp.268{277 (2019).
62. Hong, C., Liao, K.P., and Cai, T. \Semi-supervisedvalidation of multiple surrogate outcomes with ap-plication to electronic medical records phenotyping",Biometrics, 75, pp. 78{89 (2019).
63. Izadi, N., Aminian, O., and Esmaeili, B. \Occupationalaccidents in Iran: risk factors and long term trend(2007{2016)", Journal of Research in Health Sciences,19, pp. 1{6 (2019).
64. Kogi, K. \Work improvement and occupational safetyand health management systems: common featuresand research needs", Industrial Health, 40, pp. 121{133 (2002).
65. Ohniwa, R.L., Hibino, A., and Takeyasu, K. \Trendsin research foci in life science �elds over the last 30years monitored by emerging topics", Scientometrics,85, pp. 111{127 (2010).
66. Bornmann, L., Leydesdor�, L., and Wang, J. \How toimprove the prediction based on citation impact per-centiles for years shortly after the publication date?",Journal of Informetrics, 8, pp. 175{180 (2014).
67. Wang, J. \Citation time window choice for researchimpact evaluation", Scientometrics, 94, pp. 851{872(2013).
68. Wei, X., Xue, H., and Zhang, J. \Partnership insupply Chain risk management research", Journal ofApplied Science and Engineering Innovation, 2, pp.55{60 (2015).
69. Lee, J., Lapira, E., Bagheri, B., and Kao, H. \Recentadvances and trends in predictive manufacturing sys-tems in big data environment", Manufacturing Letters,1, pp. 38{41 (2013).

M. Rabiei et al./Scientia Iranica, Transactions E: Industrial Engineering 28 (2021) 1830{1852 1851
70. Zhang, L., Luo, Y., Tao, F., et al. \Cloud manufac-turing: a new manufacturing paradigm", EnterpriseInformation Systems, 8, pp. 167{187 (2014).
71. Herrmann, C., Schmidt, C., Kurle, D., Blume, S., andThiede, S. \Sustainability in manufacturing and facto-ries of the future", International Journal of PrecisionEngineering and Manufacturing-Green Technology, 1,pp. 283{292 (2014).
72. Chai, J., Liu, J.N.K., and Ngai, E.W.T. \Applicationof decision-making techniques in supplier selection: Asystematic review of literature", Expert Systems withApplications, 40, pp. 3872{3885 (2013).
73. Wu, F., Yeniyurt, S., Kim, D., and Cavusgil, S.T.\The impact of information technology on supply chaincapabilities and �rm performance: A resource-basedview", Industrial Marketing Management, 35, pp. 493{504 (2006).
74. Akbari, O.Z. \A survey of agent-oriented softwareengineering paradigm: Towards its industrial accep-tance", International Journal of Computer Engineer-ing Research, 1, pp. 14{28 (2010).
75. Amezquita-Sanchez, J.P., Valtierra-Rodriguez, M.,and Adeli, H. \Wireless smart sensors for monitoringthe health condition of civil infrastructure", ScientiaIranica, 25, pp. 2913{2925 (2018).
76. Entezami, A., Shariatmadar, H., and Karamodin,A. \An improvement on feature extraction via timeseries modeling for structural health monitoring basedon unsupervised learning methods", Scientia Iranica,27(3), pp. 1001{1018 (2020).
77. Vazirizade, S.M., Bakhshi, A., Bahar, O., and Nozhati,S. \Online nonlinear structural damage detection usingHilbert Huang transform and arti�cial neural net-works", Scientia Iranica, 26, pp. 1266{1279 (2019).
78. Kontos, E., Blake, K.D., Chou, W.Y.S., and Prestin,A. \Predictors of eHealth usage: insights on the digitaldivide from the Health Information National TrendsSurvey 2012", Journal of Medical Internet Research,16, pp. 1{16 (2014).
79. Holzinger, A., Dehmer, M., and Jurisica, I. \Knowl-edge discovery and interactive data mining inBioinformatics-state-of-the-art, future challenges andresearch directions", BMC Bioinformatics, 15, p. I1(2014).
80. Fan, W. and Bifet, A. \Mining big data: currentstatus, and forecast to the future", ACM sIGKDDExplorations Newsletter, 14, pp. 1{5 (2013).
81. Hashem, I., Abaker Targio, Y., Ibrar, A., Nor Badrul,M.S., Gani, A., and Khan, S.U. \The rise of \bigdata" on cloud computing: Review and open researchissues", Information Systems, 47, pp. 98{115 (2015).
82. Cheung, L.T.O., Fok, L., Tsang, E.P.K., Fang, W., andTsang, H.Y. \Understanding residents' environmentalknowledge in a metropolitan city of Hong Kong,
China", Environmental Education Research, 21, pp.507{524 (2015).
83. Cornell, S., Berkhout, F., Tuinstra, W., et al. \Open-ing up knowledge systems for better responses toglobal environmental change", Environmental Science& Policy, 28, pp. 60{70 (2013).
84. Bala, S. and Kumar, K. \A literature review on kid-ney disease prediction using data mining classi�cationtechnique", International Journal of Computer Scienceand Mobile Computing, 3, pp. 960{967 (2014).
85. Chaurasia, V. and Pal, S. \Early prediction of heartdiseases using data mining techniques", CaribbeanJournal of Science and Technology, 1, pp. 208{217(2013).
86. Masethe, H.D. and Masethe, M.A. \Prediction of heartdisease using classi�cation algorithms", in Proceedingsof the World Congress on Engineering and ComputerScience, p. 2224 (2014).
87. Wager, K.A., Lee, F.W., and Glaser, J.P., Health CareInformation Systems: A Practical Approach for HealthCare Management, John Wiley & Sons (2017).
88. Wickens, C.D., Hollands, J.G., Banbury, S., andParasuraman, R., Engineering Psychology & HumanPerformance, Psychology Press (2015).
89. Landy, F.J. and Conte, J.M. Work in the 21st Century,Binder Ready Version: An Introduction to Industrialand Organizational Psychology, John Wiley & Sons(2016).
Biographies
Mohammad Rabiei received his BS degree in Com-puter Science from Shahid Bahonar University of Ker-man, Iran, in 2007, and his MS degree in IT Engi-neering (E-Commerce) from K.N.T University of Tech-nology, Iran, in 2009. He is currently a PhD studentin IT Engineering (E-Commerce) at Iran Universityof Science and Technology. He became a lecturer in2006 and joined the Iranian Research Institute forInformation Science and Technology (IranDoc) as afaculty member in 2010. He is also an instructor ofan E-Business Group. His research interests includetext mining, Natural Language Processing (NLP), anduser information behavior analysis.
Seyyed-Mahdi Hosseini-Motlagh obtained his BSdegree in Industrial Engineering from Iran Universityof Science and Technology, Iran, and his MS andPhD degrees in Industrial Engineering, in 2003 and2008, respectively, from Tarbiat Modares University,Iran. He is currently Associate Professor of IndustrialEngineering at Iran University of Science and Technol-ogy. His research interests include healthcare operationmanagement, supply chain network design, stochasticand robust optimization, channel coordination androuting problems.

1852 M. Rabiei et al./Scientia Iranica, Transactions E: Industrial Engineering 28 (2021) 1830{1852
Abdorrahman Haeri obtained his BS degree inIndustrial Engineering from Isfahan University of Tech-nology, Iran, his MS degree in Industrial Engineering,in 2008, from Sharif University of Technology, Iran,and his PhD in Industrial Engineering, in 2012, fromTehran University, Iran. He is currently AssistantProfessor of Industrial Engineering at Iran Universityof Science and Technology. His research interests in-clude data mining, text mining, and Data EnvelopmentAnalysis (DEA).
Behrouz Minaei Bidgoli obtained his PhD fromMichigan State University, Michigan, USA, in Com-puter Science and Engineering, and is currently Asso-ciate Professor in the School of Computer Engineeringat Iran University of Science & Technology, Tehran,Iran. He is the head of a research group in video gamedevelopment, as well as a laboratory in Data Mining.His research interests include soft computing, machinelearning, video game development, text mining, andnatural language processing.