evolution of the mass-loss rate during atmospheric and
TRANSCRIPT
1
Evolution of the mass-loss rate during atmospheric and
pressurized slow pyrolysis of wheat straw in a bench-
scale reactor
Gianluca Grecoa, María Videgaina, Christian Di Stasia, Belén Gonzáleza, Joan J.
Manyàa,b,*
a Technological College of Huesca, b Aragón Institute of Engineering Research (I3A), University of
Zaragoza, crta. Cuarte s/n, Huesca E-22071, Spain
* Corresponding author. E-mail address: [email protected].
2
HIGHLIGHTS
Higher pressure led to higher devolatilization rates in a narrower period of time
Using a mixture of CO2 and N2 at 0.1 MPa favored the thermal cracking of volatiles
Under CO2/N2 an increased pressure led to a decrease in the yields of CO and CH4
Biochar produced at 0.1 MPa under CO2/N2 had the highest specific surface area
ABSTRACT
In the present study, the effects of the absolute pressure (0.1 or 0.5 MPa) and the reactor atmosphere
(pure N2 or a mixture of CO2/N2) on the pyrolysis behavior of wheat straw pellets (at 500 °C) were
investigated. The most interesting aspect of this work was the use of a weighing platform (with a
maximum capacity of 100 kg and a resolution of 0.5 g) to monitor the real-time mass-loss data for
the biomass sample (with an initial mass of 400 g). It was observed that an increased pressure
considerably affects the mass-loss profiles during the pyrolysis process, leading to higher
devolatilization rates in a shorter period of time. Regardless of the pyrolysis atmosphere, an increase
in the absolute pressure led to higher yields of gas at the expense of produced water and condensable
organic compounds. This finding could be due to the fact that an increased pressure favors the
exothermic secondary reactions of the intermediate volatile organic compounds in both liquid and
vapor phases. The switch from pure N2 to a mixture of CO2 and N2 at 0.1 MPa also led to a remarkable
increase in the yield of produced gas at the expense of the total liquid. This could be mainly due to
the promotion of the thermal cracking of the volatile organic compounds at a high partial pressure of
CO2, which is also consistent with the measured higher yields of CH4 and CO. The increased yield of
CO can also be seen as a direct result of the enhanced reverse Boudouard reaction, which can also
explain the much higher specific surface area (and ultra-micropore volume) measured for the biochar
produced under the same operating conditions (0.1 MPa and a mixture CO2/N2 as pyrolysis medium).

3
KEYWORDS
Wheat straw; Pyrolysis; Biochar; CO2 atmosphere; Pressure; Devolatilization rate
4
1. Introduction
The energy crisis, environmental pollution and global warming are serious problems, which have
recently generated a growing interest in developing new technologies focused on reducing the
greenhouse gas emissions and increasing the carbon sinks [1]. A promising solution for such issues
is biochar [2], a form of charred organic matter, which is possible to apply to soil in a deliberate
manner as a means of potentially improving soil productivity and carbon sequestration [3]. In order
to produce biochar, pyrolysis of agricultural wastes seems to be an interesting solution, due to its
feasibility to manage biowaste and simultaneously generate environmental and agronomic benefits
[4,5]. Among the wide range of pyrolysis processes, slow pyrolysis is a promising route to produce a
relatively high yield of biochar, obtaining gas as co-product for cogeneration use. This process, which
is carried out at low heating rates and long residence times of both the solid and vapor phases [6], is
relatively simple and robust and can be feasible for small-scale and farm-based production of biochar
[7]. Given the high number of variables affecting the process (such as peak temperature, heating rate,
gas residence time, and pressure) and the wide range of available biomass sources, (the nature of
which largely affects the pyrolysis process) a large variability in the yield and properties of the
produced biochar should be expected. Therefore, one of the main challenges nowadays is to optimize
the process conditions of the pyrolysis process for a given biomass feedstock [8,9] with the aim to
obtain an engineered biochar with the desired properties to be used for a given application. Regardless
of the final use of the produced biochar (e.g., soil amendment, material precursor for activated
carbons), the assessment of the stability of biochar’s carbon appears to be essential in order to evaluate
its potential as carbon sequestration agent.
Among all the process variables, the absolute pressure is probably one of the most interesting
parameters to study in deep. Relatively few studies [4,10–16] have been focused on the effect of the
absolute pressure on the biomass pyrolysis behavior. Most of these earlier studies reported an increase
in the char and gas yields, while the yield of the condensable fraction decreased, when both the
pressure and the residence time of the vapor phase were increased [13,15–19]. Nevertheless, some
5
authors found a negligible [20] or even a negative [10,21] effect of the absolute pressure on the char
yield. For instance, Manyà et al. [10], who analyzed the effect of the absolute pressure (in the range
of 0.1–1.0 MPa) on the pyrolysis of two-phase olive mill waste in a laboratory-scale fixed-bed reactor
(keeping constant the residence time of the vapor phase within the reactor by adjusting the mass flow
rate of the inert gas), already observed a significant decrease in the char yield when the pressure was
increased. This finding suggested that the real effect of pressure (i.e., without interaction of the
residence time of the vapor phase) was really complex, since an increased pressure could lead to an
enhancement of the kinetics of the steam gasification reaction, which might be further explained by
the catalytic effect of the alkali and alkaline earth metal species (AAEMs) present in the biomass
feedstock. Therefore, the effect of the absolute pressure on the pyrolysis behavior of any feedstock
has not been properly demonstrated yet.
Another important parameter affecting the pyrolysis behavior is the type of carrier gas used to
maintain oxygen-free conditions [5]. In terms of energy efficiency, the flue gas generated by
combustion of pyrolysis gas can be used as pyrolysis gas environment. This approach, which can lead
to important cost savings [22], may be suitable in small-scale and farm-based systems, resulting in an
improvement in the biochar production process in terms of economic feasibility, environmental
impact, and thermal efficiency. Nevertheless, further research is needed to analyze the effects of
modifying the inert environment (i.e., from pure N2 to a flue gas containing CO2) on the pyrolysis
products distribution as well as on the biochar properties.
As mentioned above, special attention should also be paid to those properties of biochar that are
related to its carbon sequestration potential. For this purpose, the fixed-carbon content and the atomic
H:C and O:C ratios appear as useful rough indicators of the long-term stability of biochar’s carbon
[9,23–26]. In fact, a recent publication [25] reported that the above-mentioned indicators exhibited a
strong correlation with both the recalcitrance index (R50) [27] and the stable-C [28], which are based
on the relative thermal stability of a given biochar to that of graphite (R50), and on oxidation of biochar
using H2O2 to accelerate the oxidative loss of carbon (stable C).
6
The specific aim of this study is to analyze the effect of both the absolute pressure (0.1 or 0.5 MPa)
and the type of pyrolysis atmosphere (pure N2 or a binary mixture of CO2 and N2, 60:40 v/v), at a
constant peak temperature of 500 °C, on the pyrolysis behavior of wheat straw pellets in a pressurized
fixed-bed reactor. The pyrolysis device is equipped with a weighing platform, which was employed
to monitor the real-time mass loss of the biomass along the pyrolysis process. To the best of our
knowledge, this is one of the first studies using a bench-scale reactor coupled to a weighing platform.
This approach can provide very useful insights to better understand the pyrolysis behavior at a
relatively large scale (compared to traditional TGA or even macro-TGA measurements), where the
secondary reactions of primary volatiles play a key role. The simultaneous analysis of the real-time
mass-loss data, gas composition, and temperature profiles can provide a unique way to assess the role
played by the studied factors (pressure and pyrolysis atmosphere) on the pyrolysis process.
2. Experimental Section
2.1. Biomass feedstock
The wheat straw (WS) pellets (7 mm OD and approximately 12 mm long) used in this work were
supplied by a Belgian company. No binder was used in making the pellets. WS pellets were directly
pyrolyzed without any preliminary milling step. The reason is that the efficiency of carbonization can
be improved for large particles as compared with small ones, leading to charcoals with higher fixed-
carbon contents [24,29].
Proximate analysis was performed in quadruplicate according to ASTM standards (D3173 for
moisture, D3174 for ash, and D3175 for volatile matter), whereas ultimate analysis was carried out
in triplicate using a combustion elemental analysis Leco CHN628 (Leco Corporation, USA). In
addition, X-Ray Fluorescence (XRF) spectroscopy analysis (ADVANT’XP+ XRF spectrometer from
Thermo ARL, Switzerland) was performed in order to determine the inorganic constituents of the
biomass ash.
7
A thermogravimetric analyzer (Netzsch 449 F1 Jupiter) was used to obtain the pyrolysis
thermogravimetric curves (at a heating rate of 10 K min−1 and a final temperature of 800 °C) under
an environment of pure N2. The initial mass of sample was 10 mg. In order to roughly estimate the
contents of the main biomass constituents, the experimental differential thermogravimetric (DTG)
curve was deconvoluted into three peaks using the “Peak Analyzer” tool implemented in OriginPro
version 9.0 (OriginLab, USA). These three peaks can be associated to the devolatilization of
hemicelluloses plus extractives (peak 1), cellulose (peak 2), and lignin (peak 3) [25].
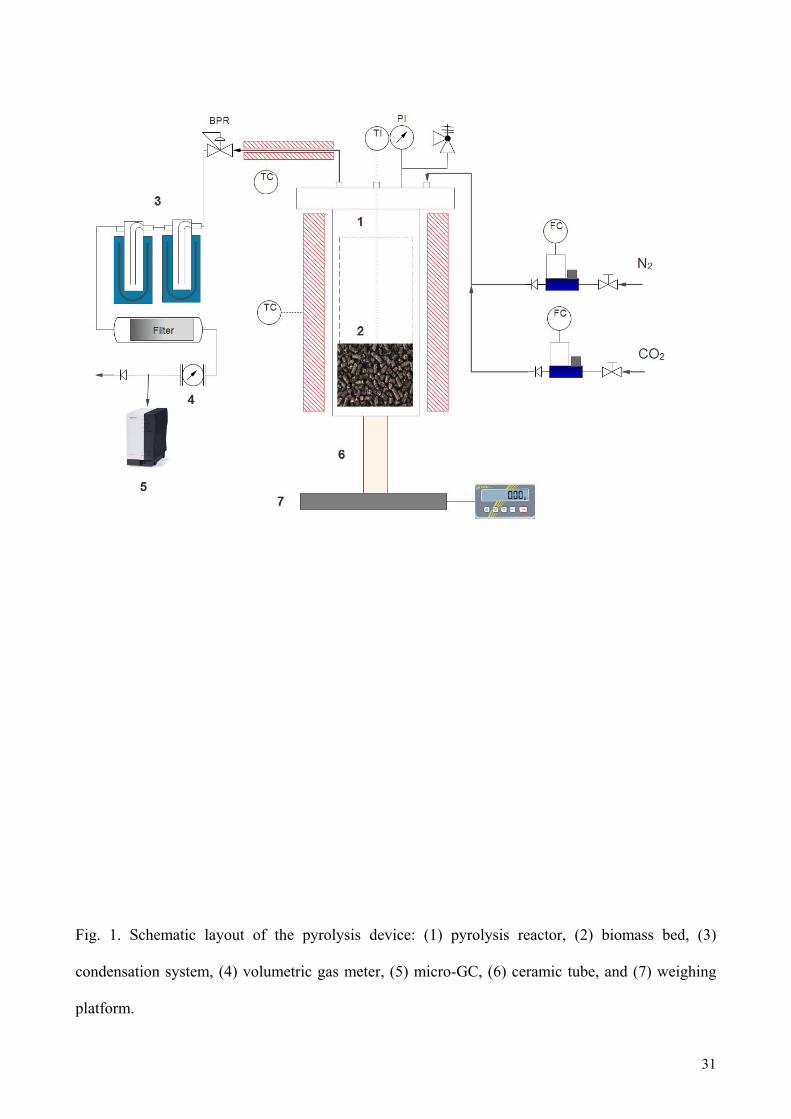
2.2. Pyrolysis device and experimental procedure
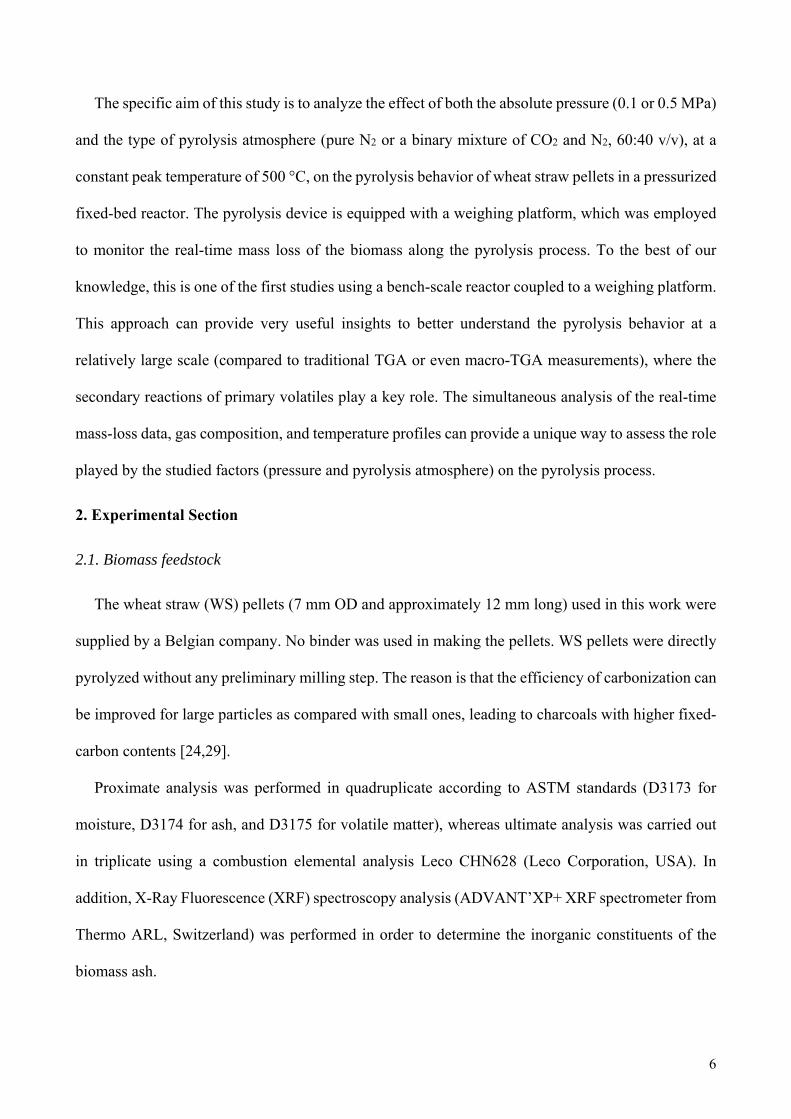
Pyrolysis runs were conducted in duplicate in a bench-scale fixed-bed reactor. Fig. 1 shows the
scheme of the experimental device, the details of which are available in a previous study [5]. Briefly,
the reactor (140 mm ID and 465 mm long) was made of Sandvik 253 MA stainless steel (EN 1.4835).
A basket of 4 L, made of AISI 316 (EN 1.4401) stainless steel wire mesh, was used to allocate the
biomass into the reactor. The initial sample weight was approximately 400 g, which represented
around 30% of the basket volume. A weighing platform from Kern (model DS with a measuring range
up to 100 kg and a reading precision of 0.5 g) was placed at the bottom of the reactor system. A
ceramic tube (117 mm OD and 330 mm long) was positioned between the reactor vessel and the
weighing platform for thermal insulation purposes. Flexible stainless-steel tubing from Swagelok (10
mm OD) were used for the reactor connections to minimize any force component.
As widely reported in literature [7,8,10,30–34], higher pyrolysis temperatures usually led to lower
biochar yields, hydrogen and oxygen contents, and aliphatic carbon fraction. In other words,
increasing peak temperature results in more potentially stable biochars. However, it is interesting to
find a compromise between yield and potential stability. In this sense, a previous study [35] showed
that pyrolysis peak temperatures higher than 500 °C could be enough to obtain a biochar with an
appropriate content of stable polycyclic aromatic carbon. Moreover, our previous experience with
other biomass sources [25] indicated that higher temperatures (e.g., 600 °C) did not necessarily lead
8
to a further improvement in the potential stability of biochar. Therefore, a peak temperature of 500
°C was selected as a reasonable trade-off between the biochar yield and its potential stability and was
kept constant for all the pyrolysis runs.
In the present study, the experimental factors to consider were the absolute pressure (0.1 or 0.5
MPa) and the type of carrier gas (pure N2 or a mixture of CO2 and N2, 60:40 v/v). The real flow rate
of the carrier gas within the reactor at 500 °C was kept constant at 3.24 L min−1, regardless of the
pressure applied, by properly adjusting the mass flow rate. Assuming an entire reactor’s void-volume
fraction of 0.9, the above-mentioned flow rate corresponds to a gas-hourly space velocity (GHSV) of
36 h−1. This approach is interesting in order to assess the effect of the absolute pressure instead of the
combined effect of the absolute pressure plus the pressure-dependent gas residence time.
Temperature inside the bed was measured by four thermocouples located in a thermowell (placed
at a radial distance of 35 mm from the axis) at different heights from the bottom of the sample basket:
10 mm (TC0), 50 mm (TC1), 200 mm (TC2), and 300 mm (TC3). During the course of the pyrolysis
runs, the sample was heated at an average heating rate of 5 °C min–1 to reach the peak temperature
(500 °C). Due to the fact that a certain thermal gradient can exist along the packed bed, the average
temperature of the two thermocouples placed at the bottom of the bed (TC0 and TC1) was chosen as
the main process temperature. A soaking time of 60 min (at the peak temperature) was chosen to
ensure the thermal equilibrium.
A back-pressure regulator was used to maintain the pressure of the system at a desired value. The
outlet gas stream passed through a heated line, maintained at a temperature of around 375 °C, before
being passed through a series of glass traps, which were immerged in ice-water baths. After each
experiment, the biochar produced was collected and weighted. The glass traps were weighted before
and after each pyrolysis run to estimate the total mass of liquid (water + organics). The pyrolysis
liquid was recovered directly from the condensers without using any solvent as wash liquid. The
water content of the pyrolysis liquid was then determined by Karl Fischer titration, while the yield of
organic compounds was determined by difference from the total mass of liquid.
9
The composition of the major components of the pyrolysis gas (N2, CO2, CO, CH4, C2HX and H2)
was determined using a micro gas chromatograph (µ-GC, Agilent 490) equipped with two analytical
columns: a Molsieve 5A (using Ar as carrier gas) and a PolarPlot U (using He as carrier gas). The
mass of produced gas was estimated from the N2 mass balances.
In order to correct the buoyancy and other thermal expansion effects, blank tests (i.e., empty
reactor) at 0.1 and 0.5 MPa were carried out employing the same heating program as for the
experiments with biomass. The real-time mass loss for a given pyrolysis test was then obtained by
subtracting the blank measurement from the raw signal.
2.3. Characterization of the pyrolysis products
The mass yield of biochar (ychar), volatile organic compounds (yorg), produced water (ywater) and
produced gas (ygas) were calculated on a dry and ash-free (daf) basis. Biochar samples were
characterized by both proximate and ultimate analyses following the same procedures as described in
Section 2.1. The carbonization efficiency was assessed by determining the fixed-carbon yield (yFC),
similarly to how it was done in previous studies [10]:
yFC = xFC,bc ychar (1)
where xFC,bc is the mass fraction of fixed-carbon in the biochar (calculated in a dry and ash-free basis).
The value of yFC corresponds to the fraction of organic matter initially present in the biomass
feedstock that is converted into fixed carbon.
Due to the highly microporous structure of biochar, specific surface areas (SBET) were determined
from the CO2 adsorption isotherms at 0 °C [36], which were obtained using an ASAP 2020 gas
sorption analyzer from Micromeritics (USA). Samples (around 120–200 mg) were previously
degassed under dynamic vacuum conditions to constant weight at 150 °C. Pore size distributions
(from 0.35 to 1.0 nm) and the ultra-micropore volume (Vultra, for pore sizes lower than 0.8 nm) of
biochars were estimated using a Grand Canonical Monte Carlo (GCMC) method for carbon slit-
10
shaped pores. All the calculations from CO2 adsorption isotherms were performed using the
MicroActive software supplied by Micromeritics.
3. Results and discussion
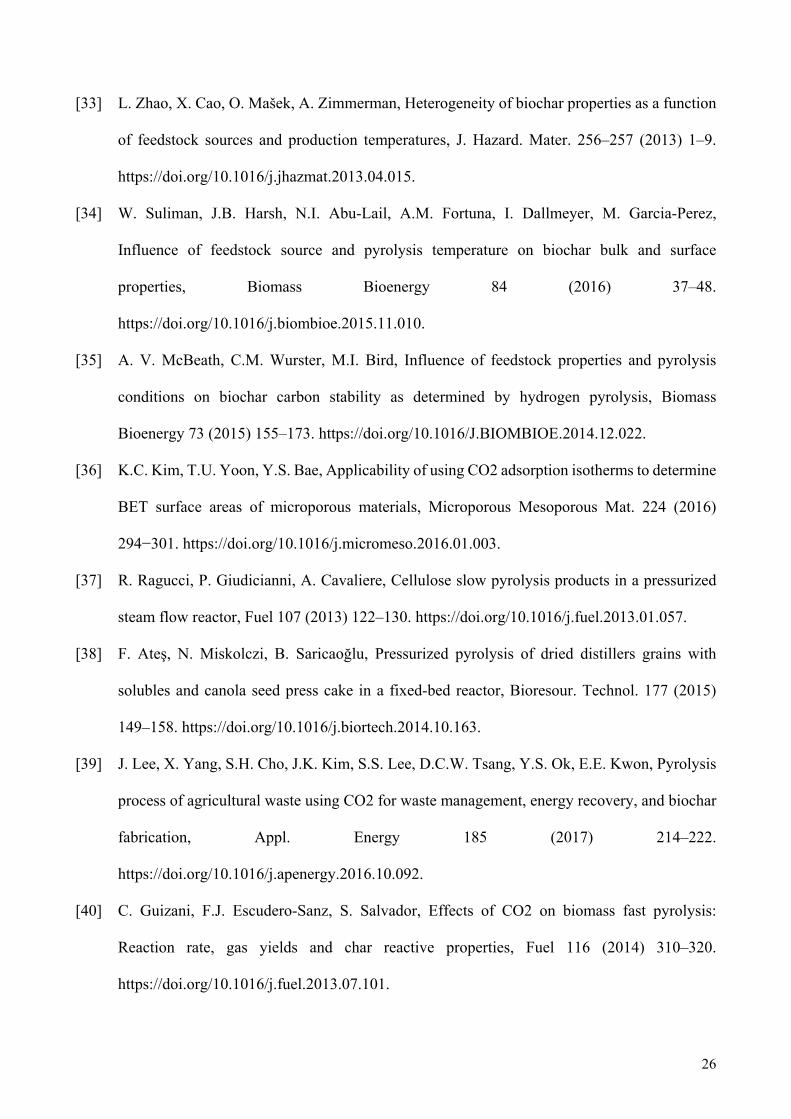
Table 1 shows the results pertaining to the characterization of the wheat straw pellets (proximate,
ultimate, and XRF analysis). From the results concerning the inorganic constituents, it should be
highlighted the high amount of K and Ca (AAEMs). Hence, a certain catalytic role of them should be
expected in this study.
The mass-balance closures for the pyrolysis tests were estimated to be within 91%−99% (see Table
S1 in the Supplementary Data). The mass yields of the different pyrolysis products (ychar, ywater, yorg
and ygas) were calculated attributing the error in the mass-balance closure to minor inaccuracies in
determining the mass of produced gas. As each experimental run was conducted in duplicate, the
mass yields of the pyrolysis products correspond to the average values.
With regard to the accuracy of the obtained mass-loss curves, we assessed the repeatability of three
blank tests (two at 0.1 MPa and one at 0.5 MPa) as well as four pyrolysis runs (at 0.1 MPa and using
a mixture of CO2 and N2 as carrier gas). The results from the three blank tests (see Fig. S1) indicated
a reasonable degree of repeatability. Also according to Fig. S1, pressure had a negligible effect on
the blank mass-loss curve. Therefore, we took the average from the three replicates as the blank signal
to be subtracted from the raw mass-loss curves. For its part, Fig. S2 displays the results obtained from
the four repeated pyrolysis runs. As can be seen from Fig. S2, a more than acceptable degree of
repeatability was reached (see also explanatory notes for Fig. S2 in the Supplementary Data).
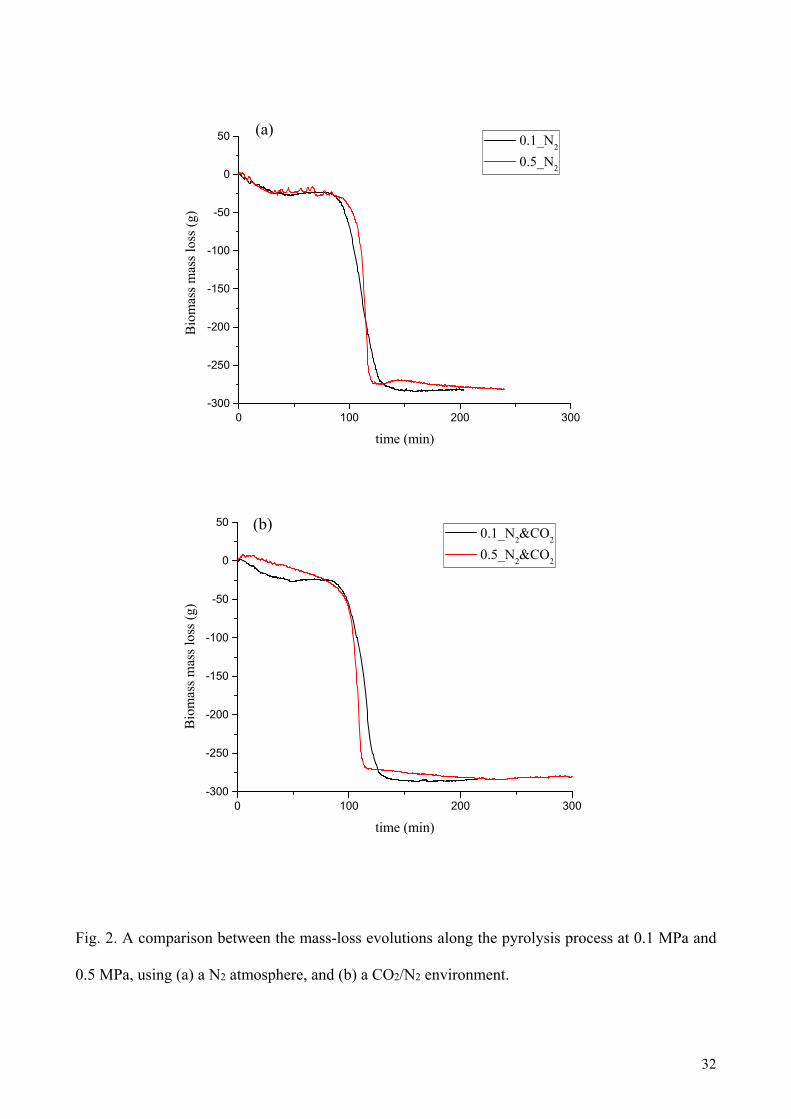
3.1. Pyrolysis behavior
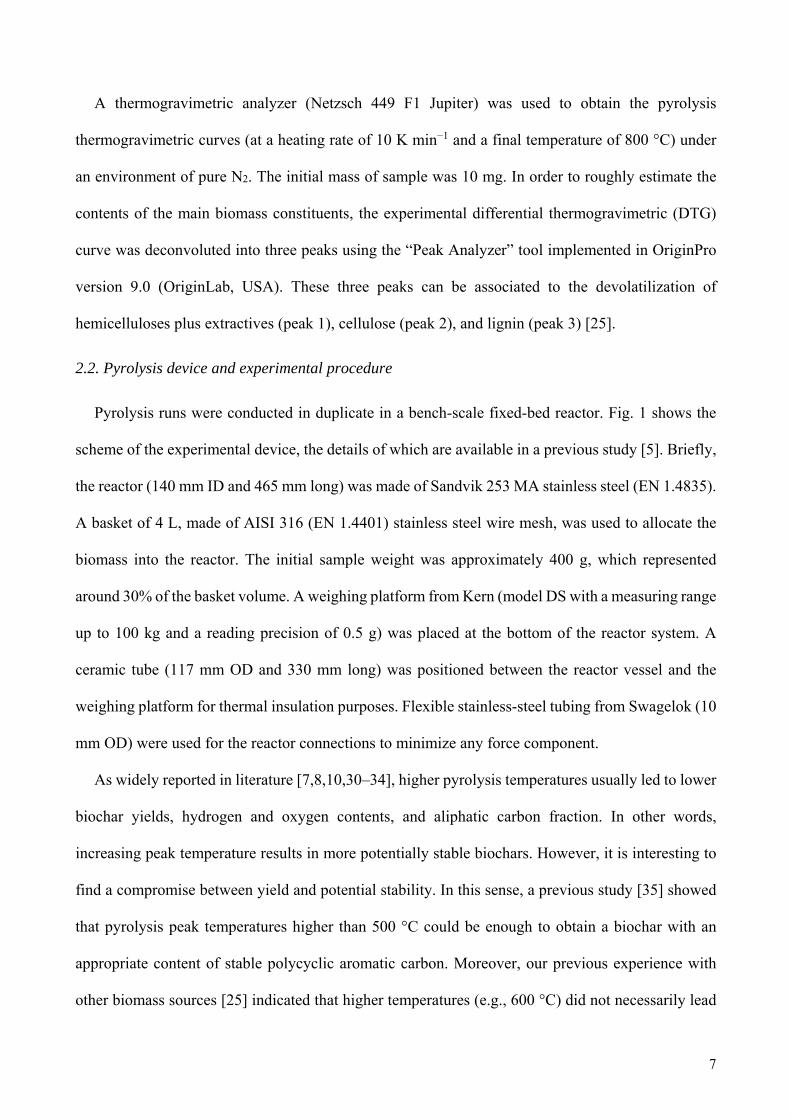
Fig. 2 shows the mass-loss profiles obtained for the four pyrolysis runs: at 0.1 and 0.5 MPa under
pure N2 (0.1_N2; 0.5_N2) in Fig. 2a; and at 0.1 and 0.5 MPa under the mixture CO2/N2 (0.1_N2&CO2;
0.5_N2&CO2) in Fig. 2b. A certain level of noise can be seen in the mass loss plots. This noise is
difficult to avoid in practice, since several factors such as the room temperature (small changes of
11
which could slightly alter the weight measurement due to the extreme sensitivity of the scale), small
changes in the heating program, and the exact position of the reactor inside the furnace could
markedly affect the stability of the acquired signal over time. However, the plots displayed in Fig. 2
provide a very interesting information for the purpose of the present work. As expected, two mass-
loss steps are clearly shown in Fig. 2. The first one corresponds to the evaporation of the moisture
fraction of the feedstock, whereas the second one is the mass loss due to the devolatilization process
at 180‒500 °C.
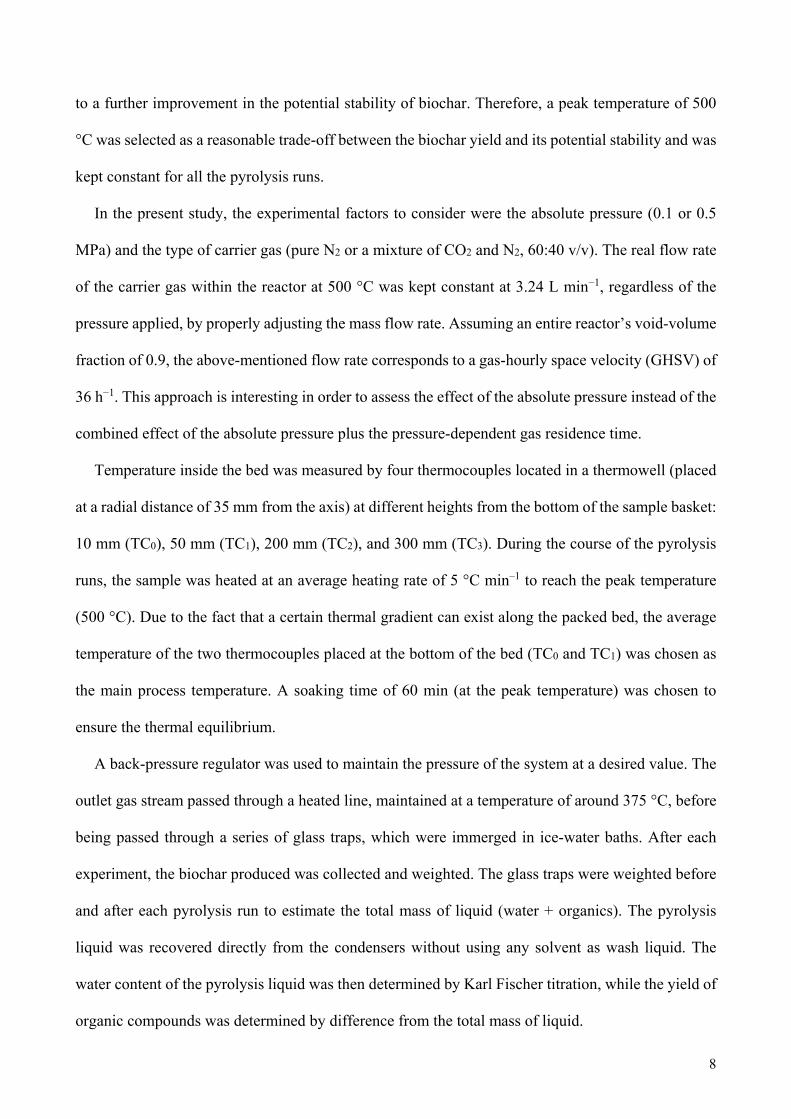
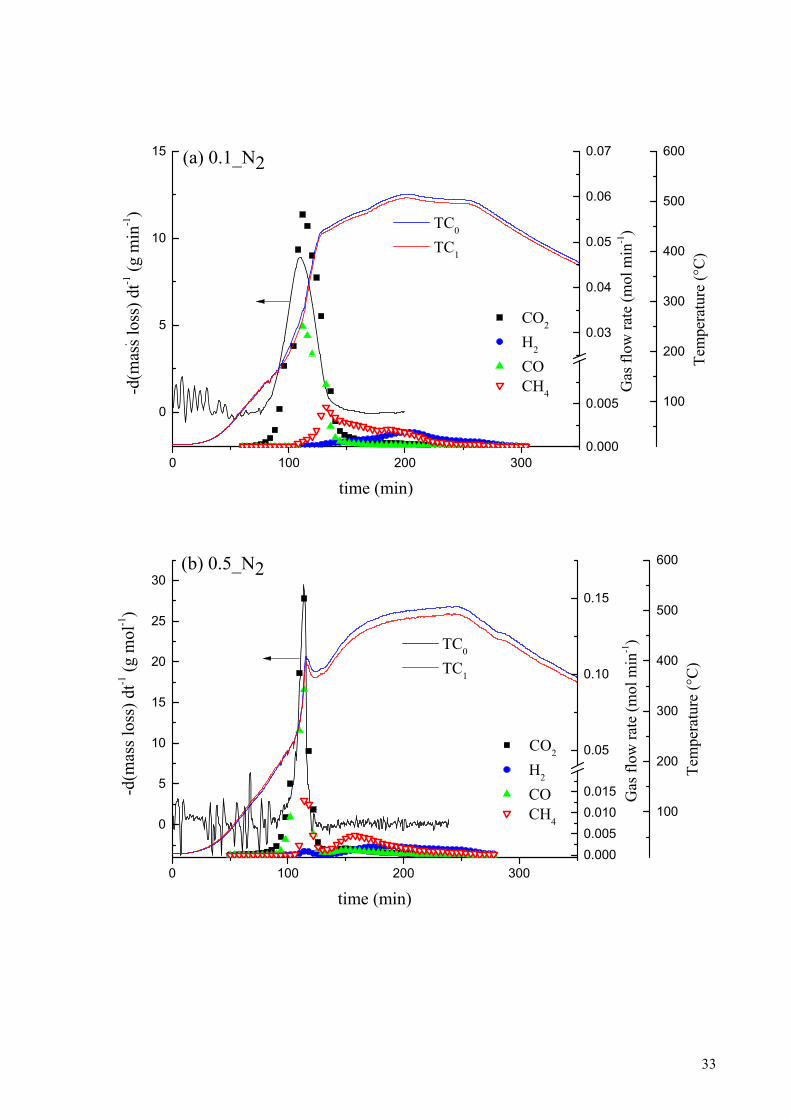
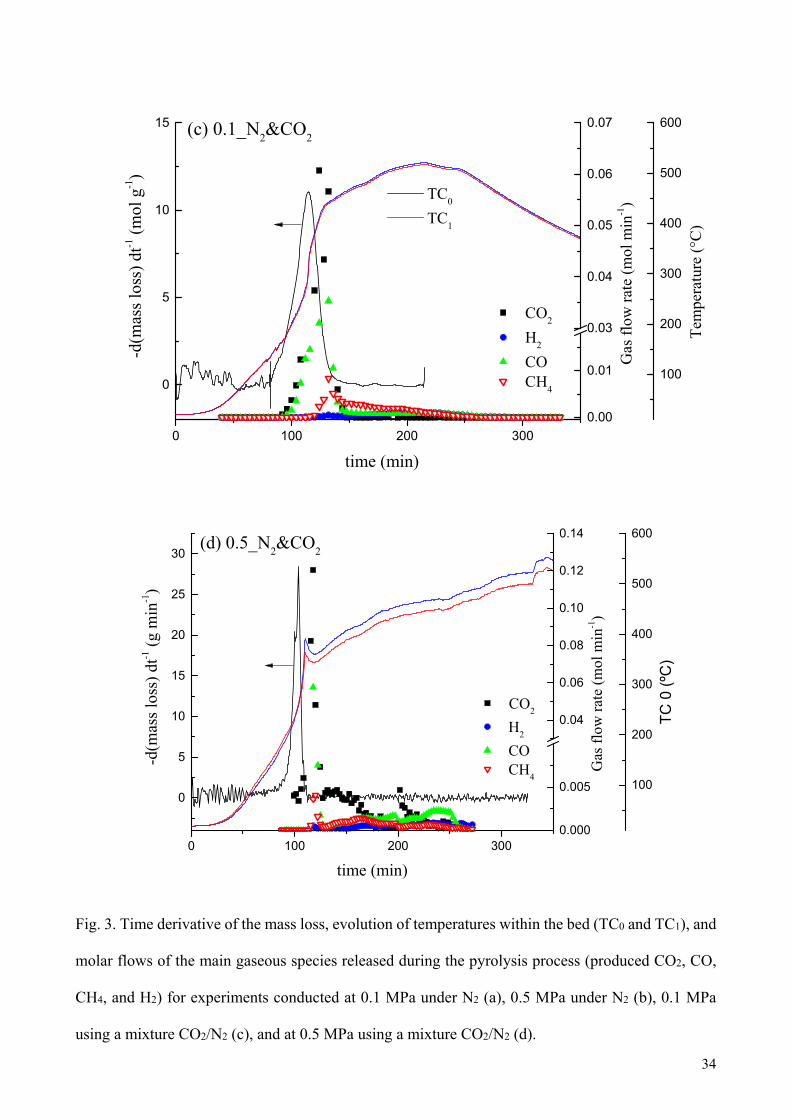
To better visualize the effects of the studied factors on the pyrolysis behavior, Fig. 3
simultaneously displays the time derivative of the mass loss, the evolution of temperature within the
bed (TC0 and TC1), and the molar flows of the main gaseous species released during the pyrolysis
process (produced CO2, CO, CH4, and H2). The detailed location of the four thermocouples and the
obtained axial temperature profiles (for all thermocouples) are shown in Figs. S3 and S4, respectively.
The plots in Fig. S4 clearly show severe axial temperature gradients throughout the reactor, especially
for the thermocouples located outside the packed bed (TC2 and TC3). For pyrolysis runs performed
at 0.5 MPa, the temperature gradients slightly decreased (i.e., higher values were recorded by
thermocouples TC2 and TC3), probably as a consequence of the enhanced convective heat transfer
related to the higher N2 mass flow rate. Nevertheless, no large differences in the temperatures
measured by TC0 and TC1 (both located within the bed) were found. This could confirm a relatively
homogeneous heating throughout the bed length.
In light of the shape of the time derivatives of the mass loss shown in Fig. 3, it can be pointed out
that the absolute pressure greatly affected the release of volatiles during the pyrolysis process. At 0.5
MPa, and regardless of the pyrolysis atmosphere, higher devolatilization rates in a narrower period
of time, compared to the two experiments conducted at 0.1 MPa, were clearly observed. Regarding
the position of the mass-loss peaks, the temperatures at which the highest devolatilization rate was
attained (Tmax) were: 263 °C (0.1_N2), 339 °C (0.5_N2), 300 °C (0.1_N2&CO2), and 261 °C
(0.5_N2&CO2). Therefore, the values of Tmax seem to depend on both the absolute pressure and the
12
pyrolysis atmosphere. Unexpectedly, these temperature values were relatively similar and, in the most
of cases, even lower than that deduced from the thermogravimetric analysis (around 325 °C, as can
be deduced from the DTG curve shown in Fig. S5). Considering the heat transfer limitations existing
in our fixed-bed reactor system, this unexpected result could be due to the presence of large radial
temperature gradients. In other words, the temperatures registered by the thermocouples could
correspond to the lowest (or almost lowest) temperature values in the bed at a given time. In the next
subsections, further discussion is provided for each of the two different pyrolysis atmospheres.
3.1.1. Pure N2 atmosphere
It is generally assumed that an increase in the absolute pressure could lead to a promotion of the
secondary cross-linking reactions at relatively low temperatures (i.e., lower than Tmax), as a
consequence of the restricted release of volatiles [25,37]. This fact can explain the observed behaviors
when the pyrolysis atmosphere was pure N2: an increase in Tmax with pressure and, as shown in Fig.
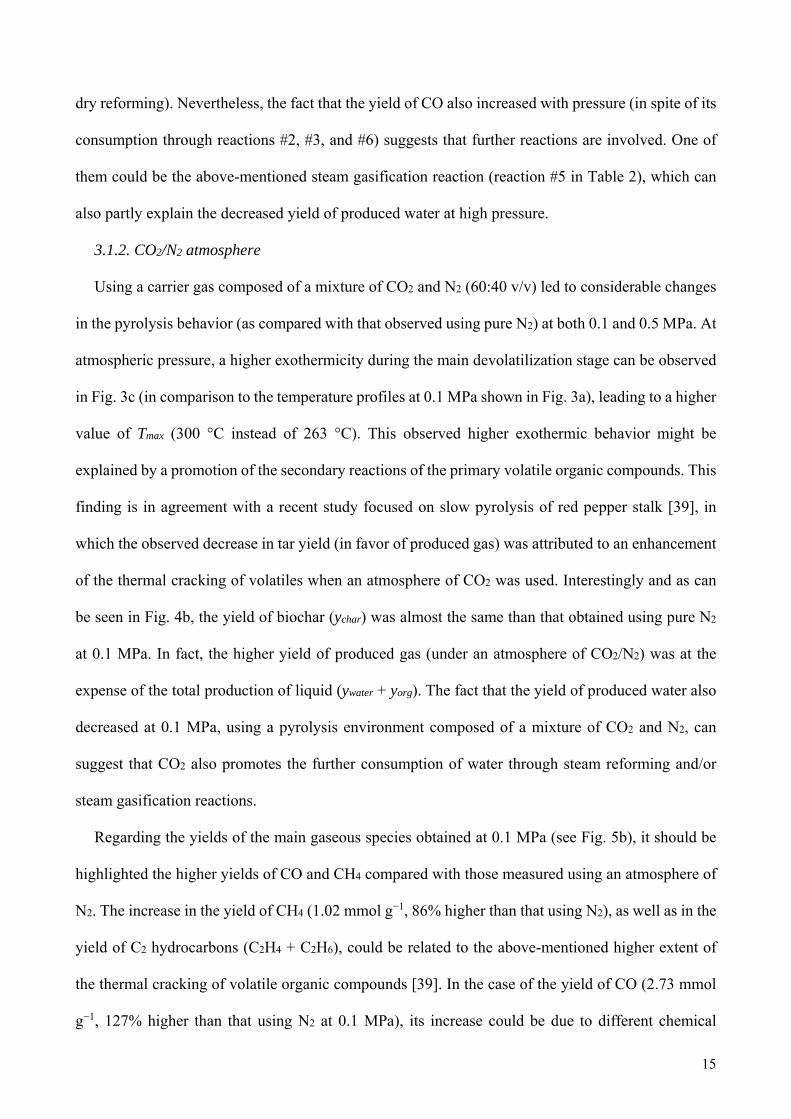
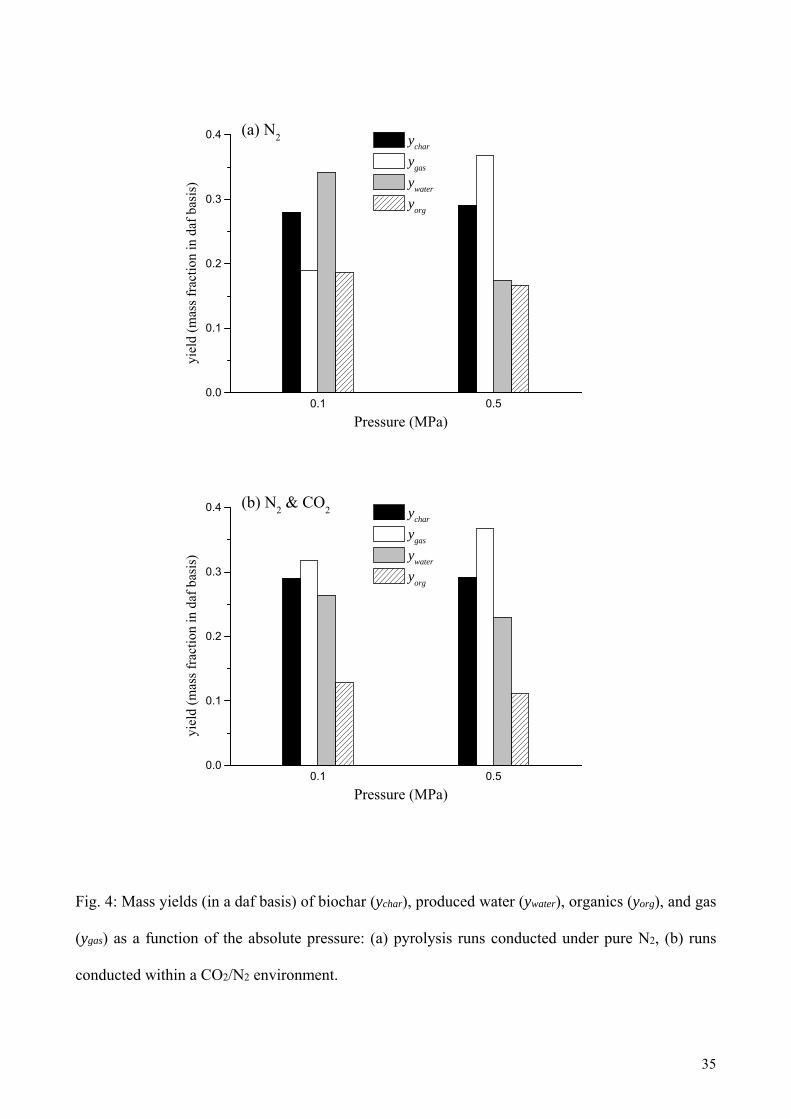
4a, an increase in the yield of produced gas (ygas) at the expense of both the produced water (ywater)
and, to a lesser extent, the condensable organic compounds (yorg). The yield of biochar, however, was
kept almost constant, regardless of the pressure applied. This can suggest that an increased pressure
results in a double effect: (1) a higher pressure (probably combined with the catalytic role of the
AAEM species) can enhance the release of volatiles (once they reach the increased saturation
temperature), leading to a higher devolatilization rate at higher temperatures; and (2), and as
mentioned above, a higher pressure can also promote the secondary charring reactions (especially at
intra-particle level and at relatively low temperatures) and simultaneously favor the thermal cracking
and steam reforming of intermediate volatile organic compounds, leading to a decrease in the
cumulative yield of the total liquid (mainly water) at the expense of produced gas and biochar.
The observed decrease in the yield of produced water with pressure, which was also reported by
Ates et al. [38] for the pressurized pyrolysis of two biomass sources, seems to be contradictory with
the higher extent of the secondary reactions of the primary volatile species, since both thermal
cracking and dehydration processes can notably increase the production of water [19]. However, a
13
higher consumption of water can also be promoted by pressure by means of an enhancement of several
reactions: (1) steam reforming of volatile organic compounds and/or light hydrocarbons, (2) water-
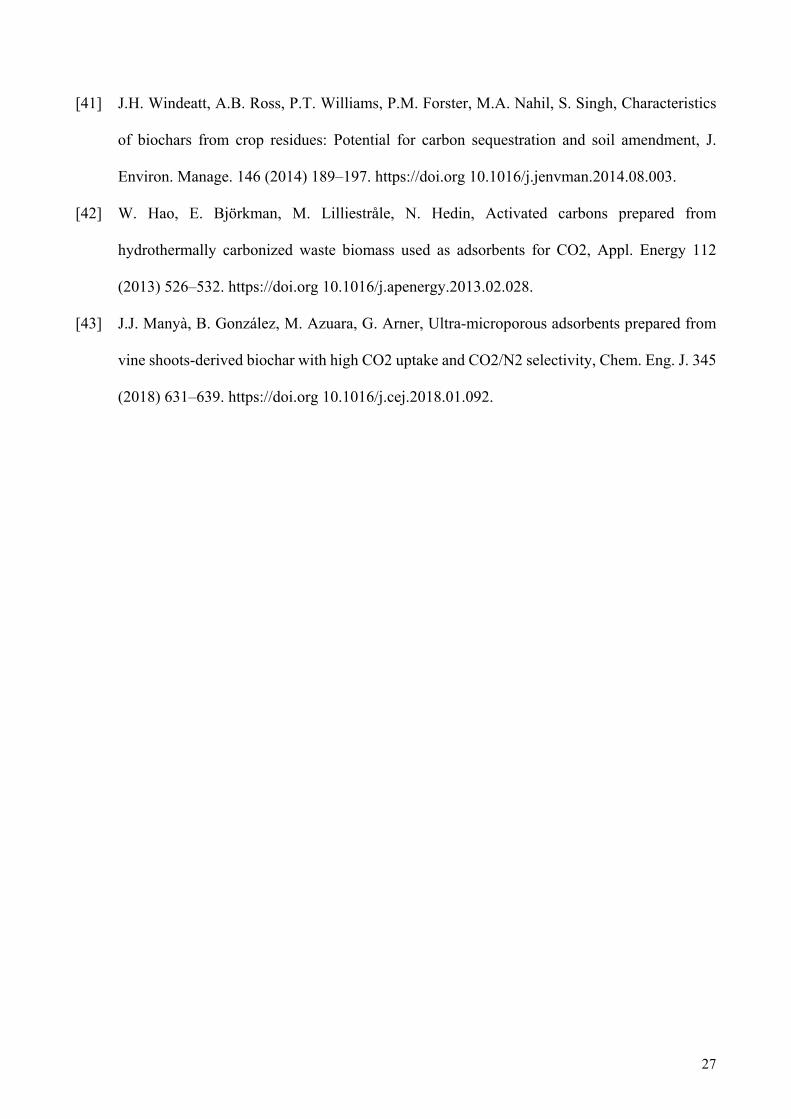
gas-shift reaction (reaction #1 in Table 2), and (3) steam gasification (reaction #5 in Table 2). Despite
the fact that secondary reactions of primary volatiles could mainly explain the obtained product
yields, a certain role of the theoretical reactions listed in Table 2 cannot be ignored, since the residence
time of permanent gases within the reactor is quite long (around 100 s assuming a GHSV of 36 h–1).
In this sense and as already observed in previous studies [4,10], a low (but certain) extent of the steam
gasification reaction cannot be discarded. In spite of the extremely low temperature and the related
thermodynamic limitations, the AAEMs contained in the wheat straw pellets (especially K, with a
relatively high content, as reported in Table 1) can enhance the kinetics of the reaction, especially at
0.5 MPa. This can also partly explain the almost constant yield of biochar regardless of the pressure
applied. In other words, a certain consumption of carbon via steam gasification can compensate the
additional char produced through secondary charring reactions of the primary volatiles.
Fig. 3 also shows that the absolute pressure caused a certain effect on the evolution of the two
temperatures inside the bed (TC0 and TC1). Both temperatures just increased up to approximately 500
°C (the selected peak temperature) at 0.1 MPa, showing the highest heating rate in correspondence
with the highest devolatilization rate. However, when the pressure was set at 0.5 MPa, the two
temperatures increased along the process, showing a heating rate (during the devolatilization step)
faster than that observed at atmospheric pressure. This is consistent with the higher extent of the
above-mentioned secondary reactions, which have an exothermic nature. The observed slight
decrease in temperature (of about 30 °C, just after attaining the highest devolatilization rate) for
pressurized experiments can be explained by a transient response of the PID controller (i.e., a lower
power was supplied to the furnace during a relatively short period).
Concerning the gas release profiles (also shown in Fig. 3), it can be seen that CO2 and CO were
the first gases to be released in all the cases, showing a peak at approximately the value of Tmax (263
°C and 339 °C at 0.1 and 0.5 MPa, respectively; see Fig. 3a), followed by the generation of CH4 and
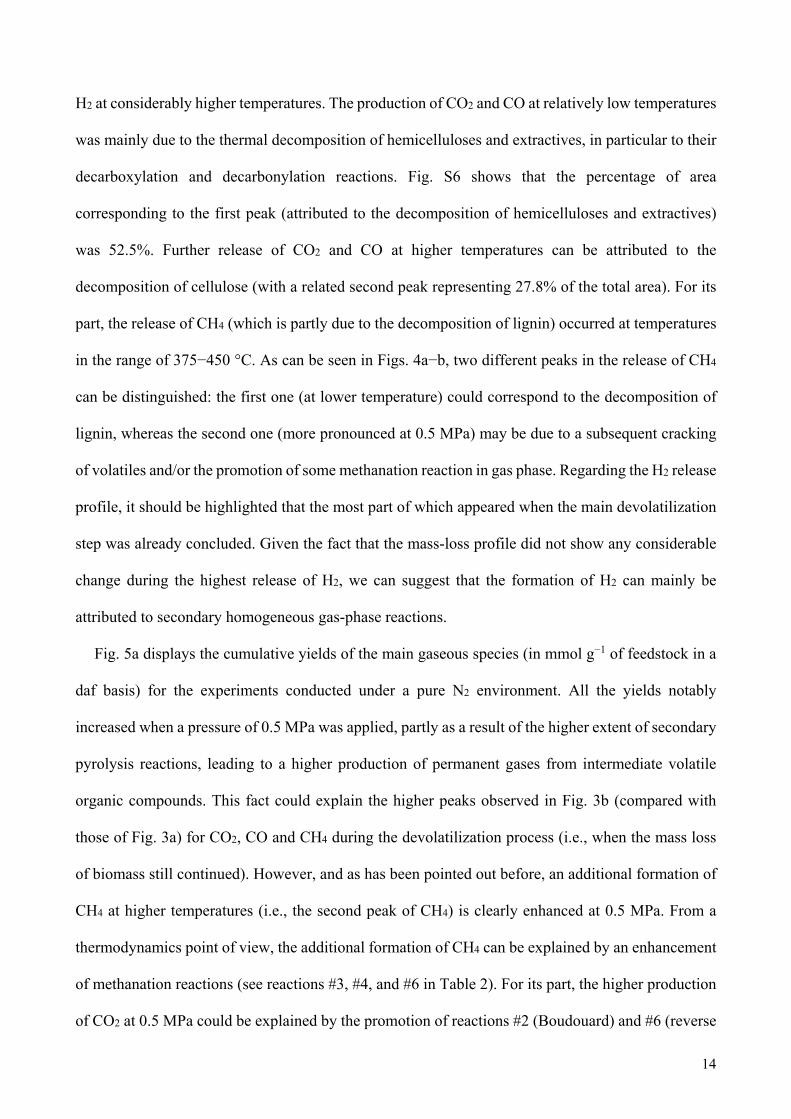
14
H2 at considerably higher temperatures. The production of CO2 and CO at relatively low temperatures
was mainly due to the thermal decomposition of hemicelluloses and extractives, in particular to their
decarboxylation and decarbonylation reactions. Fig. S6 shows that the percentage of area
corresponding to the first peak (attributed to the decomposition of hemicelluloses and extractives)
was 52.5%. Further release of CO2 and CO at higher temperatures can be attributed to the
decomposition of cellulose (with a related second peak representing 27.8% of the total area). For its
part, the release of CH4 (which is partly due to the decomposition of lignin) occurred at temperatures
in the range of 375−450 °C. As can be seen in Figs. 4a−b, two different peaks in the release of CH4
can be distinguished: the first one (at lower temperature) could correspond to the decomposition of
lignin, whereas the second one (more pronounced at 0.5 MPa) may be due to a subsequent cracking
of volatiles and/or the promotion of some methanation reaction in gas phase. Regarding the H2 release
profile, it should be highlighted that the most part of which appeared when the main devolatilization
step was already concluded. Given the fact that the mass-loss profile did not show any considerable
change during the highest release of H2, we can suggest that the formation of H2 can mainly be
attributed to secondary homogeneous gas-phase reactions.
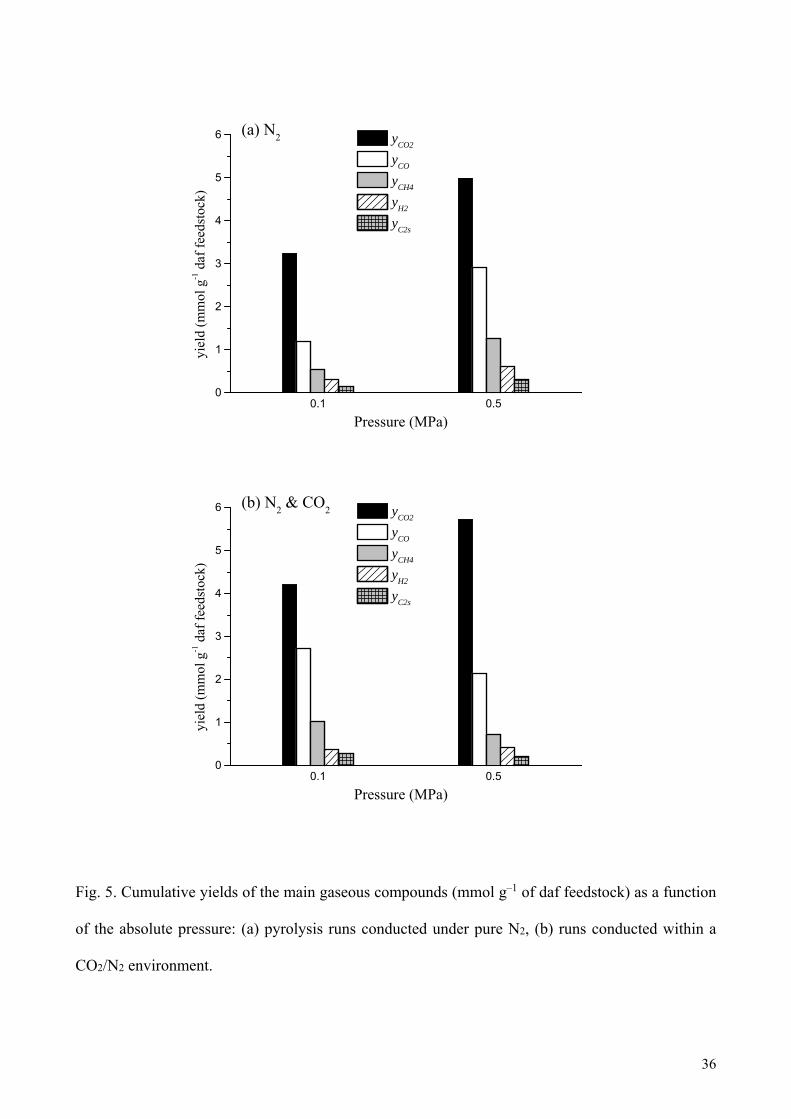
Fig. 5a displays the cumulative yields of the main gaseous species (in mmol g−1 of feedstock in a
daf basis) for the experiments conducted under a pure N2 environment. All the yields notably
increased when a pressure of 0.5 MPa was applied, partly as a result of the higher extent of secondary
pyrolysis reactions, leading to a higher production of permanent gases from intermediate volatile
organic compounds. This fact could explain the higher peaks observed in Fig. 3b (compared with
those of Fig. 3a) for CO2, CO and CH4 during the devolatilization process (i.e., when the mass loss
of biomass still continued). However, and as has been pointed out before, an additional formation of
CH4 at higher temperatures (i.e., the second peak of CH4) is clearly enhanced at 0.5 MPa. From a
thermodynamics point of view, the additional formation of CH4 can be explained by an enhancement
of methanation reactions (see reactions #3, #4, and #6 in Table 2). For its part, the higher production
of CO2 at 0.5 MPa could be explained by the promotion of reactions #2 (Boudouard) and #6 (reverse
15
dry reforming). Nevertheless, the fact that the yield of CO also increased with pressure (in spite of its
consumption through reactions #2, #3, and #6) suggests that further reactions are involved. One of
them could be the above-mentioned steam gasification reaction (reaction #5 in Table 2), which can
also partly explain the decreased yield of produced water at high pressure.
3.1.2. CO2/N2 atmosphere
Using a carrier gas composed of a mixture of CO2 and N2 (60:40 v/v) led to considerable changes
in the pyrolysis behavior (as compared with that observed using pure N2) at both 0.1 and 0.5 MPa. At
atmospheric pressure, a higher exothermicity during the main devolatilization stage can be observed
in Fig. 3c (in comparison to the temperature profiles at 0.1 MPa shown in Fig. 3a), leading to a higher
value of Tmax (300 °C instead of 263 °C). This observed higher exothermic behavior might be
explained by a promotion of the secondary reactions of the primary volatile organic compounds. This
finding is in agreement with a recent study focused on slow pyrolysis of red pepper stalk [39], in
which the observed decrease in tar yield (in favor of produced gas) was attributed to an enhancement
of the thermal cracking of volatiles when an atmosphere of CO2 was used. Interestingly and as can
be seen in Fig. 4b, the yield of biochar (ychar) was almost the same than that obtained using pure N2
at 0.1 MPa. In fact, the higher yield of produced gas (under an atmosphere of CO2/N2) was at the
expense of the total production of liquid (ywater + yorg). The fact that the yield of produced water also
decreased at 0.1 MPa, using a pyrolysis environment composed of a mixture of CO2 and N2, can
suggest that CO2 also promotes the further consumption of water through steam reforming and/or
steam gasification reactions.
Regarding the yields of the main gaseous species obtained at 0.1 MPa (see Fig. 5b), it should be
highlighted the higher yields of CO and CH4 compared with those measured using an atmosphere of
N2. The increase in the yield of CH4 (1.02 mmol g−1, 86% higher than that using N2), as well as in the
yield of C2 hydrocarbons (C2H4 + C2H6), could be related to the above-mentioned higher extent of
the thermal cracking of volatile organic compounds [39]. In the case of the yield of CO (2.73 mmol
g−1, 127% higher than that using N2 at 0.1 MPa), its increase could be due to different chemical
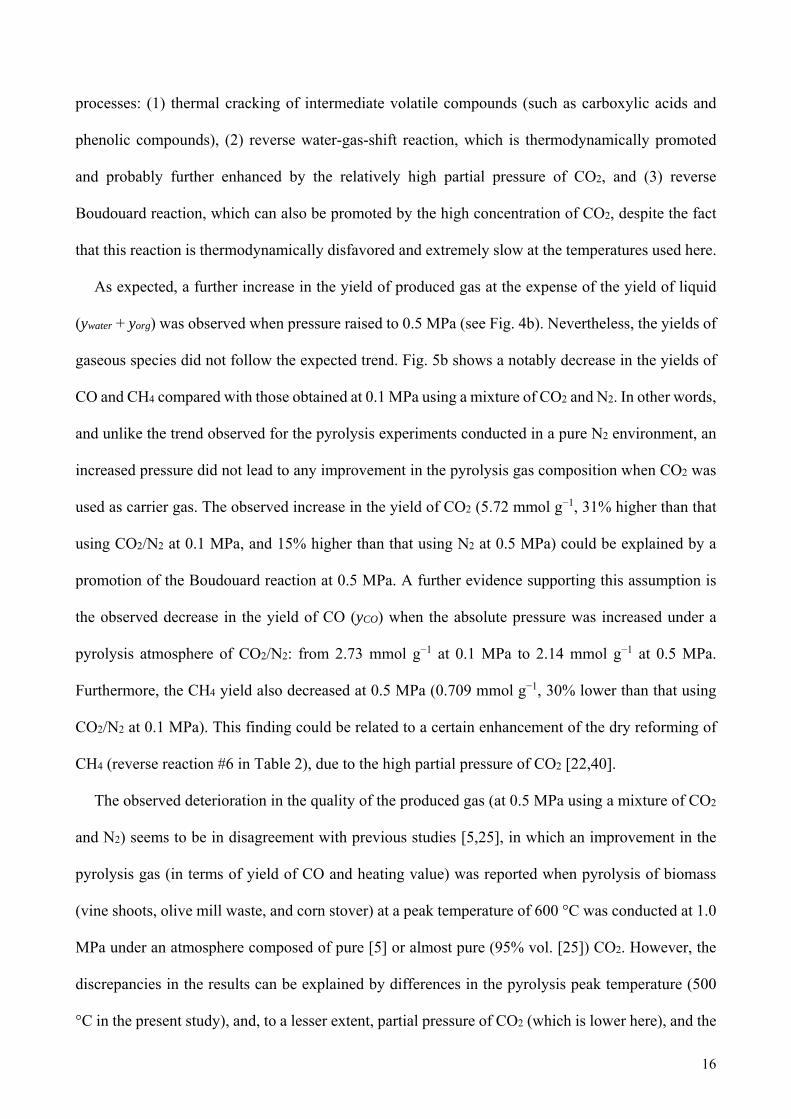
16
processes: (1) thermal cracking of intermediate volatile compounds (such as carboxylic acids and
phenolic compounds), (2) reverse water-gas-shift reaction, which is thermodynamically promoted
and probably further enhanced by the relatively high partial pressure of CO2, and (3) reverse
Boudouard reaction, which can also be promoted by the high concentration of CO2, despite the fact
that this reaction is thermodynamically disfavored and extremely slow at the temperatures used here.
As expected, a further increase in the yield of produced gas at the expense of the yield of liquid
(ywater + yorg) was observed when pressure raised to 0.5 MPa (see Fig. 4b). Nevertheless, the yields of
gaseous species did not follow the expected trend. Fig. 5b shows a notably decrease in the yields of
CO and CH4 compared with those obtained at 0.1 MPa using a mixture of CO2 and N2. In other words,
and unlike the trend observed for the pyrolysis experiments conducted in a pure N2 environment, an
increased pressure did not lead to any improvement in the pyrolysis gas composition when CO2 was
used as carrier gas. The observed increase in the yield of CO2 (5.72 mmol g−1, 31% higher than that
using CO2/N2 at 0.1 MPa, and 15% higher than that using N2 at 0.5 MPa) could be explained by a
promotion of the Boudouard reaction at 0.5 MPa. A further evidence supporting this assumption is
the observed decrease in the yield of CO (yCO) when the absolute pressure was increased under a
pyrolysis atmosphere of CO2/N2: from 2.73 mmol g−1 at 0.1 MPa to 2.14 mmol g−1 at 0.5 MPa.
Furthermore, the CH4 yield also decreased at 0.5 MPa (0.709 mmol g−1, 30% lower than that using
CO2/N2 at 0.1 MPa). This finding could be related to a certain enhancement of the dry reforming of
CH4 (reverse reaction #6 in Table 2), due to the high partial pressure of CO2 [22,40].
The observed deterioration in the quality of the produced gas (at 0.5 MPa using a mixture of CO2
and N2) seems to be in disagreement with previous studies [5,25], in which an improvement in the
pyrolysis gas (in terms of yield of CO and heating value) was reported when pyrolysis of biomass
(vine shoots, olive mill waste, and corn stover) at a peak temperature of 600 °C was conducted at 1.0
MPa under an atmosphere composed of pure [5] or almost pure (95% vol. [25]) CO2. However, the
discrepancies in the results can be explained by differences in the pyrolysis peak temperature (500
°C in the present study), and, to a lesser extent, partial pressure of CO2 (which is lower here), and the
17
biomass feedstock (having different contents of ash and different inorganic constituents). In this
sense, the lower pyrolysis temperature used in the present study can lead to very different rates and
extents of the involved reversible reactions.
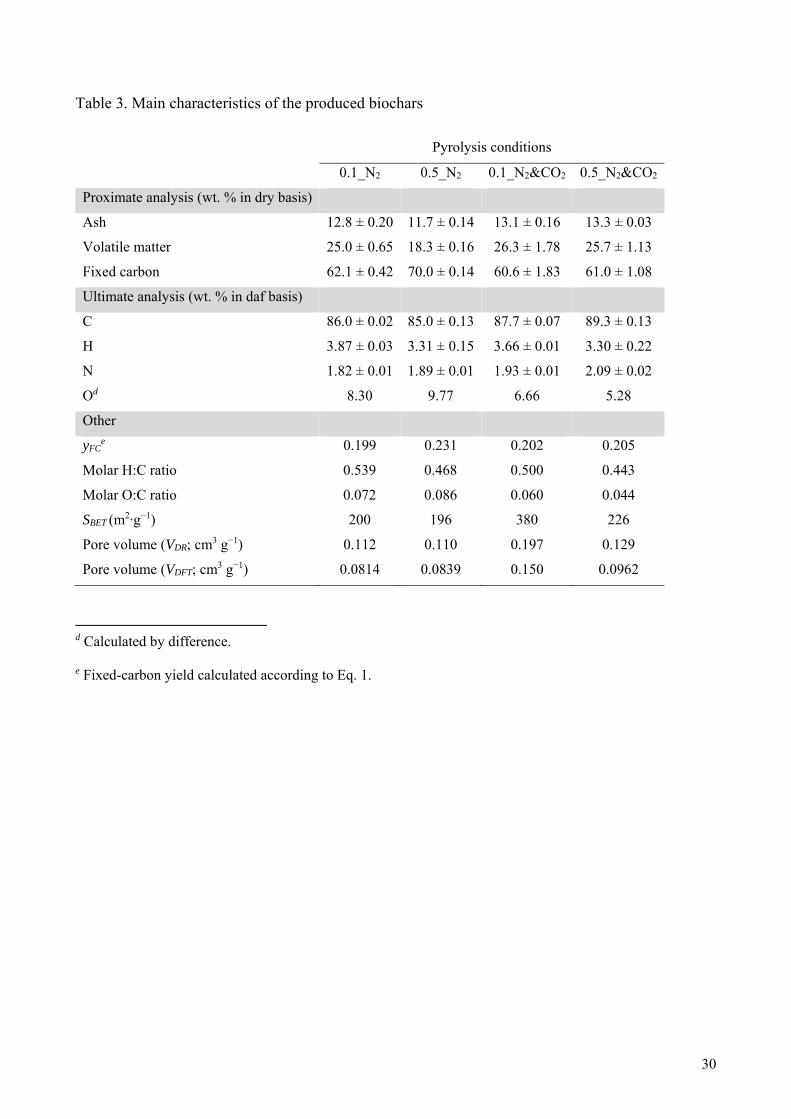
3.2 Biochar properties
The main characteristics of the biochars produced under different operating conditions are reported
in Table 3. The biochar having the highest fixed-carbon content (70.0% in dry basis, 79.3% in daf
basis) was obtained under pure N2 at 0.5 MPa. Given that the yields of biochar were practically the
same, regardless of the pyrolysis conditions, the carbonization efficiency was also maximized at 0.5
MPa under an atmosphere of pure N2 (yFC = 0.231; approximately 15% higher than that for the rest
of pyrolysis runs). This result can be attributed to the role of pressure in the promotion of secondary
reactions. As mentioned in Section 3.1.1, an increased pressure can delay the transfer of volatiles into
the vapor phase and thereby promote liquid-phase coking reactions that enhance the formation of
fixed carbon [29]. However, an increased pressure did not lead to any improvement in the fixed-
carbon yield when an atmosphere of CO2/N2 was used. One possible explanation can be related to the
finding recently reported by Lee at al. [39], who observed a faster thermal degradation of lignin when
CO2 was used as pyrolysis medium instead of N2. Given the fact that the content of lignin (in a given
biomass feedstock) is directly correlated to the yield of fixed carbon [13], a higher degradation of this
amorphous substance can lead to a lower fixed-carbon yield.
Concerning the atomic H:C and O:C ratios reported in Table 3, it should be pointed out that the
values for all produced biochars were very low (0.44−0.54 and 0.04−0.09, respectively), in spite of
the relatively low pyrolysis peak temperature (500 °C). For instance, Windeatt et al. [41] reported
H:C ratio values in the range of 0.4−0.5 for biochars produced from several crop residues through
atmospheric pyrolysis (under N2) at a higher peak temperature of 600 °C. Furthermore, a slight
decrease in the atomic ratios (at both 0.1 and 0.5 MPa) was observed when the pyrolysis atmosphere
was a mixture of CO2 and N2. However, these differences (which can be within experimental error,
18
especially for the O:C ratio) are too small to be considered as improvement in the carbon sequestration
potential. In fact, the biochar having the lowest H:C and O:C ratios (produced at 0.5 MPa and under
CO2/N2) does not exhibit the highest fixed-carbon content. In other words, we cannot assume that
using an atmosphere of CO2/N2 (instead of pure N2) can lead to biochars with higher potential
stability. This is consistent with the results from an earlier study [25], in which no significant
statistical effects on the potential stability of biochar’s carbon were observed for neither the absolute
pressure (in the range of 0.1−1.0 MPa) nor the pyrolysis atmosphere (pure N2 or a mixture CO2/N2
95:5 v/v).
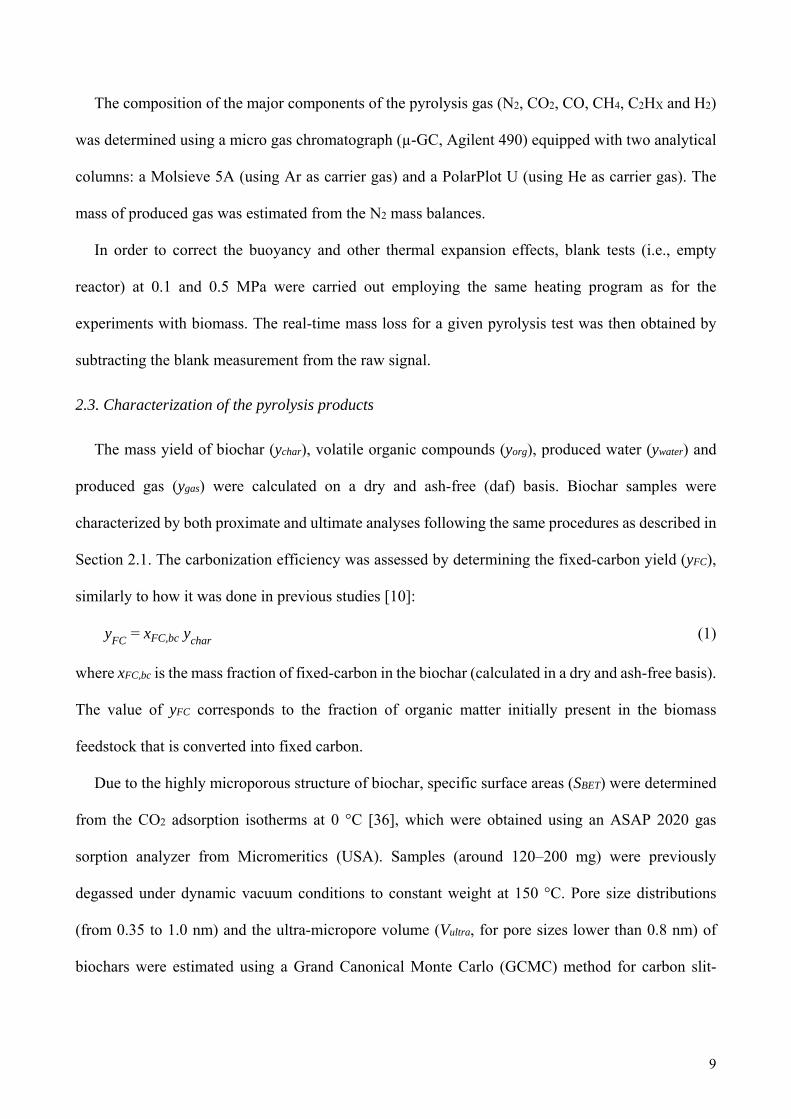
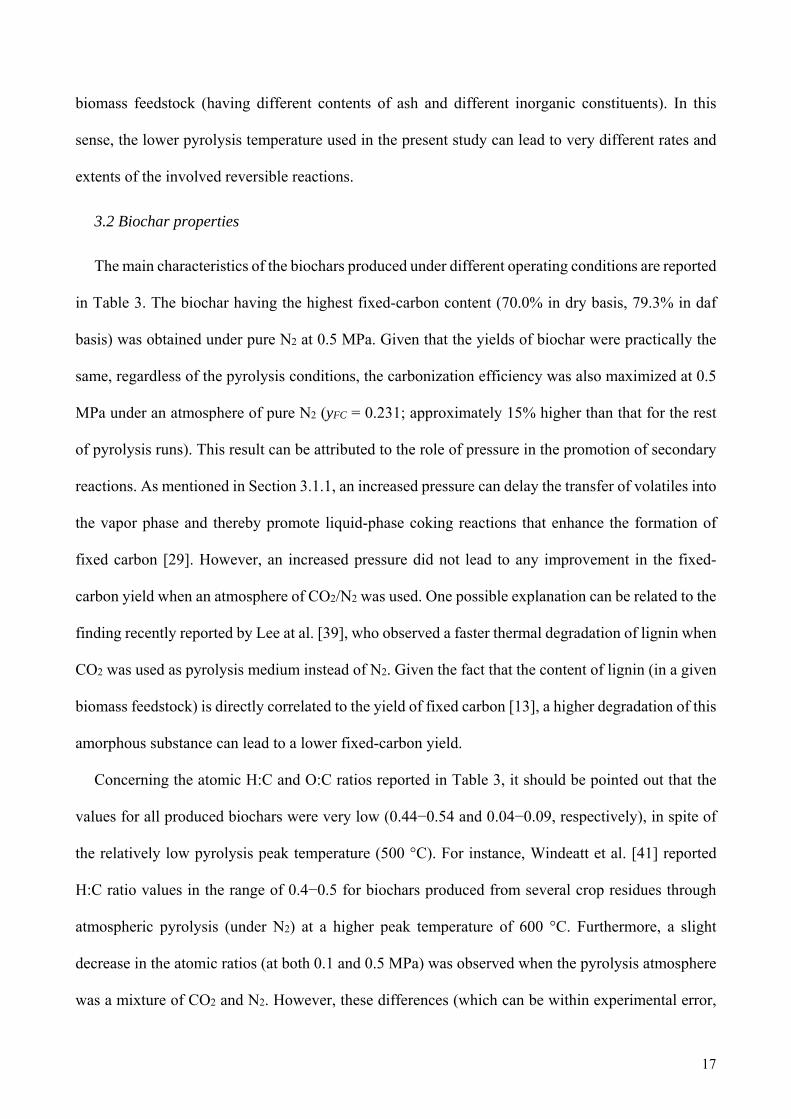
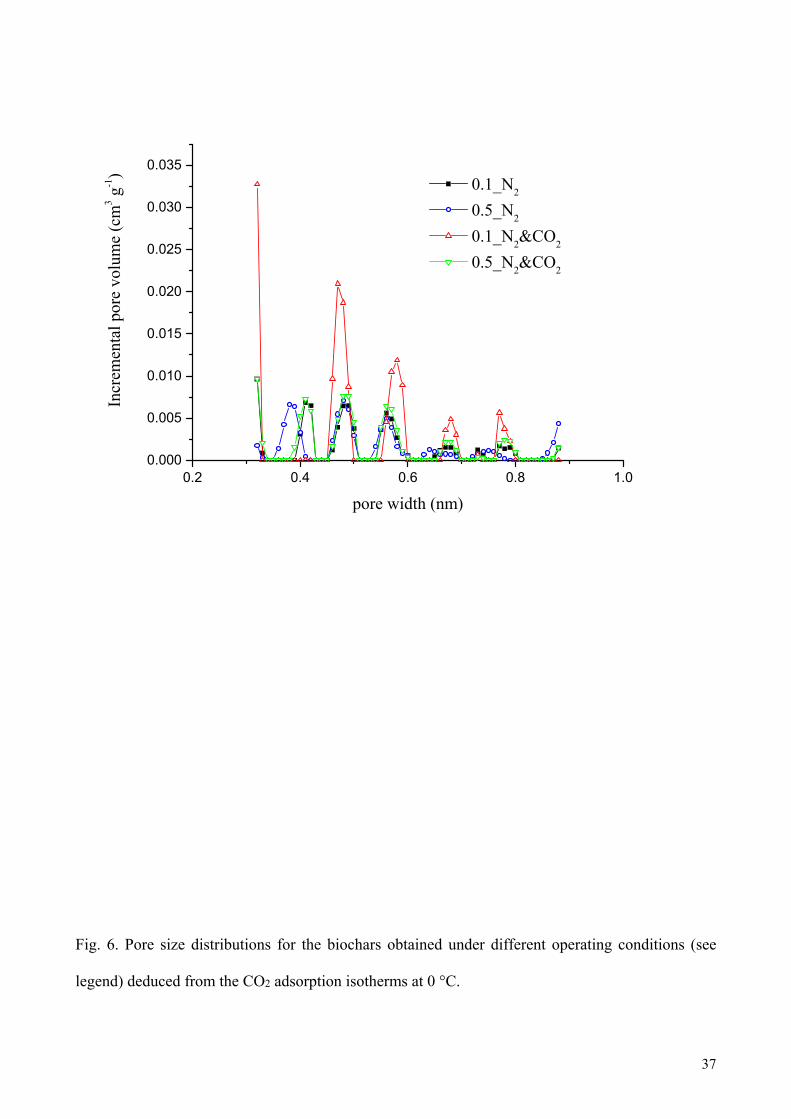
Table 3 also lists the textural parameters deduced from the CO2 adsorption isotherms at 0 °C
(which are displayed in Fig. S7). In addition to the BET specific surface area (SBET), the limiting
micropore volumes from the Dubinin-Radushkevich equation (VDR) and the ultra-micropore volume
(Vultra) are also reported in Table 3. Two considerations can be drawn from the reported textural
parameters and the pore size distributions shown in Fig. 6: (1) under a pyrolysis medium composed
of pure N2, the microporosity development of biochars was not affected by the absolute pressure for
the range of operating conditions tested in this study, and (2) using a mixture of CO2/N2 as pyrolysis
environment at atmospheric pressure led to notably higher microporous biochars. The fact that the
presence of CO2 at 0.1 MPa favors the porosity development of biochars could be due to the
promotion of the reverse Boudouard reaction under these conditions. This is consistent with the
increased yield of CO, which we already mentioned in Section 3.1.2. It must be highlighted the high
ultra-micropore volume (a key parameter for CO2 adsorption capacity) measured for the biochar
produced at 0.1 MPa under CO2/N2: 0.150 cm3 g−1. This value is within the range or even higher than
the ultra-micropore volumes reported for biomass-derived physically or chemically activated carbons
[42,43]. Further research in this direction seems to be highly interesting to produce “low-temperature”
carbon-based adsorbents for the selective removal of CO2 in gas phase.
19
4. Conclusions
From the analysis of results presented above, the following main conclusions can be drawn:
(1) An increased pressure considerably affects the mass-loss profiles during the pyrolysis process,
leading to higher devolatilization rates in a shorter period of time. Regardless of the pyrolysis
atmosphere, an increase in the absolute pressure led to higher yields of produced gas at the expense
of produced water and condensable organic compounds. This finding is related to the fact that an
increased pressure favors the exothermic secondary reactions of the intermediate volatile organic
compounds in both liquid and vapor phases.
(2) The switch from pure N2 to a mixture of CO2 and N2 at 0.1 MPa led to a remarkable increase
in the yield of produced gas at the expense of both the produced water and condensable organic
compounds. This could be mainly due to the promotion of the thermal cracking of the volatile organic
compounds at a high partial pressure of CO2, which is also consistent with the measured higher yields
of CH4 and CO. The increased yield of CO can also be seen as a direct result of the enhanced reverse
Boudouard reaction. However, increasing the absolute pressure can result in a promotion of the direct
Boudouard reaction, leading to a higher production of CO2 at the expense of CO.
(3) Interestingly, neither the pressure nor the pyrolysis atmosphere appeared to affect the yield of
biochar for the range of operating conditions under consideration. Moreover, the potential stability of
biochar’s carbon was found to be similar, regardless of the operating parameters used. Nevertheless,
a much higher porosity development (in terms of specific surface area and volume of ultra-
micropores) was measured for the biochar produced at 0.1 MPa under an atmosphere of CO2/N2.
(4) We can conclude that, for the biomass feedstock used here at a pyrolysis peak temperature of
500 °C, using a mixture of CO2 and N2 (60:40 v/v) at atmospheric pressure is the most interesting
way to simultaneously obtain a potentially recalcitrant and microporous biochar and an appropriate
pyrolysis gas with relatively high contents of CH4 and CO.
20
Acknowledgements
This project has received funding from the European Union’s Horizon 2020 research and innovation
programme under the Marie Skłodowska-Curie grant agreement No 721991. JJM also express his
gratitude to the Aragon Government (GPT group) and the European Social Fund for additional
financial support.
Appendix A. Supplementary data
Nomenclature
R50 = Harvey’s recalcitrance index (−)
SBET = Brunauer–Emmet–Teller specific surface area (m2 g–1)
stable-C = mass fraction of C remaining after H2O2 oxidation (−)
TC# = temperatures measured by the thermocouples placed within the reactor (°C)
Tmax = process temperature at which the highest devolatilization rate is attained (°C)
VDR = limiting micropore volumes from the Dubinin-Radushkevich equation (cm3 g–1)
Vultra = ultra-micropore volume (cm3 g–1)
xFC,bc = mass fraction of fixed-carbon in the biochar (daf basis)
ychar = mass yield of biochar in a dry and ash-free basis (−)
yFC = fixed-carbon yield in a dry and ash-free basis (−)
ygas = mass yield of produced gas in a dry and ash-free basis (−)
yorg = mass yield of condensable organics in a dry and ash-free basis (−)
ywater = mass yield of produced water in a dry and ash-free basis (−)
Acronyms
AAEMs = alkali and alkaline Earth metal species
DTG = differential thermogravimetric analysis
21
daf = dry-ash-free
GCMC = Grand Canonical Monte Carlo
GHSV = gas hourly space velocity (h−1)
PID = proportional integral derivative
WS = wheat straw
XRF = X-Ray Fluorescence spectroscopy
-GC = micro gas chromatograph
22
References
[1] F. Li, X. Cao, L. Zhao, J. Wang, Z. Ding, Effects of Mineral Additives on Biochar Formation:
Carbon Retention, Stability, and Properties, Environ. Sci. Technol. 48 (2014) 11211–11217.
https://doi.org/10.1021/es501885n.
[2] J.J. Manyà, Pyrolysis for Biochar Purposes: A Review to Establish Current Knowledge Gaps
and Research Needs, Environ. Sci. Technol. 46 (2012) 7939–7954.
https://doi.org/10.1021/es301029g.
[3] J. Lehmann, S. Joseph, Biochar for Environmental Management: An Introduction, in: J.
Lehmann, S. Joseph (Eds.), Biochar Environ. Manag. Sci. Technol., Earthscan, London, 2009:
pp. 1–10.
[4] J.J. Manyà, D. Alvira, M. Azuara, D. Bernin, N. Hedin, Effects of Pressure and the Addition
of a Rejected Material from Municipal Waste Composting on the Pyrolysis of Two-Phase
Olive Mill Waste, Energy Fuels 30 (2016). https://doi.org/10.1021/acs.energyfuels.6b01579.
[5] M. Azuara, E. Sáiz, J.A. Manso, F.J. García-Ramos, J.J. Manyà, Study on the effects of using
a carbon dioxide atmosphere on the properties of vine shoots-derived biochar, J. Anal. Appl.
Pyrolysis 124 (2017). https://doi.org/10.1016/j.jaap.2016.11.022.
[6] V. Dhyani, T. Bhaskar, A comprehensive review on the pyrolysis of lignocellulosic biomass,
Renew. Energy 129 (2018) 695–716. https://doi.org/10.1016/j.renene.2017.04.035.
[7] W. Song, M. Guo, Quality variations of poultry litter biochar generated at different pyrolysis
temperatures, J. Anal. Appl. Pyrolysis 94 (2012) 138–145.
https://doi.org/10.1016/j.jaap.2011.11.018.
[8] O. Mašek, P. Brownsort, A. Cross, S. Sohi, Influence of production conditions on the yield and
environmental stability of biochar, Fuel 103 (2013) 151–155.
https://doi.org/10.1016/j.fuel.2011.08.044.
23
[9] F. Ronsse, S. van Hecke, D. Dickinson, W. Prins, Production and characterization of slow
pyrolysis biochar: Influence of feedstock type and pyrolysis conditions, GCB Bioenergy 5
(2013) 104–115. https://doi.org/10.1111/gcbb.12018.
[10] J.J. Manyà, S. Laguarta, M.A. Ortigosa, J.A. Manso, Biochar from slow pyrolysis of two-phase
olive mill waste: Effect of pressure and peak temperature on its potential stability, Energy
Fuels 28 (2014) 3271–3280. https://doi.org/10.1021/ef500654t.
[11] L. Wang, M. Trninic, Ø. Skreiberg, M. Gronli, R. Considine, M.J. Antal, Is Elevated Pressure
Required To Achieve a High Fixed-Carbon Yield of Charcoal from Biomass? Part 1: Round-
Robin Results for Three Different Corncob Materials, Energy Fuels 25 (2011) 3251–3265.
https://doi.org/10.1021/ef200450h.
[12] W.S.L. Mok, M.J. Antal Jr., Effects of pressure on biomass pyrolysis. I. Cellulose pyrolysis
products, Thermochim. Acta 68 (1983) 155–164. https://doi.org/10.1016/0040-
6031(83)80221-4.
[13] M.J. Antal, S.G. Allen, X. Dai, B. Shimizu, M.S. Tam, M. Grønli, Attainment of the theoretical
yield of carbon from biomass, Ind. Eng. Chem. Res. 39 (2000) 4024–4031.
https://doi.org/10.1021/ie000511u.
[14] M.J. Antal Jr., W.S.L. Mok, Review of Methods for Improving the Yield of Charcoal from
Biomass, Energy Fuels 4 (1990) 221–225. https://doi.org/10.1021/ef00021a001.
[15] P. Rousset, C. Figueiredo, M. De Souza, W. Quirino, Pressure effect on the quality of
eucalyptus wood charcoal for the steel industry: A statistical analysis approach, Fuel Process.
Technol. 92 (2011) 1890–1897. https://doi.org/10.1016/j.fuproc.2011.05.005.
[16] E.S. Noumi, J. Blin, J. Valette, P. Rousset, Combined Effect of Pyrolysis Pressure and
Temperature on the Yield and CO2Gasification Reactivity of Acacia Wood in macro-TG,
Energy Fuels 29 (2015) 7301–7308. https://doi.org/10.1021/acs.energyfuels.5b01454.
24
[17] M.J. Antal, E. Croiset, X. Dai, C. DeAlmeida, W.S.L. Mok, N. Norberg, J.-R. Richard, M. Al
Majthoub, High-Yield Biomass Charcoal, Energy Fuels 10 (1996) 652–658.
https://doi.org/10.1021/ef9501859.
[18] J. Recari, C. Berrueco, S. Abelló, D. Montané, X. Farriol, Effect of temperature and pressure
on characteristics and reactivity of biomass-derived chars, Bioresour. Technol. 170 (2014)
204–210. https://doi.org/10.1016/j.biortech.2014.07.080.
[19] Y. Qian, J. Zhang, J. Wang, Pressurized pyrolysis of rice husk in an inert gas sweeping fixed-
bed reactor with a focus on bio-oil deoxygenation, Bioresour. Technol. 174 (2014) 95–102.
https://doi.org/10.1016/j.biortech.2014.10.012.
[20] F. Melligan, R. Auccaise, E.H. Novotny, J.J. Leahy, M.H.B. Hayes, W. Kwapinski, Pressurised
pyrolysis of Miscanthus using a fixed bed reactor, Bioresour. Technol. 102 (2011) 3466–3470.
https://doi.org/10.1016/j.biortech.2010.10.129.
[21] J.J. Manyà, F.X. Roca, J.F. Perales, TGA study examining the effect of pressure and peak
temperature on biochar yield during pyrolysis of two-phase olive mill waste, J. Anal. Appl.
Pyrolysis 103 (2013) 86–95. https://doi.org/10.1016/j.jaap.2012.10.006.
[22] G. Pilon, J.-M. Lavoie, Pyrolysis of switchgrass (Panicum virgatum L.) at low temperatures
within N2 and CO2 environments: Product yield study, ACS Sustain. Chem. Eng. 1 (2013)
198–204. https://doi.org/10.1021/sc300098e.
[23] A. Enders, K. Hanley, T. Whitman, S. Joseph, J. Lehmann, A. Whitman, S. Joseph, J.
Lehmann, Characterization of biochars to evaluate recalcitrance and agronomic performance,
Bioresour. Technol. 114 (2012) 644–653. https://doi.org/10.1016/j.biortech.2012.03.022.
[24] J.J. Manyà, M.A. Ortigosa, S. Laguarta, J.A. Manso, Experimental study on the effect of
pyrolysis pressure, peak temperature, and particle size on the potential stability of vine shoots-
derived biochar, Fuel 133 (2014) 163–172. https://doi.org/:10.1016/j.fuel.2014.05.019.
25
[25] J.J. Manyà, M. Azuara, J.A. Manso, Biochar production through slow pyrolysis of different
biomass materials: Seeking the best operating conditions, Biomass Bioenergy 117 (2018) 115–
123. https://doi.org/10.1016/j.biombioe.2018.07.019.
[26] K. Crombie, O. Masek, S.P. Sohi, P. Brownsort, A. Cross, The effect of pyrolysis conditions
on biochar stability as determined by three methods, GCB Bioenergy 5 (2013) 122–131.
https://doi.org/10.1111/gcbb.12030.
[27] O.R. Harvey, L.J. Kuo, A.R. Zimmerman, P. Louchouarn, J.E. Amonette, B.E. Herbert, An
index-based approach to assessing recalcitrance and soil carbon sequestration potential of
engineered black carbons (biochars), Environ. Sci. Technol. 46 (2012) 1415–1421.
https://doi.org/10.1021/es2040398.
[28] A. Cross, S.P. Sohi, A method for screening the relative long-term stability of biochar, GCB
Bioenergy 5 (2013) 215–220. https://doi.org/10.1111/gcbb.12035.
[29] L. Wang, O. Skreiberg, M. Gronli, G.P. Specht, M.J. Antal, Is elevated pressure required to
achieve a high fixed-carbon yield of charcoal from biomass? Part 2: The importance of particle
size, Energy Fuels 27 (2013) 2146–2156. https://doi.org/10.1021/ef400041h.
[30] C. Di Blasi, G. Signorelli, C. Di Russo, G. Rea, Product Distribution from Pyrolysis of Wood
and Agricultural Residues, Ind. Eng. Chem. Res. 38 (1999) 2216–2224.
https://doi.org/10.1021/ie980711u.
[31] A. Demirbas, Effects of temperature and particle size on bio-char yield from pyrolysis of
agricultural residues, J. Anal. Appl. Pyrolysis 72 (2004) 243–248.
https://doi.org/10.1016/j.jaap.2004.07.003.
[32] M. Azuara, B. Baguer, J.I. Villacampa, N. Hedin, J.J. Manyà, Influence of pressure and
temperature on key physicochemical properties of corn stover-derived biochar, Fuel 186
(2016) 525–533. https://doi.org/10.1016/j.fuel.2016.08.088.
26
[33] L. Zhao, X. Cao, O. Mašek, A. Zimmerman, Heterogeneity of biochar properties as a function
of feedstock sources and production temperatures, J. Hazard. Mater. 256–257 (2013) 1–9.
https://doi.org/10.1016/j.jhazmat.2013.04.015.
[34] W. Suliman, J.B. Harsh, N.I. Abu-Lail, A.M. Fortuna, I. Dallmeyer, M. Garcia-Perez,
Influence of feedstock source and pyrolysis temperature on biochar bulk and surface
properties, Biomass Bioenergy 84 (2016) 37–48.
https://doi.org/10.1016/j.biombioe.2015.11.010.
[35] A. V. McBeath, C.M. Wurster, M.I. Bird, Influence of feedstock properties and pyrolysis
conditions on biochar carbon stability as determined by hydrogen pyrolysis, Biomass
Bioenergy 73 (2015) 155–173. https://doi.org/10.1016/J.BIOMBIOE.2014.12.022.
[36] K.C. Kim, T.U. Yoon, Y.S. Bae, Applicability of using CO2 adsorption isotherms to determine
BET surface areas of microporous materials, Microporous Mesoporous Mat. 224 (2016)
294−301. https://doi.org/10.1016/j.micromeso.2016.01.003.
[37] R. Ragucci, P. Giudicianni, A. Cavaliere, Cellulose slow pyrolysis products in a pressurized
steam flow reactor, Fuel 107 (2013) 122–130. https://doi.org/10.1016/j.fuel.2013.01.057.
[38] F. Ateş, N. Miskolczi, B. Saricaoğlu, Pressurized pyrolysis of dried distillers grains with
solubles and canola seed press cake in a fixed-bed reactor, Bioresour. Technol. 177 (2015)
149–158. https://doi.org/10.1016/j.biortech.2014.10.163.
[39] J. Lee, X. Yang, S.H. Cho, J.K. Kim, S.S. Lee, D.C.W. Tsang, Y.S. Ok, E.E. Kwon, Pyrolysis
process of agricultural waste using CO2 for waste management, energy recovery, and biochar
fabrication, Appl. Energy 185 (2017) 214–222.
https://doi.org/10.1016/j.apenergy.2016.10.092.
[40] C. Guizani, F.J. Escudero-Sanz, S. Salvador, Effects of CO2 on biomass fast pyrolysis:
Reaction rate, gas yields and char reactive properties, Fuel 116 (2014) 310–320.
https://doi.org/10.1016/j.fuel.2013.07.101.
27
[41] J.H. Windeatt, A.B. Ross, P.T. Williams, P.M. Forster, M.A. Nahil, S. Singh, Characteristics
of biochars from crop residues: Potential for carbon sequestration and soil amendment, J.
Environ. Manage. 146 (2014) 189–197. https://doi.org 10.1016/j.jenvman.2014.08.003.
[42] W. Hao, E. Björkman, M. Lilliestråle, N. Hedin, Activated carbons prepared from
hydrothermally carbonized waste biomass used as adsorbents for CO2, Appl. Energy 112
(2013) 526–532. https://doi.org 10.1016/j.apenergy.2013.02.028.
[43] J.J. Manyà, B. González, M. Azuara, G. Arner, Ultra-microporous adsorbents prepared from
vine shoots-derived biochar with high CO2 uptake and CO2/N2 selectivity, Chem. Eng. J. 345
(2018) 631–639. https://doi.org 10.1016/j.cej.2018.01.092.
28
Table 1. Proximate, ultimate, and XRF analyses of the wheat straw pellets
Proximate (wt. %)
Ash 3.67 ± 0.13
Moisture 6.60 ± 0.20
Volatile matter 77.7 ± 0.31
Fixed carbon 12.0 ± 0.18
Ultimate (wt. % in daf basis)
C 49.0 ± 0.52
H 7.01 ± 0.04
N 0.704 ± 0.01
O 43.2a
Inorganic matter as equivalent oxides (wt. % of ash)b
K2O 53.2
CaO 17.4
SiO2 16.9
P2O5 4.46
Al2O3 1.66
Cl (inorganic) 1.53
MgO 1.46
S (inorganic) 1.31
Fe2O3 1.14
a Oxygen was calculated by difference.
b Only listed components with a composition higher than 1%.
29
Table 2. Main reactions probably occurring during the release of the pyrolysis gas
No. Reaction Extent of reaction (ξ)c (kmol h–1)
500 °C and 0.1 MPa 500 °C and 0.5 MPa
1 H2O + CO ⇌ CO2 + H2 0.390 0.390
2 2CO ⇌ CO2 + C 0.937 0.972
3 3H2 + CO ⇌ CH4 + H2O 0.614 0.825
4 C + 2H2 ⇌ CH4 0.343 0.693
5 C + H2O ⇌ CO + H2 −0.714 −0.871
6 2H2 + 2CO ⇌ CO2 + CH4 0.706 0.867
c Calculated using Aspen Plus V8.8; NRTL package and a Gibbs Reactor module. Stoichiometric coefficients
were taken as initial molar flow rates (in kmol h–1) for all the species involved in the reaction.
30
Table 3. Main characteristics of the produced biochars
Pyrolysis conditions
0.1_N2 0.5_N2 0.1_N2&CO2 0.5_N2&CO2
Proximate analysis (wt. % in dry basis)
Ash 12.8 ± 0.20 11.7 ± 0.14 13.1 ± 0.16 13.3 ± 0.03
Volatile matter 25.0 ± 0.65 18.3 ± 0.16 26.3 ± 1.78 25.7 ± 1.13
Fixed carbon 62.1 ± 0.42 70.0 ± 0.14 60.6 ± 1.83 61.0 ± 1.08
Ultimate analysis (wt. % in daf basis)
C 86.0 ± 0.02 85.0 ± 0.13 87.7 ± 0.07 89.3 ± 0.13
H 3.87 ± 0.03 3.31 ± 0.15 3.66 ± 0.01 3.30 ± 0.22
N 1.82 ± 0.01 1.89 ± 0.01 1.93 ± 0.01 2.09 ± 0.02
Od 8.30 9.77 6.66 5.28
Other
yFCe 0.199 0.231 0.202 0.205
Molar H:C ratio 0.539 0.468 0.500 0.443
Molar O:C ratio 0.072 0.086 0.060 0.044
SBET (m2∙g−1) 200 196 380 226
Pore volume (VDR; cm3 g−1) 0.112 0.110 0.197 0.129
Pore volume (VDFT; cm3 g−1) 0.0814 0.0839 0.150 0.0962
d Calculated by difference.
e Fixed-carbon yield calculated according to Eq. 1.
31
Fig. 1. Schematic layout of the pyrolysis device: (1) pyrolysis reactor, (2) biomass bed, (3)
condensation system, (4) volumetric gas meter, (5) micro-GC, (6) ceramic tube, and (7) weighing
platform.
32
Fig. 2. A comparison between the mass-loss evolutions along the pyrolysis process at 0.1 MPa and
0.5 MPa, using (a) a N2 atmosphere, and (b) a CO2/N2 environment.
0 100 200 300-300
-250
-200
-150
-100
-50
0
50
Bio
mas
s m
ass
loss
(g)
time (min)
0.1_N2
0.5_N2
(a)
0 100 200 300-300
-250
-200
-150
-100
-50
0
50
Bio
mas
s m
ass
loss
(g)
time (min)
0.1_N2&CO
2
0.5_N2&CO
2
(b)
33
0 100 200 300
0
5
10
15-d
(mas
s lo
ss)
dt-1 (
g m
in-1)
time (min)
∙ ∙
(a) 0.1_N2
0.000
0.005
0.03
0.04
0.05
0.06
0.07
CO2
H2
CO CH
4 Gas
flo
w r
ate
(mol
min
-1)
100
200
300
400
500
600
TC0
TC1
Tem
pera
ture
(°C
)
0 100 200 300
0
5
10
15
20
25
30
-d(m
ass
loss
) dt
-1 (
g m
ol-1)
time (min)
(b) 0.5_N2
0.000
0.005
0.010
0.015
0.05
0.10
0.15
CO2
H2
CO CH
4
Gas
flo
w r
ate
(mol
min
-1)
100
200
300
400
500
600
TC0
TC1
Tem
pera
ture
(°C
)
34
Fig. 3. Time derivative of the mass loss, evolution of temperatures within the bed (TC0 and TC1), and
molar flows of the main gaseous species released during the pyrolysis process (produced CO2, CO,
CH4, and H2) for experiments conducted at 0.1 MPa under N2 (a), 0.5 MPa under N2 (b), 0.1 MPa
using a mixture CO2/N2 (c), and at 0.5 MPa using a mixture CO2/N2 (d).
0 100 200 300
0
5
10
15-d
(mas
s lo
ss)
dt-1 (
mol
g-1)
time (min)
(c) 0.1_N2&CO
2
0.00
0.01
0.03
0.04
0.05
0.06
0.07
CO2
H2
CO CH
4
Gas
flo
w r
ate
(mol
min
-1)
100
200
300
400
500
600
TC0
TC1
Tem
pera
ture
(°C
)
0 100 200 300
0
5
10
15
20
25
30
-d(m
ass
loss
) dt
-1 (
g m
in-1)
time (min)
(d) 0.5_N2&CO
2
0.000
0.005
0.04
0.06
0.08
0.10
0.12
0.14
CO2
H2
CO CH
4
Gas
flo
w r
ate
(mol
min
-1)
100
200
300
400
500
600
TC
0 (
ºC)
35
Fig. 4: Mass yields (in a daf basis) of biochar (ychar), produced water (ywater), organics (yorg), and gas
(ygas) as a function of the absolute pressure: (a) pyrolysis runs conducted under pure N2, (b) runs
conducted within a CO2/N2 environment.
0.1 0.50.0
0.1
0.2
0.3
0.4
yiel
d (m
ass
frac
tion
in d
af b
asis
)
ychar
ygas
ywater
yorg
Pressure (MPa)
(a) N2
0.1 0.50.0
0.1
0.2
0.3
0.4
yiel
d (m
ass
frac
tion
in d
af b
asis
)
ychar
ygas
ywater
yorg
Pressure (MPa)
(b) N2 & CO
2
36
Fig. 5. Cumulative yields of the main gaseous compounds (mmol g–1 of daf feedstock) as a function
of the absolute pressure: (a) pyrolysis runs conducted under pure N2, (b) runs conducted within a
CO2/N2 environment.
0.1 0.50
1
2
3
4
5
6 yCO2
yCO
yCH4
yH2
yC2s
yiel
d (m
mol
g-1 d
af f
eeds
tock
)
Pressure (MPa)
(a) N2
0.1 0.50
1
2
3
4
5
6 yCO2
yCO
yCH4
yH2
yC2s
yiel
d (m
mol
g-1 d
af f
eeds
tock
)
Pressure (MPa)
(b) N2 & CO
2
37
Fig. 6. Pore size distributions for the biochars obtained under different operating conditions (see
legend) deduced from the CO2 adsorption isotherms at 0 °C.
0.2 0.4 0.6 0.8 1.00.000
0.005
0.010
0.015
0.020
0.025
0.030
0.035
0.1_N2
0.5_N2
0.1_N2&CO
2
0.5_N2&CO
2
Incr
emen
tal p
ore
volu
me
(cm
3 g-1
)
pore width (nm)