evolutionary and collaborative software architecture
TRANSCRIPT
Evolutionary and Collaborative Software Architecture
Recovery with Softwarenaut
Mircea Lungu
Software Composition Group - University of Bern, Switzerland
Michele Lanza
REVEAL @ Faculty of Informatics - University of Lugano, Switzerland
Oscar Nierstrasz
Software Composition Group - University of Bern, Switzerland
Abstract
Architecture recovery is an activity applied to a system whose initialarchitecture has eroded. When the system is large, the user must use ded-icated tools to support the recovery process. We present Softwarenaut –a tool which supports architecture recovery through interactive explorationand visualization. Classical architecture recovery features, such as filteringand details on demand, are enhanced with evolutionary capabilities whenmulti-version information about a subject system is available. The tool al-lows sharing and discovering the results of previous analysis sessions througha global repository of architectural views indexed by systems.
We present the features of the tool together with the architecture recoveryprocess that it supports using as a case-study ArgoUML, a well-known opensource Java system.
Keywords: Architecture Recovery, Visualization, Reverse Engineering,Software Tools
1. Introduction
Maintaining a software system implies a continuous effort to keep it up todate with the unanticipated changes in its environment [1]. Having therefore
Preprint submitted to Science of Computer Programming March 21, 2012
a clear and current understanding of the architecture of a system is criticalfor its maintenance and evolution [2, 3].
In the case of large software systems the architecture is specified throughmultiple architectural views that correspond to a set of given architecturalviewpoints. An architectural viewpoint is a pattern or template from which todevelop individual views by establishing the purposes and audience for a viewand the techniques for its creation and analysis. Different authors proposedifferent viewpoints [4, 5, 6] but the consensus is that multiple viewpointsare necessary for capturing all the various facets of a system.
As a system evolves, its architecture erodes [7] and an architectural mis-match arises between the as-defined and as-is architecture [8]. One accom-panying property of this continuous drift between the actual and the definedarchitecture of the system is an increasing brittleness of the system [7]. Themain reason for architectural erosion and drift is widespread lack of program-ming language support for expressing the architecture, as well as the lack oftools that associate architectural decisions with the source code.
When the drift and erosion have brought the system architecture awayfrom the initial state, the solution is to recover the architecture of the sys-tem from the source code. Jazayeri defined architecture recovery as “thetechniques and processes used to uncover a system’s architecture from avail-able information” [9].
While some steps of architecture recovery, such as static analysis and factextraction, can be automated, the process requires human intervention andin this context adequate tool support is crucial. From the multiple existingarchitectural viewpoints the architecture recovery tools focus on recoveringmodule and connector views through visualization and interaction [10, 11,12].
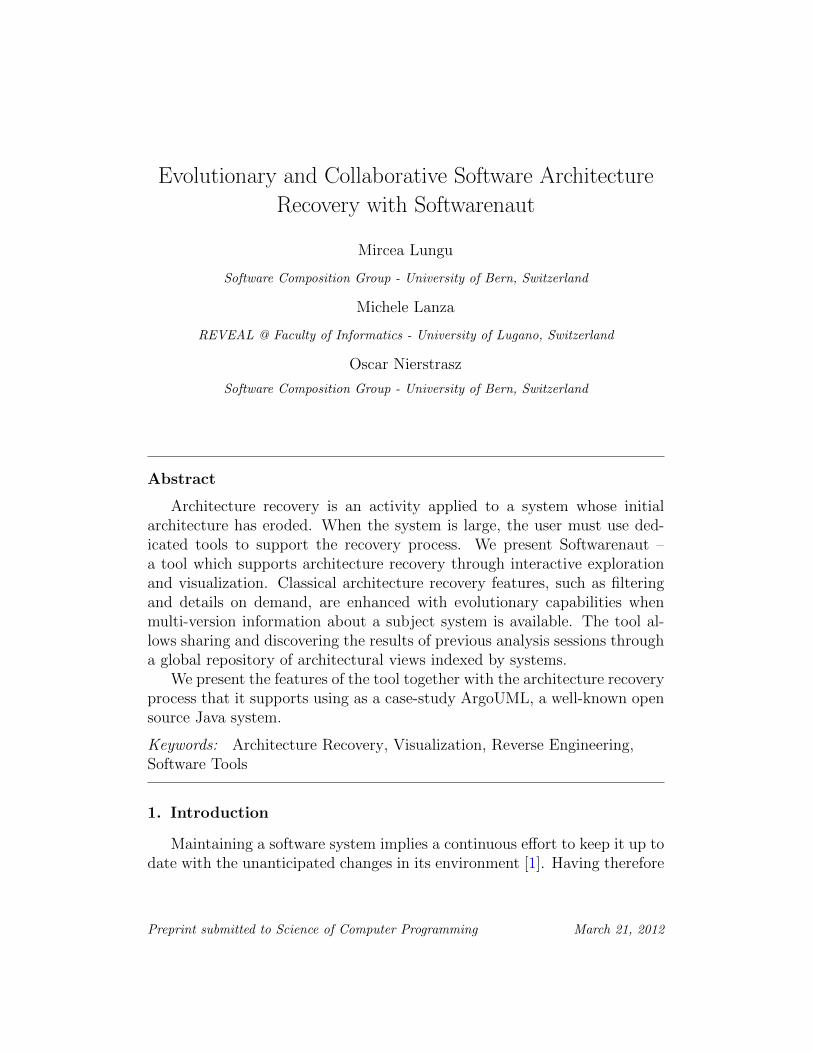
Figure 1 presents the general architecture of any architecture recoverytool. Softwarenaut relies on external tools for the first step and providessupport for the second and third steps:
• Step 2: Information Aggregation. The tool takes into account the hier-archical decomposition of a system as a basis for aggregating artifactsand relationships. In the case of a missing hierarchical decompositionthe tool can automatically generate one. When multiple versions of asystem are available the tool takes them into account to create a historyby fully modeling each individual version.
2
Information Abstraction
Aggregate low-level artifacts vertically along the containment hierarchy of the system and across versions.
Fact Extraction
Extract low-level artifacts and relationships between
them.
Interactive Exploration
Recover architectural views through exploration.
Filter irrelevant information. Save views. Share views.
Softwarenaut
Figure 1: Softwarenaut addresses the last two phases of an extract-abstract-view process
• Step 3: Interactive Visualization and Exploration. The tool allows forinteractive exploration built around the “overview, zoom and filter,then details on demand” information visualization mantra [13]. It pro-vides a variated range of filtering mechanisms and allows the recoveredarchitectural views to be shared between users and tools.
The following are several of the contributions of the tool to the state ofthe art in architecture recovery:
• Supporting multi-version analysis of software systems and enhancingthe exploration, filtering, and details on demand capabilities with evo-lutionary information.
• Providing support for collaboration by allowing users to publish anddiscover previously published architectural views which are indexed bythe analyzed system.
• Providing a rich set of interactive navigation and visualization featuresthat are required for architecture recovery [14] in the context of an openand extensible architecture.
Structure of the article. We start with describing the particularities of thetool in two of the phases of architecture recovery: information aggregation(Section 2) and interactive exploration (Section 3). In Section 4 we discussthe integration of evolutionary analysis in Softwarenaut. In Section 5 weshow how sharing architectural views enables collaboration. In Section 6
3
we discuss architectural considerations and in Section 7 we discuss the tool-building experience. In Section 8 we present related work and in Section 9we conclude and outline future work.
2. Information Abstraction
The fundamental technique that enables abstraction in Softwarenaut isaggregating horizontal relationships between software artifacts along the con-tainment relationships.
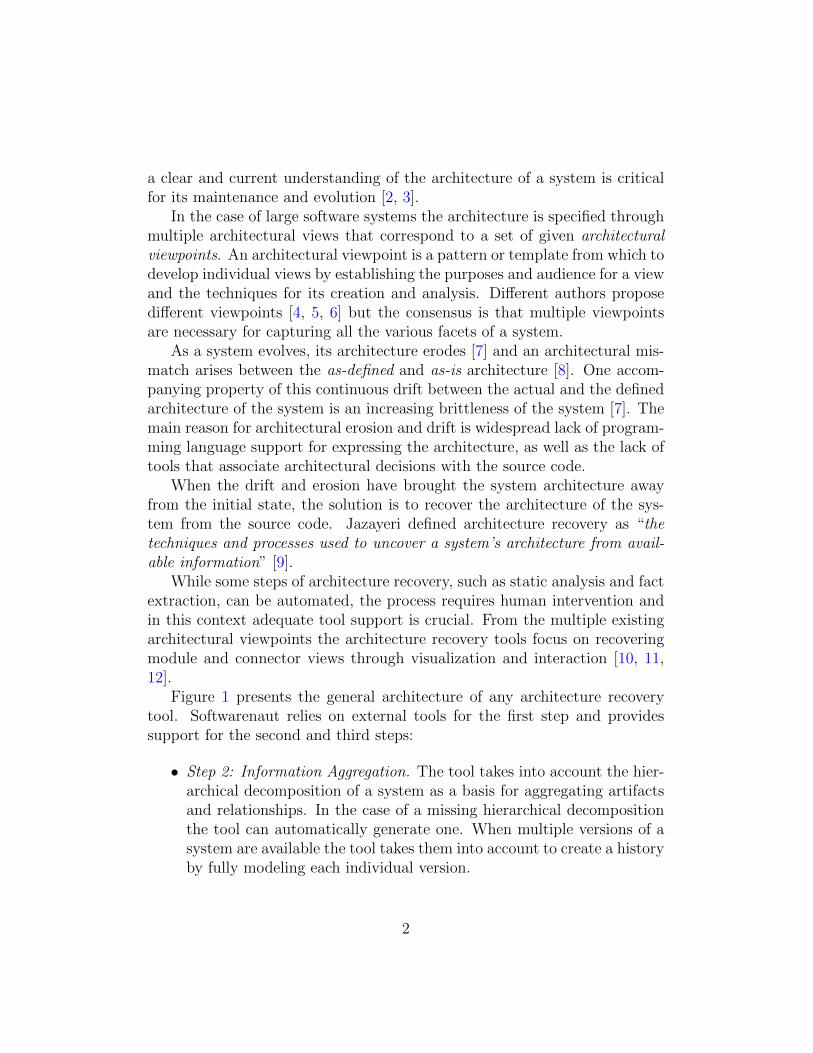
Figure 2 exemplifies the aggregation of low-level relationships betweenmethods and classes along the containment hierarchy of a Java system. Thecase study is ArgoUML1 and the figure focuses on the relationships betweenfour classes from three different packages: uml, uml.kernel, uml.ui, and per-sistence. All these packages contain many classes but the visualized entitiesare sufficient for illustration purposes.
persistenceuml
ui
actionPerformed
Action OpenProject
getExtension
AbstractFilePersister
getInstance
PersistenceManager
getCurrentProject
ProjectManager
kernel
Implicit Dependency
Explicit dependency(e.g. Method Call)
Figure 2: The aggregation of explicit dependencies into implicit ones along the containmenthierarchy of methods, classes, and packages in several classes from the ArgoUML casestudy.
The figure contains three method calls that can be obtained through staticanalysis of the system: the method calls between actionPerformed and re-
1Throughout this article we will continue using ArgoUML as a case study. When wedo not specify otherwise we refer to version 0.24.
4
spectively getCurrentProject, getInstance, and getExtension. These explicitrelationships propagate as implicit relationships vertically along the contain-ment relationships that exist between methods, classes and packages. Someof the implicit relationships that can thus be derived are the dependenciesbetween the ui package and the PersistenceManager class as well as the de-pendency between the uml package and the persistence package.
Aggregating explicit relationships across the hierarchy has a worst caseorder of complexity of O(n2) [15]. Even if in real systems there are neverrelationships between all the leaves of the tree, so the worst case scenariois never encountered, it is common that for non-trivial systems, the on-the-fly computation of the dependencies can make interactive analysis sluggish.To enable interactivity on large systems it is efficient to pre-compute thedependencies between the nodes in the hierarchy [15].
**
*
*Relationship
Composite Leaf
2
ExplicitRelationship *
ImplicitRelationship
HierarchicalGraph
TreeNode
entity: ModelEntity
relationship: ModelRelationship
from, to: TreeNode
ModelEntity
Class Method Package
...
ModelRelationship
Invocation Inheritance Access
...
Figure 3: The hierarchical graph model in Softwarenaut.
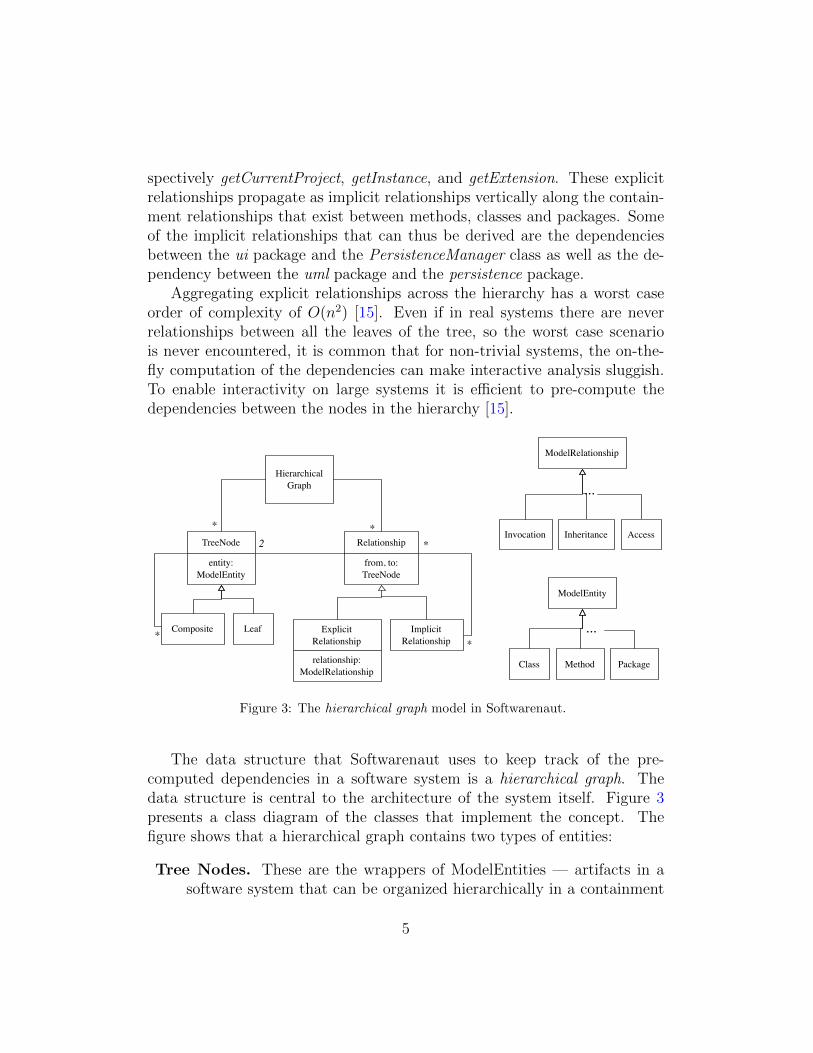
The data structure that Softwarenaut uses to keep track of the pre-computed dependencies in a software system is a hierarchical graph. Thedata structure is central to the architecture of the system itself. Figure 3presents a class diagram of the classes that implement the concept. Thefigure shows that a hierarchical graph contains two types of entities:
Tree Nodes. These are the wrappers of ModelEntities — artifacts in asoftware system that can be organized hierarchically in a containment
5
tree. The diagram shows that the tree is implemented using a Compos-ite design pattern. The objects that the leaves wrap depend on the typeof analysis and available data (in some cases they are classes, and insome others they are methods and instance variables). The compositeentities are higher-level entities which are either declared in the pro-gramming language (such as namespaces and packages) or are obtainedas a result of analysis (such as clusters resulting from the hierarchicalclustering of the leaves).
Relationships. There are two types of relationships: explicit and implicit.
Explicit Relationships are extracted using both static and dynamicanalysis. They often exist between the leaves of the tree (e.g., invo-cations between methods) but not necessarily so (e.g., the inheritancerelations between classes in a tree which contains both methods andclasses). Explicit Relationships wrap actual relationships that are partof the model and which are subclasses of Model Relationship.
Implicit Relationships are derived from the explicit relationships byaggregating them along the containment tree.
The static analysis of object-oriented system has limitations. One of themis that some dependencies cannot be unequivocally resolved. In the presenceof a method that is defined in a base class and overridden in the subclassesit is impossible to know by static analysis to which of the classes a methodcall will be directed. The decision will be taken by the model extractor.Whatever the decision, the relationships that are extracted by the extractorwill be modeled in the hierarchical graph with explicit relationships.
3. Interactive Exploration
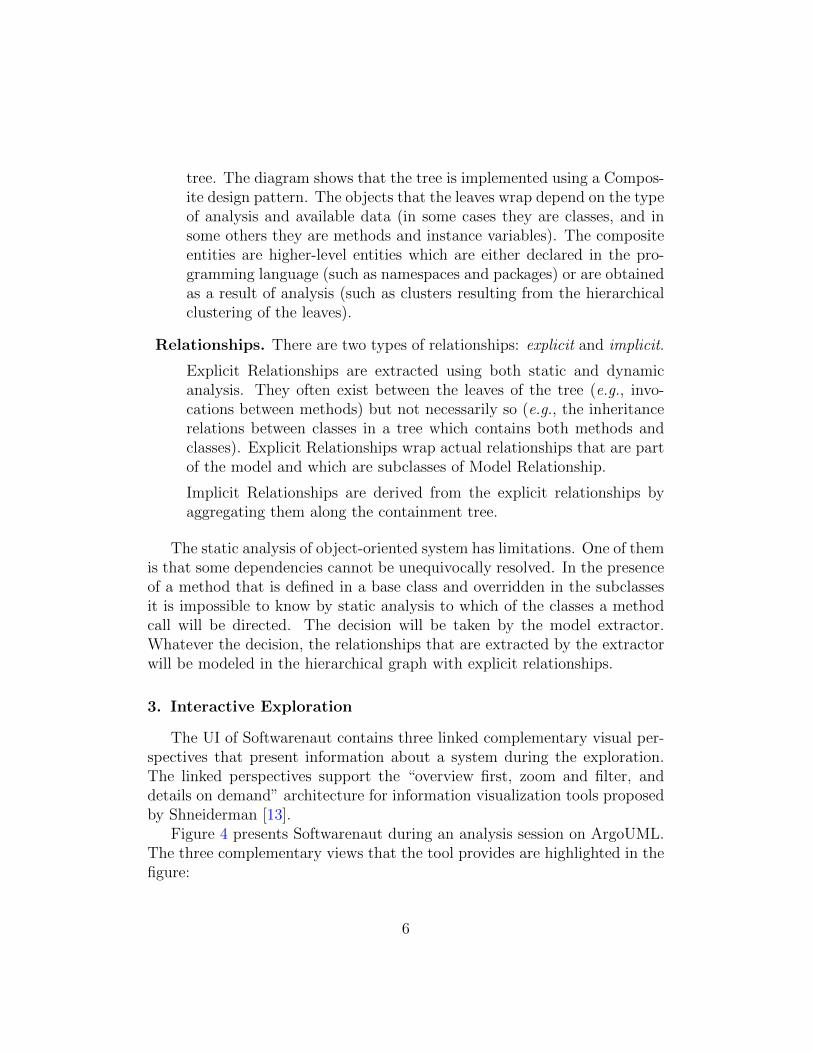
The UI of Softwarenaut contains three linked complementary visual per-spectives that present information about a system during the exploration.The linked perspectives support the “overview first, zoom and filter, anddetails on demand” architecture for information visualization tools proposedby Shneiderman [13].
Figure 4 presents Softwarenaut during an analysis session on ArgoUML.The three complementary views that the tool provides are highlighted in thefigure:
6
The Architectural
View
The Inspector
Panel
The Overview
Panel
12
3
4
Figure 4: The three linked views present complementary perspectives on a software system.In this case the analyzed system is ArgoUML
The Architectural View is Softwarenaut’s graph-based representation of mod-ules and their relationships. The nodes in the graph represent modulesand the edges represent the relationships between the modules, rela-tionships extracted from the static analysis of the system. Each edgein the graph is an aggregation of low-level relationships between thetwo associated modules.
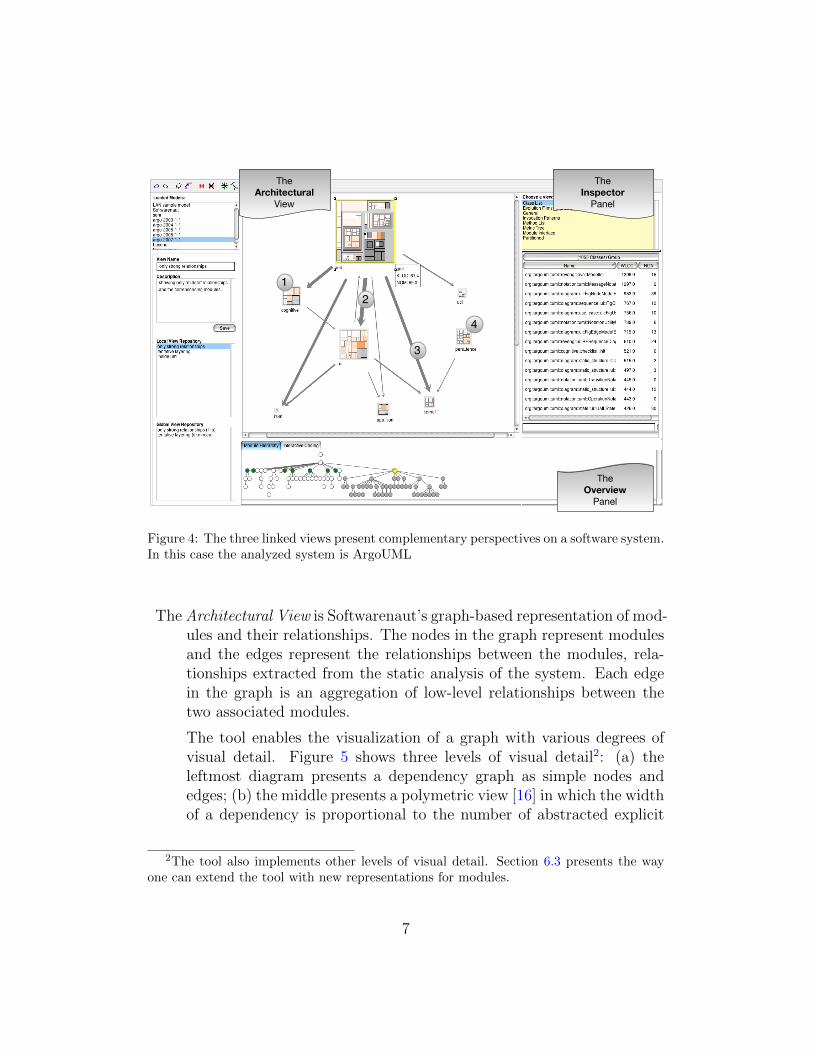
The tool enables the visualization of a graph with various degrees ofvisual detail. Figure 5 shows three levels of visual detail2: (a) theleftmost diagram presents a dependency graph as simple nodes andedges; (b) the middle presents a polymetric view [16] in which the widthof a dependency is proportional to the number of abstracted explicit
2The tool also implements other levels of visual detail. Section 6.3 presents the wayone can extend the tool with new representations for modules.
7
relationships, and the size of a module is proportional to its size; (c)the rightmost diagram presents a modified treemap layout which showsall the contained submodules and classes inside a module.
Figure 5: The tool visualizes a graph with different degrees of sophistication. Left: simplenodes and edges; Middle: polymetric view; Right: a modified treemap view
The Inspector panel presents details for an entity selected in the Explorationpanel. The goal is to supplement details of the element selected in theexploration panel.
The Overview hierarchy presents the entire hierarchy of a system and high-lights the modules that are visible in the exploration panel. It presentsa vertical slice through a system [17], offering an orientation aid whichis critical for successful navigation [18]. In Figure 4 the package treeof ArgoUML is present and on it the packages that are present in theview are highlighted in green. The subtree of the currently selectedelement (e.g.,uml) is highlighted in gray.
In the context of Softwarenaut we consider architecture as “the fundamen-tal organization of a system embodied in its components, their relationshipsto each other” [19]. The software engineering community agrees that thearchitecture of a complex system must be expressed through various archi-tectural viewpoints. Softwarenaut can be used for recovering views of thephysical architecture of the system.
The tool assumes that the hierarchical organization of the system that isprovided as input to the tool contains the architectural components of thesystem or at good approximations of these components. By the interactive
8
exploration of the input hierarchy various perspectives on the architecturecan be extracted; we call these perspectives architectural views. This sectioncontinues by detailing the interactive techniques that support the explorationprocess in Softwarenaut: navigation (Section 3.1), rule-based filtering (Sec-tion 3.2), highlighting (Section 3.3), and details on demand (Section 3.4),
3.1. Navigation
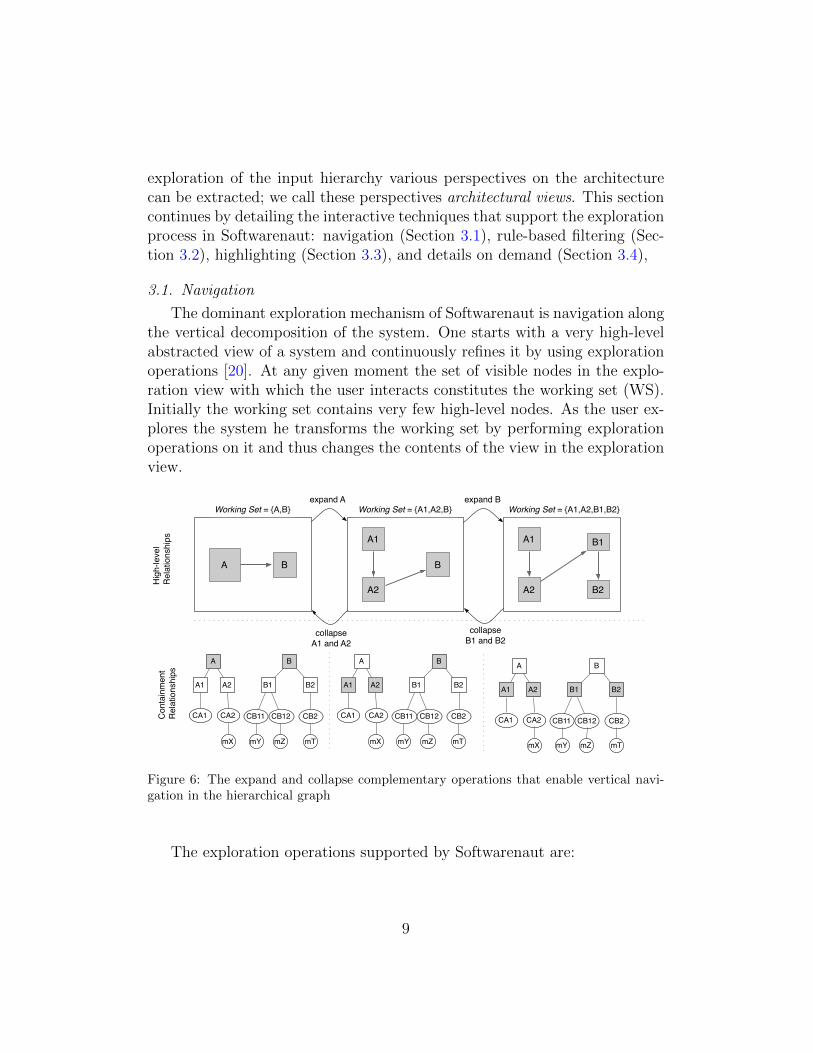
The dominant exploration mechanism of Softwarenaut is navigation alongthe vertical decomposition of the system. One starts with a very high-levelabstracted view of a system and continuously refines it by using explorationoperations [20]. At any given moment the set of visible nodes in the explo-ration view with which the user interacts constitutes the working set (WS).Initially the working set contains very few high-level nodes. As the user ex-plores the system he transforms the working set by performing explorationoperations on it and thus changes the contents of the view in the explorationview.
A B
A1
B
A2
A1 B1
A2 B2
A
A1 A2
CA2CA1
B
B1 B2
expand A expand B
collapseA1 and A2
collapseB1 and B2
Hig
h-le
vel
Rel
atio
nshi
psC
onta
inm
ent
Rel
atio
nshi
ps
Working Set = {A,B} Working Set = {A1,A2,B} Working Set = {A1,A2,B1,B2}
CB11 CB12 CB2
A
A1 A2
CA2CA1
B
B1 B2
CB11 CB12 CB2
A
A1 A2
CA2CA1
B
B1 B2
CB11 CB12 CB2
mX mY mZ mT mX mY mZ mT mX mY mZ mT
Figure 6: The expand and collapse complementary operations that enable vertical navi-gation in the hierarchical graph
The exploration operations supported by Softwarenaut are:
9
Expand. The expand operation applied to a node of the hierarchical graphin the working set replaces the node in the working set with nodes thatrepresent its children.
Collapse. The collapse operation applied to a module in a working setremoves the module and all its siblings from the view and replacesthem with their parent module.
Remove. The remove operation applied to a node removes that node fromthe working set.
Group. The group operation applied to several modules in a working setremoves the modules from the set and adds instead a unique new noderepresenting the entire group.
Focus On. Applied to a node, this operation removes all the nodes andrelationships that are not related to a given node from the view andreorganizes the rest of the elements in the view around the node thatis under focus.
Zoom In. This operation removes all the other nodes from the view andzooms in into the subject node. It is different than the Expand ans isuseful when expanding the node would bring too much detail into theview. It is in fact equivalent with a Filter of all the unrelated nodesand then an Expand.
As the user refines the view, and moves down the vertical hierarchy ofthe system, he brings more and more elements into the view. He can usethe Filter and Group operations on explicit sets of nodes to decrease thenumber of nodes displayed on screen and therefore cope with the complexityof large graphs. One type of module that benefits the user when filtered outis omnipresent modules which contribute little to the understanding of thearchitecture of the system, and heavily clutter the view [21].
History Operations. An important requirement for information explorationtools is keeping track of the interaction and providing undo/redo operations[13]. Very few architecture recovery tools implement this feature. We havediscovered this requirement while testing an earlier version of the tool withusers (see Section 7.2 for more). In its latest version Softwarenaut implementsundo/redo operations.
10
3.2. Filtering
In the previous section we have introduced the Remove operation whichworks on explicit sets of nodes. Most software architecture recovery tools offersuch a filtering operation [22]. Softwarenaut implements two main categoriesof advanced rule-based filters for nodes and edges.
1. Low-level filters act on the hierarchical graph itself. They remove fromthe hierarchical graph the elements that match a given condition, e.g.,all the invocation relationships that go to polymorphic classes.
2. High-level filters act on the high-level elements and relationships be-tween them in the working set, e.g., hiding all the high-level dependen-cies that abstract only a few low-level dependencies.
During exploration, the user needs mostly the high-level filters. Thereare three types of filters that apply to both artifacts and relationships:
Metric-based filters for entities and relationships are defined with respect tothe metrics computed for artifacts. For example filtering out the weakdependencies or the small modules3 in a view. The graph presented inFigure 4 contains only relationships that abstract more than 50 low-level dependencies.
Type-based filters for entities and relationships are defined with respect tothe type of the artifacts. For example showing only inheritance rela-tionships or hiding all the classes from a view. The graph presentedin Figure 4 presents only invocation relationships and filters out anyother type of relationship.
Evolutionary filters are defined based on the historical evolution of a moduleor an inter-module relationship in the system4. For example showingonly the relationships that existed in all the versions of a system, hidingall the unstable relationships [23], or displaying only the modules thatwere introduced in the last version of the system.
3These are threshold-based high-pass filters4Evolution-based filters require models of multiple versions of a system loaded. We
talk more about them in Section 4
11
2
1
3
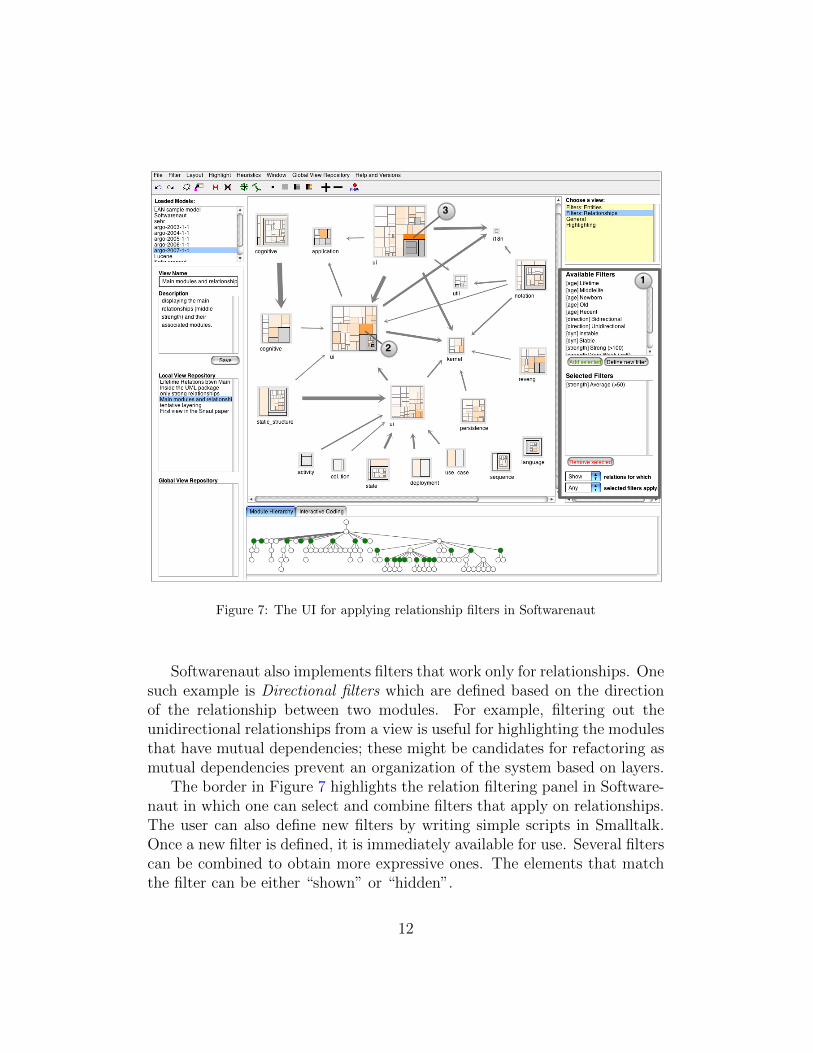
Figure 7: The UI for applying relationship filters in Softwarenaut
Softwarenaut also implements filters that work only for relationships. Onesuch example is Directional filters which are defined based on the directionof the relationship between two modules. For example, filtering out theunidirectional relationships from a view is useful for highlighting the modulesthat have mutual dependencies; these might be candidates for refactoring asmutual dependencies prevent an organization of the system based on layers.
The border in Figure 7 highlights the relation filtering panel in Software-naut in which one can select and combine filters that apply on relationships.The user can also define new filters by writing simple scripts in Smalltalk.Once a new filter is defined, it is immediately available for use. Several filterscan be combined to obtain more expressive ones. The elements that matchthe filter can be either “shown” or “hidden”.
12
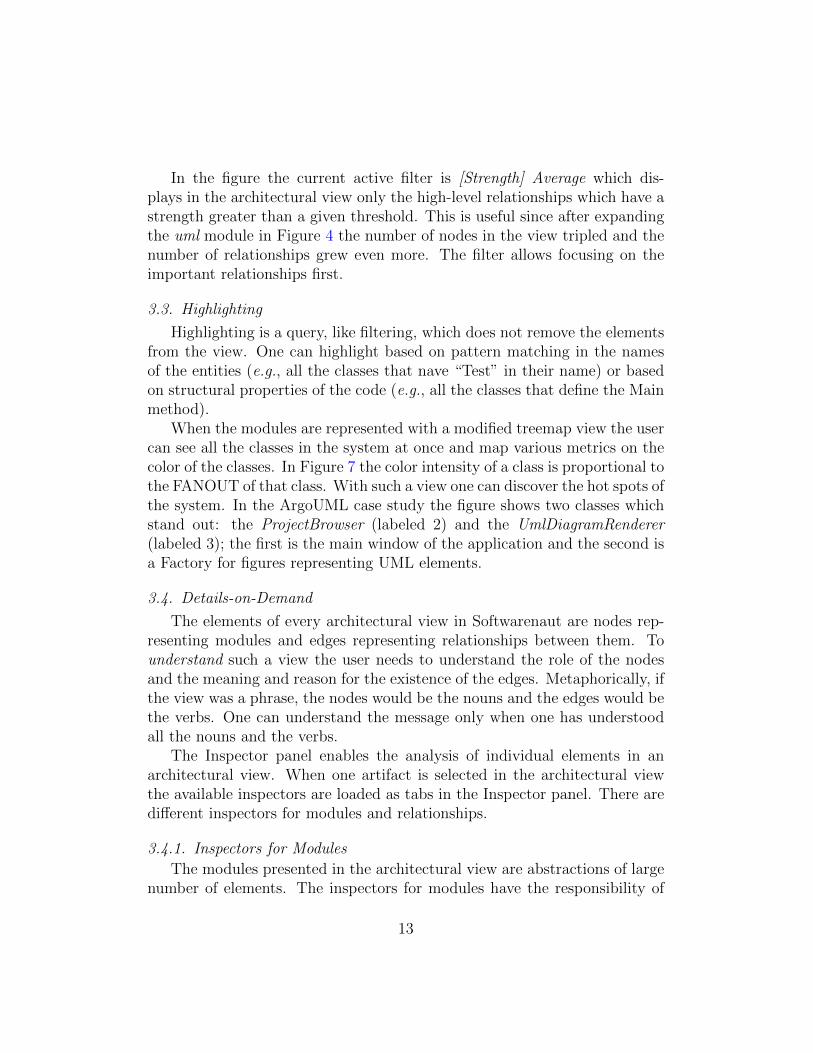
In the figure the current active filter is [Strength] Average which dis-plays in the architectural view only the high-level relationships which have astrength greater than a given threshold. This is useful since after expandingthe uml module in Figure 4 the number of nodes in the view tripled and thenumber of relationships grew even more. The filter allows focusing on theimportant relationships first.
3.3. Highlighting
Highlighting is a query, like filtering, which does not remove the elementsfrom the view. One can highlight based on pattern matching in the namesof the entities (e.g., all the classes that nave “Test” in their name) or basedon structural properties of the code (e.g., all the classes that define the Mainmethod).
When the modules are represented with a modified treemap view the usercan see all the classes in the system at once and map various metrics on thecolor of the classes. In Figure 7 the color intensity of a class is proportional tothe FANOUT of that class. With such a view one can discover the hot spots ofthe system. In the ArgoUML case study the figure shows two classes whichstand out: the ProjectBrowser (labeled 2) and the UmlDiagramRenderer(labeled 3); the first is the main window of the application and the second isa Factory for figures representing UML elements.
3.4. Details-on-Demand
The elements of every architectural view in Softwarenaut are nodes rep-resenting modules and edges representing relationships between them. Tounderstand such a view the user needs to understand the role of the nodesand the meaning and reason for the existence of the edges. Metaphorically, ifthe view was a phrase, the nodes would be the nouns and the edges would bethe verbs. One can understand the message only when one has understoodall the nouns and the verbs.
The Inspector panel enables the analysis of individual elements in anarchitectural view. When one artifact is selected in the architectural viewthe available inspectors are loaded as tabs in the Inspector panel. There aredifferent inspectors for modules and relationships.
3.4.1. Inspectors for Modules
The modules presented in the architectural view are abstractions of largenumber of elements. The inspectors for modules have the responsibility of
13
shedding light on the role of a module in a system. There are two types ofmodule inspectors:
• Inspectors that detail the internals of a module. They summarize thecontents of a module or present them in a more detailed form than ispossible in the architectural view. The Class Metrics inspector showsmetrics for all the classes contained in a module and its submodules.
The left part of Figure 8 presents the Class Metrics inspector for thecognitive module5. The module abstracts 73 classes and for each theview displays the number of methods (NOM). Some of the largestclasses in the module are: ToDoList, Designer, ToDoItem. The namesof the classes reveal the functionality of the module: providing cognitivesupport for task management.
• Inspectors that detail the interaction of a module with the rest of the sys-tem. Such inspectors summarize the relationships of a module. Theyare required since the architectural views only present individual re-lationships between pairs of modules and although these individualrelationships can be inspected there is no way of analyzing all of themat once. The Module Interface inspector presents a dependency ma-trix between the classes from the module (rows in the matrix) and theother modules in the architectural view (columns in the matrix). Thecells in the matrix have the color shade proportional to the number ofdependencies.
The right part of Figure 8 presents the Module Interface for cognitive.The first observation is that some of the classes are widely used by theother modules (e.g., the Designer and ToDoItem) while others are onlyused by one of the modules (e.g.,Critic). The second is that only 28 ofall the 73 classes are used by the other modules in the system; of these28 about half are used rarely as the white coloring of the matrix cellsshow.
3.4.2. Inspectors for Relationships
The relationships presented in the architectural view represent collectionsof low-level relationships. The relationship inspectors provide support for un-derstanding them. They are important since understanding the relationships
5The module is labeled (1) in Figure 4
14
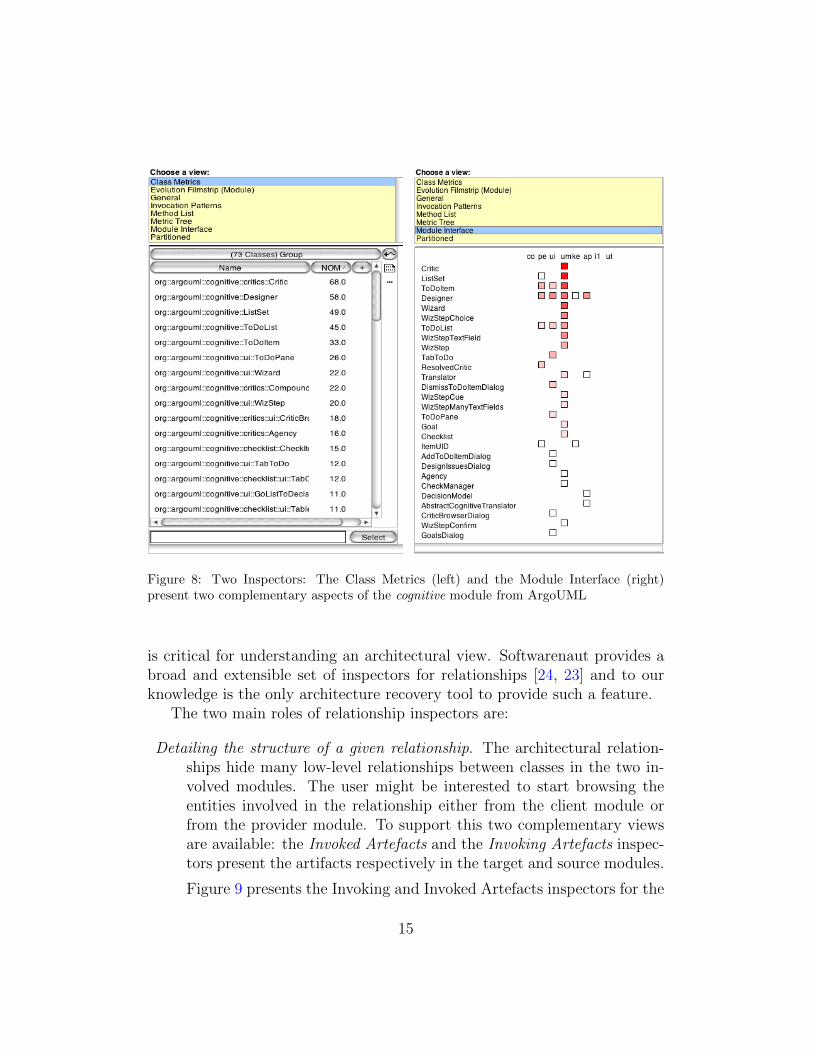
Figure 8: Two Inspectors: The Class Metrics (left) and the Module Interface (right)present two complementary aspects of the cognitive module from ArgoUML
is critical for understanding an architectural view. Softwarenaut provides abroad and extensible set of inspectors for relationships [24, 23] and to ourknowledge is the only architecture recovery tool to provide such a feature.
The two main roles of relationship inspectors are:
Detailing the structure of a given relationship. The architectural relation-ships hide many low-level relationships between classes in the two in-volved modules. The user might be interested to start browsing theentities involved in the relationship either from the client module orfrom the provider module. To support this two complementary viewsare available: the Invoked Artefacts and the Invoking Artefacts inspec-tors present the artifacts respectively in the target and source modules.
Figure 9 presents the Invoking and Invoked Artefacts inspectors for the
15
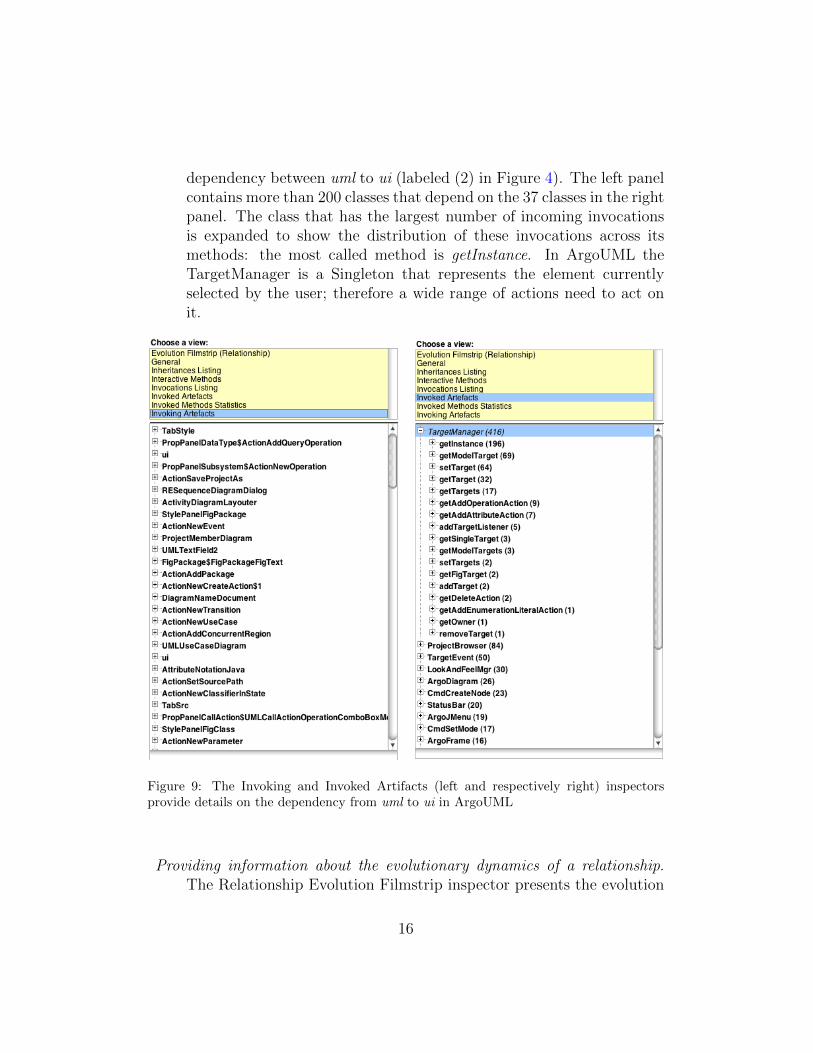
dependency between uml to ui (labeled (2) in Figure 4). The left panelcontains more than 200 classes that depend on the 37 classes in the rightpanel. The class that has the largest number of incoming invocationsis expanded to show the distribution of these invocations across itsmethods: the most called method is getInstance. In ArgoUML theTargetManager is a Singleton that represents the element currentlyselected by the user; therefore a wide range of actions need to act onit.
Figure 9: The Invoking and Invoked Artifacts (left and respectively right) inspectorsprovide details on the dependency from uml to ui in ArgoUML
Providing information about the evolutionary dynamics of a relationship.The Relationship Evolution Filmstrip inspector presents the evolution
16
of the given relationship in all the versions of the system that are avail-able for analysis. Figure 11 presents such a view: the two modules andthe associated relationship are represented in every analyzed versionwith metrics providing information about the dynamics of the relation-ship. Section 4 presents more details about the Evolution Filmstripwhile discussing evolutionary aspects of the tool.
4. Evolutionary Analysis
Softwarenaut can take evolutionary information into account to provideadvanced inspectors, history-enabled filters, and highlighters.
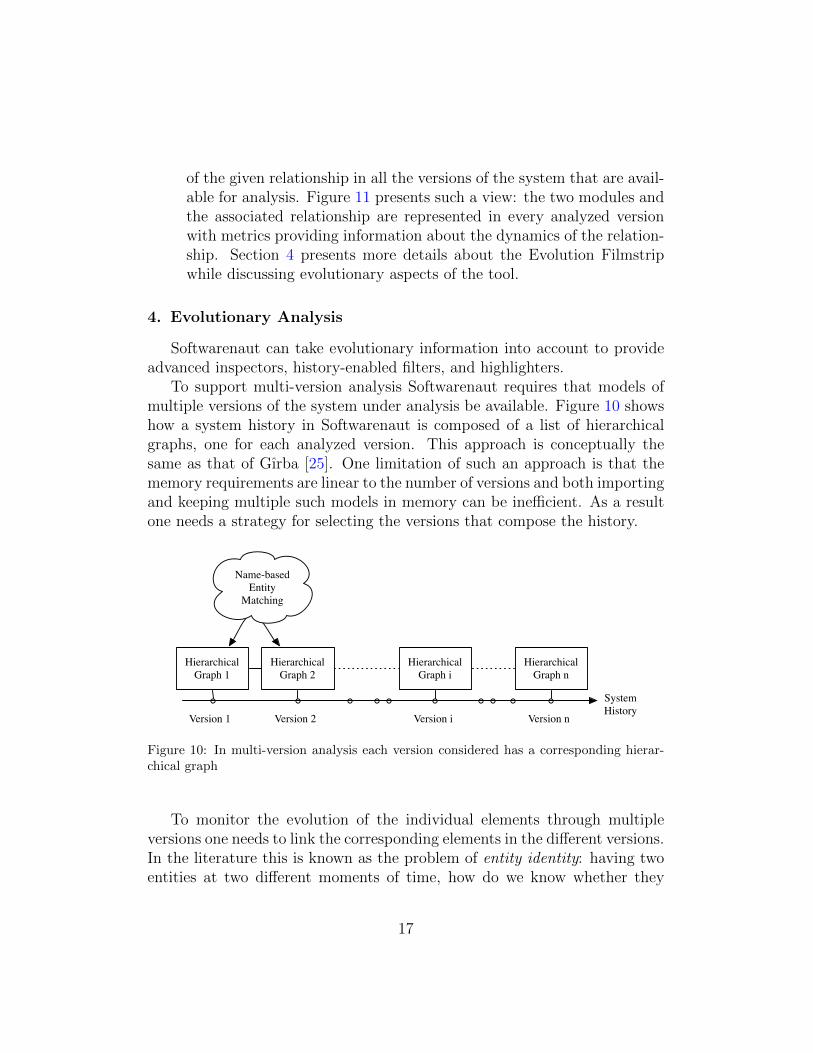
To support multi-version analysis Softwarenaut requires that models ofmultiple versions of the system under analysis be available. Figure 10 showshow a system history in Softwarenaut is composed of a list of hierarchicalgraphs, one for each analyzed version. This approach is conceptually thesame as that of Gırba [25]. One limitation of such an approach is that thememory requirements are linear to the number of versions and both importingand keeping multiple such models in memory can be inefficient. As a resultone needs a strategy for selecting the versions that compose the history.
Hierarchical Graph 1
Hierarchical Graph 2
Hierarchical Graph i
Hierarchical Graph n
Name-basedEntity
Matching
Version 1 Version 2 Version i Version n
System History
Figure 10: In multi-version analysis each version considered has a corresponding hierar-chical graph
To monitor the evolution of the individual elements through multipleversions one needs to link the corresponding elements in the different versions.In the literature this is known as the problem of entity identity: having twoentities at two different moments of time, how do we know whether they
17
are two versions of the same entity. This problem can also be found in theliterature under the name of origin analysis [26]. The most common wayto recover the identity is by the name of the entity, that is, if we have twoentities with the same name and the same type in two versions, then theyare considered to be two versions of the same history. One limitation of thisapproach is that it fails to recognize rename refactorings.
In the following section we show examples of inspectors and filters thattake advantage of the available multi-version analysis.
4.1. Evolutionary Inspectors for Relationships
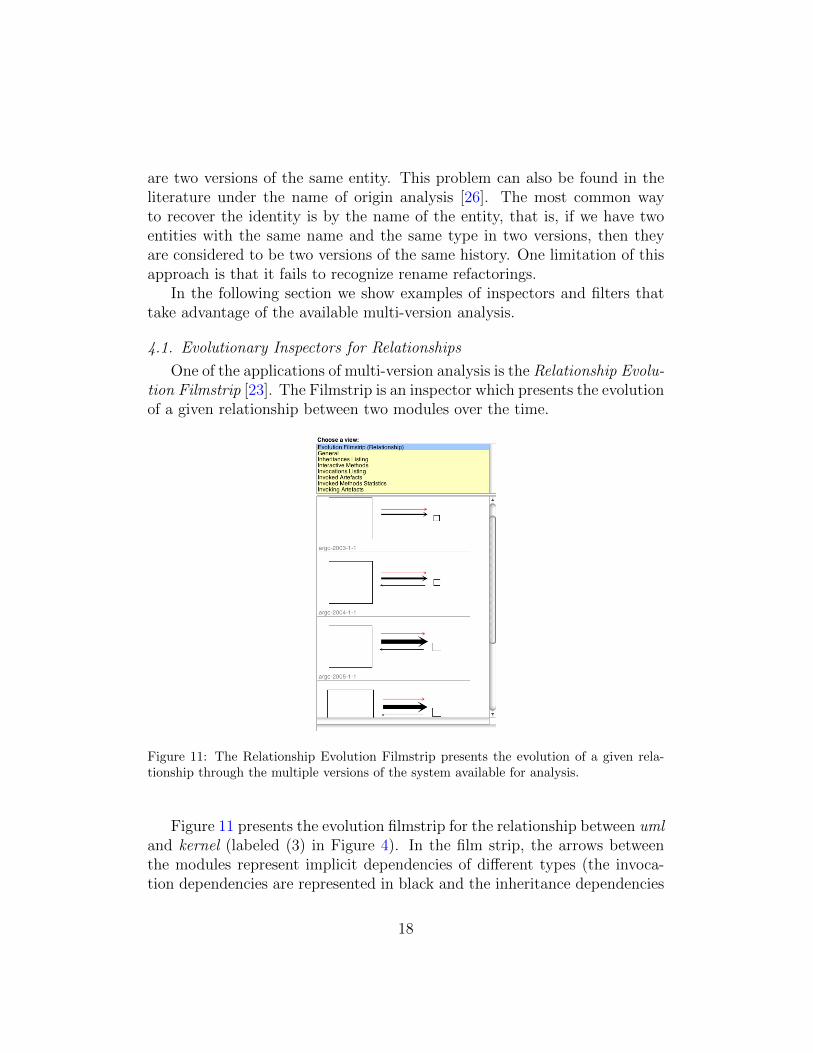
One of the applications of multi-version analysis is the Relationship Evolu-tion Filmstrip [23]. The Filmstrip is an inspector which presents the evolutionof a given relationship between two modules over the time.
Figure 11: The Relationship Evolution Filmstrip presents the evolution of a given rela-tionship through the multiple versions of the system available for analysis.
Figure 11 presents the evolution filmstrip for the relationship between umland kernel (labeled (3) in Figure 4). In the film strip, the arrows betweenthe modules represent implicit dependencies of different types (the invoca-tion dependencies are represented in black and the inheritance dependencies
18
are represented in red). The width of the dependency arrows is proportionalto the number of low-level dependencies abstracted in the corresponding im-plicit dependency [23]. The representation of the width of the dependenciesprovides insight into the quantitative dynamics of the inter-module relation-ship.
In Figure 11 we see that in the initial version the dependency was unidi-rectional from uml to kernel. Later a reverse dependency is introduced fromthe Project and ProjectManager classes which accesses a few functionalitiesin the uml package.
4.2. Evolutionary Inspectors for Modules
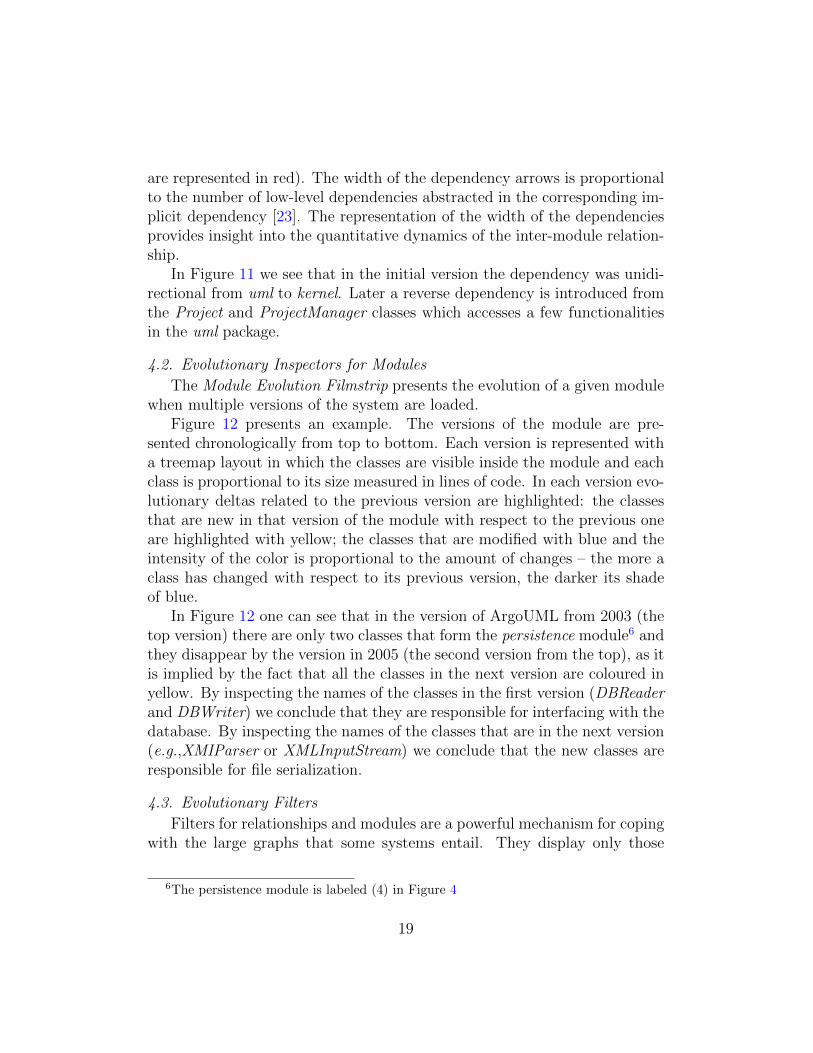
The Module Evolution Filmstrip presents the evolution of a given modulewhen multiple versions of the system are loaded.
Figure 12 presents an example. The versions of the module are pre-sented chronologically from top to bottom. Each version is represented witha treemap layout in which the classes are visible inside the module and eachclass is proportional to its size measured in lines of code. In each version evo-lutionary deltas related to the previous version are highlighted: the classesthat are new in that version of the module with respect to the previous oneare highlighted with yellow; the classes that are modified with blue and theintensity of the color is proportional to the amount of changes – the more aclass has changed with respect to its previous version, the darker its shadeof blue.
In Figure 12 one can see that in the version of ArgoUML from 2003 (thetop version) there are only two classes that form the persistence module6 andthey disappear by the version in 2005 (the second version from the top), as itis implied by the fact that all the classes in the next version are coloured inyellow. By inspecting the names of the classes in the first version (DBReaderand DBWriter) we conclude that they are responsible for interfacing with thedatabase. By inspecting the names of the classes that are in the next version(e.g.,XMIParser or XMLInputStream) we conclude that the new classes areresponsible for file serialization.
4.3. Evolutionary Filters
Filters for relationships and modules are a powerful mechanism for copingwith the large graphs that some systems entail. They display only those
6The persistence module is labeled (4) in Figure 4
19
Figure 12: The evolution of the persistence module in ArgoUML shows that the systemmigrated from a database serialization policy to a file-based one between 2003 and 2005
elements in an architectural view that are important for a given task and thusfocus the analysis. Evolutionary filters for both relationships and entities canbe classified in two main categories:
Age-based filters take into account the number of versions in which therelationships or modules existed in the system. Lifetime relationshipshave existed in all the versions of the system, Newborn relationship haveappeared only in the last analyzed version [23], Historical modules haveexisted since the first analyzed versions of the system.
Dynamics-based filters take into account the dynamics of the relationshipsand modules across versions. Stable relationships do not change muchduring the evolution of the system, Unstable relationships change fre-quently during the history of the system.
20
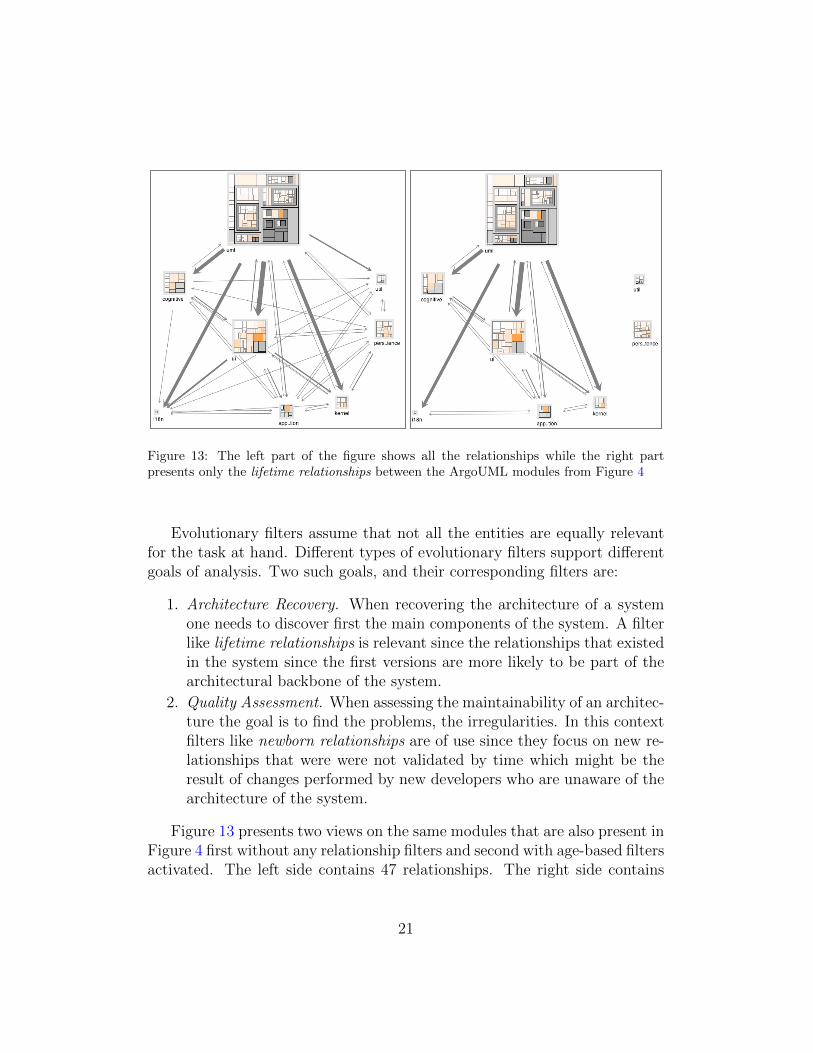
Figure 13: The left part of the figure shows all the relationships while the right partpresents only the lifetime relationships between the ArgoUML modules from Figure 4
Evolutionary filters assume that not all the entities are equally relevantfor the task at hand. Different types of evolutionary filters support differentgoals of analysis. Two such goals, and their corresponding filters are:
1. Architecture Recovery. When recovering the architecture of a systemone needs to discover first the main components of the system. A filterlike lifetime relationships is relevant since the relationships that existedin the system since the first versions are more likely to be part of thearchitectural backbone of the system.
2. Quality Assessment. When assessing the maintainability of an architec-ture the goal is to find the problems, the irregularities. In this contextfilters like newborn relationships are of use since they focus on new re-lationships that were were not validated by time which might be theresult of changes performed by new developers who are unaware of thearchitecture of the system.
Figure 13 presents two views on the same modules that are also present inFigure 4 first without any relationship filters and second with age-based filtersactivated. The left side contains 47 relationships. The right side contains
21
only the lifetime relationships: 22 relationships that existed between thedisplayed modules in all the versions of the system.
The usefulness of the filters is hinted by the fact that in the second viewthe number of relationships is low compared with the total number of rela-tionships that are present in the last version of the system; thus age-basedfilters can function as mechanisms for reducing the information overload. Amore in-depth study on the power of age-based filters as information reducersis found elsewhere [23].
5. Collaboration Through First-Class Views
Traditionally software analysis tools were designed with a analysis-in-one-sitting attitude in mind. One was supposed to start the analysis, arriveat some results, and then discard all the data such that if he had to startagain, he would start from scratch. In Softwarenaut we want to enable theinterruption and continuation of the analysis, and the reuse of the results ofthe analysis between sessions. Moreover, traditional software analysis neverreuses the information that one user has gained about a certain version ofthe system when another user analyzes the same system. This is unfortunatesince once published a version of a system never changes and therefore theresults of one analysis can contribute to further analyses. In Softwarenautthese two problems are addressed with the help of first-class views and theconcept of a Global View Repository, a service for sharing recovered archi-tectural views.
5.1. First-Class Views
The designers of a system use multiple diagrams for the specification ofthe architecture of a system. In the same way, during architecture recoverythey need to recover multiple views to capture various aspects of the structureof the system.
Views are first-class entities in Softwarenaut: one can save and restoreany view during the exploration. During an exploration session, each timethe analyst encounters a view that presents a relevant perspective on thesystem he can save it for later reference or for sharing with others. Theresult of a Softwarenaut analysis session is therefore a set of architecturalviews.
The view persistence mechanism can be used also as a way of conqueringthe complexity of top-down exploration. When the architectural view under
22
analysis becomes too complex, the user can save it and then explore differ-ent sub-parts of it. This is addressed partially in other tools by the use ofsemantic zooming techniques [12].
In Softwarenaut a view is defined by the following information:
• a name and description,
• the name and version of the system under analysis
• the current working set with the positions of all the nodes in it,
• the active artifact and relationship filters (both explicit and rule based),
• the name of the creator of the view
The model of the system is not saved together with the view. We assumethat model construction is deterministic and the name and version of thesystem will suffice for model reconstruction at a later time 7.
5.2. Sharing and Discovering Architectural Views
Once published, a given version of a system never changes. Thereforeall the analysis results regarding that version should be made public so thatother users can discover previous results and corroborate their findings. Inthe context of architectural view recovery this means discovering architec-tural views that others have previously recovered.
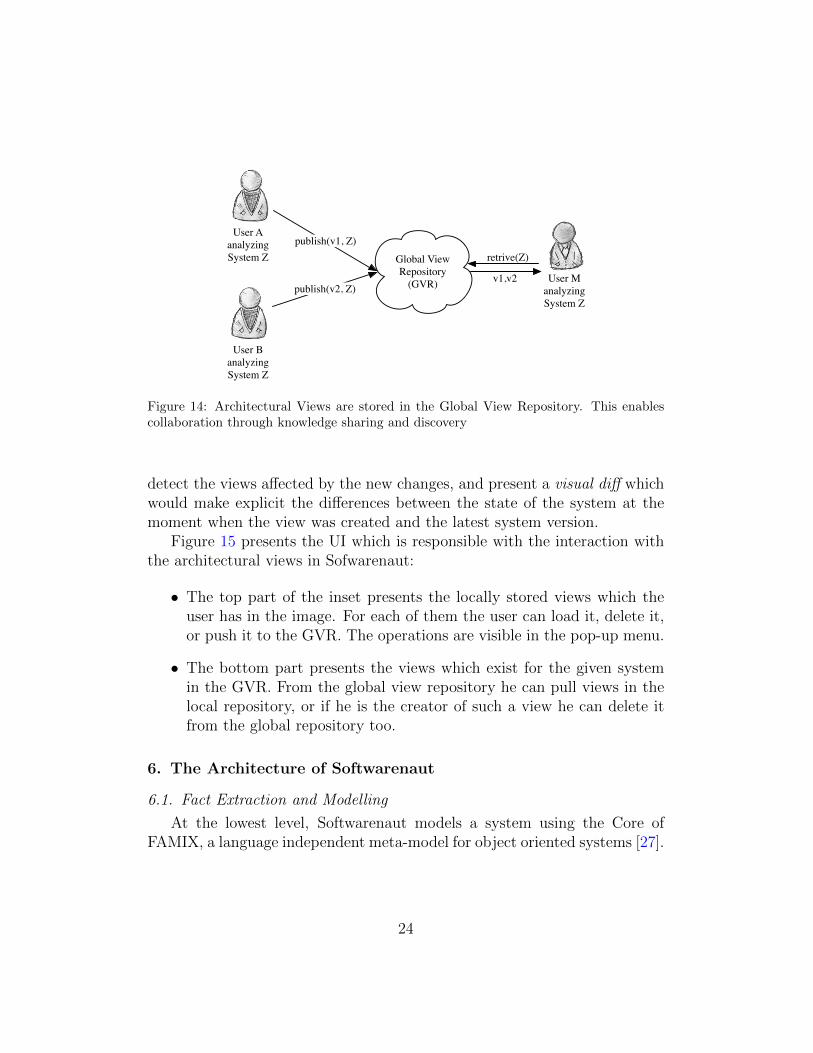
To support sharing and discovering architectural views we have createdthe Global Architectural View Repository (GVR) – a public repository thatindexes architectural views. Figure 14 presents the concept behind the GVRthrough a simplified example. While analyzing system Z, users A and Bpublish views v1 and v28. When later user M analyzes the same system, hecan already benefit from the previous knowledge by discovering the viewsthat users A and B have published.
In the future, the architectural views as saved in the GVR can serve asthe basis for monitoring the architectural evolution of the system. After thepublication of a new version of the system, Softwarenaut would automatically
7This requires nevertheless a way of uniquely identifying the entities in the view. Inour case, for each of the entities in the working set we save the fully scoped name
8The publish(v1, Z) notation means publishing to the GVR the view v1 for system Z
23
Global View Repository
(GVR)publish(v2, Z)
publish(v1, Z)User A
analyzing System Z
User Banalyzing System Z
User Manalyzing System Z
retrive(Z)
v1,v2
Figure 14: Architectural Views are stored in the Global View Repository. This enablescollaboration through knowledge sharing and discovery
detect the views affected by the new changes, and present a visual diff whichwould make explicit the differences between the state of the system at themoment when the view was created and the latest system version.
Figure 15 presents the UI which is responsible with the interaction withthe architectural views in Sofwarenaut:
• The top part of the inset presents the locally stored views which theuser has in the image. For each of them the user can load it, delete it,or push it to the GVR. The operations are visible in the pop-up menu.
• The bottom part presents the views which exist for the given systemin the GVR. From the global view repository he can pull views in thelocal repository, or if he is the creator of such a view he can delete itfrom the global repository too.
6. The Architecture of Softwarenaut
6.1. Fact Extraction and Modelling
At the lowest level, Softwarenaut models a system using the Core ofFAMIX, a language independent meta-model for object oriented systems [27].
24
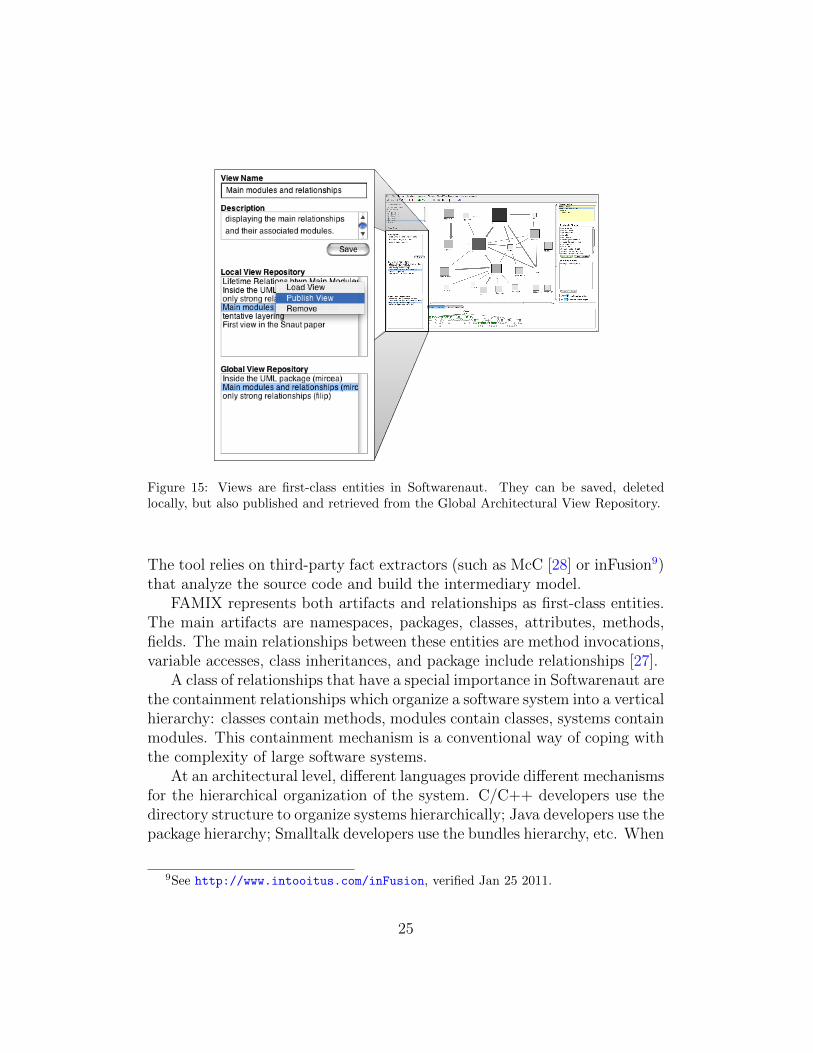
Figure 15: Views are first-class entities in Softwarenaut. They can be saved, deletedlocally, but also published and retrieved from the Global Architectural View Repository.
The tool relies on third-party fact extractors (such as McC [28] or inFusion9)that analyze the source code and build the intermediary model.
FAMIX represents both artifacts and relationships as first-class entities.The main artifacts are namespaces, packages, classes, attributes, methods,fields. The main relationships between these entities are method invocations,variable accesses, class inheritances, and package include relationships [27].
A class of relationships that have a special importance in Softwarenaut arethe containment relationships which organize a software system into a verticalhierarchy: classes contain methods, modules contain classes, systems containmodules. This containment mechanism is a conventional way of coping withthe complexity of large software systems.
At an architectural level, different languages provide different mechanismsfor the hierarchical organization of the system. C/C++ developers use thedirectory structure to organize systems hierarchically; Java developers use thepackage hierarchy; Smalltalk developers use the bundles hierarchy, etc. When
9See http://www.intooitus.com/inFusion, verified Jan 25 2011.
25
a hierarchical decomposition is not provided, we can automatically generateone using clustering techniques [29]. We presented elsewhere an experimentin clustering the classes in a system based on language similarity[30].
6.2. Integration with the Moose Analysis Platform
Softwarenaut is integrated in the Moose Analysis Platform [31]. Software-naut reuses several of the views defined in Moose for its inspectors (e.g., theinspectors that show entity metrics). Also, since behind any visual elementof Softwarenaut lays a TreeNode object which wraps often a FAMIX entity(e.g., FAMIXPackage or FAMIXClass) the user can spawn other Moose anal-yses by selecting any of the elements of a Softwarenaut architectural view.At the same time, any tool in the Moose platform can spawn a Software-naut architectural analysis on any group of entities which have containmentrelationships and dependencies between themselves.
6.3. Mechanisms for Tool Extension
Many of the features of the tool are discovered at run-time through re-flection so that that all one needs is to know the extension points. Here wegive examples of several of the features that are loaded reflectively togetherwith the rules by which they are discovered.
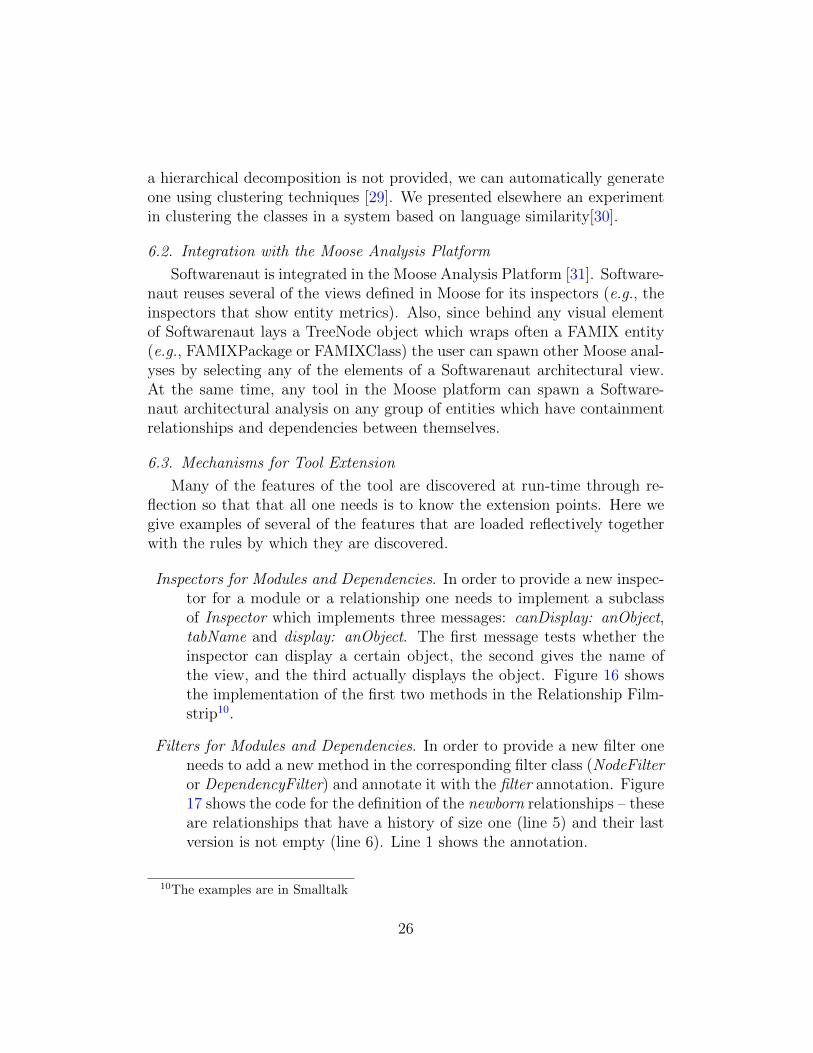
Inspectors for Modules and Dependencies. In order to provide a new inspec-tor for a module or a relationship one needs to implement a subclassof Inspector which implements three messages: canDisplay: anObject,tabName and display: anObject. The first message tests whether theinspector can display a certain object, the second gives the name ofthe view, and the third actually displays the object. Figure 16 showsthe implementation of the first two methods in the Relationship Film-strip10.
Filters for Modules and Dependencies. In order to provide a new filter oneneeds to add a new method in the corresponding filter class (NodeFilteror DependencyFilter) and annotate it with the filter annotation. Figure17 shows the code for the definition of the newborn relationships – theseare relationships that have a history of size one (line 5) and their lastversion is not empty (line 6). Line 1 shows the annotation.
10The examples are in Smalltalk
26
RelationshipFilmstrip>>canDisplay: anObject1: ^(anObject isKindOf: SN.DependencyCollection) 2: and: [anObject history notNil]
RelationshipFilmstrip>>tabName3: ^'Relationship Evolution Filmstrip'
Figure 16: Two methods enable the runtime discovery of inspectors
DependencyFilter>>isNewborn1: <filter: 'Newborn'>2: ^ShallowDependencyFilter 3: name: 'Newborn'4: block: [:dep| 5: (dep nonEmptyVersions size = 1) 6: and: [self versions last notEmpty]]
Figure 17: Annotating methods in the Filter classes enables run-time discovery
Module Representations. In order to provide a new method for represent-ing a module one needs to subclass the ModuleFigureBuilder class andimplement the moduleFigureFor:withBounds: message in his new class.The method receives the object it is supposed to draw together with therectangle in which it has to fit the visual representation of the object.
6.4. Softwarenaut Synergies
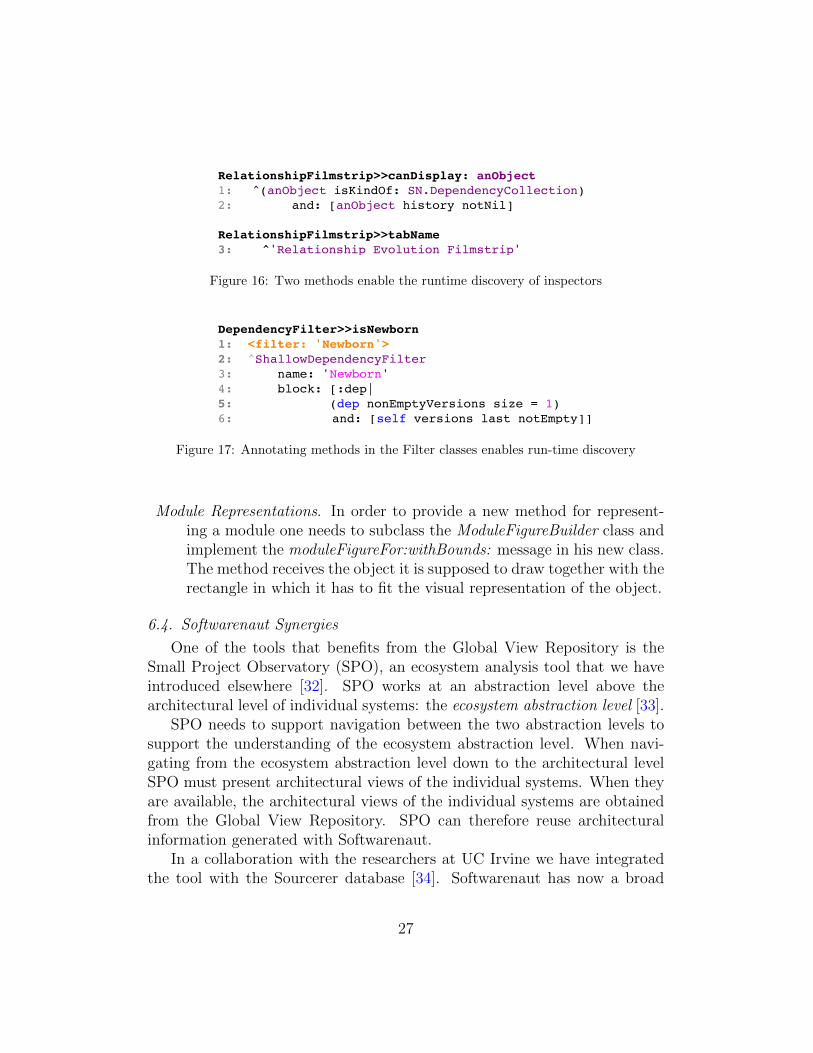
One of the tools that benefits from the Global View Repository is theSmall Project Observatory (SPO), an ecosystem analysis tool that we haveintroduced elsewhere [32]. SPO works at an abstraction level above thearchitectural level of individual systems: the ecosystem abstraction level [33].
SPO needs to support navigation between the two abstraction levels tosupport the understanding of the ecosystem abstraction level. When navi-gating from the ecosystem abstraction level down to the architectural levelSPO must present architectural views of the individual systems. When theyare available, the architectural views of the individual systems are obtainedfrom the Global View Repository. SPO can therefore reuse architecturalinformation generated with Softwarenaut.
In a collaboration with the researchers at UC Irvine we have integratedthe tool with the Sourcerer database [34]. Softwarenaut has now a broad
27
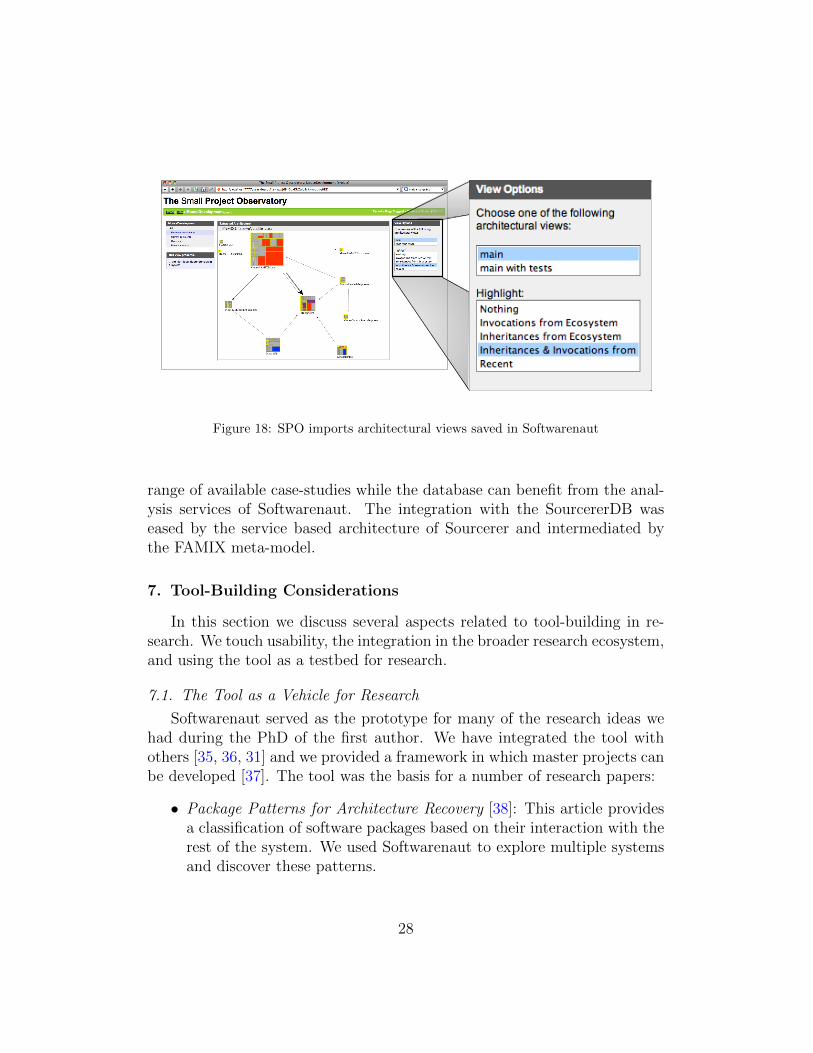
Figure 18: SPO imports architectural views saved in Softwarenaut
range of available case-studies while the database can benefit from the anal-ysis services of Softwarenaut. The integration with the SourcererDB waseased by the service based architecture of Sourcerer and intermediated bythe FAMIX meta-model.
7. Tool-Building Considerations
In this section we discuss several aspects related to tool-building in re-search. We touch usability, the integration in the broader research ecosystem,and using the tool as a testbed for research.
7.1. The Tool as a Vehicle for Research
Softwarenaut served as the prototype for many of the research ideas wehad during the PhD of the first author. We have integrated the tool withothers [35, 36, 31] and we provided a framework in which master projects canbe developed [37]. The tool was the basis for a number of research papers:
• Package Patterns for Architecture Recovery [38]: This article providesa classification of software packages based on their interaction with therest of the system. We used Softwarenaut to explore multiple systemsand discover these patterns.
28
• Exploring Inter-Module Relationships in Software Systems [23]: Thisarticle presents a taxonomy of inter-module dependencies in softwaresystems based on their evolution patterns.
• Interactive Exploration of Semantic Clusters [35]: This article proposesa technique for visualizing dendrograms of software systems using anexploration approach. In order to be able to visualize dendrogramsresulting from hierarchical clustering we had to adapt our model.
• Cutting Edge Visualization in Software [24]: This short article arguesfor the importance of providing detail views that enable one to under-stand dependencies in software.
• Automatic remodularization. One of the extensions built on top ofSoftwarenaut is MARS, an automated architecture refactoring recom-mender tool [37]. It starts from a given Softwarenaut view and checkswhether move operations applied on classes can improve the architec-ture of the system by increasing coupling and decreasing cohesion.
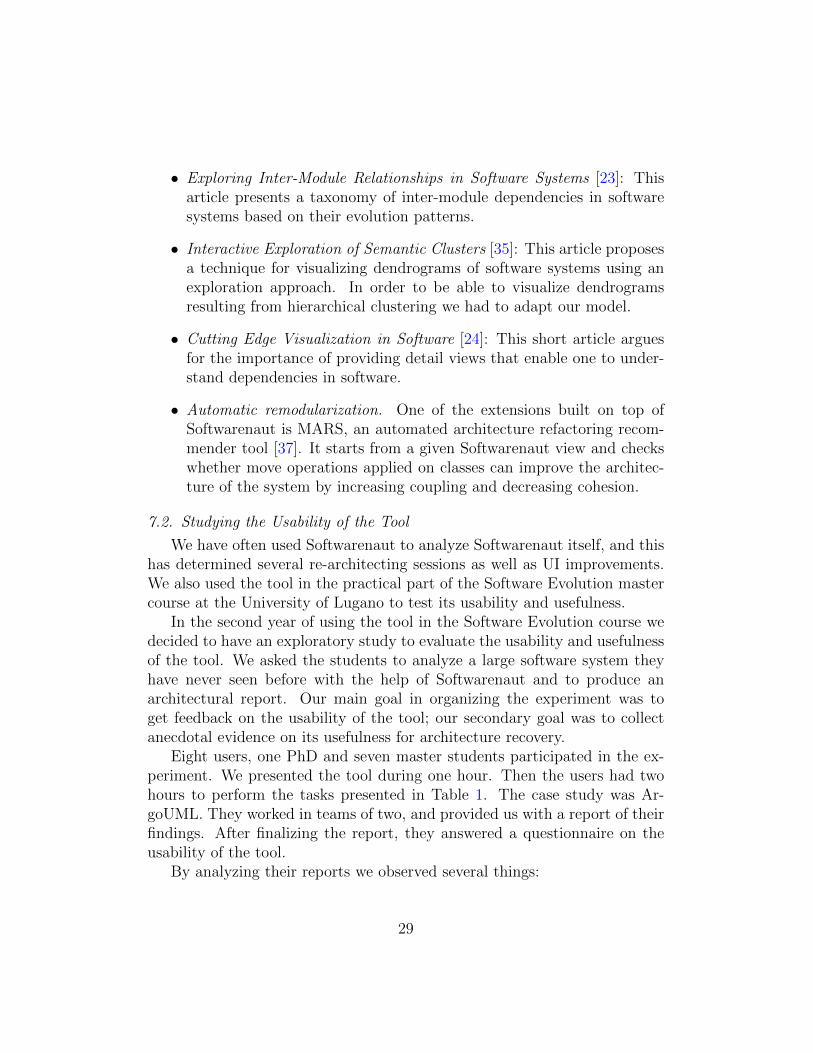
7.2. Studying the Usability of the Tool
We have often used Softwarenaut to analyze Softwarenaut itself, and thishas determined several re-architecting sessions as well as UI improvements.We also used the tool in the practical part of the Software Evolution mastercourse at the University of Lugano to test its usability and usefulness.
In the second year of using the tool in the Software Evolution course wedecided to have an exploratory study to evaluate the usability and usefulnessof the tool. We asked the students to analyze a large software system theyhave never seen before with the help of Softwarenaut and to produce anarchitectural report. Our main goal in organizing the experiment was toget feedback on the usability of the tool; our secondary goal was to collectanecdotal evidence on its usefulness for architecture recovery.
Eight users, one PhD and seven master students participated in the ex-periment. We presented the tool during one hour. Then the users had twohours to perform the tasks presented in Table 1. The case study was Ar-goUML. They worked in teams of two, and provided us with a report of theirfindings. After finalizing the report, they answered a questionnaire on theusability of the tool.
By analyzing their reports we observed several things:
29
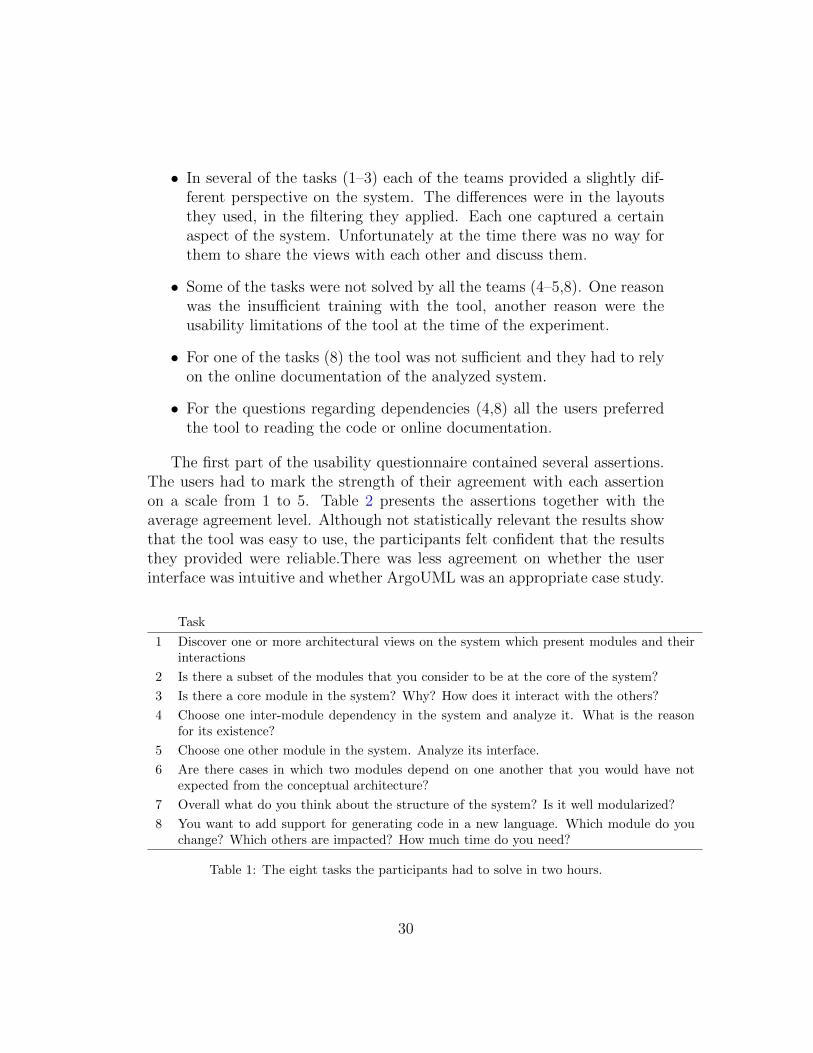
• In several of the tasks (1–3) each of the teams provided a slightly dif-ferent perspective on the system. The differences were in the layoutsthey used, in the filtering they applied. Each one captured a certainaspect of the system. Unfortunately at the time there was no way forthem to share the views with each other and discuss them.
• Some of the tasks were not solved by all the teams (4–5,8). One reasonwas the insufficient training with the tool, another reason were theusability limitations of the tool at the time of the experiment.
• For one of the tasks (8) the tool was not sufficient and they had to relyon the online documentation of the analyzed system.
• For the questions regarding dependencies (4,8) all the users preferredthe tool to reading the code or online documentation.
The first part of the usability questionnaire contained several assertions.The users had to mark the strength of their agreement with each assertionon a scale from 1 to 5. Table 2 presents the assertions together with theaverage agreement level. Although not statistically relevant the results showthat the tool was easy to use, the participants felt confident that the resultsthey provided were reliable.There was less agreement on whether the userinterface was intuitive and whether ArgoUML was an appropriate case study.
Task
1 Discover one or more architectural views on the system which present modules and theirinteractions
2 Is there a subset of the modules that you consider to be at the core of the system?
3 Is there a core module in the system? Why? How does it interact with the others?
4 Choose one inter-module dependency in the system and analyze it. What is the reasonfor its existence?
5 Choose one other module in the system. Analyze its interface.
6 Are there cases in which two modules depend on one another that you would have notexpected from the conceptual architecture?
7 Overall what do you think about the structure of the system? Is it well modularized?
8 You want to add support for generating code in a new language. Which module do youchange? Which others are impacted? How much time do you need?
Table 1: The eight tasks the participants had to solve in two hours.
30
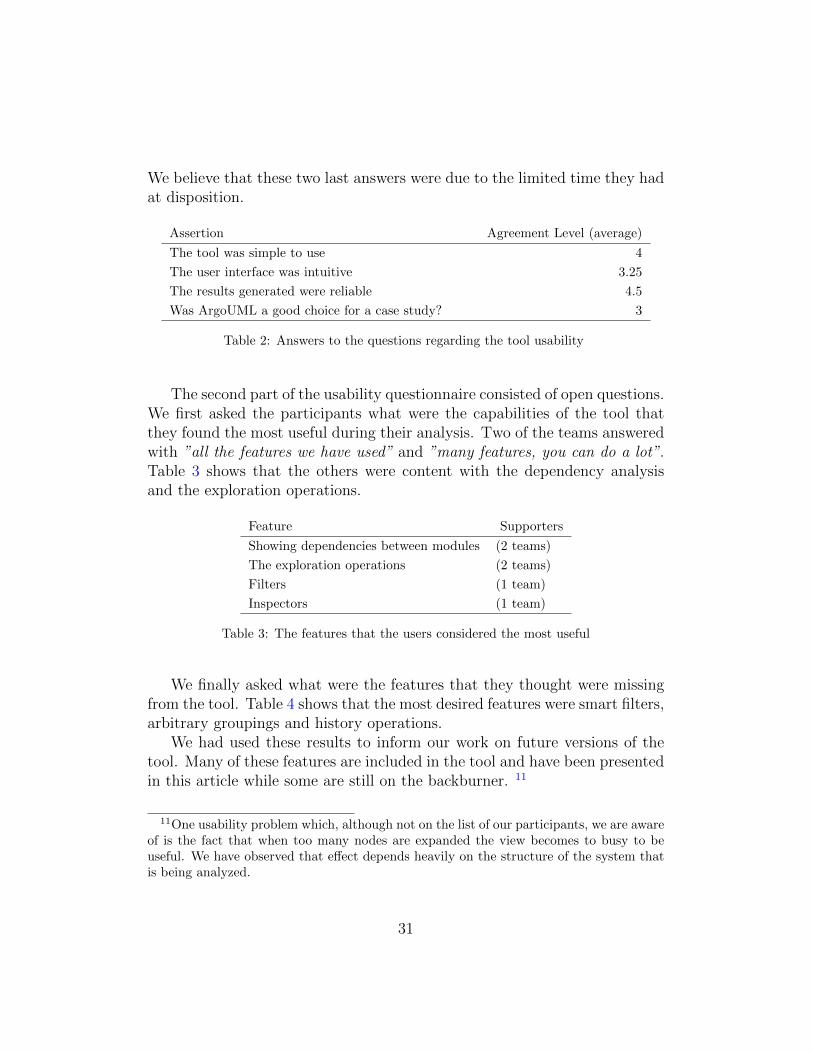
We believe that these two last answers were due to the limited time they hadat disposition.
Assertion Agreement Level (average)
The tool was simple to use 4
The user interface was intuitive 3.25
The results generated were reliable 4.5
Was ArgoUML a good choice for a case study? 3
Table 2: Answers to the questions regarding the tool usability
The second part of the usability questionnaire consisted of open questions.We first asked the participants what were the capabilities of the tool thatthey found the most useful during their analysis. Two of the teams answeredwith ”all the features we have used” and ”many features, you can do a lot”.Table 3 shows that the others were content with the dependency analysisand the exploration operations.
Feature Supporters
Showing dependencies between modules (2 teams)
The exploration operations (2 teams)
Filters (1 team)
Inspectors (1 team)
Table 3: The features that the users considered the most useful
We finally asked what were the features that they thought were missingfrom the tool. Table 4 shows that the most desired features were smart filters,arbitrary groupings and history operations.
We had used these results to inform our work on future versions of thetool. Many of these features are included in the tool and have been presentedin this article while some are still on the backburner. 11
11One usability problem which, although not on the list of our participants, we are awareof is the fact that when too many nodes are expanded the view becomes to busy to beuseful. We have observed that effect depends heavily on the structure of the system thatis being analyzed.
31
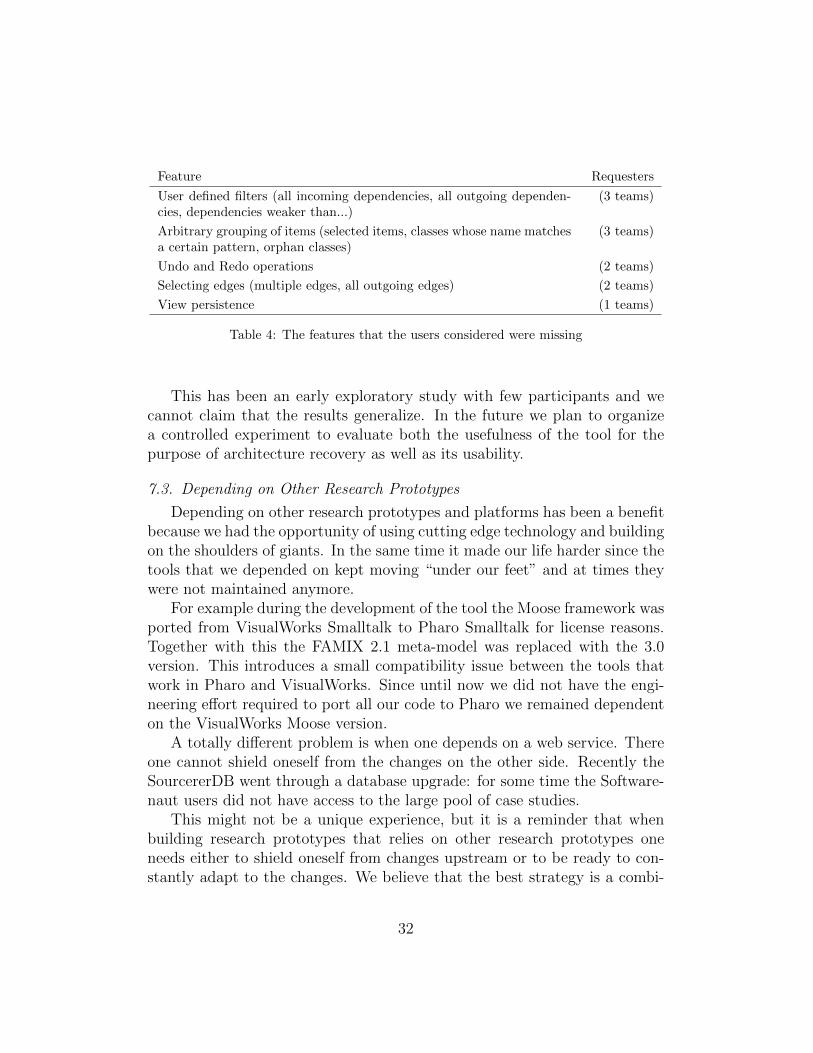
Feature Requesters
User defined filters (all incoming dependencies, all outgoing dependen-cies, dependencies weaker than...)
(3 teams)
Arbitrary grouping of items (selected items, classes whose name matchesa certain pattern, orphan classes)
(3 teams)
Undo and Redo operations (2 teams)
Selecting edges (multiple edges, all outgoing edges) (2 teams)
View persistence (1 teams)
Table 4: The features that the users considered were missing
This has been an early exploratory study with few participants and wecannot claim that the results generalize. In the future we plan to organizea controlled experiment to evaluate both the usefulness of the tool for thepurpose of architecture recovery as well as its usability.
7.3. Depending on Other Research Prototypes
Depending on other research prototypes and platforms has been a benefitbecause we had the opportunity of using cutting edge technology and buildingon the shoulders of giants. In the same time it made our life harder since thetools that we depended on kept moving “under our feet” and at times theywere not maintained anymore.
For example during the development of the tool the Moose framework wasported from VisualWorks Smalltalk to Pharo Smalltalk for license reasons.Together with this the FAMIX 2.1 meta-model was replaced with the 3.0version. This introduces a small compatibility issue between the tools thatwork in Pharo and VisualWorks. Since until now we did not have the engi-neering effort required to port all our code to Pharo we remained dependenton the VisualWorks Moose version.
A totally different problem is when one depends on a web service. Thereone cannot shield oneself from the changes on the other side. Recently theSourcererDB went through a database upgrade: for some time the Software-naut users did not have access to the large pool of case studies.
This might not be a unique experience, but it is a reminder that whenbuilding research prototypes that relies on other research prototypes oneneeds either to shield oneself from changes upstream or to be ready to con-stantly adapt to the changes. We believe that the best strategy is a combi-
32
nation of both and that the benefits of being part of a research ecosystemoutweigh the difficulties.
7.4. Availability and Documentation
Softwarenaut is written in Smalltalk and is released under the open sourceMIT License. The tool runs on Windows, Linux, and OS X and is availableonline at http://scg.unibe.ch/softwarenaut/. The homepage of the tool pro-vides screencasts, documentation, installation instructions, and directions onhow to obtain the source code and to contribute.
The Global Architectural View Repository (GVR) is implemented as aPostgreSQL database which can be publicly accessed by instances of Soft-warenaut or other tools. The online documentation provides more informa-tions about ways of accessing the GVR.
8. Related Work
There is an extended tradition of architecture recovery tools in softwareengineering research. Pollet et al. have presented a comprehensive overviewof the work in architecture recovery in their survey article [3]. In this sectionwe take several of the core aspects of Softwarenaut and we discuss how theyare similar and how they differ from other state of the art tools.
8.1. Exploration and Navigation
The first architectural visualization tool was Rigi, which emphasizes visu-alization and interaction [39]. Rigi visualizes the data as hierarchical typedgraphs and provides a Tcl interpreter for manipulating the graph data. Thereconstruction process is based on a bottom-up process of grouping softwareelements into clusters by manually selecting the nodes and collapsing them.The approach does not scale well when analyzing very large systems . InSoftwarenaut we automatically aggregate low-level relations and let the usernavigate down from the highest abstraction level.
The SHriMP tool [12] and its Eclipse-based continuation Creole [40] dis-play architectural diagrams using nested graphs. Their user interface embedssource code inside the graph nodes and integrates a hypertext metaphorfor following low-level dependencies with animated panning, zooming, andfisheye-view actions for viewing high-level structures. Relo [41] provides anexploration approach in which a users starts with a given artifact and exploresfurther on an as-needed basis. One difference between SHriMP, Creole, Reloand Softwarenaut is that the latter can also perform evolutionary analysis.
33
8.2. Evolutionary Analysis
YARN [42] animates the evolution of dependencies between the modulesof a system. We represent evolution by building complete models of severalsystem versions (just like CodeCity) while YARN uses an evolutionary modeland analyze the information in each commit. The disadvantages of YARN isthat watching an animation can be time-consuming and it does not supportinteractive exploration operations such as filtering.
CodeCity of Wettel [43] visualizes software systems using a city metaphorand also provides visualizations of the evolution of the systems. The mainadvantage of our approach over Wettel’s is the fact that we present relation-ships while he does not.
Pinzger proposed the ArchView approach [44] which provides visualiza-tions that present the evolution of the modules in a system. His evolutionanalysis takes into account the annotations from the versioning system repos-itory. However, there is no support for first-class views in ArchView and thedependencies between the modules are only based on logical coupling.
One of our original contributions is the possibility of filtering informationin the view based on its historical properties. One related study is the oneof Wierda et al. who recover the architectural decomposition of a systemthrough clustering; they observe that if they use for clustering only thosedependencies that were in the system in both the first and the last versions,the decompositions are more precise [45]. This observation supports our ideaof considering the lifetime relationships as more relevant for the architecturethan the newer relationships.
8.3. Collaboration
Shrimp, the tool of Storey et al., also allows for saving and restoringviews [46]. The views are saved inside a “Filmstrip” which is persistent.Through the intermediation of the filmstrips the users can restore explorationsessions or even share certain views. This type of information enables peoplethat know about each other to share information by emailing the files. Theadvantage of the Global View Repository is that it allows information thatother users have discovered to be shared.
Churrasco [47] supports software visualization and analysis and througha web interface. This allows different users to annotate the diagrams andthus allows a dialogue to be formed around the online visualizations. Chur-rasco presents high-level visualizations but it does not provide dependencyinformation which we consider critical for architectural understanding.
34
Proposed by Hattori et al., Replay [48] enables the chronological replayof changes inside the Eclipse IDE and supports awareness of team memberactivity by allowing one to selectively replay the changes of other team mem-bers. The information in Replay is more fine-grained than ours and is neveraggregated to the abstraction level of the architecture.
One project developed with collaboration support as the main goal is theJazz IDE of IBM [49]. Jazz aims at supporting collaboration and awarenessin small informal software development teams during forward engineering.Softwarenaut aims to support collaboration between engineers during pro-gram understanding although recovered architectural views can be used tosupport awareness during forward engineering.
9. Conclusions and Future Work
We presented Softwarenaut, our tool for architecture recovery. Soft-warenaut enables the recovery of architectural views from a software sys-tem through interactive exploration of a hierarchical decomposition of thesystem. It supports the “overview first, zoom and filter, and details on de-mand” principle of information visualization and it provides features that arerequired from architecture recovery tools: rule-based filtering mechanisms,history operations, interactive exploration, and detailed views for modulesand relationships.
Two of the original features of the tool are the capacity of saving andsharing architectural views in a Global Architectural View Repository andthe capacity of analyzing multiple versions of a system in order to providebetter filtering and interaction capabilities. We have illustrated the featuresof the tool and the architecture recovery approach that it supports using asa case-study ArgoUML, a successful open source Java system.
The tool, released under an open-source MIT license, was the test-bedfor a variety of research projects, and is still serving us in our research andconsulting practice.
One of our main future research directions is exploring ways in whichthe recovered views can be integrated in the forward engineering process andfunction as a live documentation of an evolving system. The Softwarenautviews are not simple pictures but instead they encode relationships betweenthe artifacts in the system. A view recovered for a given version of thesystem can function as a reference point for presenting the future evolution ofthe system. Another direction would be overlaying architectural constraints
35
on top of the existing views and then enforcing them during the system’sevolution. Finally we plan to run controlled experiments and user studies toevaluate usefulness and usability.
Acknowledgements. We would like to thank Fabrizio Perin for feedback onearlier drafts of this paper. We would like to thank the anonymous review-ers for their qualitative feedback. We would also like to acknowledge JoelOssher and Crista Lopes from UC Irvine for the collaboration in integrat-ing Softwarenaut with the Sourcerer database. We would also like to thankthe anonymous reviewers for their constructive feedback and patience whilereading the first version of this article and trying out Softwarenaut. Lanzaacknowledges the financial support of the SNF through project SOSYA (SNFProject No. 132175).
References
[1] M. Lehman, Programs, life cycles, and laws of software evolution, Pro-ceedings of the IEEE 68 (Sept. 1980) 1060–1076.
[2] S. Ducasse, D. Pollet, Software architecture reconstruction: A process-oriented taxonomy, IEEE Transactions on Software Engineering 35(2009) 573–591.
[3] D. Pollet, S. Ducasse, L. Poyet, I. Alloui, S. Cımpan, H. Verjus, To-wards a process-oriented software architecture reconstruction taxon-omy, in: R. Krikhaar, C. Verhoef, G. Di Lucca (Eds.), Proceedingsof 11th European Conference on Software Maintenance and Reengineer-ing (CSMR’07), IEEE Computer Society, 2007, pp. 137–148. Best PaperAward.
[4] L. Bass, P. Clements, R. Kazman, Software Architecture in Practice,Addison-Wesley Professional, 1997.
[5] P. Kruchten, The 4+1 view model of architecture, IEEE Softw. 12(1995) 42–50.
[6] C. Hofmeister, R. Nord, D. Soni, Applied Software Architecture,Addison-Wesley, 2000.
[7] D. E. Perry, A. L. Wolf, Foundations for the study of software architec-ture, SIGSOFT Softw. Eng. Notes 17 (1992) 40–52.
36
[8] D. Garlan, R. Allen, J. Ockerbloom, Architectural mismatch: Whyreuse is still so hard, IEEE Softw. 26 (2009) 66–69.
[9] M. Jazayeri, On architectural stability and evolution, in: ReliableSoftware Technlogies-Ada-Europe 2002., Springer, 2002, pp. 304–315.
[10] G. Murphy, D. Notkin, K. Sullivan, Software reflexion models: Bridg-ing the gap between source and high-level models, in: Proceedings ofSIGSOFT ’95, Third ACM SIGSOFT Symposium on the Foundationsof Software Engineering, ACM Press, 1995, pp. 18–28.
[11] H. Muller, K. Klashinsky, Rigi: a system for programming-in-the-large,Software Engineering, 1988., Proceedings of the 10th International Con-ference on (1988) 80–86.
[12] M.-A. D. Storey, H. A. Muller, Manipulating and documenting softwarestructures using SHriMP Views, in: Proceedings of ICSM ’95 (Interna-tional Conference on Software Maintenance), IEEE Computer SocietyPress, 1995, pp. 275–284.
[13] B. Shneiderman, The eyes have it: A task by data type taxonomy forinformation visualizations, in: IEEE Visual Languages, College Park,Maryland 20742, U.S.A., pp. 336–343.
[14] K. Gallagher, A. Hatch, M. Munro, Software architecture visualization:An evaluation framework and its application, IEEE Transactions onSoftware Engineering 34 (2008) 260–270.
[15] A. L. Buchsbaum, J. R. Westbrook, Maintaining hierarchical graphviews, in: Proceedings of the eleventh annual ACM-SIAM symposiumon Discrete algorithms, SODA ’00, Society for Industrial and AppliedMathematics, Philadelphia, PA, USA, 2000, pp. 566–575.
[16] M. Lanza, S. Ducasse, Polymetric views - a lightweight visual approachto reverse engineering, Software Engineering, IEEE Transactions on 29(2003) 782–795.
[17] K. Wong, The reverse engineering notebook, Ph.D. thesis, University ofVictoria, Victoria, B.C., Canada, Canada, 2000.
37
[18] M.-A. D. Storey, D. Cubranic, D. M. German, On the use of visualizationto support awareness of human activities in software development: asurvey and a framework, in: SoftVis ’05: Proceedings of the 2005 ACMsymposium on Software visualization, ACM, New York, NY, USA, 2005,pp. 193–202.
[19] I. S. 1471-2000, IEEE Std 1471-2000. IEEE recommended practice forarchitectural description of software-intensive systems., IEEE Architec-ture Working Group, 2000.
[20] G. G. Robertson, J. D. Mackinlay, S. K. Card, Cone trees: animated 3dvisualizations of hierarchical information, in: CHI ’91: Proceedings ofthe SIGCHI conference on Human factors in computing systems, ACMPress, New York, NY, USA, 1991, pp. 189–194.
[21] B. S. Mitchell, S. Mancoridis, On the automatic modularization of soft-ware systems using the bunch tool, IEEE Trans. Softw. Eng. 32 (2006)193–208.
[22] I. Aracic, T. Schaeffer, M. Mezini, K. Osterman, A Survey on Inter-active Grouping and Filtering in Graph-based Software Visualizations,Technical Report, Technische Universitat Darmstadt, 2007.
[23] M. Lungu, M. Lanza, Exploring inter-module relationships in evolvingsoftware systems, in: Proceedings of CSMR 2007 (11th European Con-ference on Software Maintenance and Reengineering), IEEE ComputerSociety Press, Los Alamitos CA, 2007, pp. 91–100.
[24] M. Lungu, M. Lanza, Softwarenaut: cutting edge visualization, in:SoftVis ’06: Proceedings of the 2006 ACM symposium on Software vi-sualization, ACM, New York, NY, USA, 2006, pp. 179–180.
[25] T. Gırba, Modeling History to Understand Software Evolution, Ph.D.thesis, University of Berne, Berne, 2005.
[26] G. Antoniol, M. Di Penta, E. Merlo, An automatic approach to identifyclass evolution discontinuities, in: IWPSE ’04: Proceedings of the Prin-ciples of Software Evolution, 7th International Workshop, IEEE Com-puter Society, Washington, DC, USA, 2004, pp. 31–40.
38
[27] S. Tichelaar, Modeling Object-Oriented Software for Reverse Engineer-ing and Refactoring, Ph.D. thesis, University of Bern, 2001.
[28] P. F. Mihancea, G. Ganea, I. Verebi, C. Marinescu, R. Marinescu, Mccand mc#: Unified c++ and c# design facts extractors tools, Sym-bolic and Numeric Algorithms for Scientific Computing, InternationalSymposium on 0 (2007) 101–104.
[29] R. Koschke, Atomic architectural component recovery for program un-derstanding and evolution, Software Maintenance, 2002. Proceedings.International Conference on (2002) 478–481.
[30] M. Lungu, A. Kuhn, T. Gırba, M. Lanza, Interactive exploration of se-mantic clusters, in: 3rd International Workshop on Visualizing Softwarefor Understanding and Analysis (VISSOFT 2005), pp. 95–100.
[31] O. Nierstrasz, S. Ducasse, T. Girba, The story of moose: an agilereengineering environment, SIGSOFT Soft.Eng. Notes 30 (2005) 1–10.
[32] M. Lungu, M. Lanza, T. Gırba, R. Robbes, The small project observa-tory: Visualizing software ecosystems, EST special issue of the Scienceof Computer Programming (2009).
[33] M. Lungu, Reverse Engineering Software Ecosystems, Ph.D. thesis, Uni-versity of Lugano, 2009.
[34] E. Linstead, S. Bajracharya, T. Ngo, P. Rigor, C. Lopes, P. Baldi,Sourcerer: mining and searching internet-scale software reposito-ries, Data Mining and Knowledge Discovery 18 (2009) 300–336.10.1007/s10618-008-0118-x.
[35] M. Lungu, A. Kuhn, T. Gırba, M. Lanza, Interactive exploration of se-mantic clusters, in: 3rd International Workshop on Visualizing Softwarefor Understanding and Analysis (VISSOFT 2005), pp. 95–100.
[36] M. Lungu, M. Lanza, T. Girba, R. Robbes, The small project observa-tory: Visualizing software ecosystems, Science of Computer Program-ming, Elsevier 75 (2010) 264–275.
[37] A. Boeckmann, MARS - Modular Architecture Recommendation Sys-tem, Bachelor’s thesis, University of Lugano, 2010.
39
[38] M. Lungu, M. Lanza, T. Gırba, Package patterns for visual architecturerecovery, in: Proceedings of CSMR 2006 (10th European Conferenceon Software Maintenance and Reengineering), IEEE Computer SocietyPress, Los Alamitos CA, 2006, pp. 185–196.
[39] H. A. Muller, S. R. Tilley, M. A. Orgun, B. D. Corrie, N. H. Madhavji,A reverse engineering environment based on spatial and visual softwareinterconnection models, in: SDE 5: Proceedings of the fifth ACM SIG-SOFT symposium on Software development environments, ACM, NewYork, NY, USA, 1992, pp. 88–98.
[40] R. Lintern, J. Michaud, M.-A. Storey, X. Wu, Plugging-in visualization:experiences integrating a visualization tool with eclipse, in: SoftVis ’03:Proceedings of the 2003 ACM symposium on Software visualization,ACM, New York, NY, USA, 2003, pp. 47–ff.
[41] V. Sinha, D. Karger, R. Miller, Relo: Helping users manage contextduring interactive exploratory visualization of large codebases, VisualLanguages and Human-Centric Computing, 2006. VL/HCC 2006. IEEESymposium on (2006) 187–194.
[42] A. Hindle, Z. M. Jiang, W. Koleilat, M. W. Godfrey, R. C. Holt, Yarn:Animating software evolution, Visualizing Software for Understandingand Analysis, International Workshop on 0 (2007) 129–136.
[43] R. Wettel, M. Lanza, R. Robbes, Software systems as cities: a controlledexperiment, in: Proceeding of the 33rd international conference onSoftware engineering, ICSE ’11, ACM, New York, NY, USA, 2011, pp.551–560.
[44] M. Pinzger, ArchView - Analyzing Evolutionary Aspects of ComplexSoftware Systems, Ph.D. thesis, Vienna University of Technology, 2005.
[45] A. Wierda, E. Dortmans, L. Lou Somers, Using version informationin architectural clustering - a case study, in: CSMR ’06: Proceedingsof the Conference on Software Maintenance and Reengineering, IEEEComputer Society, Washington, DC, USA, 2006, pp. 214–228.
[46] D. Rayside, M. Litoiu, M.-A. Storey, C. Best, R. Lintern, Visualizingflow diagrams in websphere studio using shrimp views, InformationSystems Frontiers 5 (2003) 161–174. 10.1023/A:1022649506310.
40
[47] M. D’Ambros, M. Lanza, A flexible framework to support collaborativesoftware evolution analysis, in: Proceedings of CSMR 2008 (12th Eu-ropean Conference on Software Maintenance and Reengineering), IEEEComputer Society, 2008, pp. 3–12.
[48] L. Hattori, M. D’Ambros, M. Lanza, M. Lungu, Software evolutioncomprehension: Replay to the rescue, in: Proceedings of The 19th IEEEInternational Conference on Program Comprehension, pp. 161–170.
[49] S. Hupfer, L.-T. Cheng, S. Ross, J. Patterson, Introducing collaborationinto an application development environment, in: Proceedings of the2004 ACM conference on Computer supported cooperative work, CSCW’04, ACM, New York, NY, USA, 2004, pp. 21–24.
41