evolving magma storage conditions beneath mount … · first formed (blundy and others, 2006). melt...
TRANSCRIPT
A Volcano Rekindled: The Renewed Eruption of Mount St. Helens, 2004–2006Edited by David R. Sherrod, William E. Scott, and Peter H. StaufferU.S. Geological Survey Professional Paper 1750, 2008
Chapter 33
1 Department of Earth Sciences, University of Bristol, Wills Memorial Building, Bristol BS8 1RJ, United Kingdom
2 Department of Geological Sciences, 1272 University of Oregon, Eugene, OR 97403
3 Department of Earth Sciences, Wills Memorial Building, Bristol BS8 1RJ, UK; now at Earth & Planetary Sciences, McGill University, 3450 University St., Montreal, Quebec, Canada H3A 2A7
Evolving Magma Storage Conditions Beneath Mount St. Helens Inferred from Chemical Variations in Melt Inclusions from the 1980–1986 and Current (2004–2006) Eruptions
By Jon Blundy1, Katharine V. Cashman2, and Kim Berlo3
AbstractMajor element, trace element, and volatile concentra-
tions in 187 glassy melt inclusions and 25 groundmass glasses from the 1980–86 eruption of Mount St. Helens are presented, together with 103 analyses of touching Fe-Ti oxide pairs from the same samples. These data are used to evaluate the temporal evolution of the magmatic plumbing system beneath the volcano during 1980–86 and so provide a framework in which to interpret analyses of melt inclusions from the current (2004–2006) eruption.
Major and trace element concentrations of all melt inclu-sions lie at the high-SiO2 end of the data array defined by erup-tive products of late Quaternary age from Mount St. Helens. For several major and trace elements, the glasses define a trend that is oblique to the whole-rock trend, indicating that different mineral assemblages were responsible for the two trends. The whole-rock trend can be ascribed to differentiation of hydrous basaltic parents in a deep-seated magma reservoir, probably at depths great enough to stabilize garnet. In contrast, the glass trends were generated by closed-system crystallization of the phenocryst and microlite mineral assemblages at low pressures.
The dissolved H2O content of the melt inclusions from 1980–86, as measured by ion microprobe, ranges from 0 to 6.7 wt. percent, with the highest values obtained from the plinian phase of May 18, 1980. Water contents decrease with increas-ing SiO2, consistent with decompression-driven crystallization.
Preliminary data for dissolved CO2 in melt inclusions from the May 18 plinian phase and from August 7, 1980, indicate that XH2O in the vapor phase was approximately constant at 0.80, irrespective of H2O content, suggestive of closed-system degassing with a high bubble fraction or gas streaming through the subvolcanic system. Temperature and fO2
estimates for touching Fe-Ti oxides show evidence for heating during crystallization owing to release of latent heat. Consequently, magmas with the highest microlite crystallinities record the highest temperatures. Magmas also become progressively reduced during ascent and degassing, probably as a result of redox equilibria between exsolving S-bearing gases and mag-mas. The lowest temperature oxides have fO2
≈ NNO, similar to high-temperature fumarole gases from the volcano. The temperature and fO2
of the magma tapped by the plinian phase of May 18, 1980, are 870–875°C and NNO+0.8, respectively.
The dissolved volatile contents of the melt inclusions have been used to calculate sealing pressures; that is, the pressure at which chemical exchange between inclusion and matrix melt ceased. These are greatest for the May 18 plinian magma (120 to 320 MPa); lower pressures are recorded by samples of the preplinian cryptodome and by all post-May 18 magmas. Magma crystallinity, calculated from melt-inclusion Rb contents, is negatively correlated with sealing pressure, consistent with decompression crystallization. Elevated contents of Li in melt inclusions from the cryptodome and post-May 18 samples are consistent with transfer of Li in a magmatic vapor phase from deeper parts of the magma sys-tem to magma stored at shallower levels. The Li enrichment attains its maximum extent at ~150 MPa, which is ascribed to separation of a single vapor phase into H2O-rich gas and dense Li-rich brine at the top of the magma column.
There are striking correlations between melt-inclusion chemistry and monitoring data for the 1980–86 eruption. Dis-solved SO2 contents of melt inclusions from any given event, multiplied by the mass of magma erupted during that event,
756 A Volcano Rekindled: The Renewed Eruption of Mount St. Helens, 2004−2006
correlate with the measured flux of SO2 at the surface, sug-gesting that magma degassing and melt-inclusion sealing are closely related in time and space.
Textural and chemical evidence indicates that melt inclu-sions became effectively sealed (physically or kinetically) shortly before eruption. Thus by converting pressure to depth using a density model and edifice-loading algorithm for the volcano, changing depths of magma extraction with time can be tracked and compared to the seismic record. The plinian eruption of May 18, 1980, involved magma stored 5–11 km below sea level; this is inferred to be the subvolcanic magma chamber. The preceding eruptions, including the May 18, 1980, blast, involved magma withdrawal from the cryptodome and conduit down to 5 km below sea level. Subsequent 1980 eruptions tapped magma down to depths of ≤10 km below sea level. Tapping of magma stored deeper than 2 km below sea level stopped abruptly at the end of 1980, coincident with the onset of extensive shallow seismicity and a change from explosive to effusive eruption style from 1981 to 1986. Overall, the 1980–86 eruption is consistent with the eviscera-tion of a thin, vertically extensive body of magma extending from 5 to at least 11 km below sea level and connected to the surface by a thin conduit. In the absence of sustained high magma-supply rates from depth, decompression crystalliza-tion of magma ascending through the system leads eventually to plugging of the conduit.
The current eruption of Mount St. Helens shares some similarities with the 1981–86 dome-building phase of the previous eruption, in that there is extensive shallow seismicity and extrusion of highly crystalline material in the form of a sequence of flows and spines. Melt inclusions from the cur-rent eruption have low H2O contents, consistent with magma extraction from shallow depths. Highly enriched Li in melt inclusions suggests that vapor transport of Li is a characteristic feature of Mount St. Helens. Melt inclusions from the current eruption have subtly different trace-element chemistry from all but one of the 1980–86 melt inclusions, with steeper rare-earth-element (REE) patterns and low U, Th, and high-field-strength elements (HFSE), indicating addition of a new melt component to the magma system. It is anticipated that increas-ing involvement of the new melt component will be evident as the current eruption proceeds.
IntroductionQuenched melt inclusions in phenocrysts from volcanic
rocks can provide information on preeruptive conditions within the subvolcanic magma body. Concentrations of H2O and other volatile species can be used to infer preeruptive storage depths, whereas concentrations of major and trace elements can be used to elucidate the arrival of new magma batches and, in the case of highly incompatible elements, the crystallinity of the magma at the time of inclusion entrapment. Of particular value are plagioclase-hosted melt inclusions, because of their
ubiquity in calc-alkaline magmatic rocks and because of their ability to record a wide range of magmatic conditions through partial reequilibration with the matrix melt during magma ascent and crystallization (Blundy and Cashman, 2005). By allying melt inclusion data to determinations of temperature and oxygen fugacity (fO2
) from coexisting iron-titanium oxides, it is possible to provide a detailed image of evolving subvol-canic magmatic conditions, which can in turn be linked to monitoring data such as volatile flux and seismicity.
We have previously published data on H2O and major elements in melt inclusions from the 1980–86 eruption of Mount St. Helens. Here we augment the published dataset with additional data, including previously unpublished trace-element data. The total dataset for the 1980–86 eruption now comprises 212 glasses, including 172 melt inclusions hosted in plagioclase, 8 in amphibole, 4 in orthopyroxene, 3 in clinopy-roxene, and 25 groundmass glasses. Major elements, H2O, and light trace elements (Li-Ti) have been determined for all of these glasses; heavy trace elements (Ti-U) have been deter-mined for 74 of them. A preliminary study of dissolved CO2 was carried out on two samples from the May 18 and August 7, 1980, eruptive episodes. In order to compare the conditions of magma storage during the 1980–86 eruption with those of the current (2004–2006) eruption, we have analyzed 11 melt inclusions in three samples from the current eruption for the same suite of elements. We also present new data on touching Fe-Ti oxide pairs for 14 samples spanning the entire 1980–86 eruption, for comparison with data from the new eruption (Pal-lister and others, this volume, chap. 30).
Materials and MethodsA full list and brief description of the 32 samples ana-
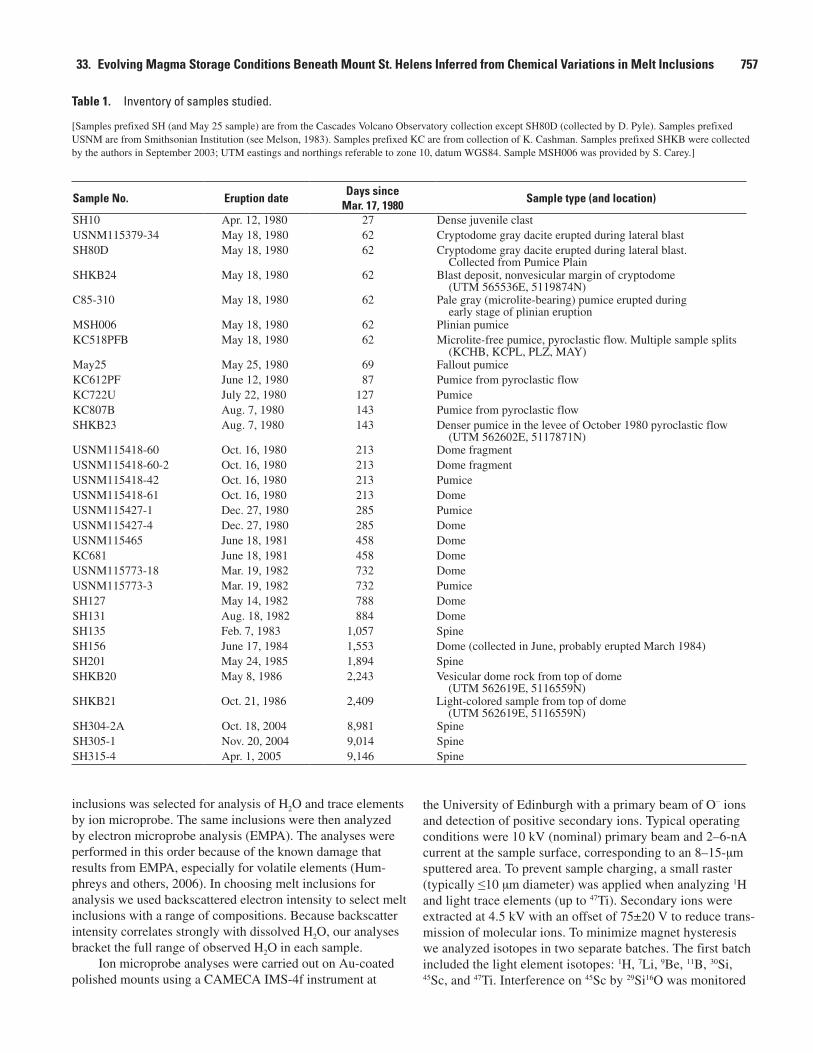
lyzed, together with their origin and any previous publica-tions that describe them, are presented in table 1. Most of the samples were prepared as grain mounts of plagioclase and mafic minerals; in some cases thin sections were also used.
Melt inclusions are widespread in plagioclase phenocrysts from all samples studied. Most inclusions are glassy without evidence of daughter crystals. About 20 percent of all inclusions analyzed contain small vapor bubbles exposed at the surface of the thin section or grain mount. Thin rims or embayments of plagioclase around the walls of most plagioclase-hosted inclusions testify to some crystallization after the inclusion was first formed (Blundy and others, 2006). Melt inclusions are less common in mafic phenocrysts (amphibole, clinopyroxene, orthopyroxene). These inclusions typically lack clear evidence of host-crystal precipitation on their walls. Some of the 1980–86 samples with relatively low (or zero) microlite abundance also have matrix glass pools large enough for analysis. It was not possible to find any large matrix glass pools in samples from the current eruption.
After initially examining each sample for melt inclusions using a scanning electron microscope (SEM), a subset of the
33. Evolving Magma Storage Conditions Beneath Mount St. Helens Inferred from Chemical Variations in Melt Inclusions 757
Sample No. Eruption dateDays since
Mar. 17, 1980Sample type (and location)
SH10 Apr. 12, 1980 27 Dense juvenile clastUSNM115379-34 May 18, 1980 62 Cryptodome gray dacite erupted during lateral blast SH80D May 18, 1980 62 Cryptodome gray dacite erupted during lateral blast.
Collected from Pumice PlainSHKB24 May 18, 1980 62 Blast deposit, nonvesicular margin of cryptodome
(UTM 565536E, 5119874N)C85-310 May 18, 1980 62 Pale gray (microlite-bearing) pumice erupted during
early stage of plinian eruptionMSH006 May 18, 1980 62 Plinian pumiceKC518PFB May 18, 1980 62 Microlite-free pumice, pyroclastic flow. Multiple sample splits
(KCHB, KCPL, PLZ, MAY)May25 May 25, 1980 69 Fallout pumiceKC612PF June 12, 1980 87 Pumice from pyroclastic flowKC722U July 22, 1980 127 PumiceKC807B Aug. 7, 1980 143 Pumice from pyroclastic flowSHKB23 Aug. 7, 1980 143 Denser pumice in the levee of October 1980 pyroclastic flow
(UTM 562602E, 5117871N)USNM115418-60 Oct. 16, 1980 213 Dome fragmentUSNM115418-60-2 Oct. 16, 1980 213 Dome fragmentUSNM115418-42 Oct. 16, 1980 213 PumiceUSNM115418-61 Oct. 16, 1980 213 DomeUSNM115427-1 Dec. 27, 1980 285 PumiceUSNM115427-4 Dec. 27, 1980 285 DomeUSNM115465 June 18, 1981 458 DomeKC681 June 18, 1981 458 DomeUSNM115773-18 Mar. 19, 1982 732 DomeUSNM115773-3 Mar. 19, 1982 732 PumiceSH127 May 14, 1982 788 DomeSH131 Aug. 18, 1982 884 DomeSH135 Feb. 7, 1983 1,057 SpineSH156 June 17, 1984 1,553 Dome (collected in June, probably erupted March 1984)SH201 May 24, 1985 1,894 SpineSHKB20 May 8, 1986 2,243 Vesicular dome rock from top of dome
(UTM 562619E, 5116559N)SHKB21 Oct. 21, 1986 2,409 Light-colored sample from top of dome
(UTM 562619E, 5116559N)SH304-2A Oct. 18, 2004 8,981 SpineSH305-1 Nov. 20, 2004 9,014 SpineSH315-4 Apr. 1, 2005 9,146 Spine
Table 1. Inventory of samples studied.
[Samples prefixed SH (and May 25 sample) are from the Cascades Volcano Observatory collection except SH80D (collected by D. Pyle). Samples prefixed USNM are from Smithsonian Institution (see Melson, 1983). Samples prefixed KC are from collection of K. Cashman. Samples prefixed SHKB were collected by the authors in September 2003; UTM eastings and northings referable to zone 10, datum WGS84. Sample MSH006 was provided by S. Carey.]
inclusions was selected for analysis of H2O and trace elements by ion microprobe. The same inclusions were then analyzed by electron microprobe analysis (EMPA). The analyses were performed in this order because of the known damage that results from EMPA, especially for volatile elements (Hum-phreys and others, 2006). In choosing melt inclusions for analysis we used backscattered electron intensity to select melt inclusions with a range of compositions. Because backscatter intensity correlates strongly with dissolved H2O, our analyses bracket the full range of observed H2O in each sample.
Ion microprobe analyses were carried out on Au-coated polished mounts using a CAMECA IMS-4f instrument at
the University of Edinburgh with a primary beam of O− ions and detection of positive secondary ions. Typical operating conditions were 10 kV (nominal) primary beam and 2–6-nA current at the sample surface, corresponding to an 8–15-µm sputtered area. To prevent sample charging, a small raster (typically ≤10 µm diameter) was applied when analyzing 1H and light trace elements (up to 47Ti). Secondary ions were extracted at 4.5 kV with an offset of 75±20 V to reduce trans-mission of molecular ions. To minimize magnet hysteresis we analyzed isotopes in two separate batches. The first batch included the light element isotopes: 1H, 7Li, 9Be, 11B, 30Si, 45Sc, and 47Ti. Interference on 45Sc by 29Si16O was monitored
758 A Volcano Rekindled: The Renewed Eruption of Mount St. Helens, 2004−2006
using 42Ca and 44Ca and then subtracted by peak-stripping. The second batch of isotopes, measured on a subset of melt inclusions, included the heavier isotopes: 30Si, 47Ti, 85Rb, 88Sr, 89Y, 90Zr, 93Nb, 133Cs, 138Ba, 139La, 140Ce, 141Pr, 143Nd, 149Sm, 157Gd, 159Tb, 161Dy, 165Ho, 171Yb, 178Hf, 181Ta, 232Th, and 238U. Background was monitored at mass 130.5 and found to be consistently <0.01 counts per second.
Interferences of light rare-earth-element (REE) oxide ions on heavy REE, Ta, and Hf were removed by peak-stripping using the oxide/ion ratios of Hinton (1990). The efficacy of the peak-stripping procedure was monitored by analyzing two iso-topes of Gd (156 and 157) to check for consistency. The high Ba content of all glasses and the large interference of BaO on both Eu isotopes (BaO/Ba ≈ 0.05) means that Eu cannot be precisely determined. The largest oxide corrections are those involving Ce (CeO/Ce ≈ 0.21), which imparts an uncertainty of ±20 percent (relative) on peak-stripped Gd count rates. Count times varied from isotope to isotope, according to abundance in the glass, but were always sufficient to generate a minimum of 100 counts over the analysis period. For both batches of isotopes, 30Si was used as an internal standard, and values were corrected for their SiO2 content using the sub-sequent analysis of each inclusion by EMPA. Trace element calibration was carried out using NIST SRM610 multielement glass. Analyses of natural-glass secondary standards reveal that accuracy is within ±15 percent relative for all elements. This indicates that differences in ion yield between SRM610 and natural silica-rich glasses are small. There is evidence that some of these small ion yield differences are systematic, but we have not corrected for this effect, which would make only a small difference to the data presented.
Water was measured using 1H and a working curve of 1H/30Si versus H2O based on analysis of 5–12 hydrous andes-ite, dacite, and rhyolite glasses of known H2O content (0.09–5.8 wt. percent). A working curve was generated on each day of analysis. There are small variations in 1H ion yield between different sessions, but the working curves are consistently linear with correlation coefficients in excess of 0.99. We used 1H/30Si for calibration, rather than 1H/30Si×SiO2, because of the systematic variation in 1H ion yield with matrix SiO2 content (Blundy and Cashman, 2005). Our working curves can be used for glasses ranging in composition from basalt to rhyolite, although all of the glasses analyzed in this study are rhyolitic. In a typical analysis of 15 cycles across the mass range, only the final 10 cycles were averaged owing to the presence of a small amount of signal instability at the onset of the analysis. This routine corresponds to a presputter period of a few minutes for 1H analysis. No such effect is observed for other light isotopes, for which all 15 cycles were included in the averaging.
Electron microprobe analysis for major elements plus total S (expressed as equivalent SO2), F, and Cl, was carried out on a CAMECA SX100 five-spectrometer WDS instru-ment, using a range of minerals, oxides, and metals for calibration. Operating conditions (2-nA beam current, 15-µm diameter spot) were those shown by Humphreys and others
(2006) to minimize the loss of alkalis (especially Na) during analysis. This analytical protocol reproduces the measured H2O content (as estimated from the analytical total) of hydrous glass standards to within 0.4 weight percent average absolute deviation. A few of the major element analyses, obtained early in the study, were analyzed on a JEOL-733 four-spectrometer instrument using slightly higher beam currents (Blundy and Cashman, 2005). These analyses did show some Na loss, as measured by ion microprobe analysis of 23Na. For these analyses we have used the ion microprobe value of Na2O in preference to the EMPA value.
After performing both ion microprobe analysis and EMPA, the data were screened for quality according to the following criteria: the analytical total, including H2O, must lie between 98.5 and 100.5 percent; Ti contents measured by EMPA and ion microprobe (heavy and light element routine) for a single inclusion must be within 15 percent relative; and the ion microprobe spot, as examined by SEM, must not have any contact with the host mineral. Analyses that failed one or more of these tests were discarded. Representative analyses are presented in tables 2 and 3, and the full dataset of accepted analyses can be found in appendix 1 (included in the digital version of this paper).
Touching Fe-Ti oxide pairs were analyzed by EMPA in thin sections of selected 1980–86 samples using a Cameca SX100 with 20-nA beam current and a focused spot. We used only touching pairs because of the known rapid reequilibration of Fe-Ti oxides to changes in temperature and fO2
(for example, Venezky and Rutherford, 1999). By selecting only oxides in direct contact it is possible to get the closest approximation to equilibrium compositions. This approach is used in prefer-ence to the conventional practice of averaging large numbers of separate ilmenite and magnetite analyses. We screened each magnetite-ilmenite pair for Mg-Mn exchange equilibrium using the method of Bacon and Hirschmann (1988) and then calculated T–fO2 using the recalculation procedure of Spencer and Lindsley (1981) and the thermometer of Andersen and Lindsley (1988) (table 4; see digital appendix 2 for geochemi-cal analyses of oxide minerals).
Major Element SystematicsMelt inclusions from the 1980–86 eruption are rhyolites
with 68–79 percent SiO2 (on an anhydrous basis). Matrix glasses span the same range. Melt inclusions from the current eruption extend the range in SiO2 to 80 percent. As previously shown by Blundy and Cashman (2001), the high SiO2 of the glasses requires crystallization at low pressures because of the increase in SiO2 solubility with decreasing pressure. It is there-fore likely that the major element variation in melt inclusions records crystallization of magma within the magma chamber and conduit.
In figure 1 we compare the major-element chemistry of melt inclusions and matrix glasses to whole-rock data from the
33. Evolving Magm
a Storage Conditions Beneath Mount St. Helens Inferred from
Chemical Variations in M
elt Inclusions
759
Sample No.Analyzed
pointHost Na2O Al2O3 SiO2 MgO K2O CaO TiO2 FeO MnO P2O5 Cl F SO2 H2O s.d. Total pH
2O
1980–86 eruption
sh10 s4-1 P 4.07 11.27 75.12 0.83 2.74 0.66 0.52 3.16 0.04 0.12 0.13 0.10 0.00 0.99 0.04 99.72 8.8USNM115379-34 11A* O 5.86 14.65 71.15 0.35 2.45 2.21 0.29 2.27 0.26 -- -- -- -- 1.83 0.02 101.31 28.2USNM115379-34 2A* P 6.18 13.63 69.48 0.54 2.25 1.80 0.23 2.00 0.13 0.31 -- -- -- 3.76 0.05 100.31 101.3USNM115379-34 3B P 4.56 12.27 72.57 0.70 2.70 1.07 0.38 2.65 0.05 0.10 0.14 0.04 0.05 2.12 0.03 99.40 37.0USNM115379-34 6A* P 5.47 11.78 73.58 0.81 2.76 0.91 0.34 3.15 0.03 -- -- -- -- 2.21 0.03 101.02 39.9SH80D 2A P 4.34 11.17 73.66 0.77 3.45 0.81 0.40 2.52 0.10 0.15 0.15 0.01 0.02 1.95 0.03 99.50 31.7SH80D 8A P 4.42 11.15 75.26 0.30 3.41 0.68 0.52 1.69 0.06 0.11 0.16 0.10 0.00 1.28 0.02 99.15 14.4C85-310 pl3-3 P 4.30 11.41 75.49 0.53 2.61 0.70 0.38 2.32 0.03 0.03 0.16 0.03 0.01 1.91 0.09 99.87 30.5MSH006 gm1* gm 5.93 14.20 71.96 0.49 2.17 2.14 0.32 2.13 -- -- -- -- -- 1.58 0.02 100.93 21.4MSH006 9A* P 5.75 13.74 65.91 0.71 2.15 2.27 0.33 2.03 -- 0.76 -- -- -- 5.92 0.10 99.57 208.1MSH006 10A* P 5.49 13.31 64.91 0.71 1.99 1.95 0.41 2.78 0.02 0.33 -- -- -- 6.38 0.11 98.27 231.5KC518PFB 518b-4-1 P 3.92 14.50 67.94 0.47 1.97 2.54 0.34 1.75 0.01 0.09 0.14 0.06 0.01 5.14 0.09 98.90 168.3KC518PFB(KCHB) 7A A 5.54 14.07 69.01 0.36 1.85 2.25 0.37 2.19 0.02 0.00 0.11 0.00 0.15 3.19 0.06 99.09 76.8KC518PFB(KCHB) 11A* A 5.65 15.03 65.81 0.37 2.44 2.35 0.51 2.13 0.00 -- -- -- -- 4.92 0.21 99.20 156.9KC518PFB(KCHB) GM3* gm 6.28 14.87 71.10 0.51 1.66 2.62 0.35 2.06 0.16 -- -- -- -- 1.17 0.02 100.78 12.1KC518PFB(KCPL) 13A* P 5.76 12.71 69.58 0.26 2.10 1.59 -- 1.01 0.00 0.18 -- -- -- 4.79 0.09 97.99 150.6KC518PFB(MAY) 6-2 P 4.89 17.04 63.99 0.35 1.58 4.15 0.24 1.49 0.00 0.30 0.10 0.07 0.00 6.40 0.89 100.60 232.7KC518PFB(MAY) 02-1 P 4.40 13.88 65.35 0.48 2.01 2.00 0.38 2.17 0.05 0.10 0.14 0.00 0.02 6.70 0.21 97.67 248.0KC518PFB(PLZ) gm3* gm 5.96 15.26 69.44 0.45 1.99 2.29 0.36 2.27 0.00 -- -- -- -- 2.22 0.03 100.24 40.1KC518PFB(PLZ) 33A2* P 6.36 12.84 68.48 0.63 1.89 1.74 0.37 2.18 0.06 0.16 -- -- -- 4.60 0.08 99.31 141.4KC518PFB(PLZ) plz-51-1 P 3.82 14.56 67.65 0.64 1.65 2.36 0.36 2.12 0.09 0.03 0.10 0.36 0.02 4.92 0.09 98.68 157.2May25 PL6-1 P 4.82 13.16 69.97 0.48 2.23 1.52 0.38 2.11 0.02 0.05 0.14 0.12 0.01 4.95 0.45 99.93 158.5KC612PF 14-2 P 5.57 12.61 70.58 0.51 2.45 1.27 0.35 2.37 0.00 0.27 0.14 0.05 0.00 3.92 0.10 100.08 109.0KC612PF 14-GM tube 5.17 11.90 73.07 0.53 2.54 1.08 0.56 2.19 0.06 0.22 0.12 0.02 0.02 2.48 0.06 99.94 49.1KC722U 1-GM* gm 4.62 12.04 77.02 0.20 2.85 0.90 0.45 1.58 -- -- -- -- -- 0.25 0.01 99.90 0.6KC722U 12-1 P 5.08 12.61 71.74 0.28 2.33 1.22 0.37 1.85 0.04 0.12 0.17 0.08 0.09 4.26 0.11 100.23 124.7KC807B 807b-9-1 O 4.75 12.82 73.89 0.18 2.57 1.29 0.38 2.22 0.06 0.00 0.15 0.10 0.02 1.09 0.02 99.51 10.5KC807B 807b-9-2 P 3.42 12.92 70.94 0.67 2.28 1.43 0.39 2.52 0.02 0.08 0.16 0.12 0.01 4.21 0.07 99.16 122.4KC807B 15-1 P 5.04 12.98 72.13 0.55 2.26 1.42 0.37 2.15 0.00 0.07 0.12 0.10 0.05 3.95 0.14 101.20 110.4KC807B 11-1 P 5.71 12.99 71.79 0.30 2.23 1.32 0.19 1.29 0.01 0.00 0.11 0.02 0.08 4.17 0.15 100.21 120.7KC807B 17GM tube 4.52 11.65 75.88 0.17 2.85 0.72 0.56 1.65 0.05 0.05 0.18 0.11 0.00 1.35 0.05 99.72 16.0USNM115418-42 c1-gm gm 4.56 11.03 77.69 0.11 2.90 0.53 0.36 1.59 0.19 0.11 0.21 0.00 0.01 0.93 0.02 100.22 7.8
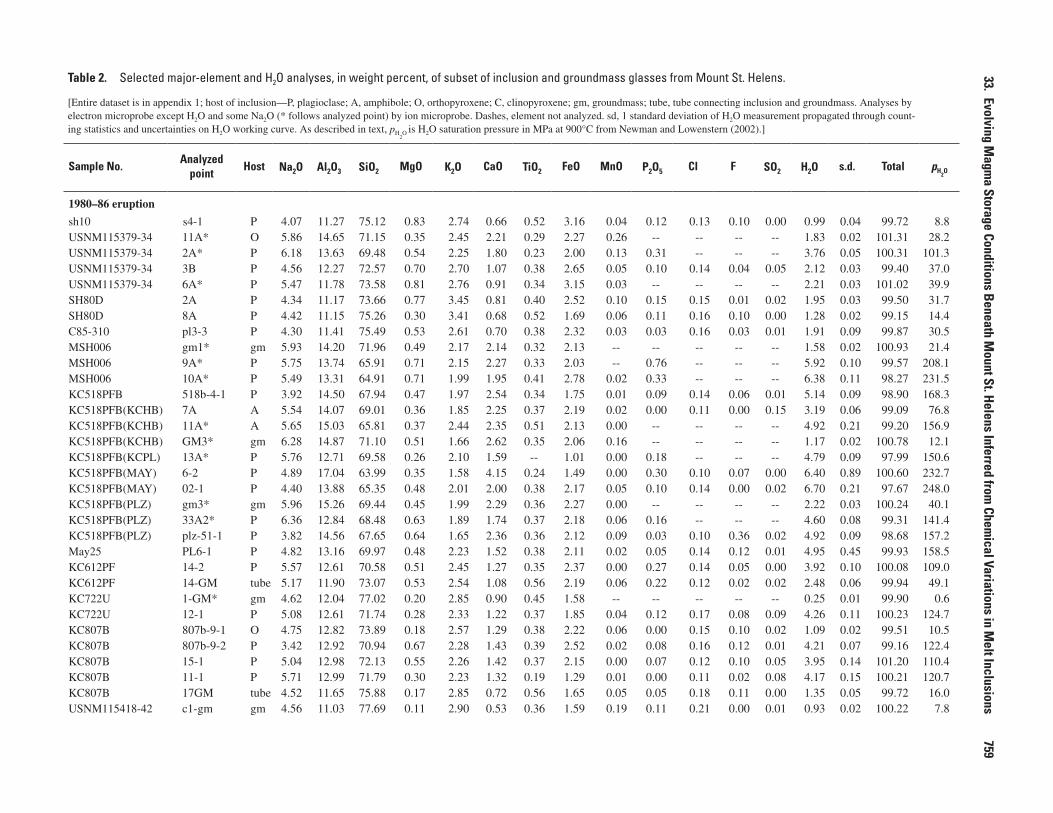
Table 2. Selected major-element and H2O analyses, in weight percent, of subset of inclusion and groundmass glasses from Mount St. Helens.
[Entire dataset is in appendix 1; host of inclusion—P, plagioclase; A, amphibole; O, orthopyroxene; C, clinopyroxene; gm, groundmass; tube, tube connecting inclusion and groundmass. Analyses by electron microprobe except H2O and some Na2O (* follows analyzed point) by ion microprobe. Dashes, element not analyzed. sd, 1 standard deviation of H2O measurement propagated through count-ing statistics and uncertainties on H2O working curve. As described in text, pH
2O is H2O saturation pressure in MPa at 900°C from Newman and Lowenstern (2002).]
760
A Volcano Rekindled: The Renewed Eruption of M
ount St. Helens, 2004−2006
USNM115418-42 b5-1 P 5.17 12.27 72.99 0.52 2.32 1.13 0.31 1.81 0.02 0.01 0.13 0.12 0.01 2.73 0.08 99.52 58.6USNM115418-60 16A P 4.51 11.57 72.08 0.63 2.76 0.94 0.52 2.40 0.07 0.09 0.15 0.11 0.01 6.38 0.11 102.22 231.5USNM115418-60 17C P 4.41 10.27 71.52 0.67 2.50 0.85 0.40 3.45 0.10 0.08 0.14 0.09 0.37 2.51 0.04 97.36 50.3USNM115418-60-2 pl1-1 A 4.23 14.11 72.86 0.21 3.07 1.17 0.31 2.10 0.02 0.09 0.28 0.04 0.00 1.81 0.07 100.30 27.7USNM115427-1 a7-1 P 4.89 12.00 74.44 0.39 3.20 0.67 0.40 1.70 0.04 0.12 0.19 0.14 0.00 2.01 0.05 100.19 33.5USNM115773-3 pl10-1 P 5.42 12.15 75.01 0.55 2.63 0.87 0.27 2.06 0.09 0.13 0.14 0.21 0.02 0.60 0.02 100.12 3.3USNM115773-3 pl4-1 P 4.53 11.53 74.64 0.41 2.62 0.77 0.41 1.99 0.06 0.10 0.11 0.18 0.00 2.79 0.08 100.14 60.6USNM115773-3 pl8-1 P 5.05 11.72 73.20 0.48 2.93 1.23 0.81 2.70 0.06 0.23 0.26 0.20 0.00 1.33 0.04 100.18 15.4SH127 sh127-5-1 P 5.94 10.68 74.21 0.39 3.33 1.00 0.52 2.01 0.06 0.07 0.19 0.21 0.00 1.09 0.02 99.71 10.6SH131 sh131-1-1 O 3.28 12.80 75.62 0.42 2.74 0.89 0.33 2.08 0.05 0.12 0.19 0.11 0.02 0.30 0.01 98.95 0.9SH131 sh131-3-gm gm 3.91 11.35 78.44 0.08 3.28 0.77 0.35 1.33 0.01 0.09 0.10 0.25 0.02 0.04 0.00 100.01 0.0SH131 sh131-5-1 P 5.26 11.11 75.32 0.13 3.36 0.62 0.40 1.54 0.07 0.00 0.17 0.48 0.00 0.86 0.02 99.31 6.7SH135 sh135-1-1 P 3.58 11.10 75.81 0.09 5.32 0.46 0.48 1.32 0.05 0.09 0.13 0.22 0.03 0.11 0.01 98.79 0.1SH156 sh156-1-1 P 3.68 10.46 76.58 0.21 3.71 0.26 0.43 1.62 0.03 0.07 0.23 0.00 0.00 1.81 0.07 99.08 27.6SH156 sh156-6-gm gm 4.29 11.10 78.34 0.09 3.57 0.41 0.30 1.25 0.01 0.07 0.11 0.03 0.00 0.12 0.01 99.68 0.1SH156 sh156-7-1 P 4.52 10.88 77.19 0.16 3.42 0.61 0.32 1.24 0.01 0.03 0.17 0.24 0.01 1.09 0.03 99.90 10.6SH156 sh156-8-2 A 6.18 15.23 72.44 0.12 3.48 0.77 0.30 1.60 0.03 0.09 0.21 0.07 0.00 0.12 0.00 100.63 0.1SHKB21 shkb21-2-1 C 4.71 11.02 75.61 0.08 5.12 0.40 0.33 1.40 0.04 0.10 0.24 0.11 0.00 0.17 0.00 99.31 0.3
Current eruptionSH304-2A sh304-1-1 A 2.83 13.84 72.70 0.84 5.65 0.82 0.29 2.24 0.09 0.08 0.10 0.21 0.00 0.15 0.00 99.83 0.2SH304-2A sh304-2-1 O 6.63 19.05 69.70 0.27 0.68 3.65 0.09 0.89 0.01 0.09 0.03 0.00 0.01 0.06 0.01 101.15 0.0SH304-2A sh304-4-2 P 4.68 10.32 77.34 0.07 2.62 0.15 0.05 0.73 0.06 0.05 0.04 0.00 0.01 2.99 0.03 99.12 68.5SH305-1 a1-1 A 5.27 13.56 72.08 0.08 6.04 0.06 0.44 1.78 0.16 0.07 0.19 0.00 0.04 0.18 0.01 99.96 0.3SH305-1 a3-1 A 3.75 12.07 76.56 0.08 5.47 0.38 0.27 1.27 0.00 0.01 0.12 0.00 0.02 0.20 0.01 100.17 0.4SH315-4 a11-1 O 2.73 12.46 76.48 0.46 4.64 0.15 0.22 2.27 0.15 0.05 0.08 0.33 0.00 0.03 0.00 100.05 0.0SH315-4 d4-1 P 3.91 13.44 73.94 0.25 4.27 1.79 0.19 1.17 0.05 0.07 0.12 0.15 0.04 0.09 0.01 99.47 0.1
Table 2. Selected major-element and H2O analyses, in weight percent, of subset of inclusion and groundmass glasses from Mount St. Helens. —Continued
[Entire dataset is in appendix 1; host of inclusion—P, plagioclase; A, amphibole; O, orthopyroxene; C, clinopyroxene; gm, groundmass; tube, tube connecting inclusion and groundmass. Analyses by electron microprobe except H2O and some Na2O (* follows analyzed point) by ion microprobe. Dashes, element not analyzed. sd, 1 standard deviation of H2O measurement propagated through count-ing statistics and uncertainties on H2O working curve. As described in text, pH
2O is H2O saturation pressure in MPa at 900°C from Newman and Lowenstern (2002).]
Sample No.Analyzed point
Host Na2O Al2O3 SiO2 MgO K2O CaO TiO2 FeO MnO P2O5 Cl F SO2 H2O s.d. Total pH2O
33. Evolving Magm
a Storage Conditions Beneath Mount St. Helens Inferred from
Chemical Variations in M
elt Inclusions
761
SampleAnalyzedpoint
Host Li B Sc Rb Sr Y Zr Nb Cs Ba La Ce Pr Nd Sm Gd Dy Ho Yb Hf Th U
1980–86 eruptionUSNM115379-34 11A O 57 -- 2.0 44 200 7.3 183 6.2 2.1 383 13.6 27.4 3.2 14.4 3.0 -- -- -- -- 7.8 3.3 1.8USNM115379-34 3B P 48 -- 5.6 49 68 11.2 206 6.6 2.8 447 14.9 32.3 3.3 18.1 3.7 4.2 3.5 0.56 -- 6.4 3.0 1.6USNM115379-34 6A P 47 -- 6.5 51 61 11.9 226 9.5 2.6 460 16.2 34.5 3.9 17.3 3.4 3.7 3.1 0.59 1.8 8.8 3.9 1.6SH80D 2A P 33 -- 7.1 69 57 11.6 224 6.9 -- 361 15.0 28.7 3.7 -- -- -- -- -- -- -- 2.8 1.5SH80D 8A P 32 -- 7.5 58 38 12.0 234 8.3 -- 378 15.7 33.0 4.0 -- -- -- -- -- -- -- 3.1 1.3MSH006 gm1 gm 34 -- 5.4 40 180 9.5 179 6.6 1.8 360 13.3 26.8 3.5 12.6 2.6 2.0 2.6 0.46 1.2 5.6 3.1 1.5MSH006 9A P 32 -- 3.8 36 212 7.6 154 5.4 1.5 317 11.9 22.9 2.9 12.1 2.4 2.1 2.1 0.34 1.0 4.5 2.4 1.1MSH006 10A P 38 -- 4.0 34 192 6.9 136 5.2 -- 276 11.3 21.8 2.2 -- -- -- -- -- -- -- 2.1 1.1KC518PFB(KCHB) 11A A 32 -- 3.2 47 267 7.0 320 28.8 1.8 439 20.3 35.8 3.7 12.6 3.4 2.1 1.9 0.41 -- 10.3 5.1 2.2KC518PFB(KCHB) GM3 gm 35 -- 4.5 36 224 8.5 180 5.8 1.5 341 12.4 26.3 3.2 13.4 2.7 -- -- -- 5.6 2.5 1.0KC518PFB(KCPL) 13A P 32 -- 1.9 45 190 2.9 87 4.3 3.0 421 11.6 20.7 2.1 8.6 1.5 1.1 -- -- -- 4.0 3.7 1.5KC518PFB(PLZ) 33A2 P 37 -- 6.5 50 195 11.0 240 8.6 2.7 454 17.9 36.2 4.1 17.4 3.2 3.3 2.5 0.55 1.7 7.8 4.4 2.3KC612PF 14-2 P 47 25 4.8 45 88 9.5 176 5.9 2.5 424 14.1 26.5 3.1 12.3 3.0 3.3 -- 0.53 1.5 5.3 2.6 1.5KC612PF 14-GM tube 42 25 5.6 52 64 9.5 205 6.8 2.8 385 12.3 28.2 3.3 15.1 3.5 3.6 2.8 0.55 1.7 6.4 2.8 1.4KC722U 1-GM gm 37 31 6.3 49 150 12.0 233 8.5 2.6 452 15.1 33.6 4.0 16.8 3.2 4.2 3.5 0.70 2.0 8.5 3.7 1.8KC722U 12-1 P 58 21 3.2 40 129 7.7 168 6.5 2.3 479 14.3 27.8 3.1 13.7 2.8 2.1 2.3 0.42 1.4 5.8 3.3 1.2KC807B 807b-9-1 O 37 23 5.8 45 86 11.1 230 8.9 2.4 426 14.4 31.2 3.8 14.7 3.1 2.6 2.9 0.61 1.9 8.7 4.7 1.9KC807B 807b-9-2 P 61 21 5.7 44 118 9.5 205 8.3 2.0 459 15.6 33.7 3.8 16.6 3.1 2.8 2.9 0.54 1.4 6.8 3.9 1.9KC807B 15-1 P 98 25 5.7 50 117 8.5 191 6.9 3.3 425 13.4 27.1 3.3 13.0 2.5 2.7 2.9 -- 1.8 6.9 3.3 2.1KC807B 11-1 P 89 25 3.6 47 144 7.8 155 6.2 2.5 423 13.1 26.3 3.4 12.9 3.1 2.2 2.3 0.58 1.3 6.7 4.1 1.8USNM115418-42 b5-1 P 60 23 5.6 40 89 8.8 186 5.8 2.3 385 13.3 26.7 3.0 12.2 2.3 3.5 2.3 0.42 1.08 4.9 2.7 1.4USNM115427-1 a7-1 P 57 21 9.1 42 38 4.1 239 11.6 1.7 492 4.3 8.8 1.0 3.8 0.6 0.7 1.1 0.24 0.81 7.2 2.6 1.2USNM115773-3 pl10-1 P 34 25 3.2 41 56 5.2 214 5.6 2.1 354 13.0 25.0 2.6 10.2 1.6 2.5 1.4 0.30 0.65 6.1 3.0 1.5USNM115773-3 pl4-1 P 65 19 4.3 43 57 7.6 185 6.2 1.9 346 13.6 27.9 3.0 12.8 2.0 2.8 2.0 0.41 1.21 6.2 2.9 1.5SH127 sh127-5-1 P 118 29 7.9 61 36 14.6 264 11.0 2.8 457 17.3 37.3 4.1 18.7 3.9 2.7 3.6 0.78 2.2 8.8 4.3 2.0SH131 sh131-1-1 O 23 37 4.6 49 42 13.5 213 7.6 1.9 479 15.9 32.0 3.8 16.5 3.3 2.4 2.9 0.72 2.1 7.4 3.5 1.7SH131 sh131-3-gm gm 38 37 5.3 50 30 13.6 286 9.6 2.4 417 14.3 32.3 3.3 15.5 3.3 2.8 3.4 0.62 2.0 9.4 5.2 2.1SH131 sh131-5-1 P 71 33 5.8 53 24 13.5 268 9.1 2.3 408 15.8 35.0 4.2 15.1 3.1 -- 3.4 0.66 2.6 9.6 5.0 2.1SH156 sh156-1-1 P 276 28 5.9 64 22 12.0 235 8.9 3.2 498 18.5 37.1 4.2 17.8 3.2 2.6 3.0 0.66 2.0 8.9 5.5 2.3SH156 sh156-7-1 P 63 33 4.6 58 26 11.1 275 8.7 3.4 416 13.7 29.2 3.3 14.1 2.9 -- 3.0 0.67 1.8 10.2 5.1 2.1SHKB21 shkb21-2-1 C 122 44 3.0 66 15 14.4 379 8.3 3.2 260 18.1 38.8 4.6 18.7 3.4 2.9 3.6 0.79 1.9 13.0 6.5 2.6
Current eruptionSH304-2A sh304-1-1 A 60 24 1.5 172 66 8.7 150 6.4 2.4 512 12.8 27.1 3.2 12.3 2.3 2.4 1.8 0.38 1.3 4.2 1.8 0.3SH304-2A sh304-4-2 P 169 28 3.0 53 156 4.6 42 4.9 3.2 370 9.6 19.6 2.2 8.7 1.9 2.0 1.2 0.21 0.5 1.7 1.9 0.6SH305-1 a3-1 A 159 27 11.8 109 22 11.2 172 5.3 4.0 356 14.0 28.8 3.5 15.2 3.2 3.8 3.3 0.61 1.6 6.2 3.7 1.7SH315-4 d4-1 P 28 34 3.4 187 7 7.0 148 5.6 4.2 116 12.1 26.4 2.8 12.1 2.1 -- 1.5 -- 0.6 6.1 3.3 1.4
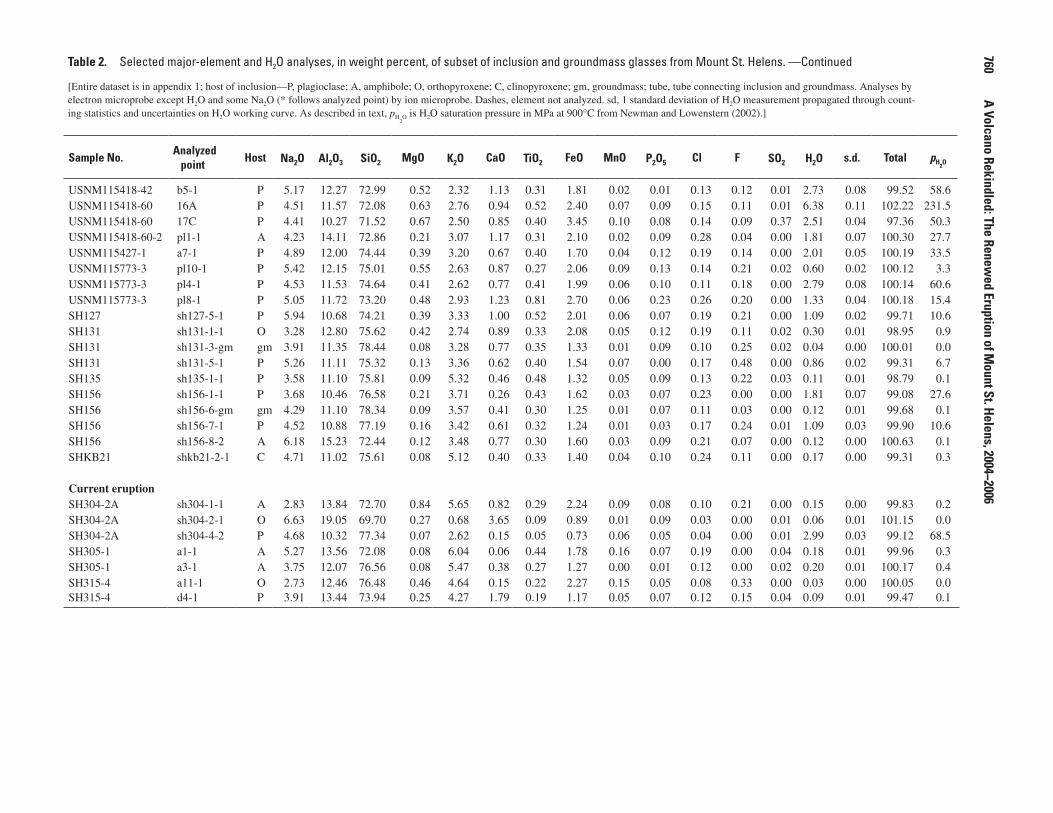
Table 3. Selected trace-element analyses, in parts per million, of subset of inclusion and groundmass glasses from Mount St. Helens.
[Entire dataset is in appendix 1; host of inclusion—P, plagioclase; A, amphibole; O, orthopyroxene; C, clinopyroxene; gm, groundmass; tube, tube connecting inclusion and groundmass. Analyses by ion microprobe. Dashes, element not analyzed.]

762 A Volcano Rekindled: The Renewed Eruption of Mount St. Helens, 2004−2006
Sample Texture Pair T, °C log fO2
1980–86 eruptionSH80D P SH80Dpr3 891 -11.79C85-310 P C85_310 pr3 942 -10.54C85-310 I C85_310 pr6 inc opx 870 -11.23C85-310 G C85_310 pr7tiny 904 -11.55KC518PFB P 518pfapr1 874 -11.51KC518PFB P 518pfapr4 899 -11.04May-25 P may25pair2 908 -10.94May-25 P may25pr1 958 -10.50May-25 P may25pr2 914 -11.44May-25 P may25pr8 869 -12.06KC612PF P june12pr3 877 -11.71KC612PF P june12p6 901 -11.29KC722U P 722upr4 895 -11.37KC722U P 722upr6 878 -11.80SHKB23 I SHKB23pr1 incPl 859 -12.32SHKB23 G SHKB23pr2late gm 872 -11.99SHKB23 P SHKB23pr3pheno 949 -10.93KC681 P 681 pair 2 902 -11.61KC681 P 681 pair 4 751 -14.65KC681 P 681 pair 5 950 -10.73SH131 G SH131gm 862 -12.39SH131 P SH131pr8 883 -11.21SH131 G SH131pr9gm 911 -11.33SH135 P SH135_10pr6 479 -29.05SH156 E SH156pr3ex 871 -12.07SH156 P SH156pr4 864 -11.90SH156 G SH156pr8tiny 927 -10.63SH156 G SH156pr9tiny 864 -12.19SH156 P SH156pr11 899 -11.40SH201 P sh201pr2 833 -13.41SH201 P sh201pr3 857 -11.76SHKB20 P SHKB20pr6 848 -12.35SHKB20 P SHKB20pr6bpheno 893 -11.83
Current eruptionSH315-4 P a5pair7 850 -12.19SH315-4 P a5pair2rpt 868 -11.95SH315-4 P a5pair6gmsrpt 1,022 -9.96
Table 4. Calculated temperature and oxygen fugacity (fO2) for
selected touching pairs of magnetite and ilmenite in Mount St. Helens samples from 1980–86 and current (2004–2006) eruptions.
[All data plotted in figure 12. Each oxide pair is identified in the column labeled “pair,” for cross-referencing to appendix 2 (in digital versions of this work in CD and on Web), which contains the entire dataset and full oxide analyses. Texture: P, phenocryst; G, groundmass; I, inclusion in silicate phe-nocryst; E, exsolution lamellae and host.]
1980–86 and current eruptions, as well as to data for magmas erupted at Mount St. Helens throughout late Quaternary time, taken from a compilation of 94 published analyses (Cashman and Taggart, 1983; Criswell, 1987; Fruchter and others, 1980; Gardner and others, 1995; Halliday and others, 1983; Hooper and others, 1980; Irving and others, 1980; Leeman and others, 1990; Melson, 1983; Pallister and others, 1992; Rutherford and Devine, 1988; Sarna-Wojcicki and others, 1981; Scheidegger
and others, 1982; Smith and Leeman, 1987, 1993; Smith-sonian Institution, 1980) and eight additional unpublished analyses. These data show a number of key systematics. Whole-rock compositions of 1980–86 magmas and those from the current eruption are silicic andesite or dacite with similar major-element compositions, which lie within the overall range for pre-1980 late Quaternary magmas from Mount St. Helens. In terms of both compatible (CaO, Al2O3, MgO, FeO, TiO2) and incompatible (K2O, Na2O) oxides, the glasses all lie at and beyond the high SiO2 end of the whole-rock data.
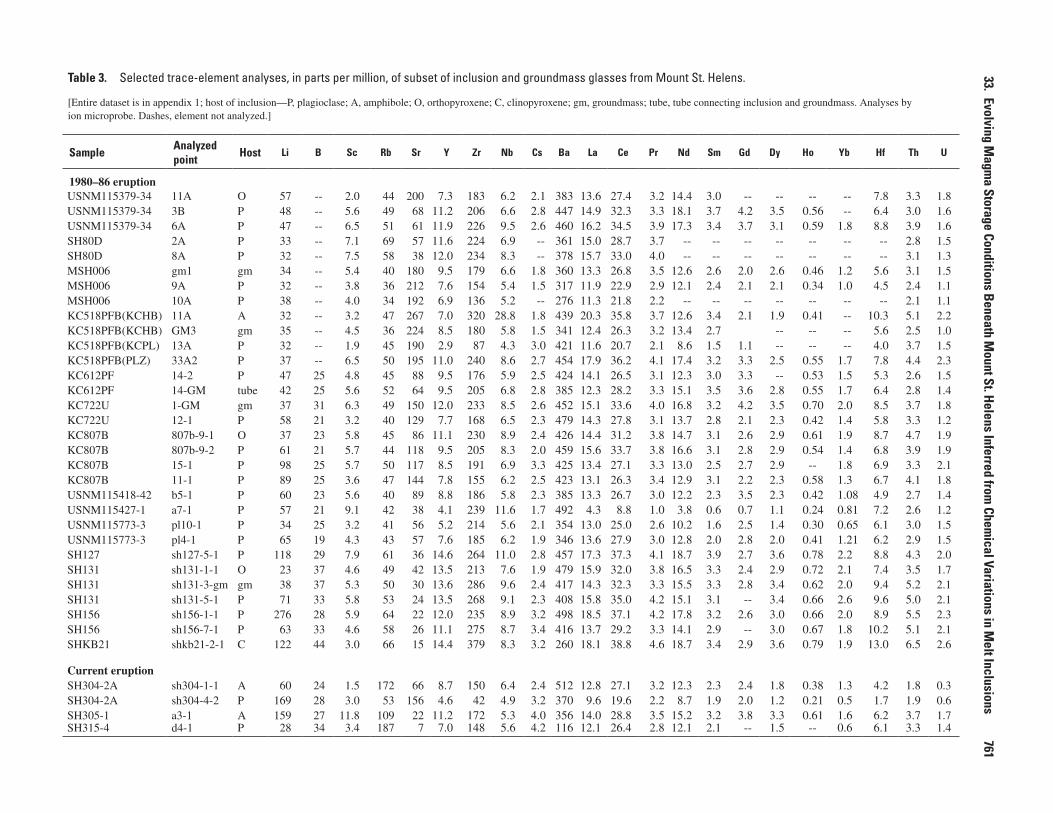
The relatively smooth chemical trends through the whole-rock data are consistent with derivation of the dacites by fractional crystallization or partial melting of basaltic rocks at depth (Smith and Leeman, 1987) or a combination of these processes. We cannot rule out mixing of magmas of differ-ent SiO2 contents to generate some of the chemical diversity in the whole rocks, especially those with >62 percent SiO2. However, marked inflections in the trends for some major and trace elements require a change in fractionating or residual mineralogy during differentiation. For example, the inflection in Al2O3 (fig. 1A) and TiO2 (fig. 1D) at ~60 percent SiO2 is interpreted as the arrival of plagioclase as a controlling phase, and the inflection in the FeO versus MgO plot at ~1.5 percent MgO (fig. 1C) marks the arrival of magnetite. The continuous linear drop in CaO with increasing SiO2 (fig. 1B) is a result of the involvement of amphibole and clinopyroxene in addition to plagioclase, such that the bulk CaO content of the crystalline residue remains approximately constant.
The location of the glass analyses at the high-SiO2 extrap-olation of the whole-rock trends suggests that they represent the continued crystallization of magma to low pressures. The fact that the dacites in which the glasses are found have such limited compositional range, whereas the glasses themselves cover a wide compositional range, even within a single sample, indicates that low-pressure crystallization involved very little change in bulk composition. In other words, the glasses record a process of closed-system crystallization in which some crystals (for example, plagioclase) are overgrown by rims of different composition, whereas others (for example, mafic minerals, oxides) are able to partially or fully reequili-brate. There is no evidence for significant physical removal of crystals from the melt, because the compositional vectors defined by the glasses are oblique to those defined by their host rocks. This is consistent with the high viscosity of silicic melts, which would preclude efficient crystal separation on appropriate time scales.
The variation in K2O with SiO2 in glasses (fig. 1E) curves strongly upward at high SiO2, consistent with the saturation of a silica phase (tridymite or quartz), as observed in the most evolved glasses of both the 1980–86 (Blundy and Cashman, 2001) and current eruptions (Pallister and others, this volume, chap. 30). The elevated K2O of glasses from the current erup-tion distinguishes them from those of the 1980–86 eruption, although a single glass from the current eruption plots at anomalously low K2O (0.67 percent). The overall trend sug-gests that most of the glasses of the current eruption reached
33. Evolving Magma Storage Conditions Beneath Mount St. Helens Inferred from Chemical Variations in Melt Inclusions 763
8
12
16
20
24
45 50 55 60 65 70 75 80 85
Al2O
3, IN
WEI
GHT
PERC
ENT
CaO,
IN W
EIGH
T PE
RCEN
T
K 2O,
IN W
EIGH
T PE
RCEN
T
Na2O
, IN W
EIGH
T PE
RCEN
T
TOTA
L FeO
, IN W
EIGH
T PE
RCEN
T
TiO2,
IN W
EIGH
T PE
RCEN
T
SiO2, IN WEIGHT PERCENT SiO2, IN WEIGHT PERCENT
SiO2, IN WEIGHT PERCENT SiO2, IN WEIGHT PERCENT
MgO, IN WEIGHT PERCENT SiO2, IN WEIGHT PERCENT
0
2
4
6
8
10
45 50 55 60 65 70 75 80 85
0
2
4
6
8
10
12
0 1 2 3 4 5 6 7 80
0.5
1
1.5
2
2.5
45 50 55 60 65 70 75 80 85
0
1
2
3
4
5
6
7
45 50 55 60 65 70 75 80 85
EXPLANATION
Pre-1980 (bulk)1980–86 (bulk)Current (bulk)
1980–86 (MI-plag)1980–86 (MI-hbl)1980–86 (MI-opx)1980-86 (MI-cpx)1980–86 (gm)
Current (MI-plag)Current (MI-hbl)Current (MI-opx)
0
1
2
3
4
5
6
7
8
45 50 55 60 65 70 75 80 85
A B
C D
E F
Figure 1. Major-element variation diagrams (normalized to 100 percent anhydrous) for Mount St. Helens whole rocks of late Quaternary age (sources given in text) and melt inclusion (MI) and groundmass (gm) glasses from 1980–86 and current (2004–2006) eruptions (data from table 2). All glass data by electron microprobe analysis. Explanation indicates host mineral for melt inclusions (MI): plag, plagioclase; hbl, hornblende; opx, orthopyroxene; cpx, clinopyroxene. A, Al2O3–SiO2. B, CaO–SiO2. C, FeOtot–MgO. D, TiO2–SiO2. E, K2O–SiO2. F, Na2O–SiO2.
764 A Volcano Rekindled: The Renewed Eruption of Mount St. Helens, 2004−2006
the silica-saturation surface at low pressure, whereas silica saturation was relatively rare in 1980–86 glasses. Silica satura-tion requires higher degrees of crystallization, cooler tempera-tures, or an initially more SiO2-rich melt.
The Na2O-SiO2 variation (fig. 1F) is unusual in that it shows a marked inflection between the whole-rock data, which show increasing Na2O with SiO2, and the glasses, which show the opposite. This cannot be a result of analytical error, as the technique used for glass analyses effectively eliminates Na loss (Humphreys and others, 2006). The decrease in Na2O with SiO2 in the glasses cannot be generated by fractionation of an Na-rich crystal phase, because the most sodic phase in any of these rocks is groundmass plagioclase (An35) with ~7 percent Na2O. Instead, we suggest that Na is preferentially partitioned into the exsolving vapor phase during volatile-saturated crystalliza-tion, causing it to decrease in the melt. This is consistent with the elevated Na content of fumarole gases from the volcano (Symonds and Reed, 1993). The slight increase in Na2O with SiO2 in the whole-rock data suggests that, in contrast to the glasses, differentiation did not involve a free-vapor phase. The
fact that the glass trend is markedly oblique to the whole-rock trend indicates that the onset of low-pressure crystallization and the onset of volatile saturation were almost coincident, as is typical of volatile-saturated decompression crystallization (Blundy and Cashman, 2001, 2005; Annen and others, 2006).
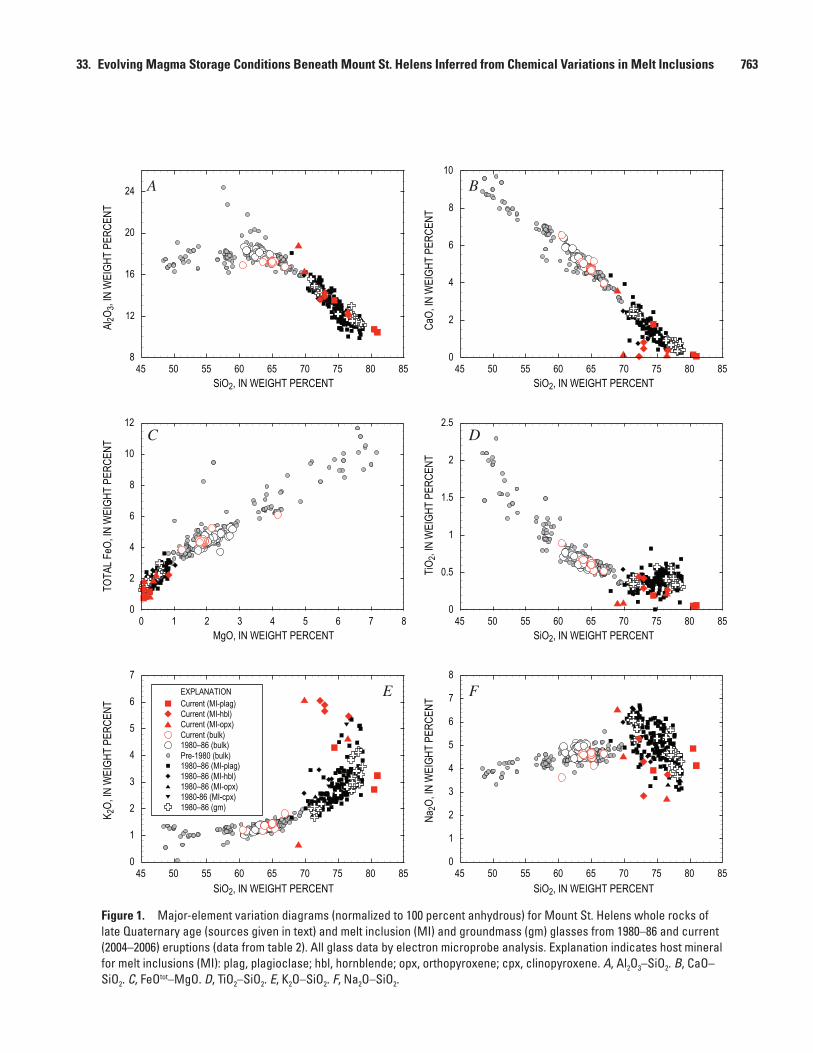
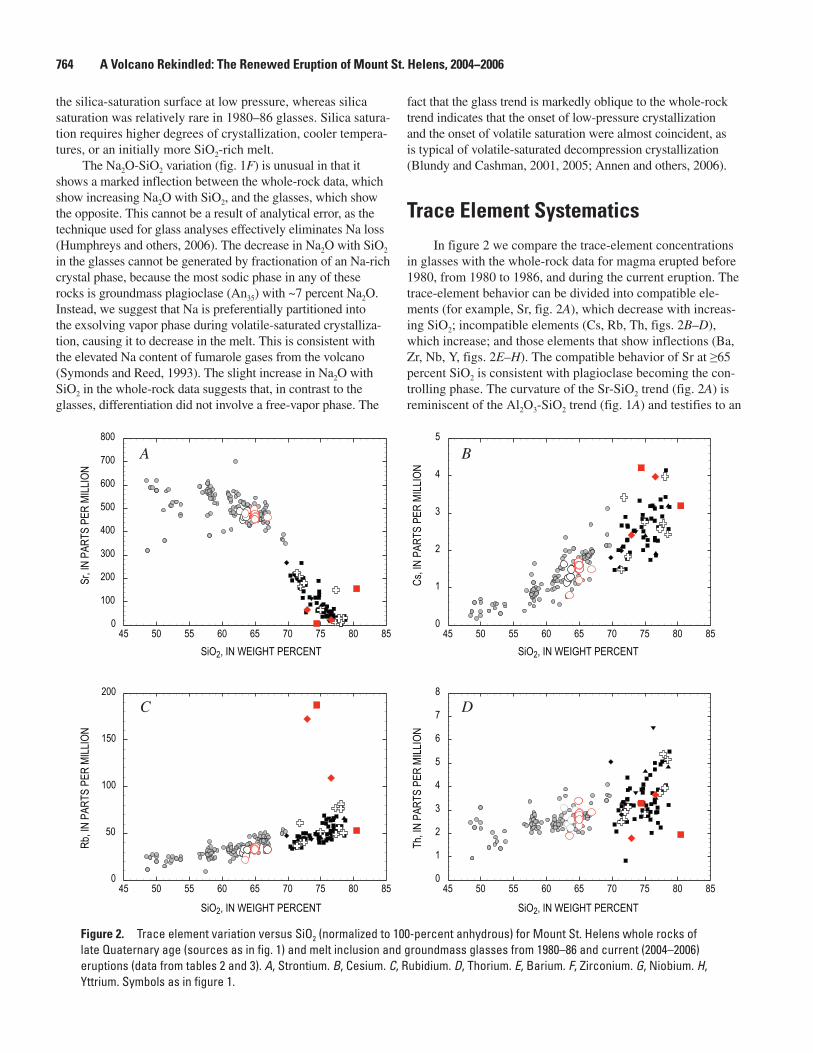
Trace Element SystematicsIn figure 2 we compare the trace-element concentrations
in glasses with the whole-rock data for magma erupted before 1980, from 1980 to 1986, and during the current eruption. The trace-element behavior can be divided into compatible ele-ments (for example, Sr, fig. 2A), which decrease with increas-ing SiO2; incompatible elements (Cs, Rb, Th, figs. 2B–D), which increase; and those elements that show inflections (Ba, Zr, Nb, Y, figs. 2E–H). The compatible behavior of Sr at ≥65 percent SiO2 is consistent with plagioclase becoming the con-trolling phase. The curvature of the Sr-SiO2 trend (fig. 2A) is reminiscent of the Al2O3-SiO2 trend (fig. 1A) and testifies to an
0
100
200
300
400
500
600
700
800
45 50 55 60 65 70 75 80 85
Sr, IN
PAR
TS P
ER M
ILLIO
N
Cs, IN
PAR
TS P
ER M
ILLIO
N
Rb, IN
PAR
TS P
ER M
ILLIO
N
Th, IN
PAR
TS P
ER M
ILLIO
N
0
1
2
3
4
5
45 50 55 60 65 70 75 80 85
0
50
100
150
200
45 50 55 60 65 70 75 80 850
1
2
3
4
5
6
7
8
45 50 55 60 65 70 75 80 85
A B
C D
SiO2, IN WEIGHT PERCENT SiO2, IN WEIGHT PERCENT
SiO2, IN WEIGHT PERCENT SiO2, IN WEIGHT PERCENT
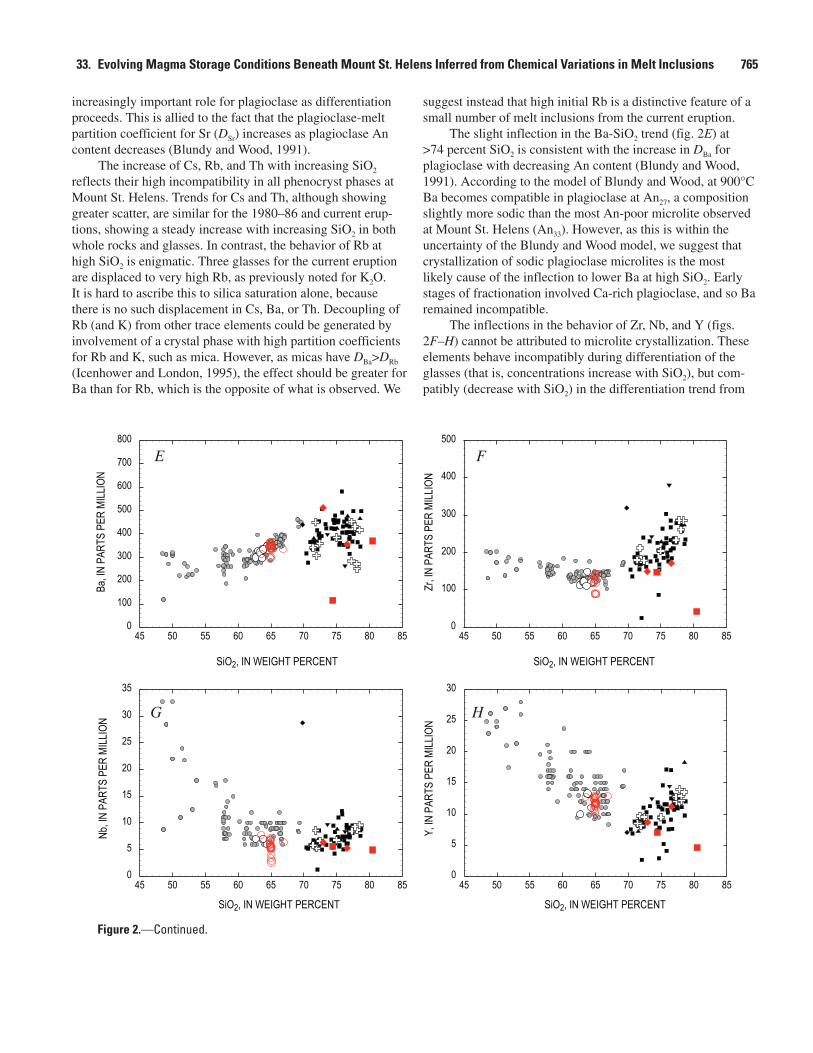
Figure 2. Trace element variation versus SiO2 (normalized to 100-percent anhydrous) for Mount St. Helens whole rocks of late Quaternary age (sources as in fig. 1) and melt inclusion and groundmass glasses from 1980–86 and current (2004–2006) eruptions (data from tables 2 and 3). A, Strontium. B, Cesium. C, Rubidium. D, Thorium. E, Barium. F, Zirconium. G, Niobium. H, Yttrium. Symbols as in figure 1.
33. Evolving Magma Storage Conditions Beneath Mount St. Helens Inferred from Chemical Variations in Melt Inclusions 765
increasingly important role for plagioclase as differentiation proceeds. This is allied to the fact that the plagioclase-melt partition coefficient for Sr (DSr) increases as plagioclase An content decreases (Blundy and Wood, 1991).
The increase of Cs, Rb, and Th with increasing SiO2 reflects their high incompatibility in all phenocryst phases at Mount St. Helens. Trends for Cs and Th, although showing greater scatter, are similar for the 1980–86 and current erup-tions, showing a steady increase with increasing SiO2 in both whole rocks and glasses. In contrast, the behavior of Rb at high SiO2 is enigmatic. Three glasses for the current eruption are displaced to very high Rb, as previously noted for K2O. It is hard to ascribe this to silica saturation alone, because there is no such displacement in Cs, Ba, or Th. Decoupling of Rb (and K) from other trace elements could be generated by involvement of a crystal phase with high partition coefficients for Rb and K, such as mica. However, as micas have DBa>DRb (Icenhower and London, 1995), the effect should be greater for Ba than for Rb, which is the opposite of what is observed. We
suggest instead that high initial Rb is a distinctive feature of a small number of melt inclusions from the current eruption.
The slight inflection in the Ba-SiO2 trend (fig. 2E) at >74 percent SiO2 is consistent with the increase in DBa for plagioclase with decreasing An content (Blundy and Wood, 1991). According to the model of Blundy and Wood, at 900°C Ba becomes compatible in plagioclase at An27, a composition slightly more sodic than the most An-poor microlite observed at Mount St. Helens (An33). However, as this is within the uncertainty of the Blundy and Wood model, we suggest that crystallization of sodic plagioclase microlites is the most likely cause of the inflection to lower Ba at high SiO2. Early stages of fractionation involved Ca-rich plagioclase, and so Ba remained incompatible.
The inflections in the behavior of Zr, Nb, and Y (figs. 2F–H) cannot be attributed to microlite crystallization. These elements behave incompatibly during differentiation of the glasses (that is, concentrations increase with SiO2), but com-patibly (decrease with SiO2) in the differentiation trend from
0
5
10
15
20
25
30
35
45 50 55 60 65 70 75 80 850
5
10
15
20
25
30
45 50 55 60 65 70 75 80 85
G H
Nb, IN
PAR
TS P
ER M
ILLIO
N
SiO2, IN WEIGHT PERCENT
Y, IN
PAR
TS P
ER M
ILLIO
N
SiO2, IN WEIGHT PERCENT
Ba, IN
PAR
TS P
ER M
ILLIO
N
Zr, IN
PAR
TS P
ER M
ILLIO
N
0
100
200
300
400
500
600
700
800
45 50 55 60 65 70 75 80 850
100
200
300
400
500
45 50 55 60 65 70 75 80 85
E F
SiO2, IN WEIGHT PERCENT SiO2, IN WEIGHT PERCENT
Figure 2.—Continued.
766 A Volcano Rekindled: The Renewed Eruption of Mount St. Helens, 2004−2006
basalt to dacite. This behavior was previously noted by Smith and Leeman (1987), who attributed the low concentration of many incompatible trace elements in dacite to their genera-tion by melting of basalt in the lower crust. During this pro-cess, garnet was stable in the residue and residual amphibole occurred at much higher modal proportion than it occurs as a phenocryst phase in the dacite. We agree with this interpreta-tion in a general sense, although we note that crystallization of hydrous basalt, rather than melting of basalt, can also pro-duce residues with garnet and modally abundant amphibole. Annen and others (2006) have argued on the basis of thermal models that deep crustal crystallization of hydrous basalt is the most effective method of producing andesite and dacite. We suggest that high-pressure crystallization accounts for the trends of decreasing Y, Zr, and Nb with increasing SiO2 in the bulk rocks. Garnet and/or amphibole crystallization best explains the behavior of Y and possibly Zr, whereas crystalli-zation of rutile or ilmenite can account for the behavior of Nb. We note that the Zr concentrations in all Mount St. Helens rocks are too low for zircon saturation at ≥850°C (Watson and Harrison, 1983), and it is unlikely that this mineral plays a role in controlling the behavior of Zr in the whole rocks. It is possible, however, that the three melt inclusions with Zr concentrations <100 ppm in figure 2F attained zircon satura-tion during cooling, although this would require a tempera-ture ≤720°C (Watson and Harrison, 1983), which is below the H2O-saturated haplogranite solidus at pressures ≤50 MPa (Johannes and Holtz, 1996).
Detailed quantitative modeling of the whole-rock and melt-inclusion differentiation trends is beyond the scope of this paper. However, we conclude that the whole-rock chemi-cal variations seen in figures 1 and 2 are consistent with a high-pressure, vapor-undersaturated differentiation episode to generate the silicic andesite and dacite and that this is followed by low-pressure, vapor-saturated crystallization to generate the compositional variation in the glasses. Mixing of more and less differentiated magmas at depth (Annen and others, 2006) or entrainment of crystalline residues from depth may be responsible for some of the linearity observed in the whole-rock data, especially in rocks with >62 percent SiO2. However, the overall whole-rock trend from basalt to dacite cannot be attributed to magma mixing alone.
For the 1980–86 eruption, melt inclusions hosted by plagioclase, amphibole, orthopyroxene, and clinopyroxene lie on the same overall trends (figs. 1, 2). In keeping with Ruther-ford and Devine (1988), we observe that amphibole-hosted inclusions are confined to the SiO2-poor end of the array, but they do not show a consistent offset relative to plagioclase- or pyroxene-hosted inclusions. This observation indicates that the major and trace-element chemistry of a melt inclusion is not a product of simple closed-system postentrapment crystalliza-tion or dissolution of the host mineral. If it were, then elements that are compatible in only one host phase (for example, Sr in plagioclase) would show different behavior from one host min-eral to another; but figure 2A indicates that this is not the case. Similarly, we see no consistent offset in MgO and FeO contents
of those inclusions hosted in mafic minerals compared to those in plagioclase (fig. 1C; Blundy and Cashman, 2005).
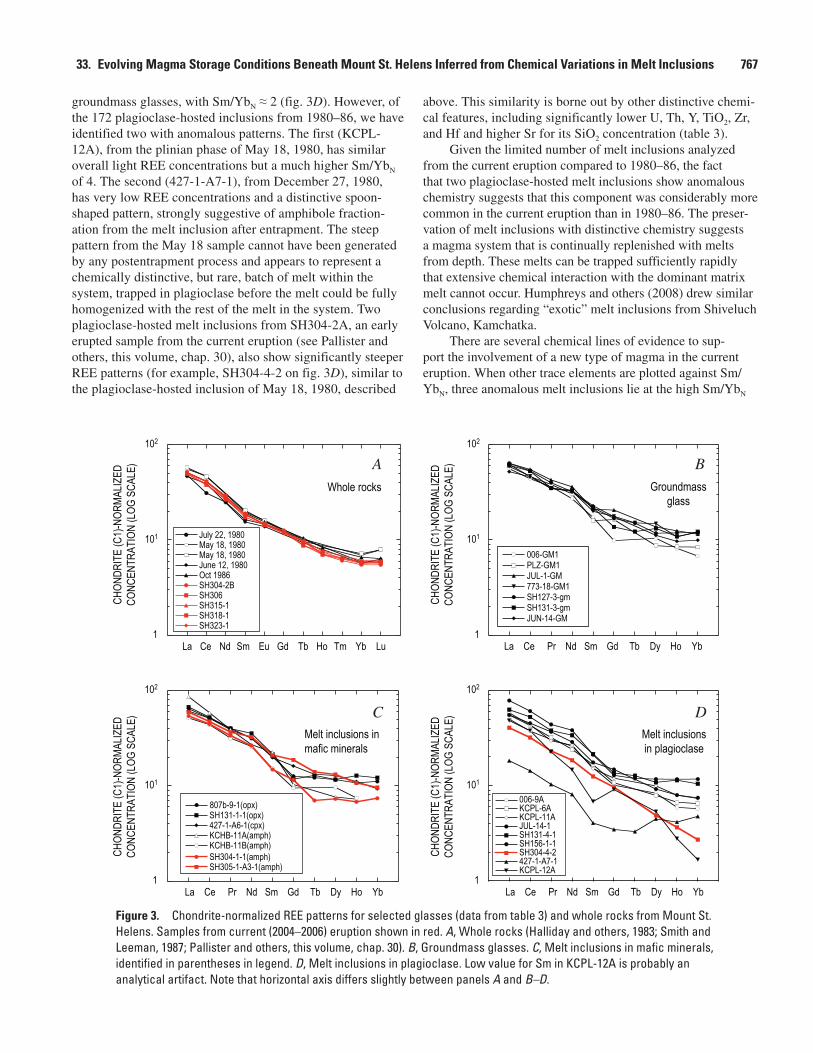
Rare-Earth Elements (REE)Rare-earth elements (except Eu) have been measured in
melt inclusions and groundmass glasses from the 1980–86 eruption and from melt inclusions in three samples of the current eruption. Selected data are plotted on chondrite-normalized (Sun and McDonough, 1989) variation diagrams in figures 3B–D, together with whole-rock data (fig. 3A) from the literature and from Pallister and others (this volume, chap. 30). As noted by Pallister and others, bulk rock REE pat-terns of samples from both the current and 1980–86 eruptions are similar. The only difference is a lower overall content of heavy REE in the current eruption. Neither eruption produced rocks with any detectable Eu anomaly (fig. 3A), despite the abundance of plagioclase as a major crystallizing phase at low pressure. This is consistent with the suggestion above that much of the chemical variation in the basalt to dacite magmas at Mount St. Helens was generated in the lower crust (~30 km depth), where plagioclase was a minor phase (Berlo and others, 2007). Elevated fO2
in these magmas would also serve to minimize any Eu anomaly due to the low Eu2+/Eu3+ ratio. Plagioclase appears to have become a major crystallizing phase only above 62 percent SiO2. We cannot rule out some plagioclase fractionation followed by plagioclase addition at a later stage to eliminate any Eu anomaly, although it would be surprising if this process precisely eliminated the Eu anomaly in all samples analyzed.
The melt inclusion and groundmass glasses have slightly elevated REE concentrations relative to the bulk rocks owing to crystallization. This crystallization demonstrably involved plagioclase, and we would expect the glasses to show nega-tive Eu anomalies if this element could be measured by ion microprobe. Plagioclase has higher partition coefficients for the light REE relative to the heavy REE; hence the increase in heavy REE concentration with fractionation is greater than that of the light REE. This is clearly seen in the groundmass glasses (fig. 3B). A characteristic of almost all inclusion and groundmass glasses is a flattening out of the REE patterns between Sm and Yb, leading to a relatively low chondrite-normalized ratio (Sm/YbN) of ~2. This behavior is character-istic of silicic magmas that have equilibrated with amphibole, which has elevated, but near-constant, partition coefficients for Sm to Yb (Sisson, 1994). The Sm/YbN of most glasses and the whole rocks is broadly similar, suggesting that at least some of the amphibole fractionation occurred in the source region of the dacites, in accord with inferences from trace-element systematics. Melt inclusions in amphibole and orthopyroxene from the current eruption (fig. 3C) are broadly similar in REE chemistry to those of 1980–86, with Sm/YbN ≈ 2.
Most plagioclase-hosted melt inclusions have similar REE patterns to melt inclusions in mafic phenocrysts and
33. Evolving Magma Storage Conditions Beneath Mount St. Helens Inferred from Chemical Variations in Melt Inclusions 767
1
101
102
La Ce Nd Sm Eu Gd Tb Ho Tm Yb Lu
Whole rocks
July 22, 1980May 18, 1980May 18, 1980June 12, 1980Oct 1986SH304-2BSH306SH315-1SH318-1SH323-1
La Ce Pr Nd Sm Gd Tb Dy Ho Yb
Groundmassglass
006-GM1PLZ-GM1JUL-1-GM773-18-GM1SH127-3-gmSH131-3-gmJUN-14-GM
1
101
102
1
101
102
1
101
102
La Ce Pr Nd Sm Gd Tb Dy Ho Yb
Melt inclusions inmafic minerals
807b-9-1(opx)SH131-1-1(opx)427-1-A6-1(cpx)KCHB-11A(amph)KCHB-11B(amph)SH304-1-1(amph)SH305-1-A3-1(amph)
CHON
DRIT
E (C
1)-N
ORMA
LIZED
CONC
ENTR
ATIO
N (L
OG S
CALE
)CH
ONDR
ITE
(C1)
-NOR
MALIZ
EDCO
NCEN
TRAT
ION
(LOG
SCA
LE)
CHON
DRIT
E (C
1)-N
ORMA
LIZED
CONC
ENTR
ATIO
N (L
OG S
CALE
)CH
ONDR
ITE
(C1)
-NOR
MALIZ
EDCO
NCEN
TRAT
ION
(LOG
SCA
LE)
La Ce Pr Nd Sm Gd Tb Dy Ho Yb
Melt inclusionsin plagioclase
006-9AKCPL-6AKCPL-11AJUL-14-1SH131-4-1SH156-1-1SH304-4-2427-1-A7-1KCPL-12A
A B
C D
Figure 3. Chondrite-normalized REE patterns for selected glasses (data from table 3) and whole rocks from Mount St. Helens. Samples from current (2004–2006) eruption shown in red. A, Whole rocks (Halliday and others, 1983; Smith and Leeman, 1987; Pallister and others, this volume, chap. 30). B, Groundmass glasses. C, Melt inclusions in mafic minerals, identified in parentheses in legend. D, Melt inclusions in plagioclase. Low value for Sm in KCPL-12A is probably an analytical artifact. Note that horizontal axis differs slightly between panels A and B–D.
groundmass glasses, with Sm/YbN ≈ 2 (fig. 3D). However, of the 172 plagioclase-hosted inclusions from 1980–86, we have identified two with anomalous patterns. The first (KCPL-12A), from the plinian phase of May 18, 1980, has similar overall light REE concentrations but a much higher Sm/YbN of 4. The second (427-1-A7-1), from December 27, 1980, has very low REE concentrations and a distinctive spoon-shaped pattern, strongly suggestive of amphibole fraction-ation from the melt inclusion after entrapment. The steep pattern from the May 18 sample cannot have been generated by any postentrapment process and appears to represent a chemically distinctive, but rare, batch of melt within the system, trapped in plagioclase before the melt could be fully homogenized with the rest of the melt in the system. Two plagioclase-hosted melt inclusions from SH304-2A, an early erupted sample from the current eruption (see Pallister and others, this volume, chap. 30), also show significantly steeper REE patterns (for example, SH304-4-2 on fig. 3D), similar to the plagioclase-hosted inclusion of May 18, 1980, described
above. This similarity is borne out by other distinctive chemi-cal features, including significantly lower U, Th, Y, TiO2, Zr, and Hf and higher Sr for its SiO2 concentration (table 3).
Given the limited number of melt inclusions analyzed from the current eruption compared to 1980–86, the fact that two plagioclase-hosted melt inclusions show anomalous chemistry suggests that this component was considerably more common in the current eruption than in 1980–86. The preser-vation of melt inclusions with distinctive chemistry suggests a magma system that is continually replenished with melts from depth. These melts can be trapped sufficiently rapidly that extensive chemical interaction with the dominant matrix melt cannot occur. Humphreys and others (2008) drew similar conclusions regarding “exotic” melt inclusions from Shiveluch Volcano, Kamchatka.
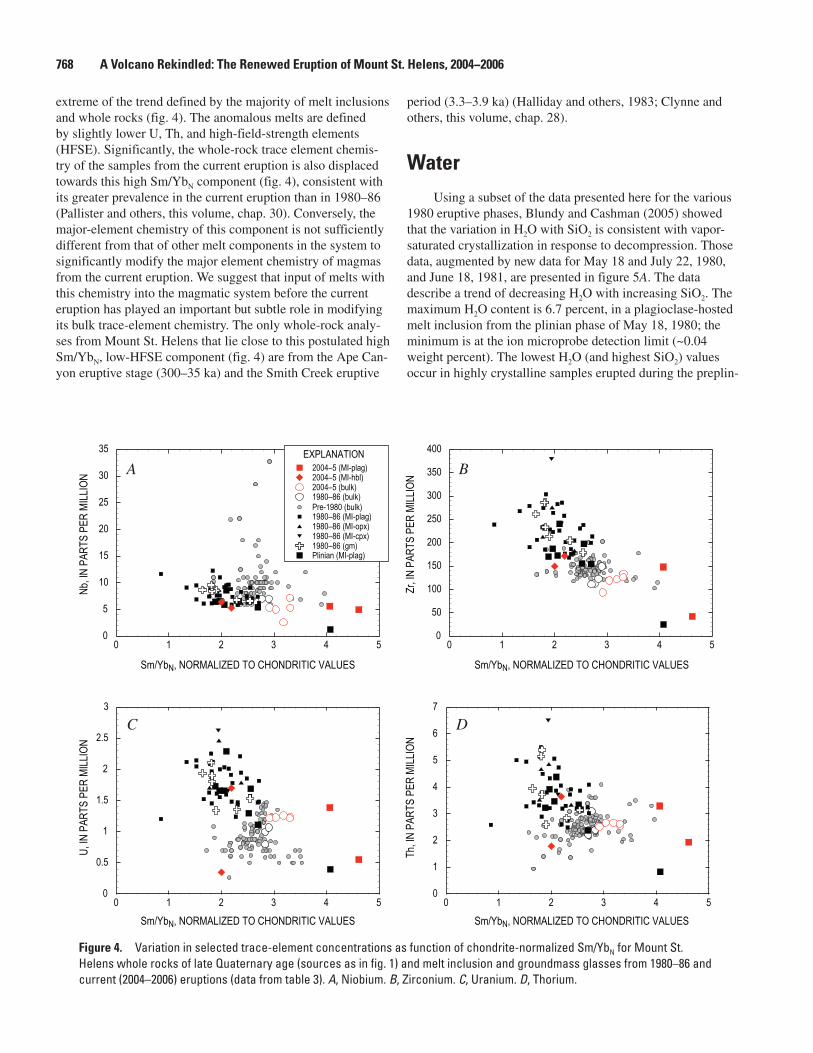
There are several chemical lines of evidence to sup-port the involvement of a new type of magma in the current eruption. When other trace elements are plotted against Sm/YbN, three anomalous melt inclusions lie at the high Sm/YbN
768 A Volcano Rekindled: The Renewed Eruption of Mount St. Helens, 2004−2006
extreme of the trend defined by the majority of melt inclusions and whole rocks (fig. 4). The anomalous melts are defined by slightly lower U, Th, and high-field-strength elements (HFSE). Significantly, the whole-rock trace element chemis-try of the samples from the current eruption is also displaced towards this high Sm/YbN component (fig. 4), consistent with its greater prevalence in the current eruption than in 1980–86 (Pallister and others, this volume, chap. 30). Conversely, the major-element chemistry of this component is not sufficiently different from that of other melt components in the system to significantly modify the major element chemistry of magmas from the current eruption. We suggest that input of melts with this chemistry into the magmatic system before the current eruption has played an important but subtle role in modifying its bulk trace-element chemistry. The only whole-rock analy-ses from Mount St. Helens that lie close to this postulated high Sm/YbN, low-HFSE component (fig. 4) are from the Ape Can-yon eruptive stage (300–35 ka) and the Smith Creek eruptive
period (3.3–3.9 ka) (Halliday and others, 1983; Clynne and others, this volume, chap. 28).
WaterUsing a subset of the data presented here for the various
1980 eruptive phases, Blundy and Cashman (2005) showed that the variation in H2O with SiO2 is consistent with vapor-saturated crystallization in response to decompression. Those data, augmented by new data for May 18 and July 22, 1980, and June 18, 1981, are presented in figure 5A. The data describe a trend of decreasing H2O with increasing SiO2. The maximum H2O content is 6.7 percent, in a plagioclase-hosted melt inclusion from the plinian phase of May 18, 1980; the minimum is at the ion microprobe detection limit (~0.04 weight percent). The lowest H2O (and highest SiO2) values occur in highly crystalline samples erupted during the preplin-
0
5
10
15
20
25
30
35
0 1 2 3 4 50
50
100
150
200
250
300
350
400
0 1 2 3 4 5
0
0.5
1
1.5
2
2.5
3
0 1 2 3 4 50
1
2
3
4
5
6
7
0 1 2 3 4 5
A B
C D
Nb, IN
PAR
TS P
ER M
ILLIO
NU,
IN P
ARTS
PER
MILL
ION
Zr, IN
PAR
TS P
ER M
ILLIO
NTh
, IN P
ARTS
PER
MILL
ION
Sm/YbN, NORMALIZED TO CHONDRITIC VALUES Sm/YbN, NORMALIZED TO CHONDRITIC VALUES
Sm/YbN, NORMALIZED TO CHONDRITIC VALUES Sm/YbN, NORMALIZED TO CHONDRITIC VALUES
Pre-1980 (bulk)
EXPLANATION
1980–86 (bulk)2004–5 (bulk)
Plinian (MI-plag)
1980–86 (MI-plag)1980–86 (MI-opx)1980–86 (MI-cpx)1980–86 (gm)
2004–5 (MI-plag)2004–5 (MI-hbl)
Figure 4. Variation in selected trace-element concentrations as function of chondrite-normalized Sm/YbN for Mount St. Helens whole rocks of late Quaternary age (sources as in fig. 1) and melt inclusion and groundmass glasses from 1980–86 and current (2004–2006) eruptions (data from table 3). A, Niobium. B, Zirconium. C, Uranium. D, Thorium.
33. Evolving Magma Storage Conditions Beneath Mount St. Helens Inferred from Chemical Variations in Melt Inclusions 769
0
1
2
3
4
5
6
7
66 68 70 72 74 76 78 80
1980–81
Apr 10 (plag)Crypto (plag)Crypto (opx)May 18 (plag)May 18 (hbl)May 25 (plag)
Jun 12 (plag)
EXPLANATIONAll 1980 except June 1981 sample
Jul 22 (plag)Aug 7 (plag)Aug 7 (opx)Oct 16 (plag)Oct 16 (hbl)
Dec 27 (plag)Dec 27 (cpx)Jun 1981 (plag)May 18 (gm)1980 (gm)
Rupturedinclusions
0
1
2
3
4
5
6
7
66 68 70 72 74 76 78 80
1982–86
CryptodomeMay 18, 1980 (plinian)1980–81Mar 1982
May 1982Aug 1982Feb 1983Jun 1984
May 1985Oct 19861982 (gm)
0
1
2
3
4
5
6
7
66 68 70 72 74 76 78 80 82
Current
CryptodomeMay 18, 1980 (plinian)1980–81
SH304-2ASH305-1SH315-4
H 2O,
IN W
EIGH
T PE
RCEN
TH 2
O, IN
WEI
GHT
PERC
ENT
H 2O,
IN W
EIGH
T PE
RCEN
T
SiO2, IN WEIGHT PERCENT
SiO2, IN WEIGHT PERCENT
SiO2, IN WEIGHT PERCENT
A
B
C
EXPLANATION
EXPLANATION
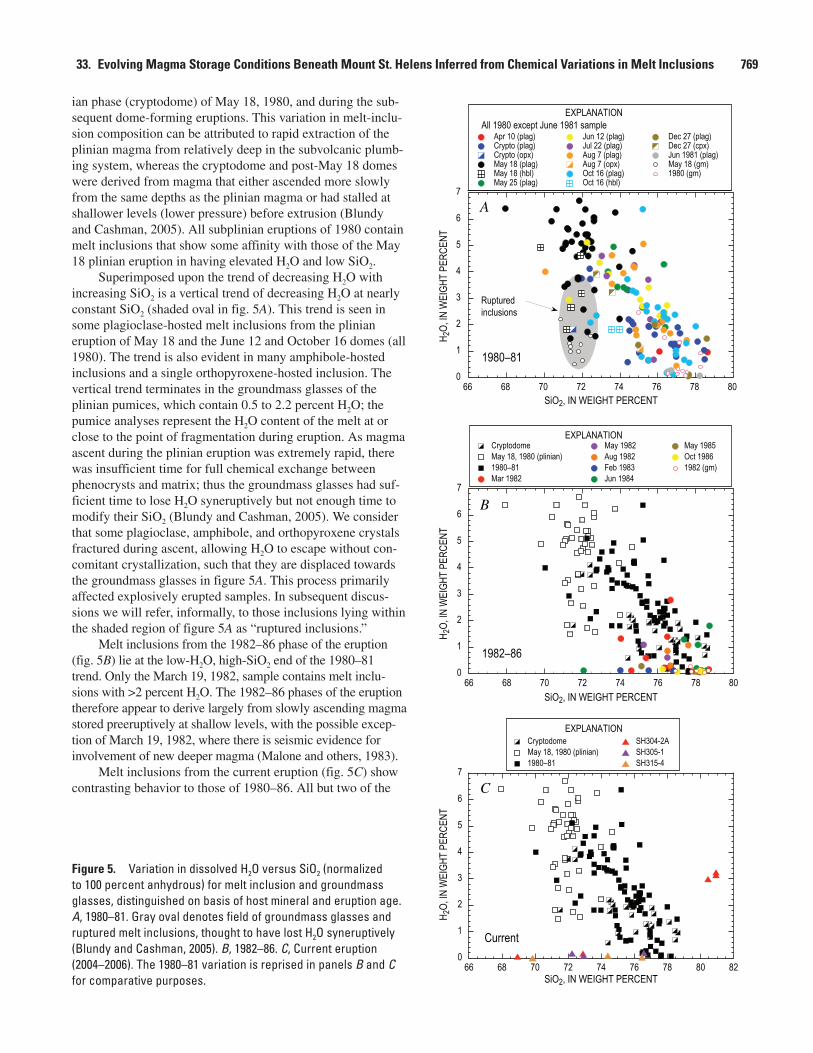
ian phase (cryptodome) of May 18, 1980, and during the sub-sequent dome-forming eruptions. This variation in melt-inclu-sion composition can be attributed to rapid extraction of the plinian magma from relatively deep in the subvolcanic plumb-ing system, whereas the cryptodome and post-May 18 domes were derived from magma that either ascended more slowly from the same depths as the plinian magma or had stalled at shallower levels (lower pressure) before extrusion (Blundy and Cashman, 2005). All subplinian eruptions of 1980 contain melt inclusions that show some affinity with those of the May 18 plinian eruption in having elevated H2O and low SiO2.
Superimposed upon the trend of decreasing H2O with increasing SiO2 is a vertical trend of decreasing H2O at nearly constant SiO2 (shaded oval in fig. 5A). This trend is seen in some plagioclase-hosted melt inclusions from the plinian eruption of May 18 and the June 12 and October 16 domes (all 1980). The trend is also evident in many amphibole-hosted inclusions and a single orthopyroxene-hosted inclusion. The vertical trend terminates in the groundmass glasses of the plinian pumices, which contain 0.5 to 2.2 percent H2O; the pumice analyses represent the H2O content of the melt at or close to the point of fragmentation during eruption. As magma ascent during the plinian eruption was extremely rapid, there was insufficient time for full chemical exchange between phenocrysts and matrix; thus the groundmass glasses had suf-ficient time to lose H2O syneruptively but not enough time to modify their SiO2 (Blundy and Cashman, 2005). We consider that some plagioclase, amphibole, and orthopyroxene crystals fractured during ascent, allowing H2O to escape without con-comitant crystallization, such that they are displaced towards the groundmass glasses in figure 5A. This process primarily affected explosively erupted samples. In subsequent discus-sions we will refer, informally, to those inclusions lying within the shaded region of figure 5A as “ruptured inclusions.”
Melt inclusions from the 1982–86 phase of the eruption (fig. 5B) lie at the low-H2O, high-SiO2 end of the 1980–81 trend. Only the March 19, 1982, sample contains melt inclu-sions with >2 percent H2O. The 1982–86 phases of the eruption therefore appear to derive largely from slowly ascending magma stored preeruptively at shallow levels, with the possible excep-tion of March 19, 1982, where there is seismic evidence for involvement of new deeper magma (Malone and others, 1983).
Melt inclusions from the current eruption (fig. 5C) show contrasting behavior to those of 1980–86. All but two of the
Figure 5. Variation in dissolved H2O versus SiO2 (normalized to 100 percent anhydrous) for melt inclusion and groundmass glasses, distinguished on basis of host mineral and eruption age. A, 1980–81. Gray oval denotes field of groundmass glasses and ruptured melt inclusions, thought to have lost H2O syneruptively (Blundy and Cashman, 2005). B, 1982–86. C, Current eruption (2004–2006). The 1980–81 variation is reprised in panels B and C for comparative purposes.
770 A Volcano Rekindled: The Renewed Eruption of Mount St. Helens, 2004−2006
inclusions have negligible H2O contents, close to ion micro-probe detection limits. The variable SiO2 contents of these inclusions strongly suggest that they fall into the ruptured inclusion category. The striking exceptions are three inclusions from SH304-2A with elevated H2O (~3 percent) and SiO2 (~81 percent). These inclusions lie quite remote from the 1980–86 trend, suggesting that different processes have shaped their chemistry. The same inclusions have the anomalous REE pat-terns seen in figure 3C. We noted previously that there is evi-dence for significant silica-phase fractionation in glasses from the current eruption (for example, fig. 1E). The elevated H2O content of the inclusions from SH304-2A suggests that they encountered the silica-saturation surface at higher pressures than those of the 1980–86 eruption. Higher pressure saturation with silica can occur if the magma is initially more silica rich, cooler, or both (Blundy and Cashman, 2001, fig. 2).
Partial Pressure of H2O and Other Volatile Species
Changes in inclusion-sealing conditions can be conve-niently expressed in terms of the partial pressure of H2O (pH2O
) (Blundy and Cashman, 2005). The pH2O
can be calculated from the measured H2O content and well-known solubility-pressure relations. We have used the software VolatileCalc of Newman and Lowenstern (2002) for rhyolitic melts at a nominal temperature of 900°C. Pressures calculated in this way are reported in table 2. The pH2O
varies from 248 MPa (for the maximum H2O content of 6.7 percent) to zero. The pH2O
values calculated for pumice erupted during the May 18, 1980, plinian event are consistently higher than those of subsequent explosive and effusive eruptive episodes.
Partial pressure of H2O does not equate directly to total pressure (Ptot) because of the presence of other volatiles, nota-bly CO2, halogens, and sulfur species. We can use the mea-sured concentrations of F, Cl, and S (as SO2) in glasses (table 2) to estimate partial pressures of other volatile species.
The chlorine content of glasses in the 1980–86 eruptive products ranges from 0.05 to 0.30 weight percent (fig. 6A) and shows a slight increase with decreasing pH2O
. This variation is consistent with the known negative pressure dependence of Cl solubility in silicate melts (Metrich and Rutherford, 1992). Enrichment of melt in Cl at low pressure can result either from crystallization or from interaction between Cl-rich vapor liberated from magma at higher pressures and magma stored at lower pressure, or a combination of both processes. The higher values measured are close to the measured solubility of Cl in hydrous rhyolite melts in equilibrium with a NaCl-KCl-H2O vapor (Shinohara and others, 1989). Metrich and Rutherford (1992) report slightly higher values, probably attributable to subtle differences in rhyolite starting composition. The fact that the measured solubilities lie at the upper end of the mea-sured Cl contents strongly suggests that the 1980–86 Mount St. Helens melts were at or close to saturation with Cl-bearing vapor. However, this does not imply high pCl2
(or pHCl2) in
the vapor phase. For example, the Cl-saturated 60–120-MPa experiments of Shinohara and others (1989) involve fluids with Cl molalities as low as 1, which equates to a mole frac-tion of Cl in an H2O-rich vapor of less than 2 percent. Thus the contribution of pCl2
(or pHCl) to Ptot is negligible. We note that at pressures of ≤120 MPa the experiments of Shinohara and oth-ers (1989) show evidence for exsolution of a dense brine phase from the vapor. Thus it is possible that the Mount St. Helens melt inclusions from 1980–86 trapped at pH2O
<120 MPa were also brine saturated, which has implications for the chemical signature of fumarole gases released at the surface. Chlorine contents of two glasses from the current eruption plot at the lower end of the 1980–86 range (≤0.06 percent; fig. 6A).
The fluorine content of the glasses ranges from the EMPA detection limit of ~0.1 weight percent up to 0.5 weight percent (fig. 6B). No F was detected in the two melt inclusions from the current eruption with elevated H2O contents. There is considerable scatter in the data, largely a consequence of low count rates for F at the analytical conditions. Overall, however, F contents are similar to Cl in any given melt inclusion and show a similar slight tendency for increase in F with decreas-ing pH2O
. Fluorine contents are below the experimentally determined fluorite solubility of Dolejš and Baker (2006) and Price and others (1999).
Concentrations of SO2 (fig. 6C) are typically less than 0.1 percent, with only two melt inclusions having significantly higher concentrations. Surprisingly, the highest SO2 concentra-tions are observed at lower pressures, and mostly in post-May 18 samples. The highest values of SO2 lie at pH2O
of 50–150 MPa, suggesting that S may be concentrated in the upper reaches of the subvolcanic plumbing system. The solubility and speciation of S in silicate melts depend on pressure, tem-perature, fO2
, fS2, and melt composition (see, for example, Car-
roll and Rutherford, 1985; Luhr, 1990; Clemente and others, 2004; Scaillet and Pichavant, 2005). For the May 18 plinian eruption of Mount St. Helens, Whitney (1984) calculated fH2S
= 3.3 MPa and fSO2 = 2.0 MPa, indicating that the contribution
of sulfur species to the overall fluid pressure is small. Sulfur dioxide contents of melt inclusions from the current eruption are similar to the lower values from 1980–86.
Concentrations of CO2 in melt inclusions were not mea-sured routinely as part of this study. Even small amounts of dissolved CO2 equate to significant partial pressures, however, because of its low solubility in rhyolitic melts. Thus know-ing CO2 concentrations is a prerequisite for converting pH2O
to Ptot and thence to depth. Many of the characteristics of the 1980–86 eruption are consistent with volatile-saturated dacite magma (Rutherford and others, 1985), but the coexisting vapor need not be pure H2O. Recently we have measured CO2 concentrations in bubble-free melt inclusions from the May 18 plinian eruption and the August 7, 1980, eruption using ion microprobe analysis of 12C calibrated against a working curve consisting of rhyolite and andesite glasses of known CO2 content. The data and analytical method will be described in detail elsewhere. However, we note here that the analyzed melt inclusions do contain detectable CO2. The most H2O-rich

33. Evolving Magma Storage Conditions Beneath Mount St. Helens Inferred from Chemical Variations in Melt Inclusions 771
0
50
100
150
200
2500 0.1 0.2 0.3 0.4
0
50
100
150
200
2500 0.1 0.2 0.3 0.4 0.5
A B
PART
IAL P
RESS
URE
H 2O
(pH 2
O),
IN M
EGAP
ASCA
LS
Cl, IN WEIGHT PERCENT
PART
IAL P
RESS
URE
H 2O
(pH 2
O),
IN M
EGAP
ASCA
LS
F, IN WEIGHT PERCENT
1980 cryptodomeMay 18, 1980 (plinian)Post-May 18, 19802004–2005 dome
Melt inclusionsExperimental dataEXPLANATION
Metrich and Rutherford, 1992 Shinohara and others, 1989 Cryptodome
May 18, 1980 (plinian)post-May 18, 1980
EXPLANATION
800°C (Dolejš and Baker, 2006) 850°C (Price and others, 1999)
Melt inclusionsExperimental data2004–2005 dome
0
50
100
150
200
2500 0.1 0.2 0.3 0.4 0.5
1980 cryptodomeMay 18, 1980 (plinian)Post-May 18, 19802004–2005 dome
EXPLANATION
Experimental data
Melt inclusions
Po sol. (900°C, FMQ)Anhyd. sol. (900°C, MnO)Po-Anhyd (900°C, NNO)
C
PART
IAL P
RESS
URE
H 2O
(pH 2
O),IN
MEG
APAS
CALS
SO2, IN WEIGHT PERCENT
Figure 6. Concentration of volatile elements in melt inclusions as a function of pH2O, as calculated from H2O contents using VolatileCalc (Newman and Lowenstern, 2002) at 900°C. Data are subdivided on basis of eruption age. Also plotted are experimental solubility data for comparison. A, Chlorine. Experimentally determined Cl solubility in system rhyolite-vapor±brine from Metrich and Rutherford (1992) at 830–850°C and Shinohara (1989) at 810°C. B, Fluorine. Experimentally determined fluorite solubility from Dolejš and Baker (2006) and Price and others (1999). C, Sulfur, expressed as SO2. Experimentally determined pyrrhotite (Po) and anhydrite (Anhyd) solubility at FMQ, NNO, and MnO buffers (Luhr, 1990).
(6.1 percent H2O) melt inclusion of those analyzed for CO2, from May 18, contains 400 ppm CO2. This equates to Ptot of 281 MPa, using the model of Newman and Lowenstern (2002) at 900°C, compared to 216 MPa if only the H2O content is considered. Thus the presence of CO2 contributes 65 MPa to the calculated Ptot. Samples with lower H2O have lower CO2. For example, at 4 percent H2O, the maximum CO2 content is 160 ppm, which equates to Ptot of 140 MPa, compared to 113 MPa for the CO2-free case. The August 7, 1980, melt inclu-sions lie at the low H2O extrapolation of the May 18 samples and extend down to 1.6 percent H2O and 60 ppm CO2, where the incorporation of CO2 increases Ptot from 23 to 31 MPa. We do not yet have any CO2 measurements for melt inclusions in samples of the current eruption.
These preliminary results confirm the conclusions of Rutherford and others (1985) and Rutherford and Devine (1988) that the fluid phase in equilibrium with the May 18, 1980, magma was a mixed H2O-CO2-SO2-H2S fluid. On the basis of experimental determination of phase relations and composition, they proposed a preeruptive equilibration pressure (Ptot) for the May 18 plinian magma of ~220 MPa with XH2O
in the fluid of 0.67. Our most H2O- and CO2-rich melt-inclusion analysis from this eruption corresponds to Ptot=281 MPa and XH2O
≈0.8. As pressure decreases, our preliminary data show that XH2O
remains approximately constant, suggestive of nearly closed-system degassing with high bubble fractions (Newman and Lowenstern, 2002) or gas streaming through the magma system, buffering XH2O (Rust and others, 2004).
772 A Volcano Rekindled: The Renewed Eruption of Mount St. Helens, 2004−2006
Without CO2 data for all of the analyzed melt inclusions, it is impossible to calculate Ptot for each one. However, we can use the preliminary results for CO2 to bracket the cor-rection required to convert pH2O to Ptot. We will assume that XH2O = 0.8 for all melt inclusions and use the model of New-man and Lowenstern (2002) to derive a relation between pH2O (calculated CO2 free) and Ptot (calculated at measured H2O and XH2O = 0.8). This simple procedure gives the following empirical correction for the presence of CO2:
Ptot = 1.287 × pH2O . (1)
The maximum Ptot for any melt inclusion in table 2, calculated in this way, is 248×1.287 = 319 MPa. In the follow-ing discussion we will use both pH2O and Ptot (calculated from equation 1) as the ordinate axes for plotting.
LithiumOne of the most striking geochemical features of Mount
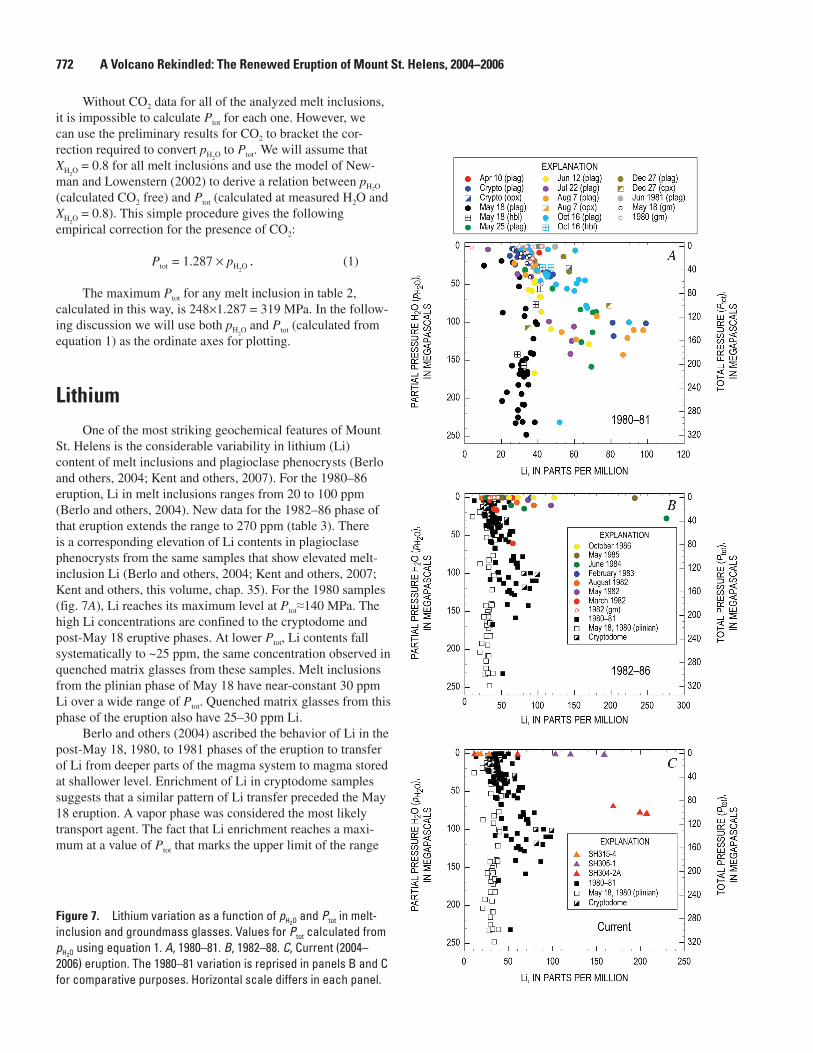
St. Helens is the considerable variability in lithium (Li) content of melt inclusions and plagioclase phenocrysts (Berlo and others, 2004; Kent and others, 2007). For the 1980–86 eruption, Li in melt inclusions ranges from 20 to 100 ppm (Berlo and others, 2004). New data for the 1982–86 phase of that eruption extends the range to 270 ppm (table 3). There is a corresponding elevation of Li contents in plagioclase phenocrysts from the same samples that show elevated melt-inclusion Li (Berlo and others, 2004; Kent and others, 2007; Kent and others, this volume, chap. 35). For the 1980 samples (fig. 7A), Li reaches its maximum level at Ptot≈140 MPa. The high Li concentrations are confined to the cryptodome and post-May 18 eruptive phases. At lower Ptot, Li contents fall systematically to ~25 ppm, the same concentration observed in quenched matrix glasses from these samples. Melt inclusions from the plinian phase of May 18 have near-constant 30 ppm Li over a wide range of Ptot. Quenched matrix glasses from this phase of the eruption also have 25–30 ppm Li.
Berlo and others (2004) ascribed the behavior of Li in the post-May 18, 1980, to 1981 phases of the eruption to transfer of Li from deeper parts of the magma system to magma stored at shallower level. Enrichment of Li in cryptodome samples suggests that a similar pattern of Li transfer preceded the May 18 eruption. A vapor phase was considered the most likely transport agent. The fact that Li enrichment reaches a maxi-mum at a value of Ptot that marks the upper limit of the range
Figure 7. Lithium variation as a function of pH2O and Ptot in melt-inclusion and groundmass glasses. Values for Ptot calculated from pH2O using equation 1. A, 1980–81. B, 1982–88. C, Current (2004–2006) eruption. The 1980–81 variation is reprised in panels B and C for comparative purposes. Horizontal scale differs in each panel.
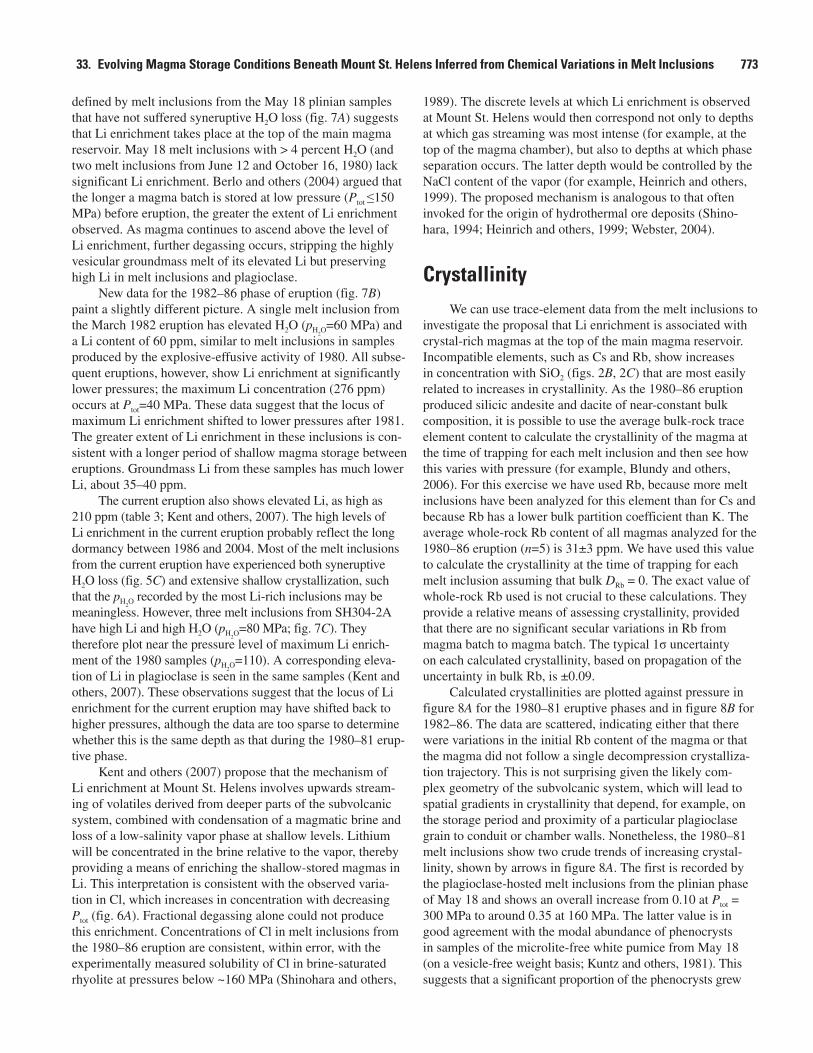
33. Evolving Magma Storage Conditions Beneath Mount St. Helens Inferred from Chemical Variations in Melt Inclusions 773
defined by melt inclusions from the May 18 plinian samples that have not suffered syneruptive H2O loss (fig. 7A) suggests that Li enrichment takes place at the top of the main magma reservoir. May 18 melt inclusions with > 4 percent H2O (and two melt inclusions from June 12 and October 16, 1980) lack significant Li enrichment. Berlo and others (2004) argued that the longer a magma batch is stored at low pressure (Ptot ≤150 MPa) before eruption, the greater the extent of Li enrichment observed. As magma continues to ascend above the level of Li enrichment, further degassing occurs, stripping the highly vesicular groundmass melt of its elevated Li but preserving high Li in melt inclusions and plagioclase.
New data for the 1982–86 phase of eruption (fig. 7B) paint a slightly different picture. A single melt inclusion from the March 1982 eruption has elevated H2O (pH2O
=60 MPa) and a Li content of 60 ppm, similar to melt inclusions in samples produced by the explosive-effusive activity of 1980. All subse-quent eruptions, however, show Li enrichment at significantly lower pressures; the maximum Li concentration (276 ppm) occurs at Ptot=40 MPa. These data suggest that the locus of maximum Li enrichment shifted to lower pressures after 1981. The greater extent of Li enrichment in these inclusions is con-sistent with a longer period of shallow magma storage between eruptions. Groundmass Li from these samples has much lower Li, about 35–40 ppm.
The current eruption also shows elevated Li, as high as 210 ppm (table 3; Kent and others, 2007). The high levels of Li enrichment in the current eruption probably reflect the long dormancy between 1986 and 2004. Most of the melt inclusions from the current eruption have experienced both syneruptive H2O loss (fig. 5C) and extensive shallow crystallization, such that the pH2O
recorded by the most Li-rich inclusions may be meaningless. However, three melt inclusions from SH304-2A have high Li and high H2O (pH2O
=80 MPa; fig. 7C). They therefore plot near the pressure level of maximum Li enrich-ment of the 1980 samples (pH2O
=110). A corresponding eleva-tion of Li in plagioclase is seen in the same samples (Kent and others, 2007). These observations suggest that the locus of Li enrichment for the current eruption may have shifted back to higher pressures, although the data are too sparse to determine whether this is the same depth as that during the 1980–81 erup-tive phase.
Kent and others (2007) propose that the mechanism of Li enrichment at Mount St. Helens involves upwards stream-ing of volatiles derived from deeper parts of the subvolcanic system, combined with condensation of a magmatic brine and loss of a low-salinity vapor phase at shallow levels. Lithium will be concentrated in the brine relative to the vapor, thereby providing a means of enriching the shallow-stored magmas in Li. This interpretation is consistent with the observed varia-tion in Cl, which increases in concentration with decreasing Ptot (fig. 6A). Fractional degassing alone could not produce this enrichment. Concentrations of Cl in melt inclusions from the 1980–86 eruption are consistent, within error, with the experimentally measured solubility of Cl in brine-saturated rhyolite at pressures below ~160 MPa (Shinohara and others,
1989). The discrete levels at which Li enrichment is observed at Mount St. Helens would then correspond not only to depths at which gas streaming was most intense (for example, at the top of the magma chamber), but also to depths at which phase separation occurs. The latter depth would be controlled by the NaCl content of the vapor (for example, Heinrich and others, 1999). The proposed mechanism is analogous to that often invoked for the origin of hydrothermal ore deposits (Shino-hara, 1994; Heinrich and others, 1999; Webster, 2004).
CrystallinityWe can use trace-element data from the melt inclusions to
investigate the proposal that Li enrichment is associated with crystal-rich magmas at the top of the main magma reservoir. Incompatible elements, such as Cs and Rb, show increases in concentration with SiO2 (figs. 2B, 2C) that are most easily related to increases in crystallinity. As the 1980–86 eruption produced silicic andesite and dacite of near-constant bulk composition, it is possible to use the average bulk-rock trace element content to calculate the crystallinity of the magma at the time of trapping for each melt inclusion and then see how this varies with pressure (for example, Blundy and others, 2006). For this exercise we have used Rb, because more melt inclusions have been analyzed for this element than for Cs and because Rb has a lower bulk partition coefficient than K. The average whole-rock Rb content of all magmas analyzed for the 1980–86 eruption (n=5) is 31±3 ppm. We have used this value to calculate the crystallinity at the time of trapping for each melt inclusion assuming that bulk DRb = 0. The exact value of whole-rock Rb used is not crucial to these calculations. They provide a relative means of assessing crystallinity, provided that there are no significant secular variations in Rb from magma batch to magma batch. The typical 1σ uncertainty on each calculated crystallinity, based on propagation of the uncertainty in bulk Rb, is ±0.09.
Calculated crystallinities are plotted against pressure in figure 8A for the 1980–81 eruptive phases and in figure 8B for 1982–86. The data are scattered, indicating either that there were variations in the initial Rb content of the magma or that the magma did not follow a single decompression crystalliza-tion trajectory. This is not surprising given the likely com-plex geometry of the subvolcanic system, which will lead to spatial gradients in crystallinity that depend, for example, on the storage period and proximity of a particular plagioclase grain to conduit or chamber walls. Nonetheless, the 1980–81 melt inclusions show two crude trends of increasing crystal-linity, shown by arrows in figure 8A. The first is recorded by the plagioclase-hosted melt inclusions from the plinian phase of May 18 and shows an overall increase from 0.10 at Ptot = 300 MPa to around 0.35 at 160 MPa. The latter value is in good agreement with the modal abundance of phenocrysts in samples of the microlite-free white pumice from May 18 (on a vesicle-free weight basis; Kuntz and others, 1981). This suggests that a significant proportion of the phenocrysts grew
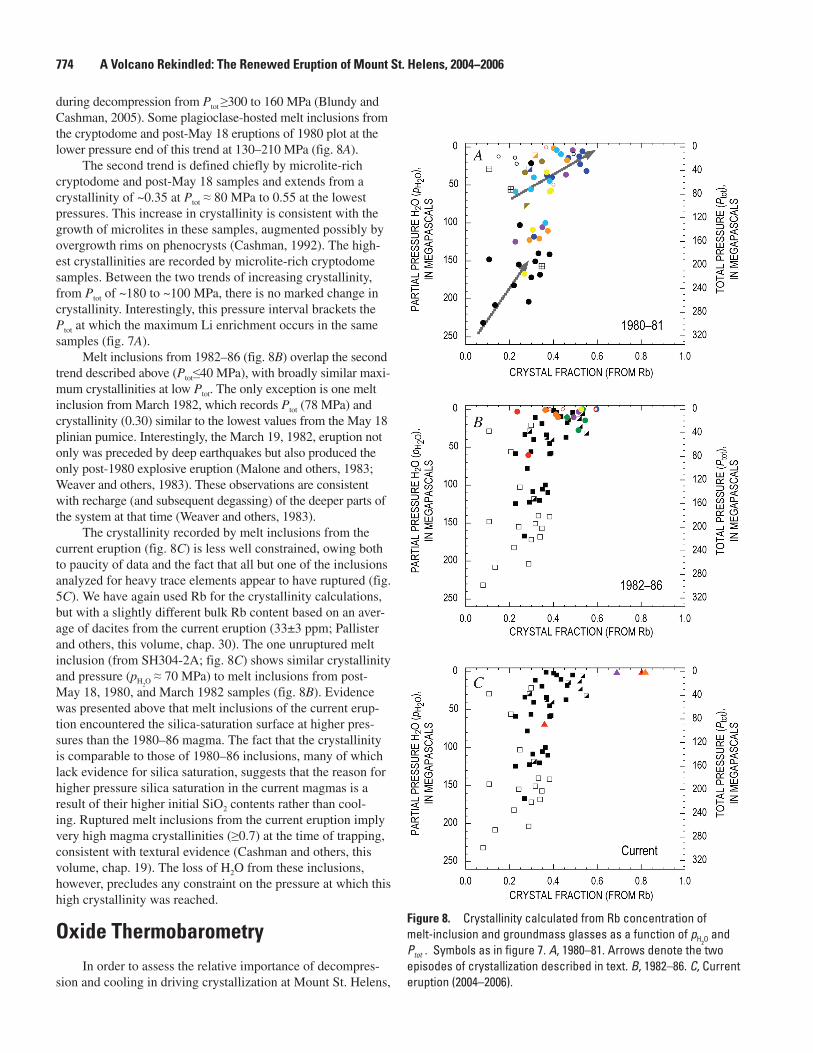
774 A Volcano Rekindled: The Renewed Eruption of Mount St. Helens, 2004−2006
during decompression from Ptot ≥300 to 160 MPa (Blundy and Cashman, 2005). Some plagioclase-hosted melt inclusions from the cryptodome and post-May 18 eruptions of 1980 plot at the lower pressure end of this trend at 130–210 MPa (fig. 8A).
The second trend is defined chiefly by microlite-rich cryptodome and post-May 18 samples and extends from a crystallinity of ~0.35 at Ptot ≈ 80 MPa to 0.55 at the lowest pressures. This increase in crystallinity is consistent with the growth of microlites in these samples, augmented possibly by overgrowth rims on phenocrysts (Cashman, 1992). The high-est crystallinities are recorded by microlite-rich cryptodome samples. Between the two trends of increasing crystallinity, from Ptot of ~180 to ~100 MPa, there is no marked change in crystallinity. Interestingly, this pressure interval brackets the Ptot at which the maximum Li enrichment occurs in the same samples (fig. 7A).
Melt inclusions from 1982–86 (fig. 8B) overlap the second trend described above (Ptot≤40 MPa), with broadly similar maxi-mum crystallinities at low Ptot. The only exception is one melt inclusion from March 1982, which records Ptot (78 MPa) and crystallinity (0.30) similar to the lowest values from the May 18 plinian pumice. Interestingly, the March 19, 1982, eruption not only was preceded by deep earthquakes but also produced the only post-1980 explosive eruption (Malone and others, 1983; Weaver and others, 1983). These observations are consistent with recharge (and subsequent degassing) of the deeper parts of the system at that time (Weaver and others, 1983).
The crystallinity recorded by melt inclusions from the current eruption (fig. 8C) is less well constrained, owing both to paucity of data and the fact that all but one of the inclusions analyzed for heavy trace elements appear to have ruptured (fig. 5C). We have again used Rb for the crystallinity calculations, but with a slightly different bulk Rb content based on an aver-age of dacites from the current eruption (33±3 ppm; Pallister and others, this volume, chap. 30). The one unruptured melt inclusion (from SH304-2A; fig. 8C) shows similar crystallinity and pressure (pH2O
≈ 70 MPa) to melt inclusions from post-May 18, 1980, and March 1982 samples (fig. 8B). Evidence was presented above that melt inclusions of the current erup-tion encountered the silica-saturation surface at higher pres-sures than the 1980–86 magma. The fact that the crystallinity is comparable to those of 1980–86 inclusions, many of which lack evidence for silica saturation, suggests that the reason for higher pressure silica saturation in the current magmas is a result of their higher initial SiO2 contents rather than cool-ing. Ruptured melt inclusions from the current eruption imply very high magma crystallinities (≥0.7) at the time of trapping, consistent with textural evidence (Cashman and others, this volume, chap. 19). The loss of H2O from these inclusions, however, precludes any constraint on the pressure at which this high crystallinity was reached.
Oxide ThermobarometryIn order to assess the relative importance of decompres-
sion and cooling in driving crystallization at Mount St. Helens,
Figure 8. Crystallinity calculated from Rb concentration of melt-inclusion and groundmass glasses as a function of pH2O and Ptot . Symbols as in figure 7. A, 1980–81. Arrows denote the two episodes of crystallization described in text. B, 1982–86. C, Current eruption (2004–2006).
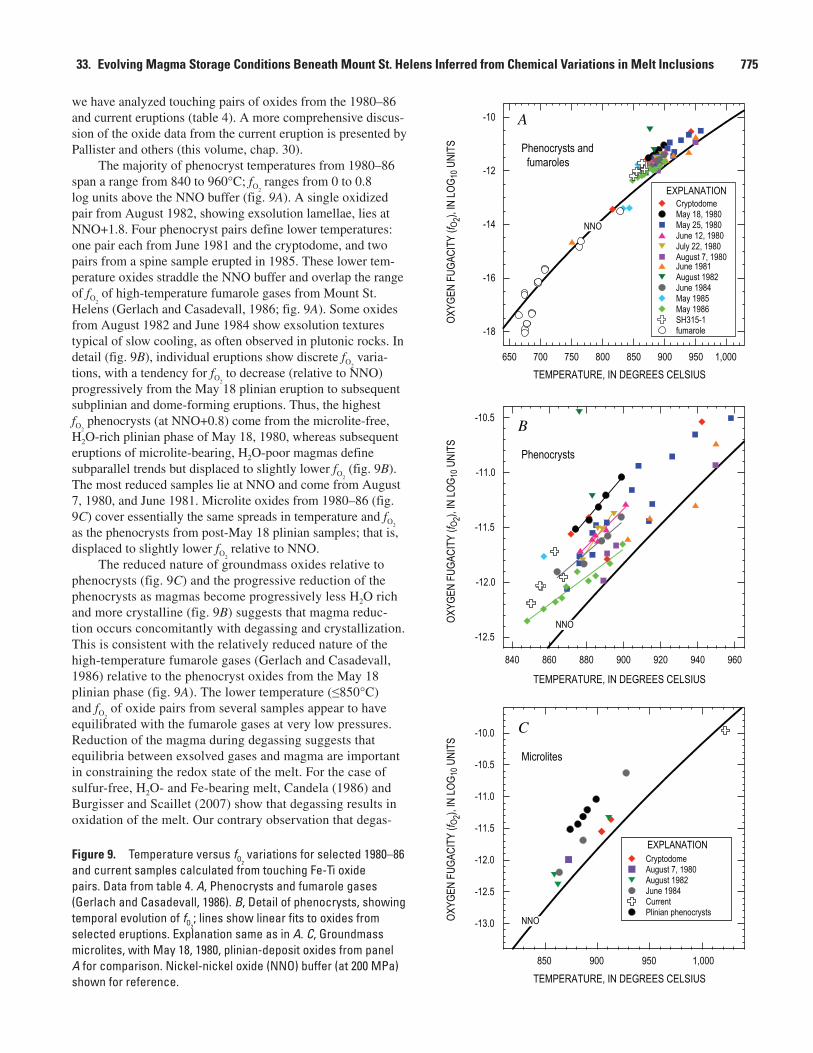
33. Evolving Magma Storage Conditions Beneath Mount St. Helens Inferred from Chemical Variations in Melt Inclusions 775
we have analyzed touching pairs of oxides from the 1980–86 and current eruptions (table 4). A more comprehensive discus-sion of the oxide data from the current eruption is presented by Pallister and others (this volume, chap. 30).
The majority of phenocryst temperatures from 1980–86 span a range from 840 to 960°C; fO2
ranges from 0 to 0.8 log units above the NNO buffer (fig. 9A). A single oxidized pair from August 1982, showing exsolution lamellae, lies at NNO+1.8. Four phenocryst pairs define lower temperatures: one pair each from June 1981 and the cryptodome, and two pairs from a spine sample erupted in 1985. These lower tem-perature oxides straddle the NNO buffer and overlap the range of fO2
of high-temperature fumarole gases from Mount St. Helens (Gerlach and Casadevall, 1986; fig. 9A). Some oxides from August 1982 and June 1984 show exsolution textures typical of slow cooling, as often observed in plutonic rocks. In detail (fig. 9B), individual eruptions show discrete fO2
varia-tions, with a tendency for fO2
to decrease (relative to NNO) progressively from the May 18 plinian eruption to subsequent subplinian and dome-forming eruptions. Thus, the highest fO2
phenocrysts (at NNO+0.8) come from the microlite-free, H2O-rich plinian phase of May 18, 1980, whereas subsequent eruptions of microlite-bearing, H2O-poor magmas define subparallel trends but displaced to slightly lower fO2
(fig. 9B). The most reduced samples lie at NNO and come from August 7, 1980, and June 1981. Microlite oxides from 1980–86 (fig. 9C) cover essentially the same spreads in temperature and fO2
as the phenocrysts from post-May 18 plinian samples; that is, displaced to slightly lower fO2
relative to NNO.The reduced nature of groundmass oxides relative to
phenocrysts (fig. 9C) and the progressive reduction of the phenocrysts as magmas become progressively less H2O rich and more crystalline (fig. 9B) suggests that magma reduc-tion occurs concomitantly with degassing and crystallization. This is consistent with the relatively reduced nature of the high-temperature fumarole gases (Gerlach and Casadevall, 1986) relative to the phenocryst oxides from the May 18 plinian phase (fig. 9A). The lower temperature (≤850°C) and fO2
of oxide pairs from several samples appear to have equilibrated with the fumarole gases at very low pressures. Reduction of the magma during degassing suggests that equilibria between exsolved gases and magma are important in constraining the redox state of the melt. For the case of sulfur-free, H2O- and Fe-bearing melt, Candela (1986) and Burgisser and Scaillet (2007) show that degassing results in oxidation of the melt. Our contrary observation that degas-
-18
-16
-14
-12
-10
CryptodomeEXPLANATION
May 18, 1980May 25, 1980June 12, 1980July 22, 1980August 7, 1980June 1981August 1982June 1984May 1985May 1986SH315-1fumarole
650 700 750 800 850 900 950 1,000
NNO
TEMPERATURE, IN DEGREES CELSIUS
TEMPERATURE, IN DEGREES CELSIUS
TEMPERATURE, IN DEGREES CELSIUS
-12.5
-12.0
-11.5
-11.0
-10.5
840 860 880 900 920 940 960
NNO
-13.0
-12.5
-12.0
-11.5
-11.0
-10.5
-10.0
CryptodomeAugust 7, 1980August 1982June 1984CurrentPlinian phenocrysts
850 900 950 1,000
NNO
A
B
C
OXYG
EN F
UGAC
ITY
(f O2),
IN LO
G 10 U
NITS
OXYG
EN F
UGAC
ITY
(f O2),
IN LO
G 10 U
NITS
OXYG
EN F
UGAC
ITY
(f O2),
IN LO
G 10 U
NITS Phenocrysts and
fumaroles
Phenocrysts
Microlites
EXPLANATIONFigure 9. Temperature versus fO2
variations for selected 1980–86 and current samples calculated from touching Fe-Ti oxide pairs. Data from table 4. A, Phenocrysts and fumarole gases (Gerlach and Casadevall, 1986). B, Detail of phenocrysts, showing temporal evolution of fO2
; lines show linear fits to oxides from selected eruptions. Explanation same as in A. C, Groundmass microlites, with May 18, 1980, plinian-deposit oxides from panel A for comparison. Nickel-nickel oxide (NNO) buffer (at 200 MPa) shown for reference.
776 A Volcano Rekindled: The Renewed Eruption of Mount St. Helens, 2004−2006
sing leads to reduction of the melt is consistent with the pres-ence of reduced sulfur (S2-) in the melt, and the degassing equilibrium (Whitney, 1984; Candela, 1986; Burgisser and Scaillet, 2007):6Fe2O3(melt) + 3S2-(melt) = 12FeO(melt) + 3SO2(vap).
The magnitude of the observed reduction (≤0.7 log units in fO2
) is consistent with the thermodynamic calculations of Burgisser and Scaillet (2007) for degassing and ascent of sulfur-rich, relatively oxidized (NNO+1) silicic magma.
The process of reduction can also account for the observed increase in melt sulfur contents at lower pressures (fig. 6C). For example, the experimental data of Clemente and others (2004) show that a modest decrease in fO2
from NNO+1 to NNO increases sulfur solubility in rhyolite melt by a factor of three.
Following Blundy and others (2006), we consider the phenocryst temperature spread in figure 9B to reflect real temperature variations within the magma body. The preserva-tion of the spread indicates that there was insufficient time for all oxides to fully equilibrate to changing temperatures before eruption. Possible causes of the spread include injection of new magma from depth into the system, loss of heat to wall rocks during magma storage, and latent heat release during decompression crystallization. Blundy and others (2006) argue that the latter process, which amounts to ~2.5°C for each 1 percent crystallized, dominates during isenthalpic magma ascent. This explains why microlite-bearing samples with the highest crystallinities tend to have the highest maximum temperatures. Interestingly, the highest temperatures, and largest range of temperatures, are found in a May 25, 1980, pumice sample (fig. 9B) that shows evidence of extensive, very shallow crystallization. Extensive crystallization, coupled with a short repose interval (one week), would limit the extent to which the shallow magma could thermally reequilibrate after the rapid crystallization pulse. The profound effect of late-stage heating indicates that the most reliable estimate of temperature in the deep magma body that fueled the May 18 plinian event lies at the low temperature end of the spread, that is, ~870°C, in good agreement with the estimate (880±10°C) of Venezky and Rutherford (1999) but somewhat lower than earlier estimates by Melson and Hopson (1981) and Ruther-ford and others (1985).
Temperature estimates from touching phenocrysts in a single sample (SH315-4) of the current eruption are dis-placed to slightly lower temperatures (850–870°C) relative to the main 1980–86 trend as observed by Pallister and others (this volume, chap. 30). A curious feature of SH315-4 is the unusually high temperature (1,020°C) recorded by a single touching microlite pair (fig. 9C). Pallister and others (this volume, chap. 30) also present sparse high Fe-Ti-oxide tem-peratures (≤1,019°C) from other samples of the current erup-tion. These data raise the possibility of some recharge of the magma system by hotter magma at depth. Alternatively, they could result from significant latent-heat release as ascending magmas undergo rapid and considerable crystallization (Pal-lister and others, this volume, chap. 30).
Temporal Variations
In this section we track temporal trends in several parame-ters at Mount St. Helens since March 17, 1980, the approximate date on which the first seismic activity was observed (Endo and others, 1990), in order to investigate evolving magma-storage conditions beneath the volcano. The most useful parameters to examine in time series are: (1) the volatile elements H2O, SO2, and Cl (fig. 10), which monitor changes in degassing; (2) the major elements K2O, MgO, and TiO2 (fig. 11), which monitor variations in crystallinity and the arrival of new, less-evolved magma batches; and (3) temperature and fO2
(fig. 12), which monitor cooling (or heating) and redox conditions.
There is an overall drop in the maximum H2O content of melt inclusions with time, from a maximum of nearly 7 per-cent during the plinian phase of May 18, 1980, to almost zero in 1986 (fig. 10A). Maximum H2O content of groundmass glass decreases from 2.2 to 0 percent over the same period. In general, explosive eruptions are characterized by melt inclu-sions with high H2O contents, whereas effusive eruptions are characterized by low-H2O inclusions. This strongly suggests a relation between magma storage conditions and eruptive style. In detail, the decrease in maximum H2O content with time is nonlinear and appears to describe a crude sawtooth cyclic pattern in which abrupt peaks in H2O are followed by a steady fall. Although this may in part be an artifact of sample size, our attempts to analyze the most H2O-rich melt inclu-sions from each sample using SEM screening, as described above, suggest that this variability is real. Peaks are observed on May 18, 1980 (plinian eruption), March 19, 1982, and June 17, 1984. It is unclear whether the single H2O-rich melt inclusion from October 16, 1980, represents a peak or simply an inherited crystal from an earlier eruption. The three peaks delineate cycles in eruptive behavior. The first cycle started with the plinian eruption on May 18, after which a steady decrease in magma supply rate led to increasingly short explosive eruptions that finally changed to discrete effusive events (Scandone and Malone, 1985). The second cycle initi-ated with an explosive eruption on March 19, 1982, preceded and accompanied by deep earthquakes, after an unusually long repose interval of 5 months. This cycle then evolved to a year (February 1983–February 1984) of continuous slow magma effusion and endogenous dome growth. The third cycle began with renewal of discrete extrusive dome growth events in March 1984 (although the first sample we have of this cycle was collected in June 1984) and continued until the end of effusive activity in 1986. This cyclicity suggests that changes in eruptive activity in March 1982 and March 1984 may reflect new inputs of magma. There are too few melt-inclusion data from the current eruption to discern any trend.
Chlorine shows the opposite behavior with time to H2O, with an overall increase in Cl from May 18, 1980, to 1986 (fig. 10B). This is consistent with the increase in solubility of Cl with decreasing pH2O (for example, fig. 6A). As is the case for H2O, the change in Cl is nonlinear with time and appears to
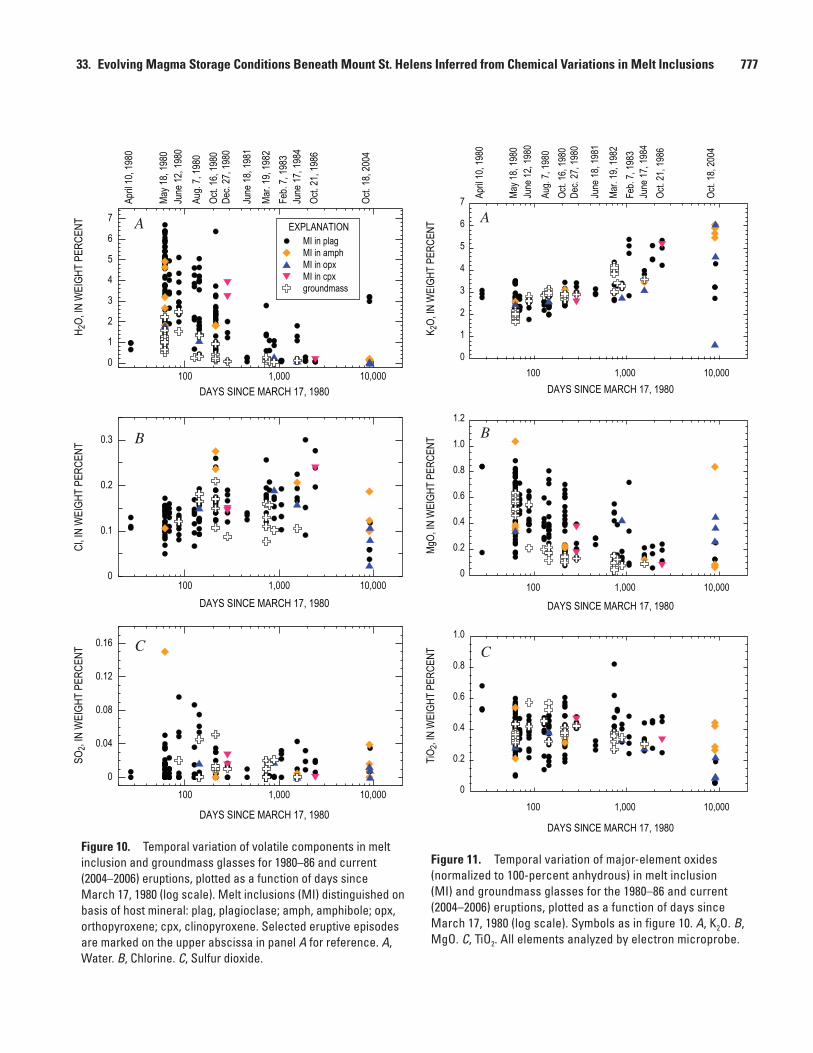
33. Evolving Magma Storage Conditions Beneath Mount St. Helens Inferred from Chemical Variations in Melt Inclusions 777
MI in plagEXPLANATION
MI in amphMI in opxMI in cpxgroundmass
DAYS SINCE MARCH 17, 1980
DAYS SINCE MARCH 17, 1980
DAYS SINCE MARCH 17, 1980
April
10, 1
980
Feb.
7, 19
83
Oct. 2
1, 19
86Ju
ne 17
, 198
4
Mar.
19, 1
982
June
18, 1
981
Dec.
27, 1
980
Oct. 1
6, 19
80Au
g. 7,
1980
June
12, 1
980
May 1
8, 19
80
Oct. 1
8, 20
04
A
B
C
0
1
2
3
4
5
6
7
100 1,000 10,000
0
0.1
0.2
0.3
100 1,000 10,000
0
0.04
0.08
0.12
0.16
100 1,000 10,000
SO2,
IN W
EIGH
T PE
RCEN
TH 2
O, IN
WEI
GHT
PERC
ENT
Cl, IN
WEI
GHT
PERC
ENT
0
1
2
3
4
5
6
7
0
0.2
0.4
0.6
0.8
1.0
1.2
0
0.2
0.4
0.6
0.8
1.0
A
B
C
DAYS SINCE MARCH 17, 1980
DAYS SINCE MARCH 17, 1980
DAYS SINCE MARCH 17, 1980
100 1,000 10,000
100 1,000 10,000
100 1,000 10,000
TiO2,
IN W
EIGH
T PE
RCEN
TK 2
O, IN
WEI
GHT
PERC
ENT
MgO,
IN W
EIGH
T PE
RCEN
T
April
10, 1
980
Feb.
7, 19
83
Oct. 2
1, 19
86Ju
ne 17
, 198
4
Mar.
19, 1
982
June
18, 1
981
Dec.
27, 1
980
Oct. 1
6, 19
80Au
g. 7,
1980
June
12, 1
980
May 1
8, 19
80
Oct. 1
8, 20
04
Figure 10. Temporal variation of volatile components in melt inclusion and groundmass glasses for 1980–86 and current (2004–2006) eruptions, plotted as a function of days since March 17, 1980 (log scale). Melt inclusions (MI) distinguished on basis of host mineral: plag, plagioclase; amph, amphibole; opx, orthopyroxene; cpx, clinopyroxene. Selected eruptive episodes are marked on the upper abscissa in panel A for reference. A, Water. B, Chlorine. C, Sulfur dioxide.
Figure 11. Temporal variation of major-element oxides (normalized to 100-percent anhydrous) in melt inclusion (MI) and groundmass glasses for the 1980–86 and current (2004–2006) eruptions, plotted as a function of days since March 17, 1980 (log scale). Symbols as in figure 10. A, K2O. B, MgO. C, TiO2. All elements analyzed by electron microprobe.
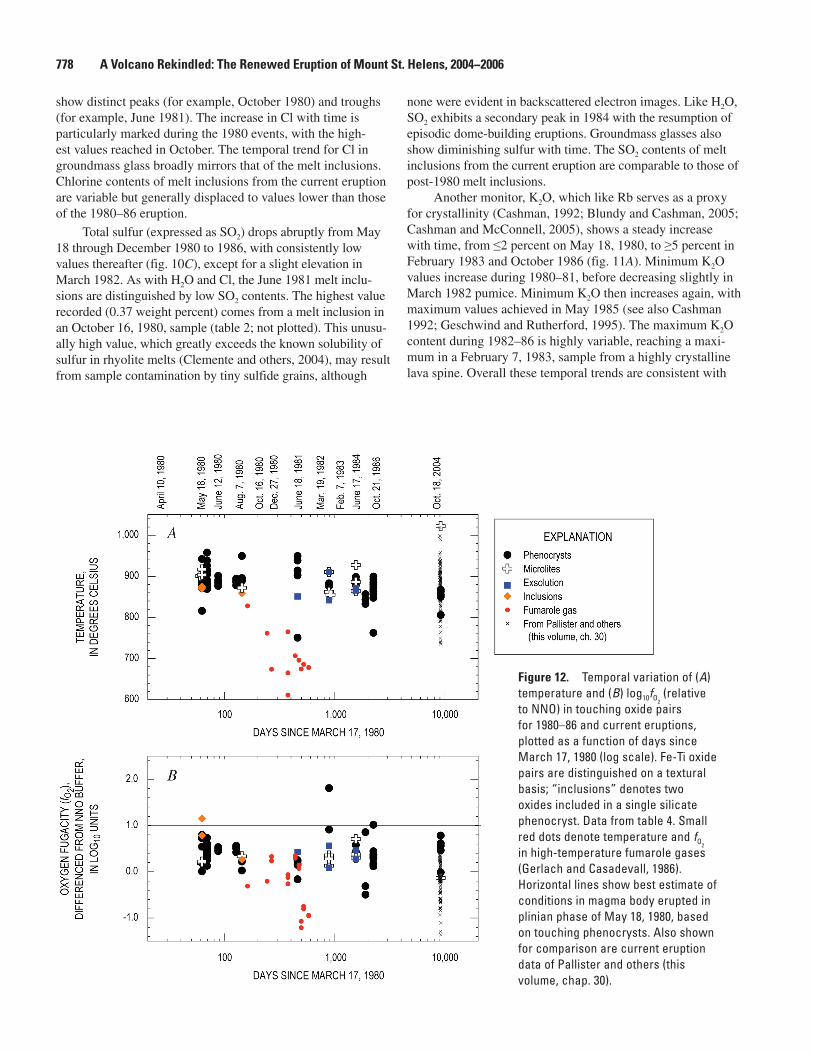
778 A Volcano Rekindled: The Renewed Eruption of Mount St. Helens, 2004−2006
Figure 12. Temporal variation of (A) temperature and (B) log10fO2
(relative to NNO) in touching oxide pairs for 1980–86 and current eruptions, plotted as a function of days since March 17, 1980 (log scale). Fe-Ti oxide pairs are distinguished on a textural basis; “inclusions” denotes two oxides included in a single silicate phenocryst. Data from table 4. Small red dots denote temperature and fO2
in high-temperature fumarole gases (Gerlach and Casadevall, 1986). Horizontal lines show best estimate of conditions in magma body erupted in plinian phase of May 18, 1980, based on touching phenocrysts. Also shown for comparison are current eruption data of Pallister and others (this volume, chap. 30).
show distinct peaks (for example, October 1980) and troughs (for example, June 1981). The increase in Cl with time is particularly marked during the 1980 events, with the high-est values reached in October. The temporal trend for Cl in groundmass glass broadly mirrors that of the melt inclusions. Chlorine contents of melt inclusions from the current eruption are variable but generally displaced to values lower than those of the 1980–86 eruption.
Total sulfur (expressed as SO2) drops abruptly from May 18 through December 1980 to 1986, with consistently low values thereafter (fig. 10C), except for a slight elevation in March 1982. As with H2O and Cl, the June 1981 melt inclu-sions are distinguished by low SO2 contents. The highest value recorded (0.37 weight percent) comes from a melt inclusion in an October 16, 1980, sample (table 2; not plotted). This unusu-ally high value, which greatly exceeds the known solubility of sulfur in rhyolite melts (Clemente and others, 2004), may result from sample contamination by tiny sulfide grains, although
none were evident in backscattered electron images. Like H2O, SO2 exhibits a secondary peak in 1984 with the resumption of episodic dome-building eruptions. Groundmass glasses also show diminishing sulfur with time. The SO2 contents of melt inclusions from the current eruption are comparable to those of post-1980 melt inclusions.
Another monitor, K2O, which like Rb serves as a proxy for crystallinity (Cashman, 1992; Blundy and Cashman, 2005; Cashman and McConnell, 2005), shows a steady increase with time, from ≤2 percent on May 18, 1980, to ≥5 percent in February 1983 and October 1986 (fig. 11A). Minimum K2O values increase during 1980–81, before decreasing slightly in March 1982 pumice. Minimum K2O then increases again, with maximum values achieved in May 1985 (see also Cashman 1992; Geschwind and Rutherford, 1995). The maximum K2O content during 1982–86 is highly variable, reaching a maxi-mum in a February 7, 1983, sample from a highly crystalline lava spine. Overall these temporal trends are consistent with
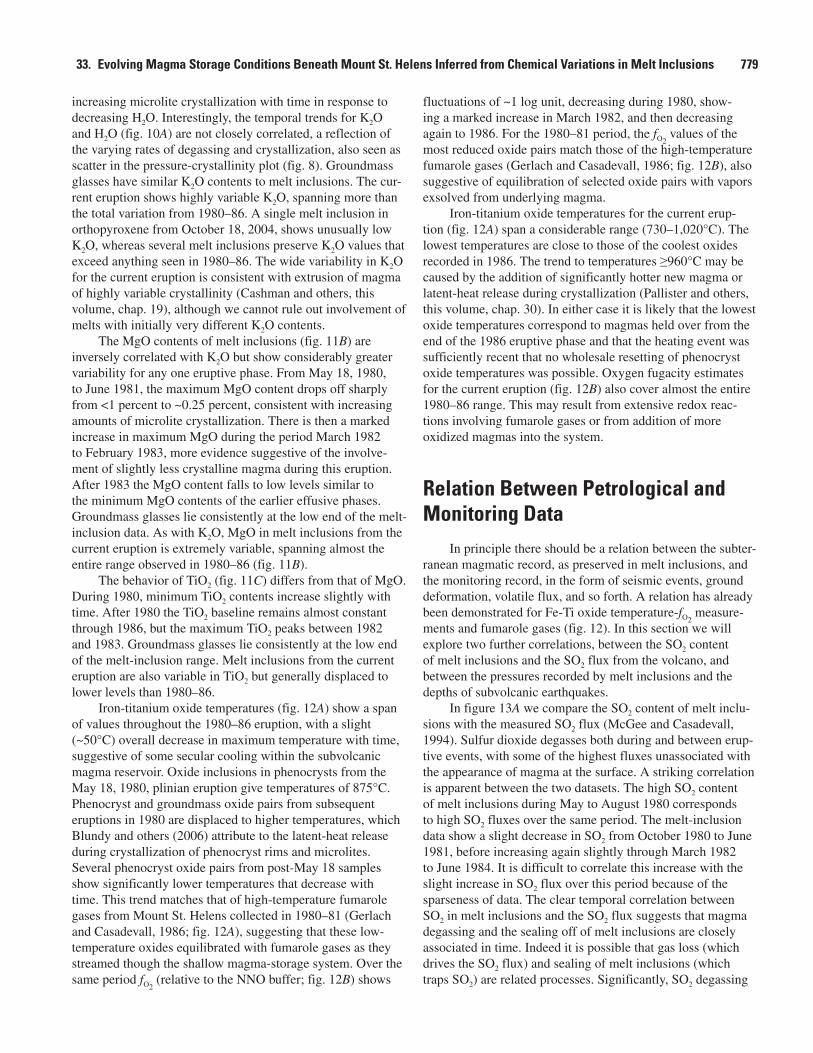
33. Evolving Magma Storage Conditions Beneath Mount St. Helens Inferred from Chemical Variations in Melt Inclusions 779
increasing microlite crystallization with time in response to decreasing H2O. Interestingly, the temporal trends for K2O and H2O (fig. 10A) are not closely correlated, a reflection of the varying rates of degassing and crystallization, also seen as scatter in the pressure-crystallinity plot (fig. 8). Groundmass glasses have similar K2O contents to melt inclusions. The cur-rent eruption shows highly variable K2O, spanning more than the total variation from 1980–86. A single melt inclusion in orthopyroxene from October 18, 2004, shows unusually low K2O, whereas several melt inclusions preserve K2O values that exceed anything seen in 1980–86. The wide variability in K2O for the current eruption is consistent with extrusion of magma of highly variable crystallinity (Cashman and others, this volume, chap. 19), although we cannot rule out involvement of melts with initially very different K2O contents.
The MgO contents of melt inclusions (fig. 11B) are inversely correlated with K2O but show considerably greater variability for any one eruptive phase. From May 18, 1980, to June 1981, the maximum MgO content drops off sharply from <1 percent to ~0.25 percent, consistent with increasing amounts of microlite crystallization. There is then a marked increase in maximum MgO during the period March 1982 to February 1983, more evidence suggestive of the involve-ment of slightly less crystalline magma during this eruption. After 1983 the MgO content falls to low levels similar to the minimum MgO contents of the earlier effusive phases. Groundmass glasses lie consistently at the low end of the melt-inclusion data. As with K2O, MgO in melt inclusions from the current eruption is extremely variable, spanning almost the entire range observed in 1980–86 (fig. 11B).
The behavior of TiO2 (fig. 11C) differs from that of MgO. During 1980, minimum TiO2 contents increase slightly with time. After 1980 the TiO2 baseline remains almost constant through 1986, but the maximum TiO2 peaks between 1982 and 1983. Groundmass glasses lie consistently at the low end of the melt-inclusion range. Melt inclusions from the current eruption are also variable in TiO2 but generally displaced to lower levels than 1980–86.
Iron-titanium oxide temperatures (fig. 12A) show a span of values throughout the 1980–86 eruption, with a slight (~50°C) overall decrease in maximum temperature with time, suggestive of some secular cooling within the subvolcanic magma reservoir. Oxide inclusions in phenocrysts from the May 18, 1980, plinian eruption give temperatures of 875°C. Phenocryst and groundmass oxide pairs from subsequent eruptions in 1980 are displaced to higher temperatures, which Blundy and others (2006) attribute to the latent-heat release during crystallization of phenocryst rims and microlites. Several phenocryst oxide pairs from post-May 18 samples show significantly lower temperatures that decrease with time. This trend matches that of high-temperature fumarole gases from Mount St. Helens collected in 1980–81 (Gerlach and Casadevall, 1986; fig. 12A), suggesting that these low-temperature oxides equilibrated with fumarole gases as they streamed though the shallow magma-storage system. Over the same period fO2
(relative to the NNO buffer; fig. 12B) shows
fluctuations of ~1 log unit, decreasing during 1980, show-ing a marked increase in March 1982, and then decreasing again to 1986. For the 1980–81 period, the fO2
values of the most reduced oxide pairs match those of the high-temperature fumarole gases (Gerlach and Casadevall, 1986; fig. 12B), also suggestive of equilibration of selected oxide pairs with vapors exsolved from underlying magma.
Iron-titanium oxide temperatures for the current erup-tion (fig. 12A) span a considerable range (730–1,020°C). The lowest temperatures are close to those of the coolest oxides recorded in 1986. The trend to temperatures ≥960°C may be caused by the addition of significantly hotter new magma or latent-heat release during crystallization (Pallister and others, this volume, chap. 30). In either case it is likely that the lowest oxide temperatures correspond to magmas held over from the end of the 1986 eruptive phase and that the heating event was sufficiently recent that no wholesale resetting of phenocryst oxide temperatures was possible. Oxygen fugacity estimates for the current eruption (fig. 12B) also cover almost the entire 1980–86 range. This may result from extensive redox reac-tions involving fumarole gases or from addition of more oxidized magmas into the system.
Relation Between Petrological and Monitoring Data
In principle there should be a relation between the subter-ranean magmatic record, as preserved in melt inclusions, and the monitoring record, in the form of seismic events, ground deformation, volatile flux, and so forth. A relation has already been demonstrated for Fe-Ti oxide temperature-fO2
measure-ments and fumarole gases (fig. 12). In this section we will explore two further correlations, between the SO2 content of melt inclusions and the SO2 flux from the volcano, and between the pressures recorded by melt inclusions and the depths of subvolcanic earthquakes.
In figure 13A we compare the SO2 content of melt inclu-sions with the measured SO2 flux (McGee and Casadevall, 1994). Sulfur dioxide degasses both during and between erup-tive events, with some of the highest fluxes unassociated with the appearance of magma at the surface. A striking correlation is apparent between the two datasets. The high SO2 content of melt inclusions during May to August 1980 corresponds to high SO2 fluxes over the same period. The melt-inclusion data show a slight decrease in SO2 from October 1980 to June 1981, before increasing again slightly through March 1982 to June 1984. It is difficult to correlate this increase with the slight increase in SO2 flux over this period because of the sparseness of data. The clear temporal correlation between SO2 in melt inclusions and the SO2 flux suggests that magma degassing and the sealing off of melt inclusions are closely associated in time. Indeed it is possible that gas loss (which drives the SO2 flux) and sealing of melt inclusions (which traps SO2) are related processes. Significantly, SO2 degassing
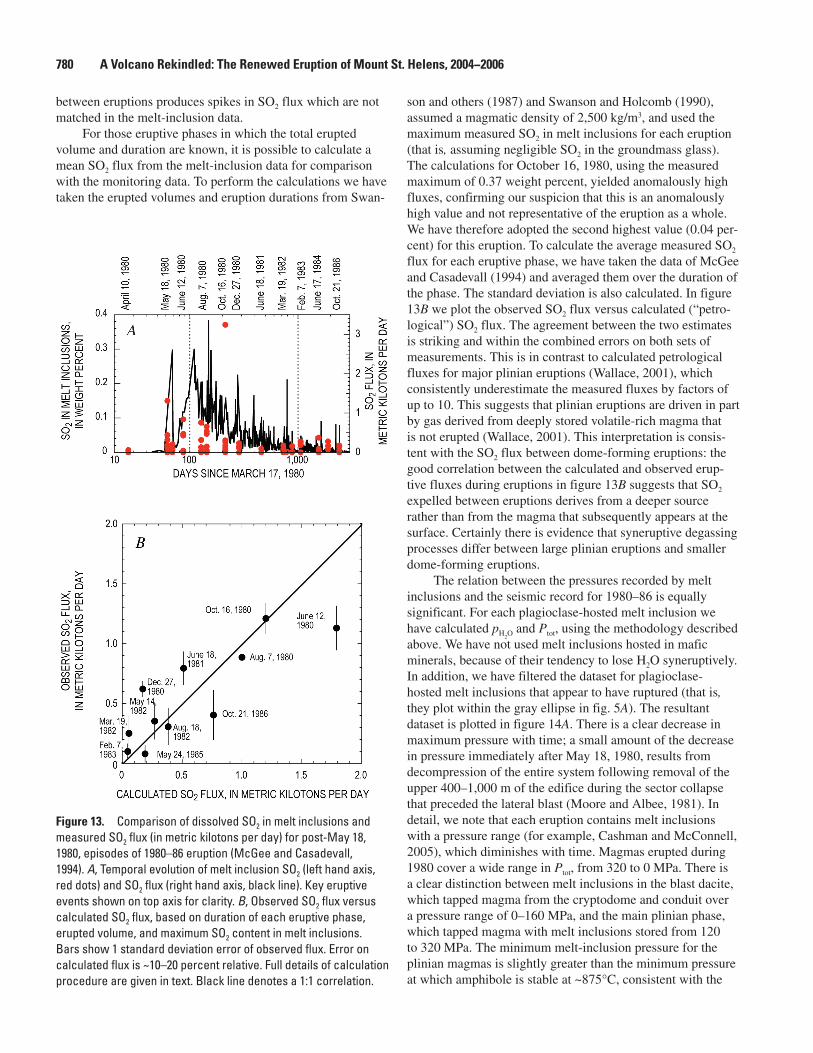
780 A Volcano Rekindled: The Renewed Eruption of Mount St. Helens, 2004−2006
between eruptions produces spikes in SO2 flux which are not matched in the melt-inclusion data.
For those eruptive phases in which the total erupted volume and duration are known, it is possible to calculate a mean SO2 flux from the melt-inclusion data for comparison with the monitoring data. To perform the calculations we have taken the erupted volumes and eruption durations from Swan-
son and others (1987) and Swanson and Holcomb (1990), assumed a magmatic density of 2,500 kg/m3, and used the maximum measured SO2 in melt inclusions for each eruption (that is, assuming negligible SO2 in the groundmass glass). The calculations for October 16, 1980, using the measured maximum of 0.37 weight percent, yielded anomalously high fluxes, confirming our suspicion that this is an anomalously high value and not representative of the eruption as a whole. We have therefore adopted the second highest value (0.04 per-cent) for this eruption. To calculate the average measured SO2 flux for each eruptive phase, we have taken the data of McGee and Casadevall (1994) and averaged them over the duration of the phase. The standard deviation is also calculated. In figure 13B we plot the observed SO2 flux versus calculated (“petro-logical”) SO2 flux. The agreement between the two estimates is striking and within the combined errors on both sets of measurements. This is in contrast to calculated petrological fluxes for major plinian eruptions (Wallace, 2001), which consistently underestimate the measured fluxes by factors of up to 10. This suggests that plinian eruptions are driven in part by gas derived from deeply stored volatile-rich magma that is not erupted (Wallace, 2001). This interpretation is consis-tent with the SO2 flux between dome-forming eruptions: the good correlation between the calculated and observed erup-tive fluxes during eruptions in figure 13B suggests that SO2 expelled between eruptions derives from a deeper source rather than from the magma that subsequently appears at the surface. Certainly there is evidence that syneruptive degassing processes differ between large plinian eruptions and smaller dome-forming eruptions.
The relation between the pressures recorded by melt inclusions and the seismic record for 1980–86 is equally significant. For each plagioclase-hosted melt inclusion we have calculated pH2O and Ptot, using the methodology described above. We have not used melt inclusions hosted in mafic minerals, because of their tendency to lose H2O syneruptively. In addition, we have filtered the dataset for plagioclase-hosted melt inclusions that appear to have ruptured (that is, they plot within the gray ellipse in fig. 5A). The resultant dataset is plotted in figure 14A. There is a clear decrease in maximum pressure with time; a small amount of the decrease in pressure immediately after May 18, 1980, results from decompression of the entire system following removal of the upper 400–1,000 m of the edifice during the sector collapse that preceded the lateral blast (Moore and Albee, 1981). In detail, we note that each eruption contains melt inclusions with a pressure range (for example, Cashman and McConnell, 2005), which diminishes with time. Magmas erupted during 1980 cover a wide range in Ptot, from 320 to 0 MPa. There is a clear distinction between melt inclusions in the blast dacite, which tapped magma from the cryptodome and conduit over a pressure range of 0–160 MPa, and the main plinian phase, which tapped magma with melt inclusions stored from 120 to 320 MPa. The minimum melt-inclusion pressure for the plinian magmas is slightly greater than the minimum pressure at which amphibole is stable at ~875°C, consistent with the
Figure 13. Comparison of dissolved SO2 in melt inclusions and measured SO2 flux (in metric kilotons per day) for post-May 18, 1980, episodes of 1980–86 eruption (McGee and Casadevall, 1994). A, Temporal evolution of melt inclusion SO2 (left hand axis, red dots) and SO2 flux (right hand axis, black line). Key eruptive events shown on top axis for clarity. B, Observed SO2 flux versus calculated SO2 flux, based on duration of each eruptive phase, erupted volume, and maximum SO2 content in melt inclusions. Bars show 1 standard deviation error of observed flux. Error on calculated flux is ~10–20 percent relative. Full details of calculation procedure are given in text. Black line denotes a 1:1 correlation.
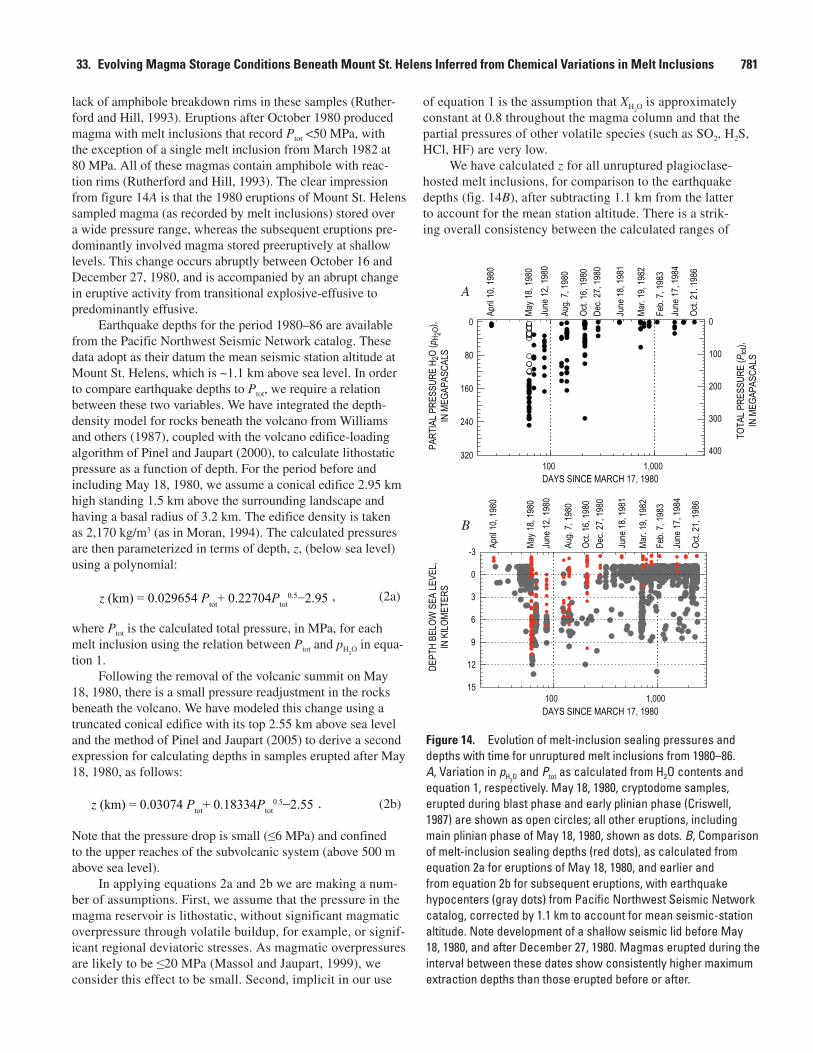
33. Evolving Magma Storage Conditions Beneath Mount St. Helens Inferred from Chemical Variations in Melt Inclusions 781
0
80
160
240
320100 1,000
0
100
200
300
400
-3
0
3
6
9
12
15100 1,000
DAYS SINCE MARCH 17, 1980
DEPT
H BE
LOW
SEA
LEVE
L,IN
KILO
METE
RS
DAYS SINCE MARCH 17, 1980
PART
IAL P
RESS
URE
H 2O
(pH 2
O),
IN M
EGAP
ASCA
LS
TOTA
L PRE
SSUR
E (P
tot),
IN M
EGAP
ASCA
LS
A
B
April
10, 1
980
Feb.
7, 1
983
Oct.
21, 1
986
June
17,
198
4
Mar
. 19,
198
2
June
18,
198
1
Dec.
27, 1
980
Oct.
16, 1
980
Aug.
7, 1
980
June
12,
198
0M
ay 1
8, 1
980
April
10, 1
980
Feb.
7, 1
983
Oct.
21, 1
986
June
17,
198
4
Mar
. 19,
198
2
June
18,
198
1
Dec.
27, 1
980
Oct.
16, 1
980
Aug.
7, 1
980
June
12,
198
0M
ay 1
8, 1
980
Figure 14. Evolution of melt-inclusion sealing pressures and depths with time for unruptured melt inclusions from 1980–86. A, Variation in pH2O and Ptot as calculated from H2O contents and equation 1, respectively. May 18, 1980, cryptodome samples, erupted during blast phase and early plinian phase (Criswell, 1987) are shown as open circles; all other eruptions, including main plinian phase of May 18, 1980, shown as dots. B, Comparison of melt-inclusion sealing depths (red dots), as calculated from equation 2a for eruptions of May 18, 1980, and earlier and from equation 2b for subsequent eruptions, with earthquake hypocenters (gray dots) from Pacific Northwest Seismic Network catalog, corrected by 1.1 km to account for mean seismic-station altitude. Note development of a shallow seismic lid before May 18, 1980, and after December 27, 1980. Magmas erupted during the interval between these dates show consistently higher maximum extraction depths than those erupted before or after.
lack of amphibole breakdown rims in these samples (Ruther-ford and Hill, 1993). Eruptions after October 1980 produced magma with melt inclusions that record Ptot <50 MPa, with the exception of a single melt inclusion from March 1982 at 80 MPa. All of these magmas contain amphibole with reac-tion rims (Rutherford and Hill, 1993). The clear impression from figure 14A is that the 1980 eruptions of Mount St. Helens sampled magma (as recorded by melt inclusions) stored over a wide pressure range, whereas the subsequent eruptions pre-dominantly involved magma stored preeruptively at shallow levels. This change occurs abruptly between October 16 and December 27, 1980, and is accompanied by an abrupt change in eruptive activity from transitional explosive-effusive to predominantly effusive.
Earthquake depths for the period 1980–86 are available from the Pacific Northwest Seismic Network catalog. These data adopt as their datum the mean seismic station altitude at Mount St. Helens, which is ~1.1 km above sea level. In order to compare earthquake depths to Ptot, we require a relation between these two variables. We have integrated the depth-density model for rocks beneath the volcano from Williams and others (1987), coupled with the volcano edifice-loading algorithm of Pinel and Jaupart (2000), to calculate lithostatic pressure as a function of depth. For the period before and including May 18, 1980, we assume a conical edifice 2.95 km high standing 1.5 km above the surrounding landscape and having a basal radius of 3.2 km. The edifice density is taken as 2,170 kg/m3 (as in Moran, 1994). The calculated pressures are then parameterized in terms of depth, z, (below sea level) using a polynomial:
z (km) = 0.029654 Ptot+ 0.22704Ptot0.5−2.95 , (2a)
where Ptot is the calculated total pressure, in MPa, for each melt inclusion using the relation between Ptot and pH2O in equa-tion 1.
Following the removal of the volcanic summit on May 18, 1980, there is a small pressure readjustment in the rocks beneath the volcano. We have modeled this change using a truncated conical edifice with its top 2.55 km above sea level and the method of Pinel and Jaupart (2005) to derive a second expression for calculating depths in samples erupted after May 18, 1980, as follows:
z (km) = 0.03074 Ptot+ 0.18334Ptot0.5−2.55 . (2b)
Note that the pressure drop is small (≤6 MPa) and confined to the upper reaches of the subvolcanic system (above 500 m above sea level).
In applying equations 2a and 2b we are making a num-ber of assumptions. First, we assume that the pressure in the magma reservoir is lithostatic, without significant magmatic overpressure through volatile buildup, for example, or signif-icant regional deviatoric stresses. As magmatic overpressures are likely to be ≤20 MPa (Massol and Jaupart, 1999), we consider this effect to be small. Second, implicit in our use
of equation 1 is the assumption that XH2O is approximately constant at 0.8 throughout the magma column and that the partial pressures of other volatile species (such as SO2, H2S, HCl, HF) are very low.
We have calculated z for all unruptured plagioclase-hosted melt inclusions, for comparison to the earthquake depths (fig. 14B), after subtracting 1.1 km from the latter to account for the mean station altitude. There is a strik-ing overall consistency between the calculated ranges of
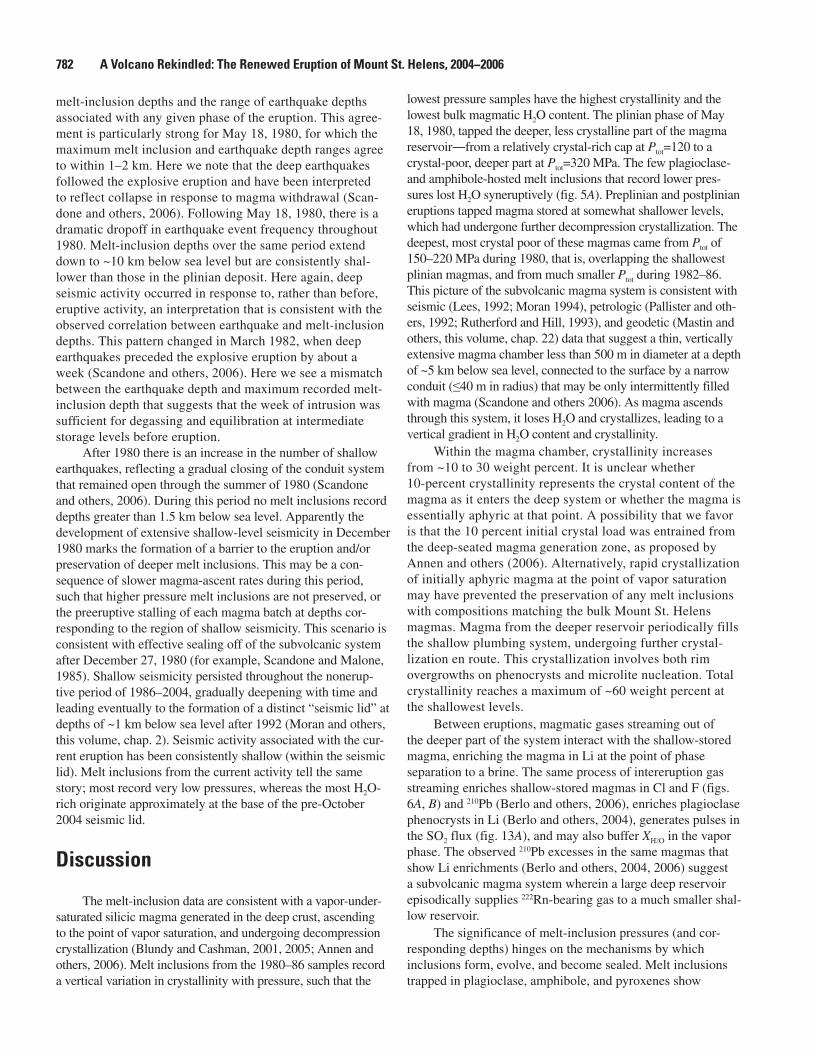
782 A Volcano Rekindled: The Renewed Eruption of Mount St. Helens, 2004−2006
melt-inclusion depths and the range of earthquake depths associated with any given phase of the eruption. This agree-ment is particularly strong for May 18, 1980, for which the maximum melt inclusion and earthquake depth ranges agree to within 1–2 km. Here we note that the deep earthquakes followed the explosive eruption and have been interpreted to reflect collapse in response to magma withdrawal (Scan-done and others, 2006). Following May 18, 1980, there is a dramatic dropoff in earthquake event frequency throughout 1980. Melt-inclusion depths over the same period extend down to ~10 km below sea level but are consistently shal-lower than those in the plinian deposit. Here again, deep seismic activity occurred in response to, rather than before, eruptive activity, an interpretation that is consistent with the observed correlation between earthquake and melt-inclusion depths. This pattern changed in March 1982, when deep earthquakes preceded the explosive eruption by about a week (Scandone and others, 2006). Here we see a mismatch between the earthquake depth and maximum recorded melt-inclusion depth that suggests that the week of intrusion was sufficient for degassing and equilibration at intermediate storage levels before eruption.
After 1980 there is an increase in the number of shallow earthquakes, reflecting a gradual closing of the conduit system that remained open through the summer of 1980 (Scandone and others, 2006). During this period no melt inclusions record depths greater than 1.5 km below sea level. Apparently the development of extensive shallow-level seismicity in December 1980 marks the formation of a barrier to the eruption and/or preservation of deeper melt inclusions. This may be a con-sequence of slower magma-ascent rates during this period, such that higher pressure melt inclusions are not preserved, or the preeruptive stalling of each magma batch at depths cor-responding to the region of shallow seismicity. This scenario is consistent with effective sealing off of the subvolcanic system after December 27, 1980 (for example, Scandone and Malone, 1985). Shallow seismicity persisted throughout the nonerup-tive period of 1986–2004, gradually deepening with time and leading eventually to the formation of a distinct “seismic lid” at depths of ~1 km below sea level after 1992 (Moran and others, this volume, chap. 2). Seismic activity associated with the cur-rent eruption has been consistently shallow (within the seismic lid). Melt inclusions from the current activity tell the same story; most record very low pressures, whereas the most H2O-rich originate approximately at the base of the pre-October 2004 seismic lid.
Discussion
The melt-inclusion data are consistent with a vapor-under-saturated silicic magma generated in the deep crust, ascending to the point of vapor saturation, and undergoing decompression crystallization (Blundy and Cashman, 2001, 2005; Annen and others, 2006). Melt inclusions from the 1980–86 samples record a vertical variation in crystallinity with pressure, such that the
lowest pressure samples have the highest crystallinity and the lowest bulk magmatic H2O content. The plinian phase of May 18, 1980, tapped the deeper, less crystalline part of the magma reservoir―from a relatively crystal-rich cap at Ptot=120 to a crystal-poor, deeper part at Ptot=320 MPa. The few plagioclase- and amphibole-hosted melt inclusions that record lower pres-sures lost H2O syneruptively (fig. 5A). Preplinian and postplinian eruptions tapped magma stored at somewhat shallower levels, which had undergone further decompression crystallization. The deepest, most crystal poor of these magmas came from Ptot of 150–220 MPa during 1980, that is, overlapping the shallowest plinian magmas, and from much smaller Ptot during 1982–86. This picture of the subvolcanic magma system is consistent with seismic (Lees, 1992; Moran 1994), petrologic (Pallister and oth-ers, 1992; Rutherford and Hill, 1993), and geodetic (Mastin and others, this volume, chap. 22) data that suggest a thin, vertically extensive magma chamber less than 500 m in diameter at a depth of ~5 km below sea level, connected to the surface by a narrow conduit (≤40 m in radius) that may be only intermittently filled with magma (Scandone and others 2006). As magma ascends through this system, it loses H2O and crystallizes, leading to a vertical gradient in H2O content and crystallinity.
Within the magma chamber, crystallinity increases from ~10 to 30 weight percent. It is unclear whether 10-percent crystallinity represents the crystal content of the magma as it enters the deep system or whether the magma is essentially aphyric at that point. A possibility that we favor is that the 10 percent initial crystal load was entrained from the deep-seated magma generation zone, as proposed by Annen and others (2006). Alternatively, rapid crystallization of initially aphyric magma at the point of vapor saturation may have prevented the preservation of any melt inclusions with compositions matching the bulk Mount St. Helens magmas. Magma from the deeper reservoir periodically fills the shallow plumbing system, undergoing further crystal-lization en route. This crystallization involves both rim overgrowths on phenocrysts and microlite nucleation. Total crystallinity reaches a maximum of ~60 weight percent at the shallowest levels.
Between eruptions, magmatic gases streaming out of the deeper part of the system interact with the shallow-stored magma, enriching the magma in Li at the point of phase separation to a brine. The same process of intereruption gas streaming enriches shallow-stored magmas in Cl and F (figs. 6A, B) and 210Pb (Berlo and others, 2006), enriches plagioclase phenocrysts in Li (Berlo and others, 2004), generates pulses in the SO2 flux (fig. 13A), and may also buffer XH2O in the vapor phase. The observed 210Pb excesses in the same magmas that show Li enrichments (Berlo and others, 2004, 2006) suggest a subvolcanic magma system wherein a large deep reservoir episodically supplies 222Rn-bearing gas to a much smaller shal-low reservoir.
The significance of melt-inclusion pressures (and cor-responding depths) hinges on the mechanisms by which inclusions form, evolve, and become sealed. Melt inclusions trapped in plagioclase, amphibole, and pyroxenes show
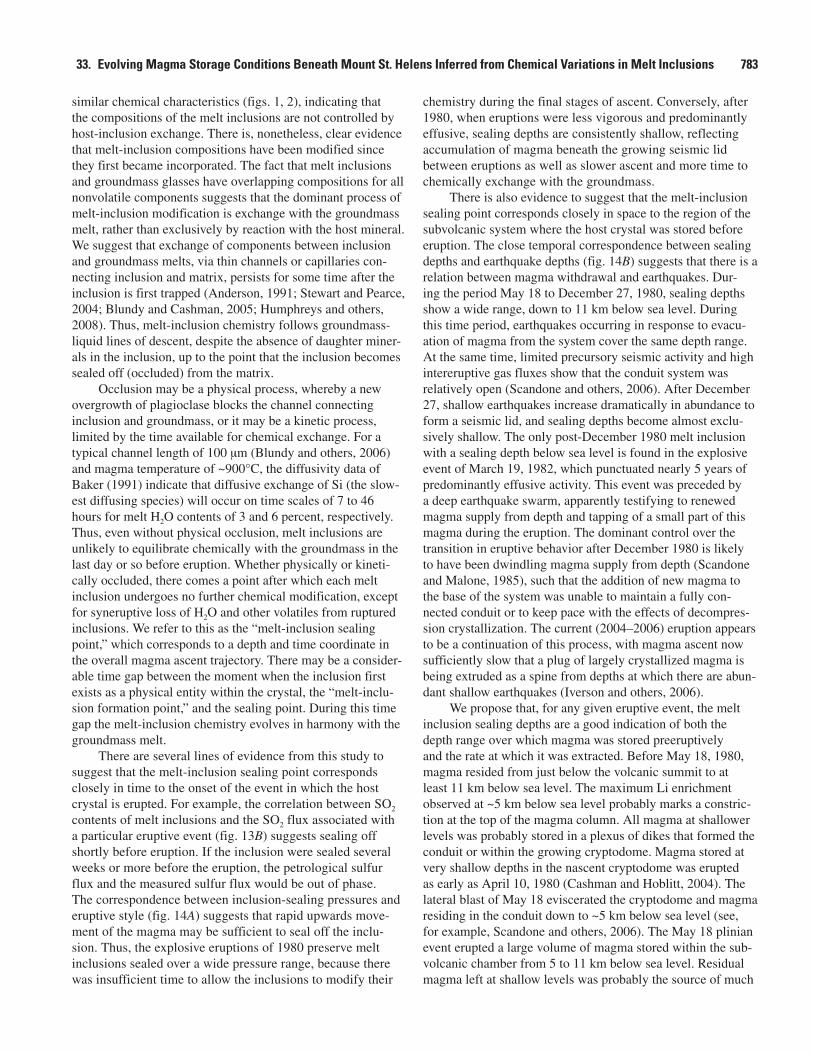
33. Evolving Magma Storage Conditions Beneath Mount St. Helens Inferred from Chemical Variations in Melt Inclusions 783
similar chemical characteristics (figs. 1, 2), indicating that the compositions of the melt inclusions are not controlled by host-inclusion exchange. There is, nonetheless, clear evidence that melt-inclusion compositions have been modified since they first became incorporated. The fact that melt inclusions and groundmass glasses have overlapping compositions for all nonvolatile components suggests that the dominant process of melt-inclusion modification is exchange with the groundmass melt, rather than exclusively by reaction with the host mineral. We suggest that exchange of components between inclusion and groundmass melts, via thin channels or capillaries con-necting inclusion and matrix, persists for some time after the inclusion is first trapped (Anderson, 1991; Stewart and Pearce, 2004; Blundy and Cashman, 2005; Humphreys and others, 2008). Thus, melt-inclusion chemistry follows groundmass-liquid lines of descent, despite the absence of daughter miner-als in the inclusion, up to the point that the inclusion becomes sealed off (occluded) from the matrix.
Occlusion may be a physical process, whereby a new overgrowth of plagioclase blocks the channel connecting inclusion and groundmass, or it may be a kinetic process, limited by the time available for chemical exchange. For a typical channel length of 100 µm (Blundy and others, 2006) and magma temperature of ~900°C, the diffusivity data of Baker (1991) indicate that diffusive exchange of Si (the slow-est diffusing species) will occur on time scales of 7 to 46 hours for melt H2O contents of 3 and 6 percent, respectively. Thus, even without physical occlusion, melt inclusions are unlikely to equilibrate chemically with the groundmass in the last day or so before eruption. Whether physically or kineti-cally occluded, there comes a point after which each melt inclusion undergoes no further chemical modification, except for syneruptive loss of H2O and other volatiles from ruptured inclusions. We refer to this as the “melt-inclusion sealing point,” which corresponds to a depth and time coordinate in the overall magma ascent trajectory. There may be a consider-able time gap between the moment when the inclusion first exists as a physical entity within the crystal, the “melt-inclu-sion formation point,” and the sealing point. During this time gap the melt-inclusion chemistry evolves in harmony with the groundmass melt.
There are several lines of evidence from this study to suggest that the melt-inclusion sealing point corresponds closely in time to the onset of the event in which the host crystal is erupted. For example, the correlation between SO2 contents of melt inclusions and the SO2 flux associated with a particular eruptive event (fig. 13B) suggests sealing off shortly before eruption. If the inclusion were sealed several weeks or more before the eruption, the petrological sulfur flux and the measured sulfur flux would be out of phase. The correspondence between inclusion-sealing pressures and eruptive style (fig. 14A) suggests that rapid upwards move-ment of the magma may be sufficient to seal off the inclu-sion. Thus, the explosive eruptions of 1980 preserve melt inclusions sealed over a wide pressure range, because there was insufficient time to allow the inclusions to modify their
chemistry during the final stages of ascent. Conversely, after 1980, when eruptions were less vigorous and predominantly effusive, sealing depths are consistently shallow, reflecting accumulation of magma beneath the growing seismic lid between eruptions as well as slower ascent and more time to chemically exchange with the groundmass.
There is also evidence to suggest that the melt-inclusion sealing point corresponds closely in space to the region of the subvolcanic system where the host crystal was stored before eruption. The close temporal correspondence between sealing depths and earthquake depths (fig. 14B) suggests that there is a relation between magma withdrawal and earthquakes. Dur-ing the period May 18 to December 27, 1980, sealing depths show a wide range, down to 11 km below sea level. During this time period, earthquakes occurring in response to evacu-ation of magma from the system cover the same depth range. At the same time, limited precursory seismic activity and high intereruptive gas fluxes show that the conduit system was relatively open (Scandone and others, 2006). After December 27, shallow earthquakes increase dramatically in abundance to form a seismic lid, and sealing depths become almost exclu-sively shallow. The only post-December 1980 melt inclusion with a sealing depth below sea level is found in the explosive event of March 19, 1982, which punctuated nearly 5 years of predominantly effusive activity. This event was preceded by a deep earthquake swarm, apparently testifying to renewed magma supply from depth and tapping of a small part of this magma during the eruption. The dominant control over the transition in eruptive behavior after December 1980 is likely to have been dwindling magma supply from depth (Scandone and Malone, 1985), such that the addition of new magma to the base of the system was unable to maintain a fully con-nected conduit or to keep pace with the effects of decompres-sion crystallization. The current (2004–2006) eruption appears to be a continuation of this process, with magma ascent now sufficiently slow that a plug of largely crystallized magma is being extruded as a spine from depths at which there are abun-dant shallow earthquakes (Iverson and others, 2006).
We propose that, for any given eruptive event, the melt inclusion sealing depths are a good indication of both the depth range over which magma was stored preeruptively and the rate at which it was extracted. Before May 18, 1980, magma resided from just below the volcanic summit to at least 11 km below sea level. The maximum Li enrichment observed at ~5 km below sea level probably marks a constric-tion at the top of the magma column. All magma at shallower levels was probably stored in a plexus of dikes that formed the conduit or within the growing cryptodome. Magma stored at very shallow depths in the nascent cryptodome was erupted as early as April 10, 1980 (Cashman and Hoblitt, 2004). The lateral blast of May 18 eviscerated the cryptodome and magma residing in the conduit down to ~5 km below sea level (see, for example, Scandone and others, 2006). The May 18 plinian event erupted a large volume of magma stored within the sub-volcanic chamber from 5 to 11 km below sea level. Residual magma left at shallow levels was probably the source of much
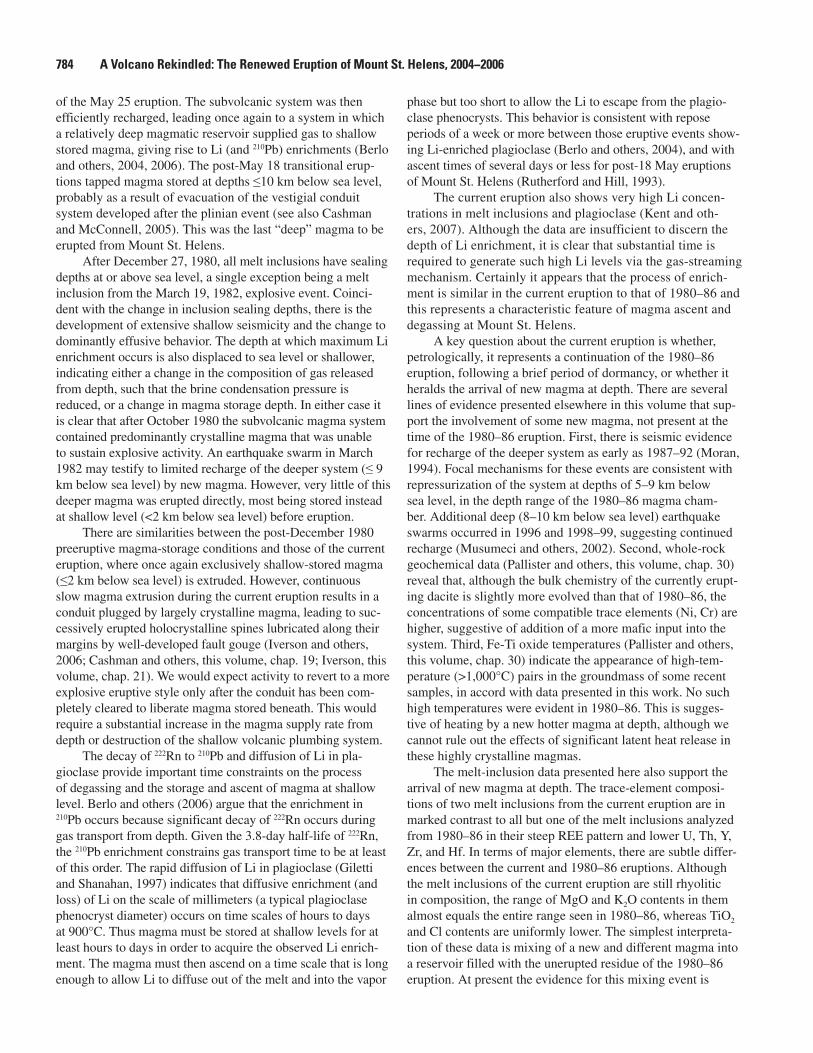
784 A Volcano Rekindled: The Renewed Eruption of Mount St. Helens, 2004−2006
of the May 25 eruption. The subvolcanic system was then efficiently recharged, leading once again to a system in which a relatively deep magmatic reservoir supplied gas to shallow stored magma, giving rise to Li (and 210Pb) enrichments (Berlo and others, 2004, 2006). The post-May 18 transitional erup-tions tapped magma stored at depths ≤10 km below sea level, probably as a result of evacuation of the vestigial conduit system developed after the plinian event (see also Cashman and McConnell, 2005). This was the last “deep” magma to be erupted from Mount St. Helens.
After December 27, 1980, all melt inclusions have sealing depths at or above sea level, a single exception being a melt inclusion from the March 19, 1982, explosive event. Coinci-dent with the change in inclusion sealing depths, there is the development of extensive shallow seismicity and the change to dominantly effusive behavior. The depth at which maximum Li enrichment occurs is also displaced to sea level or shallower, indicating either a change in the composition of gas released from depth, such that the brine condensation pressure is reduced, or a change in magma storage depth. In either case it is clear that after October 1980 the subvolcanic magma system contained predominantly crystalline magma that was unable to sustain explosive activity. An earthquake swarm in March 1982 may testify to limited recharge of the deeper system (≤ 9 km below sea level) by new magma. However, very little of this deeper magma was erupted directly, most being stored instead at shallow level (<2 km below sea level) before eruption.
There are similarities between the post-December 1980 preeruptive magma-storage conditions and those of the current eruption, where once again exclusively shallow-stored magma (≤2 km below sea level) is extruded. However, continuous slow magma extrusion during the current eruption results in a conduit plugged by largely crystalline magma, leading to suc-cessively erupted holocrystalline spines lubricated along their margins by well-developed fault gouge (Iverson and others, 2006; Cashman and others, this volume, chap. 19; Iverson, this volume, chap. 21). We would expect activity to revert to a more explosive eruptive style only after the conduit has been com-pletely cleared to liberate magma stored beneath. This would require a substantial increase in the magma supply rate from depth or destruction of the shallow volcanic plumbing system.
The decay of 222Rn to 210Pb and diffusion of Li in pla-gioclase provide important time constraints on the process of degassing and the storage and ascent of magma at shallow level. Berlo and others (2006) argue that the enrichment in 210Pb occurs because significant decay of 222Rn occurs during gas transport from depth. Given the 3.8-day half-life of 222Rn, the 210Pb enrichment constrains gas transport time to be at least of this order. The rapid diffusion of Li in plagioclase (Giletti and Shanahan, 1997) indicates that diffusive enrichment (and loss) of Li on the scale of millimeters (a typical plagioclase phenocryst diameter) occurs on time scales of hours to days at 900°C. Thus magma must be stored at shallow levels for at least hours to days in order to acquire the observed Li enrich-ment. The magma must then ascend on a time scale that is long enough to allow Li to diffuse out of the melt and into the vapor
phase but too short to allow the Li to escape from the plagio-clase phenocrysts. This behavior is consistent with repose periods of a week or more between those eruptive events show-ing Li-enriched plagioclase (Berlo and others, 2004), and with ascent times of several days or less for post-18 May eruptions of Mount St. Helens (Rutherford and Hill, 1993).
The current eruption also shows very high Li concen-trations in melt inclusions and plagioclase (Kent and oth-ers, 2007). Although the data are insufficient to discern the depth of Li enrichment, it is clear that substantial time is required to generate such high Li levels via the gas-streaming mechanism. Certainly it appears that the process of enrich-ment is similar in the current eruption to that of 1980–86 and this represents a characteristic feature of magma ascent and degassing at Mount St. Helens.
A key question about the current eruption is whether, petrologically, it represents a continuation of the 1980–86 eruption, following a brief period of dormancy, or whether it heralds the arrival of new magma at depth. There are several lines of evidence presented elsewhere in this volume that sup-port the involvement of some new magma, not present at the time of the 1980–86 eruption. First, there is seismic evidence for recharge of the deeper system as early as 1987–92 (Moran, 1994). Focal mechanisms for these events are consistent with repressurization of the system at depths of 5–9 km below sea level, in the depth range of the 1980–86 magma cham-ber. Additional deep (8–10 km below sea level) earthquake swarms occurred in 1996 and 1998–99, suggesting continued recharge (Musumeci and others, 2002). Second, whole-rock geochemical data (Pallister and others, this volume, chap. 30) reveal that, although the bulk chemistry of the currently erupt-ing dacite is slightly more evolved than that of 1980–86, the concentrations of some compatible trace elements (Ni, Cr) are higher, suggestive of addition of a more mafic input into the system. Third, Fe-Ti oxide temperatures (Pallister and others, this volume, chap. 30) indicate the appearance of high-tem-perature (>1,000°C) pairs in the groundmass of some recent samples, in accord with data presented in this work. No such high temperatures were evident in 1980–86. This is sugges-tive of heating by a new hotter magma at depth, although we cannot rule out the effects of significant latent heat release in these highly crystalline magmas.
The melt-inclusion data presented here also support the arrival of new magma at depth. The trace-element composi-tions of two melt inclusions from the current eruption are in marked contrast to all but one of the melt inclusions analyzed from 1980–86 in their steep REE pattern and lower U, Th, Y, Zr, and Hf. In terms of major elements, there are subtle differ-ences between the current and 1980–86 eruptions. Although the melt inclusions of the current eruption are still rhyolitic in composition, the range of MgO and K2O contents in them almost equals the entire range seen in 1980–86, whereas TiO2 and Cl contents are uniformly lower. The simplest interpreta-tion of these data is mixing of a new and different magma into a reservoir filled with the unerupted residue of the 1980–86 eruption. At present the evidence for this mixing event is

33. Evolving Magma Storage Conditions Beneath Mount St. Helens Inferred from Chemical Variations in Melt Inclusions 785
subtle, and it is inferred only through slight changes in trace-element chemistry consistent with small parcels of the new magma invading volumetrically dominant older magma stored at shallow levels. This interpretation is consistent with seismic evidence for such batches (for example, Scandone and others, 2006). Over time, the addition of increasing quantities of this melt component displaces slightly the bulk chemical composi-tion of the currently erupting magma, as evinced by figure 4. The melt-inclusion data do not necessarily require input of a more mafic magma into the system, just a more silicic magma with elevated Ni and Cr contents, similar, for example, to the dacites erupted during the Kalama period (Pallister and others, 1992, and this volume, chap. 30). Continued monitoring of melt inclusions from the current eruption is required to track the progressive involvement of the new magma as the eruption taps progressively deeper levels of the subvolcanic reservoir.
ConclusionsWhole-rock chemical variations in magma erupted from
or around Mount St. Helens during late Quaternary time testify to extensive chemical differentiation of basaltic magma beneath the volcano to produce silicic andesite and dacite, such as those erupted in 1980–86 and since 2004. Plagioclase involvement was minimal during the early stages of differ-entiation, probably because of elevated H2O contents in the parental magmas (Berlo and others, 2007). The compatible behavior of Y, Zr, and Nb during whole-rock differentiation points to the involvement of garnet, amphibole, and ilmenite in modal proportions at odds with the observed phenocryst assemblages. This suggests that differentiation occurred at considerable depth below Mount St. Helens, probably at the base of the crust (Ptot ≥1 GPa), where garnet becomes a stable crystallizing phase (see, for example, Müntener and others, 2001). The curvature of many whole-rock geochemical trends rules out magma mixing as the primary source of chemical variation at Mount St. Helens. However, limited amounts of mixing of different magmas in the source region, and entrain-ment of crystal residues from depth, may account for some of the linearity in rocks with >62 percent SiO2, including those from the 1980–86 and current (2004–2006) eruptions.
Melt-inclusion and groundmass-glass compositions lie at the high-SiO2 end of the whole-rock arrays. The chemical trends exhibited by the glasses commonly are oblique to those of the whole rocks, indicative of a marked change in crystal-lizing assemblage. We interpret the glass trends to result from low-pressure crystallization of a dacite magma that was gener-ated in the lower crust and ascended to the point of volatile sat-uration, ~11 km below sea level. Low-pressure crystallization involved the plagioclase-rich phenocryst assemblage, rather than the high-pressure amphibole-rich assemblage, which con-trols the whole-rock chemistry. The wide variety of matrix and inclusion glass compositions within host dacites of restricted composition indicates that low-pressure crystallization involved negligible physical segregation of crystals and melts.
Melt inclusions and Fe-Ti oxide data from the 1980–86 eruption provide constraints on the evolving subvolcanic magma plumbing. The dissolved volatile contents of the melt inclusions have enabled us to determine the storage pres-sure of a magma batch just before its eruption. By converting pressure to depth, we have been able to track the changing magma-extraction depths with time. The plinian eruption of May 18, 1980, involved magma that last equilibrated 5–11 km below sea level. The preceding eruptions, including the May 18, 1980, blast deposit, tapped magma from just below the edifice to ~5 km below sea level. Subsequent episodes in 1980 tapped magma down to 10 km below sea level. The tapping of deeper magma stopped abruptly at the end of 1980, coinci-dent with the onset of shallow preeruptive seismicity and the transition to purely effusive activity. All subsequent 1981–86 eruptive episodes tapped exclusively shallow-stored magma. We interpret the development of shallow seismicity to mark the effective closure of the conduit system by stalled, highly crystallized magma in response to diminished magma supply. Therefore, 1980 corresponds to a period during which the con-duit formed on May 18 remained sufficiently open that magma could be tapped over a wide range of depths.
The current eruption of Mount St. Helens shares simi-larities with the 1981–86 phase of the previous eruption, in that magma appears to be fed from shallow levels, beneath a seismic lid. However, the continuous slow effusion that characterizes the current activity is different from the more rapid episodic effusion of most of the 1980s and produces highly crystalline conduit material in the form of a sequence of collapsing spines. Several subtle petrological and chemical lines of evidence indicate that the deep magma driving spine extrusion differs from that previously present at Mount St. Helens. Melt-inclusion data suggest that the new magma has lower concentrations of REE, U, Th, and HFSE; higher Ni and Cr; and a steeper REE pattern than melts from 1980–86. To date, very little of this magma has insinuated its way into the choked conduit system. With time, however, we anticipate that the proportion of new magma in erupted products will increase. A careful integration of petrologic, seismologic, and gas-monitoring data will help to mark the progressive rise of any new magma through the system and, possibly, its eventual appearance at the surface.
AcknowledgmentsThis work was funded through research fellowships
from the Natural Environment Research Council (U.K.) and the Royal Society to Blundy, National Science Foundation grants EAR-0207362 and EAR-0510437 to Cashman, and a University of Bristol Ph.D. studentship to Berlo. We would like to thank J. Craven, S. Kaseman, and R. Hinton for sup-port on the Edinburgh ion microprobe, S. Kearns for help on the Bristol electron microprobe, and informative discussions with M. Humphreys, O. Melnik, S. Sparks, J. Pallister, and
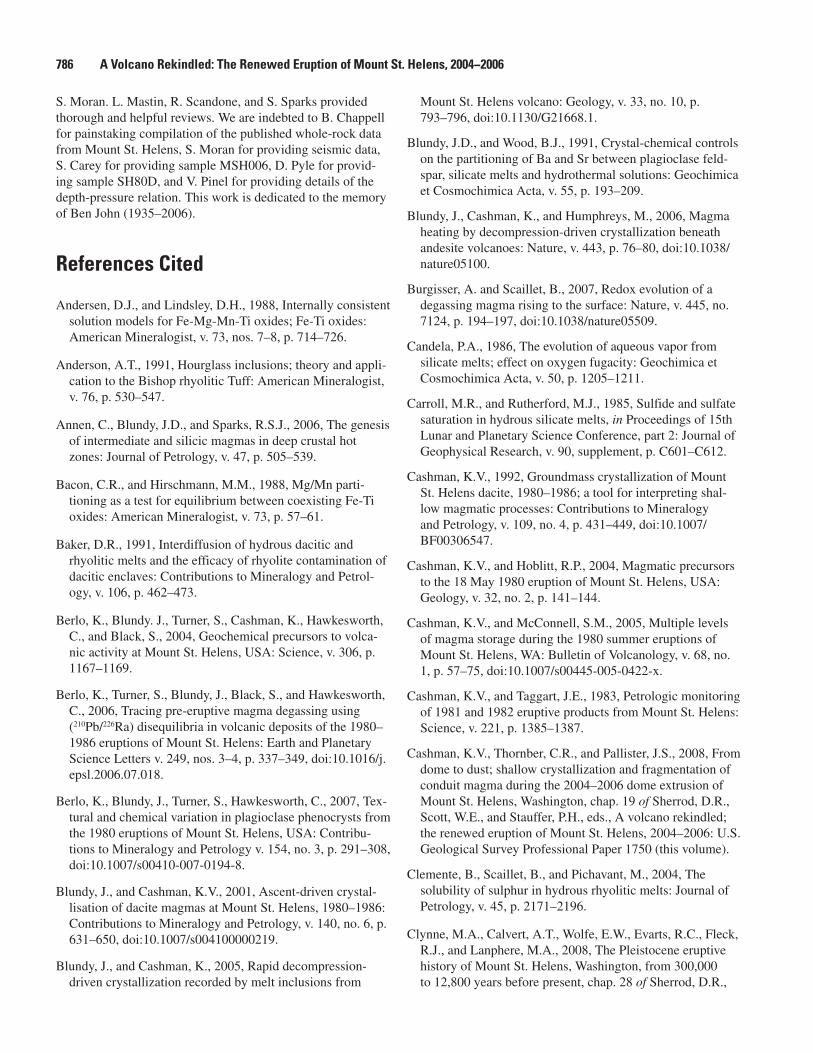
786 A Volcano Rekindled: The Renewed Eruption of Mount St. Helens, 2004−2006
S. Moran. L. Mastin, R. Scandone, and S. Sparks provided thorough and helpful reviews. We are indebted to B. Chappell for painstaking compilation of the published whole-rock data from Mount St. Helens, S. Moran for providing seismic data, S. Carey for providing sample MSH006, D. Pyle for provid-ing sample SH80D, and V. Pinel for providing details of the depth-pressure relation. This work is dedicated to the memory of Ben John (1935–2006).
References Cited
Andersen, D.J., and Lindsley, D.H., 1988, Internally consistent solution models for Fe-Mg-Mn-Ti oxides; Fe-Ti oxides: American Mineralogist, v. 73, nos. 7–8, p. 714–726.
Anderson, A.T., 1991, Hourglass inclusions; theory and appli-cation to the Bishop rhyolitic Tuff: American Mineralogist, v. 76, p. 530–547.
Annen, C., Blundy, J.D., and Sparks, R.S.J., 2006, The genesis of intermediate and silicic magmas in deep crustal hot zones: Journal of Petrology, v. 47, p. 505–539.
Bacon, C.R., and Hirschmann, M.M., 1988, Mg/Mn parti-tioning as a test for equilibrium between coexisting Fe-Ti oxides: American Mineralogist, v. 73, p. 57–61.
Baker, D.R., 1991, Interdiffusion of hydrous dacitic and rhyolitic melts and the efficacy of rhyolite contamination of dacitic enclaves: Contributions to Mineralogy and Petrol-ogy, v. 106, p. 462–473.
Berlo, K., Blundy. J., Turner, S., Cashman, K., Hawkesworth, C., and Black, S., 2004, Geochemical precursors to volca-nic activity at Mount St. Helens, USA: Science, v. 306, p. 1167–1169.
Berlo, K., Turner, S., Blundy, J., Black, S., and Hawkesworth, C., 2006, Tracing pre-eruptive magma degassing using (210Pb/226Ra) disequilibria in volcanic deposits of the 1980–1986 eruptions of Mount St. Helens: Earth and Planetary Science Letters v. 249, nos. 3–4, p. 337–349, doi:10.1016/j.epsl.2006.07.018.
Berlo, K., Blundy, J., Turner, S., Hawkesworth, C., 2007, Tex-tural and chemical variation in plagioclase phenocrysts from the 1980 eruptions of Mount St. Helens, USA: Contribu-tions to Mineralogy and Petrology v. 154, no. 3, p. 291–308, doi:10.1007/s00410-007-0194-8.
Blundy, J., and Cashman, K.V., 2001, Ascent-driven crystal-lisation of dacite magmas at Mount St. Helens, 1980–1986: Contributions to Mineralogy and Petrology, v. 140, no. 6, p. 631–650, doi:10.1007/s004100000219.
Blundy, J., and Cashman, K., 2005, Rapid decompression-driven crystallization recorded by melt inclusions from
Mount St. Helens volcano: Geology, v. 33, no. 10, p. 793–796, doi:10.1130/G21668.1.
Blundy, J.D., and Wood, B.J., 1991, Crystal-chemical controls on the partitioning of Ba and Sr between plagioclase feld-spar, silicate melts and hydrothermal solutions: Geochimica et Cosmochimica Acta, v. 55, p. 193–209.
Blundy, J., Cashman, K., and Humphreys, M., 2006, Magma heating by decompression-driven crystallization beneath andesite volcanoes: Nature, v. 443, p. 76–80, doi:10.1038/nature05100.
Burgisser, A. and Scaillet, B., 2007, Redox evolution of a degassing magma rising to the surface: Nature, v. 445, no. 7124, p. 194–197, doi:10.1038/nature05509.
Candela, P.A., 1986, The evolution of aqueous vapor from silicate melts; effect on oxygen fugacity: Geochimica et Cosmochimica Acta, v. 50, p. 1205–1211.
Carroll, M.R., and Rutherford, M.J., 1985, Sulfide and sulfate saturation in hydrous silicate melts, in Proceedings of 15th Lunar and Planetary Science Conference, part 2: Journal of Geophysical Research, v. 90, supplement, p. C601–C612.
Cashman, K.V., 1992, Groundmass crystallization of Mount St. Helens dacite, 1980–1986; a tool for interpreting shal-low magmatic processes: Contributions to Mineralogy and Petrology, v. 109, no. 4, p. 431–449, doi:10.1007/BF00306547.
Cashman, K.V., and Hoblitt, R.P., 2004, Magmatic precursors to the 18 May 1980 eruption of Mount St. Helens, USA: Geology, v. 32, no. 2, p. 141–144.
Cashman, K.V., and McConnell, S.M., 2005, Multiple levels of magma storage during the 1980 summer eruptions of Mount St. Helens, WA: Bulletin of Volcanology, v. 68, no. 1, p. 57–75, doi:10.1007/s00445-005-0422-x.
Cashman, K.V., and Taggart, J.E., 1983, Petrologic monitoring of 1981 and 1982 eruptive products from Mount St. Helens: Science, v. 221, p. 1385–1387.
Cashman, K.V., Thornber, C.R., and Pallister, J.S., 2008, From dome to dust; shallow crystallization and fragmentation of conduit magma during the 2004–2006 dome extrusion of Mount St. Helens, Washington, chap. 19 of Sherrod, D.R., Scott, W.E., and Stauffer, P.H., eds., A volcano rekindled; the renewed eruption of Mount St. Helens, 2004–2006: U.S. Geological Survey Professional Paper 1750 (this volume).
Clemente, B., Scaillet, B., and Pichavant, M., 2004, The solubility of sulphur in hydrous rhyolitic melts: Journal of Petrology, v. 45, p. 2171–2196.
Clynne, M.A., Calvert, A.T., Wolfe, E.W., Evarts, R.C., Fleck, R.J., and Lanphere, M.A., 2008, The Pleistocene eruptive history of Mount St. Helens, Washington, from 300,000 to 12,800 years before present, chap. 28 of Sherrod, D.R.,
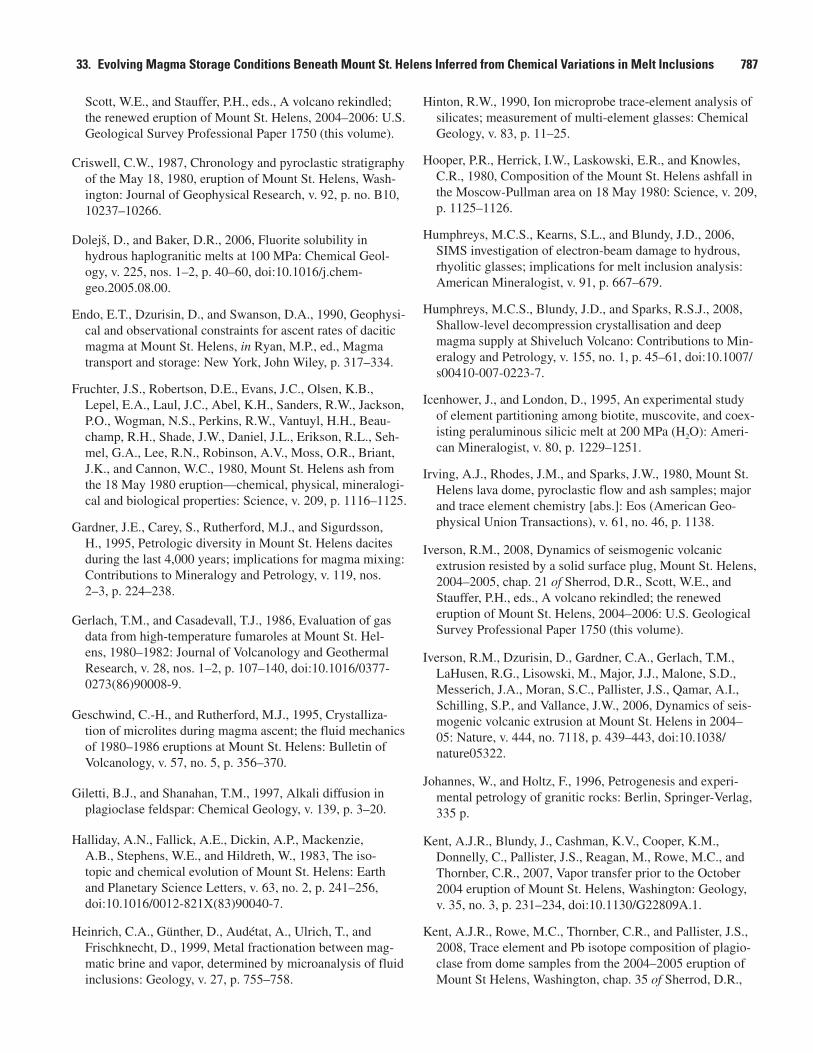
33. Evolving Magma Storage Conditions Beneath Mount St. Helens Inferred from Chemical Variations in Melt Inclusions 787
Scott, W.E., and Stauffer, P.H., eds., A volcano rekindled; the renewed eruption of Mount St. Helens, 2004–2006: U.S. Geological Survey Professional Paper 1750 (this volume).
Criswell, C.W., 1987, Chronology and pyroclastic stratigraphy of the May 18, 1980, eruption of Mount St. Helens, Wash-ington: Journal of Geophysical Research, v. 92, p. no. B10, 10237–10266.
Dolejš, D., and Baker, D.R., 2006, Fluorite solubility in hydrous haplogranitic melts at 100 MPa: Chemical Geol-ogy, v. 225, nos. 1–2, p. 40–60, doi:10.1016/j.chem-geo.2005.08.00.
Endo, E.T., Dzurisin, D., and Swanson, D.A., 1990, Geophysi-cal and observational constraints for ascent rates of dacitic magma at Mount St. Helens, in Ryan, M.P., ed., Magma transport and storage: New York, John Wiley, p. 317–334.
Fruchter, J.S., Robertson, D.E., Evans, J.C., Olsen, K.B., Lepel, E.A., Laul, J.C., Abel, K.H., Sanders, R.W., Jackson, P.O., Wogman, N.S., Perkins, R.W., Vantuyl, H.H., Beau-champ, R.H., Shade, J.W., Daniel, J.L., Erikson, R.L., Seh-mel, G.A., Lee, R.N., Robinson, A.V., Moss, O.R., Briant, J.K., and Cannon, W.C., 1980, Mount St. Helens ash from the 18 May 1980 eruption—chemical, physical, mineralogi-cal and biological properties: Science, v. 209, p. 1116–1125.
Gardner, J.E., Carey, S., Rutherford, M.J., and Sigurdsson, H., 1995, Petrologic diversity in Mount St. Helens dacites during the last 4,000 years; implications for magma mixing: Contributions to Mineralogy and Petrology, v. 119, nos. 2–3, p. 224–238.
Gerlach, T.M., and Casadevall, T.J., 1986, Evaluation of gas data from high-temperature fumaroles at Mount St. Hel-ens, 1980–1982: Journal of Volcanology and Geothermal Research, v. 28, nos. 1–2, p. 107–140, doi:10.1016/0377-0273(86)90008-9.
Geschwind, C.-H., and Rutherford, M.J., 1995, Crystalliza-tion of microlites during magma ascent; the fluid mechanics of 1980–1986 eruptions at Mount St. Helens: Bulletin of Volcanology, v. 57, no. 5, p. 356–370.
Giletti, B.J., and Shanahan, T.M., 1997, Alkali diffusion in plagioclase feldspar: Chemical Geology, v. 139, p. 3–20.
Halliday, A.N., Fallick, A.E., Dickin, A.P., Mackenzie, A.B., Stephens, W.E., and Hildreth, W., 1983, The iso-topic and chemical evolution of Mount St. Helens: Earth and Planetary Science Letters, v. 63, no. 2, p. 241–256, doi:10.1016/0012-821X(83)90040-7.
Heinrich, C.A., Günther, D., Audétat, A., Ulrich, T., and Frischknecht, D., 1999, Metal fractionation between mag-matic brine and vapor, determined by microanalysis of fluid inclusions: Geology, v. 27, p. 755–758.
Hinton, R.W., 1990, Ion microprobe trace-element analysis of silicates; measurement of multi-element glasses: Chemical Geology, v. 83, p. 11–25.
Hooper, P.R., Herrick, I.W., Laskowski, E.R., and Knowles, C.R., 1980, Composition of the Mount St. Helens ashfall in the Moscow-Pullman area on 18 May 1980: Science, v. 209, p. 1125–1126.
Humphreys, M.C.S., Kearns, S.L., and Blundy, J.D., 2006, SIMS investigation of electron-beam damage to hydrous, rhyolitic glasses; implications for melt inclusion analysis: American Mineralogist, v. 91, p. 667–679.
Humphreys, M.C.S., Blundy, J.D., and Sparks, R.S.J., 2008, Shallow-level decompression crystallisation and deep magma supply at Shiveluch Volcano: Contributions to Min-eralogy and Petrology, v. 155, no. 1, p. 45–61, doi:10.1007/s00410-007-0223-7.
Icenhower, J., and London, D., 1995, An experimental study of element partitioning among biotite, muscovite, and coex-isting peraluminous silicic melt at 200 MPa (H2O): Ameri-can Mineralogist, v. 80, p. 1229–1251.
Irving, A.J., Rhodes, J.M., and Sparks, J.W., 1980, Mount St. Helens lava dome, pyroclastic flow and ash samples; major and trace element chemistry [abs.]: Eos (American Geo-physical Union Transactions), v. 61, no. 46, p. 1138.
Iverson, R.M., 2008, Dynamics of seismogenic volcanic extrusion resisted by a solid surface plug, Mount St. Helens, 2004–2005, chap. 21 of Sherrod, D.R., Scott, W.E., and Stauffer, P.H., eds., A volcano rekindled; the renewed eruption of Mount St. Helens, 2004–2006: U.S. Geological Survey Professional Paper 1750 (this volume).
Iverson, R.M., Dzurisin, D., Gardner, C.A., Gerlach, T.M., LaHusen, R.G., Lisowski, M., Major, J.J., Malone, S.D., Messerich, J.A., Moran, S.C., Pallister, J.S., Qamar, A.I., Schilling, S.P., and Vallance, J.W., 2006, Dynamics of seis-mogenic volcanic extrusion at Mount St. Helens in 2004–05: Nature, v. 444, no. 7118, p. 439–443, doi:10.1038/nature05322.
Johannes, W., and Holtz, F., 1996, Petrogenesis and experi-mental petrology of granitic rocks: Berlin, Springer-Verlag, 335 p.
Kent, A.J.R., Blundy, J., Cashman, K.V., Cooper, K.M., Donnelly, C., Pallister, J.S., Reagan, M., Rowe, M.C., and Thornber, C.R., 2007, Vapor transfer prior to the October 2004 eruption of Mount St. Helens, Washington: Geology, v. 35, no. 3, p. 231–234, doi:10.1130/G22809A.1.
Kent, A.J.R., Rowe, M.C., Thornber, C.R., and Pallister, J.S., 2008, Trace element and Pb isotope composition of plagio-clase from dome samples from the 2004–2005 eruption of Mount St Helens, Washington, chap. 35 of Sherrod, D.R.,
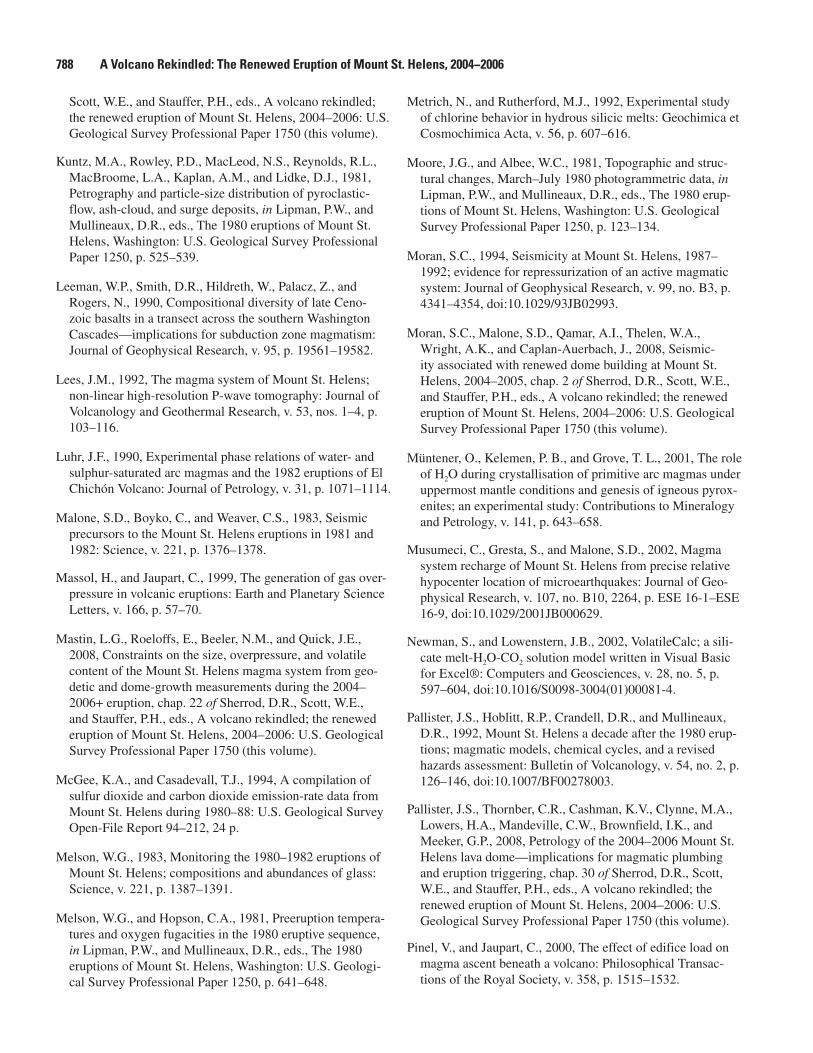
788 A Volcano Rekindled: The Renewed Eruption of Mount St. Helens, 2004−2006
Scott, W.E., and Stauffer, P.H., eds., A volcano rekindled; the renewed eruption of Mount St. Helens, 2004–2006: U.S. Geological Survey Professional Paper 1750 (this volume).
Kuntz, M.A., Rowley, P.D., MacLeod, N.S., Reynolds, R.L., MacBroome, L.A., Kaplan, A.M., and Lidke, D.J., 1981, Petrography and particle-size distribution of pyroclastic-flow, ash-cloud, and surge deposits, in Lipman, P.W., and Mullineaux, D.R., eds., The 1980 eruptions of Mount St. Helens, Washington: U.S. Geological Survey Professional Paper 1250, p. 525–539.
Leeman, W.P., Smith, D.R., Hildreth, W., Palacz, Z., and Rogers, N., 1990, Compositional diversity of late Ceno-zoic basalts in a transect across the southern Washington Cascades—implications for subduction zone magmatism: Journal of Geophysical Research, v. 95, p. 19561–19582.
Lees, J.M., 1992, The magma system of Mount St. Helens; non-linear high-resolution P-wave tomography: Journal of Volcanology and Geothermal Research, v. 53, nos. 1–4, p. 103–116.
Luhr, J.F., 1990, Experimental phase relations of water- and sulphur-saturated arc magmas and the 1982 eruptions of El Chichón Volcano: Journal of Petrology, v. 31, p. 1071–1114.
Malone, S.D., Boyko, C., and Weaver, C.S., 1983, Seismic precursors to the Mount St. Helens eruptions in 1981 and 1982: Science, v. 221, p. 1376–1378.
Massol, H., and Jaupart, C., 1999, The generation of gas over-pressure in volcanic eruptions: Earth and Planetary Science Letters, v. 166, p. 57–70.
Mastin, L.G., Roeloffs, E., Beeler, N.M., and Quick, J.E., 2008, Constraints on the size, overpressure, and volatile content of the Mount St. Helens magma system from geo-detic and dome-growth measurements during the 2004–2006+ eruption, chap. 22 of Sherrod, D.R., Scott, W.E., and Stauffer, P.H., eds., A volcano rekindled; the renewed eruption of Mount St. Helens, 2004–2006: U.S. Geological Survey Professional Paper 1750 (this volume).
McGee, K.A., and Casadevall, T.J., 1994, A compilation of sulfur dioxide and carbon dioxide emission-rate data from Mount St. Helens during 1980–88: U.S. Geological Survey Open-File Report 94–212, 24 p.
Melson, W.G., 1983, Monitoring the 1980–1982 eruptions of Mount St. Helens; compositions and abundances of glass: Science, v. 221, p. 1387–1391.
Melson, W.G., and Hopson, C.A., 1981, Preeruption tempera-tures and oxygen fugacities in the 1980 eruptive sequence, in Lipman, P.W., and Mullineaux, D.R., eds., The 1980 eruptions of Mount St. Helens, Washington: U.S. Geologi-cal Survey Professional Paper 1250, p. 641–648.
Metrich, N., and Rutherford, M.J., 1992, Experimental study of chlorine behavior in hydrous silicic melts: Geochimica et Cosmochimica Acta, v. 56, p. 607–616.
Moore, J.G., and Albee, W.C., 1981, Topographic and struc-tural changes, March–July 1980 photogrammetric data, in Lipman, P.W., and Mullineaux, D.R., eds., The 1980 erup-tions of Mount St. Helens, Washington: U.S. Geological Survey Professional Paper 1250, p. 123–134.
Moran, S.C., 1994, Seismicity at Mount St. Helens, 1987–1992; evidence for repressurization of an active magmatic system: Journal of Geophysical Research, v. 99, no. B3, p. 4341–4354, doi:10.1029/93JB02993.
Moran, S.C., Malone, S.D., Qamar, A.I., Thelen, W.A., Wright, A.K., and Caplan-Auerbach, J., 2008, Seismic-ity associated with renewed dome building at Mount St. Helens, 2004–2005, chap. 2 of Sherrod, D.R., Scott, W.E., and Stauffer, P.H., eds., A volcano rekindled; the renewed eruption of Mount St. Helens, 2004–2006: U.S. Geological Survey Professional Paper 1750 (this volume).
Müntener, O., Kelemen, P. B., and Grove, T. L., 2001, The role of H2O during crystallisation of primitive arc magmas under uppermost mantle conditions and genesis of igneous pyrox-enites; an experimental study: Contributions to Mineralogy and Petrology, v. 141, p. 643–658.
Musumeci, C., Gresta, S., and Malone, S.D., 2002, Magma system recharge of Mount St. Helens from precise relative hypocenter location of microearthquakes: Journal of Geo-physical Research, v. 107, no. B10, 2264, p. ESE 16-1–ESE 16-9, doi:10.1029/2001JB000629.
Newman, S., and Lowenstern, J.B., 2002, VolatileCalc; a sili-cate melt-H2O-CO2 solution model written in Visual Basic for Excel®: Computers and Geosciences, v. 28, no. 5, p. 597–604, doi:10.1016/S0098-3004(01)00081-4.
Pallister, J.S., Hoblitt, R.P., Crandell, D.R., and Mullineaux, D.R., 1992, Mount St. Helens a decade after the 1980 erup-tions; magmatic models, chemical cycles, and a revised hazards assessment: Bulletin of Volcanology, v. 54, no. 2, p. 126–146, doi:10.1007/BF00278003.
Pallister, J.S., Thornber, C.R., Cashman, K.V., Clynne, M.A., Lowers, H.A., Mandeville, C.W., Brownfield, I.K., and Meeker, G.P., 2008, Petrology of the 2004–2006 Mount St. Helens lava dome—implications for magmatic plumbing and eruption triggering, chap. 30 of Sherrod, D.R., Scott, W.E., and Stauffer, P.H., eds., A volcano rekindled; the renewed eruption of Mount St. Helens, 2004–2006: U.S. Geological Survey Professional Paper 1750 (this volume).
Pinel, V., and Jaupart, C., 2000, The effect of edifice load on magma ascent beneath a volcano: Philosophical Transac-tions of the Royal Society, v. 358, p. 1515–1532.
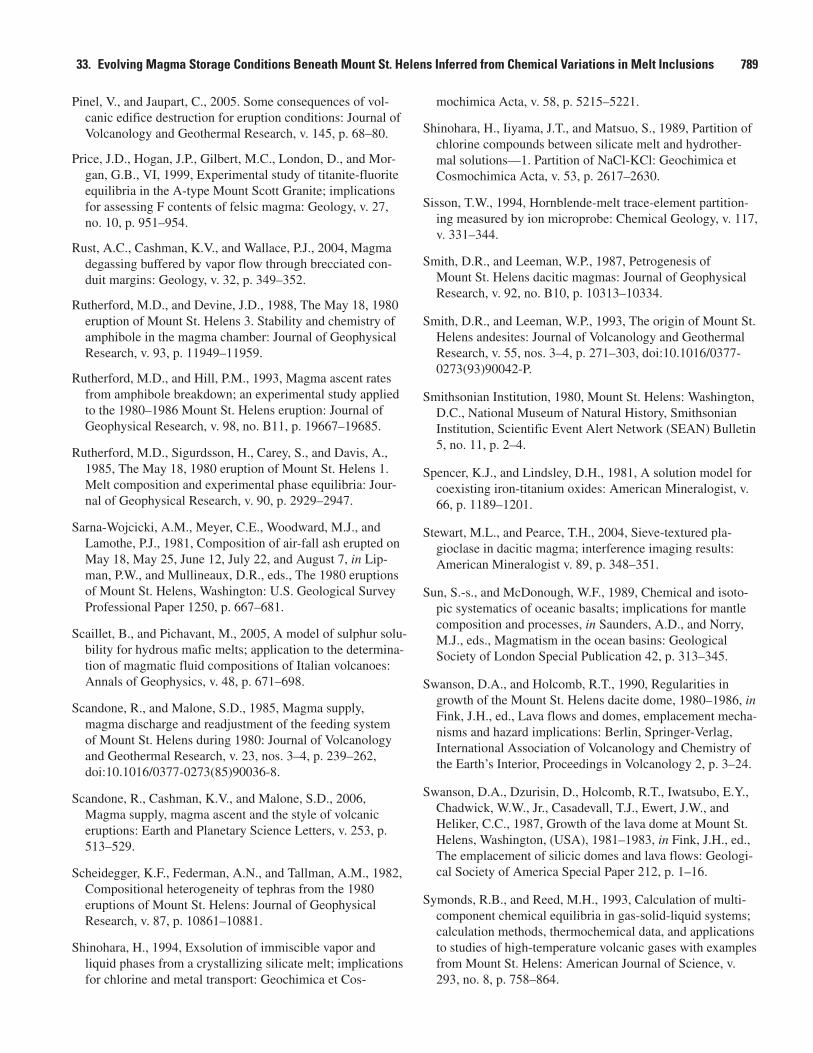
33. Evolving Magma Storage Conditions Beneath Mount St. Helens Inferred from Chemical Variations in Melt Inclusions 789
Pinel, V., and Jaupart, C., 2005. Some consequences of vol-canic edifice destruction for eruption conditions: Journal of Volcanology and Geothermal Research, v. 145, p. 68–80.
Price, J.D., Hogan, J.P., Gilbert, M.C., London, D., and Mor-gan, G.B., VI, 1999, Experimental study of titanite-fluorite equilibria in the A-type Mount Scott Granite; implications for assessing F contents of felsic magma: Geology, v. 27, no. 10, p. 951–954.
Rust, A.C., Cashman, K.V., and Wallace, P.J., 2004, Magma degassing buffered by vapor flow through brecciated con-duit margins: Geology, v. 32, p. 349–352.
Rutherford, M.D., and Devine, J.D., 1988, The May 18, 1980 eruption of Mount St. Helens 3. Stability and chemistry of amphibole in the magma chamber: Journal of Geophysical Research, v. 93, p. 11949–11959.
Rutherford, M.D., and Hill, P.M., 1993, Magma ascent rates from amphibole breakdown; an experimental study applied to the 1980–1986 Mount St. Helens eruption: Journal of Geophysical Research, v. 98, no. B11, p. 19667–19685.
Rutherford, M.D., Sigurdsson, H., Carey, S., and Davis, A., 1985, The May 18, 1980 eruption of Mount St. Helens 1. Melt composition and experimental phase equilibria: Jour-nal of Geophysical Research, v. 90, p. 2929–2947.
Sarna-Wojcicki, A.M., Meyer, C.E., Woodward, M.J., and Lamothe, P.J., 1981, Composition of air-fall ash erupted on May 18, May 25, June 12, July 22, and August 7, in Lip-man, P.W., and Mullineaux, D.R., eds., The 1980 eruptions of Mount St. Helens, Washington: U.S. Geological Survey Professional Paper 1250, p. 667–681.
Scaillet, B., and Pichavant, M., 2005, A model of sulphur solu-bility for hydrous mafic melts; application to the determina-tion of magmatic fluid compositions of Italian volcanoes: Annals of Geophysics, v. 48, p. 671–698.
Scandone, R., and Malone, S.D., 1985, Magma supply, magma discharge and readjustment of the feeding system of Mount St. Helens during 1980: Journal of Volcanology and Geothermal Research, v. 23, nos. 3–4, p. 239–262, doi:10.1016/0377-0273(85)90036-8.
Scandone, R., Cashman, K.V., and Malone, S.D., 2006, Magma supply, magma ascent and the style of volcanic eruptions: Earth and Planetary Science Letters, v. 253, p. 513–529.
Scheidegger, K.F., Federman, A.N., and Tallman, A.M., 1982, Compositional heterogeneity of tephras from the 1980 eruptions of Mount St. Helens: Journal of Geophysical Research, v. 87, p. 10861–10881.
Shinohara, H., 1994, Exsolution of immiscible vapor and liquid phases from a crystallizing silicate melt; implications for chlorine and metal transport: Geochimica et Cos-
mochimica Acta, v. 58, p. 5215–5221.
Shinohara, H., Iiyama, J.T., and Matsuo, S., 1989, Partition of chlorine compounds between silicate melt and hydrother-mal solutions—1. Partition of NaCl-KCl: Geochimica et Cosmochimica Acta, v. 53, p. 2617–2630.
Sisson, T.W., 1994, Hornblende-melt trace-element partition-ing measured by ion microprobe: Chemical Geology, v. 117, v. 331–344.
Smith, D.R., and Leeman, W.P., 1987, Petrogenesis of Mount St. Helens dacitic magmas: Journal of Geophysical Research, v. 92, no. B10, p. 10313–10334.
Smith, D.R., and Leeman, W.P., 1993, The origin of Mount St. Helens andesites: Journal of Volcanology and Geothermal Research, v. 55, nos. 3–4, p. 271–303, doi:10.1016/0377-0273(93)90042-P.
Smithsonian Institution, 1980, Mount St. Helens: Washington, D.C., National Museum of Natural History, Smithsonian Institution, Scientific Event Alert Network (SEAN) Bulletin 5, no. 11, p. 2–4.
Spencer, K.J., and Lindsley, D.H., 1981, A solution model for coexisting iron-titanium oxides: American Mineralogist, v. 66, p. 1189–1201.
Stewart, M.L., and Pearce, T.H., 2004, Sieve-textured pla-gioclase in dacitic magma; interference imaging results: American Mineralogist v. 89, p. 348–351.
Sun, S.-s., and McDonough, W.F., 1989, Chemical and isoto-pic systematics of oceanic basalts; implications for mantle composition and processes, in Saunders, A.D., and Norry, M.J., eds., Magmatism in the ocean basins: Geological Society of London Special Publication 42, p. 313–345.
Swanson, D.A., and Holcomb, R.T., 1990, Regularities in growth of the Mount St. Helens dacite dome, 1980–1986, in Fink, J.H., ed., Lava flows and domes, emplacement mecha-nisms and hazard implications: Berlin, Springer-Verlag, International Association of Volcanology and Chemistry of the Earth’s Interior, Proceedings in Volcanology 2, p. 3–24.
Swanson, D.A., Dzurisin, D., Holcomb, R.T., Iwatsubo, E.Y., Chadwick, W.W., Jr., Casadevall, T.J., Ewert, J.W., and Heliker, C.C., 1987, Growth of the lava dome at Mount St. Helens, Washington, (USA), 1981–1983, in Fink, J.H., ed., The emplacement of silicic domes and lava flows: Geologi-cal Society of America Special Paper 212, p. 1–16.
Symonds, R.B., and Reed, M.H., 1993, Calculation of multi-component chemical equilibria in gas-solid-liquid systems; calculation methods, thermochemical data, and applications to studies of high-temperature volcanic gases with examples from Mount St. Helens: American Journal of Science, v. 293, no. 8, p. 758–864.
790 A Volcano Rekindled: The Renewed Eruption of Mount St. Helens, 2004−2006
Venezky, D.Y., and Rutherford, M.J., 1999, Petrology and Fe-Ti oxide reequilibration of the 1991 Mount Unzen mixed magma: Journal of Volcanology and Geothermal Research, v. 89, p. 213–230, doi:10.1016/S0377-0273(98)00133-4.
Wallace, P.J., 2001, Volcanic SO2 emissions and the abundance and distribution of exsolved gas in magma bodies: Journal of Volcanology and Geothermal Research, v. 108, nos. 1–4, p. 85–106, doi:10.1016/S0377-0273(00)00279-1.
Watson, E.B., and Harrison, T.M., 1983, Zircon saturation revisited; temperature and composition effects in a variety of crustal magma types: Earth and Planetary Science Let-ters, v. 64, p. 295–304.
Weaver, C.S., Zollweg, J.E., and Malone, S.D., 1983, Deep earthquakes beneath Mount St. Helens; evidence for mag-
matic gas transport?: Science, v. 221, p. 1391–1394.
Weaver, C.S., Grant, W.C., and Shemeta, J.E., 1987, Local crustal extension at Mount St. Helens, Washington: Journal of Geophysical Research, v. 92, no. B10, p. 10170–10178.
Webster, J.D., 2004, The exsolution of magmatic hydrosaline chloride liquids: Chemical Geology, v. 210, p. 33–48.
Whitney, J.A., 1984, Fugacities of sulfurous gases in pyrrho-tite-bearing silicic magmas: American Mineralogist, v. 69, p. 69–78.
Williams, D.L., Abrams, G., Finn, C., Dzurisin, D., Johnson, D.J., and Denlinger, R., 1987, Evidence from gravity data for an intrusive complex beneath Mount St. Helens: Journal of Geophysical Research, v. 92, no. B10, p. 10207–10222.
Appendix 1. Chemical Analyses of Glassy Melt Inclusions, Groundmass Glass, and Fe-Ti Oxide Pairs from the 1980–86 and 2004–2006 Eruptions of Mount St. Helens, Washington
[This appendix appears only in the digital versions of this work—in the DVD-ROM that accompanies the printed volume and as a separate file accompanying this chapter on the Web at: http://pubs.usgs.gov/pp/1750. ]
Appendix 1is a spreadsheet file that contains the entire dataset of major, trace-element, and volatile analyses, a selection of which is in tables 2 and 3 in the text. See tables for analytical details.
Appendix 2. Chemical Analyses of Fe-Ti Oxide Pairs from the 1980–86 and 2004–2006 Eruptions of Mount St. Helens, Washington
[This appendix appears only in the digital versions of this work—in the DVD-ROM that accompanies the printed volume and as a separate file accompanying this chapter on the Web at: http://pubs.usgs.gov/pp/1750. ]
Appendix 2 is a spreadsheet file that contains the entire dataset of Fe-Ti analyses and calculated temperature and oxygen fugacity, a selection of which is in table 4 in the text. See table for analytical details.