ex situ evaluation of the composition of protein corona of
TRANSCRIPT
HAL Id: hal-02163344https://hal.archives-ouvertes.fr/hal-02163344
Submitted on 9 Mar 2021
HAL is a multi-disciplinary open accessarchive for the deposit and dissemination of sci-entific research documents, whether they are pub-lished or not. The documents may come fromteaching and research institutions in France orabroad, or from public or private research centers.
L’archive ouverte pluridisciplinaire HAL, estdestinée au dépôt et à la diffusion de documentsscientifiques de niveau recherche, publiés ou non,émanant des établissements d’enseignement et derecherche français ou étrangers, des laboratoirespublics ou privés.
Ex situ evaluation of the composition of protein coronaof intravenously injected superparamagnetic
nanoparticles in ratsUsawadee Sakulkhu, Lionel Maurizi, Morteza Mahmoudi, Mahdi Motazacker,
Marcel Vries, Azza Gramoun, Marie-Gabrielle Ollivier Beuzelin, Jean-PaulVallée, Farhad Rezaee, Heinrich Hofmann
To cite this version:Usawadee Sakulkhu, Lionel Maurizi, Morteza Mahmoudi, Mahdi Motazacker, Marcel Vries, et al..Ex situ evaluation of the composition of protein corona of intravenously injected superparamag-netic nanoparticles in rats. Nanoscale, Royal Society of Chemistry, 2014, 6 (19), pp.11439-11450.�10.1039/C4NR02793K�. �hal-02163344�

Nanoscale RSCPublishing
PAPER
This journal is © The Royal Society of Chemistry 2013 J. Name., 2013, 00, 1-3 | 1
Cite this: DOI: 10.1039/x0xx00000x
Received 00th January 2012,
Accepted 00th January 2012
DOI: 10.1039/x0xx00000x
www.rsc.org/
Ex situ evaluation of the composition of protein
corona of intravenously injected
superparamagnetic nanoparticles in rats
Usawadee Sakulkhua, Lionel Maurizia, Morteza Mahmoudi*bc, Mahdi Motazackerd, Marcel Vriese, Azza Gramounf, Marie-Gabrielle Ollivier Beuzelina, Jean-Paul Valléef, Farhad Rezaee*ef, Heinrich Hofmann*a
It is now well recognized that the surfaces of nanoparticles (NPs) are coated with biomolecules
(e.g., proteins) in a biological medium. Although extensive reports have been published on the
protein corona at the surface of NPs in vitro, there are very few on the in vivo protein corona.
The main reason for having very poor information regarding the protein corona in vivo is that
separation of NPs from the in vivo environment has not been possible by using available
techniques. Knowledge of the in vivo protein corona could lead to better understanding and
prediction of the fate of NPs in vivo. Here, by using the unique magnetic properties of
superparamagnetic iron oxide NPs (SPIONs), NPs were extracted from rat sera after in vivo
interaction with the rat’s physiological system. More specifically, the in vivo protein coronas
of polyvinyl-alcohol-coated SPIONs with various surface charges are defined. The
compositions of the corona at the surface of various SPIONs and their effects on the
biodistribution of SPIONs were examined and compared with the corona composition of
particles incubated for the same time in rat serum.
Introduction
Superparamagnetic iron oxide nanoparticles (SPIONs) are
promising advanced materials for various biomedical
applications, such as targeted drug delivery, contrast agent for
imaging, cell tracking, and transfections.1-6 Iron oxide, γ-Fe2O3,
is of special interest because of the approved biocompatibility
of these nanoparticles (NPs), including the well understood
metabolism of the NPs in the liver.7 For most biomedical
applications, the NPs are in contact with or taken up by various
cell types; in this case, the physicochemical properties of the
NPs, and of their surface in particular, play a crucial role in
their interaction with cells.
Studies conducted in the past few decades on the interaction of
engineered nanomaterials with biologically relevant molecules
have improved our understanding of the behavior of these
materials in human and animal bodies and have helped to
identify in vitro assays that are predictive of in vivo
biodistribution or toxicities. However, there are still valid
concerns regarding in vitro methods for determining the
biocompatibility of NPs or toxicity tests for engineered NPs.8
After NPs have been in contact with biological media, their
surfaces are covered by various biomolecules (e.g., proteins),
forming what is known as a “protein corona”.9-14 One reason
for concern is the still unpredictable composition of the protein
corona in vivo.15
In protein mixtures, the adsorption behavior is the result of
competitive transport, adsorption, desorption, and repulsion
processes. Small proteins diffuse faster than large ones and,
therefore, are detected at higher concentrations compared to the
bulk concentration in the early adsorption stage. However,
larger proteins have a greater potential to cover the surface
because of a larger contact area, which can lead to desorption of
the pre-adsorbed proteins during spreading on the surface.
Either a monolayer or multilayers are formed depending on the
pH, ionic strengths, temperature, and protein–protein
interaction.16 A continuous adsorption–desorption process has
been observed for a contact time of 100 s and a layer thickness
of several nanometers on the surface of NPs.17 Thus, the cell
actually “sees” the corona-coated NPs, rather than pristine
NPs.14
The effects of different physicochemical properties of NPs
(e.g., composition, size, shape, crystallinity, surface area,
surface defects, charge, roughness, transfer capability, and
hydrophobicity/hydrophilicity) and environmental factors (e.g.
[induced] temperature and gradient plasma concentration) on
the formation of the corona have been investigated in detail.13,
18 Because separation of NPs from the in vivo environment was

ARTICLE Journal Name
2 | J. Name., 2012, 00, 1-3 This journal is © The Royal Society of Chemistry 2012
not possible using available techniques, all the corona
evaluations at the surface of NPs were performed in vitro.
However, very recent reports confirmed that the in vitro protein
corona information does not accurately predict
hematocompatibility of colloidal NPs; thus, in vivo evaluation
of the protein corona is required to accurately predict the fate of
NPs inside the human body.
Here, using the unique magnetic properties of SPIONs, NPs
were extracted from rat sera after interacting with the rat’s
physiological system in vivo. We believe that the composition
of the “hard protein corona” (the tightly adsorbed proteins at
the NPs’ surface) corresponds much better to the composition
in vivo than the composition detected after the particles have
been incubated in serum in vitro. In this paper, we not only
show the difference between the composition of the hard
corona detected after incubation in blood in vivo and the
corresponding serum in vitro, we also present an interesting
method to use core shell nanoparticles to investigate the
influence of coatings and surface properties of particles which
cannot be separated magnetically.
Experimental
Preparation of the various SPIONs
The SPIONs were prepared via alkaline co-precipitation, and
polyvinyl alcohol (PVA) coatings were prepared as described
previously.19, 20 The PVA, which had an average molecular
weight of 14,000 g/mol and a hydrolysis degree of 85%
(Mowiol® 3-85), and the carboxylic functionalized polyvinyl
alcohol copolymer (KL-506), which had an average molecular
weight of 30,000–50,000 g/mol and a hydrolysis degree of 74–
80%, were supplied by Kuraray Specialties Europe GmbH,
Hattersheim am Main, Germany. The vinylalcohol-vinylamine
copolymer (M12), which had an average molecular weight of
80,000–140,000, was supplied by Erkol S.A, Tarragona, Spain.
The polymers were dissolved in water then rapidly heated for
15 min (Mowiol® 3-85 and KL-506) or 4 h (M12) at 90°C.
Ultrapure deionized water (Seralpur delta UV/UF setting, 0.055
μS/cm) was used in all synthesis steps.
Positively charged, neutral, and negatively charged NPs were
obtained by added a mixture of Mowiol®3-85 and M12 at a
mass ratio of 45 (with a final concentration of 9% [w/v]), 9%
(w/v) Mowiol®3-85, and 6% (w/v) KL-506 solutions,
respectively, to a 10 mg Fe/mL SPION suspension at a volume
ratio of 1:1. The mixture was preserved for at least 1 week and
stored at 4°C until used. The particle suspension was adjusted
to pH 7.4 for animal treatment.
Particle characterization
The hydrodynamic diameters of PVA-coated NPs after
adjustment to pH 7.4 were measured by dynamic laser
scattering using a ZetaPALS equipped with a BI-9000AT
digital autocorrelator (Brookhaven Instruments Cooperation,
LABORCHEMIE GmbH, Austria). NPs were diluted in
deionized water at 100 g Fe/mL and sonicated for a few
seconds. The theoretical refractive index of 2.42 of magnetite21
was used to calculate the number-weighted distribution from
the raw intensity-weighted data. The Smoluchowski method
was chosen for data processing. Viscosity, refractive index, and
dielectric constant of pure water were used to characterize the
solvent. The zeta potential was also determined using the same
instrument.
Cytotoxicity study
RAW 264.7 (mouse leukemic monocyte macrophage cell line)
cells were maintained in Dulbecco’s Modified Eagle Medium
(DMEM, Gibco B-RL, Invitrogen AG, Basel, Switzerland)
supplemented with 10% fetal bovine serum and 1% penicillin
G/streptomycin sulfate (10,000 units mL−1; 10,000 μg mL−1;
Gibco B-RL, Invitrogen AG, Basel, Switzerland) at 37°C under
5% CO2. One day before the experiments, the cells were
scraped and seeded at a density of 85 × 103 cells per well (100
L) in flat-bottomed 96-well plates (Costar, Corning
Incorporated, Maryland, USA). On the day of the experiments,
the medium was changed to fresh complete medium with PVA-
SPIONs at concentrations of 0.1, 0.2, 0.4, and 0.8 mg Fe/mL.
The cells were incubated at 37°C for 24 h and washed once
with 120 L phosphate buffered saline (PBS).
For the live cell PrestoBlue cell viability assay, 100 L of 1 ×
PrestoBlue reagent (Invitrogen, Switzerland) in complete
medium was added per well, then further incubated at 37°C for
1 h. The fluorescence was read at excitation and emission
wavelengths of 535 and 615 nm, respectively, using a
microplate reader (Infinite 200 PRO, Tecan Group Ltd.,
Männedorf, Switzerland).
Data are presented as mean ± standard deviation (SD). All
analyses were performed three times (n = 3). Values were
considered significant at P < 0.05.
Animal treatment
All the experimental procedures were approval by the local
animal care committees and were conducted in accordance with
the guidelines of the Swiss Committee on Animal Experiments.
Two-month-old female Lewis rats (approximately 200 g,
purchased from Javier France) were anesthetized with 5%
isoflurane. The rats were divided into four groups according to
the injected liquids: 150 mM NaCl (control rat), positively
charged NPs, neutral NPs, and negatively charged NPs. Then,
NPs at 7 mg Fe, corresponding to 10.36 mg SPIONs, were
injected intravenously through the tail. The rats were
anesthetized with 5% isoflurane and killed 15 min after the
injection. Various organs and blood were collected. The organs
were weighed and stored at −80°C until analysis. The blood
was collected, allowed to clot at room temperature for 15 min,
and then centrifuged at 1,500 g for 15 min at 4°C (Labofuge
400R, Heraeus, Hanau, Germany) to separate the sera and
blood cell compartments. The sera were loaded in a magnetic
separator for protein separation.
In vitro hard corona
The blood volume of a 200 g rat was calculated based on the
body weight using the experimentally determined equation of
Journal Name ARTICLE
This journal is © The Royal Society of Chemistry 2012 J. Name., 2012, 00, 1-3 | 3
Lee and Blaufox22: BV = 0.06 × BW + 0.77. Here, BV
represents the blood volume in milliliters, and BW represents
the body weight in grams. From the in vivo study, the serum
volume was half the total blood volume after coagulation and
blood cell separation. The SPIONs were incubated for 15 min
at 37°C with rat serum (Ref. no. 10710C, lot. 1229686A,
Invitrogen Corporation, Frederick, Maryland, USA) and the
same SPION/serum ratio as that in the in vivo study. After 15
min incubation, the hard corona proteins were separated using a
magnetic separator, as described below.
Ex vivo protein separation using a magnetic separator
The hard corona–SPION complexes with excess serum proteins
from the in vivo and in vitro experiments were loaded into a
column in a magnetic reactor (Fig. S1). The trapped NPs
(protein corona–NP complex) were then washed with solutions
of increasing ionic strength: 1× PBS (Life Technologies Europe
B.V., Switzerland) and 1× PBS with NaCl added to reach final
concentrations of 0.5, 1.0, and 2.0 M. After being washed with
the highest salt concentration solution, the trapped NPs were
eluted from a Ni-Fe wire by removal of the magnets. The hard
protein coronas were analyzed by liquid chromatography mass
spectrometry/mass spectrometry (LC-MS/MS).
Protein detection (LTQ-Orbitrap-XL)
NPs were spun down by centrifugation at 20,000 g for 10 min
and the pellet was resuspended in 25 µL Sequencing Grade
Trypsin (12.5 ng/µL in 25 mM ammonium bicarbonate) and
digested using a CEM Discover Microwave Digestor for 15
min at 55°C (70 W). The digestion was stopped by addition of
200 µL 50% acetonitrile + 5% formic acid. The NPs were dried
using a Thermo SpeedVac and resuspended in 13 µL 5%
acetonitrile containing 0.1% formic acid.
Samples were analyzed by NanoLC–MS/MS on an Ultimate
3000 system (Dionex, Amsterdam, The Netherlands) interfaced
on-line with a LTQ–Orbitrap-XL mass spectrometer
(ThermoFisher Scientific, San Jose, CA). Re-dissolved peptides
were loaded onto a 5 mm × 300 µm i.d. trapping micro column
packed with C18 PepMAP100 5 µm particles (Dionex) in 0.1%
FA at a flow rate of 20 µL/min. Upon loading and washing,
peptides were back-flush eluted onto a 15 cm × 75 µm i.d.
nano-column, packed with C18 PepMAP100 3 µm particles
(Dionex). The mobile phase gradient was delivered at the flow
rate of 300 nL/min as follows: 5–50% solvent B in 93 min; 50–
80% B in 5 min; 80% B for 10 min; and returning to 5% B in 5
min. Solvent A was 100:0 H2O/acetonitrile (v/v) with 0.1%
formic acid, and solvent B was 10:90 H2O/acetonitrile (v/v)
with 0.1% formic acid. Peptides were infused into the mass
spectrometer via dynamic Nanospray probe (ThermoElectron
Corp.) with a stainless steel emitter (Proxeon, Odense, DK).
The typical spray voltage was 1.6 kV with no sheath and
auxiliary gas flow; the ion transfer tube temperature was 200°C.
The mass spectrometer was operated in data-dependent mode.
The automated gain control was set to 5 × 10⁵ charges and 1 ×
104 charges for MS/MS at the linear ion trap analyzer. A DDA
cycle consisted of the survey scan within m/z 300–1300 at the
Orbitrap analyzer with target mass resolution of 60,000
(FWHM, full width at half maximum at m/z 400) followed by
MS/MS fragmentation of the five most intense precursor ions
under the relative collision energy of 35% in the linear trap.
Singly charged ions were excluded from MS/MS experiments,
and m/z of fragmented precursor ions were dynamically
excluded for a further 90 s. The ion selection threshold for
triggering MS/MS experiments was set to 500 counts. An
activation parameter q of 0.25 and activation time of 30 ms
were applied. PEAKS DB (version 5.3) was applied to spectra
generated by LTQ-ORBITRAP-XL to screen the protein
composition of the corona of the NPs. The false discovery rate
was manually adjusted to zero.
To determine the total number of the LC-MS/MS spectra for all
of the peptides that were attributed to a matched protein, a
semi-quantitative assessment of the protein amounts was
conducted using the spectral counting (SpC) method by
applying the following equation13:
------- Equation 1
where NpSpCk is the normalized percentage of the spectral
count for protein k, SpC is the spectral count identified, and
MW is the molecular weight (in kDa) of protein k.
Magnetic susceptibility
SPIONs are initially superparamagnetic, whereas free Fe ions
are paramagnetic. The magnetic volume susceptibility χvol of
magnetite is 6 × 10⁶ (SI unit), whereas that of ferritin is 0.8-2.4
× 10−4. This 1010 magnitude difference of the values indicates
that iron oxide NPs, not Fe ions or a Fe ion–ferritin complex,
would be determined by a magnetic susceptibility
measurement.23 Magnetization versus field measurements,
M(H), were performed using a MS3 magnetic susceptibility
meter (Bartington Instruments Limited, Oxon, England). A
MS2B dual-frequency sensor and MS2G single-frequency
sensor were used for the organs and serum, respectively. The
measurements were performed in triplicate at room
temperature. The organs from the rat not injected with NPs
were used as controls.
Data analysis for biodistribution of the NPs
All of the data are expressed as the percentage of the total Fe
injected dose after verification of the concordance between the
injected dose and the total activity observed in the organ.
Results
PVA-coated SPIONs with various surface charges (i.e.,
negative, positive, and neutral) were prepared for in vivo
protein corona evaluations. The effective hydrodynamic
diameters of positive, neutral, and negative NPs were 90 ± 31,

ARTICLE Journal Name
4 | J. Name., 2012, 00, 1-3 This journal is © The Royal Society of Chemistry 2012
95 ± 18, and 91 ± 22 nm, respectively. SPIONs coated with
PVA containing amino and carboxyl groups showed positive
and negative charges of 13 and −15 mV, respectively. SPIONs
coated with plain PVA (-OH) showed a slight positive charge
of 6 mV that represented a neutral particle. All types of SPIONs
showed no trace of toxicity after interactions with RAW 264.7
cells (Fig. 1).
0
20
40
60
80
100
120
0 0.1 0.2 0.4 0.8
%c
ell
via
bil
ity
PVA-SPION (mgFe/mL)
Control Positively charged NPs
Neutral NPs Negatively charged NPs
Fig. 1 The percentage cell viability of RAW 264.7 (mouse leukemic monocyte
macrophage cell line) cells after incubation with positively charged, neutral, and
negatively charged NPs at 37°C for 24 h. No difference between cells incubated
with NPs and control (no NPs) could be observed, indicating no influence of NPs
on cytotoxicity.
To investigate the in vivo protein–SPION interaction, 1.4 mL (7
mg Fe) of various SPIONs was injected intravenously into the
rats’ tails; 15 min after the injection, the SPIONs were collected
from the rats’ blood using a magnetic separator. To characterize
the hard corona composition, the separated NPs were washed
with PBS with an increasing salt content as high as 2 M NaCl.
The hard coronas of in vivo SPIONs with various surface
charges were evaluated using LC-MS/MS techniques. The
NpSpC values present the relative amounts of the identified
proteins in the hard corona. The NpSpC results for all detected
proteins are presented in Tables S1–S3 (in Supplementary
information).
Proteins showing a relatively high amount (NpSpCk >2 at the
surface of at least one particle type) were assumed more likely
to influence the biological effects of NPs, and are listed in
Table 1. Without considering the amounts, the hard corona
proteins on the three different NPs surfaces involved in the
main biological processes were also different (Table 2).
Lower molecular weight proteins (less than 30 kDa) were
observed more on all three different surface-charged NPs
comparing with higher molecular weight proteins. The LC-
MS/MS results indicate that the fibrinogen-based proteins (i.e.,
alpha and beta chains) were significant in the in vivo
composition of the protein corona (positively charged SPIONs:
NpSpC percentages of 7.90 ± 0.09 and 2.75 ± 0.04 for the
fibrinogen alpha and beta chains, respectively; neutral SPIONs:
NpSpC percentages of 9.05 ± 0.85, 8.86 ± 0.98, and 7.30 ± 0.81
for the fibrinogen alpha, beta, and gamma chains, respectively;
negatively charged SPIONs: NpSpC percentages of 4.24 ±
0.00, 2.26 ± 0.00, and 2.02 ± 0.00 for the fibrinogen alpha, beta,
and gamma chains, respectively). Other proteins abundant at
the surface of positively charged and neutral NPs, but not on
negatively charged NPs, were complement C3 and alpha-2HS-
glycoprotein (which is involved in endocytosis, brain
development, and bone tissue formation, although its exact
function is poorly understood24). In addition, some proteins
were found on neutral and negatively charged NPs but not on
positively charged NPs (i.e., apolipoprotein A-II,
serine/arginine-rich splicing factor 5, ficolin-1).
The surface charge of the SPIONs plays a crucial role in the
type of adsorbed proteins. For instance, the apolipoprotein A-II
precursor, which is crucial in mediating the transport of certain
NPs through blood–brain barriers, was a significant component
of the hard corona of neutral and negatively charged SPIONs,
but not positively charged SPIONs in vivo (NpSpC of 4.85 ±
0.53% and 7.15± 0.00% for the neutral and negatively charged
SPIONs, respectively).
For the higher molecular weight protein ranges, depending on
the charge of the SPIONs, the NpSpC amounts exhibited “dual”
variation; in this case, the neutral SPIONs contained
significantly higher amounts of 50–70 kDa proteins than the
charged SPIONs did.
0
10
20
30
40
50
60
70
>120 90-120 70-90 50-70 30-50 <30
Np
Sp
C (
%)
Molecular weight (kDa)
Positively charged NPs
Neutral NPs
Negatively charged NPs
Fig. 2 Normalized spectral counts (NpSpCs) of proteins of various molecular
weight ranges contained in the hard corona of the three types of charged SPIONs
after injection into and recovery from mice.
The amounts of proteins in the hard corona of charged NPs
increased with decreasing molecular weight. The relative
amounts of 90–120 kDa proteins were lowest, whereas the
amounts of protein with molecular weight less than 30 kDa
were highest. However, the amounts of proteins slightly
increased among proteins larger than 120 kDa (Fig. 2).
Journal Name ARTICLE
This journal is © The Royal Society of Chemistry 2012 J. Name., 2012, 00, 1-3 | 5
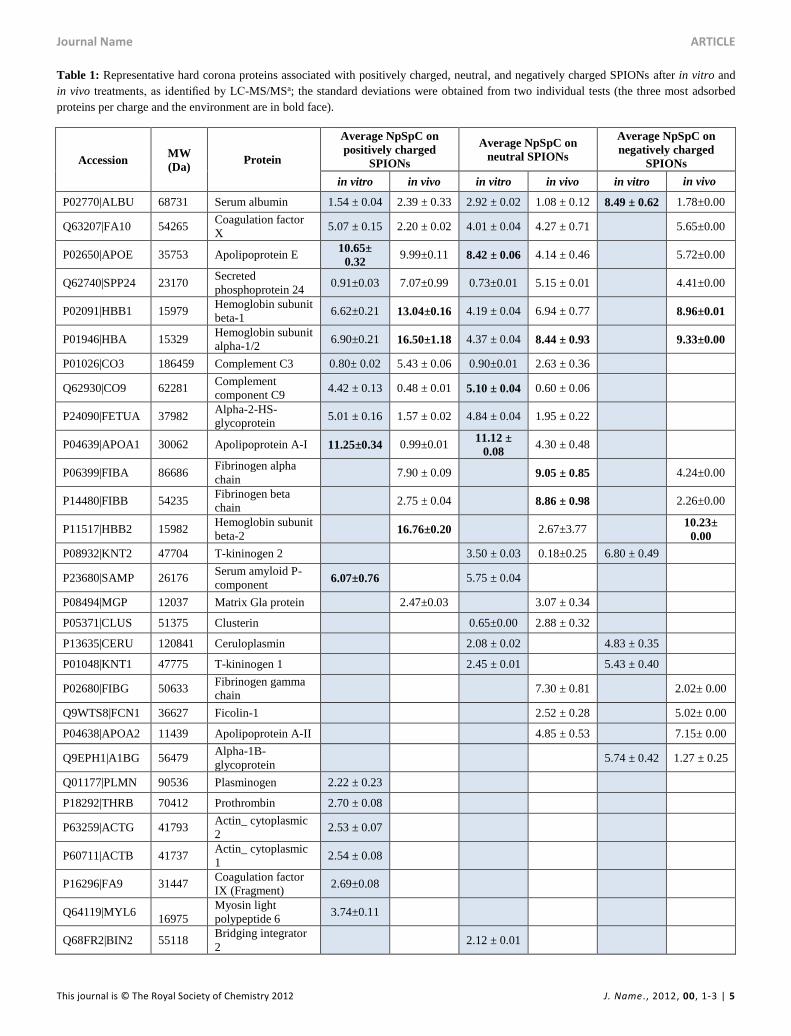
Table 1: Representative hard corona proteins associated with positively charged, neutral, and negatively charged SPIONs after in vitro and
in vivo treatments, as identified by LC-MS/MSa; the standard deviations were obtained from two individual tests (the three most adsorbed
proteins per charge and the environment are in bold face).
Accession MW
(Da) Protein
Average NpSpC on
positively charged
SPIONs
Average NpSpC on
neutral SPIONs
Average NpSpC on
negatively charged
SPIONs
in vitro in vivo in vitro in vivo in vitro in vivo
P02770|ALBU 68731 Serum albumin 1.54 ± 0.04 2.39 ± 0.33 2.92 ± 0.02 1.08 ± 0.12 8.49 ± 0.62 1.78±0.00
Q63207|FA10 54265 Coagulation factor
X 5.07 ± 0.15 2.20 ± 0.02 4.01 ± 0.04 4.27 ± 0.71
5.65±0.00
P02650|APOE 35753 Apolipoprotein E 10.65±
0.32 9.99±0.11 8.42 ± 0.06 4.14 ± 0.46
5.72±0.00
Q62740|SPP24 23170 Secreted
phosphoprotein 24 0.91±0.03 7.07±0.99 0.73±0.01 5.15 ± 0.01
4.41±0.00
P02091|HBB1 15979 Hemoglobin subunit
beta-1 6.62±0.21 13.04±0.16 4.19 ± 0.04 6.94 ± 0.77
8.96±0.01
P01946|HBA 15329 Hemoglobin subunit
alpha-1/2 6.90±0.21 16.50±1.18 4.37 ± 0.04 8.44 ± 0.93
9.33±0.00
P01026|CO3 186459 Complement C3 0.80± 0.02 5.43 ± 0.06 0.90±0.01 2.63 ± 0.36
Q62930|CO9 62281 Complement
component C9 4.42 ± 0.13 0.48 ± 0.01 5.10 ± 0.04 0.60 ± 0.06
P24090|FETUA 37982 Alpha-2-HS-
glycoprotein 5.01 ± 0.16 1.57 ± 0.02 4.84 ± 0.04 1.95 ± 0.22
P04639|APOA1 30062 Apolipoprotein A-I 11.25±0.34 0.99±0.01 11.12 ±
0.08 4.30 ± 0.48
P06399|FIBA 86686 Fibrinogen alpha
chain 7.90 ± 0.09
9.05 ± 0.85
4.24±0.00
P14480|FIBB 54235 Fibrinogen beta
chain 2.75 ± 0.04
8.86 ± 0.98
2.26±0.00
P11517|HBB2 15982 Hemoglobin subunit
beta-2 16.76±0.20
2.67±3.77
10.23±
0.00
P08932|KNT2 47704 T-kininogen 2
3.50 ± 0.03 0.18±0.25 6.80 ± 0.49
P23680|SAMP 26176 Serum amyloid P-
component 6.07±0.76
5.75 ± 0.04
P08494|MGP 12037 Matrix Gla protein
2.47±0.03
3.07 ± 0.34
P05371|CLUS 51375 Clusterin
0.65±0.00 2.88 ± 0.32
P13635|CERU 120841 Ceruloplasmin
2.08 ± 0.02
4.83 ± 0.35
P01048|KNT1 47775 T-kininogen 1
2.45 ± 0.01
5.43 ± 0.40
P02680|FIBG 50633 Fibrinogen gamma
chain 7.30 ± 0.81
2.02± 0.00
Q9WTS8|FCN1 36627 Ficolin-1
2.52 ± 0.28
5.02± 0.00
P04638|APOA2 11439 Apolipoprotein A-II
4.85 ± 0.53
7.15± 0.00
Q9EPH1|A1BG 56479 Alpha-1B-
glycoprotein 5.74 ± 0.42 1.27 ± 0.25
Q01177|PLMN 90536 Plasminogen 2.22 ± 0.23
P18292|THRB 70412 Prothrombin 2.70 ± 0.08
P63259|ACTG 41793 Actin_ cytoplasmic
2 2.53 ± 0.07
P60711|ACTB 41737 Actin_ cytoplasmic
1 2.54 ± 0.08
P16296|FA9 31447 Coagulation factor
IX (Fragment) 2.69±0.08
Q64119|MYL6 16975
Myosin light
polypeptide 6 3.74±0.11
Q68FR2|BIN2 55118 Bridging integrator
2 2.12 ± 0.01

ARTICLE Journal Name
6 | J. Name., 2012, 00, 1-3 This journal is © The Royal Society of Chemistry 2012
P08721|OSTP 34963 Osteopontin
3.17 ± 0.35
P12346|TRFE 76395 Serotransferrin
9.34 ± 0.68
P68136|ACTS 42051 Actin_ alpha
skeletal muscle 3.08 ± 0.23
Q9QX79|FETU
B 41533 Fetuin-B
7.81 ± 0.57
P55159|PON1 39358 Serum paraoxonase
/arylesterase 1 3.30 ± 0.24
P06866|HPT 38563 Haptoglobin
15.94 ±
0.02
P26644|APOH 33197 Beta-2-glycoprotein
1 6.79 ± 0.88
P04797|G3P 35828
Glyceraldehyde-3-
phosphate
dehydrogenase
3.99± 0.00
P48032|TIMP3 24226 Metalloproteinase
inhibitor 3 2.53± 0.00
aThe normalized spectral counts (NSpCs) were calculated for each protein according to Equation 1. This table contains only the most
significant hits; the full list of the most abundant proteins identified by LC-MS/MS is provided in Tables S1 and S6 in the additional file.
The numbers of different proteins that compose the protein
coronas are different for the different charges. The positively
charged NPs contained the lowest number of different proteins
(32) whereas the neutral and negatively charged NPs contained
55 and 51 different proteins, respectively. All three surfaces
shared up to 32% proteins, while the proteins that bound
specifically on the positively charged, neutral, and negatively
charged NPs were 7%, 27%, and 19%, respectively (Fig. 3).
Positive-
Neutral-
Negative
32%
Positive
7% Positive-
Neutral
0%
Neutral
27%
Neutral-
Negative
12%
Negative
19%
Positive-
Negative
3%
Fig 3 Proportions (by number) of all proteins identified in the hard corona of NPs
with different surface charges (positive, neutral, negative) after injection into
and recovery from rats.
None of the proteins was present on both positive and neutral
NPs, and only a few proteins bound both positively and
negatively charged NPs (these had NpSpCs < 2).
In addition to types of proteins, the amounts of each type also
influence the biological effect in vivo. Figure 4 shows the
relative amount of each type of protein that was observed on
each type of NPs. As shown in Fig. 4, the corona composition
of the positively charged SPIONs consisted of proteins that
were also detected on the neutral NPs and partially on
negatively charged NPs; however, the latter two contained
many other proteins. In addition, the 10 most abundant proteins
in the three different protein coronas were different.
The LC-MS/MS results indicate that the composition of the
protein coronas of all three charged NPs differed between the in
vivo and in vitro experiments, despite having the same protein
source (i.e., rat serum) under the same standard physiological
temperature (37°C) and incubation time (Table 1). Serum
albumin was the only important protein that was observed on
all of the NPs in vivo and in vitro. However, a relatively high
amount of serum albumin was only measured for the negatively
charged NPs in vitro, whereas the level was low for all the
other NPs and conditions. The second group of most abundant
proteins at the NP surface were coagulation factor X, secreted
phosphoprotein 24, hemoglobin subunit beta-1, and alpha-1/2
and Apolipoprotein E which were only absent from the
negatively charged NPs for the in vitro incubation. Of note, the
detection of factor X in serum appeared to be because not all
factor X was consumed in the conversion of prothrombin into
thrombin.25 Complement C3, complement component C9,
Apolipoprotein A-I and alpha-2HS-glycoprotein were detected
under both in vitro and in vivo on positively charged and
neutral NPs, but not on negatively charged NPs.

Journal Name ARTICLE
This journal is © The Royal Society of Chemistry 2012 J. Name., 2012, 00, 1-3 | 7
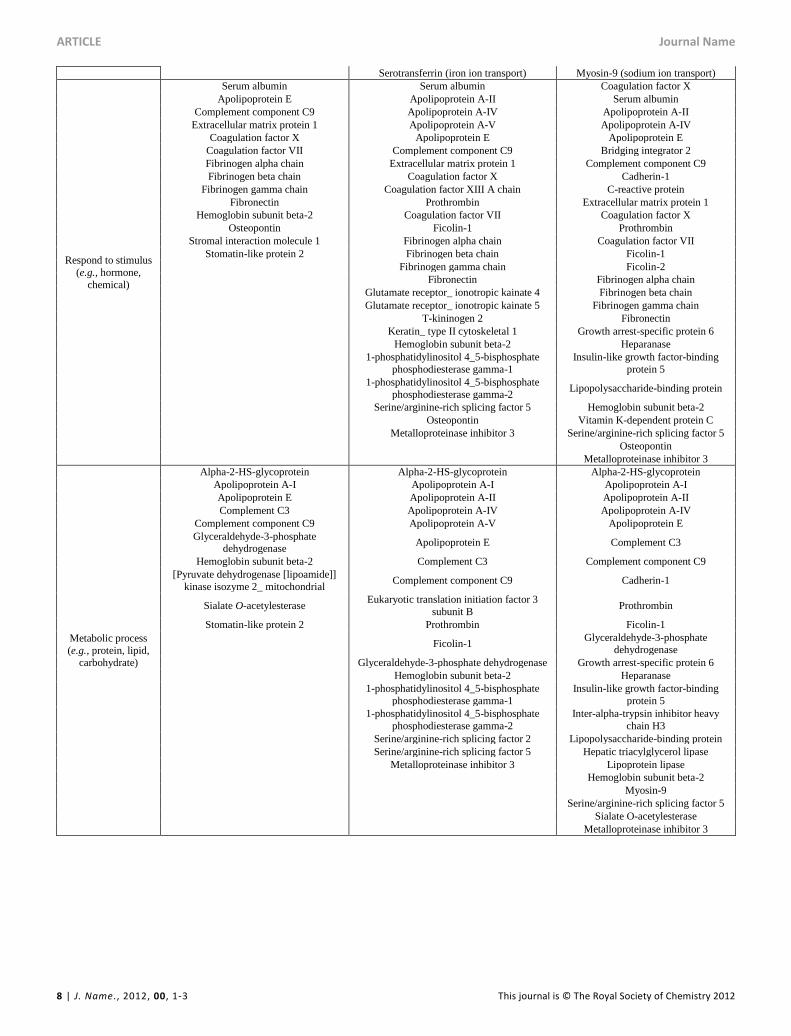
Table 2 Hard corona proteins from the in vivo study that are involved in the major biological processes (based on the information from www.uniprot.org and
www.string-db.org).
Biological process Positive Neutral Negative
Blood coagulation
Coagulation factor VII Coagulation factor XIII A chain Prothrombin
Fibrinogen alpha chain Prothrombin Coagulation factor VII
Fibrinogen beta chain Coagulation factor VII Coagulation factor IX (Fragment)
Fibrinogen gamma chain Coagulation factor IX (Fragment) Fibrinogen alpha chain
Fibrinogen alpha chain Fibrinogen beta chain
Fibrinogen beta chain Fibrinogen gamma chain
Fibrinogen gamma chain Growth arrest-specific protein 6
Kininogen-1 Vitamin K-dependent protein C
Hemostasis
Coagulation factor VII Coagulation factor XIII A chain Prothrombin
Fibrinogen alpha chain Prothrombin Coagulation factor VII
Fibrinogen beta chain Coagulation factor VII Coagulation factor IX (Fragment)
Fibrinogen gamma chain Coagulation factor IX (Fragment) Fibrinogen alpha chain
Fibrinogen alpha chain Fibrinogen beta chain
Fibrinogen beta chain Fibrinogen gamma chain
Fibrinogen gamma chain Growth arrest-specific protein 6
Kininogen-1 Vitamin K-dependent protein C
Vitamin K-dependent protein S Vitamin K-dependent protein S
Acute inflammatory
response
Complement C3 Complement C3 Complement C3
Fibronectin Prothrombin C-reactive protein
Murinoglobulin-1 Fibronectin Prothrombin
Kininogen-1 Fibronectin
T-kininogen 2 Lipopolysaccharide-binding protein
Murinoglobulin-1 Murinoglobulin-1
Complement
activation
Complement C3 Complement C3 Complement C3
Complement component C9 Complement component C9 Complement component C9
Ficolin-1 Ficolin-1
Ficolin-2
Immune system process
Complement C3 Apolipoprotein A-IV Apolipoprotein A-IV
Complement component C9 Complement C3 Complement C3
Hemoglobin subunit beta-2 Complement component C9 Complement component C9
Osteopontin Ficolin-1 Ficolin-1
Stomatin-like protein 2 Hemoglobin subunit beta-2 Ficolin-2
1-phosphatidylinositol 4_5-bisphosphate
phosphodiesterase gamma-1 Lipopolysaccharide-binding protein
1-phosphatidylinositol 4_5-bisphosphate
phosphodiesterase gamma-2 Hemoglobin subunit beta-2
Sperm flagellar protein 2 Myosin-9
Osteopontin Osteopontin
Transport
Serum albumin Serum albumin Serum albumin
Apolipoprotein A-I (lipid transport) Apolipoprotein A-I (lipid transport) Apolipoprotein A-I (lipid transport)
Apolipoprotein E (positive regulation of lipid transport,
vesicle-mediated transport)
Apolipoprotein A-II (negative regulation of
transmembrane transport
Apolipoprotein A-II (negative regulation of transmembrane
transport)
Hemoglobin subunit beta-2
(oxygen transport) Apolipoprotein A-IV (lipid transport) Apolipoprotein A-IV (lipid transport)
Band 3 anion transport protein (inorganic anionic transport)
Apolipoprotein E (positive regulation of lipid transport, vesicle-mediated transport)
Apolipoprotein E (positive regulation
of lipid transport, vesicle-mediated
transport)
Stromal interaction molecule 1 (divalent
inorganic/metal cation transport)
Clusterin (manganese ion transmembrane
transport)
Cadherin-1 (positive regulation of
intracellular transport)
Stomatin-like protein 2
(divalent inorganic/metal cation transport, intracellular transport)
Prothrombin (positive regulation of
intracellular transport)
Prothrombin (positive regulation of
intracellular transport)
Glutamate receptor_ ionotropic kainate 4
(ion transmembrane transport)
Growth arrest-specific protein 6
(negative regulation of intracellular protein transport)
Glutamate receptor_ ionotropic kainite 5
(ion transmembrane transport)
Lipopolysaccharide-binding protein
(lipopolysaccharide transport)
Hemoglobin subunit beta-2 (oxygen
transport) Hepatic triacylglycerol lipase (lipid
transport)
1-phosphatidylinositol 4_5-bisphosphate
phosphodiesterase gamma-2 (positive
regulation of calcium ion transmembrane transporter activity)
Hemoglobin subunit beta-2 (oxygen
transport)
ARTICLE Journal Name
8 | J. Name., 2012, 00, 1-3 This journal is © The Royal Society of Chemistry 2012
Serotransferrin (iron ion transport) Myosin-9 (sodium ion transport)
Respond to stimulus
(e.g., hormone,
chemical)
Serum albumin Serum albumin Coagulation factor X
Apolipoprotein E Apolipoprotein A-II Serum albumin
Complement component C9 Apolipoprotein A-IV Apolipoprotein A-II
Extracellular matrix protein 1 Apolipoprotein A-V Apolipoprotein A-IV
Coagulation factor X Apolipoprotein E Apolipoprotein E
Coagulation factor VII Complement component C9 Bridging integrator 2
Fibrinogen alpha chain Extracellular matrix protein 1 Complement component C9
Fibrinogen beta chain Coagulation factor X Cadherin-1
Fibrinogen gamma chain Coagulation factor XIII A chain C-reactive protein
Fibronectin Prothrombin Extracellular matrix protein 1
Hemoglobin subunit beta-2 Coagulation factor VII Coagulation factor X
Osteopontin Ficolin-1 Prothrombin
Stromal interaction molecule 1 Fibrinogen alpha chain Coagulation factor VII
Stomatin-like protein 2 Fibrinogen beta chain Ficolin-1
Fibrinogen gamma chain Ficolin-2
Fibronectin Fibrinogen alpha chain
Glutamate receptor_ ionotropic kainate 4 Fibrinogen beta chain
Glutamate receptor_ ionotropic kainate 5 Fibrinogen gamma chain
T-kininogen 2 Fibronectin
Keratin_ type II cytoskeletal 1 Growth arrest-specific protein 6
Hemoglobin subunit beta-2 Heparanase
1-phosphatidylinositol 4_5-bisphosphate
phosphodiesterase gamma-1
Insulin-like growth factor-binding
protein 5
1-phosphatidylinositol 4_5-bisphosphate
phosphodiesterase gamma-2 Lipopolysaccharide-binding protein
Serine/arginine-rich splicing factor 5 Hemoglobin subunit beta-2
Osteopontin Vitamin K-dependent protein C
Metalloproteinase inhibitor 3 Serine/arginine-rich splicing factor 5
Osteopontin
Metalloproteinase inhibitor 3
Metabolic process
(e.g., protein, lipid, carbohydrate)
Alpha-2-HS-glycoprotein Alpha-2-HS-glycoprotein Alpha-2-HS-glycoprotein
Apolipoprotein A-I Apolipoprotein A-I Apolipoprotein A-I
Apolipoprotein E Apolipoprotein A-II Apolipoprotein A-II
Complement C3 Apolipoprotein A-IV Apolipoprotein A-IV
Complement component C9 Apolipoprotein A-V Apolipoprotein E
Glyceraldehyde-3-phosphate dehydrogenase
Apolipoprotein E Complement C3
Hemoglobin subunit beta-2 Complement C3 Complement component C9
[Pyruvate dehydrogenase [lipoamide]]
kinase isozyme 2_ mitochondrial Complement component C9 Cadherin-1
Sialate O-acetylesterase Eukaryotic translation initiation factor 3
subunit B Prothrombin
Stomatin-like protein 2 Prothrombin Ficolin-1
Ficolin-1
Glyceraldehyde-3-phosphate dehydrogenase
Glyceraldehyde-3-phosphate dehydrogenase Growth arrest-specific protein 6
Hemoglobin subunit beta-2 Heparanase
1-phosphatidylinositol 4_5-bisphosphate
phosphodiesterase gamma-1
Insulin-like growth factor-binding
protein 5
1-phosphatidylinositol 4_5-bisphosphate
phosphodiesterase gamma-2
Inter-alpha-trypsin inhibitor heavy
chain H3
Serine/arginine-rich splicing factor 2 Lipopolysaccharide-binding protein
Serine/arginine-rich splicing factor 5 Hepatic triacylglycerol lipase
Metalloproteinase inhibitor 3 Lipoprotein lipase
Hemoglobin subunit beta-2
Myosin-9
Serine/arginine-rich splicing factor 5
Sialate O-acetylesterase
Metalloproteinase inhibitor 3

Journal Name ARTICLE
This journal is © The Royal Society of Chemistry 2012 J. Name., 2012, 00, 1-3 | 9
MGP2%
HBA17%
HBB113%
HBB217%
SPP247%
APOE10%FIBB
3%
FA102%
ALBU2%
FIBA8%
CO35%
Others(Ave.NpSpCk<2)
14%
Posi velychargedNPsAPOA25% MGP
3%
HBA8%
HBB17% HBB2
3%
SPP245%
APOA14%
OSTP3%APOE
4%FCN13%
FIBG7%
CLUS3%
FIBB9%
FA104%
FIBA9%
CO33%
Others(Ave.NpSpCk<2)
20%
NeutralNPs
APOA27% HBA
9%
HBB19%
HBB210%
SPP244%TIMP3
3%APOE6%
G3P4%
FCN15%
FIBG2%
FIBB2%
FA106%
FIBA4%
Others(Ave.NpSpCk<2)
29%
Nega velychargedNPs
Fig. 4. Percentage of relative amount of all hard corona proteins from in vivo study that were observed on each type of NPs.
The protein coronas formed in vivo contained considerably
higher amounts of low molecular weight (<30 kDa) proteins
compared with the in vitro coronas (Fig. 5). In contrast, the 30–
50 kDa proteins were more abundant in the hard coronas
formed in vitro than in those formed in vivo. For the higher
molecular weight (i.e., 50–70 kDa) protein ranges, depending
on the charge of the SPIONs, the NpSpC amounts exhibited
“dual” variation; in this case, the neutral SPIONs contained
significantly higher amounts of proteins in the molecular range
of 50–70 kDa (which contains majority of the important
proteins) in vivo, whereas the opposite trend was observed for
both the positively and negatively charged SPIONs.
Figure 6 presents the differences in the proteins adsorbed to
each surface charge type in the in vivo and in vitro conditions.
For hard coronas on neutral NPs, 50% of the proteins were
observed in both the in vitro and in vivo experiments, 17% were
observed in vitro, and 33% were observed in vivo. For the
positively charged NPs, 48% of the hard corona proteins were
observed in both the in vitro and in vivo experiments, whereas
33% and 19% of the proteins were observed in only the in vitro
or in vivo experiments, respectively. In contrast, only 8% of the
hard corona proteins on the negatively charged NPs were
observed in both the in vitro and in vivo experiments, whereas
the percentage of identified proteins in only the in vitro or in
vivo experiments increased to 38% and 54%, respectively.
Figure 7 shows the biodistribution of SPIONs in rat organs 15
min after injection of 7 mg Fe of SPIONs. We were able to
recover almost 100% of the injected NPs (94.7 ± 9.88%, 101.4
± 3.26%, and 103.05 ± 4.28% for the positively charged,
neutral, and negatively charged NPs, respectively). The serum
contained 83.2 ± 3.68% of the neutral NPs and 83.39 ± 3.19%
of the negatively charged NPs,
Fig. 5 Normalized spectral counts (NpSpCs) of proteins of various molecular weight
ranges. The proteins contained in the hard corona of the in vitro and in vivo samples on
positively charged (a), neutral (b), and negatively charged (c) NPs.

ARTICLE Journal Name
10 | J. Name., 2012, 00, 1-3 This journal is © The Royal Society of Chemistry 2012
MYL6
Positive
21%
Positive-
Neutral-
Negative 3%
Positive-
Neutral
35%
PLMN
THRB
ACTB
ACTG
FA9 BIN2
CLUS
Neutral
7%
ALB
UCERU
KNT1
KNT2
Neutral-
Negative
10%
Negative
24%
Positive-Negative
0%
a.
APOE
FA10
FETUA
SPP24
CO9
APOA1
HPT
TRFE
FETUB
APOH
ACTS PON1
A1BG
Positive Neutral Negative
HBA
Positive-
Neutral-
Negative 39%
Positive
0%
CO9
Positive-
Neutral
22%
OSTP
Neutral
13%
CLUS
KNT2
APOA2Neutral-
Negative
13%
FCN1
FIBG
Positive-Negative
0%
b. Positive Neutral Negative
Negative
13%
ALBU FIBB
FIBA
SPP24
HBB1
HBB2FA10
APOE
CO3
MGP
APOA1
FETUA
A1BG
TIMP3
G3P
Fig. 6 Hard corona proteins of in vitro and in vivo experiments. In vitro (a) and in vivo (b) protein adsorption to NPs of different surface charges injected into and recovered from rats (MS analysis of NP tightly bound proteins). This figure contains only the most significant proteins (Table 1). The protein composition of the hard corona on the in vivo NPs is different from the that on the in vitro NPs.
0
20
40
60
80
100
120
Bra
in
Hea
rt
Lung
Thym
us
Live
r
Splee
n
Sto
mac
h
Inte
stine
Kidne
y
Bladd
er
Urin
e
Blood
Ser
umTo
tal
% i
ron
in
jec
ted
do
se
Positively charged NPs
Neutral NPs
Negatively charged NPs
Fig. 7 The biodistribution of NPs with three different surface charges is
graphically represented as a measure of the percentage of the Fe injected dose
recovered in rat organs. At 15 min after injection of 7 mg Fe of SPIONs, the
positively charged NPs localized mainly in the liver, while the neutral and
negatively charged NPs were still mainly observed in serum. The data represent
triplicate measurements of n = 3.
which was twice the proportion of the positively charged NPs
(43.5 ± 9.8%). In contrast, the amount of NPs in blood cells did
not differ much by charge (2–4%). This reveals a tendency
towards higher blood circulation time for neutral and negatively
charged NPs compared with positively charged NPs.
Interestingly, within 15 min, 42.8 ± 6.14% of the positively
charged NPs localized to the liver, which is four times the
proportions of neutral (5.9 ± 0.41%) and negatively charged
NPs (9.0 ± 1.04%). Only 1–2% of NPs were observed in the
heart, the lung, the spleen (2.1 ± 0.36%, 1.6 ± 0.36%, and 0.94±
0.14% for positively charged, neutral and negatively charged
NPs, respectively) and the kidney. Negligible amounts of NPs
(0–0.3% of the injected dose) were observed in the brain, the
stomach, the urine, the bladder, and the thymus. Urine fractions
from the rats injected with NPs were brownish (data not
shown); however, no magnetization was observed in the
brownish urine samples, which indicates an absence of SPIONs
in the urine. The brownish color resulted from the aggregation
of urine pigment with the excreted PVA polymer.26
Discussion
Determination of the protein corona composition is still a very
challenging task because the adsorption process is dynamic and
the composition depends very strongly on the local
environment, including protein concentration, pH, ionic
strength, and the presence of other biomolecules such as
enzymes.27 A detailed description of this problem is given in
the paper from Del Pino et al.28 It is also well known that the
hard corona can vary significantly, changing from a protein
composition appropriate to in vitro cell studies to the protein
composition present during in vivo studies.13
Therefore, from our knowledge, it is impossible to know the
correct protein corona composition on NPs that are in contact
with a cell or in the blood stream in vivo. All experimental
methods to date influence the composition, and it will be
difficult to use these results to explain the behavior of NPs in
vivo or in cell culture. Nevertheless, existing methods as well as
the method presented here allow detection of differences in the
corona composition as a function of the surface charge, and
differences in the uptake and biodistribution of the NPs. This
allows discussion of the roles of the different proteins in the
biological behavior of inorganic NPs.
The variations in the surface charge of these three NPs
confirmed the successful coating of polymer onto the SPION
surface. The concentration of up to 0.8 mg Fe/mL without
cytotoxicity in RAW 264.7 cells revealed the potential of PVA-
SPIONs in biomedical applications, such as for magnetic
resonance imaging.29 The composition of the protein corona,
and not the protein amount or number of different proteins,
must determine the uptake of the particles by the liver and the
blood residence time. NPs larger than 50 nm are generally

Journal Name ARTICLE
This journal is © The Royal Society of Chemistry 2012 J. Name., 2012, 00, 1-3 | 11
taken up quickly by the liver reticuloendothelial system cells,
and have limited uptake into lymph and bone.30
We speculate that one or more of the proteins that adsorb only
on the neutral and negatively charged NPs lead to an increase in
the blood residence time. Candidates for this role include the
apolipoproteins A-II; prior literature on the effects of
apolipoprotein on drug delivery suggest these proteins may
promote circulation time in the bloodstream.31 Interestingly,
apolipoproteins are generally considered a factor that prolongs
NPs time in the bloodstream, but when examined in more detail
they show slightly different roles in biological systems.
Apolipoprotein A-II may stabilize high-density lipoprotein
(HDL) structure by its association with lipid, and so affect HDL
metabolism, whereas apolipoprotein E mediates the binding,
internalization, and catabolism of lipoprotein particles.32, 33
Apolipoprotein E can serve as a ligand for the low-density
lipoprotein (LDL) (Apo B/E) receptor and for the specific Apo-
E receptor (chylomicron remnant) in hepatic tissues. The
amount of apolipoprotein E in the hard corona of the positively
charged NPs was twice the amount in the corona of neutral and
negatively charged NPs, while the uptake of the positively
charged NPs in the liver was correspondingly much more than
the uptake of neutral and negatively charged NPs. This is a
good example of the importance of each protein and how the
amount of each protein in the hard corona can affect the
biological system.
For most proteins, adsorption differed, depending strongly on
the charge and environment (in vivo or in vitro). For instance,
the fibrinogen-based proteins (i.e., alpha chain, beta chain)
were completely absent from the hard corona composition of
the SPIONs in vitro, regardless of their surface charges,
whereas they formed a significant component of the in vivo
protein corona. Importantly, fibrinogen was not detected in the
hard corona of SPIONs in vitro (although they were abundant
in vivo). This is expected because serum lacks almost all
coagulation factors, particularly fibrinogen (all fibrinogen
molecules are used to form fibrin clot). This result is direct
evidence for the specificity of our results. A second example of
protein differences between in vitro and in vivo is the
apolipoprotein A-II precursor: in contrast to the in vivo results,
there was no detectable trace of this protein in the in vitro hard
corona. In addition, the NpSpC amount of alpha-2-HS-
glycoprotein was considerably reduced in vivo compared with
in vitro for the hard corona of the positively charged and
neutral SPIONs.
Interestingly, the number of different proteins that composed
the hard corona also differed substantially between in vitro and
in vivo conditions. In all of the in vitro investigations, the
positively charged NPs contained a considerably higher number
of different proteins than the negatively charged NPs. In
contrast, the opposite results were observed for the in vivo
evaluations: the positively charged NPs contained the fewest
different proteins (Fig. 3). The lowest percentage (3%) of
proteins (Anionic trypsin-1 and Sialate O-acetylesterase which
had NpSpCs < 1.5) was shared between the positively charged
and negatively charged NPs. The lack of proteins shared
between the positively charged and neutral NPs implied that
positively charged NPs would behave differently (have a
different biodistribution) than neutral and negatively charged
NPs. In addition, the fact that 12% of the proteins were shared
between the neutral and negatively charged NPs implied a
similarity in the biodistributions of these two NPs. This
interpretation was confirmed by the biodistribution results. The
biodistribution measurements revealed a high uptake in the
liver for the positively charged NPs (40% after 15 min) and a
very low uptake for the neutral and negatively charged NPs. In
contrast, neutral and negatively charged NPs were more
abundant than positively charged NPs in the serum (Fig. 7).
This observation is in contradiction to statements that
negatively charged particles adsorb less protein13 and that
therefore they have a longer residence time.
It is important to take care in interpreting our results for two
reasons. First, the hard corona of the positively charged NPs
was determined from particles, which were still circulating in
the blood. This means we do not know the protein composition
of the hard corona of the other 50% of particles, which were
taken up by monocytes or macrophages. These could be
different from the particles in blood. Second, we only examined
the composition of the hard protein corona. The weakly bound
proteins must also have an influence on the biological behavior,
and this influence is still unknown.
Conclusions
Although we recognize that the observed composition would
not be exactly the protein corona composition in vivo or in
vitro, we believe the protein corona composition assessed from
particles that had spent 15 min in blood circulation in living rats
should be very similar to the true in vivo composition. Because
the treatments of the samples were very similar, we believe that
the results presented in this paper reflect the composition of the
protein corona in a very realistic manner and that the observed
differences between the in vivo and in vitro results are
significant and important for the further discussion of the
behavior of inorganic nanoparticles in medical applications.
The protein–NPs complex was separated from ex vivo sera by
using a high magnetic field gradient magnetic reactor. The
SPION core of PVA-coated NPs did not affect particle
biodistribution (or did so minimally) and, most likely, the core
particles were protected by PVA molecules against direct
interaction with plasma proteins and cells. The information
from ex vivo protein adsorption and biodistribution studies
provides better overall understanding of NPs in vivo, from the
NPs–protein interaction to the physiological aspects. Our
results regarding the composition of the protein hard corona
show very clearly that the composition depends on the initial
surface charge of the particles. In general, neutral particles
show the highest number of different proteins both in vitro and
in vivo, positively charged particles show the lowest number of
different proteins in vivo, and particles with a negative charge
show the lowest number of different proteins in vitro. This
surprising result could have a high impact on discussions
ARTICLE Journal Name
12 | J. Name., 2012, 00, 1-3 This journal is © The Royal Society of Chemistry 2012
concerning the value of in vitro experiments related to toxicity
or uptake mechanism. Both these mechanisms depend strongly
on the composition of the protein corona.
Evaluation of soft corona would be an interesting further step to
understand the detail of protein adsorption and its relations to
biological processes. This will be useful not only for diagnostic
and drug delivery applications, but also for assessing nano-
safety of NPs for future applications.
Competing interests
The authors declare that they have no competing interests.
Acknowledgements
We would like to acknowledge the Nanodiara FP7 Project of
the EU Framework 7 Programme, Contract No. NMP4-LA-
2009-228929, and the Swiss National Science Foundation
(SNSF), Fund No. 205321-120161/1, for their financial
support.
Notes and references
a Laboratory of Powder Technology, Ecole Polytechnique Fédérale de
Lausanne, CH-1015 Lausanne, Switzerland. b Department of Nanotechnology and Nanotechnology Research Center,
Faculty of Pharmacy, Tehran University of Medical Sciences, Tehran,
Iran. c Division of Pediatric Cardiology, Department of Pediatrics, Stanford
University School of Medicine, Stanford, California 94305-5101, United
States. d Department of Experimental Vascular Medicine, Academic Medical
Center, Amsterdam, the Netherlands. e Department of Cell Biology, University Medical Center Groningen,
University of Groningen, Groningen, the Netherlands. f Department of Gastroenterology and Hepatology, Erasmus Medical
Center, Rotterdam, the Netherlands. g Department of Radiology, University of Geneva and Geneva University
Hospital 1211 Geneva 14, Switzerland.
† Electronic Supplementary Information (ESI) available:
Summary table of identified proteins. See DOI: 10.1039/b000000x/
*Corresponding Authors: (MM) email: [email protected]; (FR)
email: [email protected]; (HH) email: [email protected]
1. D. Ghosh, Y. Lee, S. Thomas, A. G. Kohli, D. S. Yun, A. M.
Belcher and K. A. Kelly, Nature nanotechnology, 2012, 7,
677-682.
2. M. E. Lobatto, V. Fuster, Z. A. Fayad and W. J. M. Mulder,
Nature Reviews Drug Discovery, 2011, 10, 835-852.
3. S. K. Mouli, L. C. Zhao, R. A. Omary and C. S. Thaxton,
Nature Reviews Urology, 2010, 7, 84-93.
4. A. Schroeder, D. A. Heller, M. M. Winslow, J. E. Dahlman,
G. W. Pratt, R. Langer, T. Jacks and D. G. Anderson, Nature
Reviews Cancer, 2012, 12, 39-50.
5. S. Tong, S. Hou, Z. Zheng, J. Zhou and G. Bao, Nano letters,
2010, 10, 4607-4613.
6. H. Wei, N. Insin, J. Lee, H. S. Han, J. M. Cordero, W. Liu
and M. G. Bawendi, Nano letters, 2012, 12, 22-25.
7. M. Mahmoudi, H. Hofmann, B. Rothen-Rutishauser and A.
Petri-Fink, Chemical reviews, 2012, 112, 2323-2338.
8. M. A. Dobrovolskaia and S. E. McNeil, J Control Release,
2013, 172, 456-466.
9. A. E. Nel, L. Mädler, D. Velegol, T. Xia, E. M. V. Hoek, P.
Somasundaran, F. Klaessig, V. Castranova and M.
Thompson, Nature materials, 2009, 8, 543-557.
10. T. Cedervall, I. Lynch, S. Lindman, T. Berggård, E. Thulin,
H. Nilsson, K. A. Dawson and S. Linse, Proceedings of the
National Academy of Sciences, 2007, 104, 2050-2055.
11. Z. W. Lai, Y. Yan, F. Caruso and E. C. Nice, ACS nano,
2012, 6, 10438-10448.
12. M. P. Monopoli, C. Åberg, A. Salvati and K. A. Dawson,
Nature nanotechnology, 2012, 7, 779-786.
13. M. P. Monopoli, D. Walczyk, A. Campbell, G. Elia, I. Lynch,
F. Baldelli Bombelli and K. A. Dawson, Journal of the
American Chemical Society, 2011, 133, 2525-2534.
14. D. Walczyk, F. B. Bombelli, M. P. Monopoli, I. Lynch and
K. A. Dawson, Journal of the American Chemical Society,
2010, 132, 5761-5768.
15. M. J. Hajipour, S. Laurent, A. Aghaie, F. Rezaee and M.
Mahmoudi, Biomaterials Science, 2014, DOI:
10.1039/c4bm00131a.
16. M. Rabe, D. Verdes and S. Seeger, Advances in colloid and
interface science, 2011, 162, 87-106.
17. C. Rocker, M. Pozl, F. Zhang, W. J. Parak and G. U.
Nienhaus, Nature Nanotechnology, 2009, 4, 577-580.
18. U. Sakulkhu, M. Mahmoudi, L. Maurizi, J. Salaklang and H.
Hofmann, Scientific reports, 2014, 4, 5020.
19. A. Chastellain, A. Petri and H. Hofmann, J Colloid Interf Sci,
2004, 278, 353-360.
20. A. Petri-Fink, M. Chastellain, L. Juillerat-Jeanneret, A.
Ferrari and H. Hofmann, Biomaterials, 2005, 26, 2685-2694.
21. R. M. Cornell and U. Schwertmann, The Iron Oxides:
Structure, Properties, Reactions, Occurences and Uses.,
WILEY-VCH Verlag GmbH & Co. KGaA,Weinheim, 2 edn.,
2006.
22. H. B. Lee and M. D. Blaufox, Journal of nuclear medicine :
official publication, Society of Nuclear Medicine, 1985, 26,
72-76.
23. L. Maurizi, U. Sakulkhu, A. Gramoun, J. P. Vallee and H.
Hofmann, The Analyst, 2014, 139, 1184-1191.
24. M. Mahmoudi, S. Laurent, M. A. Shokrgozar and M.
Hosseinkhani, ACS Nano, 2011, 5, 7263-7276.
25. M. Dashty, V. Akbarkhanzadeh, C. J. Zeebregts, C. A. Spek,
E. J. Sijbrands, M. P. Peppelenbosch and F. Rezaee, Scientific
reports, 2012, 2, 787.
26. Y. J. Jiang, A. Schadlich, E. Amado, C. Weis, E. Odermatt,
K. Mader and J. Kressler, J Biomed Mater Res B, 2010, 93B,
275-284.
27. M. Chanana, P. Rivera Gil, M. A. Correa-Duarte, L. M. Liz-
Marzan and W. J. Parak, Angewandte Chemie, 2013, 52,
4179-4183.
28. P. d. Pino, B. Pelaz, Q. Zhang, P. Maffre, G. U. Nienhaus and
W. J. Parak, Materials Horizons, 2014, 1, 301.
29. L. Maurizi, U. Sakulkhu, L. A. Crowe, V. M. Dao, N.
Leclaire, J.-P. Vallée and H. Hofmann, RSC Advances, 2014,
4, 11142.
30. K. B. Saebo, Disseration at the University of Uppsala 2004.,
2004.
31. K. Furumoto, K.-i. Ogawara, S. Nagayama, Y. Takakura, M.
Hashida, K. Higaki and T. Kimura, J. Controlled Release,
2002, 83, 89-96.
Journal Name ARTICLE
This journal is © The Royal Society of Chemistry 2012 J. Name., 2012, 00, 1-3 | 13
32. A. von Eckardstein, J. R. Nofer and G. Assmann,
Arteriosclerosis, thrombosis, and vascular biology, 2001, 21,
13-27.
33. M. Dashty, M. M. Motazacker, J. Levels, M. de Vries, M.
Mahmoudi, M. P. Peppelenbosch and F. Rezaee, Thrombosis
and haemostasis, 2014, 111, 518-530.