examination of defects and long term crack growth in rolled …735217/fulltext01.pdf ·...
TRANSCRIPT

Thesis work
Masters degree
Examination of defects and long term crack growth in
rolled bars during long term storage
Author: Jon Scheutz Mentor: Erik Hedlund Examiner: Anders Eliasson Subject/Main area: Material science
Points: 30hp
Högskolan Dalarna 791 88 Falun Sweden Tel 023-77 80 00

Abstract
This work has had the purpose to examine defects and the cause of crack growth during long term
storage in rolled bars. The bars in question are rolled and stored at Ovako in Hofors. The problem is
approached by theoretically examining the possibilities of hydrogen damage, room temperature
creep and naturally occurring porosity.
Seven bars of three steel type groups and with different rolling dates were selected and examined for
defects with ultrasonic testing. Four of the bars show defects. Specimens containing the defects are
cut out and grinded so that the defects can be examined in the scanning electron microscope and
analyzed with energy dispersive x-ray spectroscopy.
One of the specimens shows some form of cavity containing iron carbide. One of the others shows a
surface with inclusions. The remaining two both shows inclusions and cracks that seem to originate
from inclusions.
The theoretical studies show that there are two types of hydrogen damage that could be in effect in
the studied case and also that room temperature creep could facilitate but not cause crack growth
and that porosity could serve as crack initiation points. Steps should be taken to minimize the
problems mentioned above when they are suspected causes. Further examination of inclusions in
different steel types should be made if considered a problem.
Sammanfattning
Detta arbete har haft syftet att undersöka defekter och orsaken till spricktillväxt under
långtidsförvaring av spårvalsade stänger. Stängerna i undersökningen är valsade och lagrade hos
Ovako i Hofors. Problemet är angripet genom att teoretiskt undersöka risken för väteskador, kryp i
rumstemperatur och naturligt förekommande porositet.
Sju stänger indelade i tre stålsortsgrupper och med olika valsningsdatum valdes ut och undersöktes
med ultraljud. Fyra av stängerna visade på defekter. Prov innehållande dessa defekter blev utkapade
och slipade så att defekterna kan bli undersökta i svepelektronmikroskop och analyserade med
energidispersiv röntgenanalys.
Ett av proverna visar på ett hålrum innehållande en järnkarbid. Ett av de andra proverna visar på en
yta med inneslutningar. De två återstående proverna visar på inneslutningar och sprickor som verkar
utgå från inneslutningar.
De teoretiska studierna visar att det finns två typer av väteskador som är aktuella i det studerade
fallet och även att kryp vid rumstemperatur kan underlätta spricktillväxt men inte orsaka den och att
porositet kan tjäna som sprickinitieringsställen. Åtgärder för att minimera de nämnda problemen bör
tas i fall där de är misstänkta orsaker. Ytterligare undersökningar av inneslutningsbilden bör göras om
inneslutningar anses vara ett problem.

Table of Contents 1. Introduction ..................................................................................................................................... 1
1.1. Background .............................................................................................................................. 1
1.2. Purpose .................................................................................................................................... 2
1.3. Limitations ............................................................................................................................... 2
2. Steel casting ..................................................................................................................................... 3
2.1. Electric arc furnace .................................................................................................................. 3
2.2. Non-metallic inclusions in steel ............................................................................................... 3
2.3. The casting process ................................................................................................................. 4
2.3.1. Phenomena during casting .............................................................................................. 4
2.3.2. Ingot Casting .................................................................................................................... 6
2.4. Porosity .................................................................................................................................... 7
3. Hydrogen damage, creep at room temperature and ultrasonic testing ......................................... 9
3.1. Hydrogen embrittlement ...................................................................................................... 12
3.1.1. Loss in tensile ductility .................................................................................................. 12
3.1.2. Hydrogen stress cracking ............................................................................................... 12
3.1.3. Hydrogen environment embrittlement ......................................................................... 16
3.1.4. Embrittlement due to hydride formation ..................................................................... 16
3.2. Hydrogen blistering ............................................................................................................... 16
3.3. Flakes, fish-eyes and shatter cracks ...................................................................................... 17
3.4. Hydrogen attack .................................................................................................................... 17
3.5. Microperforation ................................................................................................................... 18
3.6. Degradation in flow properties ............................................................................................. 18
3.7. Preventive methods .............................................................................................................. 18
3.7.1. Preventing hydrogen blistering or flaking ..................................................................... 18
3.7.2. Preventing hydrogen embrittlement ............................................................................ 19
3.7.3. Preventing hydrogen attack .......................................................................................... 19
3.8. Room temperature creep ...................................................................................................... 20
3.9. Ultrasonic testing .................................................................................................................. 20
4. Materials ........................................................................................................................................ 21
5. Methods and equipment ............................................................................................................... 24
5.1. Ultrasonic testing .................................................................................................................. 24
5.2. XRF analysis ........................................................................................................................... 24
5.3. Defect examination ............................................................................................................... 25

5.4. Hardness testing .................................................................................................................... 25
6. Results ........................................................................................................................................... 26
6.1. Hardness testing .................................................................................................................... 26
6.2. Ultrasonic testing .................................................................................................................. 26
6.3. XRF analysis ........................................................................................................................... 30
6.4. Optical microscope analysis .................................................................................................. 31
6.5. Electron scanning microscope analysis ................................................................................. 33
6.5.1. Steel specimen with charge number v9083 .................................................................. 33
6.5.2. Steel specimen with charge number v7817 .................................................................. 33
6.5.3. Steel specimen with charge number v6337 .................................................................. 35
6.5.4. Steel specimen with charge number D1051 ................................................................. 38
7. Discussion ...................................................................................................................................... 40
7.1. Theoretical study of hydrogen damage, creep and porosity ................................................ 40
7.2. Ultrasonic testing and XRF analysis ....................................................................................... 40
7.3. Examination in optical and electron scanning microscope ................................................... 41
8. Conclusions .................................................................................................................................... 44
9. Further work .................................................................................................................................. 44
10. Bibliography ............................................................................................................................... 44

1
1. Introduction
1.1. Background The rolling mill division for Ovako in Hofors delivers different kind of steel bars in different
dimensions to other Ovako divisions for further processing as well as to external customers. The full
process from scrap to bar looks roughly as follows:
The steel mill in Hofors melts scrap and processes the melt to the right composition and
quality. There is no preheating of the scrap.
The processed melt is then casted in molds.
When the ingots have solidified they are sent to the rolling mill.
The rolling mill soaks these ingots in soaking pits to minimize segregation.
Then the 4.2 ton ingots are rolled in two or three set of rolls, depending on the final
dimension, or forged. The rolling mill in Hofors produces bars with dimensions between 78
and 230 mm diameter and 147*147 mm bars. Bars with diameters between 240 and 350 are
forged.
The bars are cooled in room temperature after which they are checked for surface and
internal defects. The latter is done with ultrasonic techniques.
The bars are then transported to their destination. Either to an external customer, to Ovako
in Hällefors for further rolling, to internal customers at Ovako in Hofors or to outdoor storage
areas.
The microstructure of the steel after rolling is not always stable. Some of the steels are hardened and
all the steels are cooled in air. Some steel manufacturers use heat treatment on their steels. At
Ovako the time between rolling and processing into tubes or rings is generally so short that heat
treatment is deemed not to be necessary.
Porosity is formed in the ingots during solidification. This porosity is reduced when the ingots are
rolled. The reduction rate is dependent on the diameter of the finished bar. Larger diameters mean
less reduction for the ingots. This increases the remaining porosity. Some steels are also more
difficult to process which is considered to also increase the remaining porosity. Ovako also uses a
small ingot size which decreases reduction.
An ultrasonic examination is done five days after rolling for steels which are aimed at more
demanding products. During a testing period ultrasonic examination was also performed after one
and three months. It is calibrated against a created defect with known size. This gives an indication of
the defect sizes in the bars based on the level of the reflected ultrasonic signal which is proportional
to the known defect size.

2
The bars are stored outdoors on two supports standing on gravel. Each pair of supports is used for
storing several bars. Since not all of the bars are used up immediately there are bars that remain at
the storage area for longer times. This time can be from a few days to more than a year. During this
time the ultrasonic signal from the bars grows empirically which might mean that the existing defects
are increasing in size.
Suspected mechanisms for this are flakes or possibly other hydrogen damage, residual stress from
rolling, creep tension or any combination of these. A rough estimate puts the time from rolling until
the bars is unusable to one year but this is depending on the steel type and the dimension of the bar.
The bigger the diameter of the bar is the shorter is the time until it is unusable. This is assumed to be
because there is more porosity in larger bars due to less reduction during rolling. Forging process the
bars more in the center which is assumed to be the reason that forged bars shows fewer problems.
There is a suspicion that growth of internal defects is the cause of certain customers complaints
when the material used was stored during long times.
1.2. Purpose The main purpose of this study is to examine theoretical possibilities of crack growth during long
term storage in rolled bars and to examine defects in rolled bars stored for shorter and longer time.
The purpose of the theoretical study is to evaluate if naturally occurring porosity can work as a crack
initiation point, examine the effects of hydrogen damage and examine the effects of creep at room
temperature. The purpose of the practical tests is to examine defects in the rolled bars with
ultrasonic testing, scanning electron microscope (SEM) and energy-dispersive X-ray spectroscopy
(EDX) analysis. The data from both the theoretical studies as well as the practical examination are
used to propose solutions for the problem.
1.3. Limitations When examining steel specimens this work is limited to locating at least one defect for those
specimens that showed defects with ultrasonic testing and to examine this surface. This means that
the possibility of other defects within those specimens or in specimens without an ultrasonic signal
will not be examined. To approach this work in a narrow enough way some theoretical possibilities,
beyond what is suggested in the background, is not examined as thoroughly. Different forms of
residual stresses is not examined due to the difficulties of practically measuring these and because
this work is focused towards other areas. The selection of steel specimens is limited by available
materials at Ovako in Hofors at the time of selection. Some other preferable steel specimens do not
have specimens with different enough rolling dates since both older and newly rolled specimens get
used up in production.

3
2. Steel casting In this section the theoretical studies of this work will be presented.
2.1. Electric arc furnace The production of steel by using scrap metal is done in an electric arc furnace which was invented in
the beginning of the 20th century. Both direct current and alternating current is used but the latter is
dominating. Three electrodes are lowered into the scrap and an electric arc is formed between them
and the scrap. This produces heat which is used to melt the scrap. [1]
Except the metal scrap several other ingredients can be put into the furnace. Pig iron and direct
reduced iron is used if available or economically favorable to produce. They generally contain lower
amounts of cupper and tin than scrap which gives cleaner steel. A number of alloying elements are
added to achieve the right composition. They can be added in their basic form, as oxides or as iron
alloys. Reducing agents can be added in the form of carbon or silicon carriers to decrease metal loss
to the slag. This is common when producing high alloy steels. Calcium oxides and magnesium oxides
are added to give the slag the correct basicity to decrease lining wear. [1]
For the melting of the scrap to proceed optimally the scrap needs to be at a temperature of 2000° C.
This means that in the initial stages the oven will work unevenly. To improve upon this it is possible
to preheat the scrap metal. This also has a few other benefits which include removing moisture and
oil from the scrap. [1]
2.2. Non-metallic inclusions in steel Nonmetallic inclusions can originate from the slag or form during ladle treatment. If their size is
bigger than 10-15 µm they can affect a number of properties like weldability, fatigue strength,
roughness, machinability, corrosion properties and ductility. These inclusions have different
mechanical properties depending on their composition. They are divided into four different groups
depending on their deformation behavior. The groups are the following: [1]
a. Ductile: They follow the deformation of the steel and are elongated in the rolling direction.
Examples are manganese sulfides and calcium and manganese silicates with a high SiO2 level.
[1]
b. Brittle: These inclusions break up into fragments during forming. Examples are deformed
Al2O3 clusters, titanium carbonitride and MnO-Cr2O3. [1]
c. Brittle-ductile: Inclusions with a hard core surrounded by a deformable phase. An example is
silicates with lower SiO2 level than a. [1]
d. Hard inclusions: These deform very little or not at all during forming. Cavities are often
detected in the rolling direction. Examples are calcium aluminates, MgO-Al2O3-spinels and
small Al2O3 inclusions. [1]
A picture of the appearance of the four kinds of inclusion is shown in Figure 1.

4
Figure 1: Picture of the appearance of inclusion types a-d.
2.3. The casting process The aim of the casting process is to solidify the molten steel (or another metal) while keeping the
percentages of different alloying elements from previous metallurgical processes constant. There are
also several quality properties to consider. It is important to minimize segregation, pores, crack
formation and to produce good surfaces. [2]
All the steel in one batch does not solidify at the same temperature. Since the steel contains alloying
elements there is a temperature interval for solidification. The first one is the starting temperature.
At this temperature the first part of the steel solidifies. This steel gets a slightly lower carbon content
than the still molten steel. Higher carbon content in the melt means that it gets a lower solidification
temperature. When the temperature drops further more and more steel solidifies and the remaining
melt gets higher and higher carbon content. The last of the melt solidifies at 1340° C, in ideal
circumstances, and has the highest carbon content. Because of this, different parts of the solid
structure have different amounts of carbon. This phenomenon is called micro or macro segregation
depending on which scale it is happening. [2]
2.3.1. Phenomena during casting
Steel have different densities depending on temperature. This is especially true when going from
molten to solid forms. Because of this there is shrinkage during solidification. On the microscopic
scale this means molten steel have to be sucked in between the forming dendrites. If the material
transport is too slow pores might be formed. These pores are often easily sealed during hot working
of the steel. On the macroscopic scale a pipe might form, which is a big cavity, see Figure 2. This is
foremost a problem with ingot casting. [2]

5
Figure 2: An ingot with a pipe defect [2].
Macrosegregations is another problem when casting. This occurs when the molten steel move
around in the mold because of differences in density arising from temperature differences. This leads
to differences in composition in different parts of the molten steel. It influences the final positions of
inclusions which is negative since it is desirable for those to end up with the mold powder on top of
the melt. Macro segregation is more severe than micro segregation because it gives different
properties in different parts of the material. [2]
For the steel to solidify there is some supercooling required. Depending on if the supercooling is high
or low the steel forms different structures. In a mold the supercooling is highest along the walls of
the container and lowers towards the center. Normally three zones are formed. The first one is a thin
layer of equiaxed crystals followed by the second one which consists of column shaped crystals. The
column shape arises when the heat travels through the first zone to reach the mold wall. The new
crystals therefore form at the old ones and grow into the unaffected melt. In the center the
temperature lowers below the melting temperature but above the final solidification temperature
which means new crystals can form easier. This gives the third zone in the center consisting of larger
equiaxed crystals. A picture of how this could look is shown in Figure 3. [2]

6
Figure 3: Picture of the crystal structure in a steel ingot [2].
Gas bubbles are another problem that needs to be considered when casting. These bubbles can
either diffuse out to the surface or remain in the material. If the bubbles diffuse to the surface there
could be problems with oxidation of the formed microscopic cavity when coming in contact with
oxygen in the air. In that case they will not disappear during hot working. For bubbles that remain in
the material there are two main kinds. Hydrogen and nitrogen that in most cases disappears into the
material during hot working and argon that do not disappear since argon does not react with the
steel at all. The last kind is rare but very negative. It is important to make that sure there is time
between the last usage of argon and the casting so that the gas has time to diffuse to the surface. [2]
The position and size of inclusions after casting is important for the materials properties. The most
dangerous inclusions are the primary inclusions. Primary inclusions are those who solidified before
casting. The secondary ones, precipitated during solidification, rarely gets big enough to cause a
problem. A big source for primary inclusions is the oxidation that occurs when pouring molten metal
into the mold or tundish. Hence it is important to have an as good separation process as possible. For
ingot casting heating the top of the mold improves separation while for continuous casting the form
of the casting pipe and an electromagnetic break optimizes the separation. [2]
The formation of cracks is a big problem. Because of this it is important to design the casting process
to minimize tension. It is also possible to design the steels high temperature properties in such a way
that cracks need more tension to form. Alloying elements that accumulate in grain boundaries is
especially dangerous. An example of this is sulfur that can form thin films in these boundaries. During
continuous casting it is possible to create tension by choosing bad geometries or cooling speeds. [2]
2.3.2. Ingot Casting
Ingot casting is unusual today. Most steels casted by this method have a problem with segregation
which hinders the use of continuous casting. But before this method was developed ingot casting
was the norm dating back from the 19th century when liquid steel was started being used. [2]
The ingot is solidified in a form most often made of cast iron. When it has finished solidifying the
mold is turned upside down to remove the ingot. The ingot is then either allowed to cool or
transported to an oven to be kept warm before rolling. The cross section of a typical ingot can be
seen in Figure 4. [2]

7
Figure 4: Structures in a solidified ingot [2]
This figure shows how the structure of the ingot goes from columnar dendrites to equiaxed crystals
from the wall to the center. It also shows the different kinds of segregations found. To decrease the
amount of air dragged down into the steel bottom casting is used. The steel then rise into the mold
rather than being poured in from the top. [2]
A hot top is used in most molds which lowers the solidification rate at the top of the mold. This will
decrease the pipe formation problem by making the top of the molten steel solidify more evenly in
time. Casting powder is added to the top of the molten steel to protect it from the air and also
insulate it, making it solidify more evenly. [2]
2.4. Porosity There are two size classifications of pores, macroporosity and microporosity. Macroporosity refers to
pores that are large enough to be seen with the unaided eye on a radiographic inspection while
microporosity refers to pores that need magnification to be seen. Pores are a common kind of defect
in castings. They can be connected to the surface or they can be internal. It is a combination of gas
evolution and metal shrinking that form the pores during solidification. Though, their nucleation is
difficult without the presence of some sort of substrate, like a nonmetallic inclusion, a grain refiner
or a second phase particle. [3]
The effect on static and dynamic properties is dependent on the sizes of the pores. The static
properties are reduced by at least the portion of the cross-sectional area that is taken up with the
pores because there is no metal there to carry the load. Because the pores also cause a stress

8
concentration in the remaining material, static properties can be reduced by more than the
percentage of cross-sectional area they take up. Micro pores do not affect static properties much
because of their size. The dynamic properties are affected by pores longer than 0.2 mm. Even with
bigger pores the effect is only slight. Though, because of the notch effect, the reduction in dynamic
properties is great if the pores extend to the surface. For both static and dynamic properties the
shape of the pores is important. Elongated pores have greater effect than round ones. [3]
The pores that exist after casting can be sealed during forging or rolling. Forging is effective at sealing
pores due to that it works large portion of the material and subjects the material to high
deformation. When rolling the material the percentage of pores sealed is dependent on the degree
of deformation. This means that higher final diameter of the rolled bars gives less percentage of
sealed pores. The size of the ingots casted affects it in the same way. A smaller ingots experiences
less deformation when worked and therefore has more pores left after rolling. [4, 5]
The pores in the material are stress concentration points. The flatter the pores are the greater the
stress concentration becomes. When subjected to stress microscopic cracks can form at the pore
edges as a result of this. If the load is increased these cracks will grow. [6]

9
3. Hydrogen damage, creep at room temperature and ultrasonic
testing Hydrogen damage is often called hydrogen embrittlement. Since not all damage caused by hydrogen
results in reduced load bearing capacity or fracture below yield stress, hydrogen damage is a better
general term. The hydrogen helps defects form and propagate below stresses needed for mechanical
fracture, create macroscopic damage and gives a general loss in ductility and/or tensile strength. This
kind of damage easily occurs in high strength steel and many failures derive from it. It is a form of
environmentally assisted failure caused most often by the combined effect of hydrogen and residual
or applied tensile stress. [7, 8]
When producing steel there are several sources of hydrogen. The most common one is moisture
from scrap metal. Other common ones are water from the slag or refractory materials in the furnace
linings. To diffuse into the steel the hydrogen needs to be in atomic form rather than the more usual
molecular form. There are certain other molecules containing hydrogen, especially hydrogen sulfide,
where the bond is even looser and therefore these molecules is more dangerous than pure hydrogen
gas. Hydrogen solubility is higher with higher temperature for many metals and when molten steel
solidifies the hydrogen gets entrapped in the metal. The solubility is also higher for fcc than bcc
which makes the entrapment worse when cooling from austenite to ferrite. Hydrogen can also enter
the material during usage. When a high pressure hydrogen environment is present during high
temperatures hydrogen can enter the metal. For high strength steel there are reports that hydrogen
gas at a total pressure of only one atmosphere has caused cracking. [7]
There are several types of hydrogen damage. These are the following: [7, 8]
Hydrogen embrittlement
Hydrogen blistering
Flakes, fish-eyes and shatter cracks
Hydrogen attack
Microperforation
Degradation in flow properties
Properties of all these kinds of hydrogen damage are shown in Table 1, Table 2 and Table 3. More in
depth description of them will follow in the following chapters.

10
Table 1: Properties of three kinds of hydrogen embrittlement [8]
Hydrogen embrittlement
Hydrogen environment embrittlement
Hydrogen stress cracking Loss in tensile ductility
Typical materials Steels, nickel-base alloys,
metastable stainless steel, titanium alloys
Carbon and low-alloy steels Steels, nickel-base alloys, Be-Cu
bronze, aluminum alloys
Usual source of hydrogen (not exclusive)
Gaseous H2 Thermal processing, electrolysis,
corrosion
Gaseous hydrogen, internal hydrogen from electrochemical
charging
Typical conditions
10-12
to 102 MPa gas pressure
0.1 to 10 ppm total hydrogen content
0.1 to 10 ppm total hydrogen content range of gas pressure
exposure
Observed at -100 to 700 ° C; most severe near 20 ° C
Observed at -100 to 100 ° C ; most severe near 20 ° C
Observed at -100 to 700 ° C
Strain rate important; embrittlement more severe at low strain rate; generally more severe
in notched or pre cracked specimens
Strain rate important; embrittlement more severe at low strain rate; always more
severe in notched or pre cracked specimens
Occurs without effect on yield stress; strain rate important
Failure initiation Surface or internal initiation;
incubation period not observed Internal crack initiation Surface and/or internal effect
Mechanisms Surface or subsurface processes Internal diffusion to stress
concentration Surface or subsurface processes

11
Table 2: Properties of hydrogen attack, hydrogen blistering and Shatter cracks, flakes and fisheyes [8]
Hydrogen attack Blistering Shatter cracks, flakes, fisheyes
Typical materials Carbon and low-alloy steels Steels, copper, aluminum Steels (forgings and castings)
Usual source of hydrogen (not
exclusive) Gaseous
Hydrogen sulfide corrosion, electrolytic charging, gaseous
Water vapor reacting with molten steel
Typical conditions
Up to 102 MPa at 200–595 ° C
Hydrogen activity equivalent to 0.2 to 1 × 10
2 MPa at 0–150 ° C
Precipitation of dissolved hydrogen during ingot cooling
Failure initiation Surface (decarburization); internal
carbide interfaces (methane bubble formation)
Internal defect Internal defect
Mechanisms
Carbon diffusion (decarburization); hydrogen
diffusion; nucleation and growth (bubble formation)
Hydrogen diffusion; nucleation and growth of bubble; steam
formation Hydrogen diffusion to voids
Table 3: Properties of micro-perforation, degradation in flow properties and metal hydride formation [8]
Micro-perforation Degradation in flow properties Metal hydride formation
Typical materials Steels (compressors) Iron, steels, nickel-base alloys V, Nb, Ta, Ti, Zr, U
Usual source of hydrogen (not
exclusive) Gaseous hydrogen Gaseous or internal hydrogen
Internal hydrogen from melt; corrosion, electrolytic charging,
welding
Typical conditions
2 to 8 × 10⁶ MPa at 20–100 ° C
1–10 ppm hydrogen content (iron at 20 ° C) up to 10
2 MPa gaseous
hydrogen
0.1 to 102 MPa gas pressure
hydrogen activity must exceed solubility limit near 20 ° C
Failure initiation Unknown
Internal defect
Mechanisms Unknown Adsorption to dislocations; solid-
solution effects Hydride precipitation

12
3.1. Hydrogen embrittlement Hydrogen embrittlement can be subdivided into three or four different categories. Here four types of
hydrogen damage are put under hydrogen embrittlement: [7, 8]
Loss in tensile ductility
Hydrogen stress cracking
Hydrogen environment embrittlement
Embrittlement due to hydride formation
3.1.1. Loss in tensile ductility
Loss in tensile ductility occurs when distortions of the metal lattice caused by hydrogen atoms
restricts dislocation movement. This phenomenon is only observed during slow strain rate testing
and causes no visible defects, chemical products or cracking. It becomes more pronounced as the
strain rate decreases. The extent of loss in area reduction as a function of hydrogen content is shown
in Figure 5. This kind of damage is most often encountered in lower strength steel alloys and is fully
reversible. By heating the metal it is possible to drive out the hydrogen and the rate of recovery is
dependent on time and temperature. However, if heated to temperatures above 315° C, there is
danger of high temperature hydrogen attack which will be explained in chapter 3.4. [7, 8]
Figure 5: The change in reduction in area in percent as a function of hydrogen content in ppm [7]
3.1.2. Hydrogen stress cracking
Hydrogen stress cracking (HSC), which can also be referred to as hydrogen induced cracking (HIC),
hydrogen assisted cracking (HAC), static fatigue or delayed failure, is a form of damage that affects
normally ductile metal alloys. These alloys experiences crack growth and possibly brittle fractures
during static load. These loads could be external, internal, caused by transformation, cold working or

13
hardening. The total hydrogen concentration needed can be as low as 0.1 ppm even though local
concentration values are substantially higher. Subsurface sites where the triaxial stresses are highest
are good initiation sites for cracks if there are no cracks initiated in other manners available. The
locally high hydrogen concentration ahead of the initiated crack tip then helps the subcritical crack to
grow. [7]
The fracture time increases with decreasing load down to a steel strength and hydrogen environment
dependent threshold level. Below this threshold there is no HSC. This threshold is higher for steel
with lower yield- and tensile strength and this phenomenon usually does not affect steels below
certain tensile strength levels. This means that the sensitivity to HSC increases with increasing
ultimate tensile strength as can be seen in Figure 6. For ferrous alloys there is generally also a
minimum hardness required at 22 HRC. [7]
Figure 6: Ductility versus hydrogen content for various steels at various strength levels. The numbers in parentheses indicate the ultimate tensile strength in MPa [7].
Room temperature is the ultimate temperature for HSC. At this temperature the rate of hydrogen
diffusion is such that there is a hydrogen buildup at crack nucleation sites and crack tips which is
what creates this phenomenon. The need for diffusion of hydrogen makes this a delayed fracture
mechanism dependent on hydrogen gas pressure and temperature. At temperatures well below
room temperature the hydrogen diffusion is slow which makes the buildup slow. Therefore, HSC is
not observed below -100° C. If the temperature reaches above 100° C the hydrogen tends to be
homogeneously distributed in the metal lattice and the necessary buildup might not occur. [7, 8]

14
As can be seen in Figure 7 the HSC effect is reversible. If the hydrogen is removed by baking the steel
at 150° C higher applied stress is needed for fracture after a certain time. Longer baking time
increases the applied stress necessary. This work as long as the hydrogen has not formed any
chemical bonding in the steel or if damage has already occurred before baking. [7, 8]
Figure 7: Static fatigue curves for various hydrogen concentrations obtained by different baking times at 150° C. Sharp notch strength steel specimens 1590 MPa; Normal notch strength: 2070 MPa [8]
Hydrogen can also induce cracking at slower strain rates. This hydrogen induced cracking has been
observed during mechanical testing in hydrogen environments. As for delayed failure there is a
minimum level of applied stress. This phenomenon is for the most part observed in higher strength
steels and there is similar temperature dependence. This embrittlement of steel increases with
decreasing strain rate because at higher strain rates the hydrogen does not diffuse fast enough for
embrittlement to occur. This phenomenon can be seen in Figure 8. [7, 8]

15
Figure 8: Notch tensile strength of high strength steel plotted against testing temperature for three strain rates [7, 8]
The highest resistance to embrittlement in steels is found in highly tempered martensitic structure
with equiaxed ferrite grains and spheroidized carbides evenly distributed throughout the matrix
when comparing with normalized or bainitic steels at equivalent strength levels. The resistance also
increases with decreasing prior austenitic grain size or if there is any retained austenite in the matrix.
Individual alloying elements effect on crack susceptibility is associated with their effect on heat
treatment, microstructure, and strength of the steel. Susceptibility increases with increasing
strength. Generally, carbon, phosphorus, sulfur, manganese and chromium increases susceptibility
while titanium decreases it because it decreases the amount of hydrogen available for cracking. [7, 8]
Fcc structure is relatively impermeable to diffusion of atomic hydrogen which makes the
susceptibility if austenitic steels low. If heavily cold worked there is a risk for deformation induced
martensite which increases the susceptibility of the steel. The martensitic steels are susceptible
because of their high strength while ferritic steels are highly resistant because of their low hardness.
In general, cold working and aging increases the susceptibility to cracking, the former due to the
increase in strength and the latter because of segregation of sulfur and phosphorus to the grain
boundaries. [7]
Intergranular cracks are generally observed in steels affected by hydrogen embrittlement. An
example of an Intergranular crack can be observed in Figure 9. HSC usually produces sharp singular
cracks like that one. The mode of fracture might be changed from the one normally observed into
another. At higher stress intensities there have been reports of transgranular cracks in steel. The
addition of silicon to an iron-carbon alloy also produced transgranular cracks. [7, 8]

16
Figure 9: Intergranular crack resulting from hydrogen embrittlement during chromium plating [7]
3.1.3. Hydrogen environment embrittlement
The characteristic for this kind of hydrogen embrittlement is comparable to HSC and there is
therefore some debate if it is a phenomenon of its own or if it should be seen as HSC. It is
encountered when performing plastic deformation of hydrogen free materials in hydrogen gas and it
is strain rate dependent. The pressure of the hydrogen gas is between 35 and 70 MPa and it is most
severe at room temperature just as for HSC. [7, 8]
3.1.4. Embrittlement due to hydride formation
This form of hydrogen embrittlement is found in a number of transition, rare earth and alkaline earth
metals. The formation of hydride particles makes the former ductile metal become embrittled. It
does not affect steel and is therefore not explained more thoroughly here. [7, 8]
3.2. Hydrogen blistering The phenomenon of hydrogen blistering is caused by the pressure created when atomic hydrogen
combines into molecular hydrogen. This can happen when a high enough concentration of atomic
hydrogen accumulates at internal defects such as voids or inclusions in low strength unhardened
steels. This could show as the formation of surface bulging, known as blisters, as can be seen in
Figure 10 or delamination caused by internal blistering at grain boundaries as can be seen in Figure
11. It occurs predominantly in low strength alloys. [7, 8]
Figure 10: Blisters in a carbon steel plate formed by hydrogen [7]

17
Figure 11: Delamination of a steel plate as a result of hydrogen blistering [7]
3.3. Flakes, fish-eyes and shatter cracks Flaking refers to small internal fissures that occur in steel when cooled from temperatures in the
order of 1100° C. They are also described by the terms fish-eyes and shatter cracks and are common
features of hydrogen damage in forgings, weldments and castings. At higher temperatures of
melting, welding or heat treatment in the austenitic range the solubility of hydrogen atoms is higher
than in the solidified or lower temperature bcc state. The excess hydrogen accumulates at internal
defects and the hydrogen atoms combine to form gaseous hydrogen. The mechanism for this as well
as many features of it is similar to hydrogen blistering and it may therefore be considered a special
case of hydrogen blistering. The extent of the damage is dependent on the time of exposure to a
hydrogen containing environment. [7, 8]
3.4. Hydrogen attack Absorbed hydrogen reacts with iron carbides or absorbed carbon to form hydrocarbon like methane.
This takes place in carbon and low alloy steels exposed to high pressure hydrogen gas at high
temperatures. The temperature has to be above 540° C for surface reaction and above 200° C for
internal reaction. This phenomenon is called hydrogen attack and leads to weakening of the steel
either by decarburization or by the defects and cracks generated by the hydrocarbon gas pressure.
[7, 8]
The initial point of attack is often found at areas of high stress concentration since hydrogen diffuses
to those areas. To prevent hydrogen attack from occurring it is a good idea to add carbide stabilizing
elements such as vanadium, titanium, chromium or molybdenum. It does not occur in austenitic
stainless steels which make them good choices for this kind of environments if they are suitable from
other considerations. Operation limits of carbon steel and some alloy steels are shown in the Nelson
curve in Figure 12. [7]

18
Figure 12: Nelson curves showing the operation limits of carbon and alloy steels in contact with hydrogen at high temperature and pressure [4]
3.5. Microperforation In extremely high hydrogen pressure a network of small fissures can be formed. This occurs
predominately in steels at room temperature and allows permeation of the alloy by gases and liquid.
[8]
3.6. Degradation in flow properties This is a form of hydrogen damage that occurs at ambient temperatures for iron and steel and at
elevated temperatures for several other alloy systems. [8]
3.7. Preventive methods For the different kinds of hydrogen damage there are different things that can be done to prevent
the damage from occurring. Some of the things are similar between the types while some of the
things only prevent one type of damage. [7]
3.7.1. Preventing hydrogen blistering or flaking
Blistering and flaking is similar which makes their prevention also similar and it is listed together. [6]
Inclusions play a big role in blistering and flaking. Minimizing these is a good way of
preventing blistering. Sulfur and sulfides have an especially poisonous effect on hydrogen
evolution and the usage of low sulfur steels is recommended. The addition of rare earth
elements can favor the formation of less detrimental globular sulfides. Hot rolled or
annealed steel is preferred to cold rolled. [7]
Material selection plays a big role in preventing blistering and flakes. It is good to avoid steels
that contain a lot of voids like rimmed steels. Nickel containing steels are good since they
generally have low hydrogen diffusion rates. [7]
In finished products like tanks and containers, coatings can be used to prevent hydrogen
penetration from the environment. [7]
Removal of sulfides, arsenic compounds, cyanides and phosphorus containing ions greatly
reduces hydrogen blistering. [7]

19
When expecting hydrogen blistering design aspects has to be considered. For example,
external support pads should not be continuously welded to the vessel itself to avoid
hydrogen entrapment at the interface. [7]
The decreased solubility of hydrogen in bcc structured steel compared to the fcc structure
leads to flaking when cooling steel from high temperature. The faster the cooling is the more
aggravated the damage gets because of hydrogen sensitive martensitic microstructure
forming. At slower cooling rates the hydrogen will also have more time to be released from
the steel and thereby eliminating the damage. [7]
3.7.2. Preventing hydrogen embrittlement
In general, the susceptibility to hydrogen embrittlement increases with increasing tensile
strength. For many steels a stress threshold exists. For non-acidic environments the
threshold is considered to be around 1000 MPa. Choosing materials below this threshold
and/or below 22 HRC is a good way to prevent this kind of damage. [7, 8]
To remove hydrogen from a steel baking can be used. It is a heat treatment at low
temperature (up to 200° C) for a longer period of time; se Figure 7.This can restore the
mechanical properties almost to their normal levels as long as no irreversible damage has
occurred. Heat treatment to improve the microstructure, especially untempered martensite
which is the most susceptible phase, is a good way to prevent hydrogen embrittlement.
Quenched and tempered microstructures fairs better than normalized and tempered ones.
[7]
Alloying the steel with hydride forming elements like titanium, molybdenum and vanadium
reduces susceptibility. [7]
Pickling is often the source for hydrogen pickup. The addition of inhibitors to reduce the
corrosion of the base metal can largely decrease hydrogen pickup. [7]
Proper cleaning and degreasing procedures and the use of dry electrodes and maintenance
of dry conditions is important for avoiding hydrogen embrittlement when welding.
Preheating and a postweld heat treatment are also recommended. [7]
If the steel is in a gaseous environment the addition of 0.4-0.7 % oxygen is efficient at
inhibiting the hydrogen embrittlement in the steel. This is though not effective in hydrogen
sulfide gas environments. [7]
3.7.3. Preventing hydrogen attack
Carbide forming elements like chromium and molybdenum increases the resistance to
hydrogen attack. Low carbon content should be used as higher carbon content means
decreased resistance. Austenitic stainless steels are immune to hydrogen attack but atomic
hydrogen can still diffuse through thin sections and can affect nonresistant substrate
materials. [7]
The operation limit of any steel regarding hydrogen attack can be found in its Nelson curve,
se Figure 12 for an example. The curves are based on long term refinery experience rather
than laboratory studies and they are reviewed regularly. [7]

20
3.8. Room temperature creep Time dependent plastic deformation is generally considered a high temperature phenomenon, above
0.4 times the melting point (about 440° C). But a form called room temperature creep (RTC) is
common behavior in most steels and alloys such as stainless steels, pipeline steels and high strength
steels. This deformation is the result of mobile dislocations and the creep rate gradually decreases
and reduces to zero when the dislocation density is exhausted. Therefore, RTC alone may not cause
serious failure in components. However it may affect stress corrosion cracking by causing local
rupture of the surface passivation film or by enhancing hydrogen diffusion through dislocation
movement. RTC is an important factor affecting crack propagation behavior even though no direct
crack propagation is observed due to it even after hold times of several days. [9, 10]
3.9. Ultrasonic testing Ultrasonic testing is more than 40 years old. It uses ultrasonic oscillations for detection of flaws in
different materials. The principle is based on that solid materials are good conductors of sound
waves. The sound waves are not just reflected on the interfaces but also on internal flaws. An
ultrasonic pulse is transmitted into the material. Reflected parts of the ultrasonic pulse generate an
electric signal that is displayed. Internal flaws as well as the edges of the material generate this
signal. [11]
To determine the sizes of any internal flaws, a reference flaw, called a flat bottom hole, of known size
is analyzed. The strength of the ultrasonic signal from the material tested is then compared to the
value from the flaw of known size. The result size is presented as percentage of the known flaw size.
[11]

21
4. Materials Here there will be a brief description of the different steel types and their properties and possible
application. In Table 4 a list of the different steel specimens with their steel types, diameter, rolling
date, charge number and a brief description is shown. All of the steel specimens were round bars
rolled with profile rolling.
Table 4: A list of Ovako steel type, diameter, rolling date, Ovako charge number and a brief description for the materials tested
Ovako steel type
Diameter (mm)
Rolling date (y-m-d)
Ovako charge number
Description of steel type
157C 190 2012-11-12 V9083 Ovako 157 is a high cleanliness case hardening steel used for bearing and transmission components.
157B 190 2012-06-03 V7817
157B 190 2012-03-10 V6337
826B 190 2013-03-13 D1103 Ovako 826B is a through hardening bearing steel that is mainly used for medium and large sized bainitic bearing rings, but it can also be used for machine components that require high tensile strength, hardness and toughness.
826B 190 2011-10-23 V5265
281P 210 2013-03-06 D1051 Ovako 281 is an oil and water hardening microalloyed steel. Used for machine components etc. that require high tensile strength, good machinability and weldability
281T 210 2011-12-11 V5845
In Table 5 the composition of the different steel types, their approximate hardness values (HB) and
Tabular HRC and HV values derived from those are shown.
Table 5: Official composition of the steel types, their given HB values and tabular HRC and HV values [12-18]
Ovako steel type
Composition in weight%
C Si Mn P S Cr Ni Mo Approximate hardness after hot rolling (HB)
Tabular HRC
Tabular HV
157 B min 0.17 0.20 0.55 - - 0.50 1.65 0.90 250 25 250
max 0.22 0.30 0.65 0.015 0.005 0.60 2.00 1.10 300 33 305
157 C min 0.17 0.20 0.55 - - 0.50 1.65 0.23 250 25 250
max 0.22 0.30 0.65 0.015 0.005 0.60 2.00 0.28 300 33 305
826B min 0.92 0.25 0.60 - - 1.65 - 0.40 400 43 423
max 1.05 0.40 0.80 0.025 0.015 1.95 0.25 0.50 500 52 565
281P min 0.17 0.25 1.45 - - 0.15 - - 200 16 199
max 0.22 0.40 1.75 - - 0.25 <0.30 <0.10 250 25 250
281T min 0.17 0.40 1.45 - - 0.15 - - 200 16 199
max 0.22 0.60 1.75 - - 0.25 <0.30 <0.10 250 25 250
For every charge at Ovako the hydrogen amount is measured and registered. The registered values
for the charges used in this work are given in Table 6.

22
Table 6: The amount of hydrogen in parts per million measured in each of the charges that the specimens used came from [12]
Charge number H (ppm)
V9083 1.1
V7817 1.1
V6337 1.1
D1103 1.0
V5265 0.7
D1051 1.7
V5845 0.7
Figure 13, Figure 14 and Figure 15 shows CCT diagrams for the different steel types. Since Ovako in
Hofors do not produce a finished product they are cooled in air and the exact cooling speed is not
known and therefore neither is the exact structure they end up with. [12]
Figure 13: CCT diagram for Ovako steel type 157C [12]

23
Figure 14: CCT diagram for Ovako steel type 826B [12]
Figure 15: CCT diagram for Ovako steel type 281P [12]
24
5. Methods and equipment Several sources of information was found and used to formulate an initial approach to the task. Then
the steel type to be studied was selected. Here consideration had to be taken to what material was
available. Three different steel types were selected where both materials newly rolled and material
with older rolling dates was available.
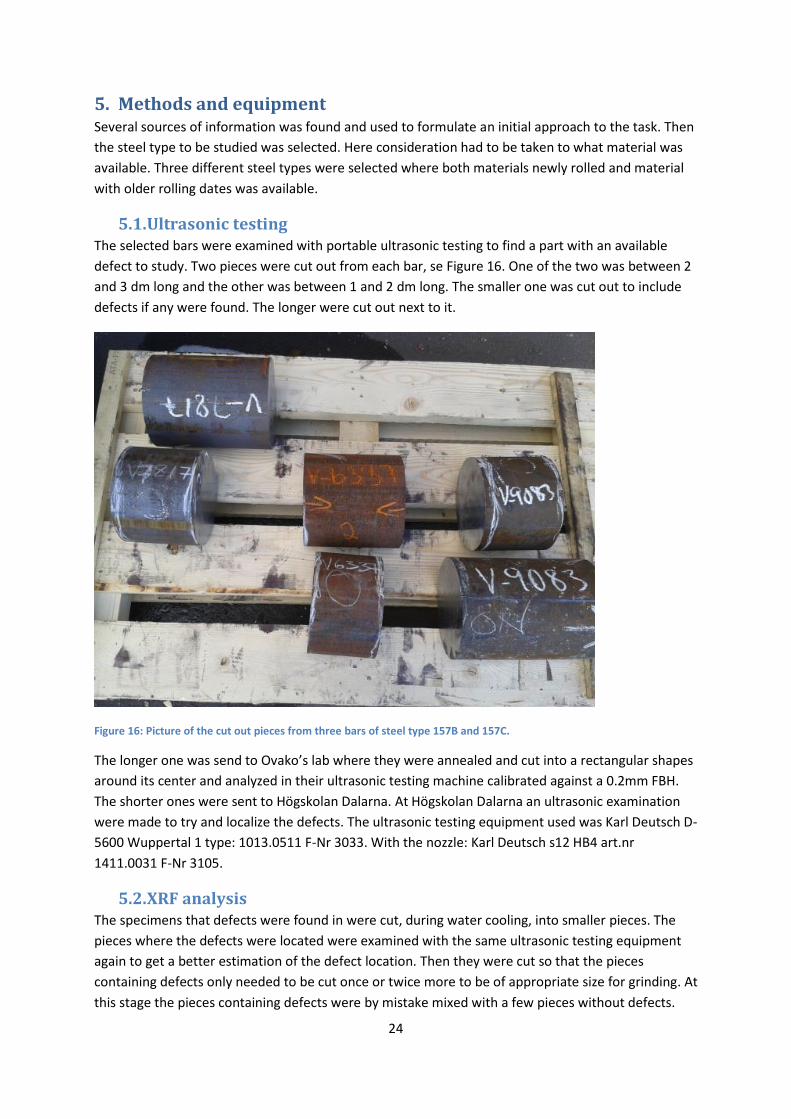
5.1. Ultrasonic testing The selected bars were examined with portable ultrasonic testing to find a part with an available
defect to study. Two pieces were cut out from each bar, se Figure 16. One of the two was between 2
and 3 dm long and the other was between 1 and 2 dm long. The smaller one was cut out to include
defects if any were found. The longer were cut out next to it.
Figure 16: Picture of the cut out pieces from three bars of steel type 157B and 157C.
The longer one was send to Ovako’s lab where they were annealed and cut into a rectangular shapes
around its center and analyzed in their ultrasonic testing machine calibrated against a 0.2mm FBH.
The shorter ones were sent to Högskolan Dalarna. At Högskolan Dalarna an ultrasonic examination
were made to try and localize the defects. The ultrasonic testing equipment used was Karl Deutsch D-
5600 Wuppertal 1 type: 1013.0511 F-Nr 3033. With the nozzle: Karl Deutsch s12 HB4 art.nr
1411.0031 F-Nr 3105.
5.2. XRF analysis The specimens that defects were found in were cut, during water cooling, into smaller pieces. The
pieces where the defects were located were examined with the same ultrasonic testing equipment
again to get a better estimation of the defect location. Then they were cut so that the pieces
containing defects only needed to be cut once or twice more to be of appropriate size for grinding. At
this stage the pieces containing defects were by mistake mixed with a few pieces without defects.

25
Two or three pieces of each steel type were present in this mix. A few was possible to identify by
visual cue. To identify all of them X-ray fluorescence (XRF) analysis were used. The equipment used
was Thermo Scientific Nitron XL3t XRF Analyser.
To have something to compare with pieces from all of the involved material was used as a reference.
From comparing the composition of these pieces with the result of the XRF analysis it was possible to
sort out most of the pieces. To separate the ones with very similar composition from each other
visual cues and their dimension was used to link them to each other and to the right steel type. It was
possible to determine which pieces that contained defects by visual markings distinguishable when
sorted in groups of each steel type.
5.3. Defect examination The final cutting of the pieces with defects was made so that they were of the appropriate size for
grinding. These were then grinded approximately 0.3mm at a time with 320P grinding paper. After
grinding 0.3mm a 800P grinding paper was used to create a finer surface. The surface was then
examined in an optical microscope to search for internal defects. This was repeated until a surface
with defects was found. Example pictures were taken with the optical microscope of the found
defects.
If the defect found was in the form of a crack or cracks the specimen were grinded with 1200P
grinding paper to create a finer surface and then etched with a 3% Nital solution. If the defect was in
the form of a pit or pits the specimen was not grinded further or etched. These samples were then
examined in a scanning electron microscope and the compositions of the bulk material as well as any
interesting defects found were analyzed with energy-dispersive X-ray spectroscopy.
5.4. Hardness testing Pieces without defect were cut from each of the original specimens except one. The two specimens
from the steel type 826B proved hard to cut because of their hardness. To cut out a piece from one
of them an angle grinder was forced to be used. Cooling by water could only be made while not
cutting which made the possibility of heating effects higher. Therefore only one of the original
specimens was cut up. These pieces were cut into the appropriate size and baked into bakelite pucks.
These steel specimens were then tested for their hardness by two methods. HRC with a HRC LECO
KT-240 hardness tester with a load of 150kg and HV with a Vickers Matsu Zawa MxT50 Micro
hardness tester with a load of 1Kg.
For HRC five test of each specimen was done and an average calculated. For HV three tests were
done for each specimen with an average calculated. From the HV values an estimated tensile
strength were calculated.

26
6. Results
6.1. Hardness testing Measured hardness values and tensile strength estimated from the HV value are shown in Table 7
and Table 8.
Table 7: Measured hardness value in HRC for the tested specimens.
Ovako charge number Steel type HRC1 HRC2 HRC3 HRC4 HRC5 Average HRC
V9083 157C 10 16 38 14 38 23
V7817 157B 51 20 35 32 21 32
V6337 157B 20 19 19 25 33 23
D1103 826B 37 36 37 37 45 38
D1051 281P 5 9 7 24 25 14
V5845 281T 13 18 19 22 16 18
Table 8: Measured hardness value in HV and estimated tensile strength for the tested specimens.
Ovako charge number Steel type HV1 HV2 HV3 Average HV Estimated tensile strength (3,33*HV) [18]
V9083 157C 260.6 234.3 253.6 250,0 833
V7817 157B 264.3 265.6 264.3 265,0 882
V6337 157B 272.7 258.1 246.1 259,0 863
D1103 826B 380 390 324.8 365,0 1216
D1051 281P 250.1 272.1 243.8 255,0 849
V5845 281T 263.7 280.5 239.1 261,0 869
6.2. Ultrasonic testing Four of the seven selected bars showed signs of defects when using ultrasonic testing at Ovako. The
cut out pieces from the same bars also showed defects when tested at Högskolan Dalarna. These can
be seen in in Table 9.
Table 9: This table shows which of the seven bars that showed signs of defects when using ultrasonic testing at Ovako and Högskolan Dalarna and if the signal came from a single point or from an area
Ovako charge number
Steel type
Defect found at Ovako (ultrasonic testing)
Defect found at Högskolan Dalarna (ultrasonic testing)
V9083 157C Yes Yes (signal from one point)
V7817 157B Yes Yes (signal from an area)
V6337 157B Yes Yes (signal from an area)
D1103 826B No No
V5265 826B No No
D1051 281P Yes Yes (signal from an area)
V5845 281T No No
In Figure 17-Figure 23 the results from the ultrasonic testing in the lab at Ovako are shown. The test
is calibrated so that 100% = 0.2 mm flat bottom hole.

27
Figure 17: Ultrasonic testing in the lab at Ovako for steel specimen with charge number v9083, steel type 157C and rolling date 2012-11-12
Figure 18: Ultrasonic testing in the lab at Ovako for steel specimen with charge number v7817, steel type 157B and rolling date 2012-06-03

28
Figure 19: Ultrasonic testing in the lab at Ovako for steel specimen with charge number v6337, steel type 157B and rolling date 2012-03-10
Figure 20: Ultrasonic testing in the lab at Ovako for steel specimen with charge number D1103, steel type 826B and rolling date 2013-03-13

29
Figure 21: Ultrasonic testing in the lab at Ovako for steel specimen with charge number v5265, steel type 826B and rolling date 2011-10-23
Figure 22: Ultrasonic testing in the lab at Ovako for steel specimen with charge number D1051, steel type 281P and rolling date 2013-03-06

30
Figure 23: Ultrasonic testing in the lab at Ovako for steel specimen with charge number v5845, steel type 281T and rolling date 2011-12-11
6.3. XRF analysis Table 10 shows the results from the XRF analysis of the pieces that were mixed together. From this
information and from visual comparison it was possible to figure out which pieces that was from the
same charge number. The ones named are the reference pieces or pieces possible to identify with
visual cues. The latter ones are the ones whose names are followed by a 2.
Table 10: Results from the XRF analysis of the mixed together specimens and the reference pieces.
SAMPLE Fe Cr Ni Mn Mo Cu V
unknown1 96.17 0.52 1.72 0.60 0.27 0.06 -
unknown2 95.99 0.45 1.84 0.52 0.97 0.19 -
unknown3 96.13 0.43 1.74 0.51 0.98 0.17 -
unknown4 97.89 0.23 0.10 1.41 0.04 0.20 0.12
unknown5 97.54 0.24 0.13 1.40 0.03 0.14 0.13
unknown6 96.14 0.43 1.70 0.52 1.00 0.18 -
d1051 97.89 0.23 0.10 1.41 0.04 0.15 0.11
d1051,2 97.86 0.25 0.12 1.42 0.04 0.17 0.10
v6337 96.05 0.44 1.78 0.49 0.96 0.18 -
v6337,2 95.96 0.43 1.83 0.51 1.00 0.20 -
v7817 96.03 0.44 1.69 0.53 1.01 0.15 -
v9083 96.17 0.51 1.64 0.63 0.27 0.07 -
v9083,2 96.06 0.52 1.78 0.60 0.26 0.07 -

31
6.4. Optical microscope analysis Pictures taken in optical microscope of the defects surfaces examined further are shown in Figure 24-
Figure 27.
Figure 24: Picture from optical microscope showing a defect in the steel with charge number v9083. The picture width is 210 µm
Figure 25: Picture from optical microscope showing defects in the steel with charge number v7817. The picture width is 520 µm

32
Figure 26: Picture from optical microscope showing defects in the steel with charge number v6337. The picture width is 1030 µm
Figure 27: Picture from optical microscope showing defects in the steel with charge number d1051. The picture width is 210 µm

33
6.5. Electron scanning microscope analysis
6.5.1. Steel specimen with charge number v9083
In this specimen one defect was found. EDX analysis of the bulk material was made in an area and on
one point in the defect. The results are shown in Figure 28 and Table 11.
Table 11: Bulk Material and defect EDX analysis and compositions
Figure 28: Bulk Material and defect EDX analysis and compositions
6.5.2. Steel specimen with charge number v7817
In this specimen one chain of defects were found as well as several smaller defects. EDX analysis of
the bulk material as well as on representative defects was made. A SEM picture of a chain of defects
in the sample is shown in Figure 30. The defect length is in the rolling direction. The results from the
EDX analyses are shown in Figure 29, Figure 31, Table 12 and Table 13.
Bulk material composition (Pink area)
Element Weight% Atomic%
Si 0.50 1.00
Cr 0.68 0.73
Mn 0.68 0.69
Fe 95.79 95.50
Ni 1.96 1.86
Mo 0.39 0.23
Defect point composition (rightmost point)
Element Weight% Atomic%
C 18.63 51.41
Si 0.50 0.59
Cr 0.50 0.32
Mn 0.70 0.42
Fe 78.16 46.40
Ni 1.52 0.86

34
Table 12: Bulk Material and defect EDX analysis and compositions for steel specimen with charge number v7817
Figure 29: Bulk Material and defect EDX analysis and compositions for steel specimen with charge number v7817
Figure 30: SEM picture of a chain of defects in steel specimen with charge number v7817. Picture width is 250 µm.
Bulk material composition (Pink area)
Element Weight% Atomic%
Si 0.38 0.75
Cr 0.47 0.50
Mn 0.54 0.55
Fe 95.78 95.95
Ni 1.61 1.54
Mo 1.22 0.71
Defect point composition (topmost point)
Element Weight% Atomic%
Mg 0.34 0.59
S 38.21 51.28
Cr 0.62 0.51
Mn 58.22 45.60
Fe 2.61 2.01

35
Table 13: EDX analysis of two points in the defect in Figure 30
Figure 31: EDX analysis of two points in the defect in Figure 30
6.5.3. Steel specimen with charge number v6337
In this specimen several chains of defects were found. Three pictures of three of them can be found
in Figure 32-Figure 34. The defect length is in the rolling direction. EDX analysis of the bulk material
as well as on two representative parts of the defects was made. The results of the analysis of the bulk
material and the defects are shown in Figure 35, Figure 36, Table 14 and Table 15. There were also
small darker defects in this sample that is not captured in the pictures.
Figure 32: SEM picture of a chain of defects in steel specimen with charge number v6337. Picture width is 730 µm.
Composition at the left point
Element Weight% Atomic%
Mg 2.22 3.83
Al 0.65 1.00
Si 0.19 0.28
S 38.25 49.93
Ca 0.95 0.99
Cr 0.34 0.27
Mn 54.97 41.88
Fe 2.43 1.82
Composition at the right point
Element Weight% Atomic%
O 46.07 59.93
Mg 9.13 7.82
Al 37.62 29.02
S 1.94 1.26
Mn 3.44 1.30
Fe 1.80 0.67

36
Figure 33: SEM picture of a chain of defects in steel specimen with charge number v6337. Picture width is 250 µm.
Figure 34: SEM picture of a chain of defects in steel specimen with charge number v6337. Picture width is 370 µm.

37
Table 14: Bulk Material and defect EDX analysis and compositions for steel specimen with charge number v6337
Figure 35: Bulk Material and defect EDX analysis and compositions for steel specimen with charge number v6337
Table 15: EDX analysis of the defect point and its compositions for steel specimen with charge number v6337
Figure 36: EDX analysis of the defect point and its compositions for steel specimen with charge number v6337
Composition of the bulk material (pink area)
Element Weight% Atomic%
Si 0.44 0.87
Cr 0.56 0.60
Mn 0.68 0.70
Fe 94.94 95.15
Ni 1.92 1.83
Mo 1.47 0.86
Defect point composition (rightmost point)
Element Weight% Atomic%
S 37.12 50.33
Cr 0.26 0.22
Mn 55.42 43.85
Fe 7.19 5.60
Defect point composition
Element Weight% Atomic%
S 37.26 50.46
Cr 0.26 0.22
Mn 58.55 46.28
Fe 3.92 3.05

38
6.5.4. Steel specimen with charge number D1051
In this specimen a lot of defects were scattered about on the surface. A SEM picture is shown in
Figure 37. EDX analysis of the bulk material as well as on two representative defects was made. The
results of the analysis of the bulk material and a few representative analyses of the defects are
shown in Figure 38 and Table 16.
Figure 37: SEM picture of steel specimen with charge number D1051. Picture width is 1180 µm.

39
Table 16: Bulk Material and defect EDX analysis and compositions for steel specimen with charge number D1051
Figure 38: Bulk Material and defect EDX analysis and compositions for steel specimen with charge number D1051
Composition of the bulk material (pink area)
Element Weight% Atomic%
Si 0.42 0.82
Cr 0.35 0.37
Mn 1.60 1.62
Fe 97.64 97.19
Defect point composition (bottommost point)
Element Weight% Atomic%
Mg 0.72 1.27
Al 0.44 0.70
S 37.65 50.25
Ca 0.62 0.67
Mn 56.88 44.30
Fe 3.68 2.82
Defect point composition (topmost point)
Element Weight% Atomic%
O 47.31 60.87
Mg 8.62 7.30
Al 39.55 30.17
Fe 4.51 1.66

40
7. Discussion
7.1. Theoretical study of hydrogen damage, creep and porosity When evaluating hydrogen damage two kinds are applicable to this situation, hydrogen stress
cracking and shatter cracks. For hydrogen stress cracking the main mechanism is internal diffusion to
stress concentrations where crack initiation leads to failure. The steels that were examined contained
between 0.7 and 1.7 ppm hydrogen and HSC can occur with as little as 0.1 ppm hydrogen content. All
the tested steels had HRC values above the minimum of 22 and estimated tensile strength above 800
MPa. All this and the fact that this is observed between -100° and 100° Celsius make it a theoretically
possible phenomenon for the situation. [7, 8]
Shatter cracks typically occur in forgings and castings. The source of hydrogen is most often water
vapor that reacts with the molten steel. Since Ovako do not preheat the scrap metal before melting
this could be a source for that water vapor. Other sources could be water from the slag or from the
refractory material in the furnace. Excess hydrogen created from its lower solubility in bcc than fcc
diffuse to internal defects like voids or inclusions where the hydrogen atoms form hydrogen
molecules. The pressure can then give the stresses necessary to form internal defects known as
flakes. [7, 8]
Except for lowering the hydrogen content the ways to avoid these two hydrogen damage types differ
a bit. For HSC baking is usable as long as irreversible damage has not yet occurred. If possible it is also
a good idea to choose materials below 22 HRC and 1000 MPa tensile strength. For shatter cracks
minimizing inclusions and voids is important. Sulfides are also important to consider since they
increase the potential of the hydrogen. Slowing down the cooling rate also decreases the risk of
shatter cracks. [7, 8]
Room temperature creep is a mechanism that can facilitate hydrogen diffusion which could increase
the risk of hydrogen damage. RTC itself does not pose a big threat because it does not propagate
cracks on its own. Avoiding pores could be a good way to decrease the available defects to which the
hydrogen diffuses. Pores in themselves do not apply any tension since they are just a void in the steel
matrix but they are a stress concentration point and therefore sensitive to stresses of different kinds.
[3, 6, 11]
The best way to seal pores is to make sure the ingots is deformed enough during forming. To achieve
this, bigger ingots could be used. Or it is possible to consider forging instead of rolling for large
dimensions since forging deforms the steel more. [4, 5]
7.2. Ultrasonic testing and XRF analysis When doing the ultrasonic testing at Ovako it was not known which part of the bar the pieces came
from. Because of different amounts of segregation in different parts of the ingot after casting it is not
possible to compare the ultrasonic analysis to each other. Even if comparing those of the same steel
type to each other only those from steel type 826B shows more defects in the older specimen
compared to the newer. [2, Figure 17-Figure 23]
When looking at the XRF analysis of the unknown samples (after accidentally mixing them together)
it is possible to identify most immediately. Unknown4 and unknown5 both contain vanadium. The
only steel type that contains this element is the one with charge number d1051 which means that

41
these two are of that steel type. Unknown1 contains 0.27 weight% molybdenum. The only steel type
that contains this amount is the one with charge number v9083 which means that this on is of that
type. The ones that are left have very equal composition which is not strange because they are of the
same steel type. They were separated by visual comparison instead which was possible because of
size differences. [Table 5, Table 10]
7.3. Examination in optical and electron scanning microscope As can be seen in the pictures from the optical microscope, defects were found in all the samples
were defects were indicated by ultrasonic testing. The steel specimen with charge number v9083
shows some form of pit or void while the others show one or more cracks. Except in the case of the
steel specimen with charge number v9083 the defects on these pictures might not have been the
ones studied in the scanning electron microscope. This is because these samples had to be grinded
with 1200p paper. This removes some of the material meaning it is not the exact same surface
studied in SEM as in optical microscope. [Table 9, Figure 24 - Figure 27]
The SEM analysis of the steel specimen with charge number v9083 shows a pit of some sort. The bulk
materials composition is in many cases slightly higher than the given intervals. The analysis of the
defect point shows a high amount of carbon. If the fact that the SEM analysis overestimates carbon
content is taken into account the analyzed particle is likely to be some kind of iron carbide. The
amounts of other alloying elements probably come from the surrounding bulk material. [Table 11,
Figure 28]
For the steel specimen with charge number v7817 there seems to be a number of different
inclusions. The first one contains manganese, sulfur, magnesium, chromium and iron. The iron and
chromium is most likely from the bulk material. The similar atomic percentages of manganese and
sulfur indicate a manganese sulfide inclusion. The shape also indicates a ductile inclusion like that
one. The magnesium is probably from a magnesium oxide. Unless found in large amounts oxygen is
omitted from the analysis since it cannot be quantified accurately. [1, Table 12, Table 13, Figure 29 -
Figure 31]
The first point on the second inclusion also contains high amounts of manganese and sulfur which
again indicates a manganese sulfide. The iron and chromium is most likely from the bulk. The
calcium, aluminum, magnesium and silicon are probably from calcium silicates, calcium aluminates,
aluminum and magnesium oxides and/or MgO-Al2O3-spinels. The second point on the inclusion
contains high amounts of aluminum and oxygen. This indicates an aluminum oxide. The iron is from
the bulk. The manganese and sulfur probably from a manganese sulfide close by. The magnesium is
either from magnesium oxide or from MgO-Al2O3-spinels or both. [1, Table 12, Table 13, Figure 29 -
Figure 31]
The analysis of the other inclusions seen in the pictures was omitted because they have similar
composition as the ones already analyzed. The darker ones are aluminum oxide and the lighter ones
and manganese sulfides. [1, Table 12, Table 13, Figure 29 - Figure 31]
For the steel specimen with charge number v6337 several cracks were found. Inclusions were only
found in one of them. As in the previous specimen those inclusions are manganese sulfides. The
darker inclusions in the sample not shown in the pictures are aluminum oxides. For the steel
specimen with charge number d1051 there are no cracks but instead there are several areas with

42
inclusions. As for the previous specimens, the darker inclusions are aluminum oxides and the lighter
are manganese sulfides, both with some other elements included. In the bulk material analysis of this
specimen there is no vanadium like in the XRF analysis. This could be because the amounts are close
to the detection limit for the EDX so it is not detected. [1, Table 10, Table 14 - Table 16, Figure 32 -
Figure 38]
All the steel specimens, except for the one with charge number v9083, contain a lot of inclusions.
Inclusions are initiation points for crack growth and for hydrogen damage. Minimizing the amount of
inclusions in the steel is one way of minimizing shatter cracks. The cracks detected with ultrasonic
testing could have been initiated because of the inclusions. Inclusions have a different elastic
modulus than steel which gives rise of stresses when deformed. This could be a cause for crack
initiation. [1, 7, 8]
8. Conclusions There are two kinds of hydrogen damage that could be affecting the steel during long term storage,
hydrogen stress cracking and/or shatter cracks. More testing is needed to know for sure. But if it is
suspected for a certain steel type baking could be considered and inclusions should be kept to a
minimum. If possible, lowering the hydrogen content is beneficial.
Pores are initiations point for cracks and hydrogen damage. If possible these should be decreased.
This can be done by using bigger ingots or by forging steel types where pores are considered a
problem.
The steel specimens contained a lot of inclusions around the areas that showed defects in the
ultrasonic examinations. Minimizing these could decrease the amounts of defects found in the steels.
9. Further work Some of the possible things to work on in the future are the following:
Determine which of the steel types that Ovako uses that have practical problems with
internal defects and find ways to avoid the problems.
Examine the problem with inclusions further and see if there are inclusions in other steel
types including those that do not show any signs of defects.
Theoretically and/or practically calculate residual tension in the steels after rolling to
determine how these affect crack growth.
10. Bibliography
1. Andersson, M., & Sjökvist, T. (2002). Processmetallurgins Grunder. Stockholm: Kugnliga
tekniska högskolan.
2. Ekerot, S. (2000). Järn- och stålframställning: Skänkmetallurgi och gjutning, jernkontorets
utbildningspaket - del 4. Jernkontoret.
43
3. Becker, W. T., & Shipley, R. J. (2002). ASM Handbook: Volume 11, Failure Analysis and
Prevention. ASM International.
4. Ovako. (1994). Porositeter i ämnen, stång och ringar. Hofors: Ovako.
5. Améen, U., & Söderbäck, C. (1981). Tillverkning av ringar från valsad stång. Igenvällning av
porer och förhindrande av sprickbildning. Hofors: SKF Steel.
6. Fagerlund, G. (1972). Samband mellan porositet och materials mekaniska egenskaper. Lund:
Tid. Institutionen för byggnadsteknik, Tekniska högskolan i Lund .
7. Chatterjee, U. K., Bose, S. K., & Roy, S. K. (2001). Hydrogen damage. In U. K. Chatterjee, S. K.
Bose, & S. K. Roy, Environmental degradation of metals (pp. 437-466). New York: Marcel
Dekker, Inc.
8. Cramer, S. D., & Covino, J. B. (2003). Hydrogen Damage. In S. D. Cramer, & J. B. Covino, ASM
Handbook: Volume 13A, Corrosion: Fundamentals, Testing, and Protection (pp. 367-380).
ASM International.
9. Zhao, J., Mo, T., & Nie, D. (2006). The occurence of room-temperature creep in cracked 304
stainless steel specimens and its effect on crack growth behavior. Materials science and
engineering A, 572-575.
10. Liu, P., Liu, C., Zhao, Z., & Northwood, D. O. (2000). Room temperature creep of a high
strength steel. Materials and Design, 325-328.
11. Berke, M. (2000, september). Nondestructive Material Testing with Ultrasonics; Introduction
to the Basic Principles. NDT.net.
12. Anerud, Marcus. Technical Manager, rolling mill, Ovako Hofors AB (2013)
13. Ovako Hofors AB (2013). General information - 157C.
14. Ovako Hofors AB (2013). General information - 281 P.
15. Ovako Hofors AB (2013). General information - 826B.
16. Ovako Hofors AB (2013). Product specification for Hofors steel designation 157.
17. Ovako Hofors AB (2013). Product specification for Hofors steel designation 826.
18. Kuhn, H., & Medlin, D. (2000). ASM Handbook, Volume 8: Hardness Conversions for Steels,
Mechanical Testing and Evaluation. ASM International.