examining combinations of social physique anxiety and ... · examining combinations of social...
TRANSCRIPT
Examining Combinations of Social Physique Anxiety and Motivation RegulationsUsing Latent Profile AnalysisSarah Ullrich-Frencha, Anne E. Coxa, and Brittany Rhoades Cooperb
aDepartment of Educational Leadership, Sport Studies and Educational/Counseling Psychology, Washington State University, Pullman,Washington; bDepartment of Human Development, Washington State University, Pullman, Washington
ABSTRACTPrevious research has used cluster analysis to examine how social physique anxiety (SPA) com-bines with motivation in physical education. This study utilized a more advanced analyticapproach, latent profile analysis (LPA), to identify profiles of SPA and motivation regulations.Students in grades 9–12 (N = 298) completed questionnaires at two time points assessing SPA andmotivation regulations, psychological needs, enjoyment, effort, and characteristics of physicaleducation peers. LPA identified four profiles representing Autonomous (13.4%), Average (39.3%),Low Autonomous (25.2%), and Autonomous and Introjected (22.1%). Profiles were replicated at asecond time point, and evidence of profile measurement invariance across gender was found. Amultivariate analysis of variance (MANOVA) showed profile differences. The model-based analyticapproach to identify profiles of SPA and motivation regulations differed from cluster analysisprofiles. The profiles were not driven by SPA, rather autonomous motivation is the dominantfactor associated with physical education motivational experiences.
KEYWORDSadolescence; physicaleducation;self-determination theory;social anxiety
Social physique anxiety (SPA) is feeling distressed orapprehensive about others’ potential negative evalua-tion of one’s own physical appearance (Hart, Leary, &Rejeski, 1989). The conceptualization of SPA emergedfrom body image and body esteem literature as well asinterpersonal literature on self-presentational concern(Hart et al., 1989). Adolescents are at risk for experien-cing such concerns, particularly in social settings thatemphasize one’s physique and abilities, such as physicaleducation (Carlson, 1995; Crombie, Brunet, & Sabiston,2011). SPA is of concern because it has been typicallylinked to a variety of negative consequences such aslower perceptions of competence and enjoyment, dis-ordered eating, and avoidance of situations where thebody might be on display (see Sabiston, Pila,Pinsonnault-Bilodeau, & Cox, 2014). However, whathas been less clear is how these feelings of apprehensionover the perceived negative evaluation of one’s bodyimpact physical activity experiences in contexts likephysical education. Both exercising and exercise avoid-ance have been identified as strategies that individualsuse to cope with the unpleasant feelings associated withSPA (Kowalski, Mack, Crocker, Niefer, & Fleming,2006; Sabiston, Sedgwick, Crocker, Kowalski, & Mack,2007). These findings help explain why SPA hasdemonstrated different relationship patterns with levels
of physical activity across samples (see Sabiston et al.,2014). Therefore, an examination of factors that mightmoderate the effects of SPA on physical activity vari-ables in specific contexts is warranted.
Recently, the role of motivation regulations as con-ceptualized by self-determination theory (SDT) hasbeen investigated as a potential moderator in the rela-tionship between SPA and physical activity behavior—that is, past research has examined how physical activ-ity-related indicators varied for individuals with differ-ent combinations of SPA and motivation regulations(Cox, Ullrich-French, & Sabiston, 2013). Motivationwas conceptualized as the different reasons why indivi-duals engage in physical education using an SDT fra-mework (Ryan & Deci, 2007). SDT conceptualizesmotivation as multi-dimensional and the organismicintegration mini-theory outlines different reasons forengagement that fall along a continuum of self-deter-mination ranging from purely intrinsic to increasinglevels of controlling or extrinsic regulation. More con-trolling reasons include participating in physical educa-tion in order to gain an external reward or meet anexternal contingency (i.e., external regulation) or parti-cipating in order to feel better about oneself or avoidfeeling shame (i.e., introjected regulation). These con-trolling types of motivation tend to associate with less
CONTACT Sarah Ullrich-French [email protected] Department of Educational Leadership, Sport Studies and Educational/Counseling Psychology,Washington State University, Physical Education Building, P.O. Box 641410, Pullman, WA 99164.
MEASUREMENT IN PHYSICAL EDUCATION AND EXERCISE SCIENCE2016, VOL. 20, NO. 1, 63–74http://dx.doi.org/10.1080/1091367X.2015.1107571
© 2016 Taylor & Francis
positive outcomes such as lower effort, enjoyment, andphysical activity behavior (Ryan & Deci, 2007; Teixeira,Carraça, Markland, Silva, & Ryan, 2012). On the otherhand, autonomous forms of motivation are likely tosupport positive physical education experiences (e.g.,Cox, Smith, & Williams, 2008; Ntoumanis, 2001;Ullrich-French & Cox, 2009) and are reflected in parti-cipation for the enjoyment and satisfaction of the activ-ity (i.e., intrinsic motivation) or because one values theactivity (i.e., identified regulation).
An early investigation of SPA in a high school phy-sical education setting using a person-centeredapproach (i.e., cluster analysis) showed that the rela-tionship between SPA and different outcomes (i.e.,enjoyment, behavior) depended on how it combinedwith motivation regulations (Cox et al., 2013). Resultsrevealed four distinct clusters: one with relatively highlevels of all motivation regulations and average SPA,one with average autonomous motivation (i.e., intrinsicmotivation and identified regulation combined) andlower controlling motivation and SPA, and two clusterswith students higher in SPA. One of these clusters withrelatively high SPA had moderate levels of all motiva-tion regulations whereas the other had higher externalregulation and lower autonomous motivation andintrojected regulation. Only students in this lattergroup suffered in terms of lower levels of enjoymentand effort in physical education as well as leisure-timephysical activity. Therefore, understanding how SPAcombines with specific motivation regulations mayallow us to more accurately predict levels of engage-ment in physical education for those with higher SPA.
Despite the promise of the initial findings using acluster analysis approach, there are a number of meth-odological limitations in the use of cluster analysis.First, the techniques used to decide on the number ofclusters present within a dataset are somewhat arbitraryand inherently limited (Magidson & Vermunt, 2002;Vermunt & Magidson, 2002). Second, cluster analysisdoes not account for measurement error in clustermembership despite the fact that characteristics of thecluster do not align perfectly with individual partici-pants’ responses within that cluster. This is a problembecause researchers often form conclusions about theindividuals within a cluster without properly acknowl-edging and modeling the uncertainty in cluster mem-bership (Magidson & Vermunt, 2002; Vermunt &Magidson, 2002).
Latent profile analysis (LPA) is a latent variablemixture modeling technique and although not a newanalytic approach, has recently gained attention as asuperior person-centered method for identifying pro-files (Magidson & Vermunt, 2002; Vermunt &
Magidson, 2002). LPA has been successfully applied inother fields to examine the multi-dimensional nature ofhealth-related constructs such as eating disorders(Mitchell et al., 2007), stress and coping (Aldridge &Roesch, 2008), and academic self-concept (Marsh,Lüdtke, Trautwein, & Morin, 2009). The two majormethodological weaknesses of cluster analysis areaddressed in an LPA approach (Magidson &Vermunt, 2002; Vermunt & Magidson, 2002). LPA isa model-based approach, which models the measure-ment error related to the uncertainty in profile mem-bership. It assumes that underlying latent subgroupsexist in a specified population and that membershipcan be inferred based on individual responses to a setof observed variables. Because LPA is a model-basedapproach, there are also several fit statistics (e.g.,Bayesian information criteria [BIC]) which can helpresearchers determine the number of profiles that bestrepresent the data, and compare the relative and overallfit of the model to the data. See Muthen (2001) for amore detailed overview of the LPA model. Given theimportance of better understanding how different com-binations of SPA and motivation regulations in physicaleducation predict relevant outcomes, further researchusing the most methodologically rigorous approach isneeded. Using a more sophisticated modeling approachto identify profiles may allow a better understanding ofpotential precipitating factors of the various combina-tions. Identifying specific antecedents that may associ-ate with the different combinations is important toinform practical strategies for reducing negative physi-cal education experiences. In this study, we examinedtwo types of theoretically relevant antecedents: psycho-logical need satisfaction and social contextual variables,neither of which has been previously examined using aperson-centered profile approach.
Drawing from SDT, psychological need satisfactionhas shown to be instrumental in predicting moreautonomous forms of motivation (Ryan & Deci,2007). In a physical education context, these includethe need to feel competent or effective at differentactivities, the need to feel socially connected to one’steachers and peers, and the need to feel autonomous orthat one has volition in deciding how to act. Thoughrobust data support the relationship between psycholo-gical need satisfaction and more autonomous motiva-tion (e.g., Standage, Duda, & Ntoumanis, 2006; Ullrich-French & Cox, 2009), we do not know how the satisfac-tion of specific needs may link to different combina-tions of SPA and motivation regulations.
The second set of potential antecedents was derivedfrom the social evaluative aspect of SPA. By definition,individuals must perceive the potential for social
64 S. ULLRICH-FRENCH ET AL.
evaluation by others for SPA to manifest (Hart et al.,1989), thus the characteristics of the people within aparticular setting may be relevant to the degree of SPAexperienced. Several studies have found that character-istics of others (e.g., presence of men versus women) orthe nature of social relationships with others who arepresent (e.g., parents versus peers, being around a bestfriend or close friends) associate with SPA. For exam-ple, young adults report greater SPA in the presence oftheir peers compared to their parents (Brunet &Sabiston, 2011). In another study, participants reportedthat they would experience less SPA when in the pre-sence of a best friend or in the company of severalfriends (i.e., three or more) compared to being alone(Carron & Prapavessis, 1997). Finally, women in anexercise setting reported higher SPA in a mixed gendersetting compared to an all-female setting and evenhigher SPA in an all-male exercise setting(Kruisselbrink, Dodge, Swanburg, & MacLeod, 2004).The same was not found for men. Thus, fluctuations inSPA associate with the characteristics of others within aparticular setting. A key limitation of the current lit-erature is that participants are often asked to imaginewhat they would feel in a hypothetical scenario ratherthan in a real-world setting they are currently experi-encing. This limitation will be addressed in the presentstudy.
In the physical education setting, limited researchhas explored the characteristics of others in relation toSPA. In one study, the number of close friends orpresence of a best friend in one’s physical educationclass did not predict SPA in that setting (Cox, Ullrich-French, Madonia, & Witty, 2011). The only significantsocial variable was peer acceptance in physical educa-tion class. The more students felt they were accepted bytheir peers, the less SPA they experienced. In line withexercise research, identifying characteristics of the peersone interacts with during physical education class mayelucidate key correlates of SPA within this setting.Some peer characteristics that have not been exploredpreviously, but may be relevant to the social evaluativepotential of the physical education setting include gen-der, skill, age, as well as the familiarity of other studentsone is participating with during activities in physicaleducation.
We had four specific aims in this study. First, weused latent profile analysis to identify unique combina-tions of SPA and motivation regulations (autonomousmotivation, introjected regulation, external regulation)in physical education in order to directly compare theresults with a previous investigation in which clusteranalysis was used (Cox et al. 2013). Second, weextended the previous investigation by replicating the
emergent profiles identified in the first wave of datacollection with data from the same students 4 monthslater and tested gender invariance of the profiles toprovide stronger evidence of profile validity. Third,we used a classify-analyze approach to assign indivi-duals to profiles and to examine differences on theore-tically relevant variables. We examined profiledifferences in the outcomes of enjoyment and effortin physical education, similar to Cox et al. (2013). Weextended the previous investigation by also examiningdifferences in motivation antecedent variables includ-ing characteristics of the social group students wereparticipating with (i.e., number of close friends, degreeof familiarity of classmates, relative age, gender, skill ofother students) and psychological needs (perceivedcompetence, autonomy, and relatedness) in physicaleducation.
Since LPA has not previously been conducted withthese variables we did not know what differences mightemerge when using a different analytic approach. Wetherefore took an exploratory approach by not startingwith a pre-determined number of profiles. Based onSDT and past findings, we did however hypothesizethat profiles characterized by greater autonomous moti-vation regardless of levels of SPA or controlling formsof motivation would predict greater effort and enjoy-ment in physical education. We also expected thatwhen students experienced greater psychological needfulfillment and were more similar to (i.e., age, gender,skill level) and familiar with the students they wereparticipating with, they would belong to a profile char-acterized by greater autonomous motivation and lessSPA relative to other profiles.
Method
Participants and procedure
Students in grades 9–12 at a public high school weresent home with a letter detailing the study and parentalconsent forms after study approval was received fromthe Institutional Review Board. Then, those studentswho returned signed parent consent forms were invitedto take a survey administered by one of the studyauthors and several research assistants that includedmeasures of all study variables during a regularly sched-uled physical education class in November. They wereinformed of study risks, their rights as participants, andthat completing the survey indicated their assent.Students completed the same survey a second time inMarch of the same school year. During each quarter ofthe school year, students were given the opportunity tochoose which activity they wanted to participate in.
MEASUREMENT IN PHYSICAL EDUCATION AND EXERCISE SCIENCE 65

Thus, at the second data collection point, students wereparticipating in a different activity than during the firstdata collection and potentially with a different group ofpeers. Further, students were not divided by age, grade,or gender so there was great potential for the degree ofhomogeneity within groups to vary considerably. Forthis study, only those students who completed surveysat both data collection points were included in theanalyses to aid in the ability to compare the solutionsobtained at different time points. The sample included298 students with an average age of 15.72 (SD = 1.23),60% girls, and 86.7% White. Approximately 20% of thestudents were in 9th, 11th, and 12th grade, and 42%were in 10th grade.
Measures used in latent profiles
SPA. Concern and worry about others evaluating theirappearance negatively within the context of physicaleducation was assessed with a modified nine-item ver-sion of the SPA Scale (Hart et al., 1989; Martin, Rejeski,Leary, McAuley, & Bane, 1997). The item that refers tobeing in a bathing suit was excluded because it was notrelevant in this physical education setting. The scalewas modified by instructing students to respond tohow true each statement was for them while participat-ing in their current activity in physical education. Anexample item is “Unattractive features of my physique/figure make me nervous during this activity in physicaleducation class.” Possible responses ranged from 1 (notat all characteristic of me) to 5 (extremely characteristicof me). Convergent and factorial validity as well asinternal consistency reliability of scale scores havebeen supported in studies using contextualized versionsof this instrument (Brunet & Sabiston, 2009; Cox et al.,2011).
Motivation regulations. Four motivation regulations(intrinsic motivation, identified regulation, introjectedregulation and external regulation) or the reasons whystudents participated in physical education were mea-sured with the Perceived Locus of Causality Scale(Goudas, Biddle, & Fox, 1994). The scale includesfour items tapping into each regulation and studentsrespond after the stem, “I take part in physical educa-tion class. . ..” Responses range from 1 (strongly dis-agree) to 7 (strongly agree). Many physical educationstudies support the validity and internal consistencyreliability of subscale scores (e.g., Standage et al.,2006; Ullrich-French & Cox, 2009). Consistent withour previous study (Cox et al., 2013) and due to highcorrelations (.84 and .77), subscale scores for intrinsic
motivation and identified regulation were averaged tocreate an autonomous motivation variable for the mainanalyses.
Profile antecedent and outcome measures
Enjoyment. The amount of fun students experiencedduring their current activity in physical education wasmeasured with two items modified from the work ofScanlan, Carpenter, Schmidt, Simons, and Keeler(1993) on the sport enjoyment scale. The items were“How much do you enjoy the current activity you aredoing in physical education?” and “How much fun doyou have participating in your current activity in phy-sical education?” Support for the validity and internalconsistency reliability from similarly modified itemshas been found with a physical education sample(Ullrich-French & Cox, 2009). Correlation betweenthese items was .71 in the current sample.
Psychological need satisfaction. Competence wasassessed using a modified version of the sports compe-tence scale (Amorose, 2003). Three items addressedhow good, how much ability, and how skilled eachstudent felt they were in their current activity in phy-sical education. An example item is “How good do youthink you are at the sport/activity you are currentlydoing in your physical education class?” Responsesranged from 1 (not at all good/not much ability/notskilled) to 5 (very good/whole lot of ability/very skilled).Reliability and validity evidence has been provided incollege age samples (Amorose, 2003; Hollembeak &Amorose, 2005).
Autonomy was assessed with six items developedby Hollembeak and Amorose (2005) to tap into per-ceptions of choice and volition in the context ofsport. We modified these items slightly for students’current activity (e.g., “I have a say in what I do whenparticipating in this sport/activity.” Responses fall ona scale ranging from 1 (not at all true for me) to 5(completely true for me). Relatedness was measuredusing the 10 items from the Need for RelatednessScale (Richer & Vallerand, 1998). Items followed theprompt of “In my relationships with my teacher andclassmates in this sport/activity, I feel . . .” followedby items, such as “supported,” “close to them,”“understood.” Responses fall on a 7-point scale ran-ging from 1 (strongly disagree) to 7 (strongly agree).There is reliability and validity evidence for thesemeasures of perceived autonomy and relatedness ina similar sample (Ullrich-French & Cox, 2009).
66 S. ULLRICH-FRENCH ET AL.
Social variables. Five items were developed for thisstudy to assess students’ perceptions of the character-istics of the peers in their activity group in physicaleducation. First, “How many of your close friends areparticipating in your current sport/activity withyou?” was asked with a response set ranging from 0to 5 or more friends. Four items were asked aboutthe relative composition of the other students in thecurrent class: “Generally, the students in my groupare” with the response options of 1 (completelyunknown/strangers) to 7 (well known to me),“Generally the students in my group are” withresponse options of 1 (much younger than me) to 7(much older than me), “With regard to how good/skilled my classmates are at this activity, generally,the students in my group are” with response optionsof 1 (much worse than me) to 7 (much better thanme), “Generally, the students in my group are” withresponse options of 1 (mostly opposite gender) to 7(mostly my gender).
Data analysis
We used LPA (Gibson, 1959; Moustaki, 1996; Vermunt& Magidson, 2002) as a person-centered analytic tech-nique to identify profiles of students based on SPA andmotivation regulations. We used this approach becauseLPA is a model-based approach that accounts for mea-surement error in the profiles and uses fit statistics toaid the selection of the profile solution that best fits thedata. The observed indicators included autonomousmotivation, introjected regulation, external regulation,and SPA.
We fit a series of LPA models with 1 through 6classes, or profiles. Model identification was assessedusing 1,000 sets of starting values. For model selection,we used information criteria (BIC, Akaike informationcriterion [AIC], and adjusted BIC) to compare models,with lower values indicating better relative fit. We alsoexamined entropy, which ranges from 0 to 1 withnumbers closer to 1 indicating improved accuracy forclassifying individuals into the “correct” profile, andLo-Mendell-Rubin likelihood ratio test (LMR-LRT;Lo, Mendell, & Rubin, 2001), which provides a teststatistic to show whether a lower versus higher numberprofile solution is a better fit. All models were fit usingMPLUS 7.11. To validate the structure of the solutionwe conducted the LPA with the second time point inorder to compare the final solution from time one tothe same sample at a second time point.
A classify-analyze approach was taken to examinewhether individuals classified into profiles, based oneach individual’s highest probably of profile
membership, would differ on outcome and antecedentvariables. Three separate multivariate analyses of var-iance (MANOVAs) were conducted, all using profilemembership as the fixed factor and included genderand grade as covariates to examine profile differenceson three sets of dependent variables of (a) psychologicalneeds (competence, autonomy, relatedness), (b) enjoy-ment and effort in physical education, and (c) socialcontextual variables representing the activity groupmakeup of number of close friends, age, gender, skill,and familiarity.
Results
There were no missing data on the variables used tocreate profiles. There were missing data on one variable(effort), but Little’s MCAR test was not significant (χ2
(75) = 69.24, p > .05) therefore expectation maximiza-tion was used to impute missing data on this variable.All variables were normally distributed and the onlyoutliers (n = 4) were detected on the variable effort.Analyses run with and without the outliers were nearlyidentical, therefore all cases were retained. There wereno multivariate outliers (p mahalanobis’s distance <.001). Internal consistency reliability ranged fromα = .77–.95 for all calculated scales (see Table 1).
The whole sample (N = 298) scored above the mid-point on all motivation regulation measures androughly at the mid-point on the SPA measure (seeTable 1). Students also reported moderate scores onthe psychological needs and enjoyment, and relativelyhigh on effort in physical education. For the socialcontextual indices, students reported having almostthree close friends in their current physical educationactivity and scored above the midpoint on the degree towhich students in their group were well known tothem. The indices representing social context indicatedthat on average, students reported classmates were rela-tively similar to them in age and skill, and that studentsin their group tended to be more of their own gender(more similar to themselves). Correlations appear inTable 1. SPA was not related to autonomous motiva-tion, but had small positive relationships with intro-jected and external regulations. SPA also was negativelycorrelated with psychological needs (although the cor-relation with autonomy was not significant) and effortin physical education, but not correlated with enjoy-ment. SPA also was positively correlated with relativeage and skill in that those with high SPA reportedclassmates as older and more skilled than themselves.Those who reported that more students in their groupwere their own gender also reported classmates weremore well known.
MEASUREMENT IN PHYSICAL EDUCATION AND EXERCISE SCIENCE 67

LPA
Models 1–6 were well identified. The AIC and adjustedBIC were lowest for the 6-profile solution suggestingthis model fit the data best, but the BIC was lowest forthe 4-profile solution which also supports good modelfit for the 4-profile model (see Table 2 for all model fitstatistics). In addition, the LMR-LRT indicates the 4-profile solution is better than 3-profile (p < .05) whilethe 5- and 6-profile solutions do not provide improvedfit (p > .05). Although entropy was highest for the 6-profile solution (.76), the 4-profile solution was similar(.73) and was the second highest value. As a result, wecarefully examined the 3-, 4-, 5-, and 6-profile modelsfor conceptual clarity. In determining the most appro-priate profile solution, it is important to balance boththe statistical fit criteria with the conceptual and prac-tical understanding of the profiles (Collins & Lanza,2010). The additional profiles added in the 5-profileand 6-profile models did not contribute to our concep-tual understanding (i.e., the added profiles were highlysimilar and essentially duplicated an existing profile)and because only a small proportion (less than 10%) of
the sample fell into those added profiles, we focusedour model selection on the more parsimonious 3- and4-profile models. The 4-profile model was very similarto the 3-profile model, but added an average profilethat provided unique representation of both introjectedand external regulations, which we believe better cap-tured the nuances of potential motivation regulationprofiles. The 4-profile solution was selected based onthese conceptual reasons and overall support from themodel fit statistics. To validate the structure of theselected 4-profile model, we replicated the 4-profilemodel with the same sample at a second time-point,four months later. All defining characteristics of theprofiles were replicated, further supporting our selec-tion of the 4-profile model.1 The remaining analysesused the time one data.
The 4-profile model at time one is presented inTable 3 with the estimated means and standard errorfor each indicator for each profile based on the LPAresults. The total sample estimated means are also pro-vided to aid in interpretation of profiles. The firstprofile represented 13.4% of the sample and was labeled
Table 1. Descriptive statistics, N = 298.1 2 3 4 5 6 7 8 9 10 11 12 13 14
1. Autonomous2. Introjected .61**3. External −.10 .32*4. SPA −.08 .13* .22**5. Competence .51** .29** −.10 −.27**6. Autonomy .42** .17** −.23** −.09 .19**7. Relatedness .57** .37** −.07 −.12* .39** .36**8. Enjoy current .60** .30** −.19** −.03 .35** .39** .41**9. Effort .42** .26** −.09 −.13* .35** .21** .28** .30**10. Close friends .24** .14* .03 −.04 .26** .17** .41** .22** .23**11. Known classmates .33** .23** −.01 .02 .33** .18** .52** .23** .18** .46**12. Relative age .11 .09 .09 .12* −.10 .14* .03 .09 .07 .11 .0513. Relative skill −.07 −.10 −.01 .18** −.36** .01 −.11 −.01 −.11 −.01 −.02 .31**14. Relative gender .33** .14* −.12* −.04 .17** .09 .21** .19** .17** .06 .21** .03 .05Scale 1–7 1–7 1–7 1–5 1–5 1–5 1–7 1–5 1–4 1–6 1–7 1–7 1–7 1–7Mean (SD) 4.15
(1.57)3.55(1.48)
3.86(1.57)
2.57(.91)
3.57(.87)
3.00(.74)
4.22(1.37)
3.10(1.03)
3.39(.72)
2.78(1.69)
4.80(1.55)
4.23(1.12)
4.02(1.20)
5.43(1.80)
Alpha .93 .77 .78 .86 .89 .82 .95 — — — — — — —
Notes. *p < .05, **p < .01. Autonomous = autonomous motivation; Introjected = introjected regulation; External = external regulation; Effort = physicaleducation effort; Known classmates = relative familiarity with classmates.
Table 2. Model fit statistics for the LPA profile selection process.Number of profiles
1 2 3 4 5 6
HO LL −2,046.374 −1,985.968 −1,955.996 −1,929.329 −1,916.928 −1,916.604LL corrected .836 1.082 1.051 1.082 1.169 1.163AIC 4,108.748 3,997.937 3,947.991 3,904.659 3,889.855 3,879.208BIC 4,138.325 4,045.999 4,014.539 3,989.692 3,993.374 4,001.212n-Adjusting BIC 4,112.954 4,004.771 3,957.454 3,916.750 3,904.576 3,896.557Max LL H1 −1,925.558 −1,925.558 −1,925.558 −1,925.558 −1,925.558 −1,925.558Entropy na .665 .700 .734 .734 .761LMR-LRT na 116.714 57.913 51.524 23.962 19.947p na .003 .002 .012 .351 .355
Note. HO LL = null log likelihood; LL corrected = log likelihood corrected.
68 S. ULLRICH-FRENCH ET AL.

Autonomous. This profile was characterized by higherthan average autonomous motivation in combinationwith lower than average introjected and external regu-lation, and SPA. The second profile represented 39.3%of the sample and was labeled Average because theyreported average levels of all four indicators. The thirdprofile represented 25.2% of the sample and was labeledLow Autonomous because they reported lower thanaverage levels of autonomous motivation and intro-jected regulation in combination with average externalregulation and SPA. Finally, the fourth profile repre-sented 22.1% of the sample and was labeledAutonomous and Introjected. This profile was charac-terized by higher than average autonomous motivationand introjected regulation in combination with rela-tively average levels of external regulation and SPA.
Gender invariance. To determine if the structure ofthe 4-profile model remained consistent across maleand female students, we conducted a measurementinvariance test by incorporating gender as a groupingvariable. We estimated one model with profilesrestricted to be equal across gender and comparedthe difference in log likelihood values and degrees offreedom to a freely estimated model (log likelihooddifference: 3.22, df difference: 4). Using the G-squareddifference test, we found evidence for measurementinvariance (i.e., the structure of the 4-profile modelis the same for male and female students [G-squared:3.22 < 11.14, alpha = .05, df = 4]). Although theprofile structure was the same, the proportions ofmale and female students within each profile weredifferent (χ2 (3) = 10.40, p < .05) with nearly half ofthe girls in the Average profile as compared to 12% ofboys. The remaining students were distributed moreevenly across the Autonomous (17% girls, 29.5% boys),Low Autonomous (20% girls, 28.5% boys), andAutonomous and Introjected (21% girls, 30% boys)profiles, although males had generally higher represen-tation across all profiles, except for the Averageprofile.
Profile classification. In order to examine the associa-tions between profile membership and the variables ofinterest, we used a classify-analyze approach to assignparticipants to the profile in which he/she has the high-est posterior probability (see Clogg, 1995). Posteriorprobabilities are produced based on the LPA model toindicate the likelihood that each individual belongs ineach profile. The average posterior probabilities ofmembership in this study were high, ranging from .83to .87, indicating relatively low classification error. Thisfour-level categorical variable was used to representprofile membership in the remaining analyses.
Profile differences in psychological needs,enjoyment/effort, and social context
The MANOVA with the psychological needs of com-petence, autonomy, and relatedness as dependent vari-ables was significant (Pillai’s trace = .405; F (9,867) = 15.04, p < .01, ηp
2 = .14). Grade was a significant(p < .01) covariate. Follow-up analyses of variance(ANOVAs) support significant differences betweenprofiles for competence (F (3, 289) = 28.08, p < .01,ηp
2 = .23), autonomy (F (3, 289) = 14.67, p < .01,ηp
2 = .13), and relatedness (F (3, 289) = 37.41,p < .01, ηp
2 = .28). Examination of pairwise compar-isons of the estimated marginal means controlling forgender and grade are reported in Table 4 with signifi-cant profile differences indicated by different super-scripts. The Autonomous and Autonomous andIntrojected profiles do not differ on any psychologicalneed variable representing similarly high scores. TheLow Autonomous profile is significantly lower than allother profiles across all psychological needs. TheAverage profile fell in-between the most adaptive andleast adaptive profiles, though it did not differ from theAutonomous and Introjected profile on autonomy.
The MANOVA with enjoyment of current activityand effort in physical education as dependent variableswas significant (Pillai’s trace = .37; F (6, 578) = 21.70,p < .01, ηp
2 = .18). Gender and grade were not signifi-cant (p > .05). Follow up ANOVAs support significant
Table 3. Latent profile means, standard error, and full sample estimated means.Latent profiles
Autonomous(N = 40)
Average(N = 117)
Low Autonomous(N = 75)
Autonomous and Introjected(N = 66) Full sample (N = 298)
M SE M SE M SE M SE M
Autonomous motivation 4.90 .30 4.13 .21 2.16 .16 5.78 .17 4.16Introjected regulation 2.54 .29 3.89 .16 1.93 .16 5.37 .19 3.56External regulation 2.13 .32 4.33 .24 3.80 .27 4.31 .21 3.86SPA 1.94 .13 2.74 .14 2.61 .13 2.68 .12 2.57
MEASUREMENT IN PHYSICAL EDUCATION AND EXERCISE SCIENCE 69
differences between profiles for enjoyment of currentactivity (F (3, 289) = 45.58, p < .01, ηp
2 = .31) and effort(F (3, 289) = 18.29, p < .01, ηp
2 = .16). Examination ofpairwise comparisons of the estimated marginal meanscontrolling for gender and grade are reported inTable 4 with significant profile differences indicatedby different superscripts. The Autonomous andAutonomous and Introjected profiles did not differand were higher than other profiles on all variables,except for the Average profile on effort in physicaleducation. The Low Autonomous profile had signifi-cantly lower scores on enjoyment and effort variablescompared to all other profiles. The Average profile hadscores in-between the most adaptive and least adaptiveprofiles on all variables, except effort in physicaleducation.
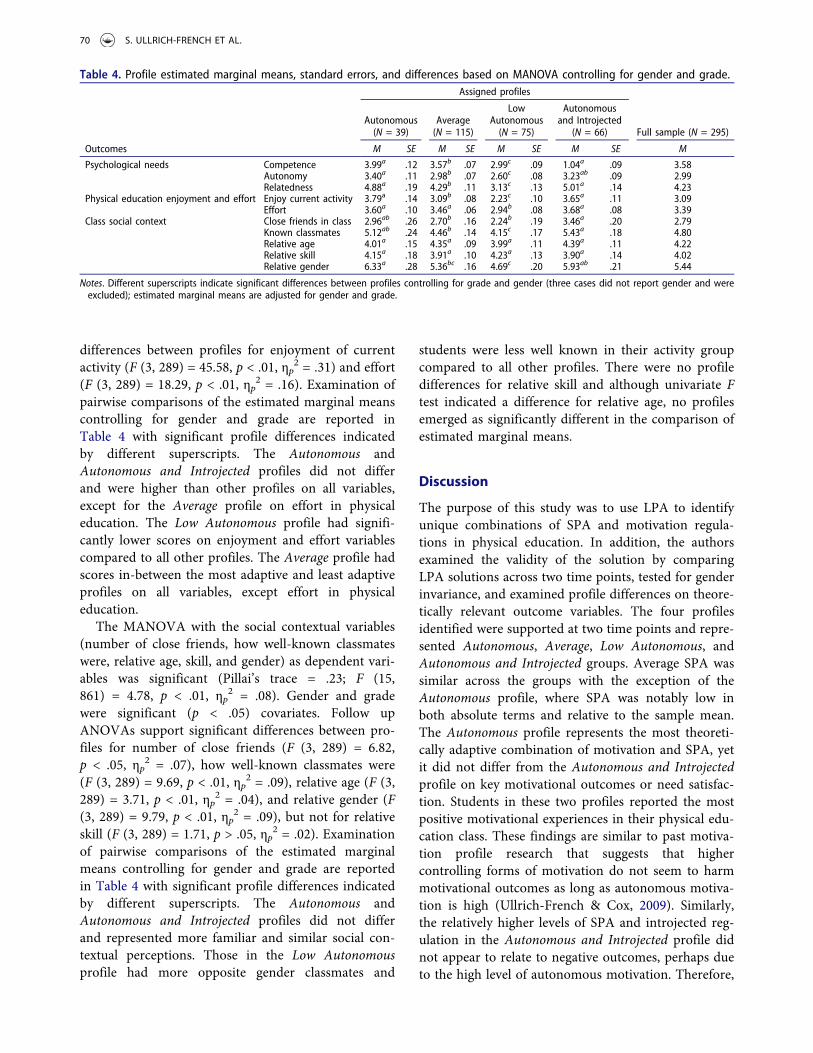
The MANOVA with the social contextual variables(number of close friends, how well-known classmateswere, relative age, skill, and gender) as dependent vari-ables was significant (Pillai’s trace = .23; F (15,861) = 4.78, p < .01, ηp
2 = .08). Gender and gradewere significant (p < .05) covariates. Follow upANOVAs support significant differences between pro-files for number of close friends (F (3, 289) = 6.82,p < .05, ηp
2 = .07), how well-known classmates were(F (3, 289) = 9.69, p < .01, ηp
2 = .09), relative age (F (3,289) = 3.71, p < .01, ηp
2 = .04), and relative gender (F(3, 289) = 9.79, p < .01, ηp
2 = .09), but not for relativeskill (F (3, 289) = 1.71, p > .05, ηp
2 = .02). Examinationof pairwise comparisons of the estimated marginalmeans controlling for gender and grade are reportedin Table 4 with significant profile differences indicatedby different superscripts. The Autonomous andAutonomous and Introjected profiles did not differand represented more familiar and similar social con-textual perceptions. Those in the Low Autonomousprofile had more opposite gender classmates and
students were less well known in their activity groupcompared to all other profiles. There were no profiledifferences for relative skill and although univariate Ftest indicated a difference for relative age, no profilesemerged as significantly different in the comparison ofestimated marginal means.
Discussion
The purpose of this study was to use LPA to identifyunique combinations of SPA and motivation regula-tions in physical education. In addition, the authorsexamined the validity of the solution by comparingLPA solutions across two time points, tested for genderinvariance, and examined profile differences on theore-tically relevant outcome variables. The four profilesidentified were supported at two time points and repre-sented Autonomous, Average, Low Autonomous, andAutonomous and Introjected groups. Average SPA wassimilar across the groups with the exception of theAutonomous profile, where SPA was notably low inboth absolute terms and relative to the sample mean.The Autonomous profile represents the most theoreti-cally adaptive combination of motivation and SPA, yetit did not differ from the Autonomous and Introjectedprofile on key motivational outcomes or need satisfac-tion. Students in these two profiles reported the mostpositive motivational experiences in their physical edu-cation class. These findings are similar to past motiva-tion profile research that suggests that highercontrolling forms of motivation do not seem to harmmotivational outcomes as long as autonomous motiva-tion is high (Ullrich-French & Cox, 2009). Similarly,the relatively higher levels of SPA and introjected reg-ulation in the Autonomous and Introjected profile didnot appear to relate to negative outcomes, perhaps dueto the high level of autonomous motivation. Therefore,
Table 4. Profile estimated marginal means, standard errors, and differences based on MANOVA controlling for gender and grade.Assigned profiles
Full sample (N = 295)Autonomous(N = 39)
Average(N = 115)
LowAutonomous(N = 75)
Autonomousand Introjected
(N = 66)
Outcomes M SE M SE M SE M SE M
Psychological needs Competence 3.99a .12 3.57b .07 2.99c .09 1.04a .09 3.58Autonomy 3.40a .11 2.98b .07 2.60c .08 3.23ab .09 2.99Relatedness 4.88a .19 4.29b .11 3.13c .13 5.01a .14 4.23
Physical education enjoyment and effort Enjoy current activity 3.79a .14 3.09b .08 2.23c .10 3.65a .11 3.09Effort 3.60a .10 3.46a .06 2.94b .08 3.68a .08 3.39
Class social context Close friends in class 2.96ab .26 2.70b .16 2.24b .19 3.46a .20 2.79Known classmates 5.12ab .24 4.46b .14 4.15c .17 5.43a .18 4.80Relative age 4.01a .15 4.35a .09 3.99a .11 4.39a .11 4.22Relative skill 4.15a .18 3.91a .10 4.23a .13 3.90a .14 4.02Relative gender 6.33a .28 5.36bc .16 4.69c .20 5.93ab .21 5.44
Notes. Different superscripts indicate significant differences between profiles controlling for grade and gender (three cases did not report gender and wereexcluded); estimated marginal means are adjusted for gender and grade.
70 S. ULLRICH-FRENCH ET AL.
consistent with an earlier study (Cox et al., 2013),results suggest that autonomous motivation associateswith positive outcomes in physical education irrespec-tive of SPA levels.
Aside from the Autonomous profile, the three remain-ing profiles had similar levels of SPA yet differed acrossmany of the outcome variables. The Autonomous andIntrojected profile reported the most positive outcomes,followed by the Average profile and then the LowAutonomous profile. Notably, there were significant dif-ferences between all three groups on enjoyment and needsatisfaction. Therefore, students whoweremost at-risk fornegative experiences in physical education were in theLow Autonomous profile which was characterized by rela-tively low autonomous motivation and average externalregulation and SPA, but scores that fall above the scale’smidpoint. These findings suggest that level of autono-mous motivation is a better predictor of students’ experi-ences in physical education compared to SPA level.
The Autonomous profile appeared to be a rather eliteprofile due to representing the smallest proportion ofstudents and a higher proportion of male students.First, the small number of students in this profile sug-gests that it is difficult for students to obtain such atheoretically adaptive motivation pattern that includeslow levels of both forms of controlling motivation andSPA. The higher proportion of male students in thisprofile is consistent with research showing that boysreport experiencing lower SPA (Brunet & Sabiston,2009; Kowalski et al., 2006; Smith, 2004) and higherautonomous motivation (Brunet & Sabiston, 2009).Although the gender distribution within profiles varied,we found a similar profile structure across genderthrough measurement invariance testing. This indicatesthat these variables may combine similarly for male andfemale students. The research on SPA has focused moreon female samples than male samples; however, there isincreasing evidence to suggest that this construct ismeaningful for male populations.
The LPA approach used in this study identifieddifferent profiles compared to those identified using acluster analysis approach (Cox et al., 2013). We inten-tionally used the same sample and time point in orderto make direct comparisons. In the LPA approach, SPAdid not appear to drive profile characteristics as theaverage level of this variable remained relatively stableacross profiles. The standard deviation of SPA for eachprofile indicated relatively high levels of variability (SDrange .91–1.03) across the profiles with the exception ofthe Autonomous profile where the standard deviationwas notably lower (SD = .45). This indicates that levelsof SPA vary considerably within three of the profiles.The differences in profiles across the two analytic
approaches could in part be due to the use of fitstatistics to inform model selection and the ability toaccount for measurement error in profile membership,which are the two major advantages to utilizing an LPAapproach. This could also be a reflection of the complexand possibly non-linear relationship that SPA may havewith motivation and physical activity. However, the useof a second time point to verify the profiles identifiedusing LPA and support for gender invariance providedevidence of the validity and reliability of LPA results.
In this study, we examined the associations betweenspecific characteristics of the peer social context and theemergent profiles. Although there are clearly limita-tions in the measurement of these indicators of thepeer context, we found that the profiles overlappedmore on the peer context variables than on psycholo-gical needs, enjoyment, or effort. This suggests greatervariability in how some of these indicators may relateto the motivation and SPA profiles. The primary dif-ference among profiles on the peer context variableswas reflected in the lower level of familiarity withclassmates in the Low Autonomous profile. Cox et al.(2011) found that in the physical education context theonly peer contextual variable that predicted SPA wasperceptions of acceptance by peers. The finding thatfamiliarity of peers in the physical education contextonly distinguished the Low Autonomous group suggestsa motivational relevance of how familiar and well-known peers are in the physical education settingwhich could provide a sense of social comfort andbelonging. This is supported in the significant andpositive bivariate correlations of close friends andfamiliarity of peers with all psychological needs, parti-cularly with relatedness perceptions. Low to moderatepositive correlations with these two peer variables andall motivation regulations, SPA, psychological needs,enjoyment, and effort in physical education furthersupport the important role of the peer context.Interestingly, relative skill and age did not differentiateany of the profiles. Thus, it seemed that friendships andfamiliarity which could support social belonging werethe most important social contextual variables for dis-tinguishing the motivation profiles. To more thor-oughly explore these issues stronger measures wouldbe necessary. We created simple one-item indicators torepresent relevant aspects of the social context; how-ever, valid and reliable measures would increase theability to draw conclusions regarding the relevance ofthe social context to the profiles.
Though they did not distinguish the different pro-files, small positive bivariate correlations with SPA werefound with relative age and skill. These correlationssuggest that those who participate with peers who are
MEASUREMENT IN PHYSICAL EDUCATION AND EXERCISE SCIENCE 71

older and more skilled also experience greater SPA inphysical education. Interestingly, autonomous motiva-tion was not correlated with SPA in this sample. Thesefindings suggest that autonomous motivation, a power-ful driver of the profiles and a reflection of internalizedmotivation was not systematically related to SPAwhereas features of the peer context that may heightensocial anxiety and controlling forms of motivation doalign with SPA. These findings could reflect that stu-dents with lower autonomous motivation and highercontrolling motivation are more aware of, or sensitiveto the features of the peer context. Whether a lessadaptive social context drives low autonomous motiva-tion or vice-versa cannot be established in this study,but deserves further exploration.
Because SPA in the physical education contextassociates with lower effort, avoidant behaviors, andless physical activity overall (Cox et al., 2013; Coxet al., 2011), it is vital to create a motivationally andsocially comfortable environment for physical educa-tion students. Interventions in the physical educationcontext that address issues of both motivation andsocial concerns are likely to be most effective inameliorating feelings of SPA. Although some of thecharacteristics of the peer context may be manipu-lated through appropriate skill and age groupings, itmay be more practical to use strategies to enhance ageneral sense of belonging and autonomous motiva-tion for physical education. Future research maytease out the unique effects of manipulating peercontextual factors compared to fostering autonomousmotivation.
A number of limitations should be noted in theinterpretation of the current results. First, the datarepresent minimal diversity and generalizability. Thenature of person-centered analyses leads to limitedgeneralizability and replicability of profiles. Althoughthe LPA approach provides a more model-drivenapproach with more objective criteria for making deci-sions, it remains an approach that is highly sensitive tothe sample. Future LPA research may also be improvedby utilizing a more rigorous method for classifyingindividuals into profiles referred to as an “inclusiveapproach,” which has recently been shown to improveestimates of the association between profiles and othervariables of interest (Bray, Lanza, & Tan, 2014). Finally,the peer contextual items were measured in a limitedway by using single item indicators without strongpsychometric support. Increased precision in measur-ing some of the peer features would be useful in futureresearch to bolster our understanding of characteristicsof the peer physical education context. Measures withevidence supporting reliability and validity are needed
to more confidently make conclusions about specificaspects of the peer context. Ultimately, research testingmanipulations of the social context or motivation willbe important to determine effective strategies teacherscan use to create the most adaptive physical educationexperience for students.
Overall, this study provided an example of usingthe more advanced person-centered LPA to examineSPA and motivation profiles in the physical educa-tion context. The authors were able to directly com-pare the results to the more limited analytic approachof cluster analysis and provide evidence of profilestructure stability across time and gender. LPA didnot fully replicate profiles identified using clusteranalysis (Cox et al., 2013), highlighting that differentanalytic approaches can lead to different results.Further use of LPA in the sport and exercise psychol-ogy literature is encouraged to provide a strongermethodological approach to profile creation. Resultssuggest that SPA may not explain motivation profiledifferences in physical education experiences. Rather,the profile differences examined appear to largelyreflect sensitivity to levels of autonomous motivationrather than SPA. Future research is needed to furtherexplore the complex relationship of SPA with moti-vational and behavioral outcomes across samples andcontexts.
Note
1. Contact the first author for the full results of the timetwo LPA results.
References
Aldridge, A. A., & Roesch, S. C. (2008). Developing copingtypologies of minority adolescents: A latent profile analy-sis. Journal of Adolescence, 31, 499–517. doi:10.1016/j.adolescence.2007.08.005
Amorose, A. J. (2003). Reflected appraisals and perceivedimportance of significant others’ appraisals as predictorsof college athletes’ self-perceptions of competence.Research Quarterly for Exercise and Sport, 74, 60–70.doi:10.1080/02701367.2003.10609065
Bray, B. C., Lanza, S. T., & Tan, X. (2015). Eliminating bias inclassify-analyze approaches for latent class analysis.Structural Equation Modeling: A MultidisciplinaryJournal, 22, 1–11. doi:10.1080/10705511.2014.935265
Brunet, J., & Sabiston, C. M. (2009). Social physique anxietyand physical activity: A self-determination theory perspec-tive. Psychology of Sport and Exercise, 10, 329–335.doi:10.1016/j.psychsport.2008.11.002
Brunet, J., & Sabiston, C. M. (2011). In the company we keep:Social physique anxiety levels differ around parents andpeers. Journal of Health Psychology, 16, 42–49. doi:10.1177/1359105310367530
72 S. ULLRICH-FRENCH ET AL.

Carlson, T. B. (1995). We hate gym: Student alienation fromphysical education. Journal of Teaching in PhysicalEducation, 14, 467–477.
Carron, A., & Prapavessis, H. (1997). Self presentation andgroup influence. Sage Social Sciences Collections, 28, 500–516. doi:10.1177/1046496497284002
Clogg, C. C. (1995). Latent class models: Recent develop-ments and prospects for the future. In G. Arminger, C.C. Clogg, & M. E. Sobel (Eds.), Handbook of statisticalmodeling for the social and behavioral sciences (pp.311–359). New York, NY: Plenum Press.
Collins, L. M., & Lanza, S. T. (2010). Latent class and latenttransition analysis: With applications in the social, beha-vioral, and health sciences (Vol. 718). New York, NY: JohnWiley & Sons.
Cox, A. E., Smith, A. L., & Williams, L. (2008). Change inphysical education motivation and physical activity beha-vior during middle school. Journal of Adolescent Health,43, 506–513. doi:10.1016/j.jadohealth.2008.04.020
Cox, A. E., Ullrich-French, S., Madonia, J., & Witty, K.(2011). Social physique anxiety in physical education:Social contextual factors and links to motivation and beha-vior. Psychology of Sport and Exercise, 12, 555–562.doi:10.1016/j.psychsport.2011.05.001
Cox, A. E., Ullrich-French, S., & Sabiston, C. (2013). Usingmotivation regulations in a person-centered approach toexamine the link between social physique anxiety inphysical education and physical activity-related out-comes in adolescents. Psychology of Sport and Exercise,14, 461–467.
Crombie, P.-A., Brunet, J., & Sabiston, C. M. (2011). Stopstaring! Proposed strategies to reduce body image concernsin physical education. Journal of Physical Education,Recreation & Dance, 82, 39–43. doi:10.1080/07303084.2011.10598581
Gibson, W. A. (1959). Three multivariate models: Factoranalysis, latent structure analysis, and latent profile analy-sis. Psychometrika, 24, 229–252. doi:10.1007/BF02289845
Goudas, M., Biddle, S. J. H., & Fox, K. R. (1994). Perceivedlocus of causality, goal orientations, and perceived compe-tence in school physical education classes. British Journalof Educational Psychology, 64, 453–463. doi:10.1111/j.2044-8279.1994.tb01116.x
Hart, E. A., Leary, M. R., & Rejeski, W. J. (1989). Themeasurement of social physique anxiety. Journal of Sport& Exercise Psychology, 11, 94–104.
Hollembeak, J., & Amorose, A. J. (2005). Perceived coachingbehaviors and college athletes’ intrinsic motivation: A testof self-determination theory. Journal of Applied SportPsychology, 17, 20–36. doi:10.1080/10413200590907540
Kowalski, K. C., Mack, D. E., Crocker, P. R. E., Niefer, C. B.,& Fleming, T. (2006). Coping with social physique anxietyin adolescence. Journal of Adolescent Health, 39, 275.e9–275.e16. doi:10.1016/j.jadohealth.2005.12.015
Kruisselbrink, L. D., Dodge, A. M., Swanburg, S. L., &MacLeod, A. L. (2004). Influence of same-sex and mixed-sex exercise settings on the social physique anxiety andexercise intentions of males and females. Journal of Sportand Exercise Psychology, 26, 616–622.
Lo, Y., Mendell, N. R., & Rubin, D. B. (2001). Testing thenumber of components in a normal mixture. Biometrika,88, 767–778. doi:10.1093/biomet/88.3.767
Magidson, J., & Vermunt, J. K. (2002). Latent class models forclustering: A comparison with K-means. Canadian Journalof Marketing Research, 20, 37–44.
Marsh, H. W., Lüdtke, O., Trautwein, U., & Morin, A. J. S.(2009). Classical latent profile analysis of academic self-concept dimensions: Synergy of person- and variable-cen-tered approaches to theoretical models of self-concept.Structural Equation Modeling: A MultidisciplinaryJournal, 16(2), 191–225. doi:10.1080/10705510902751010
Martin, K. A., Rejeski, W. J., Leary, M. R., McAuley, E., &Bane, S. (1997). Is the social physique anxiety scale reallymultidimensional? Conceptual and statistical argumentsfor a unidimensional model. Journal of Sport & ExercisePsychology, 19, 359–367.
Mitchell, J. E., Crosby, R. D., Wonderlich, S. A., Hill, L., LeGrange, D., Powers, P., & Eddy, K. (2007). Latent profileanalysis of a cohort of patients with eating disorders nototherwise specified. International Journal of EatingDisorders, 40, S95–S98. doi:10.1002/eat.20459
Moustaki, I. (1996). A latent trait and a latent class model formixed observed variables. British Journal of Mathematicaland Statistical Psychology, 49, 313–334. doi:10.1111/bmsp.1996.49.issue-2
Muthen, B. O. (2001). Latent variable mixture modeling. InG. Marcoulides & R. Schumacker (Eds.), New develop-ments and techniques in structure equation modeling (pp.1–33). Mahwah, NJ: Lawrence Erlbaum Associates, Inc.
Ntoumanis, N. (2001). A self-determination approach to theunderstanding of motivation in physical education. BritishJournal of Educational Psychology, 71, 225–242.doi:10.1348/000709901158497
Richer, S. F., & Vallerand, R. J. (1998). Construction etvalidation de l’Echelle du sentiment d’appartenance sociale[Construction and validation of the relatedness feelingscale]. Revue Europeenne de Psychologie Appliquee, 48,129–137.
Ryan, R. M., & Deci, E. L. (2007). Active human nature: Self-determination theory and the promotion and maintenanceof sport, exercise, and health. In M. S. Hagger & N.Chatzisarantis (Eds.), Intrinsic motivation and self-determi-nation in exercise and sport (pp. 1–19). Champaign, IL:Human Kinetics.
Sabiston, C. M., Pila, E., Pinsonnault-Bilodeau, G., & Cox, A.E. (2014). Social physique anxiety experiences in physicalactivity: A comprehensive synthesis of research studiesfocused on measurement, theory, and predictors and out-comes. International Review of Sport and ExercisePsychology, 7, 158–183. doi:10.1080/1750984X.2014.904392
Sabiston, C. M., Sedgwick, W. A., Crocker, P. R. E., Kowalski,K. C., & Mack, D. E. (2007). Social physique anxiety inadolescence: An exploration of influences, coping strate-gies, and health behaviors. Journal of Adolescent Research,22, 78–101. doi:10.1177/0743558406294628
Scanlan, T. K., Carpenter, P. J., Schmidt, G. W., Simons, J. P., &Keeler, B. (1993). An introduction to the sport commitmentmodel. Journal of Sport & Exercise Psychology, 15, 1–15.
Smith, A. (2004). Measurement of social physique anxiety inearly adolescence. Medicine & Science in Sports & Exercise,36, 475–483. doi:10.1249/01.MSS.0000117111.76228.BF
Standage, M., Duda, J. L., & Ntoumanis, N. (2006).Students’ motivational processes and their relationshipto teacher ratings in school physical education: A self-
MEASUREMENT IN PHYSICAL EDUCATION AND EXERCISE SCIENCE 73
determination theory approach. Research Quarterly forExercise and Sport, 77, 100–110. doi:10.1080/02701367.2006.10599336
Teixeira, P. J., Carraça, E. V., Markland, D., Silva, M. N., &Ryan, R. M. (2012). Exercise, physical activity, and self-determination theory: A systematic review. TheInternational Journal of Behavioral Nutrition and PhysicalActivity, 9, 1–30. doi:10.1186/1479-5868-9-78
Ullrich-French, S., & Cox, A. E. (2009). Using cluster analysisto examine the combinations of motivation regulations ofphysical education students. Journal of Sport & ExercisePsychology, 31, 358–379.
Vermunt, J. K., & Magidson, J. (2002). Latent class clusteranalysis. In J. A. Hagenaars & A. L. McCutcheon (Eds.),Applied latent class analysis (pp. 89–106). Cambridge, UK:Cambridge University Press.
74 S. ULLRICH-FRENCH ET AL.

Copyright of Measurement in Physical Education & Exercise Science is the property ofTaylor & Francis Ltd and its content may not be copied or emailed to multiple sites or postedto a listserv without the copyright holder's express written permission. However, users mayprint, download, or email articles for individual use.