examining metabolic vulnerabilities for cancer therapy
TRANSCRIPT

1
Examining metabolic vulnerabilities for
cancer therapy
by
Alba Luengo
B.S. Biomedical Engineering Columbia University, 2012
Submitted to the Department of Biology in Partial Fulfillment of the Requirements for the Degree of
DOCTOR OF PHILOSOPHY
at the
MASSACHUSETTS INSTITUTE OF TECHNOLOGY
June 2018
© 2018 Alba Luengo. All rights reserved.
The author hereby grants to MIT permission to reproduce and to distribute publicly paper and electronic copies of this thesis document in whole or in part in
any medium now known or hereafter created.
Signature of the Author Department of Biology
May 25, 2018 Certified By Matthew G. Vander Heiden
Professor of Biology Thesis Supervisor
Accepted By Amy E. Keating
Professor of Biology Chair of the Graduate Committee


3
Examining metabolic vulnerabilities for
cancer therapy
by
Alba Luengo
Submitted to the Department of Biology in Partial Fulfillment of the Requirements for the Degree of
Doctor of Philosophy in Biology Abstract
Metabolic reprogramming is essential for cancer cells to balance energetics,
maintain redox homeostasis, and synthesize biosynthetic precursors. Many chemotherapeutics that target metabolism are essential components of standard cancer treatment regimens, arguing that there is a therapeutic window to target the metabolic dependencies of cancer cells. However, the use of these drugs as cancer therapies was determined empirically, and rational approaches to directly target the metabolism of cancer cells, especially reprogrammed glucose metabolism, have proved challenging, in part because it is not well understood which metabolic processes are most important for cancer cell proliferation and survival.
The goal of this dissertation is to explore metabolic pathways preferentially
used by cancer cells in order to identify potential tumor dependencies that could be exploited for clinical benefit. We first determined that production of reactive byproducts is an indirect consequence of the altered glucose metabolism of cancer cells, which suggests that clinically targeting secondary effects of reprogrammed tumor metabolism could be an approach for designing novel cancer treatments. Next, we found that a molecular driver for the altered glucose metabolism of cancer cells is limited electron acceptor availability, suggesting that interventions that further restrict the oxidative capacity of tumors could also have anticancer efficacy. Finally, we interrogated the metabolic fluxes of breast cancers proliferating in different microenvironments and determined that tumors in the brain parenchyma display enhanced lipid biosynthesis, which could guide therapeutic strategies to treat cancer based on tumor site. Collectively, these studies contribute to an understanding of how the reprogrammed metabolism of cancer cells introduces targetable dependencies, with the aim of optimizing cancer therapies. Thesis Supervisor: Matthew G. Vander Heiden Title: Associate Professor of Biology

5
Biographical Note
Alba Luengo
EDUCATION 2012-2018 Massachusetts Institute of Technology
Ph.D. Department of Biology 2008-2012 Columbia University
B.S. Biomedical Engineering, Cell and Tissue Engineering RESEARCH EXPERIENCE 2012-present Massachusetts Institute of Technology, Ph.D. Candidate
David H. Koch Institute for Integrative Cancer Research Laboratory of Dr. Matthew G. Vander Heiden Assess whether a toxic metabolite byproduct of glucose metabolism can serve as a targetable liability of tumors Examine the metabolic consequences of increasing glucose oxidation in cancer cells Investigate the metabolism of primary and metastatic breast cancer utilizing a novel method of delivering isotope-labeled substrates in vivo
2009-2012 Columbia University, Undergraduate Research Assistant Laboratory of Dr. Clark T. Hung Designed 3D chondrocyte scaffolds from cells of the annulus fibrosis region of the intervertebral disc to mimic mechanical and structural properties of native nucleus pulposus tissue
2011 Memorial Sloan Kettering Cancer Center, Undergraduate Research Assistant Laboratory of Dr. Neal Rosen Investigate negative feedback in the PI3K signaling pathway upon treatment of cancer cells with mTOR kinase inhibitors
2010 CNIC (National Cardiology Research Center), Undergraduate Research Assistant Laboratory of Dr. José Antonio Enríquez Examined the relationship between autophagy and mutations in mitochondrial DNA

6
HONORS AND AWARDS 2018 Keystone Symposia Future of Science Fund Scholarship 2017 Rising Stars in Biomedicine 2017 MIT IMPACT Program, Fellow 2016-2017 Ludwig Center for Graduate Research Fellowship 2013-2016 NSF Graduate Research Fellowship 2012 Robert E. and Claire S. Reiss Prize in Biomedical Engineering,
Columbia University 2012 Tau Beta Pi National Engineering Honor Society, New York
Alpha Chapter, Columbia University 2012 Magna Cum Laude, Columbia University 2008-2012 Dean’s List, Columbia University TEACHING EXPERIENCE 2016 Teaching Assistant, General Biochemistry (7.05),
Massachusetts Institute of Technology 2013 Teaching Assistant, Experimental Biology & Communication
(7.02), Massachusetts Institute of Technology 2012 Teaching Assistant, Introduction to Cellular and Molecular
Biology II (C2006), Columbia University 2011 Teaching Assistant, Introduction to Cellular and Molecular
Biology I (C2005), Columbia University 2011-2012 Private Tutor, Ivy League Tutors Network PRESENTATIONS 2018 Keystone Symposia, Tumor Metabolism, poster 2017 Rising Stars in Biomedicine, oral 2017 Koch Institute Fall Retreat, oral 2017 Judith Ann Lippard Memorial Lectureship in Cancer Research,
Flash Talk, oral 2017 Smith Family Scientific Meeting and Dinner, poster 2017 Keystone Symposia, Tumor Metabolism: Mechanisms and
Targets, poster 2017 Keystone Symposia, New Frontiers in Understanding Tumor
Metabolism, poster 2011 BMES Annual Meeting, poster

7
PUBLICATIONS 1. Sullivan LB, Luengo A, Danai LV, Bush LN, Diehl FF, Hosios AM, Lau AN,
Lewis CA, Vander Heiden MG. Evidence for aspartate as an endogenous metabolic limitation for tumour growth. Nat. Cell. Biol. Manuscript Accepted
2. Alkan HF, Walter KE, Luengo A, Madreiter-Sokolowski CT, Stryeck S, Al-Zhoughbi W, Lewis CA, Thomas CJ, Hoefler G, Graier WF, Madl T, Vander Heiden MG, Bogner-Strauss JG. Cytosolic aspartate availability determines cell survival when glutamine is limiting. Manuscript under review.
3. Luengo A*, Gui DY*, Vander Heiden MG. Targeting metabolism for cancer therapy. Cell Chem Biol. 2017 Sep 21;24(9):1161-1180.
4. Davidson SM*, Jonas O*, Keibler MA, Hou HW, Luengo A, Mayers JR, Wyckoff J, Del Rosario AM, Whitman M, Chin CR, Condon KJ, Lammers A, Kellersberger KA, Stall BK, Stephanopolous G, Bar-Sagi D, Han J, Rabinowitz JD, Cima MJ, Langer R, Vander Heiden MG. Direct evidence for cancer-cell-autonomous extracellular protein catabolism in pancreatic tumors. Nat Med. 2017 Feb; 23(2):235-241.
5. Gui DY*, Sullivan LB*, Luengo A, Hosios AM, Bush LN, Gitego N, Davidson SM, Freinkman E, Thomas, CJ, Vander Heiden, MG. Environment dictates dependence on mitocondrial complex I for NAD+ and aspartate production and determines cancer cell sensitivity to metformin. Cell Metab. 2016 Nov 8; 24(5):716-727.
6. Dayton TL, Gocheva V, Miller KM, Israelsen WJ, Bhutkar A, Clish CB, Davidson SM, Luengo A, Bronson RT, Jacks T, Vander Heiden MG. Germline loss of PKM2 promotes metabolic distress and hepatocellular carcinoma. Genes Dev. 2016 May 1; 30(9):1020-33.
7. Pacold ME, Brimacombe KR, Chan SH, Rohde JM, Lewis CA, Swier LJ, Possemato R, Chen WW, Sullivan LB, Fiske BP, Cho S, Freinkman E, Birsoy K, Abu-Remaileh M, Shaul YD, Liu CM, Zhou M, Koh MJ, Chung H, Davidson SM, Luengo A, Wang AQ, Xu X, Yasgar A, Liu L, Rai G, Westover KD, Vander Heiden MG, Shen M, Gray NS, Boxer MB, Sabatini DM. A PHGDH inhibitor reveals coordination of serine synthesis and one-carbon unit fate. Nat Chem Biol. 2016 Jun; 12(6):452-6.
8. Davidson SM, Papagiannakopoulos T, Olenchock BA, Heyman JE, Keibler MA, Luengo A, Bauer MR, Jha AK, O’Brien JP, Pierce KA, Gui DY, Wasylenko TM, Subarraj L, Chin CR, Stephanopolous G, Mott BT, Jacks TE, Clish CB, Vander Heiden MG. Oxidative glucose metabolism is essential for Ras-driven non-small cell lung cancer. Cell Metab. 2016 Mar 8; 23(3):517-28.
9. Luengo A, Sullivan LB, Vander Heiden MG. Understanding the complex-I-ty of metformin action: limiting mitochondrial respiration to improve cancer therapy. BMC Biol. 2014 Oct 24; 12:82.
10. Gunja NJ, Dujari D, Chen A, Luengo A, Fong JV, Hung CT. Migration responses of outer and inner meniscus cells to applied direct current electric fields. J Orthop Res. 2012 Jan;30(1):103-11.


9
Acknowledgements
This thesis would not have been possible without the many people that offered support, encouragement, and guidance over the course of my PhD. First, I would like to thank my advisor, Matthew Vander Heiden for his bottomless enthusiasm and constant support, insight, and patience. I am grateful for the opportunities he has given me to travel to conferences, give scientific talks and collaborate with external groups and clinicians. All of these experiences have enriched my graduate work and contributed to my scientific development. I feel lucky to have been a member of his lab. I am grateful Professors Tyler Jacks and Michael Hemann, who have provided helpful advice during and outside of thesis committee meetings over the years. I would also like to thank Joan Brugge for her willingness to serve as an external faculty member for my thesis defense. I like to acknowledge the fellow members of the Vander Heiden Lab for contributing to a collaborative and collegial atmosphere. In particular, I would like to thank Aaron Hosios, who has been an invaluable scientific resource and an even better friend. I am indebted to his support over the course of my PhD. I have very much enjoyed working with Zhaoqi Li and I am grateful to him for injecting some much-needed enthusiasm into the final year of my PhD. I have been fortunate to always be well accompanied in the “back bay,” with Peggy Hsu and Dan Gui, both of which have made great coffee partners, workout buddies, and provided me some company during late nights in lab. Additionally, I thank Dan Gui and Lucas Sullivan for advice, mentorship, and friendship. I am also grateful to Shawn Davidson for being the first person to train me in the lab and introducing me to in vivo metabolism. I have enjoyed many conversations and interactions, scientific and not so scientific, with all current and former members of the Vander Heiden lab. I thank Mark Sullivan, Furkan Alkan, Chris Chin, Alex Muir, Evan Lien, Allison Lau, Nick Matheson, Brian Fiske, Will Israelsen, Katie Mattiani, Jared Mayers, Ben Olenchock, Laura Danai, Daniel Schmidt, Franny Diehl, Brooke Bevis, Anna Nguyen, Emily Dennstedt, Sharanya Sivanand, and Alicia Darnell for their camaraderie. I have had the privilege of working with a number of excellent external collaborators. I would like to especially thank Gino Ferraro and Divya Bezwada for being wonderful colleagues and sharing fun times together at Keystone Conferences. I have enjoyed working with Caroline Lewis, and am especially glad she did not travel too far after leaving the Vander Heiden Lab. Isaac Harris has also been a source of support and helpful conversations.

10
I am grateful for the many friendships I’ve made during this time, and would like to especially acknowledge Sahin Naqvi, Lisa Cunden, Kristin Knouse, Lucas Manuelli, Daniel Miller, and Ian Campbell for being a source of fun, support and sometimes commiseration. I am grateful to my friends Spencer Almen, Javier Rivera, Leandra Gerena, and Courtney Giannini for being a source of unwavering support and a helpful reminder that there is a life outside of grad school. I would like to offer special thanks to Lukas Murmann, I am grateful to have you in my life. Above all, I would like to thank my family – this thesis is dedicated to them. Thank you for your unconditional love, support, and always believing in me. I couldn’t have done it without you. Os quiero muchísimo.

11
Table of Contents
Abstract .......................................................................................................................... 3 Biographical Note ....................................................................................................... 5 Acknowledgements ..................................................................................................... 9 Table of Contents ....................................................................................................... 11 Chapter 1: Targeting metabolism for cancer therapy ...................................... 15
Summary ....................................................................................................................... 15 Introduction ................................................................................................................... 15 Altered glucose metabolism ........................................................................................... 21 Altered Metabolic Enzyme Expression ......................................................................... 24
Oncogenic isocitrate dehydrogenase mutations .................................................. 25 Upregulated glutaminolysis ................................................................................. 30 Increased dependence on serine ........................................................................... 33 FH and SDH loss in heritable cancer syndromes ................................................ 36 Loss of argininosuccinate synthase 1 expression ................................................ 40 Metabolic collateral lethality ................................................................................ 41
Emerging Metabolic Targets ......................................................................................... 45 Targeting de novo lipid synthesis ......................................................................... 45 Differential requirements for NAD+/NADH homeostasis .................................. 48 Targeting nucleotide acquisition and synthesis .................................................. 51 Increased requirement for detoxification of reactive metabolites ...................... 53
Lineage and Environment Specific Vulnerabilities: .................................................... 55 Differential utilization of amino acids ................................................................. 56 Asparagine auxotrophy in acute lymphoblastic leukemia .................................. 57 Inducing differentiation in myeloid cells ............................................................. 57 Non-tumor cells can influence tumor cell metabolism ........................................ 59 Metabolic dependencies can be modulated by environment ............................... 60
What Dictates Metabolic Dependencies? ...................................................................... 61 References ...................................................................................................................... 63
Chapter 2: Methylglyoxal production is a targetable liability of glycolytic metabolism in lung cancer ...................................................................................... 91
Abstract .......................................................................................................................... 92 Introduction ................................................................................................................... 92 Results ............................................................................................................................ 94
Untargeted metabolomics reveals increased antioxidant capacity in lung cancers ................................................................................................................... 94 Evidence for increased methylglyoxal production in lung tumors ..................... 98 Methylglyoxal is a byproduct of glycolysis ......................................................... 100 Glyoxalase 1 is required for methylglyoxal detoxification and to prevent accumulation of protein adducts ........................................................................ 102 Deletion of glyoxalase 1 impairs tumor proliferation ........................................ 106 Methylglyoxal accumulation induces formation of DNA-protein crosslinks .... 106

12
Exogenous methylglyoxal treatment and glyoxalase 1 ablation sensitizes cells to proteasome inhibition ......................................................................................... 111
Discussion .................................................................................................................... 113 Materials and Methods ............................................................................................... 115 References .................................................................................................................... 125
Chapter 3: Mitochondrial membrane hyperpolarization limits NAD+ regeneration in cancer cells ................................................................................. 131
Abstract ........................................................................................................................ 132 Introduction ................................................................................................................. 133 Results .......................................................................................................................... 137
The PDK inhibitor AZD7545 activates PDH and increases glucose oxidation 137 Pyruvate, but not lactate, can restore proliferation to PDK inhibited cells .... 140 Alternative pathways for NAD+ regeneration can render cells refractory to PDK inhibition .............................................................................................................. 145 Increasing aspartate availability can rescue the proliferation defect caused by PDK inhibition ..................................................................................................... 147 FCCP treatment can relieve mitochondrial membrane hyperpolarization and the NAD+/NADH imbalance caused by PDK inhibition ................................... 149 ATP hydrolysis can suppress the proliferation defect caused by AZD7545 ..... 154 PDH activation increases dependency on complex I for NAD+ regeneration and sensitizes cells to metformin treatment in vitro and in vivo ............................ 155
Discussion .................................................................................................................... 158 Materials and Methods ............................................................................................... 161 References .................................................................................................................... 167
Chapter 4: Targeting lipid biosynthesis to treat breast cancer brain metastases ................................................................................................................. 175
Abstract ........................................................................................................................ 176 Introduction ................................................................................................................. 177 Results .......................................................................................................................... 181
Analysis of glucose metabolism in primary and brain metastatic HER2-amplified breast cancer ....................................................................................... 181 HER2-amplified breast cancers display increased lipid metabolism in the brain parenchyma ......................................................................................................... 187 Organotypic slice cultures, but not standard tissue culture conditions, recapitulate in vivo metabolic phenotypes related to lipid synthesis .............. 192 Medium conditioned by primary glial cultures confers a proliferative advantage to breast cancer cells and induces resistance to PI3K inhibition ..................... 196 Efforts to target lipid biosynthesis in BCBM using pharmacological agents .. 198
Discussion .................................................................................................................... 203 Materials and Methods ............................................................................................... 208 References .................................................................................................................... 215
Chapter 5: Discussion and Future Directions .................................................. 225 Summary ..................................................................................................................... 225 Discussion .................................................................................................................... 228
Reactive byproducts of cancer metabolism ........................................................ 228

13
Metabolic Drivers of the Warburg effect ............................................................ 231 Models to study cancer metabolism ................................................................... 237
Conclusion ................................................................................................................... 241 Materials and Methods ............................................................................................... 243 References .................................................................................................................... 245
Appendix A: Understanding the complex-I-ty of metformin action: limiting mitochondrial respiration to improve cancer therapy .................................. 255 Appendix B: Evidence for electron acceptor limitation in vivo ................... 265

15
Chapter 1: Targeting metabolism for cancer
therapy
A version of this chapter has been published previously: Luengo, A., Gui, D.Y., and Vander Heiden, M.G. (2017). Targeting Metabolism for Cancer Therapy. Cell Chem Biol 24, 1161-1180.
Summary
Metabolic reprogramming contributes to tumor development and introduces
metabolic liabilities that can be exploited to treat cancer. Chemotherapies targeting
metabolism have been effective cancer treatments for decades, and the success of
these therapies demonstrates that a therapeutic window exists to target malignant
metabolism. New insights into the differential metabolic dependencies of tumors
have provided novel therapeutic strategies to exploit altered metabolism, some of
which are being evaluated in pre-clinical models or clinical trials. In this chapter,
we review our current understanding of cancer metabolism and discuss how this
might guide treatments targeting the metabolic requirements of tumor cells.
Introduction
In 1947, Sidney Farber, one of the pioneers of modern chemotherapy,
discovered that aminopterin could cause disease remission in children with acute
lymphoblastic leukemia (Farber and Diamond, 1948). Aminopterin is the precursor
of the currently used drugs methotrexate and pemetrexed, both of which are folate

16
Pemetrexed
BA
PRPPamidotransferase
6-MP6-TG
FolateCycle
FolateCycle
CHO-THF
GMP
XMPAMP
IMP
PRPP
5-phosphoribosylamine
R5P
BrequinarLeflunomide DHODH
CTP
AminopterinMethotrexatePemetrexed
DHFR
Capecitabine
TS
5-FU
THF
THF
CH2THFDHF
dTMP dUMP
dUDP
UTPUDP
CarbamoylPhosphate
DHO
Orotate
OMP
UMP

17
Figure 1. Nucleotide Biosynthesis (A) Purine nucleotide synthesis. The first reaction in purine production generates 5-phosphoribosyl-1-pyrophosphatae (PRPP) from ribose 5-phosphate (R5P). The second step is catalyzed by PRPP amidotransferase, and commits PRPP to purine synthesis. This step can be inhibited by the antimetabolites, 6-mercaptopurine (6-MP) and 6-thioguanine (6-TG). Subsequent steps in the pathway assemble the purine ring and result in the formation of inosine monophosphate (IMP), which in turn can be converted to either adenosine monophosphate (AMP) or guanosine monophosphate (GMP) by distinct reactions. The synthesis of the purine ring requires N10-formyl-tetrahydrofolate (CHO-THF) via a reaction that can be inhibited by pemetrexed. (B) Pyrimidine nucleotide synthesis. Pyrimidine nucleotide synthesis begins with the conversion of carbamoyl phosphate to the pyrimidine base orotate. One of the steps in pathway is catalyzed by dihydroorotate dehydrogenase (DHODH), which can be inhibited by brequinar sodium and leflunomide. Next, orotate is combined with PRPP to generate orotate monophosphate (OMP), which is subsequently converted to uridine monophosphate (UMP). UMP can be phosphorylated to form UDP and UTP, and the latter can be further converted to cytidine triphosphate (CTP). Uridine nucleotides can also be used for de novo thymine nucleotide synthesis. UDP is converted to deoxy-UMP (dUMP), and the enzyme thymidylate synthase (TS) generates dTMP by catalyzing the methylation of dUMP using N5,N10-methylene-tetrahydrofolate (CH2-THF) as the methyl donor. TS activity is inhibited by the antipyrimidine 5-fluorouracil (5-FU) and the 5-FU pro-drug capecitabine. Thymidine synthesis can also be inhibited by the antifolates aminopterin, methotrexate, and pemetrexed, as these drugs inhibit the enzyme dihydrofolate reductase (DHFR), limiting the availability of CH2-THF
18
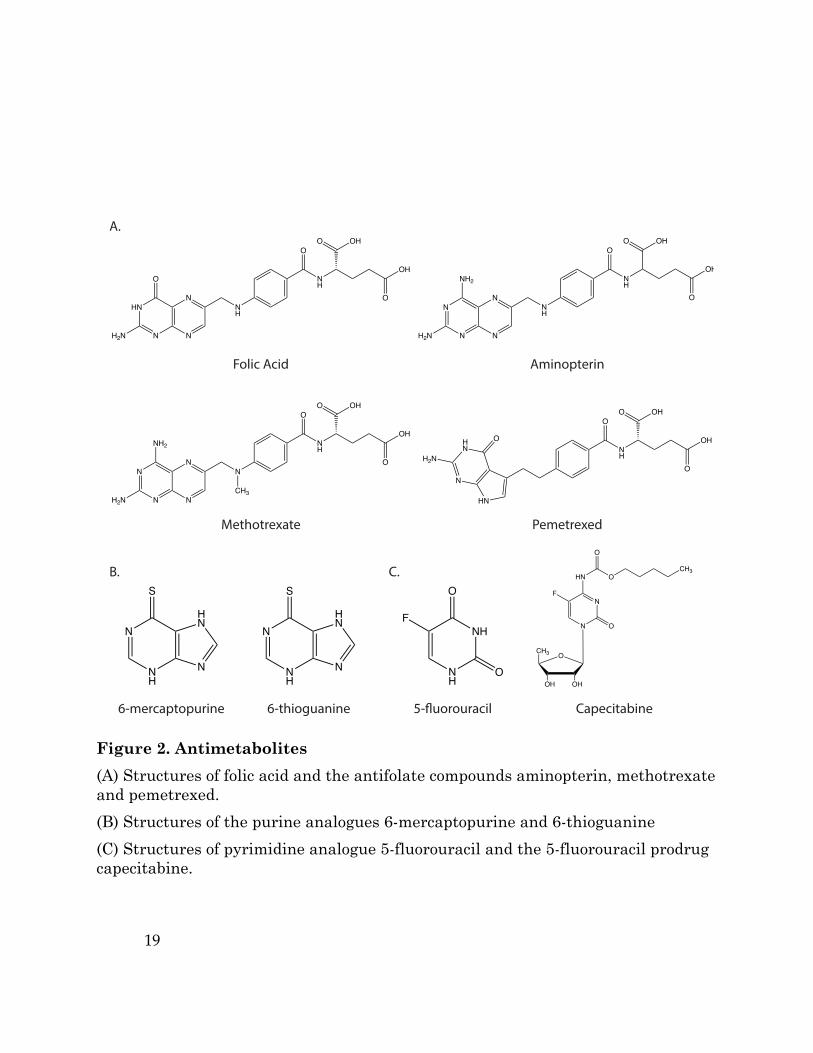
analogues that inhibit one-carbon transfer reactions required for de novo nucleotide
synthesis (Figure 1, Figure 2A) (Walling, 2006). The early clinical success of
antifolates led to the development of an entire class of drugs known as
‘antimetabolites.’ Antimetabolites are small molecules that resemble nucleotide
metabolites and inhibit the activity of enzymes involved in nucleotide base
synthesis (Table 1). Notable examples include the purine analogues 6-
mercaptopurine (6-MP) and 6-thioguanine (6-TG), which inhibit 5-phosphoribosyl-1-
pyrophosphatase (PRPP) amidotransferase, the first enzyme in de novo purine
biosynthesis (Figure 1A, Figure 2B). 6-MP and 6-TG have been successful in
treating many cancers, including childhood leukemia (Elion, 1989). The pyrimidine
analogue 5-fluorouracil (5-FU) is a synthetic analogue of uracil that inhibits
thymidylate synthase, limiting the availability of thymidine nucleotides for DNA
synthesis (Figure 1B, Figure 2C). 5-FU and the related 5-FU-prodrug
capecitabine remain widely used chemotherapies today and are an important
treatment for gastrointestinal cancers (Heidelberger et al., 1957; Wagner et al.,
2006). Other antimetabolite nucleoside analogues, such as gemcitabine and
cytarabine, are incorporated into DNA, resulting in inhibition of DNA polymerases,
and are commonly used to treat select cancers (Parker, 2009).
The clinical success of antimetabolites for treating cancer is attributed to the
increased metabolic demand of neoplastic cells for nucleotide biosynthesis and DNA
replication. However, nucleotide metabolism is only one of many metabolic
dependencies altered to support cancer cell proliferation. Proliferating cells have
19
Figure 2. Antimetabolites (A) Structures of folic acid and the antifolate compounds aminopterin, methotrexate and pemetrexed. (B) Structures of the purine analogues 6-mercaptopurine and 6-thioguanine (C) Structures of pyrimidine analogue 5-fluorouracil and the 5-fluorouracil prodrug capecitabine.
A.
AminopterinFolic Acid
Methotrexate Pemetrexed
N
NH
N
HN
S
N
NH
N
HN
S
O
OHOH
CH3
N
N
O
F
HN
O
OCH3
NH
NH
O
O
F
6-mercaptopurine 6-thioguanine Capecitabine5-fluorouracil
B. C.
HN
N N
NNH
NH
H2N
O
OOHO
OH
ON
N N
NNH
NH
OOHO
NH2
H2N
OH
O
N
N N
NN
NH
NH2
H2NCH3
OO OH
OH
ONH
OOH
OH
O
O
HN
HN
N
O
H2N

20
different metabolic requirements from non-proliferating cells (Hsu and Sabatini,
2008; Lunt and Vander Heiden, 2011; Pavlova and Thompson, 2016). While non-
proliferating cells have primarily catabolic demands, proliferating cells must
balance the divergent catabolic and anabolic requirements of sustaining cellular
homeostasis while duplicating cell mass, and thus engage in a metabolic program
distinct from that of the normal tissue from which they arise. From a therapeutic
perspective, the aberrant metabolism of proliferating cancer cells presents potential
opportunities, and there has been a growing interest in studying how best to target
cancer metabolism (Bobrovnikova-Marjon and Hurov, 2014; Galluzzi et al., 2013;
Martinez-Outschoorn et al., 2017; Vander Heiden, 2011).
Targeting general proliferative metabolism may not offer an adequate
therapeutic window since many non-malignant cells, including those in bone
marrow, intestinal crypts, and hair follicles, are rapidly proliferating. Furthermore,
the proliferation rates of normal cells are often greater than those of cancer cells
(Vander Heiden and DeBerardinis, 2017), and prominent side effects of
antimetabolite chemotherapy are caused by the destruction of non-cancerous
rapidly proliferating cells. Myeloid suppression or gastrointestinal toxicity are often
dose-limiting toxicities for these drugs.
In spite of toxicity, antimetabolites are standard in many modern
chemotherapy regimens that increase patient survival and, in some cases, help cure
disease. Factors other than proliferation rate may account for the efficacy of these
drugs. Inducing DNA damage with the use of genotoxic chemotherapies can
21
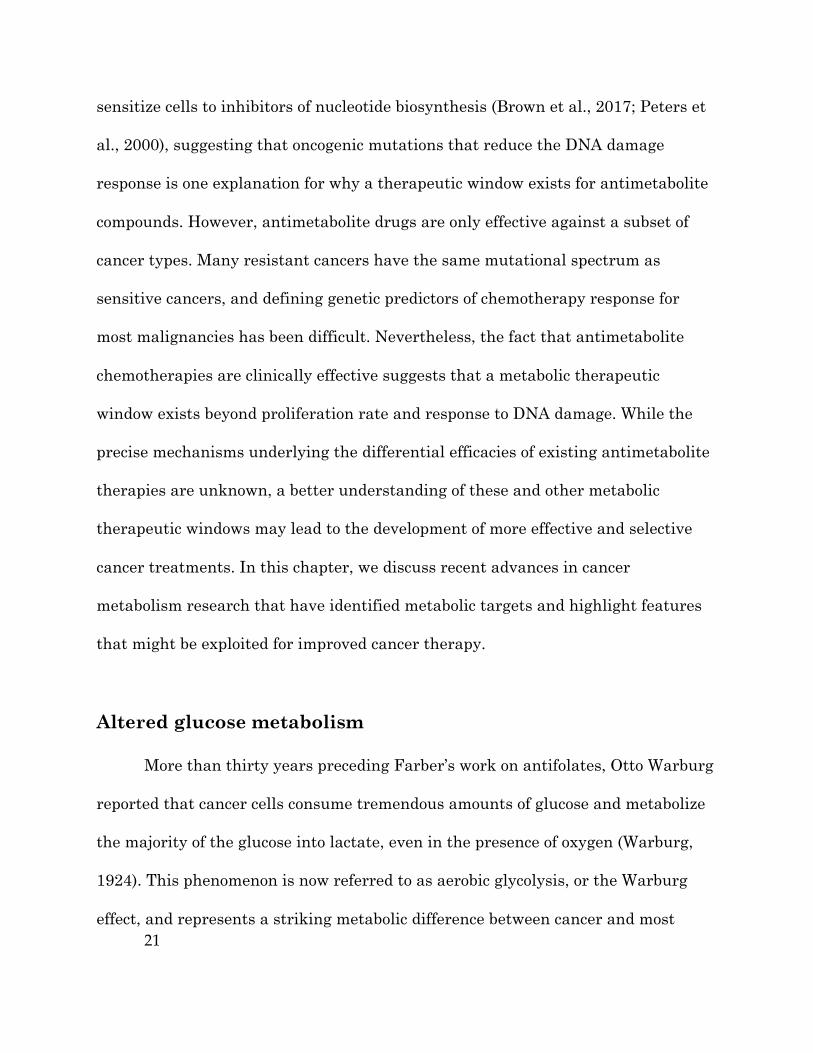
sensitize cells to inhibitors of nucleotide biosynthesis (Brown et al., 2017; Peters et
al., 2000), suggesting that oncogenic mutations that reduce the DNA damage
response is one explanation for why a therapeutic window exists for antimetabolite
compounds. However, antimetabolite drugs are only effective against a subset of
cancer types. Many resistant cancers have the same mutational spectrum as
sensitive cancers, and defining genetic predictors of chemotherapy response for
most malignancies has been difficult. Nevertheless, the fact that antimetabolite
chemotherapies are clinically effective suggests that a metabolic therapeutic
window exists beyond proliferation rate and response to DNA damage. While the
precise mechanisms underlying the differential efficacies of existing antimetabolite
therapies are unknown, a better understanding of these and other metabolic
therapeutic windows may lead to the development of more effective and selective
cancer treatments. In this chapter, we discuss recent advances in cancer
metabolism research that have identified metabolic targets and highlight features
that might be exploited for improved cancer therapy.
Altered glucose metabolism
More than thirty years preceding Farber’s work on antifolates, Otto Warburg
reported that cancer cells consume tremendous amounts of glucose and metabolize
the majority of the glucose into lactate, even in the presence of oxygen (Warburg,
1924). This phenomenon is now referred to as aerobic glycolysis, or the Warburg
effect, and represents a striking metabolic difference between cancer and most

22
normal tissues. Substantial work has sought to clinically target increased glycolysis
including efforts to inhibit lactate production and excretion (Doherty and Cleveland,
2013; Hamanaka and Chandel, 2012; Hay, 2016; Pelicano et al., 2006; Zhao et al.,
2013). One compound known to block glucose metabolism is 2-deoxyglucose (2-DG)
(Wick et al., 1957). 2-DG is phosphorylated by hexokinase to produce 2-
deoxyglucose-6-phosphate, which cannot be further metabolized by cells. It
therefore accumulates intracellularly and competitively inhibits hexokinase to slow
glucose uptake (Figure 3). Numerous preclinical studies have demonstrated anti-
proliferative effects of 2-DG (Zhang et al., 2014a). Although early clinical testing
yielded responses in some patients, the use of this drug was limited by toxicity
associated with hypoglycemia symptoms (Landau et al., 1958). Recent clinical trials
have revisited use of 2-DG at lower doses, but these doses are insufficient to inhibit
disease progression (Raez et al., 2013; Stein et al., 2010). The relative lack of 2-DG
clinical efficacy at tolerable doses has been echoed by most other attempts to
directly target aerobic glycolysis. Though efforts to target glucose uptake or lactate
production have found some success in preclinical models (Fantin et al., 2006; Hay,
2016; Shim et al., 1997; Xie et al., 2014), clinical success has been limited (Vander
Heiden and DeBerardinis, 2017).
Regulation of pyruvate kinase activity can influence aerobic glycolysis
(Dayton et al., 2016). Paradoxically, decreased pyruvate kinase activity is associated
with increased aerobic glycolysis, suggesting the activation of pyruvate kinase

23
Figure 3. Glycolysis Glucose is imported in cells by one of several glucose transporters (GLUT). Glucose is phosphorylated by hexokinase (HK), a step that can be competitively inhibited by the compound 2-deoxyglucose (2-DG). In a later step of glycolysis, glucose carbon is cleaved into two interconvertible three-carbon units, dihydroxyacetone phosphate (DHAP) and glyceraldehyde 3-phosphate (GAP). Downstream of GAP, 3-phosphoglycerate (3-PG) is converted to 2-phosphoglycerate (2-PG), and the enzyme enolase (ENO) generates phosphoenolpyruvate (PEP) from 2-PG. ENO activity can be inhibited by the compounds phosphonoacetohydroxamate (PHAH) and SF-2312. PEP is converted to pyruvate by pyruvate kinase (PKM), which can be activated by the drugs TEPP-46 and AG-348. Pyruvate can be oxidized in the TCA cycle, or it can produce lactate via lactate dehydrogenase (LDH), with lactate excreted by monocarboxylate transporters (MCT). MCT isoform 1 can be inhibited by the compound AZD3965.
Glucose
Glucose Glucose-6-phosphateHK
2-DG
DHAPGAP
2PG
PEPPyruvate
LactateLactate
Citrate
OAA
Serine Biosynthesis
Serine
ENO PHAHSF2312
GLUT
MCT
TCACycle
LDH
3PG
PKM
TEPP-46ML265

24
activity might be a way to target cancer (Christofk et al., 2008). Indeed, activation
of pyruvate kinase can inhibit cancer cell proliferation and tumor growth in some
settings (Anastasiou et al., 2012; Kung et al., 2012; Walsh et al., 2010), but because
pyruvate kinase expression is dispensable for the growth of some tumors (Cortes-
Cros et al., 2013; Israelsen et al., 2013; Lau et al., 2017), whether pyruvate kinase
activation will lead to durable responses remains an area of active study (Israelsen
et al., 2013; Israelsen and Vander Heiden, 2015).
Despite challenges associated with targeting glucose metabolism directly,
glucose uptake by cancer cells has been successfully exploited in patients through
the use of the fluoro-deoxy-glucose positron-emission-tomography (FDG-PET)
imaging to stage cancers and assess response to therapy (d'Amico, 2015; Farwell et
al., 2014; Zhu et al., 2011). Notably, many non-cancerous tissues, including the
brain, are FDG-PET avid (Berti et al., 2014; Cohade, 2010), illustrating that high
glucose uptake is not a unique feature of tumors and offering a potential
explanation for the relative lack of success in directly targeting glucose metabolism
for cancer treatment. Doses of 2-DG that inhibit glycolysis enough to limit cancer
growth may not be tolerated due to similar effects in normal tissues that also rely
on glucose metabolism.
Altered Metabolic Enzyme Expression
The expression of metabolic genes is frequently altered in cancer. Some
changes in metabolic enzyme expression result from gene amplification or deletion,

25
while others are downstream of growth signaling pathways or are consequences of
epigenetic changes. The activity of metabolic enzymes can also be affected by
mutations in the genes encoding these enzymes. Regardless of the underlying
mechanism, alterations in basal enzymatic activity of a given reaction present
potential vulnerabilities that might be targeted for cancer therapy.
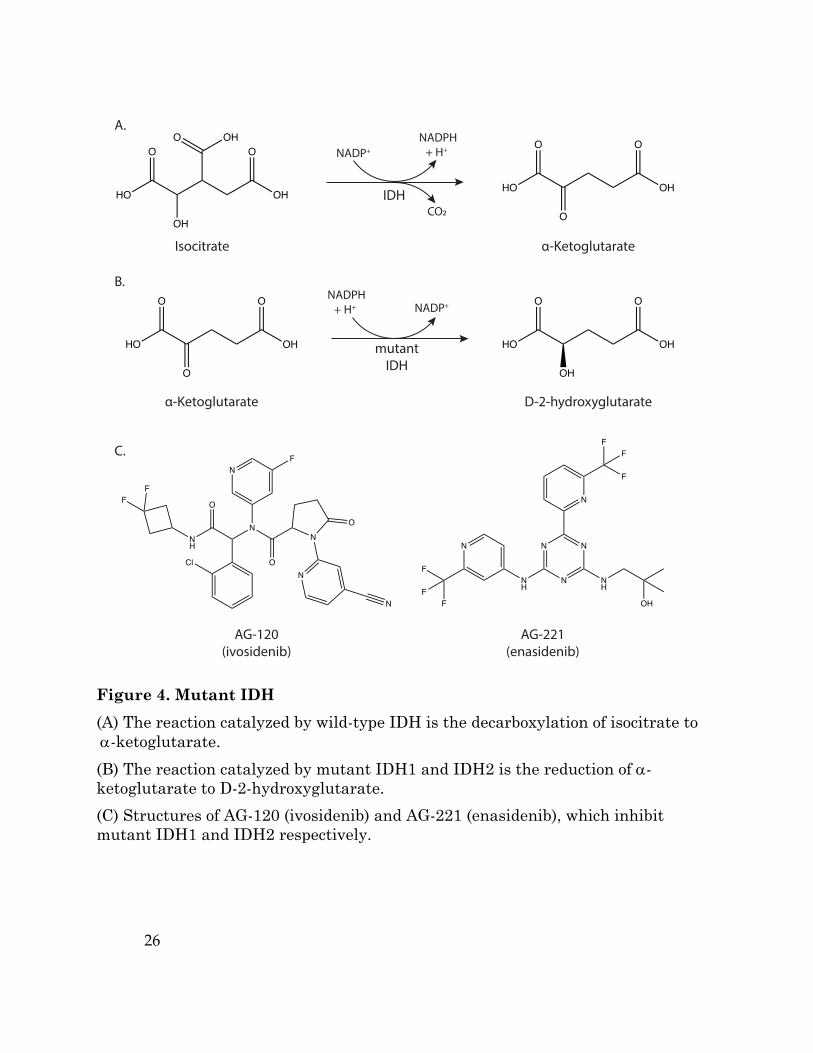
Oncogenic isocitrate dehydrogenase mutations
Recurrent somatic point mutations in the genes coding for isocitrate
dehydrogenase 1 and 2 (IDH1, IDH2) are found in a wide variety of cancers,
including glioblastoma multiforme (GBM) (Yan et al., 2009) and acute myeloid
leukemia (AML) (Dang et al., 2016; Mardis et al., 2009). Cancers expressing mutant
IDH represent a unique case in which a metabolic enzyme can act as an oncogene
and contribute to tumor development. Wild-type IDH1 and IDH2 catalyze the
reversible oxidative decarboxylation of isocitrate to alpha-ketoglutarate (aKG) and
CO2 (Figure 4A). Cancer associated mutations in IDH1 and IDH2 eliminate this
function and confer a neomorphic activity to the enzyme, generating D-2-
hydroxyglutarate (D-2HG) via the reduction of aKG (Figure 4B) (Dang et al., 2009;
Ward et al., 2010). Though it is found at low levels in normal cells, D-2HG can
accumulate to millimolar levels in cancer cells expressing mutant IDH. At these
high concentrations, D-2HG can inhibit aKG-dependent dioxygenases, including
enzymes involved in histone and DNA demethylation (Chowdhury et al., 2011;
Janke et al., 2017; Koivunen et al., 2012; Xu et al., 2011). As a result, D-2HG
26
Figure 4. Mutant IDH (A) The reaction catalyzed by wild-type IDH is the decarboxylation of isocitrate to a-ketoglutarate. (B) The reaction catalyzed by mutant IDH1 and IDH2 is the reduction of a-ketoglutarate to D-2-hydroxyglutarate. (C) Structures of AG-120 (ivosidenib) and AG-221 (enasidenib), which inhibit mutant IDH1 and IDH2 respectively.
Isocitrate
HO
O
OH
O
OH
O OH
HO OH
O O
O
α-Ketoglutarate
IDH
NADP+
NADPH+ H+
CO2
HO OH
O O
O
α-Ketoglutarate
mutantIDH
NADP+ NADPH
+ H+
D-2-hydroxyglutarate
HO OH
O O
OH
Cl
N
O
NH
N
N
N
FF
F
O
O
N
AG-221(enasidenib)
N
N
N
N
F
FF
NH
OH
NH
N
F
FF
AG-120(ivosidenib)
A.
B.
C.

27
accumulation in cancer cells expressing mutant IDH results in hypermethylation of
histones and CpG islands in DNA (Figueroa et al., 2010; Lu et al., 2012; Turcan et
al., 2012). These epigenetic changes caused by D-2HG contribute to cancer
phenotypes (Losman et al., 2013; Rohle et al., 2013; Saha et al., 2014; Wang et al.,
2013), and have been proposed to promote oncogenesis by preventing normal
cellular differentiation (Losman and Kaelin, 2013).
Pharmacological agents that inhibit mutant IDH1 and IDH2 enzyme activity
are being developed and assessed for antitumor efficacy (Figure 4C) (Dang et al.,
2016). One of the first compounds reported was AGI-5198, which targets mutant
IDH1. AGI-5198 reduces intratumoral D-2HG levels, induces expression of genes
involved in glial cell differentiation, and suppresses growth of IDH1-mutant human
glioma cells in a xenograft model (Rohle et al., 2013). A specific inhibitor of mutant
IDH2, AG-221 (enasidenib) confers survival benefit in a mouse model of IDH2-
mutant AML (Quivoron et al., 2014; Yen et al., 2017) and became the first
compound targeting mutant IDH to enter clinical trials in 2014. Early results in
IDH2-mutant AML patients have suggested enasidenib can provide clinical benefit
(DiNardo et al., 2015; Stein et al., 2014), and this drug is also being evaluated in
solid tumors. Mutant IDH1 inhibitors including AG-120 (ivosidenib) and IDH305,
as well as the pan-mutant IDH inhibitor AG-881 (Table 1), are also in clinical trials
to treat both hematologic malignancies and solid tumors, and will further inform
whether targeting mutant IDH can control disease where IDH mutations are
prevalent.

28
Despite success in some preclinical models and patients with AML, mutant
IDH inhibitors may not be effective in all IDH-mutant cancers. For example, these
drugs are unable to reverse epigenetic changes or inhibit tumor proliferation in
many models of IDH-mutant glioma, despite a robust ability to lower 2-HG in cells
and tumors (Tateishi et al., 2015; Turcan et al., 2013). IDH1 mutations are early
events in the development of glial cancer (Watanabe et al., 2009), raising the
possibility that IDH mutations are important for tumor initiation, but accumulation
of additional oncogenic mutations renders GBM tumors less dependent on
constitutive expression of mutant IDH for tumor proliferation and progression
(Johnson et al., 2014; Wakimoto et al., 2014). Nevertheless, the presence of a
mutation in IDH1 or IDH2 and high levels of 2-HG might still drive dependencies
on some pathways and introduce therapeutic vulnerability. For example, tumors
harboring an IDH mutation have increased sensitivity to hypomethylating agents
(Turcan et al., 2013), electron transport chain inhibitors (Grassian et al., 2014),
depletion of the coenzyme NAD+ (Tateishi et al., 2015) and chemoradiotherapy
(Cairncross et al., 2014). However, some evidence suggests that inhibiting mutant
IDH could confer resistance to some therapies, as inhibitors targeting mutant IDH1
can antagonize the effects of radiation therapy in glioma (Molenaar et al., 2015).
Thus, testing whether combination therapies are synergistic or antagonistic with
inhibition of mutant enzyme function is needed to guide treatment.

29
Drug Target Enzyme
Methotrexate dihydrofolate reductase (DHFR)
Pemetrexed DHFR thymidylate synthase (TS) glycinamide ribonucleotide formyltransferase (GARFT)
6-Mercaptopurine 6-Thioguanine
PRPP amidotransferase
Capecitabine 5-Fluorouracil
thymidylate synthase (TS)
Gemcitabine Cytarabine
DNA polymerase/ribonucleotide reductase(RnR)
Leflunomide dihydroorotate dehydrogenase (DHODH)
CB-839 glutaminase (GLS)
PEG-BCT-100 (ADI-PEG20) AEB-1102
depletion of circulating arginine
L-Asparaginase depletion of circulating asparagine
TVB-2640 fatty-acid synthase (FASN)
AG-120 (Ivosidenib) IDH305 BAY1436032 FT-2102 AG-221 (Enasidenib) AG-881
mutant IDH1 mutant IDH2 mutant IDH1/2
AZD3965 monocarboxylate transporter 1 (MCT1)
CPI-613 pyruvate dehydrogenase (PDH) !-ketoglutarate dehydrogenase
Metformin mitochondrial complex I
Table 1. Select agents targeting metabolism that are approved, or are in trials, for the treatment of cancer, focusing on targets discussed in this dissertation chapter.
30
Upregulated glutaminolysis
Glutamine is a non-essential amino acid, and yet cancer cells proliferating in
vitro consume glutamine far in excess of any other amino acid and are often
dependent on extracellular glutamine for survival (DeBerardinis and Cheng, 2010;
Eagle, 1955; Jain et al., 2012). Glutamine is an important nitrogen donor for amino
acids and nucleotides (Hosios et al., 2016), but glutamine uptake can exceed the
nitrogen requirement of some cancer cells (DeBerardinis et al., 2007). Glutamine
carbon has been found to contribute to aspartate, glutamate and tricarboxylic acid
(TCA) cycle metabolites via glutaminolysis (Figure 5) (Altman et al., 2016). High
rates of glutaminolysis has been proposed to support rapid proliferation by
supplying precursors to low-flux biosynthetic pathways (Newsholme et al., 1985).
Providing cells with aKG, oxaloacetate, or pyruvate is sufficient to rescue cancer
cell proliferation in conditions of glutamine starvation, confirming that glutamine
supports proliferation by replenishing depleted TCA cycle intermediates, a process
termed anaplerosis (Altman et al., 2016; Weinberg et al., 2010; Yuneva et al., 2007).
Glutamine metabolism is upregulated by various oncogenic signaling
pathways (Altman et al., 2016). In certain contexts, MYC-transformed cancers
become glutamine dependent and undergo apoptosis in the absence of glutamine
(Yuneva et al., 2007). MYC has been found to increase mRNA and protein levels of
glutamine transporters as well as expression of the enzyme glutaminase, which
catalyzes the first step in glutaminolysis (Gao et al., 2009; Wise et al., 2008; Yuneva
et al., 2012). Importantly, inhibiting glutamine entry into the TCA cycle can blunt
31
tumor progression in a MYC-driven model of liver cancer (Xiang et al., 2015;
Yuneva et al., 2012) and a MYC-inducible Burkitt lymphoma model (Le et al., 2012;
Xiang et al., 2015).
The dependence of cancer cells on glutamine has made glutaminolysis an
attractive cancer therapy target (Altman et al., 2016; Daye and Wellen, 2012;
DeBerardinis and Cheng, 2010; Vander Heiden, 2011). Clinical trials using
glutamine analogues to treat cancers were initiated decades ago, but these trials
were abandoned due to lack of efficacy and/or severe patient toxicity (Livingston et
al., 1970; O'Dwyer et al., 1984). The absence of a therapeutic window for these
studies can likely be attributed to fact that these drugs were relatively non-specific
and a panoply of glutamine utilizing enzymes were likely affected.
Current attempts to target glutaminolysis clinically have largely focused on
inhibiting glutaminase. Mammals have two glutaminase genes, GLS and GLS2,
and targeting the enzymes encoded by these genes with chemical inhibitors has
been found to decrease cancer cell proliferation in both in vitro and in vivo models
(Gross et al., 2014; Jacque et al., 2015; Le et al., 2012; Xiang et al., 2015; Yuneva et
al., 2012). One potent glutaminase inhibitor, CB-839, is currently being evaluated
in cancer trials in patients (Table 1), although the exact disease context where
glutaminase inhibition will be most effective remains an area of active
investigation. There is also data that GLS2 activity can be tumor suppressive (Hu
et al., 2010), underscoring the importance of defining the patient population likely
to benefit from glutaminase inhibition.

32
Figure 5. TCA Cycle Pyruvate produced by glycolysis can be metabolized by the TCA cycle. Pyruvate is oxidized via pyruvate dehydrogenase (PDH) to the two-carbon unit acetyl-CoA, and subsequently combined with the four-carbon oxaloacetate to generate citrate. The cycle regenerates oxaloacetate while generating precursors that are important for biosynthetic processes including heme and fatty acid synthesis. When molecules are removed from the TCA cycle to feed these pathways, TCA intermediates must be replenished in a process termed anaplerosis. Pyruvate can serve as an anaplerotic substrate when converted to oxaloacetate by the enzyme pyruvate carboxylase (PC). Glutaminolysis, the conversion of glutamine to glutamate via glutaminase (GLS), can also support anaplerosis via production of �-ketoglutarate. PDH activity is inhibited by the lipoic acid derivative CPI-613 and GLS activity is inhibited by CB-839.
Oxaloacetate
Fumarate
Citrate
Isocitrate
Succinateα-Ketoglutarate
PyruvateGlucose Lactate
Malate
Acetyl-CoA
LDH
FH
SDH
TCA Cycle
Glutamate
Glutamine
GLS
PDH
PC
IDH
Glutaminolysis
Glycolysis
CB-839
Succinyl-CoAHeme
Biosynthesis
Fatty AcidBiosynthesis
CPI-613

33
Increased dependence on serine
Increased activity of de novo serine synthesis enzymes in cancer has been
observed for more than 30 years (Snell, 1984; Snell et al., 1988). More recently, it
was found that expression of the serine synthesis enzyme phosphoglycerate
dehydrogenase (PHGDH) is increased in some cancers due to copy number gain of a
region on chromosome 1p (Beroukhim et al., 2010; Locasale et al., 2011; Possemato
et al., 2011) or as a consequence of oncogenic signaling, including NRF2 and ATF4
signaling (DeNicola et al., 2015), or hypoxia responses (Samanta et al., 2016). The
PHGDH gene encodes the enzyme that catalyzes conversion of the glycolytic
intermediate 3-phosphoglycerate into 3-phosphohydroxypyruvate, and 3-
phosphohydroxypyruvate is converted to serine via two subsequent reactions
(Figure 6). Increased PHGDH gene expression leads to greater production of serine
from glucose and is associated with specific subsets of breast cancer, lung
adenocarcinoma, and melanoma (Locasale et al., 2011; Possemato et al., 2011;
Zhang et al., 2017). Serine is present in plasma and can be taken up by cells via
amino acid transporters, yet PHGDH expression and increased serine biosynthesis
have been shown to be important for supporting cancer cell proliferation and
survival in both in vitro and in vivo settings (Locasale et al., 2011; Possemato et al.,
2011). However, PHGDH activity may not be a requirement for proliferation for all
PHGDH-amplified cancers, as expression has been shown to be dispensable in a
breast cancer xenograft model (Chen et al., 2013).

34
Figure 6. Serine Biosynthesis and Folate Cycle The glycolytic intermediate 3-phophoglycerate (3-PG) is metabolized to serine in a three-step pathway where the first step is catalyzed by the enzyme phosphoglycerate dehydrogenase (PHGDH), which can be inhibited by NCT-503 and CBR-5884. Serine metabolism to glycine by serine hydroxymethyltransferase (SHMT) transfers a one carbon unit to tetrahydrofolate (THF) to form N5,N10-methylene-tetrahydrofolate (CH2-THF). CH2-THF is the methyl donor for thymidine nucleotides, or it can be converted to N10-formyl-tetrahydrofolate (CHO-THF) for purine biosynthesis or to N5-methyl-THF (CH3-THF) to support methionine production and numerous methylation reactions via the S-adenosyl methionine (SAM) cycle.
Glucose
3PG Serine
Pyruvate
PHGDHSHMT
THF
CH2THF
CH3THF
Glycine
Met
HCys
SAMCycle
FolateCycle
CHO THF
DHF
Purine Metabolism
ThymineMetabolism
Serine Biosynthesis
CBR-5884NCT-503

35
Why some cancers are dependent on increased serine production is unknown,
but increased flux through this pathway may serve to maintain adequate
intracellular serine levels. Serine is an amino acid, and thus is required for protein
synthesis, but serine can also support many other important critical metabolic
processes including synthesis of glycine, glutathione, and phospholipids. With
respect to proliferating cells such as cancer, serine is the primary carbon donor to
the tetrahydrofolate (THF) cycle, which is required for both purine and pyrimidine
nucleotide biosynthesis (Figure 6) (Snell et al., 1987). Serine can also contribute to
NADPH production via the folate cycle, which serves to maintain redox homeostasis
and support anabolic reactions (Fan et al., 2014; Lewis et al., 2014; Ye et al., 2014).
Emerging work suggests that increased serine synthesis may be particularly
important for maintaining redox homeostasis during metastasis (Piskounova et al.,
2015).
Given the cancer cell requirement for serine, de novo serine synthesis is a
potential target for cancer therapy. Functional PHGDH loss is toxic to tumor cells
with PHGDH amplification or high serine biosynthetic flux (Locasale et al., 2011;
Mattaini et al., 2015; Possemato et al., 2011; Zhang et al., 2017), and small-
molecule inhibitors targeting PHGDH have been shown to inhibit serine synthesis
and tumor proliferation in vitro and in xenograft cancer models (Mullarky et al.,
2016; Pacold et al., 2016; Wang et al., 2017). However, inhibitors of PHGDH might
have a limited therapeutic index, as de novo serine synthesis has an important
physiological role in the central nervous system (Furuya, 2008) and Phgdh-deficient

36
mice exhibit severe brain morphogenesis defects (Yoshida et al., 2004). Compounds
with decreased distribution in the brain may be more effective for cancer therapy.
Certain tumors are dependent on uptake of environmental serine (Jain et al.,
2012; Maddocks et al., 2013; Maddocks et al., 2017), and limiting plasma serine
availability can be beneficial for patients with these cancers. Removing serine from
culture media limits incorporation of one-carbon units into nucleotides and impairs
proliferation (Labuschagne et al., 2014). Additionally, serine deprivation by dietary
restriction is sufficient to slow growth of both xenograft (Gravel et al., 2014;
Maddocks et al., 2013) and autochthonous cancer models, although efficacy of serine
deprivation appears to be influenced by both the oncogenic driver mutation and
tissue context (Maddocks et al., 2017). Combining serine restriction with other
drugs may also potentiate antitumor responses (Gravel et al., 2014; Maddocks et al.,
2013; Maddocks et al., 2017). Further understanding the roles of de novo serine
synthesis and serine uptake in different tumor contexts can yield important
insights into how to target serine metabolism.
FH and SDH loss in heritable cancer syndromes
In addition to genetic events that increase metabolic enzyme expression,
some cancers select for deletion of metabolic enzymes. Familial cancer syndromes
caused by fumarate hydratase (FH) or succinate dehydrogenase (SDH) deletion
suggest that these TCA enzymes can behave as classical tumor suppressors.
Affected families inherit one defective copy of either FH or SDH, and develop an

37
aggressive form of cancer upon loss of heterozygosity (Baysal et al., 2000; Tomlinson
et al., 2002). Loss of FH activity or SDH activity results in disruption of the TCA
cycle and accumulation of fumarate or succinate, respectively. Like D-2HG,
fumarate and succinate accumulation can inhibit some aKG-dependent
dioxygenases, resulting in hypermethylation of DNA and histones in tumors
exhibiting loss of FH or SDH (Hoekstra et al., 2015; Letouze et al., 2013; Xiao et al.,
2012). Additionally, succinate and fumarate inhibit the prolyl hydroxylase domain-
containing (PHD) enzymes that regulate stability of hypoxia-inducible factors
(HIFs), such that FH and SDH-deficient cancers activate the hypoxic gene
expression program even under normoxic conditions (Hewitson et al., 2007; Pollard
et al., 2005; Selak et al., 2005). Both epigenetic changes and aberrant HIF
activation can contribute to tumor initiation and progression in these cancers.
Loss of FH or SDH introduces vulnerabilities that may be amenable to
therapeutic targeting. In silico modeling of metabolic networks suggests that FH-
null cells can upregulate heme metabolism to enable their survival (Frezza et al.,
2011). The heme biosynthesis pathway uses succinyl-CoA to generate heme (Figure
5), which can be degraded to bilirubin and excreted from cells, allowing cells to
dispose of excess TCA cycle carbon. Thus, FH-null cells may increase flux through
this pathway as a means to allow partial TCA cycle activity. Consequently, FH
deletion renders mouse and human cells more sensitive to genetic and
pharmacological inhibition of heme oxygenase 1 (HMOX1), an enzyme involved in
heme degradation.

38
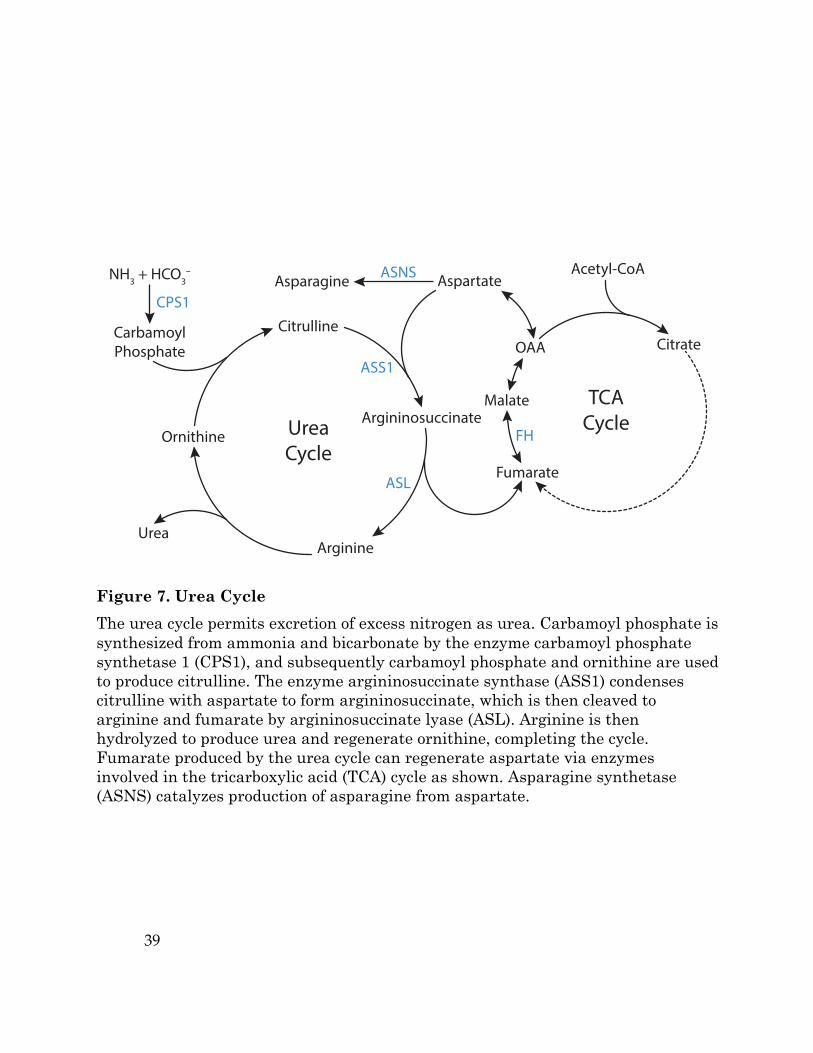
Another potentially targetable metabolic liability of renal cell cancers that
have lost FH expression is a dependence on exogenous arginine. The high levels of
fumarate resulting from FH deficiency drives argininosuccinate lyase (ASL) and
argininosuccinate synthase (ASS1) in a direction that consumes arginine (Figure
7). Depletion of intracellular arginine causes these cells to become arginine
auxotrophs (Adam et al., 2013; Zheng et al., 2013), and therapies that deplete
exogenous arginine (Table 1) may be effective in treating malignancies where FH is
lost (Phillips et al., 2013).
Loss of SDH also results in TCA cycle dysfunction, leading to the
accumulation of succinate and depletion of aspartate, fumarate, citrate, and malate.
In this context, aspartate cannot be synthesized from glutamine or other sources of
aKG, and aspartate production is dependent on pyruvate carboxylase (PC) activity.
PC catalyzes carboxylation of pyruvate to oxaloacetate (Figure 5), which can then
undergo transamination to form aspartate (Figure 7). To cope with TCA cycle
truncation and still produce aspartate, SDH defective cells upregulate PC protein
expression in culture and in tumors to synthesize aspartate from glucose (Cardaci et
al., 2015; Lussey-Lepoutre et al., 2015). PC ablation impairs SDH-deficient cell
proliferation and tumor formation, and thus targeting PC might be exploited to
treat these types of cancers.
39
Figure 7. Urea Cycle The urea cycle permits excretion of excess nitrogen as urea. Carbamoyl phosphate is synthesized from ammonia and bicarbonate by the enzyme carbamoyl phosphate synthetase 1 (CPS1), and subsequently carbamoyl phosphate and ornithine are used to produce citrulline. The enzyme argininosuccinate synthase (ASS1) condenses citrulline with aspartate to form argininosuccinate, which is then cleaved to arginine and fumarate by argininosuccinate lyase (ASL). Arginine is then hydrolyzed to produce urea and regenerate ornithine, completing the cycle. Fumarate produced by the urea cycle can regenerate aspartate via enzymes involved in the tricarboxylic acid (TCA) cycle as shown. Asparagine synthetase (ASNS) catalyzes production of asparagine from aspartate.
Aspartate
OAA
Fumarate
Citrulline
Argininosuccinate
Arginine
Ornithine
Urea
CarbamoylPhosphate
Asparagine ASNS
UreaCycle
ASS1
ASL
Citrate
Malate TCACycle
Acetyl-CoA
FH
NH3 + HCO3–
CPS1

40
Loss of argininosuccinate synthase 1 expression
Somatic loss of metabolic enzyme expression may be selected for in other
tumor types. For example, some melanoma, lymphoma, glioma, and prostate
cancers reduce or lose the expression of the urea cycle enzyme argininosuccinate
synthase 1 (ASS1) (Delage et al., 2010). As noted above, ASS1 is involved in
arginine synthesis, catalyzing the conversion of citrulline and aspartate to the
arginine precursor argininosuccinate (Figure 7). Genetic or epigenetic silencing of
ASS1 provides an advantage to tumor cells by allowing them to preserve cellular
aspartate (Rabinovich et al., 2015), a poorly transported nutrient that can be a
critical output of the TCA cycle to support de novo nucleotide synthesis and cell
proliferation (Birsoy et al., 2015; Sullivan et al., 2015).
A potential liability of ASS1-deficient cancers is that, like FH-null cancers,
they are unable to synthesize arginine de novo. As functional arginine auxotrophs,
these cells are reliant on exogenous arginine for proliferation and survival and may
be sensitive to therapies that lower arginine availability (Table 1). Arginine
deiminase (ADI) is a microbial enzyme that catabolizes arginine and can be used to
deplete extracellular arginine levels. Recombinant pegylated arginine deiminase
(ADI-PEG20) has been tested in clinical trials to treat melanoma and hepatocellular
carcinoma with some therapeutic benefit (Ascierto et al., 2005; Izzo et al., 2004; Ott
et al., 2013; Szlosarek et al., 2013; Yang et al., 2010). However, the use of arginine-
catabolizing enzymes may not be an effective therapeutic strategy for all ASS1-
deficient cancers, as some ADI-treated tumors have been found to re-express ASS1

41
(Feun et al., 2012; Long et al., 2013; Shen et al., 2003). Whether some tumors
require loss of ASS1 expression to proliferate is an area of active investigation, as
these may be more responsive to arginine depleting drugs. The combination of
arginine depletion with other therapies might also limit resistance, and the
identification of synthetic lethal targets with ASS1-loss is another approach being
evaluated to increase the clinical efficacy of therapies that deplete circulating
arginine (Bean et al., 2016; Kremer et al., 2017; Locke et al., 2016).
Metabolic collateral lethality
Loss of metabolic enzyme expression can also occur as a passenger event. For
example, genomic deletions leading to loss of tumor suppressor genes can also lead
to loss of adjacent non-essential metabolic genes. Because cells often exhibit
redundancy in essential pathways, this phenomenon can introduce a therapeutic
opportunity to target cancer cells that has been termed collateral lethality (Muller
et al., 2015). Pancreatic ductal adenocarcinoma (PDAC) cells exhibiting homozygous
deletion of the tumor suppressor SMAD4 often lose malic enzyme 2 (ME2)
expression due to the chromosomal proximity of the two genes. Targeting the malic
enzyme 3 (ME3) isoform was found to impair tumor proliferation of PDAC
xenografts lacking ME2 expression, but had no effect on tumors with intact ME2
(Dey et al., 2017). Similarly, the gene encoding enolase 1 (ENO1) is on the tumor-
suppressor locus 1p36, and undergoes homozygous deletion in 1-5% of GBM cancers.
Knockdown of enolase 2 (ENO2) in ENO1-null GBM cells resulted in significant

42
inhibition of proliferation and intracranial tumorigenesis, whereas ENO1
expressing cancer cells were insensitive to ENO2 ablation. Furthermore, ENO1 loss
results in extreme sensitivity to the pan-enolase inhibitor
phosphonoacetohydroxamate (PHAH) and SF2312 (Leonard et al., 2016; Muller et
al., 2012). In both examples, decreased metabolic enzyme redundancy rendered the
cells dependent on a specific isoform of an enzyme that could be selectively targeted.
It also decreases total cellular levels of enzymatic activity for a given reaction,
thereby lowering the threshold for toxicity for targeting the corresponding enzyme.
Passenger deletion of metabolic genes can introduce vulnerabilities involving
other pathways as well. Deletion of the tumor suppressor CDKN2A results in
concomitant deletion of the gene encoding the methionine salvage pathway enzyme
methylthioadenosine phosphorylase (MTAP) in many cancers, including 53% of
glioblastomas and 26% of pancreatic cancers (Mavrakis et al., 2016). MTAP cleaves
methylthioadenosine (MTA), a product of polyamine biosynthesis, into 5-
methylthioribose-1-phosphate (MTR) and adenine, which are further metabolized to
methionine and adenosine monophosphate (AMP), respectively (Figure 8). MTAP-
deficient cells require de novo purine synthesis to generate AMP, since they are
unable to cleave MTA to salvage adenine, and thus MTAP loss makes cells more
susceptible to inhibitors of purine biosynthesis as well as to methionine depletion
(Hori et al., 1996). Co-administration of MTA with toxic adenosine analogues has
been shown to be selectively lethal to MTAP-null cancer cells, since normal tissues
expressing MTAP are able to convert MTA to adenine to competitively inhibit the
43
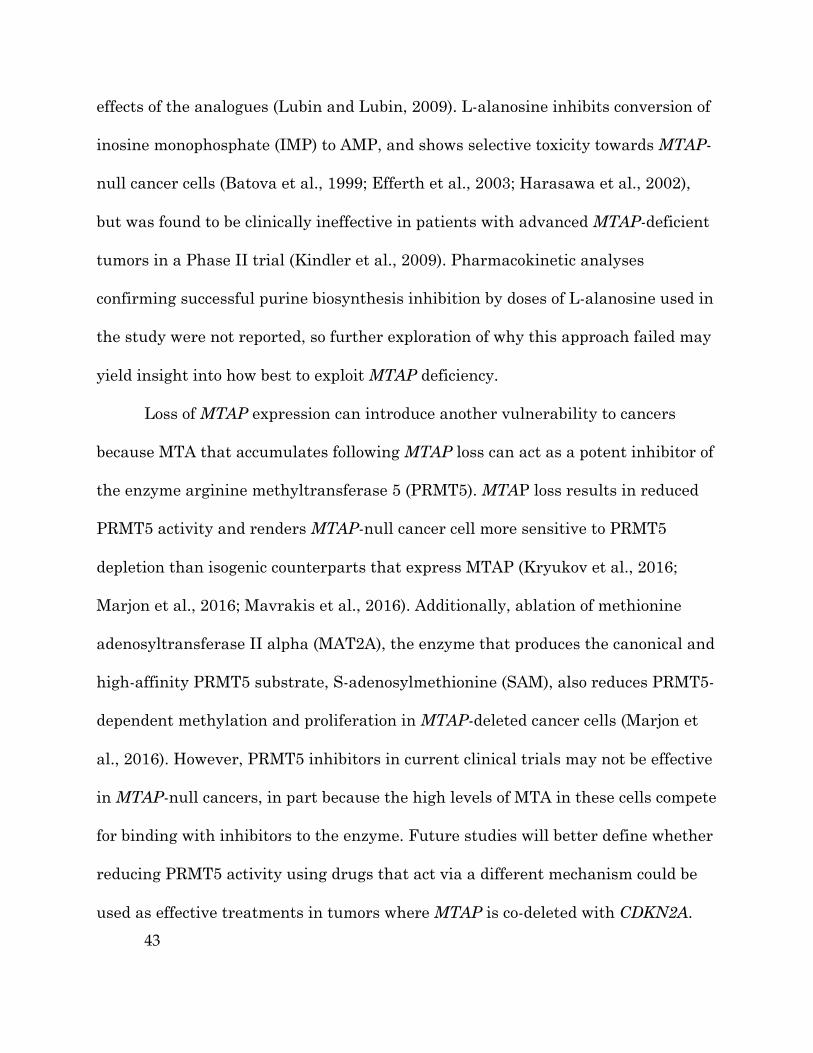
effects of the analogues (Lubin and Lubin, 2009). L-alanosine inhibits conversion of
inosine monophosphate (IMP) to AMP, and shows selective toxicity towards MTAP-
null cancer cells (Batova et al., 1999; Efferth et al., 2003; Harasawa et al., 2002),
but was found to be clinically ineffective in patients with advanced MTAP-deficient
tumors in a Phase II trial (Kindler et al., 2009). Pharmacokinetic analyses
confirming successful purine biosynthesis inhibition by doses of L-alanosine used in
the study were not reported, so further exploration of why this approach failed may
yield insight into how best to exploit MTAP deficiency.
Loss of MTAP expression can introduce another vulnerability to cancers
because MTA that accumulates following MTAP loss can act as a potent inhibitor of
the enzyme arginine methyltransferase 5 (PRMT5). MTAP loss results in reduced
PRMT5 activity and renders MTAP-null cancer cell more sensitive to PRMT5
depletion than isogenic counterparts that express MTAP (Kryukov et al., 2016;
Marjon et al., 2016; Mavrakis et al., 2016). Additionally, ablation of methionine
adenosyltransferase II alpha (MAT2A), the enzyme that produces the canonical and
high-affinity PRMT5 substrate, S-adenosylmethionine (SAM), also reduces PRMT5-
dependent methylation and proliferation in MTAP-deleted cancer cells (Marjon et
al., 2016). However, PRMT5 inhibitors in current clinical trials may not be effective
in MTAP-null cancers, in part because the high levels of MTA in these cells compete
for binding with inhibitors to the enzyme. Future studies will better define whether
reducing PRMT5 activity using drugs that act via a different mechanism could be
used as effective treatments in tumors where MTAP is co-deleted with CDKN2A.

44
Figure 8. Methionine Cycle Methionine is an essential amino acid used for methylation reactions, cysteine synthesis, and polyamine generation. Methionine adenosyltransferase (MAT) converts methionine to S-adenosylmethionine (SAM). Methyl transferases use SAM as the methyl donor for methylation reactions. Demethylation of SAM generates S-adenosylhomocysteine (SAH), which is hydrolyzed to homocysteine (HCys) and adenosine. Methionine is regenerated from HCys by transfer of the methyl group from N5-methyl-THF (CH3-THF). HCys is also an intermediate of cysteine synthesis, where serine and HCys condense to form cysteine by the transsulfuration pathway. SAM can also support polyamine synthesis when SAM is converted to decarboxylated SAM(dcSAM). Together with the urea cycle metabolite ornithine, this compound generates putrescine and subsequently spermine and spermidine. In these reactions, dcSAM is converted to 5’-methylthioadenosine (MTA). MTA accumulation inhibits the enzyme protein arginine N-methyltrasferase 5 (PRMT5), which uses SAM as a methyl donor to synthesize symmetrical dimethylarginine (sDMA) from arginine. MTA is cleaved to 5-methylthioribose-1-phosphate (MTR) and adenine in the methionine cycle by the enzyme methylthioadenosine phosphorylase (MTAP). Adenine can be converted to AMP, and the adenosine analogue L-alanosine can limit AMP production via the purine synthesis pathway. MTR can be converted to methionine, completing the methionine cycle.
Arginine
Ornithine
MTAMTR
SAM
Methionine
dcSAMPutrescine
Spermidine
Spermine
SAH
CH3THF
THF
SAMCycle
Adenine AMP ATP
dATP
IMP
R5P
L-alanosine
PRMT5ArgininesDMA
SAMSAH
MethylationReactions
SAMCycle
Serine
Cysteine
HCys
FolateCycle
UreaCycle
MethionineCycle
MTAPPolyamine
Biosynthesis
TranssulfurationPathway
PurineBiosynthesis
MAT

45
Emerging Metabolic Targets
Numerous metabolic differences between cancer cells and normal cells have
been described. Some recent examples to illustrate how these differences might be
exploited for therapy are highlighted, but many other targets have been proposed
and are discussed in detail elsewhere (Bobrovnikova-Marjon and Hurov, 2014;
Galluzzi et al., 2013; Martinez-Outschoorn et al., 2017).
Targeting de novo lipid synthesis
Several lines of evidence suggest that targeting de novo fatty acid synthesis
might be effective in the treatment of some cancers. Fatty acids are a key
component of cell membranes and can also act as signaling molecules or store
energy. It was first discovered in the 1950s that tumors are able to synthesize
lipids, and a subsequent study determined that the large majority of lipids in tumor
cells are synthesized de novo, rather than being obtained from exogenous sources
(Medes et al., 1953; Ookhtens et al., 1984). Since then, numerous studies have
identified de novo fatty acid biosynthesis as a key metabolic requirement for some
cancers, and it has been dubbed by some as a distinct metabolic “hallmark of the
transformed phenotype” (Kuhajda et al., 1994; Menendez and Lupu, 2006; Röhrig
and Schulze, 2016). With the exception of liver, adipose tissue, and lactating breast,
adult tissues do not synthesize fatty acids de novo under normal physiological
conditions (Menendez and Lupu, 2006), so inhibition of de novo fatty acid synthesis
might have an adequate therapeutic window.

46
Figure 9. Fatty Acid Synthesis
Citrate is a carrier of acetyl groups from the mitochondria to the cytoplasm to support fatty acid synthesis. Mitochondrial citrate is transported into the cytosol where ATP citrate lyase (ACLY) cleaves citrate to acetyl-CoA and oxaloacetate. Oxaloacetate is converted to malate, and malate can be transported back into the mitochondrial matrix or can be converted into pyruvate in the cytoplasm by malic enzyme 1 (ME1). Cytosolic acetyl-CoA contributes to fatty acid synthesis. First, the enzyme acetyl-CoA carboxylase (ACC) catalyzes carboxylation of acetyl CoA to malonyl CoA. Fatty acid synthase (FASN) then uses malonyl-CoA to sequentially add two carbon units to a growing acyl chain and synthesize the saturated 16-carbon fatty acid palmitate, which serves as a precursor to other fatty acids. The compound ND-464 and TVB-2640 are inhibitors of ACC and FASN, respectively.
Citrate
Malate
Oxaloacetate
Pyruvate
Acetyl-CoA
Citrate
Malate
Oxaloacetate
Pyruvate
TCA CycleAcetyl-CoA Malonyl-CoA
Palmitate
Mitochondrion Cytoplasm
ACCACLY
ME1PCPDH
FASNTVB-2640
ND-646
OtherFatty Acids

47
Fatty acid synthesis is a multi-step process that primarily occurs in the
cytosol of cells. First, acetyl-CoA groups are converted to malonyl-CoA via the
enzyme acetyl-CoA carboxylase (ACC). Next, the multidomain enzyme fatty acid
synthase (FASN) assembles the fatty acid chain palmitate from malonyl-CoA.
Although fatty acid synthesis occurs in the cytosol, cytosolic acetyl-CoA is produced
from mitochondrial citrate, which is exported from mitochondria and cleaved by
cytosolic ATP-citrate lyase (ACLY) (Figure 9). Cancer cells are also able to
generate acetyl-CoA from cytosolic acetate (Comerford et al., 2014; Gao et al., 2016;
Kamphorst et al., 2014; Mashimo et al., 2014). However, acetate is not always
abundant in blood and is not the predominate source of acetyl-CoA used for fatty
acid synthesis in some cells (Hosios and Vander Heiden, 2014). Certain cancers are
nevertheless dependent on expression of acetyl-CoA synthetase 2 (ACSS2), the
cytosolic enzyme that allows cells to synthesize acetyl-CoA from acetate, making
this a potential therapeutic target (Comerford et al., 2014; Schug et al., 2015).
Numerous inhibitors have been developed to target fatty acid synthesis, with
attempts to limit cytosolic acetyl-CoA availability via ACLY inhibition as well as
direct targeting of the enzymes ACC and FASN (Figure 9). ACLY activity is
elevated in cancers (Migita et al., 2008), and targeting ACLY genetically or
chemically prevents xenograft tumor formation and proliferation (Adam et al., 2013;
Bauer et al., 2005; Hatzivassiliou et al., 2005; Migita et al., 2008). Genetic
knockdown of ACC induces apoptosis in cancer cell lines (Brusselmans et al., 2005;
Chajes et al., 2006), and an allosteric inhibitor of ACC, ND-646, has shown

48
antitumor efficacy in autochthonous mouse lung tumor models (Svensson et al.,
2016). Targeting FASN has been found to reduce palmitoylation of tubulin and
disrupt microtubule organization, inhibiting tumor cell growth (Heuer et al., 2017).
The compound TVB-2640 is the first compound targeting FASN to enter clinical
trials (Table 1), and when combined with paclitaxel, can cause partial responses or
prolonged stable disease (Brenner et al., 2017).
Differential requirements for NAD+/NADH homeostasis
Warburg’s observation that cancer cells have dramatically increased glucose
consumption and lactate production, even in the presence of oxygen, led to the
hypothesis that cancer cells have diminished mitochondrial function (Warburg,
1956). However, subsequent work determined that despite engaging in aerobic
glycolysis, cancer cells consume oxygen at levels comparable to normal tissue
(Weinhouse, 1956; Zu and Guppy, 2004). Moreover, inhibitors of cellular respiration
block proliferation, suggesting that most cancer cells require respiration in order to
proliferate (Harris, 1980; Howell and Sager, 1979; Kroll et al., 1983; Loffer and
Schneider, 1982; Zhang et al., 2014b). Respiration is also needed for tumor
initiation, as tumor cells with impaired oxidative phosphorylation due to depletion
of mitochondrial DNA (mtDNA) exhibit increased tumor latency upon subcutaneous
transplantation. In fact, cells derived from these tumors acquire host mtDNA to
regain the ability carry out respiration, providing compelling evidence that
49
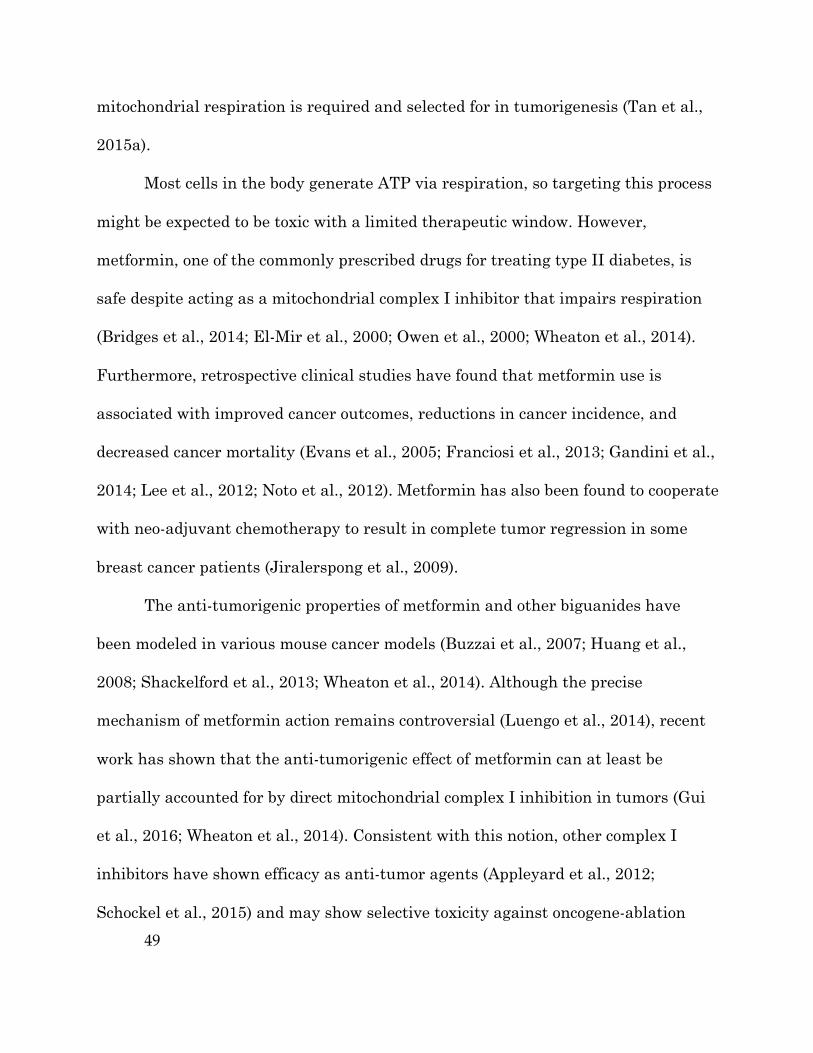
mitochondrial respiration is required and selected for in tumorigenesis (Tan et al.,
2015a).
Most cells in the body generate ATP via respiration, so targeting this process
might be expected to be toxic with a limited therapeutic window. However,
metformin, one of the commonly prescribed drugs for treating type II diabetes, is
safe despite acting as a mitochondrial complex I inhibitor that impairs respiration
(Bridges et al., 2014; El-Mir et al., 2000; Owen et al., 2000; Wheaton et al., 2014).
Furthermore, retrospective clinical studies have found that metformin use is
associated with improved cancer outcomes, reductions in cancer incidence, and
decreased cancer mortality (Evans et al., 2005; Franciosi et al., 2013; Gandini et al.,
2014; Lee et al., 2012; Noto et al., 2012). Metformin has also been found to cooperate
with neo-adjuvant chemotherapy to result in complete tumor regression in some
breast cancer patients (Jiralerspong et al., 2009).
The anti-tumorigenic properties of metformin and other biguanides have
been modeled in various mouse cancer models (Buzzai et al., 2007; Huang et al.,
2008; Shackelford et al., 2013; Wheaton et al., 2014). Although the precise
mechanism of metformin action remains controversial (Luengo et al., 2014), recent
work has shown that the anti-tumorigenic effect of metformin can at least be
partially accounted for by direct mitochondrial complex I inhibition in tumors (Gui
et al., 2016; Wheaton et al., 2014). Consistent with this notion, other complex I
inhibitors have shown efficacy as anti-tumor agents (Appleyard et al., 2012;
Schockel et al., 2015) and may show selective toxicity against oncogene-ablation

50
resistant cells (Viale et al., 2014) and cancer stem cells (Sancho et al., 2015).
Additional complex I inhibitors are under development (Bastian et al., 2017), and
other inhibitors of respiration or mitochondrial metabolism, including the lipoic acid
derivative CPI-613 (Table 1), are currently being assessed in clinical trials (Lycan et
al., 2016; Pardee et al., 2014).
Recent work has shed some light on the potential therapeutic window for
treating tumors with respiration inhibitors. Mitochondria are viewed as the
powerhouse of the cell, with respiration considered primarily as an ATP-producing
catabolic process. However, mitochondrial ATP production appears dispensable for
many proliferating cells (Birsoy et al., 2015; Sullivan et al., 2015; Titov et al., 2016).
Instead, respiration serves an alternative anabolic role for proliferating cells by
regenerating the oxidized form of nicotinamide adenine dinucleotide (NAD+) from
the reduced form (NADH) (Birsoy et al., 2015; Sullivan et al., 2015; Titov et al.,
2016). Maintenance of intracellular NAD+ is required for many cellular processes,
including protein deacetylation, ADP-ribosylation and calcium signaling (Chiarugi
et al., 2012). Additionally, NAD+ serves as a critical redox cofactor required to
generate oxidized molecules, such as amino acids and nucleotides necessary for
biomass accumulation (Birsoy et al., 2015; Sullivan et al., 2015; Titov et al., 2016).
Proliferating cells often require a high NAD+/NADH ratio to support anabolic
reactions and in some contexts the NAD+/NADH ratio directly correlates with
proliferation rate (Gui et al., 2016). Higher NAD+/NADH ratios appear important
for proliferation while lower ratios favor mitochondrial ATP production. Thus, one
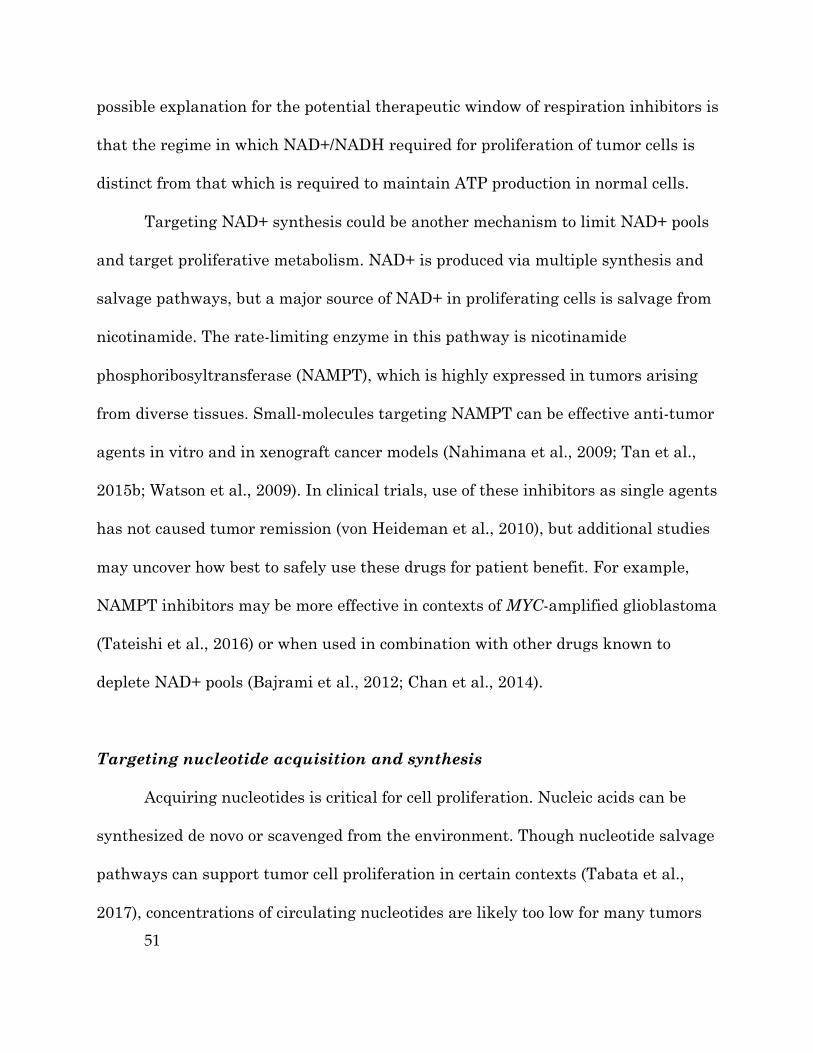
51
possible explanation for the potential therapeutic window of respiration inhibitors is
that the regime in which NAD+/NADH required for proliferation of tumor cells is
distinct from that which is required to maintain ATP production in normal cells.
Targeting NAD+ synthesis could be another mechanism to limit NAD+ pools
and target proliferative metabolism. NAD+ is produced via multiple synthesis and
salvage pathways, but a major source of NAD+ in proliferating cells is salvage from
nicotinamide. The rate-limiting enzyme in this pathway is nicotinamide
phosphoribosyltransferase (NAMPT), which is highly expressed in tumors arising
from diverse tissues. Small-molecules targeting NAMPT can be effective anti-tumor
agents in vitro and in xenograft cancer models (Nahimana et al., 2009; Tan et al.,
2015b; Watson et al., 2009). In clinical trials, use of these inhibitors as single agents
has not caused tumor remission (von Heideman et al., 2010), but additional studies
may uncover how best to safely use these drugs for patient benefit. For example,
NAMPT inhibitors may be more effective in contexts of MYC-amplified glioblastoma
(Tateishi et al., 2016) or when used in combination with other drugs known to
deplete NAD+ pools (Bajrami et al., 2012; Chan et al., 2014).
Targeting nucleotide acquisition and synthesis
Acquiring nucleotides is critical for cell proliferation. Nucleic acids can be
synthesized de novo or scavenged from the environment. Though nucleotide salvage
pathways can support tumor cell proliferation in certain contexts (Tabata et al.,
2017), concentrations of circulating nucleotides are likely too low for many tumors

52
to satisfy their nucleotides demand via salvage alone (Traut, 1994). Nevertheless,
the ability of some tumor cells to scavenge nucleotides is exploited for cancer
therapy. While most cells are able to scavenge the epigenetically modified cytosine
bases 5-hydroxymethyl-2’deoxycytidine (5hmdC) and 5-formy-2’deoxycytidine (5fdC)
and incorporate these bases into the DNA without compromising genome integrity,
cancer cell lines overexpressing cytidine deaminase (CDA) convert these bases to
the corresponding modified uracil analogues, which induce cytotoxicity when
incorporated into DNA (Zauri et al., 2015). Thus, administering 5hmdC and 5fdC
may selectively target tumors overexpressing CDA.
The clinical success of some antimetabolites argues select tumors are reliant
on de novo nucleotide synthesis. Nucleotide biosynthesis interfaces with other
metabolic pathways; ribose is synthesized from glucose via the pentose phosphate
pathway and nucleotide bases require carbon atoms from amino acids and the one-
carbon pool as well as nitrogen atoms from aspartate and glutamine. Consequently,
targeting amino acid and folate metabolism can affect nucleotide production. For
example, eliminating environmental serine, limiting aspartate synthesis via
mitochondrial inhibition, and ablating the mitochondrial folate pathway impairs
purine biosynthesis (Ducker et al., 2016; Labuschagne et al., 2014; Sullivan et al.,
2015). This raises the possibility that these interventions can widen the therapeutic
window of established antimetabolites, and future studies will determine whether
targeting these pathways is synergistic with existing antimetabolite therapies in
certain contexts.

53
Nucleotide production is downstream of some oncogenic signaling pathways.
Activation of mTOR can increase ribose synthesis via the oxidative pentose
phosphate pathway (Duvel et al., 2010) and enhance flux through the pyrimidine
and purine synthesis pathways (Ben-Sahra et al., 2013; Ben-Sahra et al., 2016;
Robitaille et al., 2013), suggesting that targeting nucleotide metabolism in tumors
exhibiting mTOR hyperactivation may be more effective. PTEN-deficient cells,
which have active mTOR signaling, are more sensitive to inhibition of DHODH by
brequinar and leflunomide (Mathur et al., 2017). Conversely, inhibiting oncogenic
signaling using PI3K inhibitors has been found to deplete DNA nucleotides,
decrease DNA synthesis, and cause DNA damage (Juvekar et al., 2016). Lung
cancer cells with oncogenic KRAS plus LKB1 loss are more reliant on the urea cycle
enzyme carbamoyl phosphate synthetase-1 (CPS1) for pyrimidine biosynthesis,
although this dependency is independent of mTOR signaling (Kim et al., 2017).
Increased requirement for detoxification of reactive metabolites
Cancer cells generally have increased levels of reactive metabolites
(DeBerardinis and Chandel, 2016; Sullivan et al., 2016). These metabolites can be
formed as error products of metabolic enzymes or can be formed non-enzymatically
due to the intrinsic reactivity of certain metabolic intermediates. Some of these
byproducts, including reactive oxygen species (ROS) and methylglyoxal, are
themselves chemically unstable and, thus, can covalently modify amino acids and
nucleic acids. While elevation of reactive metabolites can support oncogenesis in

54
some contexts (Arnold et al., 2001; Irani et al., 1997; Suh et al., 1999; Weinberg et
al., 2010), at high levels reactive metabolites become toxic and kill cells due to the
resulting damage to the proteome and genome (Karisch et al., 2011; Rabbani and
Thornalley, 2014). Cancer cells rely on several pathways to prevent reactive
metabolite accumulation. For example, the transcription factor NRF2, which
mediates an antioxidant response program to detoxify ROS, is downstream of
several oncogenic drivers, and loss of NRF2 in this context can impair tumor
proliferation (Chio et al., 2016; DeNicola et al., 2011). Disruption of this and other
detoxification pathways is predicted to have a more deleterious effect on cancer cells
than normal cells, and thus serves as a potential targetable metabolic liability.
An alternative strategy for exploiting the increased production of reactive
metabolites observed in cancer cells is to target the synthesis or utilization of
antioxidants such as glutathione. Glutathione is a cysteine-containing tripeptide
that plays a crucial role in many detoxification pathways. It is one of the most
abundant metabolites in the cell and serves to reduce the levels of reactive
metabolites by serving as a substrate for electrophilic attack. Several screens for
small-molecules that selectively kill transformed cells have identified compounds
that reduce glutathione levels (Dolma et al., 2003; Raj et al., 2011; Trachootham et
al., 2006), and genetic or pharmacological inhibition of glutathione synthesis results
in ROS accumulation and impedes cancer initiation and cell proliferation (Harris et
al., 2015; Lien et al., 2016). Therapeutic interventions that decrease intracellular
glutathione levels, such as administration of the oxidized form of vitamin C,
55
dehydroascorbate (DHA), can result in cancer cell death and impaired tumor
progression (Yun et al., 2015)
Another way to deplete intracellular glutathione is by limiting availability of
the amino acid cysteine, the key reactive residue of glutathione that is required for
its synthesis. Many cancer cells are auxotrophic for this amino acid, and lowering
whole body cysteine levels with bacterial cysteineases is a potential cancer
treatment being evaluated in clinical trials (Graczyk-Jarzynka et al., 2017).
Targeting the cystine and glutamate transporter xCT (SLC7A11) is another
approach to limit intracellular cysteine availability and prevent cysteine-dependent
glutathione synthesis. Inhibitors of this transporter have been found to deplete
intracellular glutathione in cancer cells, resulting in iron-dependent accumulation
of ROS and a form of cell death termed ferroptosis (Dixon et al., 2012; Dixon et al.,
2014; Yang et al., 2014).
Lineage and Environment Specific Vulnerabilities:
Analysis of gene expression across different cancer types has determined that
metabolic enzyme expression is heterogeneous across tumors, and there is no
universal metabolic transformation common to all cancers. In fact, tumors retain
many features that correspond to their parental normal tissue (Gaude and Frezza,
2016; Hu et al., 2013). It is not known whether this effect results from rigid lineage-
specific metabolic expression programs or from the similar local microenvironment
experienced by the tumor and normal tissue. However, these analyses suggest that

56
metabolic vulnerabilities may not be universal across all cancers and highlight the
possibility that some metabolic dependencies of cancer may be modulated by
environment or defined by tumor lineage.
Differential utilization of amino acids
Acquisition of amino acids is an important biosynthetic requirement for
cancer cells to support proliferation (Hosios et al., 2016). How cells acquire amino
acids can vary according to cell type and environment, and therefore targeting
amino acid metabolism could offer a therapeutic window for cancer treatment
(Yuneva et al., 2012). Recently, it has been determined that mouse lung and
pancreatic tumors exhibit differences in amino acid metabolism, even when
harboring the same genetic lesion. Lung tumors support their nitrogen requirement
by catabolizing free branched chain amino acids (BCAA), whereas pancreatic
tumors expressing the same driver mutation do not. Targeting BCAA
transaminases inhibits lung tumor formation better than pancreatic tumor
formation, suggesting that dependence on branched chain amino acid catabolism is
determined by cell lineage rather than by tumor site (Mayers et al., 2016). Tumors
of other lineages are also dependent on BCAA transaminases, including some
glioblastomas and blast crisis chronic myeloid leukemia (Hattori et al., 2017; Tonjes
et al., 2013). Together, these observations suggest that tissue-of-origin can influence
metabolic requirements and vulnerabilities.

57
Asparagine auxotrophy in acute lymphoblastic leukemia
The non-essential amino acid asparagine is abundant in plasma and can also
be synthesized by many cell types, so asparagine is dispensable for most cells. Acute
lymphoblastic leukemia (ALL) and related lymphomas, however, are auxotrophic
for asparagine (Neuman and McCoy, 1956). Bacterial L-asparaginase deamidates
asparagine to aspartic acid, thereby limiting the availability of asparagine for
cancer cells. L-asparaginase has been found to be effective in the treatment of ALL
and is included in standard chemotherapy regimens for this disease (Table 1)
(Egler et al., 2016). Though the mechanism of asparagine auxotrophy in ALL cells
was assumed to be genetically defined, studies have shown that clinical response to
L-asparaginase treatment is independent of asparagine synthase (ASNS)
expression, the enzyme that converts aspartate to asparagine (Figure 7) (Appel et
al., 2006; Stams et al., 2003). In fact, genome-wide analysis has shown that there is
no consistent gene expression pattern that dictates sensitivity to L-asparaginase
(Fine et al., 2005). The absence of a genetic driver for asparagine auxotrophy,
combined with the fact that L-asparaginase has little known clinical utility outside
of the context of ALL, suggests that this metabolic vulnerability may be lineage
dependent.
Inducing differentiation in myeloid cells
A common feature of acute myeloid leukemia (AML) is that leukemic
myeloblasts arrest at an immature stage of differentiation. This differentiation
58
blockade is a hallmark of AML even though there are multiple driver mutations for
this disease. Inhibitors of mutant IDH1 or IDH2 have been shown to induce
differentiation in AML cells harboring mutant IDH (Okoye-Okafor et al., 2015;
Wang et al., 2013). The transcription factor HOXA9 is overexpressed in 70% of AML
cases, and overexpression of this transcription factor alone is sufficient to
immortalize murine bone marrow derived myeloid cells (Ayton and Cleary, 2003;
Golub et al., 1999; Kroon et al., 1998). Recently, a myeloid cell screen involving
HOXA9-enforced differentiation arrest found that inhibition of dihydroorotate
dehydrogenase (DHODH), an enzyme in the pyrimidine biosynthesis pathway
(Figure 1B), can induce differentiation (Sykes et al., 2016). Targeting DHODH
depletes uridine and downstream metabolites, and providing uridine is sufficient to
maintain myeloid arrest, even in the presence of compounds targeting DHODH.
Treatment with brequinar sodium (BRQ), an inhibitor of DHODH that is approved
to treat autoimmune disease, is able to overcome myeloid differentiation blockade
and reduces leukemic cell burden in patient-derived xenografts and syngeneic
mouse AML models of diverse genetic subtypes. BRQ was previously evaluated to
treat advanced solid tumors but was not shown to be effective in clinical trials
(Arteaga et al., 1989; Noe et al., 1990; Peters et al., 1990). However, the effect of
BRQ on patients with hematologic malignancies has not yet been evaluated. Future
trials will determine whether targeting DHODH could exploit a cell lineage-
dependent liability in hematological malignancies.

59
Non-tumor cells can influence tumor cell metabolism
Metabolic symbiosis likely exists between tumor cells and the surrounding
stroma, and this interaction could also contribute to tumor growth and
proliferation. Typically, lactate is excreted at high rates by tumor cells, but lactate
has also been described as an oxidative substrate for some cancers. It has been
reported that lactate produced by cancer-associated fibroblasts can enter the TCA
cycle of cancer cells (Bonuccelli et al., 2014; Witkiewicz et al., 2012), and lactate
produced in hypoxic regions of a tumor can fuel respiration in well-oxygenated
tumor cells (Kennedy et al., 2013; Sonveaux et al., 2008). Intraoperative
isotopically-labeled glucose infusions performed on non-small cell lung cancer
patients revealed higher contribution of glucose carbon to TCA intermediates than
glycolytic intermediates in tumors, leading the authors to conclude that lactate
could serve as an anaplerotic substrate in this context as well (Hensley et al., 2016;
Faubert et al. 2017). Lactate utilization by tumors is dependent on monocarboxylate
transporters (MCTs) (Figure 3), which are highly expressed in a variety of tumors
(Pinheiro et al., 2012). Compounds targeting MCT1 are currently being evaluated
for antitumor efficacy (Table 1) (Marchiq and Pouyssegur, 2016).
Alanine is rarely limiting for proliferation, as cancer cells typically excrete,
rather than consume, alanine (DeBerardinis et al., 2007; Hosios et al., 2016; Jain et
al., 2012). However, in some contexts cells may not synthesize alanine in excess of
their biosynthetic requirements. Pancreatic ductal adenocarcinoma cells can
consume alanine produced by pancreatic stellate cells in vitro, and the secreted

60
alanine appears to help promote tumor cell proliferation and survival under
nutrient-limited conditions (Sousa et al., 2016). An improved understanding of the
interaction between PDAC tumors and stroma can help determine the metabolic
limitations of pancreatic tumor growth, and guide target selection to exploit this
symbiotic relationship for therapy.
Metabolic dependencies can be modulated by environment
Differences in nutrient availability may contribute to sensitivity or resistance
of cancer cells to some drugs. For example, most cells in culture rely on glutamine
metabolism, but targeting glutaminase is not an effective cancer therapy in all
contexts. Glutamine tracing studies have demonstrated that in some tumor tissues,
glutamine contributes minimally to TCA cycle intermediates, and those cancers can
be resistant to glutaminase inhibition (Davidson et al., 2016; Hensley et al., 2016;
Marin-Valencia et al., 2012; Sellers et al., 2015; Tardito et al., 2015). Importantly,
cell lines derived from resistant lung tumors become sensitive to glutaminase
inhibition in vitro, highlighting that environment can be a contributor to
glutaminase sensitivity (Davidson et al., 2016). What factors determine the
differential use of glutamine in different environments remains an active question,
although environmental cystine can influence glutamine anaplerosis via xCT (Muir
et al., 2017). Targeting redox is another example where environment can influence
drug efficacy, as altering culture media conditions is sufficient to change cancer cell
sensitivity to metformin (Gui et al., 2016). Metabolite levels can also influence the

61
amount of nucleotide synthesis (Cantor et al., 2017), highlighting the importance of
environment in modulating metabolic dependencies.
What Dictates Metabolic Dependencies?
One of the biggest hurdles for cancer drug development is identifying the
patients most likely to respond to a given therapy. With the recent success of some
targeted cancer therapies, patient selection for drugs is often predicated on
expression of an oncogene or the increased activity of a downstream signaling
pathway. However, this same approach may not identify responders for all
metabolic cancer therapies and response to chemotherapies that target metabolism
has not been well predicted by this approach. The protein targets of methotrexate
and 5-FU are present in almost all cancers, but the efficacy of these drugs varies
dramatically across malignancies. Many of the emerging metabolic targets
discussed in this thesis chapter are also expressed widely in cancer, but dependency
on these metabolic pathways is not always universal. For example, while targeting
ACC to limit fatty synthesis can suppress lung tumor progression in some models
(Svensson et al., 2016), loss of ACC activity can accelerate tumor growth in other
cancer models (Jeon et al., 2012). Similarly, many PHGDH-amplified tumors and
cell lines are sensitive to genetic or pharmacological inhibition of the enzyme
(Locasale et al., 2011; Mullarky et al., 2016; Pacold et al., 2016; Possemato et al.,
2011; Wang et al., 2017; Zhang et al., 2017), but for some tumor models PHGDH
expression can be dispensable for growth (Chen et al., 2013). Even among cancers

62
where mutant IDH is an oncogenic driver, sensitivity to mutant IDH inhibitors
appears to differ between leukemia and solid tumor models (Tateishi et al., 2015;
Turcan et al., 2013).
There is growing evidence that metabolic dependencies in cancer are
influenced by tissue environment, cancer lineage, as well as genetic events. Cancer
tissue-of-origin has served as a successful way to select patients for chemotherapies
targeting metabolism for decades. Environment can also influence the efficacy of
drugs targeting DHODH, mitochondrial complex I, and glutaminase, and using
more physiological culture conditions can better define how nutrient levels influence
cancer cell metabolism (Cantor et al., 2017; Davidson et al., 2016; Gui et al., 2016;
Marin-Valencia et al., 2012; Muir et al., 2017; Sellers et al., 2015; Sykes et al., 2016;
Tardito et al., 2015). Unraveling the complexity for how lineage, environment and
genetics interact to create metabolic dependencies will be challenging, but may
provide a path to exploit metabolism in a way that could be transformative for
patients. Additionally, immunotherapies are playing an increasing role in cancer
therapy, and immune cell fate can also be influenced by metabolism. Determining
how immune cell metabolism interacts with tumor metabolism, and how this is
modulated by drugs targeting metabolic enzymes, might aid in the design of more
effective immunotherapies (Buck et al., 2017; Mockler et al., 2014).
Many drugs targeting metabolism are among the most effective clinical drugs
for particular diseases, and many newer metabolic therapies are limited more by
toxicities than by their ability to kill cancer cells. A better understanding of the

63
metabolic dependencies in specific tumor tissues holds the key for defining the
aspects of metabolism most limiting for tumor growth and finding a therapeutic
window to exploit those vulnerabilities for better cancer treatment.
References
Adam, J., Yang, M., Bauerschmidt, C., Kitagawa, M., O'Flaherty, L., Maheswaran, P., Ozkan, G., Sahgal, N., Baban, D., Kato, K., et al. (2013). A role for cytosolic fumarate hydratase in urea cycle metabolism and renal neoplasia. Cell Rep 3, 1440-1448.
Altman, B.J., Stine, Z.E., and Dang, C.V. (2016). From Krebs to clinic: glutamine metabolism to cancer therapy. Nat Rev Cancer 16, 619-634.
Anastasiou, D., Yu, Y., Israelsen, W.J., Jiang, J.K., Boxer, M.B., Hong, B.S., Tempel, W., Dimov, S., Shen, M., Jha, A., et al. (2012). Pyruvate kinase M2 activators promote tetramer formation and suppress tumorigenesis. Nat Chem Biol 8, 839-847.
Appel, I.M., den Boer, M.L., Meijerink, J.P., Veerman, A.J., Reniers, N.C., and Pieters, R. (2006). Up-regulation of asparagine synthetase expression is not linked to the clinical response L-asparaginase in pediatric acute lymphoblastic leukemia. Blood 107, 4244-4249.
Appleyard, M.V., Murray, K.E., Coates, P.J., Wullschleger, S., Bray, S.E., Kernohan, N.M., Fleming, S., Alessi, D.R., and Thompson, A.M. (2012). Phenformin as prophylaxis and therapy in breast cancer xenografts. Br J Cancer 106, 1117-1122.
Arnold, R.S., Shi, J., Murad, E., Whalen, A.M., Sun, C.Q., Polavarapu, R., Parthasarathy, S., Petros, J.A., and Lambeth, J.D. (2001). Hydrogen peroxide mediates the cell growth and transformation caused by the mitogenic oxidase Nox1. Proc Natl Acad Sci U S A 98, 5550-5555.
Arteaga, C.L., Brown, T.D., Kuhn, J.G., Shen, H.S., O'Rourke, T.J., Beougher, K., Brentzel, H.J., Von Hoff, D.D., and Weiss, G.R. (1989). Phase I clinical and pharmacokinetic trial of Brequinar sodium (DuP 785; NSC 368390). Cancer Res 49, 4648-4653.

64
Ascierto, P.A., Scala, S., Castello, G., Daponte, A., Simeone, E., Ottaiano, A., Beneduce, G., De Rosa, V., Izzo, F., Melucci, M.T., et al. (2005). Pegylated arginine deiminase treatment of patients with metastatic melanoma: results from phase I and II studies. J Clin Oncol 23, 7660-7668.
Ayton, P.M., and Cleary, M.L. (2003). Transformation of myeloid progenitors by MLL oncoproteins is dependent on Hoxa7 and Hoxa9. Genes Dev 17, 2298-2307.
Bajrami, I., Kigozi, A., Van Weverwijk, A., Brough, R., Frankum, J., Lord, C.J., and Ashworth, A. (2012). Synthetic lethality of PARP and NAMPT inhibition in triple-negative breast cancer cells. EMBO Mol Med 4, 1087-1096.
Bastian, A., Matsuzaki, S., Humphries, K.M., Pharaoh, G.A., Doshi, A., Zaware, N., Gangjee, A., and Ihnat, M.A. (2017). AG311, a small molecule inhibitor of complex I and hypoxia-induced HIF-1alpha stabilization. Cancer Lett 388, 149-157.
Batova, A., Diccianni, M.B., Omura-Minamisawa, M., Yu, J., Carrera, C.J., Bridgeman, L.J., Kung, F.H., Pullen, J., Amylon, M.D., and Yu, A.L. (1999). Use of alanosine as a methylthioadenosine phosphorylase-selective therapy for T-cell acute lymphoblastic leukemia in vitro. Cancer Res 59, 1492-1497.
Bauer, D.E., Hatzivassiliou, G., Zhao, F., Andreadis, C., and Thompson, C.B. (2005). ATP citrate lyase is an important component of cell growth and transformation. Oncogene 24, 6314-6322.
Baysal, B.E., Ferrell, R.E., Willett-Brozick, J.E., Lawrence, E.C., Myssiorek, D., Bosch, A., van der Mey, A., Taschner, P.E., Rubinstein, W.S., Myers, E.N., et al. (2000). Mutations in SDHD, a mitochondrial complex II gene, in hereditary paraganglioma. Science 287, 848-851.
Bean, G.R., Kremer, J.C., Prudner, B.C., Schenone, A.D., Yao, J.C., Schultze, M.B., Chen, D.Y., Tanas, M.R., Adkins, D.R., Bomalaski, J., et al. (2016). A metabolic synthetic lethal strategy with arginine deprivation and chloroquine leads to cell death in ASS1-deficient sarcomas. Cell Death Dis 7, e2406.
Ben-Sahra, I., Howell, J.J., Asara, J.M., and Manning, B.D. (2013). Stimulation of de novo pyrimidine synthesis by growth signaling through mTOR and S6K1. Science 339, 1323-1328.
Ben-Sahra, I., Hoxhaj, G., Ricoult, S.J.H., Asara, J.M., and Manning, B.D. (2016). mTORC1 induces purine synthesis through control of the mitochondrial tetrahydrofolate cycle. Science 351, 728-733.

65
Beroukhim, R., Mermel, C.H., Porter, D., Wei, G., Raychaudhuri, S., Donovan, J., Barretina, J., Boehm, J.S., Dobson, J., Urashima, M., et al. (2010). The landscape of somatic copy-number alteration across human cancers. Nature 463, 899-905.
Berti, V., Mosconi, L., and Pupi, A. (2014). Brain: normal variations and benign findings in fluorodeoxyglucose-PET/computed tomography imaging. PET Clin 9, 129-140.
Birsoy, K., Wang, T., Chen, W.W., Freinkman, E., Abu-Remaileh, M., and Sabatini, D.M. (2015). An Essential Role of the Mitochondrial Electron Transport Chain in Cell Proliferation Is to Enable Aspartate Synthesis. Cell 162, 540-551.
Bobrovnikova-Marjon, E., and Hurov, J.B. (2014). Targeting metabolic changes in cancer: novel therapeutic approaches. Annu Rev Med 65, 157-170.
Bonuccelli, G., Avnet, S., Grisendi, G., Salerno, M., Granchi, D., Dominici, M., Kusuzaki, K., and Baldini, N. (2014). Role of mesenchymal stem cells in osteosarcoma and metabolic reprogramming of tumor cells. Oncotarget 5, 7575-7588.
Brenner, A., Falchook, G., Patel, M., Infante, J., Arkenau, H.-T., Dean, E., Borazanci, E., Lopez, J., Moore, K., Schmid, P., et al. (2017). Abstract P6-11-09: Heavily pre-treated breast cancer patients show promising responses in the first in human study of the first-In-class fatty acid synthase (FASN) inhibitor, TVB-2640 in combination with paclitaxel. Cancer Research 77, P6-11-09-P16-11-09.
Bridges, H.R., Jones, A.J., Pollak, M.N., and Hirst, J. (2014). Effects of metformin and other biguanides on oxidative phosphorylation in mitochondria. Biochem J 462, 475-487.
Brown, K.K., Spinelli, J.B., Asara, J.M., and Toker, A. (2017). Adaptive Reprogramming of De Novo Pyrimidine Synthesis Is a Metabolic Vulnerability in Triple-Negative Breast Cancer. Cancer Discov 7, 391-399.
Brusselmans, K., De Schrijver, E., Verhoeven, G., and Swinnen, J.V. (2005). RNA interference-mediated silencing of the acetyl-CoA-carboxylase-alpha gene induces growth inhibition and apoptosis of prostate cancer cells. Cancer Res 65, 6719-6725.
Buck, M.D., Sowell, R.T., Kaech, S.M., and Pearce, E.L. (2017). Metabolic Instruction of Immunity. Cell 169, 570-586.
Buzzai, M., Jones, R.G., Amaravadi, R.K., Lum, J.J., DeBerardinis, R.J., Zhao, F., Viollet, B., and Thompson, C.B. (2007). Systemic treatment with the antidiabetic drug metformin selectively impairs p53-deficient tumor cell growth. Cancer Res 67, 6745-6752.

66
Cairncross, J.G., Wang, M., Jenkins, R.B., Shaw, E.G., Giannini, C., Brachman, D.G., Buckner, J.C., Fink, K.L., Souhami, L., Laperriere, N.J., et al. (2014). Benefit from procarbazine, lomustine, and vincristine in oligodendroglial tumors is associated with mutation of IDH. J Clin Oncol 32, 783-790.
Cantor, J.R., Abu-Remaileh, M., Kanarek, N., Freinkman, E., Gao, X., Louissaint, A., Jr., Lewis, C.A., and Sabatini, D.M. (2017). Physiologic Medium Rewires Cellular Metabolism and Reveals Uric Acid as an Endogenous Inhibitor of UMP Synthase. Cell 169, 258-272 e217.
Cardaci, S., Zheng, L., MacKay, G., van den Broek, N.J., MacKenzie, E.D., Nixon, C., Stevenson, D., Tumanov, S., Bulusu, V., Kamphorst, J.J., et al. (2015). Pyruvate carboxylation enables growth of SDH-deficient cells by supporting aspartate biosynthesis. Nat Cell Biol 17, 1317-1326.
Chajes, V., Cambot, M., Moreau, K., Lenoir, G.M., and Joulin, V. (2006). Acetyl-CoA carboxylase alpha is essential to breast cancer cell survival. Cancer Res 66, 5287-5294.
Chan, M., Gravel, M., Bramoulle, A., Bridon, G., Avizonis, D., Shore, G.C., and Roulston, A. (2014). Synergy between the NAMPT inhibitor GMX1777(8) and pemetrexed in non-small cell lung cancer cells is mediated by PARP activation and enhanced NAD consumption. Cancer Res 74, 5948-5954.
Chen, J., Chung, F., Yang, G., Pu, M., Gao, H., Jiang, W., Yin, H., Capka, V., Kasibhatla, S., Laffitte, B., et al. (2013). Phosphoglycerate dehydrogenase is dispensable for breast tumor maintenance and growth. Oncotarget 4, 2502-2511.
Chiarugi, A., Dolle, C., Felici, R., and Ziegler, M. (2012). The NAD metabolome--a key determinant of cancer cell biology. Nat Rev Cancer 12, 741-752.
Chio, II, Jafarnejad, S.M., Ponz-Sarvise, M., Park, Y., Rivera, K., Palm, W., Wilson, J., Sangar, V., Hao, Y., Ohlund, D., et al. (2016). NRF2 Promotes Tumor Maintenance by Modulating mRNA Translation in Pancreatic Cancer. Cell 166, 963-976.
Chowdhury, R., Yeoh, K.K., Tian, Y.M., Hillringhaus, L., Bagg, E.A., Rose, N.R., Leung, I.K., Li, X.S., Woon, E.C., Yang, M., et al. (2011). The oncometabolite 2-hydroxyglutarate inhibits histone lysine demethylases. EMBO Rep 12, 463-469.
Christofk, H.R., Vander Heiden, M.G., Harris, M.H., Ramanathan, A., Gerszten, R.E., Wei, R., Fleming, M.D., Schreiber, S.L., and Cantley, L.C. (2008). The M2 splice isoform of pyruvate kinase is important for cancer metabolism and tumour growth. Nature 452, 230-233.

67
Cohade, C. (2010). Altered biodistribution on FDG-PET with emphasis on brown fat and insulin effect. Semin Nucl Med 40, 283-293.
Comerford, S.A., Huang, Z., Du, X., Wang, Y., Cai, L., Witkiewicz, A.K., Walters, H., Tantawy, M.N., Fu, A., Manning, H.C., et al. (2014). Acetate dependence of tumors. Cell 159, 1591-1602.
Cortes-Cros, M., Hemmerlin, C., Ferretti, S., Zhang, J., Gounarides, J.S., Yin, H., Muller, A., Haberkorn, A., Chene, P., Sellers, W.R., et al. (2013). M2 isoform of pyruvate kinase is dispensable for tumor maintenance and growth. Proc Natl Acad Sci U S A 110, 489-494.
d'Amico, A. (2015). Review of clinical practice utility of positron emission tomography with 18F-fluorodeoxyglucose in assessing tumour response to therapy. Radiol Med 120, 345-351.
Dang, L., White, D.W., Gross, S., Bennett, B.D., Bittinger, M.A., Driggers, E.M., Fantin, V.R., Jang, H.G., Jin, S., Keenan, M.C., et al. (2009). Cancer-associated IDH1 mutations produce 2-hydroxyglutarate. Nature 462, 739-744.
Dang, L., Yen, K., and Attar, E.C. (2016). IDH mutations in cancer and progress toward development of targeted therapeutics. Ann Oncol 27, 599-608.
Davidson, S.M., Papagiannakopoulos, T., Olenchock, B.A., Heyman, J.E., Keibler, M.A., Luengo, A., Bauer, M.R., Jha, A.K., O'Brien, J.P., Pierce, K.A., et al. (2016). Environment Impacts the Metabolic Dependencies of Ras-Driven Non-Small Cell Lung Cancer. Cell Metab 23, 517-528.
Daye, D., and Wellen, K.E. (2012). Metabolic reprogramming in cancer: unraveling the role of glutamine in tumorigenesis. Semin Cell Dev Biol 23, 362-369.
Dayton, T.L., Jacks, T., and Vander Heiden, M.G. (2016). PKM2, cancer metabolism, and the road ahead. EMBO Rep 17, 1721-1730.
DeBerardinis, R.J., and Chandel, N.S. (2016). Fundamentals of cancer metabolism. Sci Adv 2, e1600200.
DeBerardinis, R.J., and Cheng, T. (2010). Q's next: the diverse functions of glutamine in metabolism, cell biology and cancer. Oncogene 29, 313-324.
DeBerardinis, R.J., Mancuso, A., Daikhin, E., Nissim, I., Yudkoff, M., Wehrli, S., and Thompson, C.B. (2007). Beyond aerobic glycolysis: transformed cells can engage in glutamine metabolism that exceeds the requirement for protein and nucleotide synthesis. Proc Natl Acad Sci U S A 104, 19345-19350.

68
Delage, B., Fennell, D.A., Nicholson, L., McNeish, I., Lemoine, N.R., Crook, T., and Szlosarek, P.W. (2010). Arginine deprivation and argininosuccinate synthetase expression in the treatment of cancer. Int J Cancer 126, 2762-2772.
DeNicola, G.M., Chen, P.H., Mullarky, E., Sudderth, J.A., Hu, Z., Wu, D., Tang, H., Xie, Y., Asara, J.M., Huffman, K.E., et al. (2015). NRF2 regulates serine biosynthesis in non-small cell lung cancer. Nat Genet 47, 1475-1481.
DeNicola, G.M., Karreth, F.A., Humpton, T.J., Gopinathan, A., Wei, C., Frese, K., Mangal, D., Yu, K.H., Yeo, C.J., Calhoun, E.S., et al. (2011). Oncogene-induced Nrf2 transcription promotes ROS detoxification and tumorigenesis. Nature 475, 106-109.
Dey, P., Baddour, J., Muller, F., Wu, C.C., Wang, H., Liao, W.T., Lan, Z., Chen, A., Gutschner, T., Kang, Y., et al. (2017). Genomic deletion of malic enzyme 2 confers collateral lethality in pancreatic cancer. Nature 542, 119-123.
DiNardo, C.D., Ravandi, F., Agresta, S., Konopleva, M., Takahashi, K., Kadia, T., Routbort, M., Patel, K.P., Mark, B., Pierce, S., et al. (2015). Characteristics, clinical outcome, and prognostic significance of IDH mutations in AML. Am J Hematol 90, 732-736.
Dixon, S.J., Lemberg, K.M., Lamprecht, M.R., Skouta, R., Zaitsev, E.M., Gleason, C.E., Patel, D.N., Bauer, A.J., Cantley, A.M., Yang, W.S., et al. (2012). Ferroptosis: an iron-dependent form of nonapoptotic cell death. Cell 149, 1060-1072.
Dixon, S.J., Patel, D.N., Welsch, M., Skouta, R., Lee, E.D., Hayano, M., Thomas, A.G., Gleason, C.E., Tatonetti, N.P., Slusher, B.S., et al. (2014). Pharmacological inhibition of cystine-glutamate exchange induces endoplasmic reticulum stress and ferroptosis. Elife 3, e02523.
Doherty, J.R., and Cleveland, J.L. (2013). Targeting lactate metabolism for cancer therapeutics. J Clin Invest 123, 3685-3692.
Dolma, S., Lessnick, S.L., Hahn, W.C., and Stockwell, B.R. (2003). Identification of genotype-selective antitumor agents using synthetic lethal chemical screening in engineered human tumor cells. Cancer Cell 3, 285-296.
Ducker, G.S., Chen, L., Morscher, R.J., Ghergurovich, J.M., Esposito, M., Teng, X., Kang, Y., and Rabinowitz, J.D. (2016). Reversal of Cytosolic One-Carbon Flux Compensates for Loss of the Mitochondrial Folate Pathway. Cell Metab 23, 1140-1153.
69
Duvel, K., Yecies, J.L., Menon, S., Raman, P., Lipovsky, A.I., Souza, A.L., Triantafellow, E., Ma, Q., Gorski, R., Cleaver, S., et al. (2010). Activation of a metabolic gene regulatory network downstream of mTOR complex 1. Mol Cell 39, 171-183.
Eagle, H. (1955). The specific amino acid requirements of a human carcinoma cell (Stain HeLa) in tissue culture. J Exp Med 102, 37-48.
Efferth, T., Gebhart, E., Ross, D.D., and Sauerbrey, A. (2003). Identification of gene expression profiles predicting tumor cell response to L-alanosine. Biochem Pharmacol 66, 613-621.
Egler, R.A., Ahuja, S.P., and Matloub, Y. (2016). L-asparaginase in the treatment of patients with acute lymphoblastic leukemia. J Pharmacol Pharmacother 7, 62-71.
El-Mir, M.Y., Nogueira, V., Fontaine, E., Averet, N., Rigoulet, M., and Leverve, X. (2000). Dimethylbiguanide inhibits cell respiration via an indirect effect targeted on the respiratory chain complex I. J Biol Chem 275, 223-228.
Elion, G.B. (1989). The purine path to chemotherapy. Science 244, 41-47.
Evans, J.M., Donnelly, L.A., Emslie-Smith, A.M., Alessi, D.R., and Morris, A.D. (2005). Metformin and reduced risk of cancer in diabetic patients. BMJ 330, 1304-1305.
Fan, J., Ye, J., Kamphorst, J.J., Shlomi, T., Thompson, C.B., and Rabinowitz, J.D. (2014). Quantitative flux analysis reveals folate-dependent NADPH production. Nature 510, 298-302.
Fantin, V.R., St-Pierre, J., and Leder, P. (2006). Attenuation of LDH-A expression uncovers a link between glycolysis, mitochondrial physiology, and tumor maintenance. Cancer Cell 9, 425-434.
Farber, S., and Diamond, L.K. (1948). Temporary remissions in acute leukemia in children produced by folic acid antagonist, 4-aminopteroyl-glutamic acid. N Engl J Med 238, 787-793.
Farwell, M.D., Pryma, D.A., and Mankoff, D.A. (2014). PET/CT imaging in cancer: current applications and future directions. Cancer 120, 3433-3445.
Faubert, B., Li, K.Y., Cai, L., Hensley, C.T., Kim, J., Zacharias, L.G., Yang, C., Do, Q.N., Doucette, S., Burguete, D., et al. (2017). Lactate Metabolism in Human Lung Tumors. Cell 171, 358-371 e359.
70
Feun, L.G., Marini, A., Walker, G., Elgart, G., Moffat, F., Rodgers, S.E., Wu, C.J., You, M., Wangpaichitr, M., Kuo, M.T., et al. (2012). Negative argininosuccinate synthetase expression in melanoma tumours may predict clinical benefit from arginine-depleting therapy with pegylated arginine deiminase. Br J Cancer 106, 1481-1485.
Figueroa, M.E., Abdel-Wahab, O., Lu, C., Ward, P.S., Patel, J., Shih, A., Li, Y., Bhagwat, N., Vasanthakumar, A., Fernandez, H.F., et al. (2010). Leukemic IDH1 and IDH2 mutations result in a hypermethylation phenotype, disrupt TET2 function, and impair hematopoietic differentiation. Cancer Cell 18, 553-567.
Fine, B.M., Kaspers, G.J., Ho, M., Loonen, A.H., and Boxer, L.M. (2005). A genome-wide view of the in vitro response to l-asparaginase in acute lymphoblastic leukemia. Cancer Res 65, 291-299.
Franciosi, M., Lucisano, G., Lapice, E., Strippoli, G.F., Pellegrini, F., and Nicolucci, A. (2013). Metformin therapy and risk of cancer in patients with type 2 diabetes: systematic review. PLoS One 8, e71583.
Frezza, C., Zheng, L., Folger, O., Rajagopalan, K.N., MacKenzie, E.D., Jerby, L., Micaroni, M., Chaneton, B., Adam, J., Hedley, A., et al. (2011). Haem oxygenase is synthetically lethal with the tumour suppressor fumarate hydratase. Nature 477, 225-228.
Furuya, S. (2008). An essential role for de novo biosynthesis of L-serine in CNS development. Asia Pac J Clin Nutr 17 Suppl 1, 312-315.
Galluzzi, L., Kepp, O., Vander Heiden, M.G., and Kroemer, G. (2013). Metabolic targets for cancer therapy. Nat Rev Drug Discov 12, 829-846.
Gandini, S., Puntoni, M., Heckman-Stoddard, B.M., Dunn, B.K., Ford, L., DeCensi, A., and Szabo, E. (2014). Metformin and cancer risk and mortality: a systematic review and meta-analysis taking into account biases and confounders. Cancer Prev Res (Phila) 7, 867-885.
Gao, M., Tashiro, Y., Wang, Q., Sakai, K., and Sonomoto, K. (2016). High acetone-butanol-ethanol production in pH-stat co-feeding of acetate and glucose. J Biosci Bioeng 122, 176-182.
Gao, P., Tchernyshyov, I., Chang, T.C., Lee, Y.S., Kita, K., Ochi, T., Zeller, K.I., De Marzo, A.M., Van Eyk, J.E., Mendell, J.T., et al. (2009). c-Myc suppression of miR-23a/b enhances mitochondrial glutaminase expression and glutamine metabolism. Nature 458, 762-765.

71
Gaude, E., and Frezza, C. (2016). Tissue-specific and convergent metabolic transformation of cancer correlates with metastatic potential and patient survival. Nat Commun 7, 13041.
Golub, T.R., Slonim, D.K., Tamayo, P., Huard, C., Gaasenbeek, M., Mesirov, J.P., Coller, H., Loh, M.L., Downing, J.R., Caligiuri, M.A., et al. (1999). Molecular classification of cancer: class discovery and class prediction by gene expression monitoring. Science 286, 531-537.
Graczyk-Jarzynka, A., Zagozdzon, R., Muchowicz, A., Siernicka, M., Firczuk, M., and Juszczynski, P. (2017). New insights into redox homeostasis as a therapeutic target in B-cell malignancies. Curr Opin Hematol.
Grassian, A.R., Parker, S.J., Davidson, S.M., Divakaruni, A.S., Green, C.R., Zhang, X., Slocum, K.L., Pu, M., Lin, F., Vickers, C., et al. (2014). IDH1 mutations alter citric acid cycle metabolism and increase dependence on oxidative mitochondrial metabolism. Cancer Res 74, 3317-3331.
Gravel, S.P., Hulea, L., Toban, N., Birman, E., Blouin, M.J., Zakikhani, M., Zhao, Y., Topisirovic, I., St-Pierre, J., and Pollak, M. (2014). Serine deprivation enhances antineoplastic activity of biguanides. Cancer Res 74, 7521-7533.
Gross, M.I., Demo, S.D., Dennison, J.B., Chen, L., Chernov-Rogan, T., Goyal, B., Janes, J.R., Laidig, G.J., Lewis, E.R., Li, J., et al. (2014). Antitumor activity of the glutaminase inhibitor CB-839 in triple-negative breast cancer. Mol Cancer Ther 13, 890-901.
Gui, D.Y., Sullivan, L.B., Luengo, A., Hosios, A.M., Bush, L.N., Gitego, N., Davidson, S.M., Freinkman, E., Thomas, C.J., and Vander Heiden, M.G. (2016). Environment Dictates Dependence on Mitochondrial Complex I for NAD+ and Aspartate Production and Determines Cancer Cell Sensitivity to Metformin. Cell Metab 24, 716-727.
Hamanaka, R.B., and Chandel, N.S. (2012). Targeting glucose metabolism for cancer therapy. J Exp Med 209, 211-215.
Harasawa, H., Yamada, Y., Kudoh, M., Sugahara, K., Soda, H., Hirakata, Y., Sasaki, H., Ikeda, S., Matsuo, T., Tomonaga, M., et al. (2002). Chemotherapy targeting methylthioadenosine phosphorylase (MTAP) deficiency in adult T cell leukemia (ATL). Leukemia 16, 1799-1807.
Harris, I.S., Treloar, A.E., Inoue, S., Sasaki, M., Gorrini, C., Lee, K.C., Yung, K.Y., Brenner, D., Knobbe-Thomsen, C.B., Cox, M.A., et al. (2015). Glutathione and thioredoxin antioxidant pathways synergize to drive cancer initiation and progression. Cancer Cell 27, 211-222.

72
Harris, M. (1980). Pyruvate blocks expression of sensitivity to antimycin A and chloramphenicol. Somatic Cell Genet 6, 699-708.
Hattori, A., Tsunoda, M., Konuma, T., Kobayashi, M., Nagy, T., Glushka, J., Tayyari, F., McSkimming, D., Kannan, N., Tojo, A., et al. (2017). Cancer progression by reprogrammed BCAA metabolism in myeloid leukaemia. Nature 545, 500-504.
Hatzivassiliou, G., Zhao, F., Bauer, D.E., Andreadis, C., Shaw, A.N., Dhanak, D., Hingorani, S.R., Tuveson, D.A., and Thompson, C.B. (2005). ATP citrate lyase inhibition can suppress tumor cell growth. Cancer Cell 8, 311-321.
Hay, N. (2016). Reprogramming glucose metabolism in cancer: can it be exploited for cancer therapy? Nat Rev Cancer 16, 635-649.
Heidelberger, C., Chaudhuri, N.K., Danneberg, P., Mooren, D., Griesbach, L., Duschinsky, R., Schnitzer, R.J., Pleven, E., and Scheiner, J. (1957). Fluorinated pyrimidines, a new class of tumour-inhibitory compounds. Nature 179, 663-666.
Hensley, C.T., Faubert, B., Yuan, Q., Lev-Cohain, N., Jin, E., Kim, J., Jiang, L., Ko, B., Skelton, R., Loudat, L., et al. (2016). Metabolic Heterogeneity in Human Lung Tumors. Cell 164, 681-694.
Heuer, T.S., Ventura, R., Mordec, K., Lai, J., Fridlib, M., Buckley, D., and Kemble, G. (2017). FASN Inhibition and Taxane Treatment Combine to Enhance Anti-tumor Efficacy in Diverse Xenograft Tumor Models through Disruption of Tubulin Palmitoylation and Microtubule Organization and FASN Inhibition-Mediated Effects on Oncogenic Signaling and Gene Expression. EBioMedicine 16, 51-62.
Hewitson, K.S., Lienard, B.M., McDonough, M.A., Clifton, I.J., Butler, D., Soares, A.S., Oldham, N.J., McNeill, L.A., and Schofield, C.J. (2007). Structural and mechanistic studies on the inhibition of the hypoxia-inducible transcription factor hydroxylases by tricarboxylic acid cycle intermediates. J Biol Chem 282, 3293-3301.
Hoekstra, A.S., de Graaff, M.A., Briaire-de Bruijn, I.H., Ras, C., Seifar, R.M., van Minderhout, I., Cornelisse, C.J., Hogendoorn, P.C., Breuning, M.H., Suijker, J., et al. (2015). Inactivation of SDH and FH cause loss of 5hmC and increased H3K9me3 in paraganglioma/pheochromocytoma and smooth muscle tumors. Oncotarget 6, 38777-38788.
Hori, H., Tran, P., Carrera, C.J., Hori, Y., Rosenbach, M.D., Carson, D.A., and Nobori, T. (1996). Methylthioadenosine phosphorylase cDNA transfection alters sensitivity to depletion of purine and methionine in A549 lung cancer cells. Cancer Res 56, 5653-5658.
73
Hosios, A.M., Hecht, V.C., Danai, L.V., Johnson, M.O., Rathmell, J.C., Steinhauser, M.L., Manalis, S.R., and Vander Heiden, M.G. (2016). Amino Acids Rather than Glucose Account for the Majority of Cell Mass in Proliferating Mammalian Cells. Dev Cell 36, 540-549.
Hosios, A.M., and Vander Heiden, M.G. (2014). Acetate metabolism in cancer cells. Cancer Metab 2, 27.
Howell, N., and Sager, R. (1979). Cytoplasmic genetics of mammalian cells: conditional sensitivity to mitochondrial inhibitors and isolation of new mutant phenotypes. Somatic Cell Genet 5, 833-845.
Hsu, P.P., and Sabatini, D.M. (2008). Cancer cell metabolism: Warburg and beyond. Cell 134, 703-707.
Hu, J., Locasale, J.W., Bielas, J.H., O'Sullivan, J., Sheahan, K., Cantley, L.C., Vander Heiden, M.G., and Vitkup, D. (2013). Heterogeneity of tumor-induced gene expression changes in the human metabolic network. Nat Biotechnol 31, 522-529.
Hu, W., Zhang, C., Wu, R., Sun, Y., Levine, A., and Feng, Z. (2010). Glutaminase 2, a novel p53 target gene regulating energy metabolism and antioxidant function. Proc Natl Acad Sci U S A 107, 7455-7460.
Huang, X., Wullschleger, S., Shpiro, N., McGuire, V.A., Sakamoto, K., Woods, Y.L., McBurnie, W., Fleming, S., and Alessi, D.R. (2008). Important role of the LKB1-AMPK pathway in suppressing tumorigenesis in PTEN-deficient mice. Biochem J 412, 211-221.
Irani, K., Xia, Y., Zweier, J.L., Sollott, S.J., Der, C.J., Fearon, E.R., Sundaresan, M., Finkel, T., and Goldschmidt-Clermont, P.J. (1997). Mitogenic signaling mediated by oxidants in Ras-transformed fibroblasts. Science 275, 1649-1652.
Israelsen, W.J., Dayton, T.L., Davidson, S.M., Fiske, B.P., Hosios, A.M., Bellinger, G., Li, J., Yu, Y., Sasaki, M., Horner, J.W., et al. (2013). PKM2 isoform-specific deletion reveals a differential requirement for pyruvate kinase in tumor cells. Cell 155, 397-409.
Israelsen, W.J., and Vander Heiden, M.G. (2015). Pyruvate kinase: Function, regulation and role in cancer. Semin Cell Dev Biol 43, 43-51.
Izzo, F., Marra, P., Beneduce, G., Castello, G., Vallone, P., De Rosa, V., Cremona, F., Ensor, C.M., Holtsberg, F.W., Bomalaski, J.S., et al. (2004). Pegylated arginine deiminase treatment of patients with unresectable hepatocellular carcinoma: results from phase I/II studies. J Clin Oncol 22, 1815-1822.

74
Jacque, N., Ronchetti, A.M., Larrue, C., Meunier, G., Birsen, R., Willems, L., Saland, E., Decroocq, J., Maciel, T.T., Lambert, M., et al. (2015). Targeting glutaminolysis has antileukemic activity in acute myeloid leukemia and synergizes with BCL-2 inhibition. Blood 126, 1346-1356.
Jain, M., Nilsson, R., Sharma, S., Madhusudhan, N., Kitami, T., Souza, A.L., Kafri, R., Kirschner, M.W., Clish, C.B., and Mootha, V.K. (2012). Metabolite profiling identifies a key role for glycine in rapid cancer cell proliferation. Science 336, 1040-1044.
Janke, R., Iavarone, A.T., and Rine, J. (2017). Oncometabolite D-2-Hydroxyglutarate enhances gene silencing through inhibition of specific H3K36 histone demethylases. Elife 6.
Jeon, S.M., Chandel, N.S., and Hay, N. (2012). AMPK regulates NADPH homeostasis to promote tumour cell survival during energy stress. Nature 485, 661-665.
Jiralerspong, S., Palla, S.L., Giordano, S.H., Meric-Bernstam, F., Liedtke, C., Barnett, C.M., Hsu, L., Hung, M.C., Hortobagyi, G.N., and Gonzalez-Angulo, A.M. (2009). Metformin and pathologic complete responses to neoadjuvant chemotherapy in diabetic patients with breast cancer. J Clin Oncol 27, 3297-3302.
Johnson, B.E., Mazor, T., Hong, C., Barnes, M., Aihara, K., McLean, C.Y., Fouse, S.D., Yamamoto, S., Ueda, H., Tatsuno, K., et al. (2014). Mutational analysis reveals the origin and therapy-driven evolution of recurrent glioma. Science 343, 189-193.
Juvekar, A., Hu, H., Yadegarynia, S., Lyssiotis, C.A., Ullas, S., Lien, E.C., Bellinger, G., Son, J., Hok, R.C., Seth, P., et al. (2016). Phosphoinositide 3-kinase inhibitors induce DNA damage through nucleoside depletion. Proc Natl Acad Sci U S A 113, E4338-4347.
Kamphorst, J.J., Chung, M.K., Fan, J., and Rabinowitz, J.D. (2014). Quantitative analysis of acetyl-CoA production in hypoxic cancer cells reveals substantial contribution from acetate. Cancer Metab 2, 23.
Karisch, R., Fernandez, M., Taylor, P., Virtanen, C., St-Germain, J.R., Jin, L.L., Harris, I.S., Mori, J., Mak, T.W., Senis, Y.A., et al. (2011). Global proteomic assessment of the classical protein-tyrosine phosphatome and "Redoxome". Cell 146, 826-840.

75
Kennedy, K.M., Scarbrough, P.M., Ribeiro, A., Richardson, R., Yuan, H., Sonveaux, P., Landon, C.D., Chi, J.T., Pizzo, S., Schroeder, T., et al. (2013). Catabolism of exogenous lactate reveals it as a legitimate metabolic substrate in breast cancer. PLoS One 8, e75154.
Kim, J., Hu, Z., Cai, L., Li, K., Choi, E., Faubert, B., Bezwada, D., Rodriguez-Canales, J., Villalobos, P., Lin, Y.F., et al. (2017). CPS1 maintains pyrimidine pools and DNA synthesis in KRAS/LKB1-mutant lung cancer cells. Nature 546, 168-172.
Kindler, H.L., Burris, H.A., 3rd, Sandler, A.B., and Oliff, I.A. (2009). A phase II multicenter study of L-alanosine, a potent inhibitor of adenine biosynthesis, in patients with MTAP-deficient cancer. Invest New Drugs 27, 75-81.
Koivunen, P., Lee, S., Duncan, C.G., Lopez, G., Lu, G., Ramkissoon, S., Losman, J.A., Joensuu, P., Bergmann, U., Gross, S., et al. (2012). Transformation by the (R)-enantiomer of 2-hydroxyglutarate linked to EGLN activation. Nature 483, 484-488.
Kremer, J.C., Prudner, B.C., Lange, S.E., Bean, G.R., Schultze, M.B., Brashears, C.B., Radyk, M.D., Redlich, N., Tzeng, S.C., Kami, K., et al. (2017). Arginine Deprivation Inhibits the Warburg Effect and Upregulates Glutamine Anaplerosis and Serine Biosynthesis in ASS1-Deficient Cancers. Cell Rep 18, 991-1004.
Kroll, W., Loffler, M., and Schneider, F. (1983). Energy parameters, macromolecular synthesis and cell cycle progression of in vitro grown Ehrlich ascites tumor cells after inhibition of oxidative ATP synthesis by oligomycin. Z Naturforsch C 38, 604-612.
Kroon, E., Krosl, J., Thorsteinsdottir, U., Baban, S., Buchberg, A.M., and Sauvageau, G. (1998). Hoxa9 transforms primary bone marrow cells through specific collaboration with Meis1a but not Pbx1b. EMBO J 17, 3714-3725.
Kryukov, G.V., Wilson, F.H., Ruth, J.R., Paulk, J., Tsherniak, A., Marlow, S.E., Vazquez, F., Weir, B.A., Fitzgerald, M.E., Tanaka, M., et al. (2016). MTAP deletion confers enhanced dependency on the PRMT5 arginine methyltransferase in cancer cells. Science 351, 1214-1218.
Kuhajda, F.P., Jenner, K., Wood, F.D., Hennigar, R.A., Jacobs, L.B., Dick, J.D., and Pasternack, G.R. (1994). Fatty acid synthesis: a potential selective target for antineoplastic therapy. Proc Natl Acad Sci U S A 91, 6379-6383.
Kung, C., Hixon, J., Choe, S., Marks, K., Gross, S., Murphy, E., DeLaBarre, B., Cianchetta, G., Sethumadhavan, S., Wang, X., et al. (2012). Small molecule activation of PKM2 in cancer cells induces serine auxotrophy. Chem Biol 19, 1187-1198.
76
Labuschagne, C.F., van den Broek, N.J., Mackay, G.M., Vousden, K.H., and Maddocks, O.D. (2014). Serine, but not glycine, supports one-carbon metabolism and proliferation of cancer cells. Cell Rep 7, 1248-1258.
Landau, B.R., Laszlo, J., Stengle, J., and Burk, D. (1958). Certain metabolic and pharmacologic effects in cancer patients given infusions of 2-deoxy-D-glucose. J Natl Cancer Inst 21, 485-494.
Lau, A.N., Israelsen, W.J., Roper, J., Sinnamon, M.J., Georgeon, L., Dayton, T.L., Hillis, A.L., Yilmaz, O.H., Di Vizio, D., Hung, K.E., et al. (2017). PKM2 is not required for colon cancer initiated by APC loss. Cancer Metab 5, 10.
Le, A., Lane, A.N., Hamaker, M., Bose, S., Gouw, A., Barbi, J., Tsukamoto, T., Rojas, C.J., Slusher, B.S., Zhang, H., et al. (2012). Glucose-independent glutamine metabolism via TCA cycling for proliferation and survival in B cells. Cell Metab 15, 110-121.
Lee, J.H., Kim, T.I., Jeon, S.M., Hong, S.P., Cheon, J.H., and Kim, W.H. (2012). The effects of metformin on the survival of colorectal cancer patients with diabetes mellitus. Int J Cancer 131, 752-759.
Leonard, P.G., Satani, N., Maxwell, D., Lin, Y.H., Hammoudi, N., Peng, Z., Pisaneschi, F., Link, T.M., Lee, G.R.t., Sun, D., et al. (2016). SF2312 is a natural phosphonate inhibitor of enolase. Nat Chem Biol 12, 1053-1058.
Letouze, E., Martinelli, C., Loriot, C., Burnichon, N., Abermil, N., Ottolenghi, C., Janin, M., Menara, M., Nguyen, A.T., Benit, P., et al. (2013). SDH mutations establish a hypermethylator phenotype in paraganglioma. Cancer Cell 23, 739-752.
Lewis, C.A., Parker, S.J., Fiske, B.P., McCloskey, D., Gui, D.Y., Green, C.R., Vokes, N.I., Feist, A.M., Vander Heiden, M.G., and Metallo, C.M. (2014). Tracing compartmentalized NADPH metabolism in the cytosol and mitochondria of mammalian cells. Mol Cell 55, 253-263.
Lien, E.C., Lyssiotis, C.A., Juvekar, A., Hu, H., Asara, J.M., Cantley, L.C., and Toker, A. (2016). Glutathione biosynthesis is a metabolic vulnerability in PI(3)K/Akt-driven breast cancer. Nat Cell Biol 18, 572-578.
Livingston, R.B., Venditti, J.M., Cooney, D.A., and Carter, S.K. (1970). Glutamine antagonists in chemotherapy. Adv Pharmacol Chemother 8, 57-120.
Locasale, J.W., Grassian, A.R., Melman, T., Lyssiotis, C.A., Mattaini, K.R., Bass, A.J., Heffron, G., Metallo, C.M., Muranen, T., Sharfi, H., et al. (2011). Phosphoglycerate dehydrogenase diverts glycolytic flux and contributes to oncogenesis. Nat Genet 43, 869-874.

77
Locke, M., Ghazaly, E., Freitas, M.O., Mitsinga, M., Lattanzio, L., Lo Nigro, C., Nagano, A., Wang, J., Chelala, C., Szlosarek, P., et al. (2016). Inhibition of the Polyamine Synthesis Pathway Is Synthetically Lethal with Loss of Argininosuccinate Synthase 1. Cell Rep 16, 1604-1613.
Loffer, M., and Schneider, F. (1982). Further characterization of the growth inhibitory effect of rotenone on in vitro cultured Ehrlich ascites tumour cells. Mol Cell Biochem 48, 77-90.
Long, Y., Tsai, W.B., Wangpaichitr, M., Tsukamoto, T., Savaraj, N., Feun, L.G., and Kuo, M.T. (2013). Arginine deiminase resistance in melanoma cells is associated with metabolic reprogramming, glucose dependence, and glutamine addiction. Mol Cancer Ther 12, 2581-2590.
Losman, J.A., and Kaelin, W.G., Jr. (2013). What a difference a hydroxyl makes: mutant IDH, (R)-2-hydroxyglutarate, and cancer. Genes Dev 27, 836-852.
Losman, J.A., Looper, R.E., Koivunen, P., Lee, S., Schneider, R.K., McMahon, C., Cowley, G.S., Root, D.E., Ebert, B.L., and Kaelin, W.G., Jr. (2013). (R)-2-hydroxyglutarate is sufficient to promote leukemogenesis and its effects are reversible. Science 339, 1621-1625.
Lu, C., Ward, P.S., Kapoor, G.S., Rohle, D., Turcan, S., Abdel-Wahab, O., Edwards, C.R., Khanin, R., Figueroa, M.E., Melnick, A., et al. (2012). IDH mutation impairs histone demethylation and results in a block to cell differentiation. Nature 483, 474-478.
Lubin, M., and Lubin, A. (2009). Selective killing of tumors deficient in methylthioadenosine phosphorylase: a novel strategy. PLoS One 4, e5735.
Luengo, A., Sullivan, L.B., and Heiden, M.G. (2014). Understanding the complex-I-ty of metformin action: limiting mitochondrial respiration to improve cancer therapy. BMC Biol 12, 82.
Lunt, S.Y., and Vander Heiden, M.G. (2011). Aerobic glycolysis: meeting the metabolic requirements of cell proliferation. Annu Rev Cell Dev Biol 27, 441-464.
Lussey-Lepoutre, C., Hollinshead, K.E., Ludwig, C., Menara, M., Morin, A., Castro-Vega, L.J., Parker, S.J., Janin, M., Martinelli, C., Ottolenghi, C., et al. (2015). Loss of succinate dehydrogenase activity results in dependency on pyruvate carboxylation for cellular anabolism. Nat Commun 6, 8784.

78
Lycan, T.W., Pardee, T.S., Petty, W.J., Bonomi, M., Alistar, A., Lamar, Z.S., Isom, S., Chan, M.D., Miller, A.A., and Ruiz, J. (2016). A Phase II Clinical Trial of CPI-613 in Patients with Relapsed or Refractory Small Cell Lung Carcinoma. PLoS One 11, e0164244.
Maddocks, O.D., Berkers, C.R., Mason, S.M., Zheng, L., Blyth, K., Gottlieb, E., and Vousden, K.H. (2013). Serine starvation induces stress and p53-dependent metabolic remodelling in cancer cells. Nature 493, 542-546.
Maddocks, O.D.K., Athineos, D., Cheung, E.C., Lee, P., Zhang, T., van den Broek, N.J.F., Mackay, G.M., Labuschagne, C.F., Gay, D., Kruiswijk, F., et al. (2017). Modulating the therapeutic response of tumours to dietary serine and glycine starvation. Nature 544, 372-376.
Marchiq, I., and Pouyssegur, J. (2016). Hypoxia, cancer metabolism and the therapeutic benefit of targeting lactate/H(+) symporters. J Mol Med (Berl) 94, 155-171.
Mardis, E.R., Ding, L., Dooling, D.J., Larson, D.E., McLellan, M.D., Chen, K., Koboldt, D.C., Fulton, R.S., Delehaunty, K.D., McGrath, S.D., et al. (2009). Recurring mutations found by sequencing an acute myeloid leukemia genome. N Engl J Med 361, 1058-1066.
Marin-Valencia, I., Yang, C., Mashimo, T., Cho, S., Baek, H., Yang, X.L., Rajagopalan, K.N., Maddie, M., Vemireddy, V., Zhao, Z., et al. (2012). Analysis of tumor metabolism reveals mitochondrial glucose oxidation in genetically diverse human glioblastomas in the mouse brain in vivo. Cell Metab 15, 827-837.
Marjon, K., Cameron, M.J., Quang, P., Clasquin, M.F., Mandley, E., Kunii, K., McVay, M., Choe, S., Kernytsky, A., Gross, S., et al. (2016). MTAP Deletions in Cancer Create Vulnerability to Targeting of the MAT2A/PRMT5/RIOK1 Axis. Cell Rep 15, 574-587.
Martinez-Outschoorn, U.E., Peiris-Pages, M., Pestell, R.G., Sotgia, F., and Lisanti, M.P. (2017). Cancer metabolism: a therapeutic perspective. Nat Rev Clin Oncol 14, 11-31.
Mashimo, T., Pichumani, K., Vemireddy, V., Hatanpaa, K.J., Singh, D.K., Sirasanagandla, S., Nannepaga, S., Piccirillo, S.G., Kovacs, Z., Foong, C., et al. (2014). Acetate is a bioenergetic substrate for human glioblastoma and brain metastases. Cell 159, 1603-1614.

79
Mathur, D., Stratikopoulos, E., Ozturk, S., Steinbach, N., Pegno, S., Schoenfeld, S., Yong, R., Murty, V.V., Asara, J.M., Cantley, L.C., et al. (2017). PTEN Regulates Glutamine Flux to Pyrimidine Synthesis and Sensitivity to Dihydroorotate Dehydrogenase Inhibition. Cancer Discov 7, 380-390.
Mattaini, K.R., Brignole, E.J., Kini, M., Davidson, S.M., Fiske, B.P., Drennan, C.L., and Vander Heiden, M.G. (2015). An epitope tag alters phosphoglycerate dehydrogenase structure and impairs ability to support cell proliferation. Cancer Metab 3, 5.
Mavrakis, K.J., McDonald, E.R., 3rd, Schlabach, M.R., Billy, E., Hoffman, G.R., deWeck, A., Ruddy, D.A., Venkatesan, K., Yu, J., McAllister, G., et al. (2016). Disordered methionine metabolism in MTAP/CDKN2A-deleted cancers leads to dependence on PRMT5. Science 351, 1208-1213.
Mayers, J.R., Torrence, M.E., Danai, L.V., Papagiannakopoulos, T., Davidson, S.M., Bauer, M.R., Lau, A.N., Ji, B.W., Dixit, P.D., Hosios, A.M., et al. (2016). Tissue of origin dictates branched-chain amino acid metabolism in mutant Kras-driven cancers. Science 353, 1161-1165.
Medes, G., Thomas, A., and Weinhouse, S. (1953). Metabolism of neoplastic tissue. IV. A study of lipid synthesis in neoplastic tissue slices in vitro. Cancer Res 13, 27-29.
Menendez, J.A., and Lupu, R. (2006). Oncogenic properties of the endogenous fatty acid metabolism: molecular pathology of fatty acid synthase in cancer cells. Curr Opin Clin Nutr Metab Care 9, 346-357.
Migita, T., Narita, T., Nomura, K., Miyagi, E., Inazuka, F., Matsuura, M., Ushijima, M., Mashima, T., Seimiya, H., Satoh, Y., et al. (2008). ATP citrate lyase: activation and therapeutic implications in non-small cell lung cancer. Cancer Res 68, 8547-8554.
Mockler, M.B., Conroy, M.J., and Lysaght, J. (2014). Targeting T cell immunometabolism for cancer immunotherapy; understanding the impact of the tumor microenvironment. Front Oncol 4, 107.
Molenaar, R.J., Botman, D., Smits, M.A., Hira, V.V., van Lith, S.A., Stap, J., Henneman, P., Khurshed, M., Lenting, K., Mul, A.N., et al. (2015). Radioprotection of IDH1-Mutated Cancer Cells by the IDH1-Mutant Inhibitor AGI-5198. Cancer Res 75, 4790-4802.
Muir, A., Danai, L.V., Gui, D.Y., Waingarten, C.Y., Lewis, C.A., and Vander Heiden, M.G. (2017). Environmental cystine drives glutamine anaplerosis and sensitizes cancer cells to glutaminase inhibition. Elife 6.

80
Mullarky, E., Lucki, N.C., Beheshti Zavareh, R., Anglin, J.L., Gomes, A.P., Nicolay, B.N., Wong, J.C., Christen, S., Takahashi, H., Singh, P.K., et al. (2016). Identification of a small molecule inhibitor of 3-phosphoglycerate dehydrogenase to target serine biosynthesis in cancers. Proc Natl Acad Sci U S A 113, 1778-1783.
Muller, F.L., Aquilanti, E.A., and DePinho, R.A. (2015). Collateral Lethality: A new therapeutic strategy in oncology. Trends Cancer 1, 161-173.
Muller, F.L., Colla, S., Aquilanti, E., Manzo, V.E., Genovese, G., Lee, J., Eisenson, D., Narurkar, R., Deng, P., Nezi, L., et al. (2012). Passenger deletions generate therapeutic vulnerabilities in cancer. Nature 488, 337-342.
Nahimana, A., Attinger, A., Aubry, D., Greaney, P., Ireson, C., Thougaard, A.V., Tjornelund, J., Dawson, K.M., Dupuis, M., and Duchosal, M.A. (2009). The NAD biosynthesis inhibitor APO866 has potent antitumor activity against hematologic malignancies. Blood 113, 3276-3286.
Neuman, R.E., and McCoy, T.A. (1956). Dual requirement of Walker carcinosarcoma 256 in vitro for asparagine and glutamine. Science 124, 124-125.
Newsholme, E.A., Crabtree, B., and Ardawi, M.S. (1985). The role of high rates of glycolysis and glutamine utilization in rapidly dividing cells. Biosci Rep 5, 393-400.
Noe, D.A., Rowinsky, E.K., Shen, H.S., Clarke, B.V., Grochow, L.B., McGuire, W.B., Hantel, A., Adams, D.B., Abeloff, M.D., Ettinger, D.S., et al. (1990). Phase I and pharmacokinetic study of brequinar sodium (NSC 368390). Cancer Res 50, 4595-4599.
Noto, H., Goto, A., Tsujimoto, T., and Noda, M. (2012). Cancer risk in diabetic patients treated with metformin: a systematic review and meta-analysis. PLoS One 7, e33411.
O'Dwyer, P.J., Alonso, M.T., and Leyland-Jones, B. (1984). Acivicin: a new glutamine antagonist in clinical trials. J Clin Oncol 2, 1064-1071.
Okoye-Okafor, U.C., Bartholdy, B., Cartier, J., Gao, E.N., Pietrak, B., Rendina, A.R., Rominger, C., Quinn, C., Smallwood, A., Wiggall, K.J., et al. (2015). New IDH1 mutant inhibitors for treatment of acute myeloid leukemia. Nat Chem Biol 11, 878-886.
Ookhtens, M., Kannan, R., Lyon, I., and Baker, N. (1984). Liver and adipose tissue contributions to newly formed fatty acids in an ascites tumor. Am J Physiol 247, R146-153.

81
Ott, P.A., Carvajal, R.D., Pandit-Taskar, N., Jungbluth, A.A., Hoffman, E.W., Wu, B.W., Bomalaski, J.S., Venhaus, R., Pan, L., Old, L.J., et al. (2013). Phase I/II study of pegylated arginine deiminase (ADI-PEG 20) in patients with advanced melanoma. Invest New Drugs 31, 425-434.
Owen, M.R., Doran, E., and Halestrap, A.P. (2000). Evidence that metformin exerts its anti-diabetic effects through inhibition of complex 1 of the mitochondrial respiratory chain. Biochem J 348 Pt 3, 607-614.
Pacold, M.E., Brimacombe, K.R., Chan, S.H., Rohde, J.M., Lewis, C.A., Swier, L.J., Possemato, R., Chen, W.W., Sullivan, L.B., Fiske, B.P., et al. (2016). A PHGDH inhibitor reveals coordination of serine synthesis and one-carbon unit fate. Nat Chem Biol 12, 452-458.
Pardee, T.S., Lee, K., Luddy, J., Maturo, C., Rodriguez, R., Isom, S., Miller, L.D., Stadelman, K.M., Levitan, D., Hurd, D., et al. (2014). A phase I study of the first-in-class antimitochondrial metabolism agent, CPI-613, in patients with advanced hematologic malignancies. Clin Cancer Res 20, 5255-5264.
Parker, W.B. (2009). Enzymology of purine and pyrimidine antimetabolites used in the treatment of cancer. Chem Rev 109, 2880-2893.
Pavlova, N.N., and Thompson, C.B. (2016). The Emerging Hallmarks of Cancer Metabolism. Cell Metab 23, 27-47.
Pelicano, H., Martin, D.S., Xu, R.H., and Huang, P. (2006). Glycolysis inhibition for anticancer treatment. Oncogene 25, 4633-4646.
Peters, G.J., Nadal, J.C., Laurensse, E.J., de Kant, E., and Pinedo, H.M. (1990). Retention of in vivo antipyrimidine effects of Brequinar sodium (DUP-785; NSC 368390) in murine liver, bone marrow and colon cancer. Biochem Pharmacol 39, 135-144.
Peters, G.J., van der Wilt, C.L., van Moorsel, C.J., Kroep, J.R., Bergman, A.M., and Ackland, S.P. (2000). Basis for effective combination cancer chemotherapy with antimetabolites. Pharmacol Ther 87, 227-253.
Phillips, M.M., Sheaff, M.T., and Szlosarek, P.W. (2013). Targeting arginine-dependent cancers with arginine-degrading enzymes: opportunities and challenges. Cancer Res Treat 45, 251-262.
Pinheiro, C., Longatto-Filho, A., Azevedo-Silva, J., Casal, M., Schmitt, F.C., and Baltazar, F. (2012). Role of monocarboxylate transporters in human cancers: state of the art. J Bioenerg Biomembr 44, 127-139.

82
Piskounova, E., Agathocleous, M., Murphy, M.M., Hu, Z., Huddlestun, S.E., Zhao, Z., Leitch, A.M., Johnson, T.M., DeBerardinis, R.J., and Morrison, S.J. (2015). Oxidative stress inhibits distant metastasis by human melanoma cells. Nature 527, 186-191.
Pollard, P.J., Briere, J.J., Alam, N.A., Barwell, J., Barclay, E., Wortham, N.C., Hunt, T., Mitchell, M., Olpin, S., Moat, S.J., et al. (2005). Accumulation of Krebs cycle intermediates and over-expression of HIF1alpha in tumours which result from germline FH and SDH mutations. Hum Mol Genet 14, 2231-2239.
Possemato, R., Marks, K.M., Shaul, Y.D., Pacold, M.E., Kim, D., Birsoy, K., Sethumadhavan, S., Woo, H.K., Jang, H.G., Jha, A.K., et al. (2011). Functional genomics reveal that the serine synthesis pathway is essential in breast cancer. Nature 476, 346-350.
Quivoron, C., David, M., Straley, K., Travins, J., Kim, H., Chen, Y., Zhu, D., Saada, V., Bawa, O., Opolon, P., et al. (2014). AG-221, an Oral, Selective, First-in-Class, Potent IDH2-R140Q Mutant Inhibitor, Induces Differentiation in a Xenotransplant Model. Blood 124, 3735-3735.
Rabbani, N., and Thornalley, P.J. (2014). Dicarbonyl proteome and genome damage in metabolic and vascular disease. Biochem Soc Trans 42, 425-432.
Rabinovich, S., Adler, L., Yizhak, K., Sarver, A., Silberman, A., Agron, S., Stettner, N., Sun, Q., Brandis, A., Helbling, D., et al. (2015). Diversion of aspartate in ASS1-deficient tumours fosters de novo pyrimidine synthesis. Nature 527, 379-383.
Raez, L.E., Papadopoulos, K., Ricart, A.D., Chiorean, E.G., Dipaola, R.S., Stein, M.N., Rocha Lima, C.M., Schlesselman, J.J., Tolba, K., Langmuir, V.K., et al. (2013). A phase I dose-escalation trial of 2-deoxy-D-glucose alone or combined with docetaxel in patients with advanced solid tumors. Cancer Chemother Pharmacol 71, 523-530.
Raj, L., Ide, T., Gurkar, A.U., Foley, M., Schenone, M., Li, X., Tolliday, N.J., Golub, T.R., Carr, S.A., Shamji, A.F., et al. (2011). Selective killing of cancer cells by a small molecule targeting the stress response to ROS. Nature 475, 231-234.
Robitaille, A.M., Christen, S., Shimobayashi, M., Cornu, M., Fava, L.L., Moes, S., Prescianotto-Baschong, C., Sauer, U., Jenoe, P., and Hall, M.N. (2013). Quantitative phosphoproteomics reveal mTORC1 activates de novo pyrimidine synthesis. Science 339, 1320-1323.

83
Rohle, D., Popovici-Muller, J., Palaskas, N., Turcan, S., Grommes, C., Campos, C., Tsoi, J., Clark, O., Oldrini, B., Komisopoulou, E., et al. (2013). An inhibitor of mutant IDH1 delays growth and promotes differentiation of glioma cells. Science 340, 626-630.
Röhrig, F., and Schulze, A. (2016). The multifaceted roles of fatty acid synthesis in cancer. Nat Rev Cancer 16, 732-749.
Saha, S.K., Parachoniak, C.A., Ghanta, K.S., Fitamant, J., Ross, K.N., Najem, M.S., Gurumurthy, S., Akbay, E.A., Sia, D., Cornella, H., et al. (2014). Mutant IDH inhibits HNF-4alpha to block hepatocyte differentiation and promote biliary cancer. Nature 513, 110-114.
Samanta, D., Park, Y., Andrabi, S.A., Shelton, L.M., Gilkes, D.M., and Semenza, G.L. (2016). PHGDH Expression Is Required for Mitochondrial Redox Homeostasis, Breast Cancer Stem Cell Maintenance, and Lung Metastasis. Cancer Res 76, 4430-4442.
Sancho, P., Burgos-Ramos, E., Tavera, A., Bou Kheir, T., Jagust, P., Schoenhals, M., Barneda, D., Sellers, K., Campos-Olivas, R., Grana, O., et al. (2015). MYC/PGC-1alpha Balance Determines the Metabolic Phenotype and Plasticity of Pancreatic Cancer Stem Cells. Cell Metab 22, 590-605.
Schockel, L., Glasauer, A., Basit, F., Bitschar, K., Truong, H., Erdmann, G., Algire, C., Hagebarth, A., Willems, P.H., Kopitz, C., et al. (2015). Targeting mitochondrial complex I using BAY 87-2243 reduces melanoma tumor growth. Cancer Metab 3, 11.
Schug, Z.T., Peck, B., Jones, D.T., Zhang, Q., Grosskurth, S., Alam, I.S., Goodwin, L.M., Smethurst, E., Mason, S., Blyth, K., et al. (2015). Acetyl-CoA synthetase 2 promotes acetate utilization and maintains cancer cell growth under metabolic stress. Cancer Cell 27, 57-71.
Selak, M.A., Armour, S.M., MacKenzie, E.D., Boulahbel, H., Watson, D.G., Mansfield, K.D., Pan, Y., Simon, M.C., Thompson, C.B., and Gottlieb, E. (2005). Succinate links TCA cycle dysfunction to oncogenesis by inhibiting HIF-alpha prolyl hydroxylase. Cancer Cell 7, 77-85.
Sellers, K., Fox, M.P., Bousamra, M., 2nd, Slone, S.P., Higashi, R.M., Miller, D.M., Wang, Y., Yan, J., Yuneva, M.O., Deshpande, R., et al. (2015). Pyruvate carboxylase is critical for non-small-cell lung cancer proliferation. J Clin Invest 125, 687-698.

84
Shackelford, D.B., Abt, E., Gerken, L., Vasquez, D.S., Seki, A., Leblanc, M., Wei, L., Fishbein, M.C., Czernin, J., Mischel, P.S., et al. (2013). LKB1 inactivation dictates therapeutic response of non-small cell lung cancer to the metabolism drug phenformin. Cancer Cell 23, 143-158.
Shen, L.J., Lin, W.C., Beloussow, K., and Shen, W.C. (2003). Resistance to the anti-proliferative activity of recombinant arginine deiminase in cell culture correlates with the endogenous enzyme, argininosuccinate synthetase. Cancer Lett 191, 165-170.
Shim, H., Dolde, C., Lewis, B.C., Wu, C.S., Dang, G., Jungmann, R.A., Dalla-Favera, R., and Dang, C.V. (1997). c-Myc transactivation of LDH-A: implications for tumor metabolism and growth. Proc Natl Acad Sci U S A 94, 6658-6663.
Snell, K. (1984). Enzymes of serine metabolism in normal, developing and neoplastic rat tissues. Adv Enzyme Regul 22, 325-400.
Snell, K., Natsumeda, Y., Eble, J.N., Glover, J.L., and Weber, G. (1988). Enzymic imbalance in serine metabolism in human colon carcinoma and rat sarcoma. Br J Cancer 57, 87-90.
Snell, K., Natsumeda, Y., and Weber, G. (1987). The modulation of serine metabolism in hepatoma 3924A during different phases of cellular proliferation in culture. Biochem J 245, 609-612.
Sonveaux, P., Vegran, F., Schroeder, T., Wergin, M.C., Verrax, J., Rabbani, Z.N., De Saedeleer, C.J., Kennedy, K.M., Diepart, C., Jordan, B.F., et al. (2008). Targeting lactate-fueled respiration selectively kills hypoxic tumor cells in mice. J Clin Invest 118, 3930-3942.
Sousa, C.M., Biancur, D.E., Wang, X., Halbrook, C.J., Sherman, M.H., Zhang, L., Kremer, D., Hwang, R.F., Witkiewicz, A.K., Ying, H., et al. (2016). Pancreatic stellate cells support tumour metabolism through autophagic alanine secretion. Nature 536, 479-483.
Stams, W.A., den Boer, M.L., Beverloo, H.B., Meijerink, J.P., Stigter, R.L., van Wering, E.R., Janka-Schaub, G.E., Slater, R., and Pieters, R. (2003). Sensitivity to L-asparaginase is not associated with expression levels of asparagine synthetase in t(12;21)+ pediatric ALL. Blood 101, 2743-2747.
Stein, E.M., Altman, J.K., Collins, R., DeAngelo, D.J., Fathi, A.T., Flinn, I., Frankel, A., Levine, R.L., Medeiros, B.C., Patel, M., et al. (2014). AG-221, an Oral, Selective, First-in-Class, Potent Inhibitor of the IDH2 Mutant Metabolic Enzyme, Induces Durable Remissions in a Phase I Study in Patients with IDH2 Mutation Positive Advanced Hematologic Malignancies. Blood 124, 115-115.
85
Stein, M., Lin, H., Jeyamohan, C., Dvorzhinski, D., Gounder, M., Bray, K., Eddy, S., Goodin, S., White, E., and Dipaola, R.S. (2010). Targeting tumor metabolism with 2-deoxyglucose in patients with castrate-resistant prostate cancer and advanced malignancies. Prostate 70, 1388-1394.
Suh, Y.A., Arnold, R.S., Lassegue, B., Shi, J., Xu, X., Sorescu, D., Chung, A.B., Griendling, K.K., and Lambeth, J.D. (1999). Cell transformation by the superoxide-generating oxidase Mox1. Nature 401, 79-82.
Sullivan, L.B., Gui, D.Y., Hosios, A.M., Bush, L.N., Freinkman, E., and Vander Heiden, M.G. (2015). Supporting Aspartate Biosynthesis Is an Essential Function of Respiration in Proliferating Cells. Cell 162, 552-563.
Sullivan, L.B., Gui, D.Y., and Vander Heiden, M.G. (2016). Altered metabolite levels in cancer: implications for tumour biology and cancer therapy. Nat Rev Cancer 16, 680-693.
Svensson, R.U., Parker, S.J., Eichner, L.J., Kolar, M.J., Wallace, M., Brun, S.N., Lombardo, P.S., Van Nostrand, J.L., Hutchins, A., Vera, L., et al. (2016). Inhibition of acetyl-CoA carboxylase suppresses fatty acid synthesis and tumor growth of non-small-cell lung cancer in preclinical models. Nat Med 22, 1108-1119.
Sykes, D.B., Kfoury, Y.S., Mercier, F.E., Wawer, M.J., Law, J.M., Haynes, M.K., Lewis, T.A., Schajnovitz, A., Jain, E., Lee, D., et al. (2016). Inhibition of Dihydroorotate Dehydrogenase Overcomes Differentiation Blockade in Acute Myeloid Leukemia. Cell 167, 171-186 e115.
Szlosarek, P.W., Luong, P., Phillips, M.M., Baccarini, M., Stephen, E., Szyszko, T., Sheaff, M.T., and Avril, N. (2013). Metabolic response to pegylated arginine deiminase in mesothelioma with promoter methylation of argininosuccinate synthetase. J Clin Oncol 31, e111-113.
Tabata, S., Yamamoto, M., Goto, H., Hirayama, A., Ohishi, M., Kuramoto, T., Mitsuhashi, A., Ikeda, R., Haraguchi, M., Kawahara, K., et al. (2017). Thymidine Catabolism as a Metabolic Strategy for Cancer Survival. Cell Rep 19, 1313-1321.
Tan, A.S., Baty, J.W., Dong, L.F., Bezawork-Geleta, A., Endaya, B., Goodwin, J., Bajzikova, M., Kovarova, J., Peterka, M., Yan, B., et al. (2015a). Mitochondrial genome acquisition restores respiratory function and tumorigenic potential of cancer cells without mitochondrial DNA. Cell Metab 21, 81-94.
Tan, B., Dong, S., Shepard, R.L., Kays, L., Roth, K.D., Geeganage, S., Kuo, M.S., and Zhao, G. (2015b). Inhibition of Nicotinamide Phosphoribosyltransferase (NAMPT), an Enzyme Essential for NAD+ Biosynthesis, Leads to Altered Carbohydrate Metabolism in Cancer Cells. J Biol Chem 290, 15812-15824.

86
Tardito, S., Oudin, A., Ahmed, S.U., Fack, F., Keunen, O., Zheng, L., Miletic, H., Sakariassen, P.O., Weinstock, A., Wagner, A., et al. (2015). Glutamine synthetase activity fuels nucleotide biosynthesis and supports growth of glutamine-restricted glioblastoma. Nat Cell Biol 17, 1556-1568.
Tateishi, K., Iafrate, A.J., Ho, Q., Curry, W.T., Batchelor, T.T., Flaherty, K.T., Onozato, M.L., Lelic, N., Sundaram, S., Cahill, D.P., et al. (2016). Myc-Driven Glycolysis Is a Therapeutic Target in Glioblastoma. Clin Cancer Res 22, 4452-4465.
Tateishi, K., Wakimoto, H., Iafrate, A.J., Tanaka, S., Loebel, F., Lelic, N., Wiederschain, D., Bedel, O., Deng, G., Zhang, B., et al. (2015). Extreme Vulnerability of IDH1 Mutant Cancers to NAD+ Depletion. Cancer Cell 28, 773-784.
Titov, D.V., Cracan, V., Goodman, R.P., Peng, J., Grabarek, Z., and Mootha, V.K. (2016). Complementation of mitochondrial electron transport chain by manipulation of the NAD+/NADH ratio. Science 352, 231-235.
Tomlinson, I.P., Alam, N.A., Rowan, A.J., Barclay, E., Jaeger, E.E., Kelsell, D., Leigh, I., Gorman, P., Lamlum, H., Rahman, S., et al. (2002). Germline mutations in FH predispose to dominantly inherited uterine fibroids, skin leiomyomata and papillary renal cell cancer. Nat Genet 30, 406-410.
Tonjes, M., Barbus, S., Park, Y.J., Wang, W., Schlotter, M., Lindroth, A.M., Pleier, S.V., Bai, A.H.C., Karra, D., Piro, R.M., et al. (2013). BCAT1 promotes cell proliferation through amino acid catabolism in gliomas carrying wild-type IDH1. Nat Med 19, 901-908.
Trachootham, D., Zhou, Y., Zhang, H., Demizu, Y., Chen, Z., Pelicano, H., Chiao, P.J., Achanta, G., Arlinghaus, R.B., Liu, J., et al. (2006). Selective killing of oncogenically transformed cells through a ROS-mediated mechanism by beta-phenylethyl isothiocyanate. Cancer Cell 10, 241-252.
Traut, T.W. (1994). Physiological concentrations of purines and pyrimidines. Mol Cell Biochem 140, 1-22.
Turcan, S., Fabius, A.W., Borodovsky, A., Pedraza, A., Brennan, C., Huse, J., Viale, A., Riggins, G.J., and Chan, T.A. (2013). Efficient induction of differentiation and growth inhibition in IDH1 mutant glioma cells by the DNMT Inhibitor Decitabine. Oncotarget 4, 1729-1736.
Turcan, S., Rohle, D., Goenka, A., Walsh, L.A., Fang, F., Yilmaz, E., Campos, C., Fabius, A.W., Lu, C., Ward, P.S., et al. (2012). IDH1 mutation is sufficient to establish the glioma hypermethylator phenotype. Nature 483, 479-483.

87
Vander Heiden, M.G. (2011). Targeting cancer metabolism: a therapeutic window opens. Nat Rev Drug Discov 10, 671-684.
Vander Heiden, M.G., and DeBerardinis, R.J. (2017). Understanding the Intersections between Metabolism and Cancer Biology. Cell 168, 657-669.
Viale, A., Pettazzoni, P., Lyssiotis, C.A., Ying, H., Sanchez, N., Marchesini, M., Carugo, A., Green, T., Seth, S., Giuliani, V., et al. (2014). Oncogene ablation-resistant pancreatic cancer cells depend on mitochondrial function. Nature 514, 628-632.
von Heideman, A., Berglund, A., Larsson, R., and Nygren, P. (2010). Safety and efficacy of NAD depleting cancer drugs: results of a phase I clinical trial of CHS 828 and overview of published data. Cancer Chemother Pharmacol 65, 1165-1172.
Wagner, A.D., Grothe, W., Haerting, J., Kleber, G., Grothey, A., and Fleig, W.E. (2006). Chemotherapy in advanced gastric cancer: a systematic review and meta-analysis based on aggregate data. J Clin Oncol 24, 2903-2909.
Wakimoto, H., Tanaka, S., Curry, W.T., Loebel, F., Zhao, D., Tateishi, K., Chen, J., Klofas, L.K., Lelic, N., Kim, J.C., et al. (2014). Targetable signaling pathway mutations are associated with malignant phenotype in IDH-mutant gliomas. Clin Cancer Res 20, 2898-2909.
Walling, J. (2006). From methotrexate to pemetrexed and beyond. A review of the pharmacodynamic and clinical properties of antifolates. Invest New Drugs 24, 37-77.
Walsh, M.J., Brimacombe, K.R., Anastasiou, D., Yu, Y., Israelsen, W.J., Hong, B.S., Tempel, W., Dimov, S., Veith, H., Yang, H., et al. (2010). ML265: A potent PKM2 activator induces tetramerization and reduces tumor formation and size in a mouse xenograft model. In Probe Reports from the NIH Molecular Libraries Program (Bethesda (MD)).
Wang, F., Travins, J., DeLaBarre, B., Penard-Lacronique, V., Schalm, S., Hansen, E., Straley, K., Kernytsky, A., Liu, W., Gliser, C., et al. (2013). Targeted inhibition of mutant IDH2 in leukemia cells induces cellular differentiation. Science 340, 622-626.
Wang, Q., Liberti, M.V., Liu, P., Deng, X., Liu, Y., Locasale, J.W., and Lai, L. (2017). Rational Design of Selective Allosteric Inhibitors of PHGDH and Serine Synthesis with Anti-tumor Activity. Cell Chem Biol 24, 55-65.
Warburg, O. (1924). Über den Stoffwechsel der Carcinomzelle. Naturwissenschaften 12, 1131-1137.

88
Warburg, O. (1956). On the origin of cancer cells. Science 123, 309-314.
Ward, P.S., Patel, J., Wise, D.R., Abdel-Wahab, O., Bennett, B.D., Coller, H.A., Cross, J.R., Fantin, V.R., Hedvat, C.V., Perl, A.E., et al. (2010). The common feature of leukemia-associated IDH1 and IDH2 mutations is a neomorphic enzyme activity converting alpha-ketoglutarate to 2-hydroxyglutarate. Cancer Cell 17, 225-234.
Watanabe, T., Nobusawa, S., Kleihues, P., and Ohgaki, H. (2009). IDH1 mutations are early events in the development of astrocytomas and oligodendrogliomas. Am J Pathol 174, 1149-1153.
Watson, M., Roulston, A., Belec, L., Billot, X., Marcellus, R., Bedard, D., Bernier, C., Branchaud, S., Chan, H., Dairi, K., et al. (2009). The small molecule GMX1778 is a potent inhibitor of NAD+ biosynthesis: strategy for enhanced therapy in nicotinic acid phosphoribosyltransferase 1-deficient tumors. Mol Cell Biol 29, 5872-5888.
Weinberg, F., Hamanaka, R., Wheaton, W.W., Weinberg, S., Joseph, J., Lopez, M., Kalyanaraman, B., Mutlu, G.M., Budinger, G.R., and Chandel, N.S. (2010). Mitochondrial metabolism and ROS generation are essential for Kras-mediated tumorigenicity. Proc Natl Acad Sci U S A 107, 8788-8793.
Weinhouse, S. (1956). On respiratory impairment in cancer cells. Science 124, 267-269.
Wheaton, W.W., Weinberg, S.E., Hamanaka, R.B., Soberanes, S., Sullivan, L.B., Anso, E., Glasauer, A., Dufour, E., Mutlu, G.M., Budigner, G.S., et al. (2014). Metformin inhibits mitochondrial complex I of cancer cells to reduce tumorigenesis. Elife 3, e02242.
Wick, A.N., Drury, D.R., Nakada, H.I., and Wolfe, J.B. (1957). Localization of the primary metabolic block produced by 2-deoxyglucose. J Biol Chem 224, 963-969.
Wise, D.R., DeBerardinis, R.J., Mancuso, A., Sayed, N., Zhang, X.Y., Pfeiffer, H.K., Nissim, I., Daikhin, E., Yudkoff, M., McMahon, S.B., et al. (2008). Myc regulates a transcriptional program that stimulates mitochondrial glutaminolysis and leads to glutamine addiction. Proc Natl Acad Sci U S A 105, 18782-18787.
Witkiewicz, A.K., Whitaker-Menezes, D., Dasgupta, A., Philp, N.J., Lin, Z., Gandara, R., Sneddon, S., Martinez-Outschoorn, U.E., Sotgia, F., and Lisanti, M.P. (2012). Using the "reverse Warburg effect" to identify high-risk breast cancer patients: stromal MCT4 predicts poor clinical outcome in triple-negative breast cancers. Cell Cycle 11, 1108-1117.
89
Xiang, Y., Stine, Z.E., Xia, J., Lu, Y., O'Connor, R.S., Altman, B.J., Hsieh, A.L., Gouw, A.M., Thomas, A.G., Gao, P., et al. (2015). Targeted inhibition of tumor-specific glutaminase diminishes cell-autonomous tumorigenesis. J Clin Invest 125, 2293-2306.
Xiao, M., Yang, H., Xu, W., Ma, S., Lin, H., Zhu, H., Liu, L., Liu, Y., Yang, C., Xu, Y., et al. (2012). Inhibition of alpha-KG-dependent histone and DNA demethylases by fumarate and succinate that are accumulated in mutations of FH and SDH tumor suppressors. Genes Dev 26, 1326-1338.
Xie, H., Hanai, J., Ren, J.G., Kats, L., Burgess, K., Bhargava, P., Signoretti, S., Billiard, J., Duffy, K.J., Grant, A., et al. (2014). Targeting lactate dehydrogenase--a inhibits tumorigenesis and tumor progression in mouse models of lung cancer and impacts tumor-initiating cells. Cell Metab 19, 795-809.
Xu, W., Yang, H., Liu, Y., Yang, Y., Wang, P., Kim, S.H., Ito, S., Yang, C., Wang, P., Xiao, M.T., et al. (2011). Oncometabolite 2-hydroxyglutarate is a competitive inhibitor of alpha-ketoglutarate-dependent dioxygenases. Cancer Cell 19, 17-30.
Yan, H., Parsons, D.W., Jin, G., McLendon, R., Rasheed, B.A., Yuan, W., Kos, I., Batinic-Haberle, I., Jones, S., Riggins, G.J., et al. (2009). IDH1 and IDH2 mutations in gliomas. N Engl J Med 360, 765-773.
Yang, T.S., Lu, S.N., Chao, Y., Sheen, I.S., Lin, C.C., Wang, T.E., Chen, S.C., Wang, J.H., Liao, L.Y., Thomson, J.A., et al. (2010). A randomised phase II study of pegylated arginine deiminase (ADI-PEG 20) in Asian advanced hepatocellular carcinoma patients. Br J Cancer 103, 954-960.
Yang, W.S., SriRamaratnam, R., Welsch, M.E., Shimada, K., Skouta, R., Viswanathan, V.S., Cheah, J.H., Clemons, P.A., Shamji, A.F., Clish, C.B., et al. (2014). Regulation of ferroptotic cancer cell death by GPX4. Cell 156, 317-331.
Ye, J., Fan, J., Venneti, S., Wan, Y.W., Pawel, B.R., Zhang, J., Finley, L.W., Lu, C., Lindsten, T., Cross, J.R., et al. (2014). Serine catabolism regulates mitochondrial redox control during hypoxia. Cancer Discov 4, 1406-1417.
Yen, K., Travins, J., Wang, F., David, M.D., Artin, E., Straley, K., Padyana, A., Gross, S., DeLaBarre, B., Tobin, E., et al. (2017). AG-221, a First-in-Class Therapy Targeting Acute Myeloid Leukemia Harboring Oncogenic IDH2 Mutations. Cancer Discov.
Yoshida, K., Furuya, S., Osuka, S., Mitoma, J., Shinoda, Y., Watanabe, M., Azuma, N., Tanaka, H., Hashikawa, T., Itohara, S., et al. (2004). Targeted disruption of the mouse 3-phosphoglycerate dehydrogenase gene causes severe neurodevelopmental defects and results in embryonic lethality. J Biol Chem 279, 3573-3577.
90
Yun, J., Mullarky, E., Lu, C., Bosch, K.N., Kavalier, A., Rivera, K., Roper, J., Chio, II, Giannopoulou, E.G., Rago, C., et al. (2015). Vitamin C selectively kills KRAS and BRAF mutant colorectal cancer cells by targeting GAPDH. Science 350, 1391-1396.
Yuneva, M., Zamboni, N., Oefner, P., Sachidanandam, R., and Lazebnik, Y. (2007). Deficiency in glutamine but not glucose induces MYC-dependent apoptosis in human cells. J Cell Biol 178, 93-105.
Yuneva, M.O., Fan, T.W., Allen, T.D., Higashi, R.M., Ferraris, D.V., Tsukamoto, T., Mates, J.M., Alonso, F.J., Wang, C., Seo, Y., et al. (2012). The metabolic profile of tumors depends on both the responsible genetic lesion and tissue type. Cell Metab 15, 157-170.
Zauri, M., Berridge, G., Thezenas, M.L., Pugh, K.M., Goldin, R., Kessler, B.M., and Kriaucionis, S. (2015). CDA directs metabolism of epigenetic nucleosides revealing a therapeutic window in cancer. Nature 524, 114-118.
Zhang, B., Zheng, A., Hydbring, P., Ambroise, G., Ouchida, A.T., Goiny, M., Vakifahmetoglu-Norberg, H., and Norberg, E. (2017). PHGDH Defines a Metabolic Subtype in Lung Adenocarcinomas with Poor Prognosis. Cell Rep 19, 2289-2303.
Zhang, D., Li, J., Wang, F., Hu, J., Wang, S., and Sun, Y. (2014a). 2-Deoxy-D-glucose targeting of glucose metabolism in cancer cells as a potential therapy. Cancer Lett 355, 176-183.
Zhang, X., Fryknas, M., Hernlund, E., Fayad, W., De Milito, A., Olofsson, M.H., Gogvadze, V., Dang, L., Pahlman, S., Schughart, L.A., et al. (2014b). Induction of mitochondrial dysfunction as a strategy for targeting tumour cells in metabolically compromised microenvironments. Nat Commun 5, 3295.
Zhao, Y., Butler, E.B., and Tan, M. (2013). Targeting cellular metabolism to improve cancer therapeutics. Cell Death Dis 4, e532.
Zheng, L., Mackenzie, E.D., Karim, S.A., Hedley, A., Blyth, K., Kalna, G., Watson, D.G., Szlosarek, P., Frezza, C., and Gottlieb, E. (2013). Reversed argininosuccinate lyase activity in fumarate hydratase-deficient cancer cells. Cancer Metab 1, 12.
Zhu, A., Lee, D., and Shim, H. (2011). Metabolic positron emission tomography imaging in cancer detection and therapy response. Semin Oncol 38, 55-69.
Zu, X.L., and Guppy, M. (2004). Cancer metabolism: facts, fantasy, and fiction. Biochem Biophys Res Commun 313, 459-465.

91
Chapter 2: Methylglyoxal production is a targetable
liability of glycolytic metabolism in lung cancer
Authors: Alba Luengo1,2, Shawn M. Davidson1,2,3, Sahin Naqvi2,4, Aaron M. Hosios1,2, Caroline A. Lewis4, Elizaveta Freinkman4, Brandon Faubert5, Ralph J. Deberardinis5,6,7, Clary B. Clish3, Robert J. Downey8, Matthew G. Vander Heiden1,2,9 Author Affiliations: 1 Koch Institute for Integrative Cancer Research, Massachusetts Institute of Technology, Cambridge, MA 02139, USA 2 Department of Biology, Massachusetts Institute of Technology, Cambridge, MA 02139, USA 3 Broad Institute of MIT and Harvard University, Cambridge, MA 02142, USA 4 Whitehead Institute for Biomedical Research, Massachusetts Institute of Technology, Cambridge, MA 02142, USA 5 Children’s Medical Center Research Institute, University of Texas Southwestern Medical Center, Dallas, TX, USA 6 Department of Pediatrics, University of Texas Southwestern Medical Center, Dallas, TX, USA 7 Eugene McDermott Center for Human Growth and Development, University of Texas Southwestern Medical Center, Dallas, TX, USA 8 Thoracic Service, Department of Surgery, Memorial Sloan Kettering Cancer Center, New York, NY United States of America 9 Dana-Farber Cancer Institute, Boston, MA 02115, USA This chapter is unpublished as of May 2018
92
Abstract
Increased glycolytic metabolism is a prominent phenotype of most cancers,
but how best to exploit this metabolic alteration for cancer therapy is unknown.
Efforts to clinically target increased glucose uptake directly have been challenging,
suggesting that alternative strategies are needed. Here, we find that the reactive
metabolite methylglyoxal, a byproduct of glycolysis, accumulates at high levels in
both human and murine non-small cell lung cancers (NSCLC). Methylglyoxal reacts
non-enzymatically with basic amino acids and guanyl nucleotides to damage
macromolecules, reducing cellular fitness. Detoxification of methylglyoxal requires
both reduced glutathione and the methylglyoxal detoxification enzyme glyoxalase 1
(Glo1). Ablation of Glo1 potentiates sensitivity to methylglyoxal and reduces tumor
growth in mice, arguing that targeting pathways involved in the detoxification of
reactive metabolites is an alternative approach to therapeutically target
consequences of increased glucose metabolism in cancer.
Introduction
Cancer cells engage in altered metabolism to support the biosynthetic
demands of malignant proliferation (Pavlova and Thompson, 2016; Vander Heiden
and DeBerardinis, 2017). The reprogrammed metabolism of cancer cells
distinguishes tumors from the tissues from which they arise, raising the possibility
that tumor metabolism could be targeted for cancer therapy. For example, elevated

93
glucose uptake and flux through glycolysis is a salient feature of cancer metabolism
(Liberti and Locasale, 2016; Lunt and Vander Heiden, 2011), and compounds that
target this phenotype have been developed and tested for clinical efficacy. However,
efforts to target glucose metabolism, including inhibitors of glucose uptake,
glycolysis, and lactate excretion, have had limited clinical success, likely because all
cells require glucose and glycolytic enzymes for survival (Hay, 2016; Luengo et al.,
2017). Targeting secondary effects of increased glucose metabolism may be an
alternative therapeutic approach, and synthetic lethality approaches involving
metabolism have been proposed as a more tractable strategy to clinically target
features of cancer metabolism. For example, passenger deletion of one isoform of the
glycolytic enzyme enolase can result in increased dependence on the remaining
isoform (Leonard et al., 2016; Muller et al., 2012). Additionally, cancers with loss of
the mitochondrial enzyme fumarate hydratase (FH) accumulate fumarate, which
introduces metabolic vulnerabilities including arginine auxotrophy and dependency
on heme metabolism (Adam et al., 2013; Frezza et al., 2011; Zheng et al., 2013).
While these examples are based on the presence of specific mutations, other indirect
consequences of increased glucose metabolism can cause different metabolic
dependencies in cancer cells relative to normal cells, and these dependencies may be
applicable to broader subsets of patients. Here, we show that increased production
of the reactive metabolite methylglyoxal is a consequence of the reprogrammed
glucose metabolism of lung tumors and determine that blocking detoxification of
this metabolite impairs cancer growth and introduces targetable vulnerabilities.

94
Results
Untargeted metabolomics reveals increased antioxidant capacity in lung
cancers
Increased glucose metabolism in cancer results in different steady-state
concentrations of metabolites in tumors relative to normal tissues, which can have
implications for cell signaling, bioenergetics, and the availability of substrates that
support biosynthesis and cell proliferation (DeBerardinis and Chandel, 2016;
Sullivan et al., 2016). To identify metabolites that accumulate in lung cancers with
high glucose metabolism, we performed untargeted liquid chromatography mass-
spectrometry (LCMS)-based metabolomics on normal lung tissue and lung tumor
tissue derived from two autochthonous mouse models of KrasG12D-driven non-small
cell lung cancers (NSCLC) that have been shown to avidly consume glucose (Chen et
al., 2012; Davidson et al., 2016; Shackelford et al., 2013). These two models, the
latent model (LA2), which is initiated by mutant KrasG12D expression (Johnson et
al., 2001), and a second model, which involves Cre-mediated activation of KrasG12D
expression and deletion of Trp53 (KP), form lung tumors of different grades and
invasiveness (Tuveson et al., 2004). From this analysis, we determined that
elevations in the tripeptide glutathione was the metabolite change that was most
significantly different between tumors and normal lung tissue (Figure 1A).
Reduced glutathione (GSH) is a critical cofactor for cells required to detoxify
reactive oxygen species (ROS), which include a number of oxygen-containing
reactive chemical species produced as byproducts of mitochondrial metabolism and
95
other cellular processes (Cairns et al., 2011). Increased ROS generation is
associated with malignancy, and increased GSH levels in tumors has been proposed
to benefit cancer cells by enabling increased ROS detoxification (DeNicola et al.,
2011; Harris et al., 2015; Piskounova et al., 2015). Accumulation of intracellular
ROS can damage DNA, proteins, and lipids, and thus cells neutralize ROS via the
action of various enzyme complexes, some of which ultimately result in the
oxidation of reduced GSH to GSSH, the oxidized form of glutathione (Gorrini et al.,
2013). Thus, we reasoned that if elevated glutathione levels in lung cancer were a
response to enhanced oxidative stress, the increase in GSH should be accompanied
by an increase in GSSG, indicating a more oxidized GSH/GSSG ratio. However,
even though GSH was significantly elevated in lung tumors, levels of GSSG were
increased only in tumors arising in the LA2 model, and not in the more aggressive
KP model which displayed higher levels of GSH (Figure 1B). Furthermore, the
increase in GSH was greater in both models than any change in GSSG, consistent
with a more reduced GSH/GSSG ratio and indicating increased antioxidant capacity
in lung tumors relative to normal lung. This argues against oxidative stress as the
only explanation for GSH elevation, and suggests that the increase in GSH levels
may serve an additional function beyond ROS detoxification in lung cancers.

96
Lung LA2 KP0
1
2
3
4
Rela
tive P
eak A
rea
(S)-D-Lactoylglutathione
0 2 4 6
2
4
6
8
log2(Fold Change)
-lo
g10(p
-valu
e)
Glutathione [M+Na-2H]-
Glutathione [M-H]-
A. B.
Methylglyoxal
O
SG
OHGSH
O
O
LGSH
Glo1
GSH GSSG0
5
10
15
Rela
tive P
eak A
rea
Lung
LA2
KP
C. E.
F. G.
D.Methylglyoxal
TumorLung
Ab
un
da
nc
e (
A.U
.)
***
Lung KP
xenograft
0
5
10
15
Rela
tive P
eak A
rea
(S)-D-Lactoylglutathione
Lung KP
Glo1
Tubulin
G.
H.

97
Figure 1. Methylglyoxal and reduced glutathione accumulate in NSCLC tumors compared to normal lung. (A) Volcano plot indicating metabolites significantly elevated (p>0.05) in mouse lung tumors relative to normal lung tissue as determined by untargeted LCMS analysis. Lung lesions were generated from the LA2 and the KP KrasG12D-driven NSCLC mouse models. Two negative ionizations of glutathione ([M+Na-2H]- and [M-H]-) are indicated with arrows. Peaks with fewer than 1×10⁵ ion counts were excluded from the analysis. (B) Relative levels of reduced glutathione (GSH) and oxidized glutathione (GSSG) in extracts from normal mouse lung tissue (Lung), and NSCLC tumors arising in from the LA2 and KP mouse model as measured by targeted LCMS. (Lung, n = 9; LA2, n = 6; KP, n = 11). (C) Glutathione adducts found to be significantly higher in lung tumors compared to normal lung are shown, with statistical significance determined by Welch’s t-test. Predicted glutathione-electrophile conjugates were identified by untargeted LCMS analysis of mouse lung tissues and NSCLC generated from the LA2 and KP models. (D) Schematic depicting the reaction catalyzed by glyoxalase 1 (Glo1) to conjugate methylglyoxal with reduced glutathione (GSH) to produce (S)-D-lactoylglutathione (LGSH). (E) Relative methylglyoxal metabolite levels detected in lung cancer and normal lung tissue resected from 25 patients with lung cancer as determined by LCMS. Each dot represents the average value of three biological replicates from a single tissue region. Data are displayed as average and SD. The increase in methylglyoxal in tumors compared to normal lung is statistically significant (p<0.001). (F) Relative levels of (S)-D-lactoylglutathione in normal mouse lung tissue, LA2 tumors, and KP tumors as assessed by LCMS. Data is normalized to tissue weight and peak area. (Lung, n = 9; K, n = 6; KP, n = 11). (G) Quantification of (S)-D-lactoylglutathione in normal lung tissue and in KP allografts by LCMS. The allografts were generated from the LG lung cancer cell line, which had derived from a KP mouse lesion as previously described. The lungs were collected from the same animals. (H) Western blot analysis to assess Glo1 expression in normal mouse lung tissue and in KP lung tumors. Tubulin expression was also assessed as a loading control. Values shown denote the mean ± SEM for panels B, F, and G.

98
Evidence for increased methylglyoxal production in lung tumors
Reduced glutathione has a nucleophilic cysteine sulfhydryl group that
permits glutathione to react with electrophiles and form GSH-conjugates. The
formation of GSH-conjugates promotes electrophile detoxification because it
prevents these reactive metabolites from reacting with and damaging other
macromolecules in the cell (Blair, 2010). Furthermore, higher levels of glutathione
might be expected to more effectively prevent non-specific reaction of reactive
metabolites with macromolecules to cause damage. To explore this possibility, we
queried whether known glutathione-electrophile conjugates could be identified in
the untargeted metabolomics data from normal lung and lung tumors. Consistent
with a role for GSH in detoxifying electrophiles in tumors, we identified a number of
glutathione-electrophile conjugates that were increased in tumors relative to
normal lung (Figure 1C). Among these was (S)-D-lactoylglutathione (LGSH), which
is the conjugation of methylglyoxal with reduced glutathione (Figure 1D).
LGSH accumulation is of interest because methylglyoxal is known to be a
byproduct of increased glucose metabolism associated with hyperglycemia and
diabetes (Han et al., 2009) and can contribute to vascular damage and other
complications secondary to increased glucose levels that are observed in this disease
(Bierhaus et al., 2012; Dobler et al., 2006; Moraru et al., 2018). This raises the
possibility that methylglyoxal also accumulates in tumors secondary to increased
glucose metabolism. Consistent with this idea, methylglyoxal levels are elevated in
human lung tumors relative to normal lung (Figure 1E), which additionally

99
suggests that this finding could have translational applications for the treatment of
human lung cancer.
At high levels, methylglyoxal induces cytotoxicity because it potently and
irreversibly reacts with proteins and nucleic acids to form stable adducts referred to
as advanced glycation end-products (AGEs) (Rabbani and Thornalley, 2015).
Glycation by methylglyoxal interrupts normal electrostatic interactions, thereby
altering the structure and function of biomolecules and, by extension, the
proliferative capacity and viability of cells. In order to prevent AGE formation, the
enzyme glyoxalase 1 (Glo1, EC 4.4.1.5) is broadly expressed (Sousa Silva et al.,
2013), and catalyzes the covalent conjugation of methylglyoxal with GSH to form
LGSH (Figure 1D). Methylglyoxal reacts non-enzymatically with GSH to form a
hemithioacetal intermediate. However, this process is reversible, and Glo1 catalyzes
the isomerization of the hemithioacetal intermediate to produce LGSH, which is
more stable. In this way, Glo1 acts to irreversibly sequester reactive methylglyoxal
and prevent the non-specific reaction of this electrophile with macromolecules to
damage cells (Sousa Silva et al., 2013).
To assess whether Glo1-mediated detoxification of methylglyoxal is
important in lung cancer, we used targeted LCMS to assess levels of LGSH in
mouse lung tumors. We found that relative to normal lung, levels of LGSH were
higher in metabolite extracts collected from tumors arising in both LA2 and KP
mice (Figure 1F) and from allografts generated from KP lung tumors cells (Figure
1G). We next assessed Glo1 expression in these lung tumors and found that protein

100
levels of Glo1 were increased in KP lung tumors relative to normal lung tissues
(Figure 1H). Together, these data support the hypothesis that Glo1 expression in
tumor tissues catalyzes the production of LGSH to detoxify increased production of
methylglyoxal in lung tumors.
Methylglyoxal is a byproduct of glycolysis
Methylglyoxal can be produced from glucose, as is the case in hyperglycemia
(Han et al., 2009). One mechanism of methylglyoxal production is non-enzymatic
formation from the degradation of triose-phosphate intermediates in glycolysis
(Rabbani and Thornalley, 2015). However, methylglyoxal can also be generated as a
byproduct of threonine and glycine interconversion (Elliott, 1960; Ravichandran et
al., 2018; Sartori et al., 2008), and methylglyoxal production from glycine has been
reported in some cancer contexts (Kim et al., 2015). To distinguish between these
possibilities in lung tumors, we performed stable-isotope tracing experiments to
assess the source of methylglyoxal production in lung cancer. We cultured lung
cancer cells derived from KP lung tumors in media containing [U-13C2]glycine or [U-
13C6]glucose and measured label incorporation into methylglyoxal using LCMS.
Conversion of [U-13C2]glycine to methylglyoxal generates methylglyoxal with one
labeled carbon (m+1) (Figure 2A), and conversion of [U-13C6]glucose to
methylglyoxal results in fully labeled (m+3) methylglyoxal (Figure 2B). We found
that in the conditions tested only ~5% of the methylglyoxal is m+1 labeled from [U-
13C2]glycine, suggesting that glycine is not a major contributor to methylglyoxal

101
Figure 2. Methylglyoxal is produced as a byproduct of glycolysis in NSCLC (A and B) Schematic detailing how carbon from (A) [U-13C2]glycine or (B) [U-13C6]glucose would be incorporated into methylglyoxal based on known pathways. 13C labeled carbons are denoted by blue circles. (C and D) Isotopomer distribution of methylglyoxal in lung cancer cell lines independently derived from KP mice that were cultured for 24 hours in the presence of (C) [U-13C2]glycine or (D) [U-13C6]glucose. (E) Isotopomer distribution of methylglyoxal in autochthonous lung tumors arising in LA2 mice following a 6 hour infusion of 30mg/kg/min [U-13C6]glucose. Values were normalized to plasma enrichment of glucose. (F) Relative (S)-D-lactoylglutathione (LGSH) levels in two lung cancer cell lines derived from KP mice as detected by LCMS. Levels are shown for cells cultured in the indicated doses of 2-deoxyglucose (2DG) for 24 hours. Values shown are the peak area of LGSH normalized to peak area of reduced glutathione (n=3). (G) Correlation analysis of SUVmax and methylglyoxal abundance in human lung tumors. Each dot represents the average value of all tumor region fractions for each patient (n=24). Values in panels C,D,E and F denote mean ± SEM.
Lung Tumors0.0
0.5
1.0
13C6-Glucose
Percen
t la
bele
d
Methylglyoxal
m+0m+1m+2m+3
3553T3 LG0.0
0.5
1.0
1.5
13C6-Glucose
Percen
t L
ab
ele
d
Methylglyoxal
m+0m+1m+2m+3
3553T3 LG0.0
0.5
1.0
13C2-Glycine
Percen
t L
ab
ele
d
Methylglyoxal
m+0m+1m+2m+3
3553T3 LG
Vehicle1.25 mM 2DG2.5 mM 2DG5 mM 2DG
0.0
0.5
1.0
Rela
tive L
GS
H
OHO
HOOH
OH
OH
13C6-Glucose
13C3-Triose Phosphates
13C3-Methylglyoxal
O
O
OH
OO P
O
OH
OH
O
OHO P
O
OH
OH
A.
OHH2N
O
H2N
O
O
O
13C2-Glycine
13C1-Aminoacetone
13C1-Methylglyoxal
Acetyl-CoA
CoA-SH CO2
[O]
NH3
B. C.
D.
F.E. G.

102
formation in these cells (Figure 2C). Conversely, when lung cancer cells were
cultured with [U-13C6]glucose, virtually all of the methylglyoxal was m+3 labeled,
matching the labeling pattern expected when methylglyoxal is produced from
glycolytic intermediates (Figure 2D). These results indicate that for lung cancer
cells in culture, the majority of methylglyoxal is produced from glucose, likely as a
byproduct of increased glycolysis. To determine whether methylglyoxal is also
derived from glucose in lung tumors, we assessed the contribution of [U-13C6]glucose
to methylglyoxal in NSCLC in vivo (Davidson et al., 2016). We infused [U-
13C6]glucose into mice bearing LA2 tumors for six hours and analyzed metabolite
labeling in tumor tissue by LCMS. Consistent with results obtained from cell lines,
the majority of methylglyoxal in lung tumors was found to be generated from
glucose (Figure 2E).
Glyoxalase 1 is required for methylglyoxal detoxification and to prevent
accumulation of protein adducts
The increased production of methylglyoxal as a reactive byproduct of glucose
metabolism, along with the accumulation of GSH, raises the possibility that
detoxification of this reactive metabolite is important for lung tumor growth. To test
this hypothesis, we first examined whether manipulating levels of intracellular
glutathione could affect sensitivity to exogenous methylglyoxal. Because glutathione
is a required substrate of Glo1, we expected depletion of glutathione to impair
methylglyoxal detoxification and thus increase sensitivity to this metabolite.

103
Indeed, treatment of lung cancer cells with buthionine sulfoximine (BSO), a
compound that inhibits glutathione synthesis (Griffith, 1982), renders cells
exquisitely sensitive to exogenous methylglyoxal (Figure 3A).
To inhibit detoxification of methylglyoxal genetically, we utilized
CRISPR/Cas9-based genome editing to delete Glo1 from lung cancer cells (Figure
3B). Consistent with functional deletion of Glo1, levels of intracellular LGSH were
dramatically lower in Glo1-deficient cells (Figure 3C). Loss of Glo1 also resulted in
a modest growth defect (Figure 3D) and greatly increased sensitivity to exogenous
methylglyoxal (Figure 3E). To confirm that Glo1 deletion and reduced LGSH
production leads to increased reaction of methylglyoxal with macromolecules, we
measured methylglyoxal glycation adducts in cells with and without Glo1
expression. Methylglyoxal can react with free arginine or arginine residues in
proteins to form stable covalent adducts, including hydroimidazolone (MG-H1)
(Figure 3F). Concentrations of free MG-H1 as measured by LCMS were increased
in cells that did not express Glo1 (Figure 3G). Levels of MG-H1 were further
elevated in Glo1-null cells that had been incubated with exogenous methylglyoxal
(Figure 3H) and proteins containing MG-H1 adducts were also detected by
Western blot in this context (Figure 3I). Together, these data suggest that
inhibition of the glyoxalase system in lung cancer cells can lead to accumulation of
methylglyoxal-derived adducts on protein. Furthermore, loss of Glo1 can impair cell
viability if methylglyoxal is present at high levels.

104
0.0
0.5
1.0
1.5
2.0
2.5
Gro
wth
Rate
(d
ou
blin
gs/d
ay)
sgGlo1-2
sgGlo1-3
Parental
sgGlo1-1
3553T3 LG
-2
-1
0
1
2
Gro
wth
Rate
(d
ou
blin
gs/d
ay)
100µM BSO
100µM BSO + 200µM MGO
Vehicle
200µM MGO
3553T3 LG
Glo1
Parenta
l
sgGlo1
-1
sgGlo1
-2
sgGlo1
-3
3553T3
A.
Glo1
Parenta
l
sgGlo1
-1
sgGlo1
-2
LG
B.
0.0
0.5
1.0
1.5
Rela
tive P
eak A
rea
LGSH
sgGlo1-2
sgGlo1-3
Parental
sgGlo1-1
3553T3 LG
0.0
0.5
1.0
1.5
Rela
tive R
LU
Viable Cells
+ 200μM Methylglyoxal
sgGlo1-2
sgGlo1-3
Parental
sgGlo1-1
3553T3 LG
NH
NH2
NH
N NH
HN
O
Arginine
MG-H1
Methylglyoxal
O
O
0
1
2
3
4
Rela
tive P
eak A
rea
MG-H1
sgGlo1-2
sgGlo1-3
Parental
sgGlo1-1
3553T3 LG
0
100
200
300
Rela
tive P
eak A
rea
MG-H1
+ 200μM Methylglyoxal
sgGlo1-2
sgGlo1-3
Parental
sgGlo1-1
3553T3 LG
3553T3Parent
3553T3sgGlo1-1
3553T3sgGlo1-2
3553T3sgGlo1-3
Tubulin
MG-H1
Tubulin
MG-H1
MGO
3553T3Parent
3553T3sgGlo1-1
3553T3sgGlo1-2
3553T3sgGlo1-3
– + – + – + – + – + – + – +
LGParent
LGsgGlo1-1
LGsgGlo1-2
10 20 30
0
1 103
2 103
Days after injection
Tu
mo
r V
olu
me (
mm
3)
3553T3 Parental
3553T3 sgGlo1-1
3553T3 sgGlo1-2
3553T3 sgGlo1-3
C. D. E.
F. G. H.
I. J. K.
105
Figure 3. Glyoxalase 1 is required for methylglyoxal detoxification and NSCLC tumor growth (A) Proliferation rates of two NSCLC cell lines independently derived from KP mice cultured in standard media or in media containing the indicated doses of methylglyoxal (MGO) or buthionine sulfoximine (BSO), an inhibitor of glutathione synthesis. Cells treated with BSO had been pre-treated with BSO for 48 hours prior to the initiation of the experiment. (B) Western blot analysis of glyoxalase 1 (Glo1) expression in parental 3553T3 and LG lung cancer cells and in independent clones where Glo1 was deleted using CRISPR/Cas9 (sgGlo1) as shown. (C) Relative levels of (S)-D-lactoylglutathione (LGSH) in 3553T3 and LG parental NSCLC cells or the clones shown in (B) where Glo1 was deleted was detected using LCMS. Values are peak area of LGSH normalized to peak area of GSH (n=3). (D) Proliferation rates of 3553T3 and LG parental cells and sgGlo1 clones (n=3). (E) Relative number of viable 3553T3 and LG lung cancer cells and in clones in which Glo1 was deleted as determined by CellTiter-Glo Luminescence Assay following a 48 hour incubation with 200µM methylglyoxal (n=3). (F) Schematic detailing how methylglyoxal can react non-enzymatically with arginine to form hydroimidazolone (MG-H1). (G) LCMS quantification of relative free MG-H1 abundance in 3553T3 and LG parental lung cancer cells and Glo1-deleted clones. Values are peak area of MG-H1 normalized to peak area of arginine (n=3). (H) LCMS quantification of free MG-H1 abundance in 3553T3 parental lung cancer cell lines or in Glo1-null clones following incubation with 200µM methylglyoxal for 16 hours. Values are normalized to MG-H1 peak area in parental lung cancer cell lines incubated without methylglyoxal treatment (n=3). (G) Western blot analysis of proteins containing MG-H1 epitopes in lysates of lung cancer parent cell lines and sgGlo1 cell lines that had been treated 200µM of methylglyoxal (MGO) for 12 hours or untreated. (H) Tumor growth over time of allografts generated from parental 3553T3 lung cancer cells and clones in which Glo1 has been deleted (n=6). (I) Western blot analysis of proteins containing MG-H1 epitopes in lysates of allografts generated from parental 3553T3 lines and Glo1-null clones. (J) Tumor growth over time of allografts generated from parental 3553T3 lung cancer cells and clones in which Glo1 has been deleted (n=6). (K) Western blot analysis of proteins containing MG-H1 epitopes in lysates of allografts generated from parental 3553T3 lines and Glo1-null clones. Values in panels A, C, D, E, G, H, and J indicate mean ± SEM

106
Deletion of glyoxalase 1 impairs tumor proliferation
A major difference between cells in culture and in tumors is that in vivo,
tumors must acquire nutrients and excrete waste via the vasculature. Tumors are
known to be poorly vascularized, potentially reducing their ability to dispose of
waste and toxic metabolites. Thus, lung cancer cells in vivo might be more sensitive
to methylglyoxal accumulation under basal conditions than cells in culture. To
determine whether Glo1 expression is important for lung tumor growth, we
implanted parental lung cancer cells and Glo1-deficient cells subcutaneously as
mouse allografts. The ability to proliferate in vivo was severely impaired in cells
that did not express Glo1 compared to parental NSCLC cancer lines (Figure 3J).
Tumors from Glo1-deleted cells also had increased MG-H1 protein adducts,
suggesting that accumulation of glycated proteins might contribute to reduced
tumor growth in vivo (Figure 3K). Taken together, these data argue that lung
cancer cells are dependent on the glyoxalase system to detoxify methylglyoxal
produced as a byproduct of increased glucose metabolism.
Methylglyoxal accumulation induces formation of DNA-protein crosslinks
To better characterize the molecular repercussions of Glo1 deletion and
exogenous methylglyoxal treatment in lung cancer cell lines, we utilized RNA
sequencing to probe the global gene expression profiles of a lung cancer parental cell
line and one Glo1-null that had been cultured in the presence or absence of
exogenous methylglyoxal. We performed hierarchical clustering of all samples based
107
on pairwise Euclidean distances of normalized gene counts and found that samples
clustered first by Glo1 status, and second by methylglyoxal treatment (Figure 4A).
Interestingly, the distance between vehicle and methylglyoxal treatment in the
parental cell line was small, suggesting that in cell culture conditions, the
glyoxalase system is robust and can efficiently detoxify exogenous methylglyoxal
without significant repercussions for cell homeostasis.
Next, we wanted to determine which biological processes were perturbed by
methylglyoxal administration or caused by Glo1 loss. We found that transcripts of
genes involved in cell cycle, DNA replication, and DNA repair were significantly
enriched upon methylglyoxal treatment (Figure 4B). Performing the same analysis
using genes that were differentially expressed upon deletion of Glo1, we found that
the transcriptional response was similar to that induced by exogenous
methylglyoxal, as transcripts involved in DNA replication and response to DNA
damage were found to be enriched (Figure 4C). This data set provides insight into
changes to cellular homeostasis that arise upon addition of exogenous
methylglyoxal or ablation of Glo1, and can suggest possible molecular targets that
would be selectively lethal in contexts in which lung cancer cells accumulate
macromolecules damaged by methylglyoxal.
As our differential expression analysis revealed that transcripts relating to
DNA replication and DNA repair were stimulated by exogenous methylglyoxal and
Glo1 loss, we wondered whether accumulation of methylglyoxal could affect DNA
stability. Methylglyoxal can react with guanyl bases, forming nucleotide adducts

108
0 Gy 4 Gy 8 Gy 16 Gy0.0
5.0 105
1.0 106
1.5 106
Radiation
Cel
l Num
ber
ParentalsgGlo1-3
Vehicle 300nM 1µM-0.5
0.0
0.5
1.0
1.5
Etoposide
Gro
wth
Rat
e (d
oubl
ings
/day
)ParentalsgGlo1-3
B. C.
Vehicle vs. Methylglyoxal Treatment
Term ID Description log10
p-value
GO:0007049 Cell cycle -26.6517
GO:0006260 DNA replication -7.0516
GO:0051302 Regulation of cell division -8.6180
GO:0007059 Chromosome segregation -9.3468
GO:0006281 DNA repair -3.5638
Parental vs. sgGlo1
Term ID Description log10
p-value
GO:0006260 DNA replication -11.1337
GO:0006974
Cellular response to DNA
damage stimulus
-4.2668
GO:0006457 Protein folding -3.1838
GO:0007049 Cell cycle -5.9281
GO:0006334 Nucleosome assemply -5.8996
0.0
0.5
1.0
1.5
Rel
ativ
e D
PCs
ParentalsgGlo1-1sgGlo1-2sgGlo1-3
0.0
0.5
1.0
1.5
2.0
Rel
ativ
e D
PCs
Vehicle400 µM Methylglyoxal
0
2
4
6
Rel
ativ
e D
PCs
400 µM Methylglyoxal
Vehicle200µM Methylglyoxal
0.0
0.5
1.0
1.5
2.0
2.5
Rel
ativ
e D
PCs
ParentalsgGlo1-2sgGlo1-3
H.
I.
D.
E. G.
F.
A.
3553T3 3553T3
LG LG

109
Figure 4. Methylglyoxal accumulation results in DNA damage and formation of DNA-protein crosslinks (A) RNA sequencing was performed on three biological replicates of the 3553T3 parental and 3553T3 sgGlo1-3 lung cancer cell line that had been cultured in the presence or absence 200µM methylglyoxal (MGO) for 12 hours. The heat map is a representation of the Euclidean distance matrix with dark blue indicating zero distance and light blue indicating large distance. The dendogram represents hierarchical clustering across the samples. (B) List of biological process gene ontology (GO) terms associated with genes that were more highly expressed when 200µM methylglyoxal was administered to 3553T3 parental cells and 3553T3 sgGlo1-3 cells relative to untreated cells. (C) List of GO terms that were associated with transcripts enriched in 3553T3 sgGlo1-3 cells relative to 3553T3 parental cell lines. (D and E) Quantification of DNA-protein crosslink (DPC) isolates was performed by the SDS/KCl precipitation method in (D) 3553T3 and (E) LG parental lung cancer cell lines that were cultured in the indicated dose of methylglyoxal. DPC levels were normalized to the untreated condition (n=6). (F and G) Quantification of DPC isolates was performed by the SDS/KCl precipitation method in (F) 3553T3 and (G) LG parental lung cancer cell lines and clones in which Glo1 was deleted. DPC levels were normalized to those of parental cell lines (n=6). (H) Proliferation rates of 3553T3 parental and 3553T3 sgGlo1-3 cell lines cultured at the indicated concentration of etoposide (n=6). (I) Cell number of 3553T3 parental and 3553T3 sgGlo1-3 cell lines 48 hours after treatment with the indicated dose of ionizing radiation in grays (Gy) (n=6). Values shown denote the mean ± SEM.
110
and causing mutagenesis and DNA damage when levels of this metabolite are
elevated (Rabbani and Thornalley, 2014; Thornalley et al., 2010). Furthermore, it
has been reported that methylglyoxal accumulation can result in formation of
covalent DNA-protein crosslinks (DPCs) (Brambilla et al., 1985; Vaz et al., 2016).
These are cytotoxic DNA lesions that can be caused by exogenous agents, such as
ionizing radiation, and by endogenously produced reactive aldehyde-containing
metabolites, including formaldehyde and methylglyoxal (Stingele and Jentsch,
2015). We isolated and quantified DPCs using a KCl/SDS precipitation assay
(Zhitkovich and Costa, 1992) and determined that DPCs accumulate upon
methylglyoxal administration (Figure 4D,E). Furthermore, DPCs were found to be
elevated in lung cancer cell lines in which Glo1 was deleted (Figure 4F,G).
Together with the finding that MG-H1 levels increase upon Glo1 loss (Figure
3G,K), this result argues that inhibiting detoxification of methylglyoxal can cause
this metabolite to accumulate and react with macromolecules in the cell.
To test whether increased reaction of methylglyoxal with DNA could be a
liability for cells that accumulate this metabolite, we assessed whether Glo1 loss
could sensitize lung cancer cells to agents that induce DNA damage. We found that
relative to the parental lung cancer cell line, a Glo1-deficient clone was more
sensitive to etoposide, a chemotherapy that induces DNA strand breaks by
inhibition of topoisomerase II (Figure 4D) and ionizing radiation (Figure 4E)
revealing a potential vulnerability of cells with impaired ability to detoxify
methylglyoxal.
111
Exogenous methylglyoxal treatment and glyoxalase 1 ablation sensitizes
cells to proteasome inhibition
It has been shown that in contexts of hyperglycemia, methylglyoxal
accumulation increases dependency on proteolytic degradation (Queisser et al.,
2010; Rabbani and Thornalley, 2012). Additionally, we determined that expression
of transcripts involved in protein folding were increased by Glo1 deletion (Figure
4C), suggesting that inhibiting this detoxification pathway can result in
accumulation of damaged, misfolded proteins modified by methylglyoxal. To
determine whether exogenous methylglyoxal could render lung cancer cells more
reliant on protein degradation, we assessed whether culturing lung cancer cell lines
in the presence of methylglyoxal could increase dependency on proteasome
inhibition. Indeed, we determined that exogenous methylglyoxal increased the
sensitivity of lung cancer cells to MG-132, a potent proteasome inhibitor (Figure
5A,B). Cells with deleted Glo1 were also found to be more susceptible to proteasome
inhibition than parental lung cell lines, displaying reduced cell number (Figure 5C)
and impaired viability (Figure 5D) upon treatment with MG-132. Together, this
data suggest that the proteasome is important for degradation of proteins damaged
by methylglyoxal, and inhibition of the proteasome results in impaired viability in
contexts where methylglyoxal accumulates.
We next wanted to determine whether we could further decrease in vivo
proliferation of lung cancer cells with Glo1 loss by targeting the proteasome. We
generated allografts from the Glo1-deleted lung cancer cell line that exhibited the

112
Figure 5. Methylglyoxal accumulation and glyoxalase 1 loss sensitizes lung cancer cells to proteasome inhibition in vitro and in tumors (A and B) Relative number of viable (A) 3553T3 and (B) LG lung cancer cells as determined by CellTiter-Glo Luminescence Assay following a 48 hr incubation with the indicated doses of methylglyoxal and the proteasome inhibitor MG-132 (n=4). (C) Relative number of viable 3553T3 parental and 3553T3 Glo1-null cells was determined by CellTiter-Glo Luminescence Assay following a 48 hr incubation with the indicated doses of the proteasome inhibitor MG-132 (n=3). (D) Percent viability was assessed by flow cytometry in 3553T3 sgGlo1-3 cells and the same clone in which Glo1 had been re-expressesd (3553T3 sgGlo1-3 pLHCX Glo1) following a 24 hr incubation with the indicated concentration of MG-132. (E) Assessment of tumor volume over time of allograft tumors generated from 3553T3 sgGlo1-3 pLHCX Glo1 and 3553T3 sgGlo1-3 cancer cells in mice that had been dosed with vehicle or the 1mg/kg bortezomib. Treatment with bortezomib was initiated one week after allograft injection, as indicated by the asterisk (n=15). Values shown denote the mean ± SEM.
5 10 15 20 250
5 102
1 103
Days After Injection
Tum
or V
olum
e (m
m3 )
sgGlo1-3; Vehicle
sgGlo1-3 + pLHCX Glo1; 1mg/kg Bortezomib
sgGlo1-3; 1mg/kg Bortezomib
sgGlo1-3 + pLHCX Glo1; Vehicle
*
Vehicle 350 nM 400 nM 450 nM0.0
0.5
1.0
1.5
MG-132
Rel
ativ
e R
LUVehicle
100µM Methylglyoxal
200µM Methylglyoxal
Vehicle 350 nM 400 nM 450 nM0.0
0.5
1.0
1.5
MG-132
Rel
ativ
e R
LU
Parental
sgGlo1-1
sgGlo1-2
sgGlo1-3
Vehicle 300 nM 450 nM0.0
0.5
1.0
1.5
MG-132
Rel
ativ
e R
LU
Vehicle
200µM Methylglyoxal
400µM Methylglyoxal
0 nM 150 nM 200 nM 250 nM 300 nM 350 nM0.0
0.2
0.4
0.6
0.8
1.0
MG-132
Viab
ility
sgGlo1-3
sgGlo1-3 + pLHCX Glo1
B.A.
D.C.
E.

113
best in vivo proliferation (Figure 3H) and the same cell line in which Glo1 had been
re-expressed as a control. One week after the tumor cells were injected, mice were
randomized into two groups and were dosed daily with 1mg/kg bortezomib, a
proteasome inhibitor with better pharmacokinetics than MG-132. While the Glo1
overexpressing clone was insensitive to bortezomib treatment, this regimen
decreased proliferation of tumors lacking Glo1 (Figure 5E). This data suggests that
cancer cells that accumulate methylglyoxal are more reliant on the proteasome, and
that a potential liability of reactive metabolite production is inducing accumulation
of damaged macromolecules.
Discussion
Changes in metabolite levels in cancer tissues can have important
implications for cell physiology and homeostasis, and can also inform how fluxes
through the metabolic network change in tumor contexts. In this study, we
performed untargeted metabolomics on lung tumors and determined that
glutathione, which has been shown to be required for malignant transformation
(Harris et al., 2015), is the metabolite that most significantly accumulates in
NSCLC lesions relative to normal lung. Interestingly, levels of the oxidized form of
glutathione were not elevated to the same extent in these tumors, indicating that
the ratio of GSH to GSSG is increased and that NSCLC have higher antioxidant
capacity than normal lung. This finding is consistent with emerging data that
suggests that tumors are in a more reduced state than normal tissues (Gamcsik et

114
al., 2012; Hung et al., 2011; Hung and Yellen, 2014; Zhao et al., 2016), and this
state can be limiting for tumor growth (Sullivan et al. 2018).
We also determined that NSCLC tumors accumulate GSH-electrophile
conjugates, and that the reactive electrophile methylglyoxal is produced at greater
levels in tumors than normal lung in both mouse and humans. Since we determine
that methylglyoxal is formed as a byproduct of glycolysis in NSCLC, we propose
that the increased production of methylglyoxal observed in this context is likely due
to the elevated glucose consumption of tumors. Though direct attempts to target
glycolysis for cancer therapy have been challenging, consequences of reprogrammed
glucose metabolism, such as increased production of methylglyoxal, could serve as
an alternative therapeutic strategy to exploit increased glucose metabolism. We
determine that inhibiting detoxification of methylglyoxal by deletion of Glo1 results
in accumulation of DNA and proteins damaged by this metabolite, and sensitizes
lung cancer cells to agents that induce DNA damage or inhibit proteasome activity.
This suggests that interventions that promote methylglyoxal accumulation in
tumors could be one strategy to enhance the efficacy of existent cancer treatments.
Taken more broadly, the findings presented in this study suggest that
production of reactive metabolites as a secondary consequence of reprogrammed
cancer metabolism could lead to other targetable vulnerability of tumor cells.
Glutathione appears to be critical for the detoxification of many reactive
electrophiles, including fumarate, which accumulates in FH-null cancers (Sullivan
et al., 2013; Zheng et al., 2015) and ROS (Garama et al., 2015; Harris et al., 2015).

115
Limiting glutathione availability or targeting detoxification pathways of reactive
metabolites could be a mechanism to selectively target cancer cells that produce
reactive metabolites at higher levels than normal tissues. A greater understanding
of which detoxification pathways are amenable to clinical targeting could reveal
novel therapeutic strategies for the treatment of cancer.
Materials and Methods
Mouse Models: For experiments involving the LA2 model (Johnson et al., 2001) 4
to 6-month old mice of a mixed 129/Sv and C57Bl6 genetic background were used.
For experiments involving KP animals, 2 to 6-month old mice of a mixed 129/Sv and
C57Bl6 genetic background were used. Lesions in the KP model were initiated by
2×10⁷ PFU of adenovirus with Cre-recombinase (Gene Transfer Vector Core,
University of Iowa) delivered intratracheally.
For allograft experiments, 1×10⁵ cancer cells were suspended in 100µL PBS
and injected into the flanks of 4 to 6-week old male nu/nu Nude mice (Charles River
Laboratories, 088). Tumor volume was measured by caliper in two dimensions, and
volumes were calculated using the equation V = (p/6)LW2, where L is the longer of
the two measured dimension. Mice were sacrificed after the first tumor was
measured to be greater than 1cm3 or if recommended by the veterinary staff.
Bortezomib was diluted in sterile PBS and administered intraperitoneally at
1mg/kg. All animal work was approved by the Massachusetts Institute of
Technology’s Committee on Animal Care.

116
Venous Infusions: Catheters were surgically implanted into the jugular veins of
tumor bearing animals three days prior to the infusion experiment. The day of the
experiment, animals were fasted for six hours and subsequently [U-13C6]glucose
(Cambridge Isotope Laboratories, CLM-1396-PK) was infused for six hours at a rate
of 30mg/kg/min into conscious, free-moving animals. Animals were terminally
anesthetized with 120mg/kg sodium pentobarbital and tumors were rapidly excised
and frozen utilizing a BioSqueezer (Bio Spec Products Inc.) that had been pre-cooled
in liquid nitrogen. Tumors were stored at -80°C for subsequent analysis.
Tumor Metabolite Extraction: A tissue fragment weighing 10-40 mg was
homogenized cryogenically (CryoMill, Retsch). Metabolites were extracted using ice-
cold HPLC grade methanol, water, and chloroform in a 600:400:300 ratio. Samples
were vortexed at 4°C for 10 minutes, and then centrifuged at 4°C degrees for 10
minutes to separate the aqueous and organic layers. The top aqueous layer was
collected and dried under nitrogen gas for subsequent analysis by mass-
spectrometry.
Untargeted Metabolomics: For untargeted metabolomics analysis, data were
acquired using a liquid chromatography mass-spectrometry (LCMS) system
comprised of a Nexera X2 U-HPLC (Shimadzu, Marlborough, MA) coupled to a Q-
Exactive hybrid quadrupole orbitrap mass spectrometer (Thermo Fisher Scientific;
Waltham, MA). Negative ion mode analyses of polar metabolites were achieved

117
using a HILIC method under basic conditions. Briefly, 30µl of tissue homogenate
was homogenate extracted using 120µL of 80% methanol containing [15N]inosine,
thymine-d4, and glycocholate-d4 as internal standards (Cambridge Isotope
Laboratories; Andover, MA). The samples were centrifuged (10 min, 9000×g, 4°C)
and the supernatants were injected directly onto a 150 × 2.0 mm Luna NH2 column
(Phenomenex; Torrance, CA). Samples were eluted at a flow rate of 400µl/min with
initial conditions of 10% mobile phase A (20mM ammonium acetate and 20mM
ammonium hydroxide in water) and 90% mobile phase B (10mM ammonium
hydroxide in 75:25 vol/vol acetonitrile/methanol) followed by a 10 minute linear
gradient to 100% mobile phase A. MS full scan data were acquired over m/z 70–750.
The ionization source voltage is −3.0 kV and the source temperature is 325°C.
Spectra were processed utilizing XCMS Online to identify metabolites that
differentially accumulate in lung and tumors. (Tautenhahn et al., 2012). To identify
GSH-electrophile conjugates that were elevated in NSCLC tumors relative to
normal lung, the human metabolome database (Wishart et al., 2018) was used to
identify peaks in the untargeted metabolomics data set with masses corresponding
to annotated conjugates.
Cell culture experiments: Cell lines were generated from tumors arising from the
KP lung cancer model as previously described (Davidson et al., 2016). Briefly, KP
lung lesions were digested in collagenase IV/dispase/trypsin for 30 minutes at 37°C.
All cell lines were cultured in DMEM (Corning 10-013-CV) supplemented with 10%

118
fetal bovine serum. For all experiments, media was changed to DMEM without
pyruvate (Corning 10-017-CV) supplemented with 10% dialyzed fetal bovine serum,
treatment condition as indicated. The reagents used in this study include
methylglyoxal (Sigma, M0252), 2-deoxy-D-glucose (2DG, Sigma, D6134), L-
buthionine-sulfoximine (BSO, Sigma, B2515), etoposide (Sigma, E1383), MG-132
(Selleck Chemicals, S2619), bortezomib (Selleck Chemicals, S1013).
For LCMS experiments, 1×10⁶ cells were seeded in 10cm tissue culture
dishes. After 24 hours, cells were washed three times with PBS and media was
changed to 5mL of the appropriate treatment condition. For isotope labeling
experiments, the media contained either 25mM [U-13C6]glucose (Cambridge Isotope
Laboratories, CLM-1396-PK) or 400µM [U-13C2]glycine (Cambridge Isotope
Laboratories, CLM-1017-PK). After 12 hours, cells were washed rapidly with ice-
cold blood bank saline and lysed on the dish with 1mL of ice-cold 80% HPLC grade
methanol in HPLC grade water. Next, samples were vortexed at 4°C for 10 minutes,
and then centrifuged at 4°C degrees for 10 minutes to precipitate the protein. The
supernatant was collected, dried under nitrogen gas, and resuspended in 100µL of
80% HPLC grade methanol in HPLC grade water for subsequent analysis by mass-
spectrometry.
For proliferation experiments, 2×10⁴ cells were seeded replicate six-well
dishes. To deplete intracellular glutathione prior to the initiation of the experiment,
half the wells were seeded in media containing 200µM buthionine sulfoximine. After
24 hours, one dish was counted to determine the starting cell number prior to

119
treatment. All remaining dishes were washed three times in phosphate buffered
saline (PBS), and 4mL of media containing the indicated treatment was added to
cells. Three days following the treatment, cell counts were determined utilizing a
Cellometer Auto T4 Plus Cell Counter (Nexcelom Bioscience).
For experiments in which number of viable cells were measured, cells were
plated in 96-well dishes at a seeding density of 5,000 cells per well. Cells were
permitted to settle overnight, and subsequently were washed three times PBS and
cultured in the indicated treatment condition for 48 hours. Number of viable cells
was assessed utilizing the CellTiter-Glo Luminescent Cell Viability Assay (Promega
G7572) to count number of viable cells.
Targeted Metabolomics: Metabolite profiling was conducted on a QExactive
bench top orbitrap mass spectrometer equipped with an Ion Max source and a HESI
II probe, which was coupled to a Dionex UltiMate 3000 HPLC system (Thermo
Fisher Scientific, San Jose, CA). External mass calibration was performed using the
standard calibration mixture every 7 days. For each sample 4µL were injected onto
a SeQuant® ZIC®-pHILIC 150 × 2.1mm analytical column equipped with a 2.1 ×
20mm guard column (both 5mm particle size; EMD Millipore). Buffer A was 20mM
ammonium carbonate, 0.1% ammonium hydroxide; Buffer B was acetonitrile. The
column oven and autosampler tray were held at 25°C and 4°C, respectively. The
chromatographic gradient was run at a flow rate of 0.150mL/min as follows: 0-20
min: linear gradient from 80-20% B; 20-20.5 min: linear gradient form 20-80% B;

120
20.5-28 min: hold at 80% B. The mass spectrometer was operated in full-scan,
polarity-switching mode, with the spray voltage set to 3.0 kV, the heated capillary
held at 275°C, and the HESI probe held at 350°C. The sheath gas flow was set to 40
units, the auxiliary gas flow was set to 15 units, and the sweep gas flow was set to 1
unit. MS data acquisition was performed in a range of m/z = 70–1000, with the
resolution set at 70,000, the AGC target at 1×10⁶, and the maximum injection time
(Max IT) at 20 msec. For detection of metabolites associated with methylglyoxal,
targeted selected ion monitoring (tSIM) scans in positive mode were included. The
isolation window was set at 1.0 m/z and tSIM scans were centered at m/z =
229.1295 (Positive Mode) for hydroimidazolone (MG-H1) and m/z = 380.1122
(Positive Mode) and 378.0966 (Negative Mode) for (S)-D-lactoylglutathione. For all
tSIM scans, the resolution was set at 70,000, the AGC target was 1×10⁵, and the
max IT was 250 msec.
Cell Line Generation: E-CRISP (e-crisp.org) was used to design sgRNA targeting
Glo1 (F 5’ CACCGCTGTCACCCACCTTGGTGCTGTTT 3’; R 5’ 5’
AAACAGCACCAAGGTGGGTGACAGCGGTG 3’). The sgRNA was cloned into
lentiCRISPR v2 (Addgene, 52961). Isogenic clones were selected for comparison of
CRISPR cell lines. To generate Glo1 overexpressing cells, mouse-tagged ORF clone
of Glo1 (OriGene Technologies, MR201690) was cloned into pLHCX overexpression
retroviral vector.
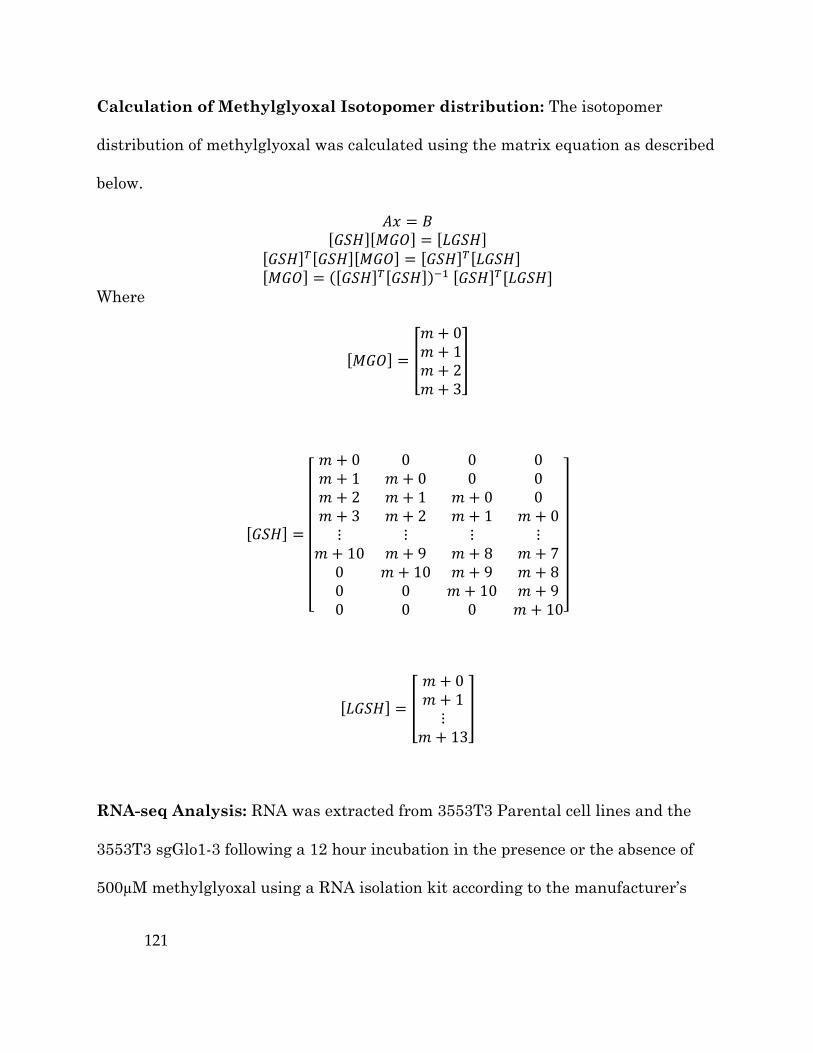
121
Calculation of Methylglyoxal Isotopomer distribution: The isotopomer
distribution of methylglyoxal was calculated using the matrix equation as described
below.
𝐴𝑥 = 𝐵 𝐺𝑆𝐻 𝑀𝐺𝑂 = 𝐿𝐺𝑆𝐻
𝐺𝑆𝐻 , 𝐺𝑆𝐻 𝑀𝐺𝑂 = 𝐺𝑆𝐻 , 𝐿𝐺𝑆𝐻 𝑀𝐺𝑂 = 𝐺𝑆𝐻 , 𝐺𝑆𝐻 -. 𝐺𝑆𝐻 ,[𝐿𝐺𝑆𝐻]
Where
𝑀𝐺𝑂 =
𝑚 + 0𝑚 + 1𝑚 + 2𝑚 + 3
𝐺𝑆𝐻 =
𝑚 + 0 0 0 0𝑚 + 1 𝑚 + 0 0 0𝑚 + 2 𝑚 + 1 𝑚 + 0 0𝑚 + 3 𝑚 + 2 𝑚 + 1 𝑚 + 0⋮ ⋮ ⋮ ⋮
𝑚 + 10 𝑚 + 9 𝑚 + 8 𝑚 + 70 𝑚 + 10 𝑚 + 9 𝑚 + 80 0 𝑚 + 10 𝑚 + 90 0 0 𝑚 + 10
𝐿𝐺𝑆𝐻 =
𝑚 + 0𝑚 + 1⋮
𝑚 + 13
RNA-seq Analysis: RNA was extracted from 3553T3 Parental cell lines and the
3553T3 sgGlo1-3 following a 12 hour incubation in the presence or the absence of
500µM methylglyoxal using a RNA isolation kit according to the manufacturer’s

122
instructions (QIAGEN, RNeasy Mini Kit, 74104). RNA sequencing reads were
mapped to the mouse genome (mm10) using bwa v0.7.12 (Li and Durbin, 2009), and
gene counts were obtained using featureCounts v1.6 with Ensembl 84 mouse
transcript annotations. Genes with fewer than 5 reads in at least 3 samples were
filtered out as not expressed. Count normalization was performed using the rlog
function in the DESeq2 v1.18.1 R package (Love et al., 2014), and clustering was
performed with the pheatmap function based on pairwise Euclidean distances
calculated using the dist function. Briefly, the Euclidean distance between two
samples p and q with N genes each was calculated with the following equation:
d(p,q) = (qi − pi )2
i=1
N∑
Both Glo1 genotype (knockout or wild-type) and treatment (methylglyoxal or
vehicle), were included as covariates in the DESeq2 model, as well as an interaction
term between the two covariates. For each covariate (Glo1 genotype or
methylglyoxal treatment), the Wald test was used to estimate the significance and
direction of effect. We performed differential expression analysis (Love et al., 2014),
and utilized gene ontology (GO) enrichment analysis to discover terms
overrepresented among the list of genes upregulated upon exogenous methylglyoxal
treatment (Eden et al., 2007; Eden et al., 2009) and summarized the results by
eliminating functionally redundant GO terms (Supek et al., 2011).

123
Immunoblot: Cells were washed with cold PBS and lysed with cold RIPA buffer
containing cOmplete Mini protease inhibitor (Roche, 11836170001). Protein
concentration was quantified by BCA Protein Assay (Pierce, 23225) with BSA as a
standard. Lysates were resolved by SDS-PAGE using standard techniques. Proteins
were transferred onto nitrocellulose membranes using the iBlot2 Dry Blotting
System (Thermo Fisher, IB21001, IB23001) and protein was detected with the
following primary antibodies: anti-Methylglyoxal (Cell Biolabs, STA-011), anti-
Glyoxalase 1 (Novus Biologicals, 19015), anti-Vinculin (Sigma, V9131), anti-Tubulin
(Abcam, ab4074). The secondary antibodies used were IR680LT dye conjugated
anti-rabbit IgG (Licor Biosciences, 925-68021) and IRDye 800CW conjugated anti-
mouse IgG (Licor Biosciences, s 925-32210).
DNA-Protein Crosslinks Quantification: DPCs were quantified using a
KCl/SDS precipitation assay (Zhitkovich and Costa, 1992). 2×10⁶ cells were lysed in
500µL of lysis buffer (2% SDS in 20mM Tris-HCl, pH=7.5) and snap-frozen in liquid
nitrogen. Next, cells were thawed at 55ºC for 5 minutes and sonicated in a 4ºC
water bath for 5 cycle at 20 seconds each. To precipitate the protein and DPCs,
500µL of assay buffer (200mM KCl in 20mM Tris, pH 7.5) was added to each
sample. The samples were kept on ice for 5 minutes, and then centrifuged at
15,000×g at 4ºC for 5 minutes. The supernatant was kept to quantify the soluble
DNA by Quant-iT PicoGreen dsDNA Assay (ThermoFisher Scientific, P11496)
124
The pellet was resuspended in 500µL of assay buffer, incubated shaking at 55ºC for
5 minutes, cooled on ice for 5 minutes, and centrifuged at 15,000×g at 4ºC for 5
minutes. This wash procedure was repeated three additional times prior to final
resuspension in 500µL of assay buffer. Protein was digested with 0.2 mg/mL
proteinase K (New England BioLabs, P8107S) and held at 55ºC for 3 hours shaking.
Next, 10µL of 50mg/mL of BSA (UltraPure, Invitrogen, AM2616) was added to each
sample to precipitate the SDS. Samples were cooled on ice for 5 minutes and
centrifuged 15,000×g at 4ºC for 5 minutes. The DNA that had been crosslinked is in
the supernatant and can be quantified by Quant-iT PicoGreen dsDNA Assay
(ThermoFisher Scientific, P11496). DPCs were calculated as the ratio between DNA
precipitated by SDS/KCl and the total DNA (soluble DNA + DNA precipitated by
SDS/KCl).
Irradiation of cells: Cells were cultured in standard plastic tissue culture plates
at 37 degrees Celsius, 5% CO2. Immediately prior to irradiation they were removed
from the incubator and were irradiated at room temperature in ambient air with a
single dose of gamma radiation in a dual 137Cs source low dose-rate irradiator
(Gammacell 40 Exactor, Best Theratronics). The total dose delivered was 0 (control),
4, 8, or 16 Gy. During radiation, there was minimum 3 mm media above the cells
and 5 mm water-equivalent bolus material below the plate to ensure that irradiated
cells were not within the dose buildup region. The dose was verified using a
thermoluminescent dosimeter.

125
References
Adam, J., Yang, M., Bauerschmidt, C., Kitagawa, M., O'Flaherty, L., Maheswaran, P., Ozkan, G., Sahgal, N., Baban, D., Kato, K., et al. (2013). A role for cytosolic fumarate hydratase in urea cycle metabolism and renal neoplasia. Cell Rep 3, 1440-1448.
Bierhaus, A., Fleming, T., Stoyanov, S., Leffler, A., Babes, A., Neacsu, C., Sauer, S.K., Eberhardt, M., Schnolzer, M., Lasitschka, F., et al. (2012). Methylglyoxal modification of Nav1.8 facilitates nociceptive neuron firing and causes hyperalgesia in diabetic neuropathy. Nat Med 18, 926-933.
Blair, I.A. (2010). Analysis of endogenous glutathione-adducts and their metabolites. Biomed Chromatogr 24, 29-38.
Brambilla, G., Sciaba, L., Faggin, P., Finollo, R., Bassi, A.M., Ferro, M., and Marinari, U.M. (1985). Methylglyoxal-induced DNA-protein cross-links and cytotoxicity in Chinese hamster ovary cells. Carcinogenesis 6, 683-686.
Cairns, R.A., Harris, I.S., and Mak, T.W. (2011). Regulation of cancer cell metabolism. Nat Rev Cancer 11, 85-95.
Chen, Z., Cheng, K., Walton, Z., Wang, Y., Ebi, H., Shimamura, T., Liu, Y., Tupper, T., Ouyang, J., Li, J., et al. (2012). A murine lung cancer co-clinical trial identifies genetic modifiers of therapeutic response. Nature 483, 613-617.
Davidson, S.M., Papagiannakopoulos, T., Olenchock, B.A., Heyman, J.E., Keibler, M.A., Luengo, A., Bauer, M.R., Jha, A.K., O'Brien, J.P., Pierce, K.A., et al. (2016). Environment Impacts the Metabolic Dependencies of Ras-Driven Non-Small Cell Lung Cancer. Cell Metab 23, 517-528.
DeBerardinis, R.J., and Chandel, N.S. (2016). Fundamentals of cancer metabolism. Sci Adv 2, e1600200.
DeNicola, G.M., Karreth, F.A., Humpton, T.J., Gopinathan, A., Wei, C., Frese, K., Mangal, D., Yu, K.H., Yeo, C.J., Calhoun, E.S., et al. (2011). Oncogene-induced Nrf2 transcription promotes ROS detoxification and tumorigenesis. Nature 475, 106-109.
Dobler, D., Ahmed, N., Song, L., Eboigbodin, K.E., and Thornalley, P.J. (2006). Increased dicarbonyl metabolism in endothelial cells in hyperglycemia induces anoikis and impairs angiogenesis by RGD and GFOGER motif modification. Diabetes 55, 1961-1969.

126
Eden, E., Lipson, D., Yogev, S., and Yakhini, Z. (2007). Discovering motifs in ranked lists of DNA sequences. PLoS Comput Biol 3, e39.
Eden, E., Navon, R., Steinfeld, I., Lipson, D., and Yakhini, Z. (2009). GOrilla: a tool for discovery and visualization of enriched GO terms in ranked gene lists. BMC Bioinformatics 10, 48.
Elliott, W.H. (1960). Methylglyoxal formation from aminoacetone by ox plasma. Nature 185, 467-468.
Frezza, C., Zheng, L., Folger, O., Rajagopalan, K.N., MacKenzie, E.D., Jerby, L., Micaroni, M., Chaneton, B., Adam, J., Hedley, A., et al. (2011). Haem oxygenase is synthetically lethal with the tumour suppressor fumarate hydratase. Nature 477, 225-228.
Gamcsik, M.P., Kasibhatla, M.S., Teeter, S.D., and Colvin, O.M. (2012). Glutathione levels in human tumors. Biomarkers 17, 671-691.
Gorrini, C., Harris, I.S., and Mak, T.W. (2013). Modulation of oxidative stress as an anticancer strategy. Nat Rev Drug Discov 12, 931-947.
Griffith, O.W. (1982). Mechanism of action, metabolism, and toxicity of buthionine sulfoximine and its higher homologs, potent inhibitors of glutathione synthesis. J Biol Chem 257, 13704-13712.
Han, Y., Randell, E., Vasdev, S., Gill, V., Curran, M., Newhook, L.A., Grant, M., Hagerty, D., and Schneider, C. (2009). Plasma advanced glycation endproduct, methylglyoxal-derived hydroimidazolone is elevated in young, complication-free patients with Type 1 diabetes. Clin Biochem 42, 562-569.
Harris, I.S., Treloar, A.E., Inoue, S., Sasaki, M., Gorrini, C., Lee, K.C., Yung, K.Y., Brenner, D., Knobbe-Thomsen, C.B., Cox, M.A., et al. (2015). Glutathione and thioredoxin antioxidant pathways synergize to drive cancer initiation and progression. Cancer Cell 27, 211-222.
Hay, N. (2016). Reprogramming glucose metabolism in cancer: can it be exploited for cancer therapy? Nat Rev Cancer 16, 635-649.
Hung, Y.P., Albeck, J.G., Tantama, M., and Yellen, G. (2011). Imaging cytosolic NADH-NAD(+) redox state with a genetically encoded fluorescent biosensor. Cell Metab 14, 545-554.
Hung, Y.P., and Yellen, G. (2014). Live-cell imaging of cytosolic NADH-NAD+ redox state using a genetically encoded fluorescent biosensor. Methods Mol Biol 1071, 83-95.

127
Johnson, L., Mercer, K., Greenbaum, D., Bronson, R.T., Crowley, D., Tuveson, D.A., and Jacks, T. (2001). Somatic activation of the K-ras oncogene causes early onset lung cancer in mice. Nature 410, 1111-1116.
Kim, D., Fiske, B.P., Birsoy, K., Freinkman, E., Kami, K., Possemato, R.L., Chudnovsky, Y., Pacold, M.E., Chen, W.W., Cantor, J.R., et al. (2015). SHMT2 drives glioma cell survival in ischaemia but imposes a dependence on glycine clearance. Nature 520, 363-367.
Leonard, P.G., Satani, N., Maxwell, D., Lin, Y.H., Hammoudi, N., Peng, Z., Pisaneschi, F., Link, T.M., Lee, G.R.t., Sun, D., et al. (2016). SF2312 is a natural phosphonate inhibitor of enolase. Nat Chem Biol 12, 1053-1058.
Li, H., and Durbin, R. (2009). Fast and accurate short read alignment with Burrows-Wheeler transform. Bioinformatics 25, 1754-1760.
Liberti, M.V., and Locasale, J.W. (2016). The Warburg Effect: How Does it Benefit Cancer Cells? Trends Biochem Sci 41, 211-218.
Love, M.I., Huber, W., and Anders, S. (2014). Moderated estimation of fold change and dispersion for RNA-seq data with DESeq2. Genome Biol 15, 550.
Luengo, A., Gui, D.Y., and Vander Heiden, M.G. (2017). Targeting Metabolism for Cancer Therapy. Cell Chem Biol 24, 1161-1180.
Lunt, S.Y., and Vander Heiden, M.G. (2011). Aerobic glycolysis: meeting the metabolic requirements of cell proliferation. Annu Rev Cell Dev Biol 27, 441-464.
Moraru, A., Wiederstein, J., Pfaff, D., Fleming, T., Miller, A.K., Nawroth, P., and Teleman, A.A. (2018). Elevated Levels of the Reactive Metabolite Methylglyoxal Recapitulate Progression of Type 2 Diabetes. Cell Metab 27, 926-934 e928.
Muller, F.L., Colla, S., Aquilanti, E., Manzo, V.E., Genovese, G., Lee, J., Eisenson, D., Narurkar, R., Deng, P., Nezi, L., et al. (2012). Passenger deletions generate therapeutic vulnerabilities in cancer. Nature 488, 337-342.
Pavlova, N.N., and Thompson, C.B. (2016). The Emerging Hallmarks of Cancer Metabolism. Cell Metab 23, 27-47.
Piskounova, E., Agathocleous, M., Murphy, M.M., Hu, Z., Huddlestun, S.E., Zhao, Z., Leitch, A.M., Johnson, T.M., DeBerardinis, R.J., and Morrison, S.J. (2015). Oxidative stress inhibits distant metastasis by human melanoma cells. Nature 527, 186-191.

128
Queisser, M.A., Yao, D., Geisler, S., Hammes, H.P., Lochnit, G., Schleicher, E.D., Brownlee, M., and Preissner, K.T. (2010). Hyperglycemia impairs proteasome function by methylglyoxal. Diabetes 59, 670-678.
Rabbani, N., and Thornalley, P.J. (2012). Methylglyoxal, glyoxalase 1 and the dicarbonyl proteome. Amino Acids 42, 1133-1142.
Rabbani, N., and Thornalley, P.J. (2014). Dicarbonyl proteome and genome damage in metabolic and vascular disease. Biochem Soc Trans 42, 425-432.
Rabbani, N., and Thornalley, P.J. (2015). Dicarbonyl stress in cell and tissue dysfunction contributing to ageing and disease. Biochem Biophys Res Commun 458, 221-226.
Ravichandran, M., Priebe, S., Grigolon, G., Rozanov, L., Groth, M., Laube, B., Guthke, R., Platzer, M., Zarse, K., and Ristow, M. (2018). Impairing L-Threonine Catabolism Promotes Healthspan through Methylglyoxal-Mediated Proteohormesis. Cell Metab 27, 914-925 e915.
Riester, M., Xu, Q., Moreira, A., Zheng, J., Michor, F., and Downey, R.J. (2018). The Warburg effect: persistence of stem-cell metabolism in cancers as a failure of differentiation. Ann Oncol 29, 264-270.
Sartori, A., Garay-Malpartida, H.M., Forni, M.F., Schumacher, R.I., Dutra, F., Sogayar, M.C., and Bechara, E.J. (2008). Aminoacetone, a putative endogenous source of methylglyoxal, causes oxidative stress and death to insulin-producing RINm5f cells. Chem Res Toxicol 21, 1841-1850.
Shackelford, D.B., Abt, E., Gerken, L., Vasquez, D.S., Seki, A., Leblanc, M., Wei, L., Fishbein, M.C., Czernin, J., Mischel, P.S., et al. (2013). LKB1 inactivation dictates therapeutic response of non-small cell lung cancer to the metabolism drug phenformin. Cancer Cell 23, 143-158.
Sousa Silva, M., Gomes, R.A., Ferreira, A.E., Ponces Freire, A., and Cordeiro, C. (2013). The glyoxalase pathway: the first hundred years... and beyond. Biochem J 453, 1-15.
Stingele, J., and Jentsch, S. (2015). DNA-protein crosslink repair. Nat Rev Mol Cell Biol 16, 455-460.
Sullivan, L.B., Gui, D.Y., and Vander Heiden, M.G. (2016). Altered metabolite levels in cancer: implications for tumour biology and cancer therapy. Nat Rev Cancer 16, 680-693.
129
Sullivan, L.B., Martinez-Garcia, E., Nguyen, H., Mullen, A.R., Dufour, E., Sudarshan, S., Licht, J.D., Deberardinis, R.J., and Chandel, N.S. (2013). The proto-oncometabolite fumarate binds glutathione to amplify ROS-dependent signaling. Mol Cell 51, 236-248.
Sullivan, L.B., Luengo, A., Danai L.V., Bush L.N., Diehl F.F., Hosios A.M., Lau A.N., Elmiligy S., Malstrom S., Lewis C.A., Vander Heiden M.G. (2018). Evidence for Aspartate as an Endogenous Metabolic Limitation for Tumour Growth. Nat Cell Bio. Manuscript Accepted
Supek, F., Bosnjak, M., Skunca, N., and Smuc, T. (2011). REVIGO summarizes and visualizes long lists of gene ontology terms. PLoS One 6, e21800.
Tautenhahn, R., Patti, G.J., Rinehart, D., and Siuzdak, G. (2012). XCMS Online: a web-based platform to process untargeted metabolomic data. Anal Chem 84, 5035-5039.
Thornalley, P.J., Waris, S., Fleming, T., Santarius, T., Larkin, S.J., Winklhofer-Roob, B.M., Stratton, M.R., and Rabbani, N. (2010). Imidazopurinones are markers of physiological genomic damage linked to DNA instability and glyoxalase 1-associated tumour multidrug resistance. Nucleic Acids Res 38, 5432-5442.
Tuveson, D.A., Shaw, A.T., Willis, N.A., Silver, D.P., Jackson, E.L., Chang, S., Mercer, K.L., Grochow, R., Hock, H., Crowley, D., et al. (2004). Endogenous oncogenic K-ras(G12D) stimulates proliferation and widespread neoplastic and developmental defects. Cancer Cell 5, 375-387.
Vander Heiden, M.G., and DeBerardinis, R.J. (2017). Understanding the Intersections between Metabolism and Cancer Biology. Cell 168, 657-669.
Vaz, B., Popovic, M., Newman, J.A., Fielden, J., Aitkenhead, H., Halder, S., Singh, A.N., Vendrell, I., Fischer, R., Torrecilla, I., et al. (2016). Metalloprotease SPRTN/DVC1 Orchestrates Replication-Coupled DNA-Protein Crosslink Repair. Mol Cell 64, 704-719.
Wishart, D.S., Feunang, Y.D., Marcu, A., Guo, A.C., Liang, K., Vazquez-Fresno, R., Sajed, T., Johnson, D., Li, C., Karu, N., et al. (2018). HMDB 4.0: the human metabolome database for 2018. Nucleic Acids Res 46, D608-D617.
Zhao, Y., Wang, A., Zou, Y., Su, N., Loscalzo, J., and Yang, Y. (2016). In vivo monitoring of cellular energy metabolism using SoNar, a highly responsive sensor for NAD(+)/NADH redox state. Nat Protoc 11, 1345-1359.

130
Zheng, L., Cardaci, S., Jerby, L., MacKenzie, E.D., Sciacovelli, M., Johnson, T.I., Gaude, E., King, A., Leach, J.D., Edrada-Ebel, R., et al. (2015). Fumarate induces redox-dependent senescence by modifying glutathione metabolism. Nat Commun 6, 6001.
Zheng, L., Mackenzie, E.D., Karim, S.A., Hedley, A., Blyth, K., Kalna, G., Watson, D.G., Szlosarek, P., Frezza, C., and Gottlieb, E. (2013). Reversed argininosuccinate lyase activity in fumarate hydratase-deficient cancer cells. Cancer Metab 1, 12.
Zhitkovich, A., and Costa, M. (1992). A simple, sensitive assay to detect DNA-protein crosslinks in intact cells and in vivo. Carcinogenesis 13, 1485-1489.
131
Chapter 3: Mitochondrial membrane hyperpolarization
limits NAD+ regeneration in cancer cells
Authors: Alba Luengo1,2,6, Zhaoqi Li1,2,6, Dan Y. Gui1,2, Lucas B. Sullivan1,2, , Caroline A. Lewis3, Maria Zagorulya2, Craig J. Thomas4, Matthew G. Vander Heiden1,2,5 Author Affiliations: 1 Koch Institute for Integrative Cancer Research, Massachusetts Institute of Technology, Cambridge, MA 02139, USA 2 Department of Biology, Massachusetts Institute of Technology, Cambridge, MA 02139, USA 3 Whitehead Institute for Biomedical Research, Massachusetts Institute of Technology, Cambridge, MA 02142, USA 4 NIH Chemical Genomics Center, National Center for Advancing Translational Sciences, NIH, Bethesda, MD 20892, USA 5 Dana-Farber Cancer Institute, Boston MA 02115, USA 6 Co-first author This chapter is unpublished as of May 2018

132
Abstract
The propensity of cancer cells to consume large quantities of glucose and
metabolize this glucose primarily to lactate, regardless of oxygen availability, is
known as aerobic glycolysis or the Warburg effect and is one of the most prominent
features of cancer cell metabolism. The pyruvate dehydrogenase complex (PDH)
catalyzes the oxidation of pyruvate in the mitochondria as an alternative to lactate
production, and regulation of PDH activity can influence pyruvate fate in cells.
Here, we utilize the compound AZD7545 to activate PDH by inhibiting its negative
regulator, pyruvate dehydrogenase kinase (PDK). PDK inhibition increases
pyruvate oxidation and mitochondrial respiration, suppresses the Warburg effect,
and reduces cancer cell proliferation. We show that PDK inhibition slows
proliferation by perturbing NAD+/NADH homeostasis, as increasing the capacity of
cancer cells to generate NAD+ by orthogonal pathways decreases sensitivity to
AZD7545. We also establish that electron acceptor insufficiency observed upon PDK
inhibition is caused by mitochondrial hyperpolarization, which in turn limits the
capacity of the mitochondrial electron transport chain (ETC) to regenerate NAD+.
Surprisingly, increasing ETC by uncoupling mitochondrial respiration from ATP
synthesis or by increasing ATP consumption suppresses the proliferation defect
caused by PDK inhibition. This suggests electron acceptor generation, rather than
mitochondrial ATP production, is a limiting function of mitochondrial respiration
when PDK is inhibited. Finally, targeting the ETC with the complex I inhibitor
metformin can further disrupt NAD+/NADH balance and potentiate the anti-

133
proliferative effect of AZD7545 in vitro and in vivo. These findings suggest that
cancer cells have limited capacity to regenerate NAD+ by mitochondrial respiration,
arguing that the production of lactate from glucose is a consequence of redox
requirements and providing an explanation for the Warburg effect in cancer cells.
Introduction
Cancer cells reprogram metabolism to support the biochemical demands of
increased proliferation (Locasale and Cantley, 2011; Lunt and Vander Heiden,
2011; Ward and Thompson, 2012). A universal feature of the altered metabolism of
cancer cells is increased glucose uptake and the propensity to secrete glucose as
lactate rather than oxidizing glucose carbons via pathways that require
mitochondrial respiration, regardless of oxygen availability. This phenomenon,
known as the “Warburg effect” or aerobic glycolysis, is common among cancers and
has been shown to be a requirement for tumor proliferation in some contexts
(Fantin et al., 2006; Le et al., 2010; Shim et al., 1998; Xie et al., 2014)
Why aerobic glycolysis is a prominent feature of cancer metabolism remains
controversial. Proliferating cells have increased demand for ATP to support biomass
synthesis, yet aerobic glycolysis is less efficient for ATP production than oxidative
metabolism. This discrepancy caused Otto Warburg, who first observed this
phenotype, to conclude that tumors must have defects in mitochondrial respiration
(Warburg, 1956). However, it has since been shown that tumors not only have
functional mitochondria (Koppenol et al., 2011), but that tumors require

134
mitochondria and respiration for growth, progression, and metastasis (LeBleu et al.,
2014; Tan et al., 2015; Viale et al., 2014; Weinberg et al., 2010). Thus, an
explanation for high glycolytic flux and lactate production in cancer must also
account for the fact that mitochondrial respiration is also needed for cancer cell
proliferation.
One proposed benefit of the Warburg effect is that the increased glucose
consumption observed in cancer cells can shunt important biosynthetic precursors
into anabolic reactions that branch from glycolysis, including pathways that
contribute to production of nucleosides, lipids and proteins (Boroughs and
DeBerardinis, 2015; Cairns et al., 2011; Levine and Puzio-Kuter, 2010). Though the
idea that inefficient ATP production is a tradeoff for supporting anabolic reactions
is an attractive one, glycolytic intermediates are not necessarily elevated in
proliferating cells (Lunt et al., 2015; Williamson et al., 1970) and many cancer cells
excrete the majority of glucose carbons as lactate, which questions the extent to
which glucose can fuel the biosynthetic reactions that contribute to cell mass
(DeBerardinis et al., 2007; Lunt and Vander Heiden, 2011). Indeed, it has been
shown that amino acids, rather than glucose, account for the majority of new
biomass in proliferating cells (Hosios et al., 2016). Another proposed function of the
Warburg effect is to increase the rate of ATP generation, as many have argued that
ATP can be produced faster by aerobic glycolysis than by oxidative phosphorylation
(Pfeiffer et al., 2001). Yet another explanation is that lactate production facilitates
generation of electron carriers, which are required as cofactors for redox reactions in

135
cells. Increased glucose uptake permits higher production of the reducing equivalent
NADPH via the oxidative branch of the pentose phosphate pathway and production
of the oxidizing equivalent NAD+ via the action of lactate dehydrogenase (LDH)
(Vander Heiden et al., 2009). However, it remains unclear whether either of these
cofactors could be limiting for cancer cell proliferation (Vander Heiden and
DeBerardinis, 2017). A definitive explanation for how the Warburg effect promotes
cancer cell growth remains an area of active investigation (Liberti and Locasale,
2016).
Critical to the phenotype of aerobic glycolysis is the metabolic fate of glucose-
derived pyruvate. Pyruvate is the end-product of glycolysis and lies at the
intersection of glycolysis in the cytosol and the tricarboxylic acid cycle (TCA) in the
mitochondria. Pyruvate oxidation requires the activity of the pyruvate
dehydrogenase complex (PDH), which catalyzes the conversion of pyruvate to
acetyl-CoA, thereby supplying carbon for the TCA cycle. The oxidation of pyruvate
to acetyl-CoA is irreversible under physiological conditions, and thus PDH is a
critical regulatory point for energy metabolism in cells. PDH activity can be tuned
by pyruvate dehydrogenase kinases (PDK), which inactivate PDH by
phosphorylation (Korotchkina and Patel, 2001). The PDK enzymes are
transcriptionally upregulated by a number of signaling pathways that are
dysregulated in cancer, including aberrant HIF1a activation (Kim et al., 2006;
Papandreou et al., 2006), constitutive Wnt signaling (Pate et al., 2014) and p53 loss
(Contractor and Harris, 2012). Thus, oncogenic signaling pathways could be an

136
important contributor to metabolic reprogramming in cancer cells, since these
pathways can suppress pyruvate oxidation by activating PDK to suppress PDH.
To understand the contribution of PDH inhibition to the Warburg effect, we
increased PDH activity in cancer cells with the small molecule PDK inhibitor
AZD7545. We found that PDK inhibition results in a proliferation defect that can be
rescued with interventions that increase NAD+ regeneration, suggesting that high
PDH activity limits the ability of cells to regenerate electron acceptors.
Surprisingly, we find that the NAD+/NADH imbalance caused by AZD7545 is due to
insufficient mitochondrial electron transport, which in this context is constrained by
the mitochondrial proton gradient. Increasing electron transport chain activity with
FCCP, which uncouples mitochondrial respiration from ATP production, or with
gramicidin D, which increases ATPase activity, confers resistance to PDK
inhibition, suggesting that a requirement for NAD+ regeneration can supersede
that of mitochondrial ATP synthesis to support proliferation. Further limiting the
capacity for NAD+ regeneration by inhibiting electron transport with the biguanide
metformin, which blocks complex I activity, sensitizes cells to AZD7545 in culture
and reduces tumor growth in vivo. These data indicate that the ability of
mitochondrial respiration to regenerate electron acceptors may be inadequate to
support maximal cancer cell proliferation, providing an explanation for why cancer
cells increase flux from glucose to lactate.

137
Results
The PDK inhibitor AZD7545 activates PDH and increases glucose oxidation
To study the metabolic consequences of PDH enzyme regulation in cancer
cells, we wanted to stimulate pyruvate oxidation by increasing PDH complex
activity. The activity of PDH depends on its phosphorylation state, which in turn is
determined by its negative regulator, PDK. Active PDK results in accumulation of
inactive, phosphorylated PDH. To determine whether we could promote pyruvate
oxidation in mitochondria by repressing PDK (Figure 1A), we utilized AZD7545, a
potent and selective inhibitor of this enzyme (Kato et al., 2007; Morrell et al., 2003).
To validate that this compound functionally inhibits PDK, we first assessed
phosphorylation of the PDH complex in cells that had been treated with AZD7545.
As expected, AZD7545 treatment resulted in decreased phosphorylation of the E1a
subunit of the PDH complex (Figure 1B). We further confirmed that the decrease
in PDH phosphorylation corresponded to an increase in PDH activity by a dynamic
stable-isotope labeling experiment. We found that AZD7545 increased the rate of
citrate labeling from [U-13C6]glucose, consistent with increased PDH flux (Figure
1C).
Glutamine is the primary substrate for TCA cycle metabolism for cells in
culture (Altman et al., 2016; DeBerardinis and Cheng, 2010). A longer, steady-state,
labeling experiment confirmed that while glucose incorporation into citrate was
increased by AZD7545 treatment (Figure 1D), glutamine entry to the TCA cycle
was decreased by PDK inhibition (Figure 1E), suggesting that PDK inhibition

138
0.2
0.3
0.4
0.5
Citr
ate
Frac
tion
M+2
Lab
eled
AZD7545 (2 μM)Pyruvate (1mM)
--
+-
-+
++
0.0
0.1
0.2
0.3
0.4
0.5
Citr
ate
Frac
tion
Labe
led
AZD7545 (2 μM) - + - +M+4 M+5
OAACitrate
PyruvateLactate
acetyl-CoA
LDH
PDHPC
AZD7545
TCACycle
PDK
A. B. C.
– – ++AZD7545A549HeLa
VinculinP -PDH-E1α
1.0 1.00.44 0.75
0 5 100.0
0.1
0.2
0.3
Time (minutes)
Citr
ate
Frac
tion
M+2
Lab
eled
Vehicle
AZD7545
0:00:0
0
0:10:0
0
0:20:0
0
0:30:0
0
0:40:0
0
0:50:0
0
1:00:0
0
1:10:0
00
100
200
300
400
500
Time (hr:min:sec)
OC
R (p
mol
/min
)
Vehicle
AZD7545 (0.5uM)
Pyruvate FCCPRotenoneAntimycinD. E. F.
Aspartate AST
AlanineALT
139
Figure 1. Stimulating PDH activity increases glucose oxidation and oxygen consumption (A) Schematic illustrating the relationship between pyruvate dehydrogenase kinase (PDK) activity and pyruvate fate. The primary metabolic fates of pyruvate include: (1) metabolism to lactate by lactate dehydrogenase (LDH), (2) entry into the TCA cycle via the enzyme pyruvate carboxylase (PC), which converts pyruvate to oxaloacetate (OAA), (3) entry into the TCA cycle via oxidation by pyruvate dehydrogenase (PDH) to acetyl-CoA, (4) conversion to alanine by alanine transaminase (ALT). PDH is under negative regulation of pyruvate dehydrogenase kinase (PDK) enzymes, which can be inhibited by the compound AZD7545. OAA can be converted to aspartate via aspartate transaminase (AST). (B) Western blot analysis to assess phosphorylation of the S293 site of the pyruvate dehydrogenase E1-alpha (PDH-E1a) enzyme subunit in cell lines treated with vehicle or 1µM AZD7545 for 2 hours. Vinculin expression was assessed as a loading control. Signal intensity of phosphorylated PDH normalized to vinculin expression is indicated below each lane. (C) Kinetic labeling of citrate from labeled glucose to assess PDH flux with and without PDK inhibition. The fraction of m+2 citrate was measured after addition of[U-13C6]glucose to HeLa cells for the indicated amount of time. Cells were incubated for 5 hours in media containing 5mM unlabeled glucose with vehicle or 1µM AZD7545, after which 20mM [U-13C6]glucose was added to all conditions. Metabolites were rapidly extracted at the indicated time points and citrate labeling was determined by LCMS (n=3 per time point). (D) Fraction of citrate that is m+2 labeled from [U-13C6]glucose, measured by GCMS, after culturing HeLa cells in vehicle or 2µM AZD7545 and for 5 hours (n=3). (E) Fraction of citrate that was m+4 or m+5 labeled from [U-13C5]glutamine, assessed by GCMS, after culturing HeLa cells in vehicle or 2µM AZD7545 for 5 hours (n=3). (F) Oxygen consumption measured in HeLa cells that that had been treated with vehicle or 0.5µM AZD7545 for five hours. How oxygen consumption changes following the addition of pyruvate, the mitochondrial uncoupler FCCP, and the combination of the complex I inhibitor rotenone and the complex III inhibitor antimycin (n=12).
Values shown denote the mean ± SD.

140
results in higher levels of glucose oxidation, but not necessarily increased TCA
cycle flux. Relevant to this question, mitochondrial oxygen consumption rate (OCR)
was increased by AZD7545 (Figure 1F), arguing that mitochondrial oxidation
reactions are increased in this context. Taken together, we can conclude that PDK
inhibition increases oxidative glucose metabolism and suppresses aerobic glycolysis
in cancer cells.
Pyruvate, but not lactate, can restore proliferation to PDK inhibited cells
We found that treatment with AZD7545 decreased the proliferation rate of
cancer cells in a dose-dependent manner (Figure 2A-C). This result is consistent
with numerous findings in the literature that argue that repressing the Warburg
effect in cancer cells can suppress cell proliferation and tumor growth (Fantin et al.,
2006; Le et al., 2010; Xie et al., 2014). Thus, PDK inhibition provides an opportunity
to study the molecular consequences of increased glucose oxidation and could reveal
the benefit conferred by the glycolytic metabolism observed in cancer cells. Since
pyruvate is the substrate of the PDH reaction, we wanted to first determine
whether adding exogenous pyruvate could alter sensitivity to PDK inhibition. We
found that supplementing media with 1mM pyruvate greatly decreased sensitivity
to AZD7545 (Figure 2D-F).
One potential explanation for why pyruvate rescues PDK inhibition is that
because the PDH reaction consumes pyruvate, higher PDH flux caused by PDK

141
Figure 2. PDK inhibition slows proliferation, and this effect is suppressed by exogenous pyruvate (A, B, and C) Proliferation rate of (A) 143B (B) HeLa and (C) A549 cells incubated with the indicated doses of AZD7545 (n=3). (D, E, and F) Proliferation rate of (D) 143B (E) HeLa and (F) A549 cells as measured after treatment with the indicated doses of AZD7545 in the presence or absence of 1mM pyruvate (n=3). (G) Intracellular alanine levels were measured by LCMS in 143B and HeLa cells following treatment with 1µM AZD7545 for five hours (n=4). (H) Aspartate levels were measured by LCMS in 143B, A549 and HeLa cells following a five-hour incubation with 1µM AZD7545 (n=4). (I) Relative change of ratio of NAD+ to NADH was measured by LCMS in 143B, HeLa, and A549 cells that had been incubated in media containing vehicle or 1µM AZD7545 for five hours (n=3). Values shown denote the mean ± SEM.
143B HeLa0.0
0.5
1.0
Ala
nine
Poo
l Siz
e(N
orm
aliz
ed to
Veh
ilce) Vehicle
AZD7545
Vehicle AZD75452µM
AZD75455µM
0.0
0.5
1.0
Pro
lifer
atio
n R
ate
(Dou
blin
gs/d
ay)
A549
- Pyruvate+ Pyruvate
143B HeLa A5490.0
0.5
1.0
Asp
arta
te P
ool S
ize
(Nor
mal
ized
to V
ehic
le) Vehicle
AZD7545
143B HeLa A5490.0
0.5
1.0
Rel
ativ
e N
AD
+/N
AD
H(N
orm
aliz
ed to
Veh
icle
)
VehicleAZD7545
0µM 2µM 5µM 10µM0.0
0.5
1.0
AZD7545
Pro
lifer
atio
n R
ate
(Dou
blin
gs/d
ay)
143B
0µM 2µM 5µM 10µM0.0
0.5
1.0
1.5
AZD7545
Pro
lifer
atio
n R
ate
(Dou
blin
gs/d
ay)
HeLa
0µM 2µM 5µM 10µM0.0
0.2
0.4
0.6
0.8
1.0
AZD7545
Pro
lifer
atio
n R
ate
(Dou
blin
gs/d
ay)
A549
Vehicle AZD75452µM
AZD75455µM
0.0
0.5
1.0
1.5
Pro
lifer
atio
n R
ate
(Dou
blin
gs/d
ay)
HeLa
- Pyruvate+ Pyruvate
Vehicle AZD75452µM
AZD75455µM
0.0
0.5
1.0
1.5
Pro
lifer
atio
n R
ate
(Dou
blin
gs/d
ay)
143B
- Pyruvate+ Pyruvate
D. E. F.
G. H. I.
A. B. C.

142
inhibition may limit the availability of pyruvate for anabolic pathways, resulting in
a proliferation defect that is rescued by providing additional pyruvate. Pyruvate
carbon has many metabolic fates, including transamination to alanine and
conversion to oxaloacetate via pyruvate carboxylase (Corbet and Feron, 2017)
(Figure 1A). PDK inhibition was found to deplete levels of intracellular alanine
(Figure 2E) and aspartate (Figure 2F), which is generated by transamination of
oxaloacetate. The decreased levels of these substrates in cells caused by PDK
inhibition suggest that active PDH could prevent pyruvate carbons from fueling
anabolic reactions important for cell proliferation.
An alternative hypothesis is that pyruvate could rescue cells with inhibited
PDK by acting as an electron acceptor (Birsoy et al., 2015; Gui et al., 2016; Sullivan
et al., 2015). The reaction catalyzed by PDH requires NAD+ as a cofactor, and thus
inhibition of PDK would be expected to increase NAD+ consumption. Furthermore,
PDH competes with LDH for pyruvate that would otherwise produce an NAD+ in
the conversion to lactate, further decreasing the NAD+/NADH ratio in cells. We
confirm that the high PDH activity induced by AZD7545 treatment depletes NAD+,
treatment with the PDK inhibitor lowers the relative NAD+/NADH ratio in cancer
cells (Figure 2D).
To determine whether pyruvate suppressed the effects of PDK inhibition by
providing carbons required for anabolism or by acting as an exogenous electron
acceptor, we utilized lactate to distinguish these two possibilities. It has been
reported that lactate can act as a fuel and contribute to central carbon metabolism
143
(Faubert et al., 2017; Hui et al., 2017; Kennedy et al., 2013) and thus could fulfill
some of the anabolic requirements of pyruvate carbon. Indeed, we determine that
the addition of exogenous lactate to PDK-inhibited cells was sufficient to increase
intracellular pool sizes of alanine and aspartate (Figure 3A,B). However, from a
redox perspective, lactate is reduced relative to pyruvate, and thus acts as an
electron donor rather than an electron acceptor. As expected, exogenous lactate
further decreased the NAD+/NADH ratio of cells treated with AZD7545 further
(Figure 3C).
Since lactate can fulfill some of the of the anabolic functions of pyruvate, but
further decreases NAD+ generation, we could use lactate to assess which of these
two roles of pyruvate is more important to suppress the anti-proliferative effects of
PDK inhibition. We found that adding lactate to the culture media not only failed to
rescue AZD7545 treatment, but instead increased the sensitivity of cancer cells to
PDK inhibition (Figure 3D-F). This suggests that response to AZD7545 can be
influenced by the NAD+/NADH ratio in cells. Furthermore, the finding that
pyruvate, which can act as an electron acceptor, decreases sensitivity to PDK
inhibition, while lactate, which acts as an electron donor, potentiates the effects of
AZD7545, argues that the proliferation defects caused active PDH result from
insufficient NAD+ regeneration.

144
Figure 3. Lactate increases sensitivity of cancer cells to PDK inhibition (A) Alanine levels were measured by GCMS in 143B and HeLa cells treated with vehicle, 1µM AZD7545, and 5mM lactate as indicated (n=3). (B) Intracellular aspartate levels were measured by GCMS in 143B and HeLa cells that had been incubated with vehicle, 1µM AZD7545, and 5mM lactate as indicated (n=3). (C) Relative change in NAD+/NADH as measured by LCMS in HeLa cells that had been incubated in media containing vehicle or 1µM AZD7545 in the presence or absence of 10mM lactate (n=3). (D,E, and F) Proliferation rate of (D) 143B (E) HeLa and (F) A549 cells incubated with the indicated doses of AZD7545 and 1mM lactate, 10mM lactate, or untreated vehicle) (n=3). Values shown denote the mean ± SEM.
143B HeLa0.0
0.5
1.0
Ala
nine
Poo
l Siz
e(N
orm
aliz
ed to
Veh
ilce) Vehicle
AZD7545
AZD7545 + 5mM Lactate
Vehicle AZD75455µM
AZD754510µM
0.0
0.5
1.0
Prol
ifera
tion
Rat
e(D
oubl
ings
/day
)
HeLa
- Lactate
+ 1mM Lactate
+ 10mM Lactate
Vehicle AZD75452µM
AZD75455µM
0.0
0.5
1.0
Prol
ifera
tion
Rat
e(D
oubl
ings
/day
)
143B
- Lactate
+ 1mM Lactate
+ 10mM Lactate
Vehicle AZD75452µM
AZD75455µM
0.0
0.2
0.4
0.6
0.8
Prol
ifera
tion
Rat
e(D
oubl
ings
/day
)A549
- Lactate
+ 1mM Lactate
+ 10mM Lactate
143B HeLa0.0
0.5
1.0
Asp
arta
te P
ool S
ize
(Nor
mal
ized
to V
ehic
le) Vehicle
AZD7545
AZD7545 + 5mM Lactate
Vehicle AZD7545 AZD7545+ Lactate
0
1
2
3
4
Rel
ativ
e N
AD
+/N
AD
H
A. B.
C. D.
E. F.

145
Alternative pathways for NAD+ regeneration can render cells refractory to
PDK inhibition
To further test the hypothesis that pyruvate rescues PDK inhibition by acting
as an electron acceptor, we questioned whether orthogonal pathways that
regenerate NAD+ could also reduce responsiveness to AZD7545. One method to
alter the intracellular NAD+/NADH is to utilize redox reaction pairs that utilize
NAD+ and NADH as cofactors. For example, duroquinone permits NAD+
regeneration via the quinone reductase NQO1 (Merker et al., 2006) (Figure 4A)
and providing cells with duroquinone can rescue proliferation in conditions where
NAD+ is limiting (Gui et al., 2016). We treated cells with AZD7545 in the absence
or presence of duroquinone and found that duroquinone decreases AZD7545
sensitivity (Figure 4B,C). This finding is consistent with our prediction that the
proliferation defect caused by PDK inhibition is due to NAD+/NADH imbalance.
Another method for increasing the intracellular NAD+/NADH is by expression of
NADH oxidase from Lactobacillus brevis (LbNOX) (Titov et al., 2016) (Figure 4D).
We generated cell lines expressing either LbNOX or empty vector (E.V.) under a
doxycycline-inducible promoter, allowing us to increase the capacity for NAD+
production of these cells (Figure 4E). We performed a titration of AZD7545 on E.V.
or LbNOX cancer cells in media containing doxycycline and assessed proliferation.
We found that LbNOX conferred resistance to PDK inhibition (Figure 4F,G),
further arguing that restoring NAD+ regeneration and increasing the NAD+/NADH
reduction potential can decrease sensitivity to PDK inhibition.

146
Figure 4. Antiproliferative effect of PDK inhibition is suppressed by increasing intracellular NAD+ (A) Schematic illustrating how duroquinone supplementation can increase NAD+. The enzyme NAD(P)H dehydrogenase, quinone 1 (NQO1) reduces duroquinone to durohydroquinone using NADH as a cofactor. (B and C) Proliferation rate of (B) 143B and (C) A549 cells incubated with the indicated doses of AZD7545 and 5mM duroquinone as indicated (n=3). (D) Schematic indicating the reaction catalyzed by the NADH oxidase from Lactobacillus brevis (LbNOX). (E) Western blot analysis using an anti-FLAG antibody to examine expression of LbNOX in 143B and A549 cells that had been infected with pInducer20-E.V. or pInducer20-LbNOX-FLAG and incubated with 500ng/mL doxycycline. Vinculin expression was also assessed as a loading control. (G and F) Effect of LbNOX expression on sensitivity to AZD7545. Proliferation rate of A549 and 143B cells incubated with the indicated doses of AZD7545 and doxycycline (500ng/mL) to induce LbNOX expression. E.V. denotes cells with empty vector where LbNOX is not expressed in response to doxycycline (n=3). Values shown denote the mean ± SEM.
Vehicle AZD7545
2µM
AZD7545
5µM
AZD7545
10µM
0.0
0.2
0.4
0.6
0.8P
ro
life
rati
on
Rate
(Do
ub
lin
gs/d
ay)
A549
E.V.LbNOX
Vehicle AZD7545
2µM
AZD7545
5µM
AZD7545
10µM
0.0
0.5
1.0
Pro
life
rati
on
Rate
(Do
ub
lin
gs/d
ay)
143B
E.V.LbNOX
O
O
OH
OH
Duroquinone Durohydroquinone
NQO1
NADH NAD+
2NADH + 2H+ + O2
LbNOX 2NAD+ + 2H2O
Vehicle AZD7545
2µM
AZD7545
5µM
AZD7545
10µM
0.0
0.5
1.0
Pro
life
rati
on
Rate
(Do
ub
lin
gs/d
ay)
A549
- Duroquinone+ Duroquinone
Vehicle AZD7545
2µM
AZD7545
5µM
AZD7545
10µM
0.0
0.5
1.0
1.5
2.0
Pro
life
rati
on
Rate
(Do
ub
lin
gs/d
ay)
143B
- Duroquinone+ Duroquinone
B.
A.
C.
F.
D.
G.
A549143B
VinculinFLAG
EVFLAG-LbNOX EV
FLAG-LbNOX
E.

147
Increasing aspartate availability can rescue the proliferation defect caused
by PDK inhibition
Maintaining NAD+/NADH balance can support de novo aspartate synthesis
under conditions of electron transport chain inhibition (Birsoy et al., 2015; Sullivan
et al., 2015). Aspartate is essential product of metabolism that is needed to make
proteins as well as for purine and pyrimidine biosynthesis, and thus aspartate can
be a limitation for cancer cell growth (Birsoy et al., 2015; Gui et al., 2016; Sullivan
et al., 2015) Sullivan et al. 2018). Since we had found that PDK inhibition could
constrain NAD+ regeneration and deplete intracellular aspartate, we wanted to
assess whether exogenous aspartate could replace the requirement for electron
acceptors in cells with active PDH. We found that supplementing culture media
with aspartate could confer resistance to PDK inhibition, as assessed by
proliferation rate (Figure 5A-C). Interestingly, we found that exogenous aspartate
can increase the NAD+/NADH ratio in both basal conditions and upon treatment
with AZD7545 (Figure 5D). Therefore, though AZD7545 limits aspartate
production and results in aspartate deficiency (Figure 2H) it is difficult to
distinguish whether the proliferation defect caused by this compound is caused by
the biosynthetic demand of aspartate or electron acceptor limitation. It is likely that
both parameters are related and contribute the responsiveness of cancer cells to
AZD7545, particularly since lactate addition is sufficient to increase aspartate
levels without rescuing proliferation.

148
Figure 5. Proliferation of PDK-inhibited cells is restored by exogenous aspartate (A, B, and C) Proliferation rate was measured in (A) 143B, (B) HeLa and (C) A549 cells that had been incubated with the indicated doses of AZD7545 and treated without or with 20mM of exogenous aspartate as indicated (n=3). (D) Relative change in ratio of NAD+ to NADH was measured by LCMS in HeLa cells that had been incubated with vehicle or 1µM AZD7545 with or without 20mM aspartate as indicated (n=3). Values shown denote the mean ± SEM.
Vehicle AZD75452µM
AZD75455µM
AZD754510µM
0.0
0.5
1.0
1.5
Prol
ifera
tion
Rat
e(D
oubl
ings
/day
)143B
- Aspartate+ Aspartate
Vehicle AZD75452µM
AZD75455µM
AZD754510µM
0.0
0.5
1.0
1.5
Prol
ifera
tion
Rat
e(D
oubl
ings
/day
)
HeLa
- Aspartate+ Aspartate
Vehicle AZD75452µM
AZD75455µM
AZD754510µM
0.0
0.5
1.0
Prol
ifera
tion
Rat
e(D
oubl
ings
/day
)
A549
- Aspartate+ Aspartate
A. B.
C. D.
––
+–
–+
++
2
4
6
Rel
ativ
e N
AD
+/N
AD
HAZD7545
Aspartate
149
FCCP treatment can relieve mitochondrial membrane hyperpolarization
and the NAD+/NADH imbalance caused by PDK inhibition
Our data suggests that PDK inhibition reduces the availability of electron
acceptors and perturbs NAD+/NADH balance. NAD+ is necessary to support the
activities of many metabolic pathways, including oxidative catabolic reactions
(Hosios and Vander Heiden, 2018). There are two primary mechanisms by which
cells can regenerate NAD+ consumed by both glycolysis and anabolic pathways. In
the cytosol, LDH can produce NAD+ by the reduction of pyruvate to lactate (Wuntch
et al., 1970). NAD+ can also be regenerated by the mitochondrial electron transport
chain (ETC), in which the electrons of NADH are transferred to oxygen to generate
water. PDK inhibition decreases NAD+ regeneration by LDH, as this leads to
increased PDH activity and competes with LDH for the same substrate. However, it
is unclear why cells treated with AZD7545 should not be able to regenerate NAD+
via ETC, as these cells have functional mitochondrial electron transport, and in fact
display increased rates of basal oxygen consumption (OCR) (Figure 6A).
Nevertheless, cells display NAD+/NADH imbalance upon PDK inhibition,
suggesting that despite increasing mitochondrial ETC, these cells remain deficient
for electron acceptors. We therefore wondered what factor was limiting NAD+
regeneration by mitochondrial respiration in cells with PDK inhibition.
As the terminal substrate of ETC, oxygen can be limiting for electron
transport, but we found this possibility unlikely because the mitochondrial
respiration has been shown to function at oxygen levels as low as 0.5% (Rumsey et

150
al., 1990), and these cells were cultured at atmospheric 21% oxygen. Furthermore,
the expression of LbNOX, which requires oxygen as a substrate, suppressed the
anti-proliferative effect of AZD7545, arguing against oxygen being limiting in PDK-
inhibited cells. The oxidation-reduction reactions of the electron transport chain are
coupled to proton pumping into the inter-membrane space of the mitochondria,
forming an electrochemical gradient that drives ATP production via the FoF1 ATP
synthase (Mitchell 1961). To test whether we could restore NAD+/NADH balance in
cells with inhibited PDK by decoupling mitochondrial electron transport from ATP
synthesis, we utilized the ionophore carbonyl cyanide-4-
(trifluoromethoxy)phenylhydrazone (FCCP). FCCP is an uncoupling agent that
dissipates the electrochemical gradient across the inner mitochondrial membrane,
thereby permitting a higher rate of mitochondrial respiration that is dependent on
the availability of substrates of ETC, including NADH. Treatment with FCCP
increased oxygen consumption to a greater extent in cells treated with AZD7545
(Figure 6B), validating that cells with PDK inhibition have increased
mitochondrial NADH generation (Figure 2I). Furthermore, uncoupling
mitochondrial respiration from ATP production increases the capacity of cells to
regenerate NAD+, as FCCP treatment was found to restore the NAD+/NADH ratio
(Figure 6C) and intracellular aspartate pool sizes (Figure 6D) in cells with
inhibited PDK.
If increasing the capacity for the ETC to regenerate NAD+ were sufficient to
rescue the effects of PDK inhibition, then FCCP should restore the proliferation of

151
cells treated with AZD7545. We measured the growth rate of PDK-inhibited cells in
the absence or presence of a low concentration of FCCP and determined that FCCP
increased proliferation of cells treated with AZD7545 (Figure 6E-G). Thus, the
regeneration of electron acceptors appears to be more important for cancer cell
proliferation than mitochondrial ATP synthesis when PDK is inhibited.
Furthermore, uncoupling the mitochondria was found to rescue the proliferation
defects and NAD+/NADH imbalance caused by PDK treatment, suggesting that in
the absence of FCCP, mitochondrial electron transport is limited by ATP
consumption. In other words, a constraint for respiration in these cells could be the
rate of ATP synthesis because the action of the FoF1 ATP synthase is insufficient to
relieve the proton gradient generated by the ETC, leading to increased
mitochondrial membrane polarization and limiting NAD+ regeneration via the
ETC. To test this hypothesis, we utilized the electrochemical sensitive positive dye,
tetramethylrhodamine ethyl ester (TMRE), which labels mitochondria with high
membrane potentials. We assessed TMRE staining by flow cytometry and found
that AZD7545 treatment increases the electrochemical gradient of mitochondria,
and that FCCP reverses this effect (Figure 6H). This data suggests that though
cells increase mitochondrial respiration upon PDK inhibition, ETC is not increased
at sufficient levels to solve the NAD+/NADH imbalance caused by AZD7545. Our
data also suggests that mitochondrial membrane potential, rather than availability
of the terminal electron acceptor oxygen, constrains the respiration of PDK-
inhibited cells.

152
HeLa 143B0
200
400
600
Max
imal
OC
R
(pm
ol/m
in•5
e105
cells
)
VehicleAZD7545
Vehicle AZD75452µM
AZD75455µM
0.0
0.2
0.4
0.6
0.8
A549
Prol
ifera
tion
Rat
e(D
oubl
ings
/day
)
- Gramicidin D
+ Gramicidin D (0.5nM)
Vehicle AZD75452µM
AZD75455µM
AZD754510µM
0.0
0.5
1.0
Prol
ifera
tion
Rat
e(D
oubl
ings
/day
)
HeLa
- FCCP
+ FCCP
HeLa 143B0
200
400
600B
asal
OC
R
(pm
ol/m
in•5
e105
cells
)
Vehicle
AZD7545
A549 HeLa 143B0.0
0.5
1.0
1.5
Asp
arta
te P
ool S
ize
(Nor
mal
ized
to V
ehic
le) Vehicle
AZD7545AZD7545 + FCCP
A549 HeLa0
2
4
6
8
Rel
ativ
e N
AD
+/N
AD
H Vehicle
AZD7545AZD7545 + FCCP
.
Vehicle AZD75452µM
AZD75455µM
AZD754510µM
0.0
0.5
1.0
1.5
Prol
ifera
tion
Rat
e(D
oubl
ings
/day
)
143B
- FCCP+ FCCP
A.
C.
VehicleAZD7545FCCP + AZD7545
Sample
E.
G.
Vehicle AZD75452µM
AZD75455µM
AZD754510µM
0.0
0.2
0.4
0.6
0.8Pr
olife
ratio
n R
ate
(Dou
blin
gs/d
ay)
A549
- FCCP
+ FCCP
I.
B.
D.
F.
H.
J.
VehicleAZD7545Gram.+ AZD7545
Sample
PE-A

153
Figure 6. Uncoupling electron transport from ATP synthesis, and increasing ATP consumption, suppresses the antiproliferative effect of AZD7545. (A) The basal oxygen consumption rate (OCR) of HeLa and 143B cells cultured with vehicle or 0.5µM AZD7545 is shown (n=4). (B) The oxygen consumption rate was assessed upon administration of FCCP to HeLa and 143B cells that had been treated with vehicle or 0.5µM AZD7545 (n=4). (C) The relative change in the ratio of NAD+ to NADH was measured by LCMS after treating A549 and HeLa cells with vehicle, 2µM AZD7545, or 2µM AZD7545 and 250nM FCCP for five hours (n=4). (D) Intracellular aspartate levels were measured by LCMS in cells that had been treated with vehicle, 2µM AZD7545, or 2µM AZD7545 and 250nM FCCP for five hours (n=4). (E, F, and G) Proliferation rate was assessed in (E) 143B, (F) A549 and (G) HeLa cells that had been incubated with the indicated doses of AZD7545 and in the presence or the absence of 500nM FCCP. (H) Mitochondrial membrane potential was assessed in 143B cells that had been incubated with vehicle or 1µM AZD7545 and with or without 500nM of FCCP as indicated. Mitochondrial membrane potential was assessed by TMRE (tetramethylrhodamine, ethyl ester) dye uptake, and quantified by flow cytometry. (I) Proliferation rate in A549 cells was measured after treating cells with vehicle, 5µM AZD7545, and/or 0.5nM gramicidin as indicated. (J) Mitochondrial membrane potential was assessed in A549 cells that had been incubated with vehicle or 1µM AZD7545 and with or without 1nM of gramicidin as indicated. Mitochondrial membrane potential was assessed by TMRE (tetramethylrhodamine, ethyl ester) dye uptake, and quantified by flow cytometry. Values in all panels denote the mean ± SEM.

154
ATP hydrolysis can suppress the proliferation defect caused by AZD7545
We next wanted to assess whether we could stimulate mitochondrial electron
transport in PDK-inhibited cancer cells by increasing the activity of the FoF1 ATP
synthase. Increasing mitochondrial ATP synthesis is predicted to relieve the
hyperpolarized proton gradient across the inner mitochondrial membrane,
increasing the capacity of cells to regenerate NAD+. One way to stimulate
mitochondrial ATP synthesis, and consequently respiration, is to increase ATP
consumption such that increased levels of ADP can stimulate ATP synthase activity
(Brown, 1992). Thus, we sought to increase ADP availability in PDK-inhibited cells
by pharmacologically increasing ATP hydrolysis by the plasma membrane Na+/K+
ATPase. Na+/K+ ATPase activity can be enhanced by low doses of gramicidin D, a
sodium ionophore that forms channels in the plasma membrane and increases the
permeability of Na+ and K+ ions (Nobes et al., 1989). Gramicidin D treatment has
been shown to increase the rate of oxidative phosphorylation in cells (Vander
Heiden et al., 1999), suggesting that this compound can increase mitochondrial ETC
activity. We determined that cancer cells were more resistant to AZD7545
treatment when grown in the presence of gramicidin D (Figure 6I) and that this
compound can relieve mitochondrial membrane hyperpolarization (Figure 6J),
suggesting that stimulating ATP consumption in cells with inactive PDK can
enhance mitochondrial respiration and restore NAD+/NADH homeostasis. More
broadly these data indicate that ETC activity in intact cells may be limited by ADP

155
availability in some contexts and arguing limited ATP consumption, rather than a
demand for increased ATP production, contribute to the Warburg effect in cancer.
PDH activation increases dependency on complex I for NAD+ regeneration
and sensitizes cells to metformin treatment in vitro and in vivo
Cells treated with PDK inhibition have limited capacity to regenerate NAD+
via mitochondrial respiration, despite increased OCR. Therefore, interventions that
inhibit the ETC could limit electron acceptor availability more severely and
potentiate the anti-proliferative effects of AZD7545. To test this hypothesis, we
assessed sensitivity of cancer cells to the biguanide metformin, which limits NAD+
regeneration via complex I (Wheaton et al., 2014). We found that the combination of
metformin and AZD7545 reduced the proliferation of cancer cells in a synergistic
manner (Figure 7A-C). Furthermore, low dose AZD7545 treatment is sufficient to
decrease the IC50 of metformin by more than 30% in both HeLa and A549 cells
(Figure 7D,E), confirming that PDK inhibition increases dependency on complex I
for NAD+ regeneration. The anti-proliferative effect of the combination of AZD7545
and metformin was ablated by media supplementation with pyruvate, suggesting
that as predicted, this effect is mediated by synergistic loss of NAD+/NADH
homeostasis.
We next assessed whether we could recapitulate the synergistic effects of
metformin and PDK inhibition to limit tumor growth. Availability of electron
acceptors has been shown to be limiting for tumor growth in some contexts (Gui et
156
al., 2016; Schockel et al., 2015; Wheaton et al., 2014) and thus we hypothesized that
further limiting NAD+ regeneration with the combination of AZD7545 and
metformin could have a larger effect on tumor growth than either drug alone. We
implanted A549 cells into the flanks of nude mice and when the tumors reached a
size of 50mm3, the mice were randomized into four groups. Mice were treated once
per day by oral gavage of either vehicle, 500 mg/kg metformin, 45 mg/kg AZD7545,
or a combination of the two treatments. Metformin was found to inhibit tumor
growth as previously reported (Gui et al., 2016; Wheaton et al., 2014). AZD7545 had
no effect on xenograft growth alone, but increased the effect of metformin (Figure
7F).
The finding that AZD7545 treatment did not decrease tumor growth as a
single agent might be expected from the pharmacokinetics of this compound. Three
hours after AZD7545 dosing, we find that levels of the compound in tumors and in
serum correspond to concentrations that conferred a proliferation defect to cells in
culture (Figure 7G,H). However, twenty-four hours after treatment, the compound
could no longer be detected by LCMS in plasma (Figure 7G). This argues that more
frequent dosing scheme of AZD7545 may be more effective for inhibiting growth in
tumors alone, and enhancing the effects of metformin treatment. Nevertheless, once
a day dosing of AZD7545 was sufficient potentiate the anti-tumor effects of
metformin, suggesting that drug combinations that synergistically limit electron
acceptor availability could be a mechanism to inhibit tumor growth.
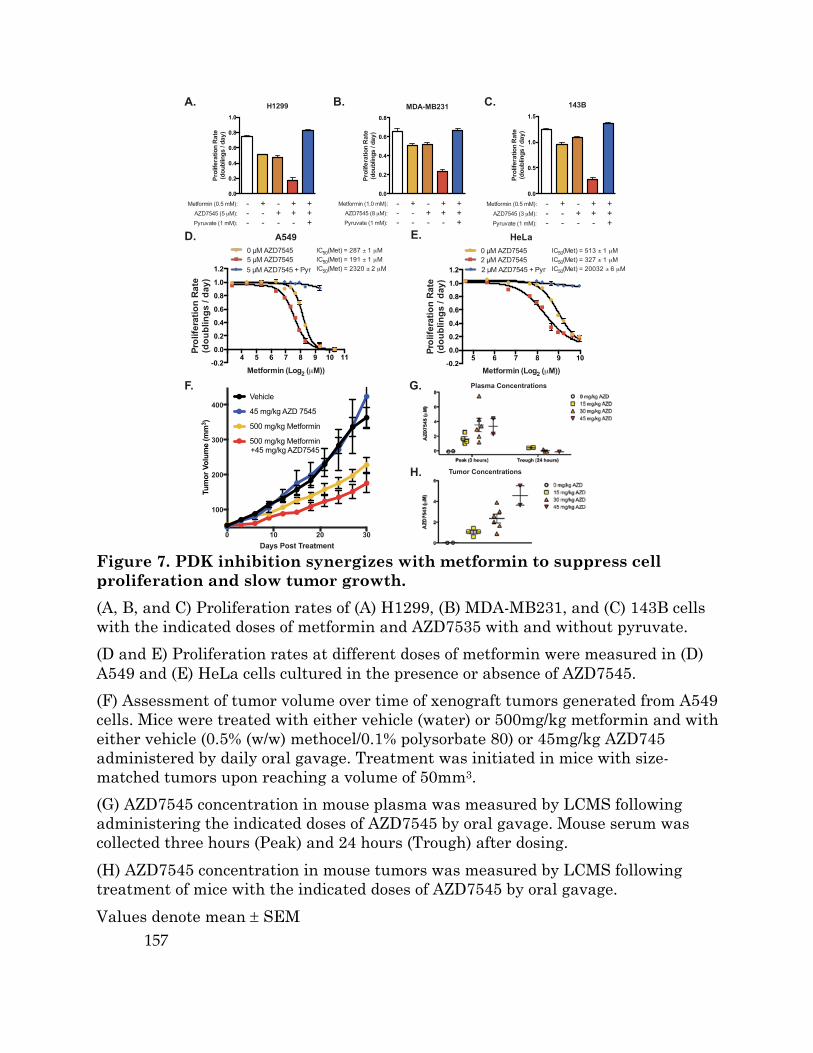
157
Figure 7. PDK inhibition synergizes with metformin to suppress cell proliferation and slow tumor growth. (A, B, and C) Proliferation rates of (A) H1299, (B) MDA-MB231, and (C) 143B cells with the indicated doses of metformin and AZD7535 with and without pyruvate. (D and E) Proliferation rates at different doses of metformin were measured in (D) A549 and (E) HeLa cells cultured in the presence or absence of AZD7545. (F) Assessment of tumor volume over time of xenograft tumors generated from A549 cells. Mice were treated with either vehicle (water) or 500mg/kg metformin and with either vehicle (0.5% (w/w) methocel/0.1% polysorbate 80) or 45mg/kg AZD745 administered by daily oral gavage. Treatment was initiated in mice with size-matched tumors upon reaching a volume of 50mm3. (G) AZD7545 concentration in mouse plasma was measured by LCMS following administering the indicated doses of AZD7545 by oral gavage. Mouse serum was collected three hours (Peak) and 24 hours (Trough) after dosing. (H) AZD7545 concentration in mouse tumors was measured by LCMS following treatment of mice with the indicated doses of AZD7545 by oral gavage. Values denote mean ± SEM
4 5 6 7 8 9 10 11-0.2
0.0
0.2
0.4
0.6
0.8
1.0
1.2
Metformin (Log2 (μM))
Pro
lifer
atio
n R
ate
(do
ub
ling
s / d
ay)
A5490 M AZD75455 M AZD7545
IC50(Met) = 287 ± 1 μMIC50(Met) = 191 ± 1 μMIC50(Met) = 2320 ± 2 μM5 M AZD7545 + Pyr
5 6 7 8 9 10-0.2
0.0
0.2
0.4
0.6
0.8
1.0
1.2
Metformin (Log2 (μM))
Prol
ifera
tion
Rat
e (d
oubl
ings
/ da
y)
HeLa0 M AZD75452 M AZD7545
IC50(Met) = 513 ± 1 μMIC50(Met) = 327 ± 1 μMIC50(Met) = 20032 ± 6 μM2 M AZD7545 + Pyr
0.0
0.5
1.0
1.5
Pro
lifer
atio
n R
ate
(dou
blin
gs /
day)
143B
Metformin (0.5 mM):
AZD7545 (3 μM):
Pyruvate (1 mM):
---
+--
-+-
++-
+++
0.0
0.2
0.4
0.6
0.8
Pro
lifer
atio
n R
ate
(dou
blin
gs /
day)
MDA-MB231
Metformin (1.0 mM):
AZD7545 (8 μM):
Pyruvate (1 mM):
---
+--
-+-
++-
+++
0.0
0.2
0.4
0.6
0.8
1.0
Pro
lifer
atio
n R
ate
(dou
blin
gs /
day)
H1299
Metformin (0.5 mM):
AZD7545 (5 μM):
Pyruvate (1 mM):
---
+--
-+-
++-
+++
0 10 20 30
100
200
300
400
Days Post Treatment
Tum
or V
olum
e (m
m3 )
Vehicle
45 mg/kg AZD 7545
500 mg/kg Metformin
500 mg/kg Metformin+45 mg/kg AZD7545
D.
G.F.
A. B. C.
E.
H.
Plasma Concentrations
Tumor Concentrations

158
Discussion
We find that suppressing the Warburg effect in cancer cells by targeting PDK
perturbs NAD+/NADH homeostasis and decreases proliferation. Because PDH lies
at the intersection between glycolysis and glucose oxidation, this enzyme represents
critical regulator of aerobic glycolysis in cancer cells. For this reason, there has long
been interest to increase PDH flux for cancer therapy (Stacpoole, 2017). Like
AZD7545, the compound dichloroacetate (DCA) can inhibit PDK, and this compound
has demonstrated antitumor activity in some contexts (Bonnet et al., 2007;
Michelakis et al., 2010). However, DCA has generally shown limited capacity to
decrease tumor growth as a single agent (Cairns et al., 2007; Garon et al., 2014;
Shahrzad et al., 2010; Sun et al., 2010), with some studies requiring DCA
concentrations as high as 50mM to inhibit cancer cell growth (Allen et al., 2015; Lin
et al., 2014; Madhok et al., 2010). Our data suggests that compounds that inhibit
PDK activity could be more effective when combined with other drugs that limit
capacity for NAD+ regeneration, such as electron transport chain inhibitors like
metformin. Efforts to clinically target features of Warburg effect, including glucose
uptake and lactate excretion, have been challenging (Hay, 2016; Luengo et al.,
2017), but interventions that restrict the oxidative capacity of cells could be one
strategy to exploit the enhanced glycolytic flux observed in cancer cells.
Our data shows that electron acceptor availability can restrict cancer cell
proliferation, supporting studies reporting that the NAD+/NADH ratio can correlate
with tumor proliferation (Gui et al., 2016). Though the reactions that regenerate

159
NAD+ do not directly provide biomass to cancer cells, this cofactor is needed to
catabolize reduced nutrients, including sugars and lipids, and to synthesize oxidized
macromolecules, such as nucleotides and amino acids (Hosios and Vander Heiden,
2018; Lunt and Vander Heiden, 2011). Furthermore, cancer cells require NAD+ for
many important cellular processes, including the histone deacetylation by sirtuins,
maintenance of calcium homeostasis, and poly(ADP-ribose) polymerase activity
(Ying, 2008). Proliferating cells have been described as having high NAD+/NADH
ratios to support growth (Schwartz et al., 1974), but recently tumor cells have been
shown to be more reduced than what was previously assumed (Hung et al., 2011;
Zhao et al., 2016), supporting the hypothesis that electron acceptor availability can
be limited in tumors.
Entry of glucose carbons into the mitochondria limits NAD+ regeneration by
LDH and consequently increases dependency on mitochondrial electron transport
for access to oxygen as an electron acceptor. Though cancer cells with inactive PDK
have functional mitochondria, and in fact display elevated rates of mitochondrial
respiration, we find that in this context the oxidative capacity of ETC is constrained
by a high ATP/ADP ratio, and this can slow proliferation. Interestingly, human
cancer cell lines have been described as having an increased mitochondrial proton
gradient relative to non-cancerous tissues (Bonnet et al., 2007; Chen, 1988), and
membrane hyperpolarization has been associated with tumor progression and
invasion (Heerdt et al., 2005). This could indicate that the constrained oxidative
capacity of mitochondrial respiration is a general feature of cancer cells in many

160
contexts, and suggests that one possible explanation for the Warburg effect
phenotype is that the mitochondrial membrane potential constrains electron
acceptor regeneration by ETC, and the resulting high NADH/NAD+ ratio promotes
flux through LDH to regenerate NAD+ consumed in glycolysis.
While recent findings have confirmed that electron acceptors can be limiting
under conditions of mitochondrial inhibition (Birsoy et al., 2015; Gui et al., 2016;
Sullivan et al., 2016; Titov et al., 2016), the data presented in this study suggest
that electron acceptor availability can be endogenously limited by mitochondrial
membrane potential and intracellular ATP when glucose oxidation is enhanced.
Why mitochondrial activity is regulated to limit pyruvate oxidation to not exceed
the ATP production needs of a cell is not well understood, but this may restrict
generation of reactive oxygen species and limit cell damage. It also suggests that
regulation to uncouple ATP production from respiration might be beneficial in some
contexts to allow oxidation reactions at rates that exceed the demand for ATP
production, a state already known to be the case for heat generation in endothermic
organs (Nicholls and Locke, 1984).
Aerobic glycolysis is an inefficient means of generating ATP when
considering the yield per glucose molecule. However, our data provide further
evidence that ATP is not necessarily limiting for cancer cell proliferation.
Uncoupling the mitochondria with FCCP decreased the sensitivity of cells to
AZD7545, suggesting that that requirement for electron acceptors supersedes that
of ATP in this context. Furthermore, the finding that enhancing the rate of ATP
161
hydrolysis with gramicidin D restores growth of PDK-inhibited cells serves as
further evidence that ATP consumption, rather than ATP itself, can be limiting for
proliferation. It has been shown previously that ATP hydrolysis is important for
prostate cancer cell growth, and that inhibiting ATPase activity and increasing the
ATP/AMP ratio resulted in tumor regression (Fang et al., 2010). While the
mechanism by which ATP consumption promotes cancer in this context was
unexplained, it is possible that in these settings increasing ATP utilization also
promotes NAD+ regeneration in the mitochondria, thereby increasing electron
acceptor availability and promoting proliferative metabolism. The idea ATP
hydrolysis, rather than ATP synthesis, could be limiting for cancer cell metabolism
has historical support (Racker, 1972; Scholnick et al., 1973), even though many
more recent studies have focused on how cancer cells use metabolism optimize ATP
production. The finding that ATP can be a limitation for the oxidative capacity of
mitochondria also supports the notion that the Warburg effect may reflect the
increased demand of proliferating cells to regenerate electron acceptors and
provides insight into why this metabolic state is associated with proliferation in
many different biological systems.
Materials and Methods
Cell Culture Experiments: Cell lines were cultured in DMEM (Corning 10-013-
CV) supplemented with 10% fetal bovine serum. For all experiments, cells were
washed three times in phosphate buffered saline (PBS), and then cultured in of

162
DMEM without pyruvate (Corning 10-017-CV) with 10% dialyzed fetal bovine
serum, supplemented with the indicated treatment condition. The reagents used for
the cell culture experiments are as follows: AZD7545 (Selleck Chemicals, s7517),
sodium pyruvate (Sigma, P2256), sodium L-lactate (Sigma, L7022), duroquinone
(Sigma, D223204), L-aspartic acid (Sigma A6683), rotenone (Sigma R8875), FCCP
(carbonyl cyanide 4-(trifluoromethoxy)phenylhydrazone) (Sigma, C2920), gramicidin
from Bacillus aneurinolyticus (Bacillus brevis) (Sigma, G5002), metformin
hydrochloride (Sigma PHR1084). All cells were cultured at 37°C with 5% CO2.
Dynamic stable-isotope labeling experiments: Cells were plated in six-well
plates in at a seeding density of 150,000 cells per well. Cells were permitted to
settle overnight. Prior to the initiation of the experiment, cells were washed three
times with PBS, and then cultured in media containing 5mM glucose and the
indicated treatment condition. After cells were cultured for 5 hours, 30µL of a 1M
[U-13C6]glucose solution was rapidly administered to each well of the plate and the
plate was rocked gently. Following the appropriate incubation (ranging from 2 to 12
minutes), wells were washed as quickly as possible with ice-cold blood bank saline
and lysed on the dish with 300µL of ice-cold 80% HPLC grade methanol in HPLC
grade water. Samples were scraped, collected into Eppendorf tubes, and vortexed
for 10 minutes at 4°C. Samples were centrifuged at 21,000´g for 10 minutes at 4°C
to precipitate the protein. 50µM of each sample was collected for immediate
analysis by liquid chromatography mass-spectrometry (LCMS).
163
LCMS Metabolite Profiling: Metabolite profiling was conducted on a QExactive
bench top orbitrap mass spectrometer equipped with an Ion Max source and a HESI
II probe, which was coupled to a Dionex UltiMate 3000 HPLC system (Thermo
Fisher Scientific, San Jose, CA). External mass calibration was performed using the
standard calibration mixture every 7 days. For each sample, 4µL of each sample
was injected onto a SeQuant® ZIC®-pHILIC 150 ´ 2.1 mm analytical column
equipped with a 2.1 ´ 20 mm guard column (both 5 mm particle size; EMD
Millipore). Buffer A was 20mM ammonium carbonate, 0.1% ammonium hydroxide;
Buffer B was acetonitrile. The column oven and autosampler tray were held at 25°C
and 4°C, respectively. The chromatographic gradient was run at a flow rate of 0.150
mL/min as follows: 0-20 min: linear gradient from 80-20% B; 20-20.5 min: linear
gradient form 20-80% B; 20.5-28 min: hold at 80% B. The mass spectrometer was
operated in full-scan, polarity-switching mode, with the spray voltage set to 3.0 kV,
the heated capillary held at 275°C, and the HESI probe held at 350°C. The sheath
gas flow was set to 40 units, the auxiliary gas flow was set to 15 units, and the
sweep gas flow was set to 1 unit. MS data acquisition was performed in a range of
m/z = 70–1000, with the resolution set at 70,000, the AGC target at 1´106, and the
maximum injection time (Max IT) at 20 msec. For detection of nicotinamide
diadenine nucleotide cofactors, targeted selected ion monitoring (tSIM) scans in
positive mode were included. The isolation window was set at 3.0 m/z and tSIM
scans were centered at m/z = 665.1243 for NAD(H). For detection of 13C-labeled
citrate, a negative mode tSIM scan centered on 194.1985 was included. The

164
isolation window was set at 8.0 m/z. For all tSIM scans, the resolution was set at
70,000, the AGC target was 1´105, and the max IT was 250 msec. Relative
quantitation of polar metabolites was performed with XCalibur QuanBrowser 2.2
(Thermo Fisher Scientific) using a 5ppm mass tolerance and referencing an in-
house library of chemical standards.
Oxygen Consumption Measurements: An Agilent Seahorse Bioscience
Extracellular Flux Analyzer (XF24) was used to measure oxygen consumption rates
(OCR). Cells were plated at 50,000 cells per well in Seahorse Bioscience 24-well
plates in 100µL of DMEM without pyruvate (Corning 10-017-CV) supplemented
with 10% dialyzed fetal bovine serum. An additional 500µL of media was added
following 1 hour incubation. The following day, cells were washed three times with
PBS and incubated in DMEM without pyruvate with the indicated treatment. Five
hours later, OCR measurements were made every 6 minutes, and injections of
pyruvate at 16 minutes, FCCP (Sigma, C2920) at 32 minutes, and rotenone (Sigma
R8875, 2µM) and antimycin (Sigma A8674, 2µM) at 48 minutes. Basal OCR was
calculated by subtracting residual OCR following the addition of rotenone and
antimycin from the initial OCR measurements. Maximal OCR was calculated by
subtracting residual OCR from the oxygen consumption measure made following
the addition of FCCP.

165
Proliferation Rate Measurements: Proliferation rate was determined as
previously described (Gui et al., 2016; Sullivan et al., 2015). Cells were plated in
replicate six-well plates in 2mL at an initial seeding density of 20,000 cells per well
for all cells except for MDA-MB-231, which were seeded at 40,000 cells per well.
Cells were permitted to settle overnight and one six-well dish was counted to
calculate the starting cell number at the initiation of the experiment. For all
remaining dishes, cells were washed three times with PBS and 4mL of treatment
media was added to each well. After 48 hours, cells were washed again three times
with PBS and 4mL of the treatment media was replenished. Four days after the
initial treatment, cells were counted to obtain the final cell counts for the
experiment. All counts were done using a Cellometer Auto T4 Plus Cell Counter
(Nexcelcom Bioscience). The proliferation rate was calculated as follows.
𝑃𝑟𝑜𝑙𝑖𝑓𝑒𝑟𝑎𝑡𝑖𝑜𝑛 𝑅𝑎𝑡𝑒 𝑑𝑜𝑢𝑏𝑙𝑖𝑛𝑔𝑠/𝑑𝑎𝑦 = logP
𝐹𝑖𝑛𝑎𝑙 𝐶𝑒𝑙𝑙 𝐶𝑜𝑢𝑛𝑡 (𝑑𝑎𝑦 = 4)𝐼𝑛𝑖𝑡𝑖𝑎𝑙 𝐶𝑒𝑙𝑙 𝑐𝑜𝑢𝑛𝑡 (𝑑𝑎𝑦 = 0)
4 (𝑑𝑎𝑦𝑠)
Immunoblotting: Cells were treated with 1µM AZD7545 for 2 hours, washed with
ice-cold PBS, and scraped into cold RIPA buffer containing cOmplete Mini protease
inhibitor (Roche 11836170001). Protein concentration was calculated using the BCA
Protein Assay (Pierce 23225) with BSA as a standard. Lysates were resolved by
SDS-PAGE and proteins were transferred onto nitrocellulose membranes using the
iBlot2 Dry Blotting System (Thermo Fisher, IB21001, IB23001). Protein was
166
detected with the primary antibodies anti-Pyruvate Dehydrogenase E1-alpha
subunit (phospho S293) (Abcam, ab92696), anti-FLAG (Sigma, F1804) and anti-
Vinculin (Sigma, V9131). The secondary antibodies used were IR680LT dye
conjugated anti-rabbit IgG (Licor Biosciences 925-68021) and IRDye 800CW
conjugated anti-mouse IgG (Licor Biosciences 925-32210).
Generation of LbNOX cell lines: LbNOX-FLAG cDNA was cloned from pUC57-
LbNOX using the primers 5’-
GGGGACAAGTTTGTACAAAAAAGCAGGCATGAAGGTCACCGTGGTC-3’ and 5’-
GGGGACCACTTTGTACAAGAAAGCTGGGTTTACTTGTCATCGTCATCCTTGTAA
TC-3’. pUC57-LbNOX was a gift from Vamsi Mootha (Addgene, 75285). The PCR
product was subsequently cloned into pInducer20 using LR Clonase II Plus
(ThermoFischer 12538120). pInducer20 was a gift from Stephen Elledge (Addgene,
44012). A549 and 143B cells were infected with lentivirus containing pInducer20-
LbNOX-FLAG or pInducer20-E.V. and 10µg/mL polybrene (Millipore TR-1003-G).
The infected cells were selected in 1mg/mL G418 (VWR-G5005). For proliferation
experiments done with these cell lines, all conditions were supplemented with
500ng/mL doxycycline.
Mitochondrial Membrane Potential: Mitochondrial membrane potential was
assessed by utilizing the TMRE (tetramethylrhodamine, ethyl ester) assay kit
(Abcam, ab113852). 143B cells were treated with 0.1% DMSO, 1µM AZD7545,

167
500nM FCCP, or AZD7545 and FCCP at the indicated doses for 5 hours. The cells
were then treated with 200nM TMRE for 30 minutes, trypsinized, washed with
PBS, and resuspended in 1% BSA in PBS. TMRE fluorescence was measured on a
BD LSR II flow cytometer.
Mouse experiments: Mouse xenografts were generated from A549 cells. Two
million cells were injected into the flanks of NU/NU mice (Charles river
Laboratories, 088). A caliper was used to measure flank tumor volume in two
dimensions and volume was calculated using the equation V = (p/6)(L´W2). Length
was defined to be the longer of the two dimensions measured. The tumors were
permitted to reach a size of 50mm3, after which the animals were random assigned
to an experimental group and the treatment regimen was initiated. Metformin
(500mg/kg) and AZD7545 (45mg/kg) were both administered once daily by oral
gavage, with a vehicle of water and 0.5% (w/w) methocel/0.1% polysorbate 80
respectively.
References
Allen, K.T., Chin-Sinex, H., DeLuca, T., Pomerening, J.R., Sherer, J., Watkins, J.B., 3rd, Foley, J., Jesseph, J.M., and Mendonca, M.S. (2015). Dichloroacetate alters Warburg metabolism, inhibits cell growth, and increases the X-ray sensitivity of human A549 and H1299 NSC lung cancer cells. Free Radic Biol Med 89, 263-273.
Altman, B.J., Stine, Z.E., and Dang, C.V. (2016). From Krebs to clinic: glutamine metabolism to cancer therapy. Nat Rev Cancer 16, 619-634.
168
Birsoy, K., Wang, T., Chen, W.W., Freinkman, E., Abu-Remaileh, M., and Sabatini, D.M. (2015). An Essential Role of the Mitochondrial Electron Transport Chain in Cell Proliferation Is to Enable Aspartate Synthesis. Cell 162, 540-551.
Bonnet, S., Archer, S.L., Allalunis-Turner, J., Haromy, A., Beaulieu, C., Thompson, R., Lee, C.T., Lopaschuk, G.D., Puttagunta, L., Bonnet, S., et al. (2007). A mitochondria-K+ channel axis is suppressed in cancer and its normalization promotes apoptosis and inhibits cancer growth. Cancer Cell 11, 37-51.
Boroughs, L.K., and DeBerardinis, R.J. (2015). Metabolic pathways promoting cancer cell survival and growth. Nat Cell Biol 17, 351-359.
Brown, G.C. (1992). Control of respiration and ATP synthesis in mammalian mitochondria and cells. Biochem J 284 ( Pt 1), 1-13.
Cairns, R.A., Harris, I.S., and Mak, T.W. (2011). Regulation of cancer cell metabolism. Nat Rev Cancer 11, 85-95.
Cairns, R.A., Papandreou, I., Sutphin, P.D., and Denko, N.C. (2007). Metabolic targeting of hypoxia and HIF1 in solid tumors can enhance cytotoxic chemotherapy. Proc Natl Acad Sci U S A 104, 9445-9450.
Chen, L.B. (1988). Mitochondrial membrane potential in living cells. Annu Rev Cell Biol 4, 155-181.
Contractor, T., and Harris, C.R. (2012). p53 negatively regulates transcription of the pyruvate dehydrogenase kinase Pdk2. Cancer Res 72, 560-567.
Corbet, C., and Feron, O. (2017). Cancer cell metabolism and mitochondria: Nutrient plasticity for TCA cycle fueling. Biochim Biophys Acta 1868, 7-15.
DeBerardinis, R.J., and Cheng, T. (2010). Q's next: the diverse functions of glutamine in metabolism, cell biology and cancer. Oncogene 29, 313-324.
DeBerardinis, R.J., Mancuso, A., Daikhin, E., Nissim, I., Yudkoff, M., Wehrli, S., and Thompson, C.B. (2007). Beyond aerobic glycolysis: transformed cells can engage in glutamine metabolism that exceeds the requirement for protein and nucleotide synthesis. Proc Natl Acad Sci U S A 104, 19345-19350.
Fang, M., Shen, Z., Huang, S., Zhao, L., Chen, S., Mak, T.W., and Wang, X. (2010). The ER UDPase ENTPD5 promotes protein N-glycosylation, the Warburg effect, and proliferation in the PTEN pathway. Cell 143, 711-724.

169
Fantin, V.R., St-Pierre, J., and Leder, P. (2006). Attenuation of LDH-A expression uncovers a link between glycolysis, mitochondrial physiology, and tumor maintenance. Cancer Cell 9, 425-434.
Faubert, B., Li, K.Y., Cai, L., Hensley, C.T., Kim, J., Zacharias, L.G., Yang, C., Do, Q.N., Doucette, S., Burguete, D., et al. (2017). Lactate Metabolism in Human Lung Tumors. Cell 171, 358-371 e359.
Garon, E.B., Christofk, H.R., Hosmer, W., Britten, C.D., Bahng, A., Crabtree, M.J., Hong, C.S., Kamranpour, N., Pitts, S., Kabbinavar, F., et al. (2014). Dichloroacetate should be considered with platinum-based chemotherapy in hypoxic tumors rather than as a single agent in advanced non-small cell lung cancer. J Cancer Res Clin Oncol 140, 443-452.
Gui, D.Y., Sullivan, L.B., Luengo, A., Hosios, A.M., Bush, L.N., Gitego, N., Davidson, S.M., Freinkman, E., Thomas, C.J., and Vander Heiden, M.G. (2016). Environment Dictates Dependence on Mitochondrial Complex I for NAD+ and Aspartate Production and Determines Cancer Cell Sensitivity to Metformin. Cell Metab 24, 716-727.
Hay, N. (2016). Reprogramming glucose metabolism in cancer: can it be exploited for cancer therapy? Nat Rev Cancer 16, 635-649.
Heerdt, B.G., Houston, M.A., and Augenlicht, L.H. (2005). The intrinsic mitochondrial membrane potential of colonic carcinoma cells is linked to the probability of tumor progression. Cancer Res 65, 9861-9867.
Hosios, A.M., Hecht, V.C., Danai, L.V., Johnson, M.O., Rathmell, J.C., Steinhauser, M.L., Manalis, S.R., and Vander Heiden, M.G. (2016). Amino Acids Rather than Glucose Account for the Majority of Cell Mass in Proliferating Mammalian Cells. Dev Cell 36, 540-549.
Hosios, A.M., and Vander Heiden, M.G. (2018). The redox requirements of proliferating mammalian cells. J Biol Chem.
Hui, S., Ghergurovich, J.M., Morscher, R.J., Jang, C., Teng, X., Lu, W., Esparza, L.A., Reya, T., Le, Z., Yanxiang Guo, J., et al. (2017). Glucose feeds the TCA cycle via circulating lactate. Nature 551, 115-118.
Hung, Y.P., Albeck, J.G., Tantama, M., and Yellen, G. (2011). Imaging cytosolic NADH-NAD(+) redox state with a genetically encoded fluorescent biosensor. Cell Metab 14, 545-554.
170
Kato, M., Li, J., Chuang, J.L., and Chuang, D.T. (2007). Distinct structural mechanisms for inhibition of pyruvate dehydrogenase kinase isoforms by AZD7545, dichloroacetate, and radicicol. Structure 15, 992-1004.
Kennedy, K.M., Scarbrough, P.M., Ribeiro, A., Richardson, R., Yuan, H., Sonveaux, P., Landon, C.D., Chi, J.T., Pizzo, S., Schroeder, T., et al. (2013). Catabolism of exogenous lactate reveals it as a legitimate metabolic substrate in breast cancer. PLoS One 8, e75154.
Kim, J.W., Tchernyshyov, I., Semenza, G.L., and Dang, C.V. (2006). HIF-1-mediated expression of pyruvate dehydrogenase kinase: a metabolic switch required for cellular adaptation to hypoxia. Cell Metab 3, 177-185.
Koppenol, W.H., Bounds, P.L., and Dang, C.V. (2011). Otto Warburg's contributions to current concepts of cancer metabolism. Nat Rev Cancer 11, 325-337.
Korotchkina, L.G., and Patel, M.S. (2001). Site specificity of four pyruvate dehydrogenase kinase isoenzymes toward the three phosphorylation sites of human pyruvate dehydrogenase. J Biol Chem 276, 37223-37229.
Le, A., Cooper, C.R., Gouw, A.M., Dinavahi, R., Maitra, A., Deck, L.M., Royer, R.E., Vander Jagt, D.L., Semenza, G.L., and Dang, C.V. (2010). Inhibition of lactate dehydrogenase A induces oxidative stress and inhibits tumor progression. Proc Natl Acad Sci U S A 107, 2037-2042.
LeBleu, V.S., O'Connell, J.T., Gonzalez Herrera, K.N., Wikman, H., Pantel, K., Haigis, M.C., de Carvalho, F.M., Damascena, A., Domingos Chinen, L.T., Rocha, R.M., et al. (2014). PGC-1alpha mediates mitochondrial biogenesis and oxidative phosphorylation in cancer cells to promote metastasis. Nat Cell Biol 16, 992-1003, 1001-1015.
Levine, A.J., and Puzio-Kuter, A.M. (2010). The control of the metabolic switch in cancers by oncogenes and tumor suppressor genes. Science 330, 1340-1344.
Liberti, M.V., and Locasale, J.W. (2016). The Warburg Effect: How Does it Benefit Cancer Cells? Trends Biochem Sci 41, 211-218.
Lin, G., Hill, D.K., Andrejeva, G., Boult, J.K., Troy, H., Fong, A.C., Orton, M.R., Panek, R., Parkes, H.G., Jafar, M., et al. (2014). Dichloroacetate induces autophagy in colorectal cancer cells and tumours. Br J Cancer 111, 375-385.
Locasale, J.W., and Cantley, L.C. (2011). Metabolic flux and the regulation of mammalian cell growth. Cell Metab 14, 443-451.
171
Luengo, A., Gui, D.Y., and Vander Heiden, M.G. (2017). Targeting Metabolism for Cancer Therapy. Cell Chem Biol 24, 1161-1180.
Lunt, S.Y., Muralidhar, V., Hosios, A.M., Israelsen, W.J., Gui, D.Y., Newhouse, L., Ogrodzinski, M., Hecht, V., Xu, K., Acevedo, P.N., et al. (2015). Pyruvate kinase isoform expression alters nucleotide synthesis to impact cell proliferation. Mol Cell 57, 95-107.
Lunt, S.Y., and Vander Heiden, M.G. (2011). Aerobic glycolysis: meeting the metabolic requirements of cell proliferation. Annu Rev Cell Dev Biol 27, 441-464.
Madhok, B.M., Yeluri, S., Perry, S.L., Hughes, T.A., and Jayne, D.G. (2010). Dichloroacetate induces apoptosis and cell-cycle arrest in colorectal cancer cells. Br J Cancer 102, 1746-1752.
Merker, M.P., Audi, S.H., Bongard, R.D., Lindemer, B.J., and Krenz, G.S. (2006). Influence of pulmonary arterial endothelial cells on quinone redox status: effect of hyperoxia-induced NAD(P)H:quinone oxidoreductase 1. Am J Physiol Lung Cell Mol Physiol 290, L607-619.
Michelakis, E.D., Sutendra, G., Dromparis, P., Webster, L., Haromy, A., Niven, E., Maguire, C., Gammer, T.L., Mackey, J.R., Fulton, D., et al. (2010). Metabolic modulation of glioblastoma with dichloroacetate. Sci Transl Med 2, 31ra34.
Morrell, J.A., Orme, J., Butlin, R.J., Roche, T.E., Mayers, R.M., and Kilgour, E. (2003). AZD7545 is a selective inhibitor of pyruvate dehydrogenase kinase 2. Biochem Soc Trans 31, 1168-1170.
Nicholls, D.G., and Locke, R.M. (1984). Thermogenic mechanisms in brown fat. Physiol Rev 64, 1-64.
Nobes, C.D., Lakin-Thomas, P.L., and Brand, M.D. (1989). The contribution of ATP turnover by the Na+/K+-ATPase to the rate of respiration of hepatocytes. Effects of thyroid status and fatty acids. Biochim Biophys Acta 976, 241-245.
Papandreou, I., Cairns, R.A., Fontana, L., Lim, A.L., and Denko, N.C. (2006). HIF-1 mediates adaptation to hypoxia by actively downregulating mitochondrial oxygen consumption. Cell Metab 3, 187-197.
Pate, K.T., Stringari, C., Sprowl-Tanio, S., Wang, K., TeSlaa, T., Hoverter, N.P., McQuade, M.M., Garner, C., Digman, M.A., Teitell, M.A., et al. (2014). Wnt signaling directs a metabolic program of glycolysis and angiogenesis in colon cancer. EMBO J 33, 1454-1473.
172
Pfeiffer, T., Schuster, S., and Bonhoeffer, S. (2001). Cooperation and competition in the evolution of ATP-producing pathways. Science 292, 504-507.
Racker, E. (1972). Bioenergetics and the problem of tumor growth. Am Sci 60, 56-63.
Rumsey, W.L., Schlosser, C., Nuutinen, E.M., Robiolio, M., and Wilson, D.F. (1990). Cellular energetics and the oxygen dependence of respiration in cardiac myocytes isolated from adult rat. J Biol Chem 265, 15392-15402.
Schockel, L., Glasauer, A., Basit, F., Bitschar, K., Truong, H., Erdmann, G., Algire, C., Hagebarth, A., Willems, P.H., Kopitz, C., et al. (2015). Targeting mitochondrial complex I using BAY 87-2243 reduces melanoma tumor growth. Cancer Metab 3, 11.
Scholnick, P., Lang, D., and Racker, E. (1973). Regulatory mechanisms in carbohydrate metabolism. IX. Stimulation of aerobic glycolysis by energy-linked ion transport and inhibition by dextran sulfate. J Biol Chem 248, 5175.
Schwartz, J.P., Passonneau, J.V., Johnson, G.S., and Pastan, I. (1974). The effect of growth conditions on NAD+ and NADH concentrations and the NAD+:NADH ratio in normal and transformed fibroblasts. J Biol Chem 249, 4138-4143.
Shahrzad, S., Lacombe, K., Adamcic, U., Minhas, K., and Coomber, B.L. (2010). Sodium dichloroacetate (DCA) reduces apoptosis in colorectal tumor hypoxia. Cancer Lett 297, 75-83.
Shim, H., Chun, Y.S., Lewis, B.C., and Dang, C.V. (1998). A unique glucose-dependent apoptotic pathway induced by c-Myc. Proc Natl Acad Sci U S A 95, 1511-1516.
Stacpoole, P.W. (2017). Therapeutic Targeting of the Pyruvate Dehydrogenase Complex/Pyruvate Dehydrogenase Kinase (PDC/PDK) Axis in Cancer. J Natl Cancer Inst 109.
Sullivan, L.B., Gui, D.Y., Hosios, A.M., Bush, L.N., Freinkman, E., and Vander Heiden, M.G. (2015). Supporting Aspartate Biosynthesis Is an Essential Function of Respiration in Proliferating Cells. Cell 162, 552-563.
Sullivan, L.B., Luengo, A., Danai L.V., Bush L.N., Diehl F.F., Hosios A.M., Lau A.N., Elmiligy S., Malstrom S., Lewis C.A., Vander Heiden M.G. (2018). Evidence for Aspartate as an Endogenous Metabolic Limitation for Tumour Growth. Nat Cell Bio. Manuscript Accepted.

173
Sun, R.C., Fadia, M., Dahlstrom, J.E., Parish, C.R., Board, P.G., and Blackburn, A.C. (2010). Reversal of the glycolytic phenotype by dichloroacetate inhibits metastatic breast cancer cell growth in vitro and in vivo. Breast Cancer Res Treat 120, 253-260.
Tan, A.S., Baty, J.W., Dong, L.F., Bezawork-Geleta, A., Endaya, B., Goodwin, J., Bajzikova, M., Kovarova, J., Peterka, M., Yan, B., et al. (2015). Mitochondrial genome acquisition restores respiratory function and tumorigenic potential of cancer cells without mitochondrial DNA. Cell Metab 21, 81-94.
Titov, D.V., Cracan, V., Goodman, R.P., Peng, J., Grabarek, Z., and Mootha, V.K. (2016). Complementation of mitochondrial electron transport chain by manipulation of the NAD+/NADH ratio. Science 352, 231-235.
Vander Heiden, M.G., Cantley, L.C., and Thompson, C.B. (2009). Understanding the Warburg effect: the metabolic requirements of cell proliferation. Science 324, 1029-1033.
Vander Heiden, M.G., Chandel, N.S., Schumacker, P.T., and Thompson, C.B. (1999). Bcl-xL prevents cell death following growth factor withdrawal by facilitating mitochondrial ATP/ADP exchange. Mol Cell 3, 159-167.
Vander Heiden, M.G., and DeBerardinis, R.J. (2017). Understanding the Intersections between Metabolism and Cancer Biology. Cell 168, 657-669.
Viale, A., Pettazzoni, P., Lyssiotis, C.A., Ying, H., Sanchez, N., Marchesini, M., Carugo, A., Green, T., Seth, S., Giuliani, V., et al. (2014). Oncogene ablation-resistant pancreatic cancer cells depend on mitochondrial function. Nature 514, 628-632.
Warburg, O. (1956). On the origin of cancer cells. Science 123, 309-314.
Ward, P.S., and Thompson, C.B. (2012). Metabolic reprogramming: a cancer hallmark even warburg did not anticipate. Cancer Cell 21, 297-308.
Weinberg, F., Hamanaka, R., Wheaton, W.W., Weinberg, S., Joseph, J., Lopez, M., Kalyanaraman, B., Mutlu, G.M., Budinger, G.R., and Chandel, N.S. (2010). Mitochondrial metabolism and ROS generation are essential for Kras-mediated tumorigenicity. Proc Natl Acad Sci U S A 107, 8788-8793.
Wheaton, W.W., Weinberg, S.E., Hamanaka, R.B., Soberanes, S., Sullivan, L.B., Anso, E., Glasauer, A., Dufour, E., Mutlu, G.M., Budigner, G.S., et al. (2014). Metformin inhibits mitochondrial complex I of cancer cells to reduce tumorigenesis. Elife 3, e02242.

174
Williamson, D.H., Krebs, H.A., Stubbs, M., Page, M.A., Morris, H.P., and Weber, G. (1970). Metabolism of renal tumors in situ and during ischemia. Cancer Res 30, 2049-2054.
Wuntch, T., Chen, R.F., and Vesell, E.S. (1970). Lactate dehydrogenase isozymes: further kinetic studies at high enzyme concentration. Science 169, 480-481.
Xie, H., Hanai, J., Ren, J.G., Kats, L., Burgess, K., Bhargava, P., Signoretti, S., Billiard, J., Duffy, K.J., Grant, A., et al. (2014). Targeting lactate dehydrogenase--a inhibits tumorigenesis and tumor progression in mouse models of lung cancer and impacts tumor-initiating cells. Cell Metab 19, 795-809
Ying, W. (2008). NAD+/NADH and NADP+/NADPH in cellular functions and cell death: regulation and biological consequences. Antioxid Redox Signal 10, 179-206.
Zhao, Y., Wang, A., Zou, Y., Su, N., Loscalzo, J., and Yang, Y. (2016). In vivo monitoring of cellular energy metabolism using SoNar, a highly responsive sensor for NAD(+)/NADH redox state. Nat Protoc 11, 1345-1359.
175
Chapter 4: Targeting lipid biosynthesis to treat
breast cancer brain metastases
Authors: Alba Luengo1,2,8, Gino B. Ferraro3,4,8, Christopher R. Chin1, Divya Bezwada3,4, Shawn M. Davidson1,2,5, Elena Brachtel6, Matthew G. Vander Heiden1,2,6, Rakesh K. Jain3,4 Author Affiliations: 1 Koch Institute for Integrative Cancer Research, Massachusetts Institute of Technology, Cambridge, MA 02139, USA 2 Department of Biology, Massachusetts Institute of Technology, Cambridge, MA 02139, USA 3 Edwin L. Steele Laboratory, Department of Radiation Oncology, Massachusetts General Hospital 4 Harvard Medical School Boston, MA 02114, USA 5 Broad Institute of MIT and Harvard University, Cambridge, MA 02142, USA 6 Department of Pathology, Massachusetts General Hospital and Harvard Medical School, Boston, MA 02114, USA 7 Dana-Farber Cancer Institute, Boston MA 02115, USA 8 Co-first author This chapter is unpublished as of May 2018

176
Abstract
Breast cancer brain metastases are refractory to cancer therapies, even when
the same treatment can be used to successfully treat extracranial breast cancer
lesions. While challenges associated with therapeutic delivery to the brain can
contribute to this phenomenon, the direct influence by the brain tumor
microenvironment can also promote resistance to some drugs. To study how tissue
site can influence breast cancer metabolism, we assessed glucose fate in a murine
model of HER2-amplified breast cancer where human cells are implanted to form
tumors in the brain or in the mammary fat pad (MFP). We found that breast
cancers in the brain exhibit increased glucose consumption and use glucose
differently than those growing in the MFP. We also found that breast cancers
growing in the brain increase lipid biosynthesis, and that unlike breast tumors in
the MFP, the use of glucose carbon to synthesize fatty acids was not dependent
phosphoinositide-3-kinase signaling for breast tumors growing at this site. To study
changes in metabolism caused by the brain microenvironment, we developed ex vivo
platforms that recapitulate the metabolic phenotypes observed in vivo. We also
assessed whether targeting lipid synthesis pharmacologically could be a strategy to
slow proliferation of breast cancer brain metastasis. Taken together, these data
illustrate that the tumor microenvironment can influence glucose metabolism and
sensitivity to therapy.
177
Introduction
Tumor cells rewire metabolism to incorporate nutrients into biomass, balance
cellular energetics, and support rapid uncontrolled proliferation (DeBerardinis and
Chandel, 2016; Pavlova and Thompson, 2016). Most studies have aimed to define
features of the metabolic network that are shared across many tumor types, or are
induced by a particular oncogenic lesion. Cancer-associated mutations can cause
specific changes in how nutrients are used (Nagarajan et al., 2016), but the
phenotype of aerobic glycolysis is considered a hallmark of cancer metabolism and is
observed in most tumors, regardless of driver mutation or tissue of origin (Liberti
and Locasale, 2016; Vander Heiden et al., 2009). In fact, increased glycolysis is so
pervasive among cancers that the associated increase in glucose uptake is routinely
exploited to visualize tumors in patients using positron emission tomography of a
radiolabeled glucose analogue (18F-FDG-PET) (Hay, 2016). While it is important to
define the pathways differentially required for proliferating tumor and normal
tissues, how metabolic alterations across different cancer types are influenced by
tissue location remains understudied. Despite the fact that mammalian organs have
varied nutrient levels and tissue metabolism to support their physiological function,
relatively little is known about how tumor cells adapt their metabolic program to
permit growth in different microenvironments. Tissue environment has been shown
to affect cancer cell metabolism and dependence on specific enzymes (Davidson et
al., 2016; Hensley et al., 2016; Sellers et al., 2015), but the majority of cancer
metabolism studies rely on standard cell culture, which does not accurately
178
recapitulate the nutrient conditions found in tissues (Cantor et al., 2017; Muir et
al., 2017; Tardito et al., 2015). Thus, in vivo cancer metabolism studies are critical
to understand how nutrient availability supports cancer growth in different tumor
microenvironments and can help inform our understanding of both cancer cell
metabolism and metastases.
Breast cancer brain metastasis (BCBM) is a significant clinical problem with
limited treatment options. Patients with breast cancer positive for the receptor
tyrosine-protein kinase erbB-2 (HER2) are at high risk of developing BCBM due to
the proclivity of HER2-positive tumor cells to colonize the brain parenchyma
(Eichler et al., 2011; Kodack et al., 2015). Inhibitors of HER2, including the
antibody trastuzumab, are effective for controlling systemic extracranial disease,
but BCBMs respond poorly to this treatment and consequently are a major cause of
morbidity and mortality for HER2-positive breast cancer patients (Bachelot et al.,
2013; Olson et al., 2013). Though resistance to HER2-targeted therapies is most
commonly attributed to lack of drug delivery across the blood brain barrier, both
preclinical and clinical studies have confirmed that anti-HER2 therapies can
accumulate in brain metastases (Askoxylakis et al., 2016; Tamura et al., 2013).
Furthermore, BCBM are insensitive to brain-penetrant small-molecule inhibitors of
HER2, such as lapatinib (Bachelot et al., 2013; Lin et al., 2008; Lin et al., 2009) as
well as brain-penetrant drugs that target signaling downstream of HER2, such as
phosphoinositide-3-kinase (PI3K)-targeted therapies (Kodack et al., 2017; Ni et al.,
2016). The different clinical response of breast cancers growing in different sites
179
suggests that tumor microenvironment may play a role in therapy resistance in
these patients.
How the environment differs between breast cancer tumors growing in the
brain versus other sites is not well characterized. However, metabolism influenced
by environment and nutrient conditions can affect response to therapy (Cantor et
al., 2017; Davidson et al., 2016; Gui et al., 2016; Muir et al., 2017). Whether
environment changes metabolic dependencies of breast cancers growing in the brain
in a way that influences response to HER2-targeted therapies is unknown.
Gene expression analysis of brain-tropic breast cancer cells have revealed
increased expression of enzymes involved in both glycolysis and oxidative
phosphorylation relative to parental breast cancer cells (Chen et al., 2007), but
whether this affects metabolic vulnerabilities of breast tumors has not yet been
investigated. The blood-brain barrier limits availability of many nutrients, and the
brain is unique in relying primarily on glucose metabolism. There is also evidence
that tumors growing in the brain exhibit more prominent glucose oxidation (Maher
et al., 2012; Marin-Valencia et al., 2012), while another study has argued that
BCBM depend more on gluconeogenesis for survival (Chen et al., 2015). A
comprehensive assessment of how breast cancers growing in the brain parenchyma
adapt their metabolism to proliferate and survive is lacking, and could be
informative to understand how environment affects response to existing breast
cancer therapies.

180
In this study, we sought to determine the differential metabolic dependencies
of primary and metastatic disease and determine the mechanisms by which breast
cancer cells adapt to survive in the brain microenvironment. We utilized an
orthotopic mouse model of HER2-amplified breast cancer that has been previously
shown to recapitulate the clinical response of human disease (Kodack et al., 2017;
Kodack et al., 2012). We assessed the in vivo metabolism of breast tumors growing
in the mammary fat pad (MFP) and brain parenchyma and found that relative to
extracranial disease, BCBM increase glucose consumption and the contribution of
glucose carbon to the tricarboxylic acid (TCA) cycle and to newly synthesized lipids.
Importantly, we found that PI3K inhibition decreased fatty acid synthesis and the
expression of lipid synthesis enzymes in breast tumors growing in the MFP, while
the use of glucose to synthesize lipids in brain metastases was found to be
independent of PI3K signaling. These findings were not evident from the
examination of HER2-amplified breast cancer using standard cell culture
techniques, and thus we optimized organotypic slices and glial-conditioned media
culture systems that recapitulate in vivo metabolic phenotypes to develop platforms
to study the tissue-site driven dependencies of breast cancer. Collectively, we
present evidence that the brain microenvironment affects lipid metabolism of breast
cancer cells and that this metabolic rewiring may contribute to targeted therapy
resistance.

181
Results
Analysis of glucose metabolism in primary and brain metastatic HER2-
amplified breast cancer
Glucose is a major nutrient consumed by proliferating mammalian cells
(Hosios et al., 2016; Jain et al., 2012). Examining the fate of glucose carbons in
tumors can provide insight into how breast cancers use metabolism to grow in
different tissues and may reveal nodes that are differentially important for tumor
growth in the brain versus other sites. To study differences in glucose metabolism
between BCBM and disease in the primary tissue, we generated xenografts in the
MFP and in the brain parenchyma from the HER2-amplified human breast cell line
BT474, which had been previously engineered to express Gaussia luciferase to allow
monitoring of tumor growth by measurement of luciferase activity in blood
(Askoxylakis et al., 2016; Kodack et al., 2017; Kodack et al., 2012). We assessed
glucose uptake in tumors formed at each site using 18F-FDG-PET and found that
BCBM take-up greater quantities of glucose relative to size-matched, isogenic
tumors growing in the MFP (Figure 1A). These data suggest that tumor site could
influence glucose metabolism of breast cancer cells.
To examine the fate of glucose in HER2-positive breast tumors derived from
the same BT474 cells growing in the breast and in the brain, we performed a
euglycemic infusion of 13C-isotope labeled glucose into conscious, unrestrained mice
bearing BT474 xenograft tumors at either site. This approach replaces extracellular
glucose available to tumors with labeled [U-13C6]glucose, which can provide insight
182
into metabolic fluxes in tissues (Davidson et al., 2016; Hensley et al., 2016; Maher
et al., 2012; Marin-Valencia et al., 2012). Following an infusion performed over a
period of twelve hours, the majority of the circulating glucose was 13C-labeled
(Figure 1B). At this time point, metabolites were extracted from tumors and
analyzed by gas chromatography-mass spectrometry (GCMS) to determine the 13C-
labeling of metabolites in tumor tissue.
Carbon from glucose can enter the tricarboxylic acid (TCA) cycle via two main
routes that can be prominent in cancers (Davidson et al., 2016; Hensley et al., 2016;
Sellers et al., 2015). The pyruvate dehydrogenase complex (PDH) can oxidize
pyruvate to acetyl-CoA, which then can enter the TCA cycle (Figure 1C).
Alternatively, glucose-derived pyruvate can enter the TCA cycle through an
anaplerotic reaction catalyzed by pyruvate carboxylase (PC). Relative flux through
these pathways can be estimated from the 13C-label distribution of TCA
intermediates. Oxidation of [U-13C6]glucose via PDH results in TCA metabolites
with two 13C carbons (m+2), while entry of labeled glucose via PC results in TCA
intermediates with three labeled carbons (m+3) (Figure 1C). When compared to
breast tumors growing in the mammary fat pad, breast tumors growing in the brain
display increased m+2 and m+3 labeling of TCA cycle intermediates (Figure 1D),
consistent with increased glucose oxidation of breast tumors growing in the brain.
Relative PC flux also appears to be elevated in BCBM, as the m+3 isotopomers of
citrate, alpha-ketoglutarate, succinate, fumarate, malate and aspartate are all
much higher in BCBM compared to MFP tumors (Figure 1D).

183
To compare the glucose metabolism of tumors growing in each site with the
glucose metabolism of non-cancerous tissue, we analyzed the labeling pattern of
TCA cycle intermediates of normal brain and of white adipose tissue (WAT)
collected from mice that had been infused with [U-13C6]glucose. The contribution of
glucose to generate both m+2 and m+3 TCA cycle metabolite labeling was much
higher in normal brain cortex than in white adipose tissue (WAT) (Figure 1E). This
is perhaps unsurprising, as pyruvate carboxylase has been reported to have high
activity in astrocytes (Shank et al., 1985; Yu et al., 1983) and adipose cells are
glycolytic cells that secrete much of the glucose they consume as lactate
(DiGirolamo et al., 1992; Sabater et al., 2014). Nevertheless, these findings suggest
that the degree to which glucose contributes to the TCA cycle in tumors generated
from the same parental cell line can be similar to the metabolism of the non-
cancerous tissue where the tumor resides, highlighting that tissue
microenvironment can impact tumor metabolism.
Signaling through the PI3K-AKT pathway is downstream of HER2 signaling,
and is important for the progression and growth of HER2-positive breast cancers
(Alimandi et al., 1995; Lee-Hoeflich et al., 2008; Zhou et al., 2001a; Zhou et al.,
2001b). The pan-Class I PI3K inhibitor buparlisib (previously referred to as
BKM120) has been shown to be effective against HER2-amplified breast cancer cells
(Maira et al., 2012) and can cause regression of tumors growing in the MFP (Kodack
et al., 2017). However, even though this compound can effectively cross the blood
brain barrier (Bendell et al., 2012; Koul et al., 2012), and displays similar target

184
Cit aKG Suc Fum Mal Asp Cit aKG Suc Fum Mal Asp0
10
20
30
40
Percen
t L
ab
ele
d
(No
rm
alized
to
Pla
sm
a E
nric
hm
en
t)
m+2m+3
Cortex WAT
0 1500 3000 45000
2
4
6
Time (minutes)
FD
G u
pta
ke
(Tu
mo
r/L
iver r
ati
o)
Brain
MFP
Brain
Tumors
MFP
Tumors
0
50
100
Fracti
on
m+
6 L
ab
ele
d
Plasma Glucose Enrichment
Brain
Tumors
MFP
Tumors
Vehicle PI3K inh. Vehicle PI3K inh.
Cit aKG Suc Fum Mal Asp Cit aKG Suc Fum Mal Asp0
10
20
30
40
Percen
t L
ab
ele
d
(No
rm
alized
to
Pla
sm
a E
nric
hm
en
t)
m+2m+3
Brain Tumors MFP Tumors
Cit Suc Mal Asp Cit Suc Fum Mal Asp0
10
20
30
40
Percen
t L
ab
ele
d
(No
rm
alized
to
Pla
sm
a E
nric
hm
en
t)
m+2m+3
Brain Tumors
+ PI3K Inhibtion
MFP Tumors
+ PI3K inhibition
A. B. C.
D.
E.
G.
PDH
PC
HK2
GLUT3
HER3
HER2
F.

185
Figure 1. Glucose is metabolized differently in BT474 HER2-amplified breast tumors depending on tissue site (A) 18F-fluorodeoxyglucose (FDG)-positron emission tomography was used to assess glucose uptake of tumors derived from HER2-amplified BT474 human breast cancer cells growing in the brain or the mammary fat pad (MFP) of female nu/nu mice. For each tumor, FDG uptake is shown at time points following FDG injection and was normalized to FDG uptake in the liver of the same animal. (B) Enrichment of fully labeled glucose (m+6) in plasma was measured by GCMS following a twelve hour [U-13C6]glucose infusion into mice bearing HER2-amplified tumors in the mammary fat pad (MFP Tumors) or in the brain (Brain Tumors). (C) Schematic depicting the dominant citrate isotopomers generated from fully labeled 13C-glucose (m+6, indicated by grey circles). Fully-labeled pyruvate is generated from glucose by glycolysis (m+3) and can be oxidized by the pyruvate dehydrogenase (PDH) complex to generate acetyl-CoA with label on both carbons. This carbon can enter the tricarboxylic acid (TCA) cycle to produce citrate with two labeled carbons (m+2, indicated by green circles). Carbon from glucose-derived pyruvate can also enter the TCA cycle via pyruvate carboxylase (PC), resulting in citrate with three labeled carbons (m+3, indicated by blue circles). (D and E) The percent labeling of TCA cycle intermediates from [U-13C6]glucose was assessed in (D) HER2-amplified breast tumors growing in the brain (Brain Tumors) and mammary fat pad (MFP Tumors), and in (E) normal brain (Cortex) and white adipose tissue (WAT). Data shown are labeling in tissue after a twelve hour [U-13C6]glucose infusion into female nude mice. The m+2 (green) and m+3 (blue) isotopomers of citrate (Cit), alpha-ketoglutarate (aKG), succinate (Suc), fumarate (Fum), malate (Mal), and aspartate (Asp) were measured by GCMS and normalized to 13C6-glucose enrichment in plasma. (F) The percent labeling of TCA cycle intermediates were measured following a twelve hour [U-13C6]glucose infusion in female nude mice harboring HER2-amplified breast tumors in the brain (Brain Tumors + PI3K inhibition) or mammary fat pad (MFP Tumors + PI3K inhibition) and that had been dosed with 30 mg/kg buparlisib daily for 3 days (PI3K inhibitor). Tissues were collected two hours following the third dose of buparlisib, and the m+2 (green) and m+3 (blue) isotopomers of citrate (Cit), succinate (Suc), malate (Mal), and aspartate (Asp) were normalized to plasma enrichment. (G) Western blot analysis of pyruvate dehydrogenase (PDH), pyruvate carboxylase (PC), hexokinase 2 (HK2), glucose transporter 3 (GLUT3), receptor tyrosine-protein kinase erbB-3 (HER3), and receptor tyrosine-protein kinase erbB-2 (HER2) expression in three representative HER2-amplified lesions growing in the mammary fat pad (MFP Tumors) or brain (Brain Tumors) of mice that had been treated with vehicle or with 30 mg/kg buparlisib daily for 10 days (PI3K inh.). Tissues were harvested two hours following the final dose of buparlisib.

186
inhibition in tumors growing in the MFP and the brain, BT474-derived tumors
growing in the brain are resistant to buparlisib treatment (Kodack et al., 2017).
This suggests that that the brain microenvironment can alter dependence on the
PI3K pathway in HER2-amplified breast tumors.
To assess whether PI3K inhibition had a differential effect on glucose
metabolism in BT474 xenografts growing at different tumor sites, we assessed
glucose fate in breast tumors after a 12-hour [U-13C6]glucose infusion in mice that
had been treated with buparlisib. Though we did not observe dramatic changes, the
m+2 and m+3 labeling of TCA cycle intermediates from glucose in both BCBM and
MFP tumors decreased slightly upon PI3K inhibition, particularly the abundance of
m+3 isotopomers in MFP tumors (Figure 1D,F).
Finally, we performed Western blot analysis to assess whether the expression
of proteins involved in glucose metabolism in tumors growing in the MFP and in the
brain was affected by buparlisib treatment. Interestingly, the relative expression of
PC and PDH protein levels corresponded to the differences in relative glucose fate
we observed in each site (Figure 1D,F,G). In addition, PDH expression in BT474
xenografts was found to be largely unaffected by tumor location or buparlisib
treatment, whereas PC expression appears to be decreased by PI3K inhibition in
the MFP, but not in the brain (Figure 1G). Collectively, these data suggest that
isogenic tumors growing in different sites display differences in metabolic enzyme
expression and glucose metabolism, and these differences appear to be conferred by
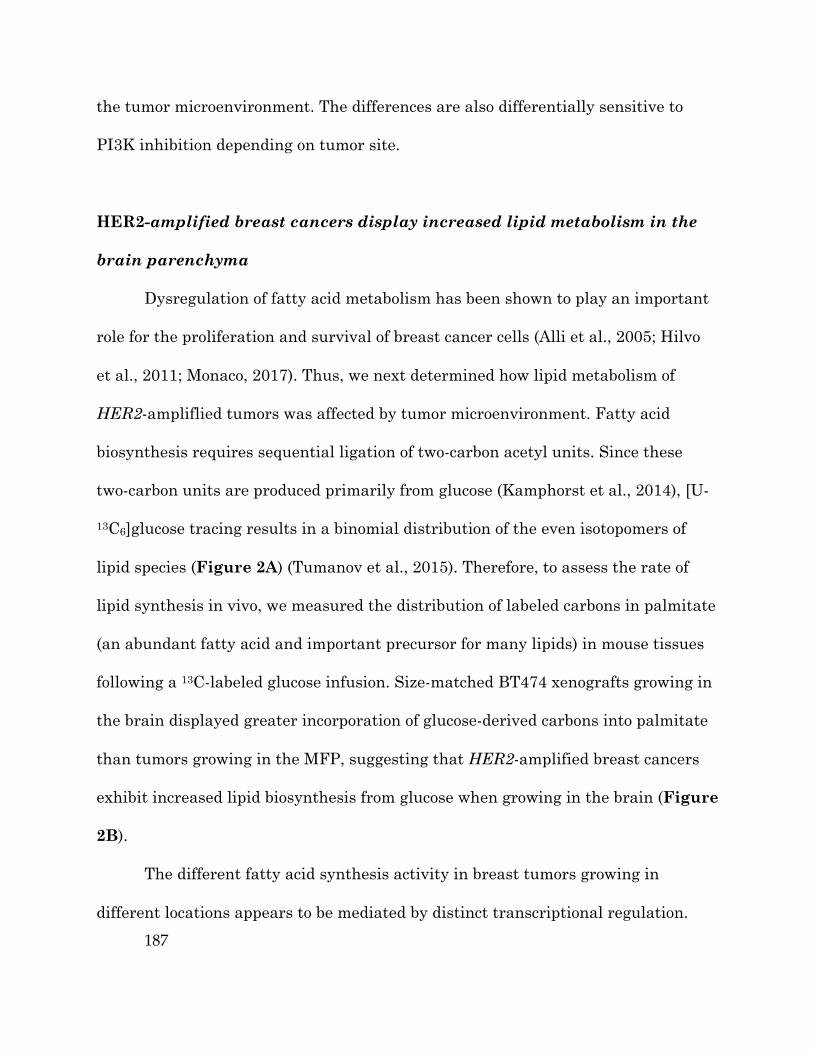
187
the tumor microenvironment. The differences are also differentially sensitive to
PI3K inhibition depending on tumor site.
HER2-amplified breast cancers display increased lipid metabolism in the
brain parenchyma
Dysregulation of fatty acid metabolism has been shown to play an important
role for the proliferation and survival of breast cancer cells (Alli et al., 2005; Hilvo
et al., 2011; Monaco, 2017). Thus, we next determined how lipid metabolism of
HER2-ampliflied tumors was affected by tumor microenvironment. Fatty acid
biosynthesis requires sequential ligation of two-carbon acetyl units. Since these
two-carbon units are produced primarily from glucose (Kamphorst et al., 2014), [U-
13C6]glucose tracing results in a binomial distribution of the even isotopomers of
lipid species (Figure 2A) (Tumanov et al., 2015). Therefore, to assess the rate of
lipid synthesis in vivo, we measured the distribution of labeled carbons in palmitate
(an abundant fatty acid and important precursor for many lipids) in mouse tissues
following a 13C-labeled glucose infusion. Size-matched BT474 xenografts growing in
the brain displayed greater incorporation of glucose-derived carbons into palmitate
than tumors growing in the MFP, suggesting that HER2-amplified breast cancers
exhibit increased lipid biosynthesis from glucose when growing in the brain (Figure
2B).
The different fatty acid synthesis activity in breast tumors growing in
different locations appears to be mediated by distinct transcriptional regulation.

188
m+2 m+4 m+6 m+8 m+10 m+12 m+14 m+160
1
2
3
4
Palm
itate
Perc
ent
Labe
led
(Nor
mal
ized
to P
lasm
a en
richm
ent)
Brain TumorsBrain Tumors + PI3K inh.MFP TumorsMFP Tumors + PI3K inh.
m+2 m+4 m+6 m+8 m+10 m+12 m+14 m+160
1
2
3
4
Palm
itate
Perc
ent
Labe
led
(Nor
mal
ized
to P
lasm
a En
richm
ent)
Brain TumorsMFP TumorsCortexWAT
BrainMFP
MFPTumors
Vehicle PI3K inh. Vehicle PI3K inh.
BrainTumors
Vehicle PI3K inh. Vehicle PI3K inh.
MFPTumors
BrainTumors
p-ACC (S79) ACC
FASNp-ACLY (S455)
ACLY
BT474 T47D
A. B.
C. E.
D. F.
G.
m+2 m+4 m+6 m+8 m+10 m+12 m+14 m+160
1
2
3
4
Palm
itate
Perc
ent
Labe
led
(Nor
mal
ized
to P
lasm
a En
richm
ent)
Brain TumorsMFP Tumors
FASN
Iba1
GFAP
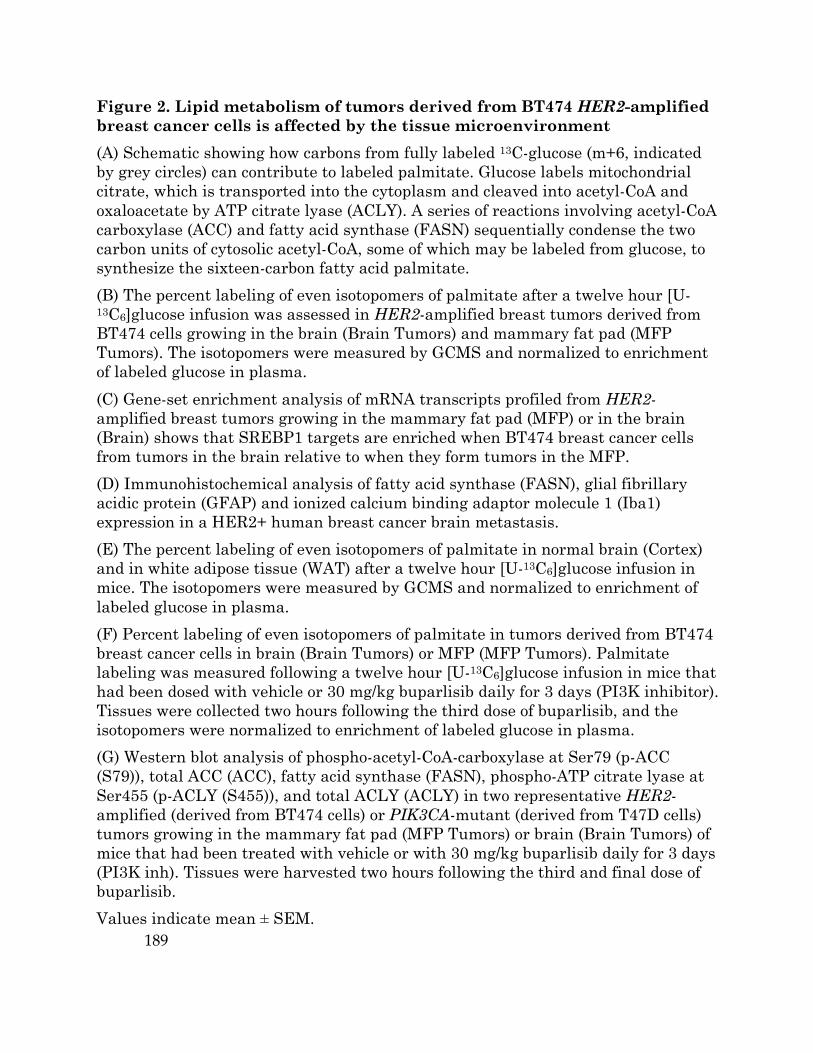
189
Figure 2. Lipid metabolism of tumors derived from BT474 HER2-amplified breast cancer cells is affected by the tissue microenvironment (A) Schematic showing how carbons from fully labeled 13C-glucose (m+6, indicated by grey circles) can contribute to labeled palmitate. Glucose labels mitochondrial citrate, which is transported into the cytoplasm and cleaved into acetyl-CoA and oxaloacetate by ATP citrate lyase (ACLY). A series of reactions involving acetyl-CoA carboxylase (ACC) and fatty acid synthase (FASN) sequentially condense the two carbon units of cytosolic acetyl-CoA, some of which may be labeled from glucose, to synthesize the sixteen-carbon fatty acid palmitate. (B) The percent labeling of even isotopomers of palmitate after a twelve hour [U-13C6]glucose infusion was assessed in HER2-amplified breast tumors derived from BT474 cells growing in the brain (Brain Tumors) and mammary fat pad (MFP Tumors). The isotopomers were measured by GCMS and normalized to enrichment of labeled glucose in plasma. (C) Gene-set enrichment analysis of mRNA transcripts profiled from HER2-amplified breast tumors growing in the mammary fat pad (MFP) or in the brain (Brain) shows that SREBP1 targets are enriched when BT474 breast cancer cells from tumors in the brain relative to when they form tumors in the MFP. (D) Immunohistochemical analysis of fatty acid synthase (FASN), glial fibrillary acidic protein (GFAP) and ionized calcium binding adaptor molecule 1 (Iba1) expression in a HER2+ human breast cancer brain metastasis. (E) The percent labeling of even isotopomers of palmitate in normal brain (Cortex) and in white adipose tissue (WAT) after a twelve hour [U-13C6]glucose infusion in mice. The isotopomers were measured by GCMS and normalized to enrichment of labeled glucose in plasma. (F) Percent labeling of even isotopomers of palmitate in tumors derived from BT474 breast cancer cells in brain (Brain Tumors) or MFP (MFP Tumors). Palmitate labeling was measured following a twelve hour [U-13C6]glucose infusion in mice that had been dosed with vehicle or 30 mg/kg buparlisib daily for 3 days (PI3K inhibitor). Tissues were collected two hours following the third dose of buparlisib, and the isotopomers were normalized to enrichment of labeled glucose in plasma. (G) Western blot analysis of phospho-acetyl-CoA-carboxylase at Ser79 (p-ACC (S79)), total ACC (ACC), fatty acid synthase (FASN), phospho-ATP citrate lyase at Ser455 (p-ACLY (S455)), and total ACLY (ACLY) in two representative HER2-amplified (derived from BT474 cells) or PIK3CA-mutant (derived from T47D cells) tumors growing in the mammary fat pad (MFP Tumors) or brain (Brain Tumors) of mice that had been treated with vehicle or with 30 mg/kg buparlisib daily for 3 days (PI3K inh). Tissues were harvested two hours following the third and final dose of buparlisib. Values indicate mean ± SEM.

190
Gene set enrichment analysis comparing the transcriptomes of BT474 lesions
growing in the MFP and in the brain suggests that targets of the transcription
factor sterol regulatory element-binding protein isoform 1 (SREBP1) were
selectively enriched in brain tumors (Figure 2C). SREBP1 is a master
transcriptional regulator that activates fatty acid biosynthesis and has been shown
to be important for growth of some cancers (Currie et al., 2013; Furuta et al., 2008).
Thus, higher activity of SREBP1 could explain why lipid synthesis is observed to be
higher in breast cancers growing in the brain.
To determine whether enzymes involved in lipid synthesis were also found in
human breast cancer brain metastases, we performed immunohistochemistry
assessing fatty acid synthase (FASN) expression on a patient-derived HER2-
positive breast cancer brain metastasis (Figure 2D). FASN was specifically
expressed in the metastatic breast tumor at levels that are much higher than the
surrounding brain tissue. Staining for FASN was found to be mutually exclusive
with two markers of brain stroma – ionized calcium binding adaptor molecule 1
(Iba1), which localizes to microglia (Ito et al., 1998) and glial fibrillary acidic protein
(GFAP), which is enriched in astrocyte cells (Eng et al., 2000). This finding is
consistent with literature suggesting that lipid synthesis is increased in cancer cells
(Medes et al., 1953; Ookhtens et al., 1984).
To confirm that tumors synthesize more lipids than the relevant normal
tissues in our tumor model, we assessed incorporation of glucose carbon into
palmitate in the brain and WAT of mice that had been infused with [U-13C6]glucose.

191
We find that these non-cancerous tissues incorporate less glucose carbon into lipids
than tumor lesions growing in either site (Figure 2E), confirming that elevated
lipid synthesis can be a feature of cancer (Baenke et al., 2013; Medes et al., 1953). It
was surprising that white adipose tissue had virtually no detectable lipid synthesis
in these mice, since glucose has been show to contribute to adipocyte lipid stores
(Hosios et al., 2016). However, it is possible that because in this case WAT was
collected from tumor bearing mice, these animals had reduced lipogenesis due to
adipose atrophy induced by cancer (Ebadi and Mazurak, 2014).
We next wondered whether lipid metabolism of HER2-amplified breast
tumors is altered following PI3K inhibition by buparlisib. We analyzed the
palmitate isotopomer distribution of BT474 xenografts following three doses of
buparlisib and a twelve-hour infusion of 13C-labeled glucose. Interestingly, we found
that PI3K inhibition reduced lipid synthesis in breast cancers growing in the MFP,
but not in those growing in the brain parenchyma (Figure 2F). This suggests that,
in contrast to MFP breast tumors, lipid synthesis from glucose in breast tumors
growing in the brain is independent of PI3K signaling.
We next analyzed the expression of proteins involved in lipid synthesis in
breast cancer cell lines proliferating in the MFP and in the brain by Western blot.
We performed this analysis on tumors generated from BT474 cells, as well as on
tumors generated from the PIK3CA-mutant (H1047R) T47D cell line. We found that
the expression of many lipid biosynthesis enzymes, including FASN, acetyl-CoA
carboxylase (ACC), and acetyl-CoA lyase (ACLY) were elevated in tumors growing

192
in the brain relative to those growing in the MFP. We also found that expression of
these enzymes was reduced by PI3K inhibition in breast cancers growing in the
MFP, while expression of the same enzymes in brain tumors either remained
unchanged or was only modestly affected by buparlisib treatment (Figure 2G).
Taken together, the data from our glucose tracing experiments, gene set
enrichment analysis, and protein expression analysis suggests that lipid
metabolism is dysregulated in breast tumors growing in different tissue sites, and
that tumors growing in the brain have increased lipid synthesis from glucose that is
independent of PI3K signaling. These findings argue that increased lipid
biosynthesis may be a metabolic adaptation of breast cancers proliferating in the
brain that tracks with therapy resistance to PI3K inhibition.
Organotypic slice cultures, but not standard tissue culture conditions,
recapitulate in vivo metabolic phenotypes related to lipid synthesis from
glucose
Our data argue that HER2-amplified BCBM exhibit increased glucose flux
into lipids; however, an ability to dissect the mechanism of this effect in vivo is
technically challenging. Standard tissue culture methods are more amenable to
assess response to drug treatment and allow manipulation of nutrient conditions
(Lane et al., 2016), but may not reflect differences caused by the tumor
microenvironment (Mayers and Vander Heiden, 2015). To determine whether we
could study the increased contribution of glucose carbons to lipids observed in

193
BCBM in vitro, we first assessed whether this phenotype requires constant
exposure to the brain microenvironment. We dissociated BT474 xenografts that had
been growing in the brain parenchyma and cultured cancer cells from these tumors
in standard conditions used to passage BT474 cells in vitro. We then assessed the
rate of lipid synthesis in these cells by measuring the incorporation of carbons from
[U-13C6]glucose into palmitate, and found no change in the palmitate labeling
compared to the parental cell lines (Figure 3A). This finding highlights the
difficulty of studying site-dependent metabolic alterations that are driven by tissue
environment and argues that alternative culture systems are needed to recapitulate
in vivo breast cancer metabolism.
Previous studies have shown that organotypic slice cultures can retain
cellular architecture and some characteristics of in vivo metabolism (Lane et al.,
2016; Sellers et al., 2015; Warburg, 1923). To determine whether breast cancer slice
cultures exhibit the same metabolic phenotypes observed in the orthotopic mouse
model, we cut freshly resected BT474 xenograft tumors from the MFP and from the
brain into 250-300µM slices, placed them in culture media containing [U-
13C6]glucose, and traced the metabolic fate of labeled glucose. We analyzed the 13C
label distribution in palmitate and found that BCBM explants exhibit increased
lipid synthesis relative to tissue slices derived from tumors growing in the MFP
(Figure 3B). Similar findings were obtained in explants from tumors generated
from the HER2-amplified and PIK3CA-mutant (E545K) MDA-MB-361 cell line
(Figure 3C).
194
We next assessed whether synthesis of lipids from glucose in the organotypic
slices could be influenced by PI3K inhibition, and whether the response observed in
explants would reflect that of our orthotopic mouse model. We traced [U-
13C6]glucose into BT474 organotypic slices and found that buparlisib treatment
decreased the 13C-label distribution of palmitate in explants from MFP tumors,
while lipid synthesis from glucose in brain slices appeared to be unaffected by PI3K
inhibition (Figure 3D). Interestingly, unlike BT474 tumor slices, slices from MDA-
MB-361 xenografts growing in the brain also displayed decreased label from glucose
into palmitate upon buparlisib treatment, although these explants maintained a
higher rate of lipid synthesis than was observed in organotypic slices generated
from MFP xenografts (Figure 3C). This data is potentially relevant, because MDA-
MB-361 tumors proliferating in the brain are less resistant to PI3K inhibition than
BT474 brain tumors (Kodack et al., 2017). The finding that MDA-MB-361 brain
explants are more sensitive to buparlisib than BT474 brain explants serves as
further evidence that organotypic slice cultures can recapitulate breast cancer
phenotypes observed in vivo. Furthermore, data generated from these organotypic
slice cultures suggest that increased lipid synthesis is a general feature of BCBM
that can be reproduced in ex vivo explants, and argues that this could be a viable
platform to both study metabolism, and test therapeutic agents targeting BCBM.

195
Figure 3. Ex vivo organotypic cultures recapitulate in vivo site-specific metabolic phenotypes of breast cancers more accurately than standard tissue culture conditions. (A) The percent labeling of the even isotopomers of palmitate was assessed in parental BT474 cell lines and in two different lines of BT474 cells that had previously grown as brain tumors that were then re-seeded in vitro. (B) The percent labeling of even isotopomers of palmitate were measured by GCMS after culturing ex vivo tissue slice cultures from tumors growing in the brain (Brain Tumor Slice) or mammary fat pad (MFP Tumor Slice) derived fromHER2-amplified BT474 cells.in media supplemented with [U-13C6]glucose. (C and D). The percent labeling of even isotopomers of palmitate were measured by GCMS after culturing organotypic slice cultures generated from (C) HER2-amplified and PIK3CA-mutant (MDA-MB-361) or (D) HER2-amplified (BT474) tumors growing in the brain (Brain Tumor Slice) and in the breast (MFP Tumor Slice) in media containing [U-13C6]glucose and either DMSO or 1µM buparlisib (PI3K inh.). Values indicate mean ± SEM.
m+2 m+4 m+6 m+8 m+10 m+12 m+14 m+160
5
10
15
Palm
itate
Perc
ent L
abel
ed
BT474 ParentalBT474 Brain ABT474 Brain B
m+2 m+4 m+6 m+8 m+10 m+12 m+14 m+160
1
2
3
MD
A-M
B-3
61Pa
lmita
te P
erce
nt L
abel
ed
MFP Tumor SliceMFP Tumor Slice + PI3K inh.
Brain Tumor SliceBrain Tumor Slice + PI3K inh.
m+2 m+4 m+6 m+8 m+10 m+12 m+14 m+160
2
4
6
8
10 Brain Tumor SliceMFP Tumor Slice
BT4
74
Palm
itate
Per
cent
Lab
eled
A. C.
m+2 m+4 m+6 m+8 m+10 m+12 m+14 m+160
1
2
3
4
BT4
74
Palm
itate
Per
cent
Lab
eled
MFP Tumor Slice
Brain Tumor SliceBrain Tumor Slice + PI3K inh.
MFP Tumor Slice + PI3K inh.
B. D.

196
Medium conditioned by primary glial cultures confers a proliferative
advantage to breast cancer cells and induces resistance to PI3K inhibition
The fact that organotypic slice cultures appear to recapitulate features of the
brain microenvironment in vitro suggests that the presence of brain stroma may be
sufficient to induce relevant metabolic alterations. To assess whether these
metabolic changes were a result of a physical interaction between breast cancer
cells and the surrounding tissue or a result of a soluble factor released by brain
stroma, we assessed whether culturing breast cancer cells in media that had been
preconditioned by primary glial cells could confer resistance to PI3K inhibition or
alter the rate of lipid biosynthesis in breast cancer cells. When cultured in
minimum essential media (MEM) that had been conditioned for 4 days by primary
glial cell culture, the HER2-amplified cancer cell line BT474 displayed a
proliferative advantage in conditioned media relative to culture in standard MEM
or RPMI (Figure 4A). Additionally, medium conditioned by glial cells decreases
sensitivity of BT474 cells to buparlisib, mimicking drug resistance observed in
BCBM in the orthotropic mouse model. These findings are also consistent with
existing literature showing that brain stroma can promote the proliferation and
survival of cancer cells (Kim et al., 2011; Lin et al., 2010).
We next wanted to determine whether the rate of lipid biosynthesis in breast
cancer cells could be altered by glial cells in culture. First, we supplemented
standard MEM and MEM conditioned by glial cells with the same concentrations of
unlabeled and 13C-isotope labeled glucose, and assessed the incorporation of labeled

197
Figure 4. Conditioned media from primary glial cell cultures can promote lipid synthesis and confer resistance to PI3K inhibition (A) Relative number of viable BT474 cells after treatment with the indicated doses of buparlisib (PI3K inh.) in media based on either minimal essential media (MEM), RPMI, or MEM that had been conditioned by primary glial cultures. Number of viable cells was assessed using Cell Titer-Glo Assay. (B) The percent labeling of even isotopomers of palmitate were measured in BT474 cells that had been grown in MEM or glial conditioned MEM media that had been supplemented with [U-13C6]glucose. Two batches of conditioned media, which had been generated from two independent primary glial cultures, were assessed (Batch A and B respectively). (C) The incorporation of glucose carbons into the even isotopomers of palmitate was measured in BT474 cells that had been cultured in [U-13C6]glucose in standard DMEM-based media, or in the same media that was shared with primary glial cells via a transwell culture system. (D) The incorporation of glucose carbons into the even isotopomers of palmitate in BT474 cells that had been cultured alone in standard media, or co-cultured with primary glial cells in a transwell system. Cells were incubated with [U-13C6]glucose and 1µM buparlisib (PI3K inh.) as indicated. Values indicate mean ± SEM.
m+2 m+4 m+6 m+8 m+10 m+12 m+14 m+160
5
10
15
Palm
itate
Perc
ent L
abel
ed
BT474BT474 co-culture
MEM RPMI AstrocyteConditioned
MEM
0.0
0.5
1.0
1.5
2.0
Rel
ativ
e R
LU
Vehicle1µM PI3K inh.2µM PI3K inh.
A.
m+2 m+4 m+6 m+8 m+10 m+12 m+14 m+160
5
10
15
20
25
Palm
itate
Perc
ent L
abel
ed
MEM (Batch A)Glial Conditioned MEM (Batch A)MEM (Batch B)Glial Conditioned MEM (Batch B)
m+2 m+4 m+6 m+8 m+10 m+12 m+14 m+160
5
10
15
Palm
itate
Perc
ent L
abel
ed
BT474BT474 + PI3K inh.BT474 co-cultureBT474 co-culture + PI3K inh.
B.
C D.
198
carbon into palmitate in BT474 cells cultured in these different media. We found
that incorporation of glucose carbons into lipids was increased in two independent
batches of glial conditioned media (Figure 4B). We obtained similar results by co-
culturing breast cancer cells with glia using a co-culture system in which the breast
cancer and glial cells were cultured in separate compartments but shared the same
culture media (Figure 4C). Interestingly, though buparlisib treatment decreased
lipid synthesis in BT474 that were cultured alone, palmitate labeling in BT474 cells
co-cultured with glial cells in a transwell system also appeared to be independent of
PI3K signaling (Figure 4D). Taken together, these data suggest that a soluble
factor secreted by glial cells, or depletion of a soluble factor by glial cells, is
sufficient to alter the metabolism of breast cancer cells and increase lipid synthesis
from glucose. This finding is consistent with constant exposure to the brain
microenvironment being needed to induce both therapeutic resistance and the
metabolic changes associated with BCBM.
Efforts to target lipid biosynthesis in BCBM using pharmacological agents
Because our data argue that BCBM exhibit increase glucose flux into lipids
and that this correlated with resistance to PI3K inhibition, we wanted to test
whether increased lipid biosynthesis is a metabolic dependency of BCBM. To this
end, we sought to identify small molecules that could target this pathway. The
ACLY inhibitor SB-204990, the ACC inhibitors TOFA and PF 05175157, and the
FASN inhibitors C75 and GSK 2194069 have all been reported to block fatty acid

199
synthesis and can suppress tumor cell growth in some contexts (Flavin et al., 2010;
Hatzivassiliou et al., 2005; Huang et al., 2015; Kuhajda, 2006; Li et al., 2013).
However, when we assessed the degree to which these compounds inhibited the
incorporation of glucose carbons into palmitate, the majority did not inhibit lipid
synthesis at doses that were achievable for target inhibition in vivo (Figure 5A-E).
Recently, 3V Biosciences has developed an oral, potent FASN inhibitor that is
currently being assessed for clinical efficacy for the treatment of patients with
advanced solid malignant tumors (Jones and Infante, 2015) (NCT02223247). We
obtained TVB-3644, which is a tool compound related to the clinical drug candidate,
and determined that TVB-3644 was very effective at inhibiting lipid production in
vitro, as BT474 cells cultured in the presence of this inhibitor displayed low
incorporation of glucose carbons into palmitate, even at doses as low as 50nM
(Figure 5F).
To assess whether targeting lipid biosynthesis could represent a metabolic
dependency of HER2-amplified breast cancer, we measured the proliferation of
breast cancer cell lines that had been cultured in the presence or the absence of
TVB-3644. We determined that this FASN inhibitor reduced proliferation of BT474
and MDA-MB-361 cell lines in standard culture almost as potently as the PI3K
inhibitor buparlisib (Figure 5G,H). We next assessed the response to TVB-3644 in
organotypic slices by measuring the incorporation of glucose carbons into palmitate,
and determined that TVB-3644 can reduce the rate of lipid synthesis in both MFP
and brain explants generated from BT474 and MDA-MB-361 tumor xenografts
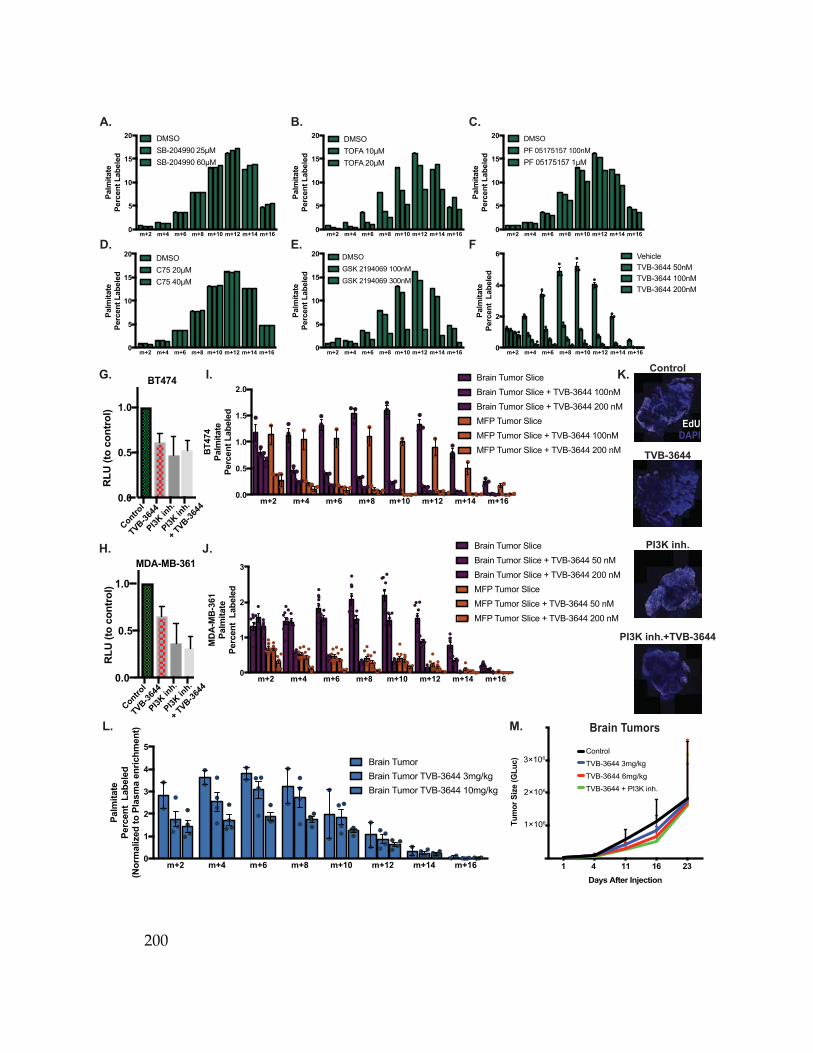
200
m+2 m+4 m+6 m+8 m+10 m+12 m+14 m+160
1
2
3
4
5
Palm
itate
Percen
t L
ab
ele
d
(No
rm
alized
to
Pla
sm
a e
nric
hm
en
t)
Brain Tumor
Brain Tumor TVB-3644 3mg/kg
Brain Tumor TVB-3644 10mg/kg
m+2 m+4 m+6 m+8 m+10 m+12 m+14 m+160
5
10
15
20
Palm
itate
Percen
t L
ab
ele
d
DMSO
C75 20µM
C75 40µM
m+2 m+4 m+6 m+8 m+10 m+12 m+14 m+160
5
10
15
20
Palm
itate
Percen
t L
ab
ele
d
DMSO
TOFA 10µM
TOFA 20µM
m+2 m+4 m+6 m+8 m+10 m+12 m+14 m+160
5
10
15
20
Palm
itate
Percen
t L
ab
ele
d
DMSO
SB-204990 25µM
SB-204990 60µM
0
1
Tu
mo
r S
ize (
GL
uc)
Control
TVB-3644 3mg/kg
TVB-3644 6mg/kg
TVB-3644 + PI3K inh.
4 11 16 23
Days After Injection
3×10⁶
2×10⁶
1×10⁶
m+2 m+4 m+6 m+8 m+10 m+12 m+14 m+160
1
2
3
MD
A-M
B-3
61
Palm
itate
Percen
t L
ab
ele
d MFP Tumor Slice
MFP Tumor Slice + TVB-3644 50 nM
MFP Tumor Slice + TVB-3644 200 nM
Brain Tumor Slice
Brain Tumor Slice + TVB-3644 50 nM
Brain Tumor Slice + TVB-3644 200 nM
m+2 m+4 m+6 m+8 m+10 m+12 m+14 m+160.0
0.5
1.0
1.5
2.0
BT
474
Palm
itate
Percen
t L
ab
ele
d
MFP Tumor Slice
MFP Tumor Slice + TVB-3644 100nM
MFP Tumor Slice + TVB-3644 200 nM
Brain Tumor Slice
Brain Tumor Slice + TVB-3644 100nM
Brain Tumor Slice + TVB-3644 200 nM
0.0
0.5
1.0
MDAMB361
RL
U (
to c
on
tro
l)
Control
TVB-3
644
PI3
K inh.
Fat 5uM
Fat 10uM
Fat 10uM
+ T
VB200nM
RAD001 5
00nM
RAD001 5
00nM
+ T
VB200nM
TVB-3
644
PI3
K inh.
PI3
K inh.
+ T
VB-3
644
0.0
0.5
1.0
BT474
RL
U (
to c
on
tro
l)
Control
PI3
K inh.
+ T
VB-3
644
MDA-MB-361
m+2 m+4 m+6 m+8 m+10 m+12 m+14 m+160
5
10
15
20
Palm
itate
Percen
t L
ab
ele
d
DMSO
GSK 2194069 100nM
GSK 2194069 300nM
A. B. C.
D. E. F.
H. J.
G. I.
L. M.
m+2 m+4 m+6 m+8 m+10 m+12 m+14 m+160
5
10
15
20
Palm
itate
Percen
t L
ab
ele
d
DMSO
PF 05175157 100nM
PF 05175157 1µM
m+2 m+4 m+6 m+8 m+10 m+12 m+14 m+160
2
4
6
Palm
itate
Percen
t L
ab
ele
d
Vehicle
TVB-3644 50nM
TVB-3644 100nM
TVB-3644 200nM
Brain Tumors
Control
TVB-3644
PI3K inh.
PI3K inh.+TVB-3644
K.
EdU
DAPI

201
Figure 5. Targeting lipid synthesis in breast cancer cells utilizing existing pharmacologic agents. (A-F) The percent labeling of even isotopomers of palmitate were measured by GCMS after culturing BT474 cells in media supplemented with [U-13C6]glucose and the indicated doses of the ACLY inhibitor (A) SB-204990, the ACC inhibitors (B) TOFA and (C) PF 05175157, and the fatty acid synthase inhibitors (D) C75, (E) GSK 2194069, and (F) TVB-3644. (G and H) Relative number of viable (G) BT474 and (H) MDA-MB-361 cells after treatment with 200nM FASN inhibitor TVB-3644 and/or 750nM buparlisib (PI3K inh.) as determined by MTT assay as indicated. (I and J) The percent labeling of even isotopomers of palmitate were measured by GCMS after culturing organotypic slice cultures generated from (I) HER2-amplified (BT474) or (J) HER2-amplified and PIK3CA-mutant (MDA-MB-361) breast tumors growing in the brain (Brain Tumor Slice) or in the breast (MFP Tumor Slice) in media containing [U-13C6]glucose and the indicated doses of the FASN inhibitor TVB-3644. (K) To monitor proliferation, 5-ethynyl-2′-deoxyuridine (EdU) incorporation into ex vivo slice cultures generated from BT474 xenografts growing in the brain was assessed by imaging slices (250-300µm thick) using multispectral confocal microscopy. HER2+ breast cancer cells remain viable up to 5 days ex vivo as shown by the DAPI stain and EdU incorporation (active proliferation). Slices were incubated in media containing 200nM TVB-3644, 750nM buparlisib (PI3K inh.), or both as indicated. (L) The percent labeling of even isotopomers of palmitate were measured following a twelve hour [U-13C6]glucose infusion in mice that had been dosed with the indicated doses of TVB-3644 and harbored HER2-amplified breast tumors in the brain (Brain Tumors). Tissues were collected two hours following the third dose of TVB-3644, and the isotopomers were normalized to enrichment of glucose in plasma. (M) Growth kinetics of HER2-amplified BT474 breast tumors cell lines growing in the brain was assessed by the measurement of Gaussia luciferase (GLuc) activity in blood. Mice were treated with the indicated doses of the FASN inhibitor TVB-3644, buparlisib (PI3K inh.), or both drugs in combination. Values indicate mean ± SEM.

202
(Figure 5I,J). Finally, we wanted to determine how FASN inhibition could
influence tumor growth of BCBM. We assessed proliferation of HER2-amplified
organotypic slices by measuring incorporation of 5-etnydyl-2’-deoxyuridine (EdU) by
confocal microscopy. We find that brain explants established from BT474 brain
tumors are refractory to PI3K inhibition, as buparlisib does not decrease the EdU
incorporation of these slice cultures (Figure 5K). These results match the response
to PI3K observed in vivo, as these same tumors are also refractory to buparlisib
when grown in the brain parenchyma (Kodack et al., 2017). However, TVB-3644
was able to significantly reduce EdU labeling in BT474 brain explants, both as a
single agent and combined with buparlisib (Figure 5K). The finding that FASN
inhibition is able to reduce proliferation of HER2-amplified cells grown in standard
tissue culture conditions as well as in brain organotypic slices suggest that lipid
synthesis could be a targetable vulnerability of breast cancer, including in BCBM.
We also tested whether TVB-3644 could inhibit growth of BCBM in the
BT474 orthotopic model. Unfortunately, TVB-3644 was found to be less effective in
reducing lipid synthesis in BCBM in vivo, as tracing of [U-13C6]glucose fate into
BT474 xenografts in the brain showed only a modest reduction of incorporation of
label into palmitate at a dose of 3mg/kg (Figure 5L). Though there was stronger
inhibition of lipid synthesis when mice were dosed with TVB-3644 at 10mg/kg
(Figure 5L), this treatment was too toxic for extensive treatment of animals. As
additional evidence that this compound is not brain penetrant, we did not observe a
significant reduction of brain tumor proliferation upon treatment with TVB-3644

203
given at either 3mg/kg or 6mg/kg, or when combined with 30mg/kg buparlisib
(Figure 5M). Thus, though our data suggests that lipid synthesis could be a
metabolic dependency of breast cancers proliferating in the brain, a more brain
penetrant compound is needed to test this hypothesis in vivo.
Discussion
HER2-positive breast cancer brain metastases are often refractory to the
same therapies that successfully control extracranial disease, and how brain
microenvironment affects the metabolism of breast tumors remains poorly
understood. To assess the in vivo metabolism of breast cancer proliferating in
different tissues, we assessed glucose metabolism in tumors derived from breast
cancer cells with the aim of identifying metabolic dependencies unique to HER2-
amplified tumors growing in the brain parenchyma. Though a prevailing view of
cancer metabolism is that tumors universally diminish glucose oxidation in favor of
lactate production (Vander Heiden et al., 2009; Warburg, 1956), we observe
evidence of glucose oxidation in HER2-amplified breast tumors in both the MFP
and brain tissue, albeit to a greater extent in the cancers proliferating in the brain.
Despite the fact that most cells in culture require glutamine to supply carbons to
the TCA cycle (Altman et al., 2016), oxidative glucose metabolism has been reported
in a number of in vivo cancer metabolism studies (Davidson et al., 2016; Hensley et
al., 2016; Maher et al., 2012; Sellers et al., 2015; Yuneva et al., 2012) and
mitochondrial metabolism is a potential target for cancer therapy (Weinberg and
204
Chandel, 2015). Previous studies have shown that breast tumors display increased
mitochondrial activity relative to surrounding stroma (Whitaker-Menezes et al.,
2011), and that the expression of enzymes involved in the TCA cycle and glucose
oxidation are elevated when breast cancers metastasize to the brain (Chen et al.,
2007). Furthermore, HER2 signaling has been shown to promote glucose oxidation
in breast cancer cells (Grassian et al., 2011). Our in vivo tracing analyses extend
these findings, and suggest that glucose may be a more important substrate for
oxidative metabolism of breast cancer in brain metastases.
The increased glucose metabolism in HER2-amplified tumors appears to
serve a biosynthetic function, as we observe increased incorporation of glucose
carbons into fatty acids in these cancers relative to normal tissues. This phenotype
is enhanced by the brain microenvironment, as we found higher incorporation
glucose carbons into lipids and increased expression of SREBP1 targets in breast
tumors growing in this site. Lipid synthesis can contribute to malignancy and has
been described as a potential cancer therapy target (Röhrig and Schulze, 2016).
Breast tumors have been shown to display aberrant lipid metabolism (Hilvo et al.,
2011) and FASN expression is elevated in breast cancer and associated with poor
prognosis (Kuhajda et al., 1994; Kuhajda et al., 1989). FASN protein levels have
been described to be elevated in HER2-positive breast cancer that metastasizes to
the brain (Jung et al., 2015). Our findings support these published studies,
suggesting that fatty acid biosynthesis is an adaptation of breast cancers growing in
the brain microenvironment.
205
Lipids are more reduced than other nutrients, and thus synthesis of fatty
acids requires large amounts of the electron carrier NADPH (Fan et al., 2014;
Hosios and Vander Heiden, 2018). Breast cancer cells derived from brain lesions
have been reported to increase expression of enzymes required for the oxidative
branch of the pentose phosphate pathway (Chen et al., 2007), which is a major
source of NADPH in cells. Though detoxification of reactive oxygen species has been
proposed as a major consequence of enhanced oxidative pentose phosphate flux in
BCBM, increased NADPH production may also help support the increased rate of
lipid synthesis observed in breast tumors proliferating in the brain. From a carbon
perspective, glucose is the primary source of lipids synthesized de novo (Kamphorst
et al., 2013), and the increased glucose synthesis of BCBM could contribute to the
increased fatty acid biosynthesis observed in these lesions.
Recently, it has been shown that increased lipid synthesis can promote
resistance to antiangiogenic therapies in breast and in other tumor types (Sounni et
al., 2014). This finding provides one potential mechanism by which the brain
microenvironment promotes resistance to targeted breast cancer treatments.
Culturing HER2-amplified cancer cells in presence of brain stroma, either in vivo or
in tissue culture systems, was found to enhance the rate of lipid synthesis and
reduce sensitivity to PI3K inhibition by buparlisib. Furthermore, we found that
inhibiting lipid synthesis with the FASN inhibitor TVB-3644 could decrease
proliferation and potentiate the anticancer effects of buparlisib in organotypic slice
cultures generated from brain tumors, suggesting that breast cancer cells are

206
reliant on lipid synthesis for evasion of targeted therapies. Testing this hypothesis
in vivo was limited by the lack of a sufficiently brain-penetrant molecule; however,
the response observed in organotypic slice cultures suggests that this approach can
allow the use of existing inhibitors and help prioritize medicinal chemistry efforts to
enhance brain delivery.
The resistance to buparlisib and increased lipid synthesis we observe in
BCBM appears to be essentially mediated by the brain microenvironment, as this
phenotype was only observed in the brain parenchyma or when cancer cells were
grown in culture systems optimized to mimic this tumor site. This finding is
consistent with emerging literature that the brain represents a unique
microenvironment that can decrease the sensitivity of tumors to many targeted
therapies (Kodack et al., 2017; Kodack et al., 2012). Though the mechanism by
which the brain environment confers resistance is not well understood, tumors are
often surrounded by reactive astrocytes, which have been shown to promote
survival of cancer cells and decrease sensitivity to chemotherapeutics (Kim et al.,
2011; Lin et al., 2010). Furthermore, breast tumors can undergo genetic alterations
(Valiente et al., 2014) or adopt features of brain metabolism to promote their
proliferation and survival at this site. Breast cancers proliferating in the brain have
been shown to upregulate enzymes required to metabolize g-aminoburtyric acid
(GABA) (Neman et al., 2014) and express a brain specific cadherin in order to form
gap junctions between cancer cells and astrocytes (Chen et al., 2016). Our data also
suggests that brain microenvironment can alter breast cancer cell metabolism, as

207
we see increased lipid synthesis in HER2-amplified cells grown in the presence of
brain stroma. However, this change does not appear to be mediated by a genetic
adaptation, as breast cancer cells seem to require constant exposure to the brain
microenvironment in order to evade PI3K inhibition and increase the rate of lipid
synthesis. Furthermore, these metabolic alterations appear to be mediated by
changes in a soluble factor rather than direct interaction, as media conditioned by
primary glial cultures are also able to confer these phenotypes.
It has been shown in other cancer models that tumors of the same genotype
can display different in vivo metabolism depending on the tissues in which they are
arise (Mayers et al., 2016; Yuneva et al., 2012). In our study, rather than permitting
cancer of the same genotype to develop in different tissues, tumors from the same
parental cell line were injected into two tumor sites. Despite the fact that these
breast tumors are isogenic, we still observed large difference in metabolism and
sensitivity to chemotherapies between cancers growing in the breast or in the brain.
This finding has clinical significance, because many cancer therapies are often
selected based on the genetic profile of tumors (Garraway, 2013). While the genetic
mutations that drive malignancy of cancer cells are important, the results of the
present study highlight that it is critical to also consider the metabolic environment
in therapy studies. Standard cell culture does not recapitulate the nutrient
conditions found in tissues, and may not be the optimal culture system for the
validation of some drug targets, particularly in relation to metabolism (Cantor et
al., 2017; Davidson et al., 2016; Gui et al., 2016; Muir et al., 2017; Tardito et al.,
208
2015). Alternative culture systems, such as the ones developed here using
conditioned media and organotypic slice cultures, could be useful to assess
vulnerabilities that are sensitive to tissue site. Additional in vivo metabolism
studies, combined with the use of culture systems that mimic the environment of
tissues, can serve to further reveal unique metabolic dependencies of the brain that
might be able to be exploited for the development of new cancer targets or to
improve the efficacy of existing drugs.
Materials and Methods
Mouse Breast Cancer Models: All animal studies were approved by the MIT and
MGH Committees on Animal Care. Breast cancer xenografts were generated in
female nude mice of 8-9 weeks of age as previously described (Kodack et al., 2012).
Briefly, to generate MFP tumors 5´106 BT474 cells were resuspended in 50µL of a
1:1 ratio of PBS and Matrigel Matrix, High Concentration (BD Biosciences, 354248).
For Brain tumors, 1´105 BT474 cells were diluted in 1µL of PBS and
stereotactically injected into the left frontal lobe of the mouse brain. The day before
implantation of tumor cells, a 0.36-mg or 0.72-mg 17b-estradiol pellet (Innovative
Research of America, SE121) was implanted subcutaneously. Buparlisib (PI3K
inhibitor) and TVB-3644 (FASN inhibitor) were administered once per day via oral
gavage and were obtained from Novartis and 3V Biosciences, respectively.
209
Glucose Infusions in Mice: Catheters were surgically implanted into the jugular
vein of tumor bearing animals three days before the infusion experiment. Prior to
the initiation of the study, mice were fasted for 6 hours. [U-13C6]glucose (Cambridge
Isotope Laboratories, CLM-1396-PK) was infused at a constant rate of 30mg/kg/min
for twelve hours into conscious, free-moving animals, after which the animals were
terminally anesthetized with 120mg/kg sodium pentobarbital. Blood was collected
immediately by cardiac puncture, and tumors, brain and white adipose tissue were
harvested quickly, within five minutes of sacrifice. Tissues were frozen using the
BioSqueezer (BioSpec Products) and stored at -80°C for subsequent metabolite
extraction and analysis.
Metabolite Extraction: Tissues were fragmented into small (~10-30mg)
fragments, weighed, and homogenized cryogenically (Retsch Cryomill). For ex vivo
tumor explants, the slice was picked up with forceps, rapidly submerged into ice-
cold blood bank saline, and transferred to an Eppendorf tube. For cell culture
samples, cells were washed rapidly with ice-cold blood bank saline, lysed directly in
six-well dishes with HPLC-grade methanol, scraped, and transferred to an
Eppendorf tube. Metabolites were extracted using ice-cold HPLC-grade methanol,
water, and chloroform at a volume ratio of 600:400:300. Samples were vortexed for
10 minutes at 4°C and centrifuged for 10 minutes at 21,000´g and 4°C to separate
the top, aqueous layer and the bottom, organic layer. Each layer was collected and

210
dried under nitrogen gas, and stored at -80°C for subsequent analysis by liquid or
gas-chromatography mass-spectrometry (GCMS).
Derivatization of Polar Metabolites for analysis by Gas-Chromatography
Mass Spectrometry (GCMS): Frozen and dried metabolites from the aqueous
phase were dissolved in 20µL of Methoxamine (MOX) Reagent (2% solution of
methoxyamine-hydrogen chloride in pyridine, Sigma TS-45950) and incubated at
37°C for 90 minutes. Subsequently, 25µL of N-tert-Butyldimethylsilyl-N-
methyltrifluoroacetamide (MTBSTFA) with 1% tert-Butyldimethylchlorosilane (t-
BDMCS) (Sigma 375934) was added and samples were held at 60°C for one hour.
Samples were vortexed, transferred to GCMS vials and capped.
GCMS Fatty Acid Methyl Ester (FAME) Derivatization: Frozen and dried
metabolites from the organic phase were saponified to free fatty acids and esterified
to form fatty acid methyl esters. First, 500µL of 2%H2SO4 was added to each sample
and incubated for two hours at 60°C. Next 100 µL of a saturated salt solution
(sodium chloride dissolved in HPLC-grade water) and 500µL of HPLC-grade hexane
was added and the sample was vortexed. The top hexane layer was collected and
evaporated under nitrogen gas. Each sample was resuspended with 50µL of fresh
HPLC-grade hexane, vortexed, and transferred to glass GCMS sample vial (Agilent
5181-8872).

211
Metabolite Profiling by GCMS: GCMS analysis was performed using an Agilent
7890 GC equipped with 30m DB-35MS capillary column connected to an Agilent
5975B MS operating under electron impact ionization at 70eV. For each sample,
1µL was injected at 270°C using helium gas as a carrier with a flow rate of
1mL/min. For the measurement of polar metabolites, the GC oven temperature was
kept at 100°C for three minutes and increased to 30°C at a rate of 3.5°C/min. The
MS source and quadrupole were kept at 230°C and 150°C, respectively, and the
detector was run in scanning mode, recording ion abundance within 100-605 m/z.
Mass Isotopomer distributions were determined by integrating the appropriate ion
fragments and correcting for natural isotope abundance using in house algorithms
adapted as previously reported (Lewis et al., 2014).
Cell culture experiments: BT474 cells were transduced with an expression
cassette encoding Gaussia Luciferase and GFP separated by an internal ribosomal
entry site using a lentiviral system as previously described (Chung et al., 2009). All
cell lines in this study were purchased from ATCC and were authenticated
(CellCheck). BT474 cells were cultured in RPMI 1640 culture media supplemented
with 10% FBS and 2mM glutamine at 21% oxygen, 37°C, and 5% CO2. The reagents
used for cell culture experiments included buparlisib (BKM120), C75 (4-methylene-
2-octyl-5-oxotetra- hydrofuran-3-carboxylic acid), TOFA (5-tetradecyloxy-2-furoic
acid), GSK 2194069 (4-[4-(5-Benzofuranyl)phenyl]-5-[[(3S)-1-(cyclopropylcarbonyl)-
3-pyrrolidinyl]methyl]-2,4-dihydro-3H-1,2,4-triazol-3-one), SB-204990 ((3R,5S)-rel-
212
5-[6-(2,4-Dichlorophenyl)hexyl]tetrahydro-3-hydroxy-2-oxo-3-furanacetic acid), PF
05175157 (1,4-Dihydro-1'-[2-methyl-1H-benzimidazol-6-yl)carbonyl]-1-(1-
methylethyl)-spiro[5H-indazole-5,4'-piperidin]-7(6H)-one), and TVB-3644.
For tracing experiments done at standard tissue culture conditions, cells
were plated in six well dishes at a seeding density of 150,000 cells per well. The
following day, cells were washed three times with phosphate buffered saline (PBS)
and incubated in DMEM without glucose, glutamine, or sodium pyruvate (Corning,
17-207-CV) that had been supplemented with 25mM [U-13C6]glucose, 4mM
glutamine, 10% dialyzed fetal bovine serum and the indicated treatment condition.
Metabolites were extracted after a 72hour incubation with the tracing medium.
Western Blot Analysis: Tumor samples were homogenized in RIPA buffer (Boston
BioProducts) supplemented protease inhibitors (Roche, cOmplete ULTRA tablets,
05892970001) and phosphatase inhibitors (Roche, phosSTOP, PHOSS-RO) using a
tissue homogenizer (Cole-Palmer, Lab-GEN). Lysates were centrifuged at 18,000´g
for 30 minutes at 4°C. Protein concentration was quantified and samples were
subsequently boiled in Laemmli buffer.
Gene Set Enrichment Analysis: RNA was extracted from BT474 tumors grown
in the mammary fat pad and brain parenchyma. RNA was extracted and processed
according to the manufacturer’s instructions and subsequently hybridized to
Affymetrix GeneChip Human Genome U133 Plus 2.0 Arrays.

213
Isolation of BT474 cells from BT474 xenografts growing in brain: Tumors
were minced in RPMI media and subsequently incubated for one hour shaking at
37°C in BT474 culture media (RPMI 1640 + 10% FBS) supplemented with 1%
penicillin/streptomycin (P/S) and 1 mg/mL collagenase/dispase enzyme mix (Roche,
COLLDISP-RO). Tissues were then centrifuged at 1500rpm for 5 minutes, and
supernatant was removed. The pellet was resuspended BT474 culture media
supplemented with 1% P/S and pipetted well to disaggregate clumps. Media was
changed the following day.
Organotypic slice cultures: Explants were generated from BT474 mouse
xenografts using a microtome (Precisionary Instruments, Compresstome VF-300).
To trace the tissue explants, each sample was carefully washed three times with
PBS and media was replaced with tracing media (DMEM without glucose,
glutamine, or sodium pyruvate [Corning, 17-207-CV] supplemented with 25mM [U-
13C6]glucose, 4 mM glutamine and 10% dialyzed fetal bovine serum) and the
indicated treatment condition. The slice cultures were incubated with tracing media
for three days before metabolites were extracted from all samples.
Primary Glial Cultures: Primary glial cultures were generated as described
(Schildge et al., 2013). Cortices were dissected from mouse pups of age P1 to P4 and
cut into small pieces with sharp blades. The tissue was transferred to a 50mL tube
214
containing 22.5 mL of Hank’s Buffered Saline Solution (HBSS) and 2.5 mL of 2.5%
trypsin. The tube was incubated at 37°C for thirty minutes and then centrifuged for
5 minutes at 500´g. The supernatant was removed by decantation, and the pellet
was washed twice with PBS and subsequently plated in a T75 tissue culture dish.
Primary glial cells were cultured in DMEM (Corning 10-013-CV) supplemented
with 10% fetal bovine serum and in dishes that had been coated with a 50µg/mL
solution of poly-L-lysine.
To generate conditioned media from primary glial cultures, glial cells were passaged
to a 15cm diameter dish at a confluence of approximately 40%. The cells were
permitted to settle overnight, and then were washed three times with PBS before
being incubated with 30mL of Minimal Essential Medium without glutamine
(MEM, Corning 15-010-CV) supplemented with 10% dialyzed fetal bovine serum
and 2mM glutamine. Four days later, conditioned media was collected and filtered
through a vacuum filter with a pore size of 0.22µM (VWR, 28199-774). To assess the
proliferation response to glia-conditioned media, BT474 cells were plated in 96 well
dishes at 7,500 cells per well. After the cells were permitted to settle over night,
they were washed three times PBS, and cultured in the indicated treatment
condition for 48 hours. Cells were washed three times and number of viable cells
was assessed utilizing the CellTiter-Glo Luminescent Cell Viability Assay (Promega
G7572).

215
Co-Culture experiment: For the glial-BT474 co-culture experiments, BT474 cells
were plated in six well dishes at a seeding density of 150,000 cells/well. The same
day, astrocytes were plated at the same seeding density into membrane-based
transwell inserts (Sigma, Z353086). The next day, both cell populations were
washed three times with PBS and then placed into DMEM without glucose,
glutamine, or sodium pyruvate (Corning, 17-207-CV) that had been supplemented
with 25mM [U-13C6]glucose, 4mM glutamine, 10% dialyzed fetal bovine serum, and
either DMSO or 1µM buparlisib. Each co-culture was incubated in 2mL of total
media, with 1.5mL used beneath the transwell and 500µL used to cover the glial
cells in the insert. After incubation with the tracing media for three days,
metabolites were extracted from the BT474 cells.
References
Alimandi, M., Romano, A., Curia, M.C., Muraro, R., Fedi, P., Aaronson, S.A., Di Fiore, P.P., and Kraus, M.H. (1995). Cooperative signaling of ErbB3 and ErbB2 in neoplastic transformation and human mammary carcinomas. Oncogene 10, 1813-1821.
Alli, P.M., Pinn, M.L., Jaffee, E.M., McFadden, J.M., and Kuhajda, F.P. (2005). Fatty acid synthase inhibitors are chemopreventive for mammary cancer in neu-N transgenic mice. Oncogene 24, 39-46.
Altman, B.J., Stine, Z.E., and Dang, C.V. (2016). From Krebs to clinic: glutamine metabolism to cancer therapy. Nat Rev Cancer 16, 619-634.
Askoxylakis, V., Ferraro, G.B., Kodack, D.P., Badeaux, M., Shankaraiah, R.C., Seano, G., Kloepper, J., Vardam, T., Martin, J.D., Naxerova, K., et al. (2016). Preclinical Efficacy of Ado-trastuzumab Emtansine in the Brain Microenvironment. J Natl Cancer Inst 108.

216
Bachelot, T., Romieu, G., Campone, M., Dieras, V., Cropet, C., Dalenc, F., Jimenez, M., Le Rhun, E., Pierga, J.Y., Goncalves, A., et al. (2013). Lapatinib plus capecitabine in patients with previously untreated brain metastases from HER2-positive metastatic breast cancer (LANDSCAPE): a single-group phase 2 study. Lancet Oncol 14, 64-71.
Baenke, F., Peck, B., Miess, H., and Schulze, A. (2013). Hooked on fat: the role of lipid synthesis in cancer metabolism and tumour development. Dis Model Mech 6, 1353-1363.
Bendell, J.C., Rodon, J., Burris, H.A., de Jonge, M., Verweij, J., Birle, D., Demanse, D., De Buck, S.S., Ru, Q.C., Peters, M., et al. (2012). Phase I, dose-escalation study of BKM120, an oral pan-Class I PI3K inhibitor, in patients with advanced solid tumors. J Clin Oncol 30, 282-290.
Cantor, J.R., Abu-Remaileh, M., Kanarek, N., Freinkman, E., Gao, X., Louissaint, A., Jr., Lewis, C.A., and Sabatini, D.M. (2017). Physiologic Medium Rewires Cellular Metabolism and Reveals Uric Acid as an Endogenous Inhibitor of UMP Synthase. Cell 169, 258-272 e217.
Chen, E.I., Hewel, J., Krueger, J.S., Tiraby, C., Weber, M.R., Kralli, A., Becker, K., Yates, J.R., 3rd, and Felding-Habermann, B. (2007). Adaptation of energy metabolism in breast cancer brain metastases. Cancer Res 67, 1472-1486.
Chen, J., Lee, H.J., Wu, X., Huo, L., Kim, S.J., Xu, L., Wang, Y., He, J., Bollu, L.R., Gao, G., et al. (2015). Gain of glucose-independent growth upon metastasis of breast cancer cells to the brain. Cancer Res 75, 554-565.
Chen, Q., Boire, A., Jin, X., Valiente, M., Er, E.E., Lopez-Soto, A., Jacob, L., Patwa, R., Shah, H., Xu, K., et al. (2016). Carcinoma-astrocyte gap junctions promote brain metastasis by cGAMP transfer. Nature 533, 493-498.
Chung, E., Yamashita, H., Au, P., Tannous, B.A., Fukumura, D., and Jain, R.K. (2009). Secreted Gaussia luciferase as a biomarker for monitoring tumor progression and treatment response of systemic metastases. PLoS One 4, e8316.
Currie, E., Schulze, A., Zechner, R., Walther, T.C., and Farese, R.V., Jr. (2013). Cellular fatty acid metabolism and cancer. Cell Metab 18, 153-161.
Davidson, S.M., Papagiannakopoulos, T., Olenchock, B.A., Heyman, J.E., Keibler, M.A., Luengo, A., Bauer, M.R., Jha, A.K., O'Brien, J.P., Pierce, K.A., et al. (2016). Environment Impacts the Metabolic Dependencies of Ras-Driven Non-Small Cell Lung Cancer. Cell Metab 23, 517-528.
217
DeBerardinis, R.J., and Chandel, N.S. (2016). Fundamentals of cancer metabolism. Sci Adv 2, e1600200.
DiGirolamo, M., Newby, F.D., and Lovejoy, J. (1992). Lactate production in adipose tissue: a regulated function with extra-adipose implications. FASEB J 6, 2405-2412.
Ebadi, M., and Mazurak, V.C. (2014). Evidence and mechanisms of fat depletion in cancer. Nutrients 6, 5280-5297.
Eichler, A.F., Chung, E., Kodack, D.P., Loeffler, J.S., Fukumura, D., and Jain, R.K. (2011). The biology of brain metastases-translation to new therapies. Nat Rev Clin Oncol 8, 344-356.
Eng, L.F., Ghirnikar, R.S., and Lee, Y.L. (2000). Glial fibrillary acidic protein: GFAP-thirty-one years (1969-2000). Neurochem Res 25, 1439-1451.
Fan, J., Ye, J., Kamphorst, J.J., Shlomi, T., Thompson, C.B., and Rabinowitz, J.D. (2014). Quantitative flux analysis reveals folate-dependent NADPH production. Nature 510, 298-302.
Flavin, R., Peluso, S., Nguyen, P.L., and Loda, M. (2010). Fatty acid synthase as a potential therapeutic target in cancer. Future Oncol 6, 551-562.
Furuta, E., Pai, S.K., Zhan, R., Bandyopadhyay, S., Watabe, M., Mo, Y.Y., Hirota, S., Hosobe, S., Tsukada, T., Miura, K., et al. (2008). Fatty acid synthase gene is up-regulated by hypoxia via activation of Akt and sterol regulatory element binding protein-1. Cancer Res 68, 1003-1011.
Garraway, L.A. (2013). Genomics-driven oncology: framework for an emerging paradigm. J Clin Oncol 31, 1806-1814.
Grassian, A.R., Metallo, C.M., Coloff, J.L., Stephanopoulos, G., and Brugge, J.S. (2011). Erk regulation of pyruvate dehydrogenase flux through PDK4 modulates cell proliferation. Genes Dev 25, 1716-1733.
Gui, D.Y., Sullivan, L.B., Luengo, A., Hosios, A.M., Bush, L.N., Gitego, N., Davidson, S.M., Freinkman, E., Thomas, C.J., and Vander Heiden, M.G. (2016). Environment Dictates Dependence on Mitochondrial Complex I for NAD+ and Aspartate Production and Determines Cancer Cell Sensitivity to Metformin. Cell Metab 24, 716-727.
Hatzivassiliou, G., Zhao, F., Bauer, D.E., Andreadis, C., Shaw, A.N., Dhanak, D., Hingorani, S.R., Tuveson, D.A., and Thompson, C.B. (2005). ATP citrate lyase inhibition can suppress tumor cell growth. Cancer Cell 8, 311-321.

218
Hay, N. (2016). Reprogramming glucose metabolism in cancer: can it be exploited for cancer therapy? Nat Rev Cancer 16, 635-649.
Hensley, C.T., Faubert, B., Yuan, Q., Lev-Cohain, N., Jin, E., Kim, J., Jiang, L., Ko, B., Skelton, R., Loudat, L., et al. (2016). Metabolic Heterogeneity in Human Lung Tumors. Cell 164, 681-694.
Hilvo, M., Denkert, C., Lehtinen, L., Muller, B., Brockmoller, S., Seppanen-Laakso, T., Budczies, J., Bucher, E., Yetukuri, L., Castillo, S., et al. (2011). Novel theranostic opportunities offered by characterization of altered membrane lipid metabolism in breast cancer progression. Cancer Res 71, 3236-3245.
Hosios, A.M., Hecht, V.C., Danai, L.V., Johnson, M.O., Rathmell, J.C., Steinhauser, M.L., Manalis, S.R., and Vander Heiden, M.G. (2016). Amino Acids Rather than Glucose Account for the Majority of Cell Mass in Proliferating Mammalian Cells. Dev Cell 36, 540-549.
Hosios, A.M., and Vander Heiden, M.G. (2018). The redox requirements of proliferating mammalian cells. J Biol Chem.
Huang, T., Sun, J., Wang, Q., Gao, J., and Liu, Y. (2015). Synthesis, Biological Evaluation and Molecular Docking Studies of Piperidinylpiperidines and Spirochromanones Possessing Quinoline Moieties as Acetyl-CoA Carboxylase Inhibitors. Molecules 20, 16221-16234.
Ito, D., Imai, Y., Ohsawa, K., Nakajima, K., Fukuuchi, Y., and Kohsaka, S. (1998). Microglia-specific localisation of a novel calcium binding protein, Iba1. Brain Res Mol Brain Res 57, 1-9.
Jain, M., Nilsson, R., Sharma, S., Madhusudhan, N., Kitami, T., Souza, A.L., Kafri, R., Kirschner, M.W., Clish, C.B., and Mootha, V.K. (2012). Metabolite profiling identifies a key role for glycine in rapid cancer cell proliferation. Science 336, 1040-1044.
Jones, S.F., and Infante, J.R. (2015). Molecular Pathways: Fatty Acid Synthase. Clin Cancer Res 21, 5434-5438.
Jung, Y.Y., Kim, H.M., and Koo, J.S. (2015). Expression of Lipid Metabolism-Related Proteins in Metastatic Breast Cancer. PLoS One 10, e0137204.
Kamphorst, J.J., Chung, M.K., Fan, J., and Rabinowitz, J.D. (2014). Quantitative analysis of acetyl-CoA production in hypoxic cancer cells reveals substantial contribution from acetate. Cancer Metab 2, 23.

219
Kamphorst, J.J., Cross, J.R., Fan, J., de Stanchina, E., Mathew, R., White, E.P., Thompson, C.B., and Rabinowitz, J.D. (2013). Hypoxic and Ras-transformed cells support growth by scavenging unsaturated fatty acids from lysophospholipids. Proc Natl Acad Sci U S A 110, 8882-8887.
Kim, S.J., Kim, J.S., Park, E.S., Lee, J.S., Lin, Q., Langley, R.R., Maya, M., He, J., Kim, S.W., Weihua, Z., et al. (2011). Astrocytes upregulate survival genes in tumor cells and induce protection from chemotherapy. Neoplasia 13, 286-298.
Kodack, D.P., Askoxylakis, V., Ferraro, G.B., Fukumura, D., and Jain, R.K. (2015). Emerging strategies for treating brain metastases from breast cancer. Cancer Cell 27, 163-175.
Kodack, D.P., Askoxylakis, V., Ferraro, G.B., Sheng, Q., Badeaux, M., Goel, S., Qi, X., Shankaraiah, R., Cao, Z.A., Ramjiawan, R.R., et al. (2017). The brain microenvironment mediates resistance in luminal breast cancer to PI3K inhibition through HER3 activation. Sci Transl Med 9.
Kodack, D.P., Chung, E., Yamashita, H., Incio, J., Duyverman, A.M., Song, Y., Farrar, C.T., Huang, Y., Ager, E., Kamoun, W., et al. (2012). Combined targeting of HER2 and VEGFR2 for effective treatment of HER2-amplified breast cancer brain metastases. Proc Natl Acad Sci U S A 109, E3119-3127.
Koul, D., Fu, J., Shen, R., LaFortune, T.A., Wang, S., Tiao, N., Kim, Y.W., Liu, J.L., Ramnarian, D., Yuan, Y., et al. (2012). Antitumor activity of NVP-BKM120--a selective pan class I PI3 kinase inhibitor showed differential forms of cell death based on p53 status of glioma cells. Clin Cancer Res 18, 184-195.
Kuhajda, F.P. (2006). Fatty acid synthase and cancer: new application of an old pathway. Cancer Res 66, 5977-5980.
Kuhajda, F.P., Jenner, K., Wood, F.D., Hennigar, R.A., Jacobs, L.B., Dick, J.D., and Pasternack, G.R. (1994). Fatty acid synthesis: a potential selective target for antineoplastic therapy. Proc Natl Acad Sci U S A 91, 6379-6383.
Kuhajda, F.P., Piantadosi, S., and Pasternack, G.R. (1989). Haptoglobin-related protein (Hpr) epitopes in breast cancer as a predictor of recurrence of the disease. N Engl J Med 321, 636-641.
Lane, A.N., Higashi, R.M., and Fan, T.W. (2016). Preclinical models for interrogating drug action in human cancers using Stable Isotope Resolved Metabolomics (SIRM). Metabolomics 12.
220
Lee-Hoeflich, S.T., Crocker, L., Yao, E., Pham, T., Munroe, X., Hoeflich, K.P., Sliwkowski, M.X., and Stern, H.M. (2008). A central role for HER3 in HER2-amplified breast cancer: implications for targeted therapy. Cancer Res 68, 5878-5887.
Lewis, C.A., Parker, S.J., Fiske, B.P., McCloskey, D., Gui, D.Y., Green, C.R., Vokes, N.I., Feist, A.M., Vander Heiden, M.G., and Metallo, C.M. (2014). Tracing compartmentalized NADPH metabolism in the cytosol and mitochondria of mammalian cells. Mol Cell 55, 253-263.
Li, S., Qiu, L., Wu, B., Shen, H., Zhu, J., Zhou, L., Gu, L., and Di, W. (2013). TOFA suppresses ovarian cancer cell growth in vitro and in vivo. Mol Med Rep 8, 373-378.
Liberti, M.V., and Locasale, J.W. (2016). The Warburg Effect: How Does it Benefit Cancer Cells? Trends Biochem Sci 41, 211-218.
Lin, N.U., Carey, L.A., Liu, M.C., Younger, J., Come, S.E., Ewend, M., Harris, G.J., Bullitt, E., Van den Abbeele, A.D., Henson, J.W., et al. (2008). Phase II trial of lapatinib for brain metastases in patients with human epidermal growth factor receptor 2-positive breast cancer. J Clin Oncol 26, 1993-1999.
Lin, N.U., Dieras, V., Paul, D., Lossignol, D., Christodoulou, C., Stemmler, H.J., Roche, H., Liu, M.C., Greil, R., Ciruelos, E., et al. (2009). Multicenter phase II study of lapatinib in patients with brain metastases from HER2-positive breast cancer. Clin Cancer Res 15, 1452-1459.
Lin, Q., Balasubramanian, K., Fan, D., Kim, S.J., Guo, L., Wang, H., Bar-Eli, M., Aldape, K.D., and Fidler, I.J. (2010). Reactive astrocytes protect melanoma cells from chemotherapy by sequestering intracellular calcium through gap junction communication channels. Neoplasia 12, 748-754.
Maher, E.A., Marin-Valencia, I., Bachoo, R.M., Mashimo, T., Raisanen, J., Hatanpaa, K.J., Jindal, A., Jeffrey, F.M., Choi, C., Madden, C., et al. (2012). Metabolism of [U-13 C]glucose in human brain tumors in vivo. NMR Biomed 25, 1234-1244.
Maira, S.M., Pecchi, S., Huang, A., Burger, M., Knapp, M., Sterker, D., Schnell, C., Guthy, D., Nagel, T., Wiesmann, M., et al. (2012). Identification and characterization of NVP-BKM120, an orally available pan-class I PI3-kinase inhibitor. Mol Cancer Ther 11, 317-328.
Marin-Valencia, I., Yang, C., Mashimo, T., Cho, S., Baek, H., Yang, X.L., Rajagopalan, K.N., Maddie, M., Vemireddy, V., Zhao, Z., et al. (2012). Analysis of tumor metabolism reveals mitochondrial glucose oxidation in genetically diverse human glioblastomas in the mouse brain in vivo. Cell Metab 15, 827-837.

221
Mayers, J.R., Torrence, M.E., Danai, L.V., Papagiannakopoulos, T., Davidson, S.M., Bauer, M.R., Lau, A.N., Ji, B.W., Dixit, P.D., Hosios, A.M., et al. (2016). Tissue of origin dictates branched-chain amino acid metabolism in mutant Kras-driven cancers. Science 353, 1161-1165.
Mayers, J.R., and Vander Heiden, M.G. (2015). Famine versus feast: understanding the metabolism of tumors in vivo. Trends Biochem Sci 40, 130-140.
Medes, G., Thomas, A., and Weinhouse, S. (1953). Metabolism of neoplastic tissue. IV. A study of lipid synthesis in neoplastic tissue slices in vitro. Cancer Res 13, 27-29.
Monaco, M.E. (2017). Fatty acid metabolism in breast cancer subtypes. Oncotarget 8, 29487-29500.
Muir, A., Danai, L.V., Gui, D.Y., Waingarten, C.Y., Lewis, C.A., and Vander Heiden, M.G. (2017). Environmental cystine drives glutamine anaplerosis and sensitizes cancer cells to glutaminase inhibition. Elife 6.
Nagarajan, A., Malvi, P., and Wajapeyee, N. (2016). Oncogene-directed alterations in cancer cell metabolism. Trends Cancer 2, 365-377.
Neman, J., Termini, J., Wilczynski, S., Vaidehi, N., Choy, C., Kowolik, C.M., Li, H., Hambrecht, A.C., Roberts, E., and Jandial, R. (2014). Human breast cancer metastases to the brain display GABAergic properties in the neural niche. Proc Natl Acad Sci U S A 111, 984-989.
Ni, J., Ramkissoon, S.H., Xie, S., Goel, S., Stover, D.G., Guo, H., Luu, V., Marco, E., Ramkissoon, L.A., Kang, Y.J., et al. (2016). Combination inhibition of PI3K and mTORC1 yields durable remissions in mice bearing orthotopic patient-derived xenografts of HER2-positive breast cancer brain metastases. Nat Med 22, 723-726.
Olson, E.M., Abdel-Rasoul, M., Maly, J., Wu, C.S., Lin, N.U., and Shapiro, C.L. (2013). Incidence and risk of central nervous system metastases as site of first recurrence in patients with HER2-positive breast cancer treated with adjuvant trastuzumab. Ann Oncol 24, 1526-1533.
Ookhtens, M., Kannan, R., Lyon, I., and Baker, N. (1984). Liver and adipose tissue contributions to newly formed fatty acids in an ascites tumor. Am J Physiol 247, R146-153.
Pavlova, N.N., and Thompson, C.B. (2016). The Emerging Hallmarks of Cancer Metabolism. Cell Metab 23, 27-47.

222
Röhrig, F., and Schulze, A. (2016). The multifaceted roles of fatty acid synthesis in cancer. Nat Rev Cancer 16, 732-749.
Sabater, D., Arriaran, S., Romero Mdel, M., Agnelli, S., Remesar, X., Fernandez-Lopez, J.A., and Alemany, M. (2014). Cultured 3T3L1 adipocytes dispose of excess medium glucose as lactate under abundant oxygen availability. Sci Rep 4, 3663.
Schildge, S., Bohrer, C., Beck, K., and Schachtrup, C. (2013). Isolation and culture of mouse cortical astrocytes. J Vis Exp.
Sellers, K., Fox, M.P., Bousamra, M., 2nd, Slone, S.P., Higashi, R.M., Miller, D.M., Wang, Y., Yan, J., Yuneva, M.O., Deshpande, R., et al. (2015). Pyruvate carboxylase is critical for non-small-cell lung cancer proliferation. J Clin Invest 125, 687-698.
Shank, R.P., Bennett, G.S., Freytag, S.O., and Campbell, G.L. (1985). Pyruvate carboxylase: an astrocyte-specific enzyme implicated in the replenishment of amino acid neurotransmitter pools. Brain Res 329, 364-367.
Sounni, N.E., Cimino, J., Blacher, S., Primac, I., Truong, A., Mazzucchelli, G., Paye, A., Calligaris, D., Debois, D., De Tullio, P., et al. (2014). Blocking lipid synthesis overcomes tumor regrowth and metastasis after antiangiogenic therapy withdrawal. Cell Metab 20, 280-294.
Tamura, K., Kurihara, H., Yonemori, K., Tsuda, H., Suzuki, J., Kono, Y., Honda, N., Kodaira, M., Yamamoto, H., Yunokawa, M., et al. (2013). 64Cu-DOTA-trastuzumab PET imaging in patients with HER2-positive breast cancer. J Nucl Med 54, 1869-1875.
Tardito, S., Oudin, A., Ahmed, S.U., Fack, F., Keunen, O., Zheng, L., Miletic, H., Sakariassen, P.O., Weinstock, A., Wagner, A., et al. (2015). Glutamine synthetase activity fuels nucleotide biosynthesis and supports growth of glutamine-restricted glioblastoma. Nat Cell Biol 17, 1556-1568.
Tumanov, S., Bulusu, V., and Kamphorst, J.J. (2015). Analysis of Fatty Acid Metabolism Using Stable Isotope Tracers and Mass Spectrometry. Methods Enzymol 561, 197-217.
Valiente, M., Obenauf, A.C., Jin, X., Chen, Q., Zhang, X.H., Lee, D.J., Chaft, J.E., Kris, M.G., Huse, J.T., Brogi, E., et al. (2014). Serpins promote cancer cell survival and vascular co-option in brain metastasis. Cell 156, 1002-1016.
Vander Heiden, M.G., Cantley, L.C., and Thompson, C.B. (2009). Understanding the Warburg effect: the metabolic requirements of cell proliferation. Science 324, 1029-1033.

223
Warburg, O. (1923). Versuche an überlebendem Carcinomgewebe (Methoden). Biochemische Zeitschrift 142, 317–333.
Warburg, O. (1956). On the origin of cancer cells. Science 123, 309-314.
Weinberg, S.E., and Chandel, N.S. (2015). Targeting mitochondria metabolism for cancer therapy. Nat Chem Biol 11, 9-15.
Whitaker-Menezes, D., Martinez-Outschoorn, U.E., Flomenberg, N., Birbe, R.C., Witkiewicz, A.K., Howell, A., Pavlides, S., Tsirigos, A., Ertel, A., Pestell, R.G., et al. (2011). Hyperactivation of oxidative mitochondrial metabolism in epithelial cancer cells in situ: visualizing the therapeutic effects of metformin in tumor tissue. Cell Cycle 10, 4047-4064.
Yu, A.C., Drejer, J., Hertz, L., and Schousboe, A. (1983). Pyruvate carboxylase activity in primary cultures of astrocytes and neurons. J Neurochem 41, 1484-1487.
Yuneva, M.O., Fan, T.W., Allen, T.D., Higashi, R.M., Ferraris, D.V., Tsukamoto, T., Mates, J.M., Alonso, F.J., Wang, C., Seo, Y., et al. (2012). The metabolic profile of tumors depends on both the responsible genetic lesion and tissue type. Cell Metab 15, 157-170.
Zhou, B.P., Liao, Y., Xia, W., Spohn, B., Lee, M.H., and Hung, M.C. (2001a). Cytoplasmic localization of p21Cip1/WAF1 by Akt-induced phosphorylation in HER-2/neu-overexpressing cells. Nat Cell Biol 3, 245-252.
Zhou, B.P., Liao, Y., Xia, W., Zou, Y., Spohn, B., and Hung, M.C. (2001b). HER-2/neu induces p53 ubiquitination via Akt-mediated MDM2 phosphorylation. Nat Cell Biol 3, 973-982.


225
Chapter 5: Discussion and Future Directions
Summary
Tumor cells rewire their metabolic network to efficiently incorporate
nutrients into biomass, balance cellular energetics, and support rapid, uncontrolled
proliferation. The discovery that the metabolism of cancer cells differs from that of
normal tissues was made almost a century ago by Otto Warburg in the late 1920s,
who determined that tumors consume large quantities of glucose and excrete the
majority of glucose-derived carbon as lactate. Since this initial finding, it has been
determined that many cancer cells display the “Warburg effect,” and the
reprogrammed glucose metabolism of cancer cells is now considered a hallmark of
the disease. Since this phenotype represents one of the largest metabolic differences
distinguishing cancer cells from their tissues of origin, there has been attempts to
target this pathway for the treatment of cancer. However, efforts to directly target
the Warburg effect have seen limited clinical success, likely because the same
glycolytic enzymes are expressed in both tumors and non-cancerous cells and high
glucose uptake is important in some normal tissues such as the brain. Thus, in
order to exploit metabolism for cancer therapy, it is important to first define
pathways that are essential to support the progression of specific cancers.
In this dissertation, we explore several strategies to target the metabolism of
cancer cells. We first utilized an unbiased approach to identify metabolites that
accumulate in lung tumors relative to lung tissue, and determined that the

226
antioxidant glutathione is elevated in tumors. We found that in lung lesions, one
function of high levels of glutathione is to react with and scavenge endogenously
produced electrophiles, including methylglyoxal, a reactive error-product of
glycolysis. We established that production of methylglyoxal is higher in lung
cancers and that blocking detoxification of this metabolite can reduce cancer cell
fitness and impair lung tumor growth. Though glycolytic enzymes are present in
normal and malignant tissues, glycolytic flux and, by extension, reactive metabolite
production are greatly enhanced in cancer contexts. Thus, while inhibitors of
glycolysis can result in unwanted toxicity, targeting detoxification pathways of
reactive metabolites could offer a more selective therapeutic strategy. That is, an
indirect effect of the reprogrammed glucose metabolism of cancer cells is production
of reactive metabolite byproducts, and this could represent a targetable
vulnerability of highly glycolytic tumors.
Though the Warburg effect has been studied extensively since its initial
discovery, the ontology of this process remains controversial. To investigate how
high glycolytic flux promotes tumor proliferation, we next repressed the Warburg
effect in cancer cells by inhibiting PDK, which results in increased entry of glucose-
derived carbons into the tricarboxylic acid cycle. We found that stimulating glucose
oxidation in cancer cells perturbs NAD+/NADH homeostasis, and that this
imbalance is caused by limited oxidative capacity of mitochondrial respiration. We
determined that the mitochondrial respiration of tumor cells is endogenously
constrained by the membrane potential across the inner mitochondrial membrane

227
and by the ATP utilization of the cell. This finding suggests that tumors may rewire
glucose metabolism to optimize for electron acceptor generation, and suggests that
therapies that restrict availability of NAD+ could be another strategy to target the
enhanced glycolytic flux of cancer cells.
Finally, we interrogated how cancer cells adapt their metabolic program to
permit growth in different tumor microenvironments. We investigated the
differential metabolic phenotypes and dependencies of HER2-amplified breast
cancers growing in the primary site and as metastases in the brain. We found that
breast cancers growing in the brain exhibit increased glucose consumption and lipid
synthesis relative to those in the mammary fat pad. Furthermore, we provide
evidence that inhibiting fatty acid synthesis could be a way to augment the efficacy
of therapies that otherwise are ineffective in treating breast cancer in this tissue
context.
Collectively, these studies investigate how the metabolic dependencies of
cancer cells differ relative to normal cells, and explore whether any of these altered
pathways could provide opportunities to improve therapies for cancer patients.
Though it has proven challenging to directly target the glucose metabolism of
tumors for clinical benefit, treatment strategies that target secondary consequences
of glycolysis, such as methylglyoxal production, or metabolic drivers of the
phenotype, such as electron acceptor insufficiency, may represent a more tractable
avenue to target the Warburg effect for cancer treatment. Additionally,
investigation of how metabolic rewiring supports tumor proliferation in different

228
tumor sites can help guide therapies for cancers with limited treatment options, as
is the case for breast cancer brain metastases.
Discussion
Reactive byproducts of cancer metabolism
Altered flux through metabolic pathways results in different steady-state
concentrations of metabolites in tumors relative to normal tissues, which can have
important implications for cell signaling, bioenergetics, and proliferation
(DeBerardinis and Chandel, 2016; Sullivan et al., 2016). Some metabolites
accumulate inappropriately in cancer cells and their local microenvironment as
byproducts or error products of metabolism. This class of metabolites are generated
by promiscuous enzyme activity, or non-enzymatically due to the inherent reactivity
of certain metabolic pathway intermediates (Sullivan et al., 2016). Many of these
byproducts are themselves chemically unstable, producing reactive metabolites that
can further react non-specifically with other nearby molecules.
Accumulation of reactive metabolites can have negative consequences for
cellular fitness, as these molecules can react with and damage macromolecules in
the cell. Thus, cells with enhanced production of reactive metabolites rely on
pathways that robustly detoxify these species to prevent accumulation of damaged
biomolecules.
In the work presented in this thesis, we determined that methylglyoxal
production is elevated in tumors and that targeting detoxification of this metabolite
229
can impair cancer cell growth. However, other reactive error products of
metabolism, including reactive oxygen species (ROS), formaldehyde, and byproducts
of lipid peroxidation have also been found to be generated at higher levels in
tumors. We and others have determined that tumor cells have increased levels of
antioxidants to detoxify these reactive intermediates and allow cancer progression
(Gorrini et al., 2013; Piskounova et al., 2015; Schafer et al., 2009). The increased
antioxidant capacity of tumor cells appears to be downstream of oncogenic signaling
pathways that promote flux through pathways that produce NADPH, which is
required for the synthesis of glutathione (DeNicola et al., 2015; DeNicola et al.,
2011; Harris et al., 2015; Ye et al., 2014).
Limiting the availability of antioxidants or targeting pathways that detoxify
reactive metabolites could represent a promising approach to exploit a metabolic
feature common to many cancer cells. Targeting detoxification pathways could
selectively kill cells that produce higher levels of reactive metabolites, thereby
treating tumors by potentiating, rather than repressing, a metabolic phenotype of
cancer cells. Inhibition of glutathione synthesis induces accumulation of ROS,
resulting in toxicity and reduced tumor progression (Garama et al., 2015; Harris et
al., 2015; Raj et al., 2011; Trachootham et al., 2006). We have reported in Chapter 2
of this thesis that ablation of the methylglyoxal detoxification enzyme glyoxalase 1
can inhibit cancer cell proliferation, which is in agreement with published studies
(Hosoda et al., 2015; Sakamoto et al., 2001; Thornalley et al., 1996). The toxicity of
the lipid peroxidation error product 4-hydroxy-2-nonenal has been reported to be
230
enhanced by blocking its detoxification by depletion of intracellular glutathione
(Spitz et al., 1991). Conversely, enhancing the ability of tumors to detoxify reactive
metabolites by providing antioxidants has been reported to accelerate tumor growth
(Le Gal et al., 2015; Omenn et al., 1996; Sayin et al., 2014), suggesting that reactive
metabolites can endogenously restrain tumor cell proliferation.
Though therapies that induce excessive accumulation of reactive metabolites
could impair tumor progression, a potential pitfall of this approach is that
accumulation of reactive metabolites at low levels can also contribute to
malignancy. ROS has been shown to activate oncogenic signaling pathways and
contribute to genomic instability (Arnold et al., 2001; Irani et al., 1997; Suh et al.,
1999; Weinberg et al., 2010). Endogenously produced formaldehyde can promote
systemic DNA damage and malignant transformation (Burgos-Barragan et al.,
2017). Repression of Glyoxalase 1 in breast cancer has been shown to increase
tumor growth (Nokin et al., 2016), and it has been reported that methylglyoxal can
enhance tumorigenesis at low doses while inhibiting tumor progression at higher
concentrations (Nokin et al., 2017). A better understanding of the regimes in which
reactive metabolites can promote malignancy or induce cancer cell toxicity, while
sparing non-cancerous tissues, is essential the successful clinical translation of
strategies that exploit elevated production of reactive metabolites in cancers.

231
Metabolic Drivers of the Warburg effect
Why cancer cells consume large quantities of glucose, only to secrete the
majority of the carbons as lactate, remains poorly understood and has been debated
since Warburg’s initial discovery. Tumor cells require energy to support
proliferation, and yet the Warburg effect is inefficient for ATP production. The
conversion of glucose to lactate produces 2 ATP, whereas complete oxidation of each
glucose molecule generates as many as 36 ATP (Vander Heiden et al., 2009). It has
been proposed that though the yield of ATP generated by glycolysis low, the rapid
rate of this pathway grants a selective advantage to cancer cells under conditions of
nutrient limitation (Pfeiffer et al., 2001). However, it has been calculated that the
relative amount of ATP required for growth may be less than what is required for
cellular maintenance (Kilburn et al., 1969), and evidence suggests that ATP is not
limiting for proliferation of cancer cells (Locasale and Cantley, 2011; Lunt and
Vander Heiden, 2011). In fact, there are cases where ATP hydrolysis, rather than
ATP itself, could may be limiting for proliferation (Fang et al., 2010; Racker, 1972;
Scholnick et al., 1973). The study described in Chapter 3 of this thesis provides
further evidence that ATP hydrolysis may be a constraint for cancer cell
proliferation in some contexts.
A commonly invoked explanation for the Warburg effect is that the rapid
rates of glycolysis observed in cancer cells facilitates shunting of carbon into
anabolic pathways (Boroughs and DeBerardinis, 2015; Cairns et al., 2011; Hsu and
Sabatini, 2008; Koppenol et al., 2011; Vander Heiden et al., 2009). However, the

232
vast majority of glucose consumed by tumors is excreted as lactate, and it has been
shown that carbons derived from glucose are incorporated into the new biomass of
proliferating cells only at low levels (Hosios et al., 2016). However, levels of
glycolytic intermediates are not necessarily changed in tumor cells (Lunt et al.,
2015) arguing against this hypothesis being the sole explanation for the Warburg
effect in all cancers.
Another proposed benefit of the Warburg effect is generation of electron
carriers. Proliferating cells require electrons in the form of NADPH, as this cofactor
is needed to synthesize macromolecules and antioxidants (Cairns et al., 2011). It
has been proposed that NADPH production could be limiting for cancer cell
proliferation (Vander Heiden et al., 2009). However, in this dissertation, we
determine that two processes that are highly demanding for NADPH, glutathione
production (Chapter 2) and lipid synthesis (Chapter 4) are increased in cancers.
Additionally, it has been shown that increasing proline synthesis, an NADPH
consuming process, promotes tumor cell growth (Liu et al., 2015), further arguing
against NADPH being a limitation for all tumors.
Recently, it has been argued that the regeneration of the oxidizing equivalent
NAD+ could be limiting for tumor proliferation (Birsoy et al., 2015; Gui et al., 2016;
Sullivan et al., 2015; Titov et al., 2016). NAD+ is required to remove electrons from
nutrients cells consume and to oxidize precursors of nucleotides and amino acids
(Hosios and Vander Heiden, 2018). Though proliferating cells have high
NAD+/NADH ratios in order to support these pathways (Schwartz et al., 1974), it
233
has recently been shown that the NAD+/NADH ratio is lower in cancer cells than
what was originally assumed (Hung et al., 2011; Hung and Yellen, 2014; Zhao et al.,
2016b), serving as further evidence that NAD+ could be limiting for tumors.
The conversion of pyruvate to lactate can be influenced by the availability of
NAD+, as the enzyme lactate dehydrogenase (LDH) is highly efficient and abundant
in cancer cells (Lunt and Vander Heiden, 2011; Wuntch et al., 1970). Additionally,
activity of pyruvate dehydrogenase (PDH) has been shown to be regulated by the
NAD+/NADH ratio (Pettit et al., 1975), and increasing NAD+ regeneration in
cancer cells can stimulate PDH (Titov et al., 2016). Since the relative activity of
PDH and LDH dictates pyruvate fate in cells, we wondered whether NAD+
availability could influence the Warburg effect phenotype. Since PDH consumes
NAD+ and LDH produces it (Figure 1A), we hypothesized that depleting NAD+
could suppress glucose oxidation in favor of lactate excretion, thereby repressing the
Warburg effect.
To test this idea, we cultured A549 cells with a variety of agents that could
alter the NAD+/NADH ratio and performed a dynamic stable-isotope labeling
experiment with [U-13C6]glucose to measure the incorporation of glucose-derived
carbons into citrate, which corresponds to PDH flux. We found that the complex I
inhibitor rotenone decreases the both relative NAD+/NADH and PDH activity, and
both these effects were suppressed by treatment with duroquinone, which enhances
NAD+ regeneration (Gui et al., 2016; Merker et al., 2006) (Figure 1B,C). This
confirms that depletion of NAD+ decreases glucose oxidation, as expected.
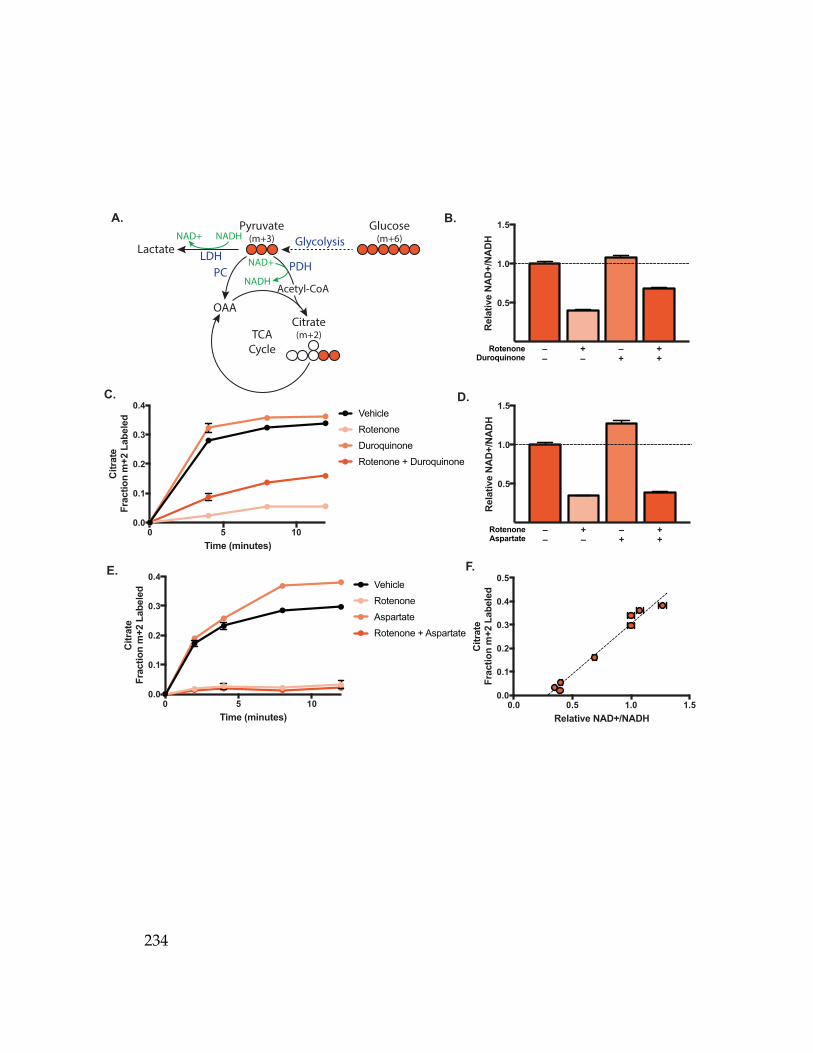
234
0 5 10
0.0
0.1
0.2
0.3
0.4
Time (minutes)
Cit
rate
Fracti
on
m+
2 L
ab
ele
d
VehicleRotenoneAspartateRotenone + Aspartate
–
–
+
–
–
+
+
+
0.5
1.0
1.5
Rela
tive N
AD
+/N
AD
H
Rotenone
Aspartate0 5 10
0.0
0.1
0.2
0.3
0.4
Time (minutes)
Cit
rate
Fracti
on
m+
2 L
ab
ele
d
VehicleRotenoneDuroquinoneRotenone + Duroquinone
–
–
+
–
–
+
+
+
0.5
1.0
1.5
Rela
tive N
AD
+/N
AD
H
Rotenone
Duroquinone
A. B.
C. D.
0.0 0.5 1.0 1.5
0.0
0.1
0.2
0.3
0.4
0.5
Relative NAD+/NADH
Cit
rate
Fracti
on
m+
2 L
ab
ele
d
E.
OAACitrate(m+2)
Pyruvate(m+3)
Lactate
Acetyl-CoA
LDHPDHPC
NAD+
NADH
TCACycle
NAD+ NADHGlucose
(m+6)Glycolysis
F.
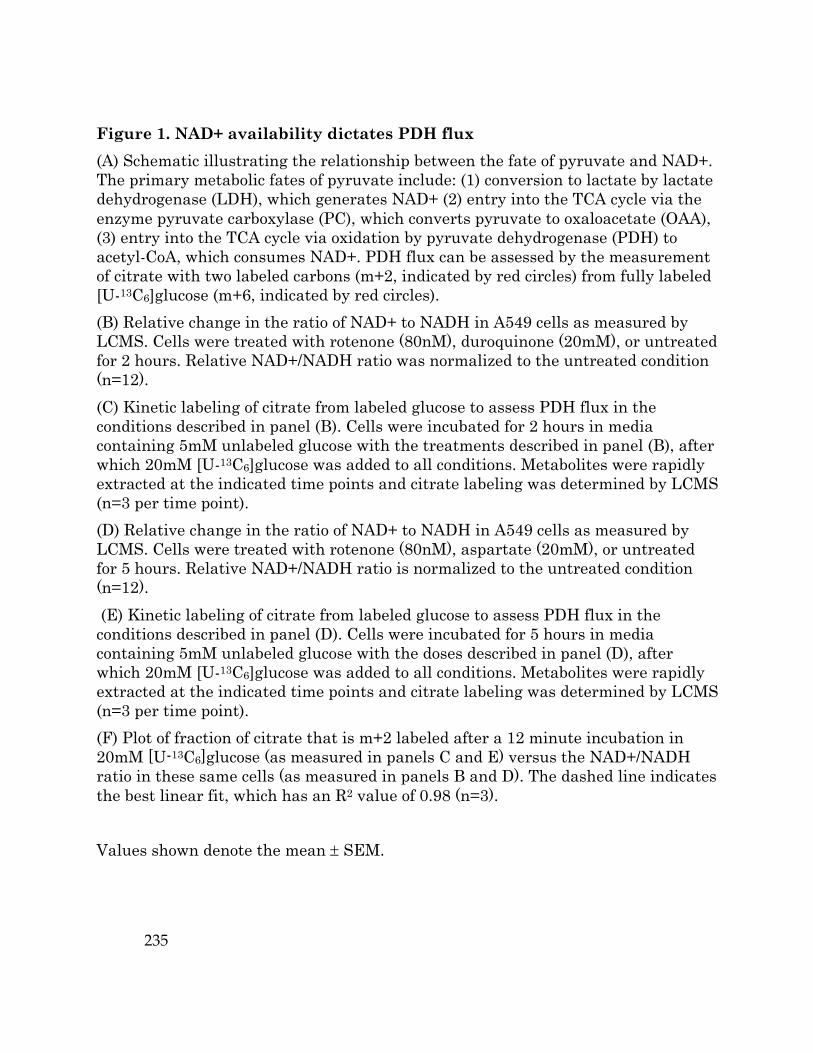
235
Figure 1. NAD+ availability dictates PDH flux (A) Schematic illustrating the relationship between the fate of pyruvate and NAD+. The primary metabolic fates of pyruvate include: (1) conversion to lactate by lactate dehydrogenase (LDH), which generates NAD+ (2) entry into the TCA cycle via the enzyme pyruvate carboxylase (PC), which converts pyruvate to oxaloacetate (OAA), (3) entry into the TCA cycle via oxidation by pyruvate dehydrogenase (PDH) to acetyl-CoA, which consumes NAD+. PDH flux can be assessed by the measurement of citrate with two labeled carbons (m+2, indicated by red circles) from fully labeled [U-13C6]glucose (m+6, indicated by red circles). (B) Relative change in the ratio of NAD+ to NADH in A549 cells as measured by LCMS. Cells were treated with rotenone (80nM), duroquinone (20mM), or untreated for 2 hours. Relative NAD+/NADH ratio was normalized to the untreated condition (n=12). (C) Kinetic labeling of citrate from labeled glucose to assess PDH flux in the conditions described in panel (B). Cells were incubated for 2 hours in media containing 5mM unlabeled glucose with the treatments described in panel (B), after which 20mM [U-13C6]glucose was added to all conditions. Metabolites were rapidly extracted at the indicated time points and citrate labeling was determined by LCMS (n=3 per time point). (D) Relative change in the ratio of NAD+ to NADH in A549 cells as measured by LCMS. Cells were treated with rotenone (80nM), aspartate (20mM), or untreated for 5 hours. Relative NAD+/NADH ratio is normalized to the untreated condition (n=12). (E) Kinetic labeling of citrate from labeled glucose to assess PDH flux in the conditions described in panel (D). Cells were incubated for 5 hours in media containing 5mM unlabeled glucose with the doses described in panel (D), after which 20mM [U-13C6]glucose was added to all conditions. Metabolites were rapidly extracted at the indicated time points and citrate labeling was determined by LCMS (n=3 per time point). (F) Plot of fraction of citrate that is m+2 labeled after a 12 minute incubation in 20mM [U-13C6]glucose (as measured in panels C and E) versus the NAD+/NADH ratio in these same cells (as measured in panels B and D). The dashed line indicates the best linear fit, which has an R2 value of 0.98 (n=3).
Values shown denote the mean ± SEM.

236
To ensure that PDH activity is reflective of the intracellular NAD+/NADH
ratio, rather than a read-out of proliferation, we next performed the same dynamic
labeling experiment but substituted duroquinone with 20mM exogenous aspartate.
Aspartate supplementation has been shown to rescue the proliferation defects
caused by rotenone without restoring the NAD+/NADH ratio (Sullivan et al., 2016),
decoupling these two parameters. We found that exogenous aspartate did not
increase the relative NAD+/NADH ratio or glucose oxidation of cells that had been
incubated with rotenone (Figure 1D,E). This indicates that in these cells, PDH flux
depends on the availability of NAD+ rather than growth rate.
Interestingly, when we plotted the effects that these agents have on the
relative change of the NAD+/NADH ratio against the fraction of m+2 citrate after a
12 minute pulse of [U-13C6]glucose, we found a linear correlation between
NAD+/NADH and glucose oxidation (Figure 1E). This indicated to us that, as we
hypothesized, NAD+ availability influences the rate of glucose oxidation and, by
extension, the Warburg effect. This experiment, along with the findings presented
in Chapter 3 of this dissertation, argues that the Warburg effect may be an
adaptation to increased demand for oxidizing equivalents in proliferating cancer
cells. In Appendix B of this thesis, we further address whether electron acceptor
availability could be a constraint for tumor growth in vivo.
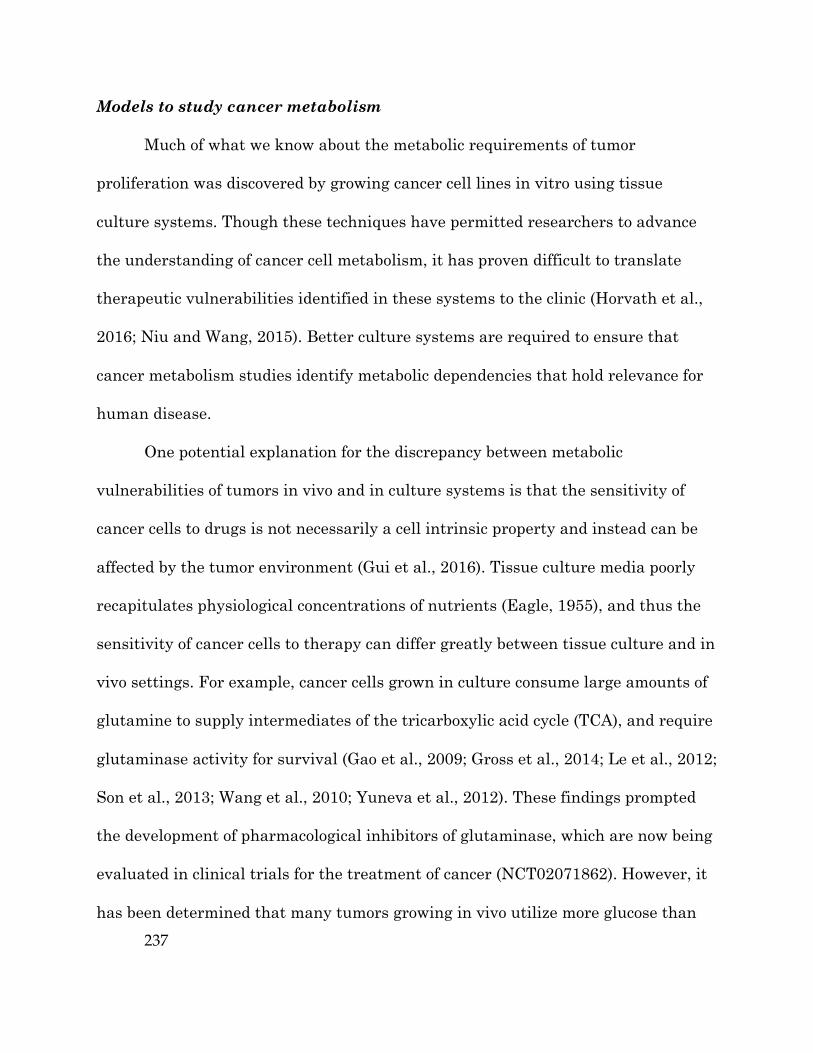
237
Models to study cancer metabolism
Much of what we know about the metabolic requirements of tumor
proliferation was discovered by growing cancer cell lines in vitro using tissue
culture systems. Though these techniques have permitted researchers to advance
the understanding of cancer cell metabolism, it has proven difficult to translate
therapeutic vulnerabilities identified in these systems to the clinic (Horvath et al.,
2016; Niu and Wang, 2015). Better culture systems are required to ensure that
cancer metabolism studies identify metabolic dependencies that hold relevance for
human disease.
One potential explanation for the discrepancy between metabolic
vulnerabilities of tumors in vivo and in culture systems is that the sensitivity of
cancer cells to drugs is not necessarily a cell intrinsic property and instead can be
affected by the tumor environment (Gui et al., 2016). Tissue culture media poorly
recapitulates physiological concentrations of nutrients (Eagle, 1955), and thus the
sensitivity of cancer cells to therapy can differ greatly between tissue culture and in
vivo settings. For example, cancer cells grown in culture consume large amounts of
glutamine to supply intermediates of the tricarboxylic acid cycle (TCA), and require
glutaminase activity for survival (Gao et al., 2009; Gross et al., 2014; Le et al., 2012;
Son et al., 2013; Wang et al., 2010; Yuneva et al., 2012). These findings prompted
the development of pharmacological inhibitors of glutaminase, which are now being
evaluated in clinical trials for the treatment of cancer (NCT02071862). However, it
has been determined that many tumors growing in vivo utilize more glucose than

238
glutamine for anaplerosis (Davidson et al., 2016; Hensley et al., 2016; Maher et al.,
2012; Marin-Valencia et al., 2012; Sellers et al., 2015), and that the same cells that
exhibit sensitivity to glutaminase inhibition in tissue culture settings can be
refractory to this treatment in vivo (Davidson et al., 2016). These findings highlight
that standard media conditions can misrepresent vulnerabilities of cancer
metabolism, complicating the translation of metabolic liabilities of cancer cells
identified in culture into effective cancer therapies.
The development of culture systems that more accurately recapitulate the
tumor microenvironment may provide improved models to study dependencies of
cancer metabolism. Tissue culture media was formulated to optimize proliferation
(Eagle, 1955) and it can be adapted to better reflect levels of nutrients found in vivo.
Growing cancer cells in serum or in serum-like media was found to repress
glutamine catabolism and sensitivity to glutaminase inhibitors (Muir et al., 2017;
Tardito et al., 2015), suggesting that these culture conditions can more accurately
replicate features of the metabolism of cancers grown in vivo. The use of more
physiological culture media could help reveal liabilities of metabolism that have
greater possibilities for successful in vivo translation (Cantor et al., 2017).
Another consideration for the development of more physiological culture
systems is that tumors in vivo are highly heterogeneous and consist of both tumor
cells and a variety of noncancerous stromal cells. Stromal cells have been shown to
confer resistance to chemotherapies to tumors (Gilbert and Hemann, 2011).
Furthermore, these tumor and stromal cells share a nutrient environment which

239
can alter the availability of resources and dependencies on metabolic pathways. It
has been reported that tumor associated-stroma can supply tumor cells with amino
acids, either by direct excretion of alanine (Sousa et al., 2016), cystine (Zhang et al.,
2012) or by production of exosomes (Zhao et al., 2016a). Existent cell culture
methods fail to recapitulate these interactions. As we have presented in Chapter 4
of this thesis, the use of conditioned media or of co-culture systems can be one way
to mimic the tumor microenvironment within the constraints of standard tissue
culture techniques.
The use of ex vivo organotypic slice cultures, introduced in Chapter 4 of this
dissertation, is another method to model the interaction between cancer cells and
stroma in tissue culture systems, with the additional benefit of maintaining the
native tissue architecture of tumors. In this method, metabolism studies are
performed on thin slices generated from freshly resected tumors, and cultured in
defined media conditions. This approach was used by Warburg when he first
identified the reprogrammed glucose metabolism of tumors (Warburg, 1923) and
since this initial discovery, it has been confirmed that ex vivo organotypic slices can
recapitulate features of in vivo tumor metabolism (Lane et al., 2016; Sellers et al.,
2015) and display drug sensitivities that match those observed in the clinic
(Askoxylakis et al., 2016; de Graaf et al., 2010; Parrish et al., 1995). Expanded use
of this platform in future cancer metabolism studies can aid identification of
metabolic dependencies that more accurately reflect those of tumors growing in
vivo.

240
As tumor metabolism is influenced by a panoply of cell-extrinsic factors, it is
likely impossible to model all these features using a single in vitro system.
Measurement of metabolic fluxes in intact tumors is becoming standard in the field
of cancer metabolism, and these studies may prove essential in determining
metabolic liabilities that are amenable to therapeutic targeting. Several studies
have assessed the fate of isotope-labeled nutrients in mice and human cancer,
permitting direct examination of the activities of metabolic pathways in vivo.
However, functional interpretation of the data obtained from these studies proves
challenging due to the complexity of in vivo physiology. Tumors have been shown to
be highly heterogeneous (Hensley et al., 2016) and it is challenging to distinguish
the metabolic phenotypes of different cell types within the tumor microenvironment.
Additionally, metabolite labeling in vivo depends on a variety of factors including
enrichment of the labeled precursors, exchange flux, and the metabolism of tissues
distal to the tumor. However, in vivo metabolism studies can still provide important
information about the activity of various metabolic pathways, and the techniques
for analyzing metabolism in vivo are rapidly expanding.
Standard cell culture systems have been essential for the discovery of genetic
drivers of proliferation. However, these same approaches have proved less
successful in modeling the drug response of compounds targeting core pathways of
metabolism. It is now acknowledged that environmental factors are important
regulators of cell metabolism and can alter the essentially of certain biochemical
pathways. To maximize the translation of metabolic vulnerabilities identified in

241
pre-clinical studies, future studies of metabolism will need to rely on experimental
culture models that that more accurately mimic the nutrient environment seen by
tumor cells in vivo. Though it can be highly informative to measure metabolic fluxes
in intact tumors, complete reliance on these techniques for the identification of
metabolic targets is impractical due to the limits on experimental manipulation and
throughput. Identification of which features of the tumor microenvironment are
most important for altering metabolic dependencies is needed to develop culture
medias that recapitulate metabolic network of tumors in vivo, and the use of these
model systems will be critical to identify metabolic dependencies that can be
exploited for the treatment of cancer.
Conclusion
The metabolism of cancer cells is considerably different than that of normal,
differentiated cells, as tumors must balance their requirement for energy
production, macromolecule biosynthesis, and redox homeostasis. Though metabolic
pathways that are altered in cancer often appear to be attractive therapeutic
targets, inhibition of metabolic enzymes often result in significant toxic effects, as
the metabolism of cancer cells can share many features with proliferating non-
cancerous cell types, including immune and stem cells. Though this represents a
significant challenge for translating metabolic dependencies of cancer cells to
clinical therapies, the fact that antimetabolites, which target nucleotide
metabolism, have been an integral part of standard chemotherapeutic regimens for

242
decades suggests that a therapeutic window exists to target the malignant
metabolism of cancer cells.
The work presented in this dissertation investigates metabolic vulnerabilities
of cancer cells, with the aim of identifying opportunities for clinical translation.
Glycolytic enzymes are expressed in both cancer cells and normal tissues, and thus
inhibitors of glucose metabolism may not offer sufficient selectivity for effective
cancer treatment. However, production of reactive metabolite byproducts is a
secondary, indirect effect of the reprogrammed metabolism of glucose in cancer cells
and could provide an opportunity to clinically target tumors that are glucose avid.
Increased activity of other metabolic pathways may also create analogous liabilities.
Furthermore, we have determined that the Warburg effect is an adaptation to the
limited oxidative capacity of cancer cells, suggesting that electron acceptor
availability is a constraint for tumor cell growth and that further perturbing the
redox potential of cancer cells could be a potential treatment strategy. Finally, we
interrogated metabolic fluxes of tumors in vivo and determined that breast cancers
that have metastasized to the brain increase their rate of fatty acid biosynthesis,
suggesting that targeting the lipid metabolism of these tumors could be a way to
develop therapies towards a cancer with inadequate treatment options.
Future investigation of the metabolic dependencies of tumor growth face
several challenges. Many existent cancer metabolism studies were performed in
cancer cell lines cultured in standard tissue culture conditions, rather than in intact
tumors. Though these studies have been informative for determining the

243
requirements of proliferation, there is growing evidence that the metabolic
dependencies of tumors can be greatly influenced by features of the tumor
microenvironment, including the availability of nutrients and interaction with
surrounding non-malignant stromal cells, tumor-initiation cells, and non-
proliferating cancer cells. These variables may make translating metabolic
vulnerabilities identified in tissue culture conditions to viable therapeutic strategies
difficult. Extending our understanding of these challenging questions in metabolism
will be critical to design therapies targeting the metabolic vulnerabilities of tumors
for the treatment of cancer patients.
Materials and Methods
Cell Culture Experiments: A549 cells were cultured in DMEM (Corning 10-013-
CV) supplemented with 10% fetal bovine serum. For all experiments, cells were
washed three times in phosphate buffered saline (PBS), and then cultured in
DMEM without pyruvate (Corning 10-017-CV) with 10% dialyzed fetal bovine
serum, supplemented with the indicated treatment condition. The reagents used for
the cell culture experiments are as follows: duroquinone (Sigma, D223204), L-
aspartic acid (Sigma A6683), rotenone (Sigma R8875). Cells were cultured at 37°C
with 5% CO2.
Dynamic stable-isotope labeling experiments: Cells were plated in six-well
plates in at a seeding density of 150,000 cells per well. Cells were permitted to

244
settle overnight. Prior to the initiation of the experiment, cells were washed three
times with PBS, and then cultured in media containing 5mM glucose and the
indicated treatment condition. After cells were cultured for 5 hours, 30µL of a 1M
[U-13C6]glucose solution was rapidly administered to each well of the plate and the
plate was rocked gently. Following the appropriate incubation (ranging from 2 to 12
minutes), cells were washed as quickly as possible with ice-cold blood bank saline
and lysed on the dish with 300µL of ice-cold 80% HPLC-grade methanol in HPLC-
grade water. Samples were scraped, collected into Eppendorf tubes, and vortexed
for 10 minutes at 4°C, centrifuged at 21,000´g for 10 minutes at 4°C to precipitate
the protein. 50µM of each sample was collected for immediate analysis by liquid
chromatography mass-spectrometry (LCMS).
LCMS Metabolite Profiling: Metabolite profiling was conducted on a QExactive
bench top orbitrap mass spectrometer equipped with an Ion Max source and a HESI
II probe, which was coupled to a Dionex UltiMate 3000 HPLC system (Thermo
Fisher Scientific, San Jose, CA). External mass calibration was performed using the
standard calibration mixture every 7 days. For each sample, 4µL of each sample
was injected onto a SeQuant® ZIC®-pHILIC 150 ´ 2.1 mm analytical column
equipped with a 2.1 ´ 20 mm guard column (both 5 mm particle size; EMD
Millipore). Buffer A was 20mM ammonium carbonate, 0.1% ammonium hydroxide;
Buffer B was acetonitrile. The column oven and autosampler tray were held at 25°C
and 4°C, respectively. The chromatographic gradient was run at a flow rate of 0.150

245
mL/min as follows: 0-20 min: linear gradient from 80-20% B; 20-20.5 min: linear
gradient form 20-80% B; 20.5-28 min: hold at 80% B. The mass spectrometer was
operated in full-scan, polarity-switching mode, with the spray voltage set to 3.0 kV,
the heated capillary held at 275°C, and the HESI probe held at 350°C. The sheath
gas flow was set to 40 units, the auxiliary gas flow was set to 15 units, and the
sweep gas flow was set to 1 unit. MS data acquisition was performed in a range of
m/z = 70–1000, with the resolution set at 70,000, the AGC target at 1´106, and the
maximum injection time (Max IT) at 20 msec. For detection of nicotinamide
diadenine nucleotide cofactors, targeted selected ion monitoring (tSIM) scans in
positive mode were included. The isolation window was set at 3.0 m/z and tSIM
scans were centered at m/z = 665.1243 for NAD(H). For detection of 13C-labeled
citrate, a negative mode tSIM scan centered on 194.1985 was included. The
isolation window was set at 8.0 m/z. For all tSIM scans, the resolution was set at
70,000, the AGC target was 1´105, and the max IT was 250 msec. Relative
quantitation of polar metabolites was performed with XCalibur QuanBrowser 2.2
(Thermo Fisher Scientific) using a 5ppm mass tolerance and referencing an in-
house library of chemical standards.
References
Arnold, R.S., Shi, J., Murad, E., Whalen, A.M., Sun, C.Q., Polavarapu, R., Parthasarathy, S., Petros, J.A., and Lambeth, J.D. (2001). Hydrogen peroxide mediates the cell growth and transformation caused by the mitogenic oxidase Nox1. Proc Natl Acad Sci U S A 98, 5550-5555.

246
Askoxylakis, V., Ferraro, G.B., Kodack, D.P., Badeaux, M., Shankaraiah, R.C., Seano, G., Kloepper, J., Vardam, T., Martin, J.D., Naxerova, K., et al. (2016). Preclinical Efficacy of Ado-trastuzumab Emtansine in the Brain Microenvironment. J Natl Cancer Inst 108.
Birsoy, K., Wang, T., Chen, W.W., Freinkman, E., Abu-Remaileh, M., and Sabatini, D.M. (2015). An Essential Role of the Mitochondrial Electron Transport Chain in Cell Proliferation Is to Enable Aspartate Synthesis. Cell 162, 540-551.
Boroughs, L.K., and DeBerardinis, R.J. (2015). Metabolic pathways promoting cancer cell survival and growth. Nat Cell Biol 17, 351-359.
Burgos-Barragan, G., Wit, N., Meiser, J., Dingler, F.A., Pietzke, M., Mulderrig, L., Pontel, L.B., Rosado, I.V., Brewer, T.F., Cordell, R.L., et al. (2017). Mammals divert endogenous genotoxic formaldehyde into one-carbon metabolism. Nature 548, 549-554.
Cairns, R.A., Harris, I.S., and Mak, T.W. (2011). Regulation of cancer cell metabolism. Nat Rev Cancer 11, 85-95.
Cantor, J.R., Abu-Remaileh, M., Kanarek, N., Freinkman, E., Gao, X., Louissaint, A., Jr., Lewis, C.A., and Sabatini, D.M. (2017). Physiologic Medium Rewires Cellular Metabolism and Reveals Uric Acid as an Endogenous Inhibitor of UMP Synthase. Cell 169, 258-272 e217.
Davidson, S.M., Papagiannakopoulos, T., Olenchock, B.A., Heyman, J.E., Keibler, M.A., Luengo, A., Bauer, M.R., Jha, A.K., O'Brien, J.P., Pierce, K.A., et al. (2016). Environment Impacts the Metabolic Dependencies of Ras-Driven Non-Small Cell Lung Cancer. Cell Metab 23, 517-528.
de Graaf, I.A., Olinga, P., de Jager, M.H., Merema, M.T., de Kanter, R., van de Kerkhof, E.G., and Groothuis, G.M. (2010). Preparation and incubation of precision-cut liver and intestinal slices for application in drug metabolism and toxicity studies. Nat Protoc 5, 1540-1551.
DeBerardinis, R.J., and Chandel, N.S. (2016). Fundamentals of cancer metabolism. Sci Adv 2, e1600200.
DeNicola, G.M., Chen, P.H., Mullarky, E., Sudderth, J.A., Hu, Z., Wu, D., Tang, H., Xie, Y., Asara, J.M., Huffman, K.E., et al. (2015). NRF2 regulates serine biosynthesis in non-small cell lung cancer. Nat Genet 47, 1475-1481.
DeNicola, G.M., Karreth, F.A., Humpton, T.J., Gopinathan, A., Wei, C., Frese, K., Mangal, D., Yu, K.H., Yeo, C.J., Calhoun, E.S., et al. (2011). Oncogene-induced Nrf2 transcription promotes ROS detoxification and tumorigenesis. Nature 475, 106-109.

247
Eagle, H. (1955). The specific amino acid requirements of a human carcinoma cell (Stain HeLa) in tissue culture. J Exp Med 102, 37-48.
Fang, M., Shen, Z., Huang, S., Zhao, L., Chen, S., Mak, T.W., and Wang, X. (2010). The ER UDPase ENTPD5 promotes protein N-glycosylation, the Warburg effect, and proliferation in the PTEN pathway. Cell 143, 711-724.
Gao, P., Tchernyshyov, I., Chang, T.C., Lee, Y.S., Kita, K., Ochi, T., Zeller, K.I., De Marzo, A.M., Van Eyk, J.E., Mendell, J.T., et al. (2009). c-Myc suppression of miR-23a/b enhances mitochondrial glutaminase expression and glutamine metabolism. Nature 458, 762-765.
Garama, D.J., Harris, T.J., White, C.L., Rossello, F.J., Abdul-Hay, M., Gough, D.J., and Levy, D.E. (2015). A Synthetic Lethal Interaction between Glutathione Synthesis and Mitochondrial Reactive Oxygen Species Provides a Tumor-Specific Vulnerability Dependent on STAT3. Mol Cell Biol 35, 3646-3656.
Gilbert, L.A., and Hemann, M.T. (2011). Chemotherapeutic resistance: surviving stressful situations. Cancer Res 71, 5062-5066.
Gorrini, C., Harris, I.S., and Mak, T.W. (2013). Modulation of oxidative stress as an anticancer strategy. Nat Rev Drug Discov 12, 931-947.
Gross, M.I., Demo, S.D., Dennison, J.B., Chen, L., Chernov-Rogan, T., Goyal, B., Janes, J.R., Laidig, G.J., Lewis, E.R., Li, J., et al. (2014). Antitumor activity of the glutaminase inhibitor CB-839 in triple-negative breast cancer. Mol Cancer Ther 13, 890-901.
Gui, D.Y., Sullivan, L.B., Luengo, A., Hosios, A.M., Bush, L.N., Gitego, N., Davidson, S.M., Freinkman, E., Thomas, C.J., and Vander Heiden, M.G. (2016). Environment Dictates Dependence on Mitochondrial Complex I for NAD+ and Aspartate Production and Determines Cancer Cell Sensitivity to Metformin. Cell Metab 24, 716-727.
Harris, I.S., Treloar, A.E., Inoue, S., Sasaki, M., Gorrini, C., Lee, K.C., Yung, K.Y., Brenner, D., Knobbe-Thomsen, C.B., Cox, M.A., et al. (2015). Glutathione and thioredoxin antioxidant pathways synergize to drive cancer initiation and progression. Cancer Cell 27, 211-222.
Hensley, C.T., Faubert, B., Yuan, Q., Lev-Cohain, N., Jin, E., Kim, J., Jiang, L., Ko, B., Skelton, R., Loudat, L., et al. (2016). Metabolic Heterogeneity in Human Lung Tumors. Cell 164, 681-694.

248
Horvath, P., Aulner, N., Bickle, M., Davies, A.M., Nery, E.D., Ebner, D., Montoya, M.C., Ostling, P., Pietiainen, V., Price, L.S., et al. (2016). Screening out irrelevant cell-based models of disease. Nat Rev Drug Discov 15, 751-769.
Hosios, A.M., Hecht, V.C., Danai, L.V., Johnson, M.O., Rathmell, J.C., Steinhauser, M.L., Manalis, S.R., and Vander Heiden, M.G. (2016). Amino Acids Rather than Glucose Account for the Majority of Cell Mass in Proliferating Mammalian Cells. Dev Cell 36, 540-549.
Hosios, A.M., and Vander Heiden, M.G. (2018). The redox requirements of proliferating mammalian cells. J Biol Chem.
Hosoda, F., Arai, Y., Okada, N., Shimizu, H., Miyamoto, M., Kitagawa, N., Katai, H., Taniguchi, H., Yanagihara, K., Imoto, I., et al. (2015). Integrated genomic and functional analyses reveal glyoxalase I as a novel metabolic oncogene in human gastric cancer. Oncogene 34, 1196-1206.
Hsu, P.P., and Sabatini, D.M. (2008). Cancer cell metabolism: Warburg and beyond. Cell 134, 703-707.
Hung, Y.P., Albeck, J.G., Tantama, M., and Yellen, G. (2011). Imaging cytosolic NADH-NAD(+) redox state with a genetically encoded fluorescent biosensor. Cell Metab 14, 545-554.
Hung, Y.P., and Yellen, G. (2014). Live-cell imaging of cytosolic NADH-NAD+ redox state using a genetically encoded fluorescent biosensor. Methods Mol Biol 1071, 83-95.
Irani, K., Xia, Y., Zweier, J.L., Sollott, S.J., Der, C.J., Fearon, E.R., Sundaresan, M., Finkel, T., and Goldschmidt-Clermont, P.J. (1997). Mitogenic signaling mediated by oxidants in Ras-transformed fibroblasts. Science 275, 1649-1652.
Kilburn, D.G., Lilly, M.D., and Webb, F.C. (1969). The energetics of mammalian cell growth. J Cell Sci 4, 645-654.
Koppenol, W.H., Bounds, P.L., and Dang, C.V. (2011). Otto Warburg's contributions to current concepts of cancer metabolism. Nat Rev Cancer 11, 325-337.
Lane, A.N., Higashi, R.M., and Fan, T.W. (2016). Preclinical models for interrogating drug action in human cancers using Stable Isotope Resolved Metabolomics (SIRM). Metabolomics 12.

249
Le, A., Lane, A.N., Hamaker, M., Bose, S., Gouw, A., Barbi, J., Tsukamoto, T., Rojas, C.J., Slusher, B.S., Zhang, H., et al. (2012). Glucose-independent glutamine metabolism via TCA cycling for proliferation and survival in B cells. Cell Metab 15, 110-121.
Le Gal, K., Ibrahim, M.X., Wiel, C., Sayin, V.I., Akula, M.K., Karlsson, C., Dalin, M.G., Akyurek, L.M., Lindahl, P., Nilsson, J., et al. (2015). Antioxidants can increase melanoma metastasis in mice. Sci Transl Med 7, 308re308.
Liu, W., Hancock, C.N., Fischer, J.W., Harman, M., and Phang, J.M. (2015). Proline biosynthesis augments tumor cell growth and aerobic glycolysis: involvement of pyridine nucleotides. Sci Rep 5, 17206.
Locasale, J.W., and Cantley, L.C. (2011). Metabolic flux and the regulation of mammalian cell growth. Cell Metab 14, 443-451.
Lunt, S.Y., Muralidhar, V., Hosios, A.M., Israelsen, W.J., Gui, D.Y., Newhouse, L., Ogrodzinski, M., Hecht, V., Xu, K., Acevedo, P.N., et al. (2015). Pyruvate kinase isoform expression alters nucleotide synthesis to impact cell proliferation. Mol Cell 57, 95-107.
Lunt, S.Y., and Vander Heiden, M.G. (2011). Aerobic glycolysis: meeting the metabolic requirements of cell proliferation. Annu Rev Cell Dev Biol 27, 441-464.
Maher, E.A., Marin-Valencia, I., Bachoo, R.M., Mashimo, T., Raisanen, J., Hatanpaa, K.J., Jindal, A., Jeffrey, F.M., Choi, C., Madden, C., et al. (2012). Metabolism of [U-13 C]glucose in human brain tumors in vivo. NMR Biomed 25, 1234-1244.
Marin-Valencia, I., Yang, C., Mashimo, T., Cho, S., Baek, H., Yang, X.L., Rajagopalan, K.N., Maddie, M., Vemireddy, V., Zhao, Z., et al. (2012). Analysis of tumor metabolism reveals mitochondrial glucose oxidation in genetically diverse human glioblastomas in the mouse brain in vivo. Cell Metab 15, 827-837.
Merker, M.P., Audi, S.H., Bongard, R.D., Lindemer, B.J., and Krenz, G.S. (2006). Influence of pulmonary arterial endothelial cells on quinone redox status: effect of hyperoxia-induced NAD(P)H:quinone oxidoreductase 1. Am J Physiol Lung Cell Mol Physiol 290, L607-619.
Muir, A., Danai, L.V., Gui, D.Y., Waingarten, C.Y., Lewis, C.A., and Vander Heiden, M.G. (2017). Environmental cystine drives glutamine anaplerosis and sensitizes cancer cells to glutaminase inhibition. Elife 6.
Niu, N., and Wang, L. (2015). In vitro human cell line models to predict clinical response to anticancer drugs. Pharmacogenomics 16, 273-285.

250
Nokin, M.J., Durieux, F., Bellier, J., Peulen, O., Uchida, K., Spiegel, D.A., Cochrane, J.R., Hutton, C.A., Castronovo, V., and Bellahcene, A. (2017). Hormetic potential of methylglyoxal, a side-product of glycolysis, in switching tumours from growth to death. Sci Rep 7, 11722.
Nokin, M.J., Durieux, F., Peixoto, P., Chiavarina, B., Peulen, O., Blomme, A., Turtoi, A., Costanza, B., Smargiasso, N., Baiwir, D., et al. (2016). Methylglyoxal, a glycolysis side-product, induces Hsp90 glycation and YAP-mediated tumor growth and metastasis. Elife 5.
Omenn, G.S., Goodman, G.E., Thornquist, M.D., Balmes, J., Cullen, M.R., Glass, A., Keogh, J.P., Meyskens, F.L., Valanis, B., Williams, J.H., et al. (1996). Effects of a combination of beta carotene and vitamin A on lung cancer and cardiovascular disease. N Engl J Med 334, 1150-1155.
Parrish, A.R., Gandolfi, A.J., and Brendel, K. (1995). Precision-cut tissue slices: applications in pharmacology and toxicology. Life Sci 57, 1887-1901.
Pettit, F.H., Pelley, J.W., and Reed, L.J. (1975). Regulation of pyruvate dehydrogenase kinase and phosphatase by acetyl-CoA/CoA and NADH/NAD ratios. Biochem Biophys Res Commun 65, 575-582.
Pfeiffer, T., Schuster, S., and Bonhoeffer, S. (2001). Cooperation and competition in the evolution of ATP-producing pathways. Science 292, 504-507.
Piskounova, E., Agathocleous, M., Murphy, M.M., Hu, Z., Huddlestun, S.E., Zhao, Z., Leitch, A.M., Johnson, T.M., DeBerardinis, R.J., and Morrison, S.J. (2015). Oxidative stress inhibits distant metastasis by human melanoma cells. Nature 527, 186-191.
Racker, E. (1972). Bioenergetics and the problem of tumor growth. Am Sci 60, 56-63.
Raj, L., Ide, T., Gurkar, A.U., Foley, M., Schenone, M., Li, X., Tolliday, N.J., Golub, T.R., Carr, S.A., Shamji, A.F., et al. (2011). Selective killing of cancer cells by a small molecule targeting the stress response to ROS. Nature 475, 231-234.
Sakamoto, H., Mashima, T., Sato, S., Hashimoto, Y., Yamori, T., and Tsuruo, T. (2001). Selective activation of apoptosis program by S-p-bromobenzylglutathione cyclopentyl diester in glyoxalase I-overexpressing human lung cancer cells. Clin Cancer Res 7, 2513-2518.
Sayin, V.I., Ibrahim, M.X., Larsson, E., Nilsson, J.A., Lindahl, P., and Bergo, M.O. (2014). Antioxidants accelerate lung cancer progression in mice. Sci Transl Med 6, 221ra215.

251
Schafer, Z.T., Grassian, A.R., Song, L., Jiang, Z., Gerhart-Hines, Z., Irie, H.Y., Gao, S., Puigserver, P., and Brugge, J.S. (2009). Antioxidant and oncogene rescue of metabolic defects caused by loss of matrix attachment. Nature 461, 109-113.
Scholnick, P., Lang, D., and Racker, E. (1973). Regulatory mechanisms in carbohydrate metabolism. IX. Stimulation of aerobic glycolysis by energy-linked ion transport and inhibition by dextran sulfate. J Biol Chem 248, 5175.
Schwartz, J.P., Passonneau, J.V., Johnson, G.S., and Pastan, I. (1974). The effect of growth conditions on NAD+ and NADH concentrations and the NAD+:NADH ratio in normal and transformed fibroblasts. J Biol Chem 249, 4138-4143.
Sellers, K., Fox, M.P., Bousamra, M., 2nd, Slone, S.P., Higashi, R.M., Miller, D.M., Wang, Y., Yan, J., Yuneva, M.O., Deshpande, R., et al. (2015). Pyruvate carboxylase is critical for non-small-cell lung cancer proliferation. J Clin Invest 125, 687-698.
Son, J., Lyssiotis, C.A., Ying, H., Wang, X., Hua, S., Ligorio, M., Perera, R.M., Ferrone, C.R., Mullarky, E., Shyh-Chang, N., et al. (2013). Glutamine supports pancreatic cancer growth through a KRAS-regulated metabolic pathway. Nature 496, 101-105.
Sousa, C.M., Biancur, D.E., Wang, X., Halbrook, C.J., Sherman, M.H., Zhang, L., Kremer, D., Hwang, R.F., Witkiewicz, A.K., Ying, H., et al. (2016). Pancreatic stellate cells support tumour metabolism through autophagic alanine secretion. Nature 536, 479-483.
Spitz, D.R., Sullivan, S.J., Malcolm, R.R., and Roberts, R.J. (1991). Glutathione dependent metabolism and detoxification of 4-hydroxy-2-nonenal. Free Radic Biol Med 11, 415-423.
Suh, Y.A., Arnold, R.S., Lassegue, B., Shi, J., Xu, X., Sorescu, D., Chung, A.B., Griendling, K.K., and Lambeth, J.D. (1999). Cell transformation by the superoxide-generating oxidase Mox1. Nature 401, 79-82.
Sullivan, L.B., Gui, D.Y., Hosios, A.M., Bush, L.N., Freinkman, E., and Vander Heiden, M.G. (2015). Supporting Aspartate Biosynthesis Is an Essential Function of Respiration in Proliferating Cells. Cell 162, 552-563.
Sullivan, L.B., Gui, D.Y., and Vander Heiden, M.G. (2016). Altered metabolite levels in cancer: implications for tumour biology and cancer therapy. Nat Rev Cancer 16, 680-693.

252
Tardito, S., Oudin, A., Ahmed, S.U., Fack, F., Keunen, O., Zheng, L., Miletic, H., Sakariassen, P.O., Weinstock, A., Wagner, A., et al. (2015). Glutamine synthetase activity fuels nucleotide biosynthesis and supports growth of glutamine-restricted glioblastoma. Nat Cell Biol 17, 1556-1568.
Thornalley, P.J., Edwards, L.G., Kang, Y., Wyatt, C., Davies, N., Ladan, M.J., and Double, J. (1996). Antitumour activity of S-p-bromobenzylglutathione cyclopentyl diester in vitro and in vivo. Inhibition of glyoxalase I and induction of apoptosis. Biochem Pharmacol 51, 1365-1372.
Titov, D.V., Cracan, V., Goodman, R.P., Peng, J., Grabarek, Z., and Mootha, V.K. (2016). Complementation of mitochondrial electron transport chain by manipulation of the NAD+/NADH ratio. Science 352, 231-235.
Trachootham, D., Zhou, Y., Zhang, H., Demizu, Y., Chen, Z., Pelicano, H., Chiao, P.J., Achanta, G., Arlinghaus, R.B., Liu, J., et al. (2006). Selective killing of oncogenically transformed cells through a ROS-mediated mechanism by beta-phenylethyl isothiocyanate. Cancer Cell 10, 241-252.
Vander Heiden, M.G., Cantley, L.C., and Thompson, C.B. (2009). Understanding the Warburg effect: the metabolic requirements of cell proliferation. Science 324, 1029-1033.
Wang, J.B., Erickson, J.W., Fuji, R., Ramachandran, S., Gao, P., Dinavahi, R., Wilson, K.F., Ambrosio, A.L., Dias, S.M., Dang, C.V., et al. (2010). Targeting mitochondrial glutaminase activity inhibits oncogenic transformation. Cancer Cell 18, 207-219.
Warburg, O. (1923). Versuche an überlebendem Carcinomgewebe (Methoden). Biochemische Zeitschrift 142, 317–333.
Weinberg, F., Hamanaka, R., Wheaton, W.W., Weinberg, S., Joseph, J., Lopez, M., Kalyanaraman, B., Mutlu, G.M., Budinger, G.R., and Chandel, N.S. (2010). Mitochondrial metabolism and ROS generation are essential for Kras-mediated tumorigenicity. Proc Natl Acad Sci U S A 107, 8788-8793.
Wuntch, T., Chen, R.F., and Vesell, E.S. (1970). Lactate dehydrogenase isozymes: further kinetic studies at high enzyme concentration. Science 169, 480-481.
Ye, J., Fan, J., Venneti, S., Wan, Y.W., Pawel, B.R., Zhang, J., Finley, L.W., Lu, C., Lindsten, T., Cross, J.R., et al. (2014). Serine catabolism regulates mitochondrial redox control during hypoxia. Cancer Discov 4, 1406-1417.

253
Yuneva, M.O., Fan, T.W., Allen, T.D., Higashi, R.M., Ferraris, D.V., Tsukamoto, T., Mates, J.M., Alonso, F.J., Wang, C., Seo, Y., et al. (2012). The metabolic profile of tumors depends on both the responsible genetic lesion and tissue type. Cell Metab 15, 157-170.
Zhang, W., Trachootham, D., Liu, J., Chen, G., Pelicano, H., Garcia-Prieto, C., Lu, W., Burger, J.A., Croce, C.M., Plunkett, W., et al. (2012). Stromal control of cystine metabolism promotes cancer cell survival in chronic lymphocytic leukaemia. Nat Cell Biol 14, 276-286.
Zhao, H., Yang, L., Baddour, J., Achreja, A., Bernard, V., Moss, T., Marini, J.C., Tudawe, T., Seviour, E.G., San Lucas, F.A., et al. (2016a). Tumor microenvironment derived exosomes pleiotropically modulate cancer cell metabolism. Elife 5, e10250.
Zhao, Y., Wang, A., Zou, Y., Su, N., Loscalzo, J., and Yang, Y. (2016b). In vivo monitoring of cellular energy metabolism using SoNar, a highly responsive sensor for NAD(+)/NADH redox state. Nat Protoc 11, 1345-1359.

255
Appendix A: Understanding the complex-I-ty of
metformin action: limiting mitochondrial respiration to
improve cancer therapy
A version of this chapter has been previously published: Luengo, A., Sullivan, L.B., and Heiden, M.G. (2014). Understanding the complex-I-ty of metformin action: limiting mitochondrial respiration to improve cancer therapy. BMC Biol 12, 82. Abstract
Metformin has been a first-line treatment for type II diabetes mellitus for
decades and is the most widely prescribed antidiabetic drug. Retrospective studies
have found that metformin treatment is associated with both reduced cancer
diagnoses and cancer-related deaths. Despite the prevalence of metformin use in the
clinic, its molecular mechanism of action remains controversial. In this appendix,
we discuss evidence that supports the role of metformin as a cancer therapeutic.
Introduction
The biguanide metformin is an antihyperglycemic agent used to treat type II
diabetes. Metformin decreases blood glucose levels by suppressing liver
gluconeogenesis and stimulating glucose uptake in skeletal muscle and adipose
tissues. Metformin is prescribed to over 120 million people, providing a wealth of
epidemiological data. Retrospective studies have found that metformin treatment is

256
associated with diminished tumorigenesis, with a recent meta-analysis of these
studies reporting a 31% reduction in cancer incidence and a 34% reduction in
cancer-specific mortality across many tumor types (Gandini et al., 2014). While
these findings are provocative, it remains controversial whether the effects of
metformin on improving cancer outcomes are a result of altered whole body
metabolism or if metformin can act in a cell autonomous manner. Indeed, the
anticancer action of metformin can be divided into two categories: ‘indirect effects’
resulting from systemic changes in metabolism, such as reduced concentrations of
blood glucose and insulin, and ‘direct effects’ on tumor cells (Figure 1).
Importantly, both could act synergistically or have differential importance
depending on the cancer context. The molecular mechanisms by which metformin
can impact tumor biology are an area of active research and clinical trials are
ongoing to define the role of metformin in cancer treatment.
Metformin action on cells and tissues
Although the molecular underpinnings of metformin action remain an area of
active investigation, the best described mechanism is inhibition of complex I, the
first component of the mitochondrial electron transport chain (Figure 2). Complex I
inhibition by metformin interrupts mitochondrial respiration and decreases proton-
driven synthesis of ATP, causing cellular energetic stress and elevation of the
AMP:ATP ratio. These changes result in allosteric activation of 5’-AMP-activated
protein kinase (AMPK), a primary metabolic sensor. Hepatic AMPK activation can
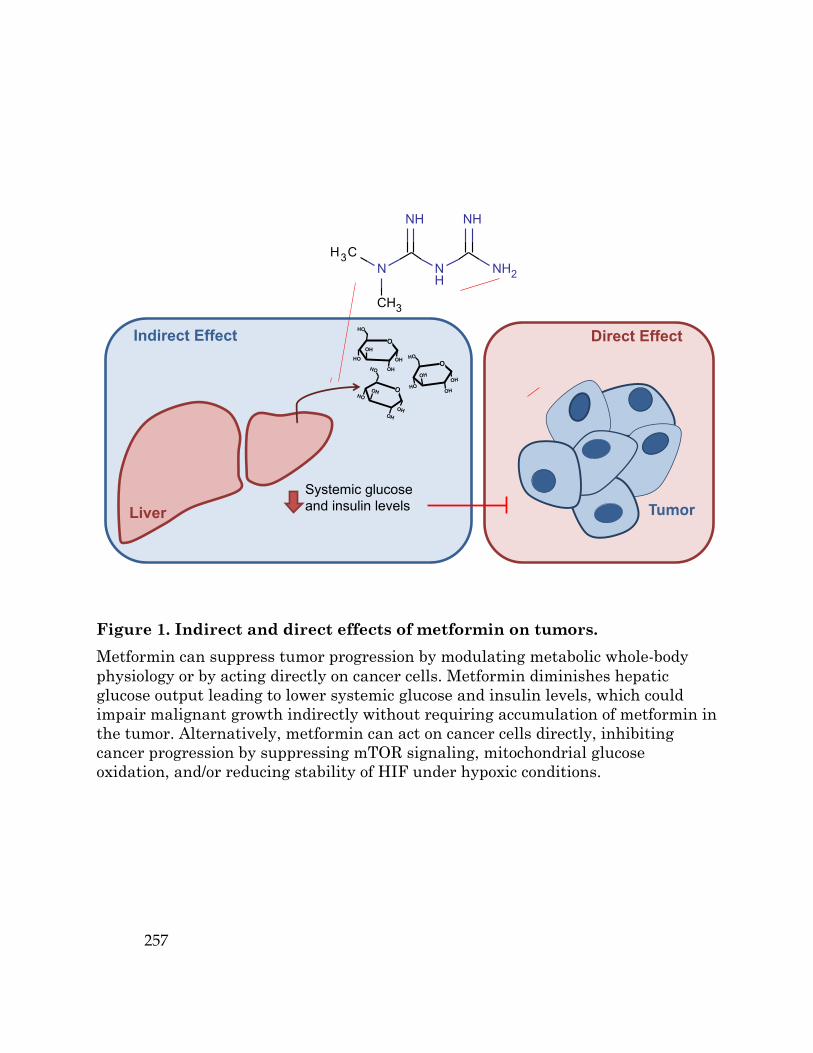
257
Figure 1. Indirect and direct effects of metformin on tumors. Metformin can suppress tumor progression by modulating metabolic whole-body physiology or by acting directly on cancer cells. Metformin diminishes hepatic glucose output leading to lower systemic glucose and insulin levels, which could impair malignant growth indirectly without requiring accumulation of metformin in the tumor. Alternatively, metformin can act on cancer cells directly, inhibiting cancer progression by suppressing mTOR signaling, mitochondrial glucose oxidation, and/or reducing stability of HIF under hypoxic conditions.
Systemic)glucose)and)insulin)levels
Indirect)Effect Direct)Effect
N NH
NH2
NH NH
H3C
CH3
Liver Tumor
Luengo*et*al.*Figure*1

258
inhibit gluconeogenesis and activate glycolysis (Mihaylova and Shaw, 2011). AMPK
activation in the muscle can also increase glucose consumption, and is another
potential site of metformin action (Hardie and Alessi, 2013). Both of these
consequences of metformin can lower blood glucose and contribute to therapeutic
benefit in in type II diabetes.
Though AMPK was once considered the primary executor of metformin
antidiabetic action, genetic loss-of-function studies in mice have indicated that
hepatic expression of AMPK and its upstream activating kinase LKB1 may not be
absolutely required for suppression of gluconeogenesis by metformin (Foretz et al.,
2010). An AMPK-independent mechanism has been proposed, by which metformin
antagonizes glucagon-dependent cyclic AMP (cAMP) signaling (Miller et al., 2013).
Glucagon activates adenylyl cyclase to produce cAMP and stimulate cAMP-
dependent protein kinase (PKA) signaling. PKA activation decreases fructose-2,6,-
bisphosphate levels, thereby favoring gluconeogenesis in the liver and increasing
blood glucose levels. Metformin opposes glucagon action because inhibition of the
mitochondrial electron transport chain elevates cytosolic AMP:ATP ratios, which in
turn abrogates cAMP production (Miller et al., 2013). Therefore, inhibition of PKA
signaling by metformin may be another mechanism for inhibition of hepatic
gluconeogenesis and reduced hyperglycemia in patients treated with the drug.
In addition to targeting complex I, metformin has recently been shown to
inhibit mitochondrial glycerol-phosphate dehydrogenase (mGPD) (Figure 2)
(Madiraju et al., 2014). mGPD transports cytosolic reducing equivalents from

259
NADH into the mitochondria via the glycerol-phosphate shuttle. Interestingly,
inhibition of mGPD and complex I both compromise the ability of mitochondria to
oxidize cytosolic NADH and decrease the entry of these reducing equivalents into
the electron transport chain. Therefore, both complex I and mGPD inhibition are
expected to have similar downstream consequences on cellular bioenergetics.
Regardless of how metformin disrupts mitochondrial respiration, the
resulting energy stress, changes in cofactor balance, and reliance on alternative
metabolic pathways to obtain ATP could have several effects that contribute to the
therapeutic benefits of this drug. AMPK activation, PKA inhibition, and redox
stress may act separately or in concert to repress hepatic gluconeogenesis and
stimulate insulin sensitivity. There are many ways in which metformin might act
across tissues to alter metabolic physiology, and these complexities make it
challenging to understand how metformin improves outcomes in cancer patients.
Role of metformin in cancer therapy
The association between metformin and decreased cancer risk may be a
result of the antidiabetic effects of the drug. Increased glucose consumption is a
hallmark of many cancer cells, and increased blood glucose and insulin levels seen
in type II diabetes are associated with worse cancer prognosis (Pollak, 2012).
Metformin improves glycemic control and lowers insulin levels, which can influence
other hormones and cytokines, including insulin-like growth factor 1 (IGF-1), a
known mitogen that has been shown to promote carcinogenesis. Most of the patients

260
Figure 2. Cellular consequences of metformin action at the mitochondria. Metformin enters the cell by organic cation transporter 1 (OCT1) and subsequently accumulates in the mitochondria. There, metformin inhibits complex I of the electron transport chain and mGDP, resulting in decreased NADH oxidation. Decreased electron chain activity suppresses tricarboxylic acid (TCA) cycle flux and decreases mitochondrial ATP synthesis. These actions result in increased AMPK signaling, decreased cAMP/PKA signaling, decreased gluconeogenesis and increased glycolysis.
261
in existing retrospective metformin studies were diabetic, so ongoing efforts to
define the benefit of metformin in non-diabetic cancer patients will provide
important insight into the role indirect metformin effects play in improved cancer
outcomes.
Metformin affects systemic metabolism, but can also influence cell
autonomous energetics. Metformin treatment leads to energy stress and AMPK
activation in cancer cells, which can impair proliferation by suppressing anabolic
processes and growth signaling through mammalian target of rapamycin (mTOR).
Increased mTOR activation has been implicated in a wide variety of different
cancers, and AMPK-mediated attenuation of anabolic metabolism and/or mTOR
signaling by metformin may contribute to the antitumor effects of metformin in
some situations. However, LKB1-deficient tumors, which are compromised in their
ability to activate AMPK, are particularly sensitive to biguanides (Shackelford et
al., 2013). This suggests that induction of energy stress may account for some of the
ability of metformin to limit cancer progression.
It has long been known that malignant cells avidly consume glucose and
preferentially metabolize glucose to lactate. However, studies of tumor metabolism
in vivo have suggested that some tumor cells also oxidize glucose in the
mitochondria (Davidson et al., 2016; Hensley et al., 2016; Maher et al., 2012; Marin-
Valencia et al., 2012; Sellers et al., 2015). Since metformin prevents mitochondrial
glucose metabolism, metformin might be particularly effective in tumors that rely
on glucose oxidation via the tricarboxylic acid cycle.

262
Decreased vascularization of tumors affects the availability of both glucose
and oxygen and may influence how glucose is used by cancer cells in vivo.
Stabilization of hypoxia-inducible factors (HIFs) is a critical part of the metabolic
adaptation to low-oxygen and activation of HIFs is reported in many cancers
(Semenza, 2013). Metformin has recently been shown to reduce hypoxia-induced
HIF1α stabilization and diminish expression of HIF target genes in tumors
(Wheaton et al., 2014), suggesting that metformin may serve a therapeutic role in
cancers that are dependent on HIF signaling for survival in hypoxic environments.
A better understanding of the signaling and metabolic effects of metformin on
cancer cells will help define other tumor contexts likely to be sensitive to metformin.
Despite increasing evidence that metformin can have profound effects on
cancer cells, it is not well understood if the drug accumulates to sufficient levels to
cause these direct effects in patient tumors. The liver is a clear site of drug action,
as it is exposed to high levels of oral metformin and expresses the metformin
transporter OCT1, facilitating uptake and allowing for drug accumulation in this
tissue. At metformin doses prescribed to diabetic patients, the circulating levels in
plasma and peripheral tissues are orders of magnitude below the concentrations
used in vitro to elicit a biological effect in cancer cells. How the concentrations used
in vitro translate to the effects on tumor tissues remains controversial, but some
studies have shown that metformin induces cancer autonomous metabolic changes
in vivo. Metformin has been shown to activate AMPK in intestinal tumors, even in
the absence of changes in organismal blood glucose or insulin levels (Tomimoto et
263
al., 2008). In another study, tumors engineered to express a surrogate for complex I
that is refractory to metformin are resistant to the drug in vivo (Wheaton et al.,
2014). These data argue that the direct effect of metformin on mitochondrial
electron transport can be relevant for tumor growth in a cell autonomous manner. A
better understanding of the pharmacokinetic properties and the molecular
mechanisms of metformin will better define how best to use this antidiabetic drug
in cancer therapy.
References
Davidson, S.M., Papagiannakopoulos, T., Olenchock, B.A., Heyman, J.E., Keibler, M.A., Luengo, A., Bauer, M.R., Jha, A.K., O'Brien, J.P., Pierce, K.A., et al. (2016). Environment Impacts the Metabolic Dependencies of Ras-Driven Non-Small Cell Lung Cancer. Cell Metab 23, 517-528.
Foretz, M., Hebrard, S., Leclerc, J., Zarrinpashneh, E., Soty, M., Mithieux, G., Sakamoto, K., Andreelli, F., and Viollet, B. (2010). Metformin inhibits hepatic gluconeogenesis in mice independently of the LKB1/AMPK pathway via a decrease in hepatic energy state. J Clin Invest 120, 2355-2369.
Gandini, S., Puntoni, M., Heckman-Stoddard, B.M., Dunn, B.K., Ford, L., DeCensi, A., and Szabo, E. (2014). Metformin and cancer risk and mortality: a systematic review and meta-analysis taking into account biases and confounders. Cancer Prev Res (Phila) 7, 867-885.
Hardie, D.G., and Alessi, D.R. (2013). LKB1 and AMPK and the cancer-metabolism link - ten years after. BMC Biol 11, 36.
Hensley, C.T., Faubert, B., Yuan, Q., Lev-Cohain, N., Jin, E., Kim, J., Jiang, L., Ko, B., Skelton, R., Loudat, L., et al. (2016). Metabolic Heterogeneity in Human Lung Tumors. Cell 164, 681-694.
Madiraju, A.K., Erion, D.M., Rahimi, Y., Zhang, X.M., Braddock, D.T., Albright, R.A., Prigaro, B.J., Wood, J.L., Bhanot, S., MacDonald, M.J., et al. (2014). Metformin suppresses gluconeogenesis by inhibiting mitochondrial glycerophosphate dehydrogenase. Nature 510, 542-546.

264
Maher, E.A., Marin-Valencia, I., Bachoo, R.M., Mashimo, T., Raisanen, J., Hatanpaa, K.J., Jindal, A., Jeffrey, F.M., Choi, C., Madden, C., et al. (2012). Metabolism of [U-13 C]glucose in human brain tumors in vivo. NMR Biomed 25, 1234-1244.
Marin-Valencia, I., Yang, C., Mashimo, T., Cho, S., Baek, H., Yang, X.L., Rajagopalan, K.N., Maddie, M., Vemireddy, V., Zhao, Z., et al. (2012). Analysis of tumor metabolism reveals mitochondrial glucose oxidation in genetically diverse human glioblastomas in the mouse brain in vivo. Cell Metab 15, 827-837.
Mihaylova, M.M., and Shaw, R.J. (2011). The AMPK signalling pathway coordinates cell growth, autophagy and metabolism. Nat Cell Biol 13, 1016-1023.
Miller, R.A., Chu, Q., Xie, J., Foretz, M., Viollet, B., and Birnbaum, M.J. (2013). Biguanides suppress hepatic glucagon signalling by decreasing production of cyclic AMP. Nature 494, 256-260.
Pollak, M.N. (2012). Investigating metformin for cancer prevention and treatment: the end of the beginning. Cancer Discov 2, 778-790.
Sellers, K., Fox, M.P., Bousamra, M., 2nd, Slone, S.P., Higashi, R.M., Miller, D.M., Wang, Y., Yan, J., Yuneva, M.O., Deshpande, R., et al. (2015). Pyruvate carboxylase is critical for non-small-cell lung cancer proliferation. J Clin Invest 125, 687-698.
Semenza, G.L. (2013). HIF-1 mediates metabolic responses to intratumoral hypoxia and oncogenic mutations. J Clin Invest 123, 3664-3671.
Shackelford, D.B., Abt, E., Gerken, L., Vasquez, D.S., Seki, A., Leblanc, M., Wei, L., Fishbein, M.C., Czernin, J., Mischel, P.S., et al. (2013). LKB1 inactivation dictates therapeutic response of non-small cell lung cancer to the metabolism drug phenformin. Cancer Cell 23, 143-158.
Tomimoto, A., Endo, H., Sugiyama, M., Fujisawa, T., Hosono, K., Takahashi, H., Nakajima, N., Nagashima, Y., Wada, K., Nakagama, H., et al. (2008). Metformin suppresses intestinal polyp growth in ApcMin/+ mice. Cancer Sci 99, 2136-2141.
Wheaton, W.W., Weinberg, S.E., Hamanaka, R.B., Soberanes, S., Sullivan, L.B., Anso, E., Glasauer, A., Dufour, E., Mutlu, G.M., Budigner, G.S., et al. (2014). Metformin inhibits mitochondrial complex I of cancer cells to reduce tumorigenesis. Elife 3, e02242.

265
Appendix B: Evidence for electron acceptor
limitation in vivo
Authorship statement: Some passages and figures have been adapted or quoted verbatim from the following published articles: Gui, D.Y., Sullivan, L.B., Luengo, A., Hosios, A.M., Bush, L.N., Gitego, N., Davidson, S.M., Freinkman, E., Thomas, C.J., and Vander Heiden, M.G. (2016). Environment Dictates Dependence on Mitochondrial Complex I for NAD+ and Aspartate Production and Determines Cancer Cell Sensitivity to Metformin. Cell Metab 24, 716-727. Sullivan, L.B., Luengo, A., Danai L.V., Bush L.N., Diehl F.F., Hosios A.M., Lau A.N., Elmiligy S., Malstrom S., Lewis C.A., Vander Heiden M.G. (2018). Evidence for Aspartate as an Endogenous Metabolic Limitation for Tumour Growth. Nat Cell Bio. Manuscript Accepted
Defining the endogenous metabolic limitations of tumor growth can help
guide new strategies for cancer therapy. Cancer cells proliferate more slowly in vivo
than in standard tissue culture systems, suggesting that tumor proliferation could
be restricted by a metabolic limitation. In Chapter 3 of this dissertation, we provide
evidence that electron acceptors could be limiting for cancer cell growth in some
contexts, thus increasing dependence on pathways that regenerate NAD+. The
dramatic differences in oxygen and nutrient availability between cancer cells
growing in vitro versus those proliferating as tumors make it likely that electron
acceptors are further limited in vivo, suggesting that the findings presented in this
thesis could hold relevance for in vivo tumor growth. A better understanding of
NAD+/NADH homeostasis in cancers growing in vivo is critical for identifying

266
contexts in which therapies that limit electron acceptor availability could be used to
benefit cancer patients.
Recent data suggests that a primary function of respiration is to provide
electron acceptors and regenerate oxidized cofactors required for proliferation
(Birsoy et al., 2015; Sullivan et al., 2015; Titov et al., 2016). The biguanide
metformin can impair respiration by inhibition of the glycerol-phosphate shuttle
(Madiraju et al., 2014) and direct inhibition of mitochondrial complex I (NADH
dehydrogenase), resulting in decreased mitochondrial respiration (Bridges et al.,
2014; El-Mir et al., 2000; Luengo et al., 2014; Owen et al., 2000; Wheaton et al.,
2014). Supporting the role of complex I as an important target of metformin in
cancer, expression of a metformin-resistant yeast analog of complex I (NDI1)
renders cells insensitive to metformin in culture and resistant to the anti-tumor
growth effects of metformin in xenograft models (Birsoy et al., 2015; Wheaton et al.,
2014). These data support the hypothesis that metformin targets complex I and
could serve as an intervention to decrease mitochondrial electron transport, and
thus electron acceptor availability, in tumors.
To explore whether electron acceptor availability could be limiting in vivo, we
first wanted to assess the effects of metformin on tumor growth. For these studies,
we injected A549 cells into the flanks of nude mice. When xenograft tumors reached
a size of 50mm3, the mice were randomized into three groups and treated once a day
with vehicle, 500mg/kg metformin, or 1,500 mg/kg metformin by oral gavage. We
found that metformin treatment inhibited tumor growth in a dose-dependent

267
Figure 1. Metformin slows tumor growth and decreases intratumoral NAD+ and aspatate levels (A) Assessment of tumor volume over time of xenograft tumors generated from A549 cells. Mice were treated with either vehicle (sterile water) or the indicated dose of metformin by daily oral gavage. Treatment was initiated in mice with size-matched tumors upon reaching a volume of 50mm3. (B) Concentrations of metformin in tumors of mice that had been treated for 10 days with the indicated dose of metformin. Tissues were collected 2 hours following the final treatment. (C and D) Relative intratumoral (C) NAD+ and (E) aspartate were measured after 10 days of vehicle or metformin treatment at the indicated dose. Relative NAD+ and aspartate levels are shown as total ion counts (TIC) normalized to leucine TIC. Values shown denote the mean ± SEM
0 2 4 6 8 10
50
100
150
Days Post Treatment
Tum
or V
olum
e (m
m3 )
Vehicle500mg/kg Metformin1500 mg/kg Metformin
Vehicle 500mg/kgMetformin
1500mg/kgMetformin
0
50
100
Tum
or M
etfo
rmin
(μM
)
Vehicle 500mg/kgMetformin
1500mg/kgMetformin
0
1
2
3
4
5
Asp
arta
te (T
IC) /
Leu
cine
(TIC
)
Vehicle 500mg/kgMetformin
1500mg/kgMetformin
0.00
0.05
0.10
0.15
NA
D+
(TIC
) / L
euci
ne (T
IC)
A. B.
C. D.

268
manner (Figure 1A). Measurement of metformin concentration in tumors
confirmed that escalating doses of the drug resulted in an increase in the
intratumoral concentration of metformin (Figure 1B), and the levels achieved by
these treatments were therapeutically relevant and expected to be tolerable in
humans (Dell'Aglio et al., 2009). Though levels of NADH were undetectable, we
found that NAD+ levels decreased in tumors treated with increasing doses of
metformin (Figure 1C). Importantly, the tumor proliferation defect correlated with
intratumoral NAD+ levels, suporting the argument that electron acceptor
availability could constrain tumor growth.
Previous work has shown that maintaining NAD+/NADH balance supports
de novo aspartate biosynthesis required for the proliferation of cancer cells (Birsoy
et al., 2015; Sullivan et al., 2015). To assess whether aspartate was affected by
metformin treatment in vivo, we measured levels of this amino acid in A549 tumors
that had been treated with metformin and discovered a dose-dependent decrease in
intratumoral aspartate levels (Figure 1D). This finding raises the possibility that
aspartate synthesis could constrain cancer cell proliferation, and thus we next
wanted to determine whether aspartate availability could limit tumor growth.
Transport of aspartate into most mammalian cells is inefficient, with
millimolar concentrations of aspartate required to restore proliferation of cells in
which electron transport is impaired (Birsoy et al., 2015; Sullivan et al., 2015).
Aspartate levels in circulation are very low (Mayers and Vander Heiden, 2015) and
most mammalian cells do not have a known asparaginase activity, the enzymatic

269
activity that converts asparagine to aspartate (Figure 2A). Thus, aspartate could
represent a metabolic limitation for tumor proliferation in vivo.
We hypothesized that if cancer cells were able to convert asparagine to
aspartate, circulating asparagine, which is permeable to cells, might be able to
contribute to intracellular aspartate pools (Figure 2B). Guinea pigs have long been
known to be unique among mammals in possessing asparaginase activity in their
blood (Broome, 1963). The protein responsible for this activity, guinea pig
asparaginase 1 (gpASNase1), has only recently been identified (Schalk et al., 2014).
We expressed an epitope tagged gpASNase1 in cells (Figure 2C) and assessed
whether heterologous gpASNase1 expression could support aspartate production in
tumor cells, and thus promote tumor growth. We implanted control cells and
gpASNase1-expressing 143B cells into the flanks of nude mice and found that
tumors expressing gpASNase1 proliferated at a higher rate than tumors derived
from control cells (Figure 2D), suggesting that obtaining aspartate could be a
limitation for the growth of some tumors.
Metformin was found to decrease intratumoral NAD+ levels and
intratumoral asparate (Figure 1C,D); however, it is unclear which of these
limitations contributed more significantly to suppression of tumor proliferation. To
test whether metformin could suppress tumor growth by depleting intracellular
aspartate, we assessed whether heterologous gpASNase expression could confer
resistance to metformin treatment in vivo. We implanted 143B cells with or without

270
Figure 2. Heterologous expression of guinea pig asparaginase 1 promotes tumor proliferation and confers resistance to metformin treatment in vivo (A) Schematic summarizing the permeability of asparagine (ASN) and aspartate (ASP) and in the inabilitly of cells to convert ASN to ASP. (B) Schematic depicting how intracellular expression of gpASNase1 allows environmental asparagine to support intracelluar aspartate levels. (C) Western blot analysis of 143B cells expressing empty vector (ev) of FLAG-tagged gpASNase1 as indicated. gpASNase1 expression is detected with an anti-FLAG antibody, and vinculin expression is assessed as a loading control. Predicted molecular weight of gpASNase1 is 60kDa. (D) Assessment of tumor volume over time of xenograft tumors generated from 143B cells expressing empty vector (ev) or gpASNase1 as indicated. (E) Volumes of tumors derived from 143B cells expressing ev or gpASNase1 were measured over time in mice that were treated with either vehicle (water) or 1g/kg metformin once daily by oral gavage. Treatment was initiated in mice with size-matched tumors after reaching 45mm3. Values shown denote the mean ± SEM; NS is p>0.05; *p<0.05; **p<0.01; ***p<0.001
A. B.
C.
D.
E.

271
gpASNase1 expression into nude mice and treated the mice with either 1000 mg/kg
metformin or vehicle by daily oral gavage after xenograft tumors reached a size of
45mm3. Though metformin suppressed growth of control tumors, metformin had no
effect on the growth of gpASNase-expressing tumors (Figure 2E). Collectively,
these data support the hypothesis that metformin can suppress tumor growth by
exacerbating an endogenous aspartate limitation. Furthermore, targeting the
pathways of aspartate production may have particular efficacy to inhibit growth of
some tumors.
Materials and Methods
Mouse studies: All experiments performed in this appendix were approved by the
MIT Committee on Animal care (IACUC). Two million A549 or one million 143B
cells were suspended in 100 µL of PBS and cells were injected into flanks of nu/nu
mice (088) (Charles River Laboratories). When tumours became palpable, tumor
volume was measured by caliper in two dimensions, and volumes were estimated
using the equation V = (p/6)(L´W2). Length was defined to be the longer of the two
dimensions measured. The tumors were permitted to grow to 50 mm3, after which
the animals were randomly assigned to a treatment or vehicle group. Vehicle
(sterile water), 500 mg/kg, or 1500 mg/kg of metformin was dosed via oral gavage
daily for 10 days. Only tumour sites that formed tumours by the end point of the
growth assay were measured and factored into the tumour volume calculation. The
tumors and plasma samples were collected two hours after the final dosage on day

272
10, and metformin and metabolite concentrations were quantified by liquid
chromatography-mass spectrometry (LCMS). Mice were sacrificed at endpoints
consistent with our mouse protocol or prior if recommended by the veterinary staff.
Western Blot Analysis: Cells expressing either empty vector or c-terminal FLAG
tagged gpASNase1 were washed with cold PBS and lysed with cold RIPA buffer
containing cOmplete Mini protease inhibitors (Roche). Protein concentration was
determined by BCA Protein Assay (Pierce) using BSA as a standard. Samples were
resolved by SDS-PAGE using standard techniques, and protein was detected with
the following antibodies: primary antibodies: FLAG (Cell Signaling, 2368), Vinculin
(Abcam, ab18058); secondary antibodies: IR680LT dye conjugated anti-rabbit IgG
(Licor Biosciences, 925-68021), IR800 dye conjugated anti-mouse IgG (Licor
Biosciences, 925-32210). Blot were imaged by an Odyssey infrared scanner (Licor
Biosciences) and analyzed using Image Studio Lite.
Polar Metabolite Quantification by Liquid Chromatography-Mass
Spectrometry: Briefly, metabolites were first extracted using ice-cold 80%
methanol and chloroform. Relative metabolites abundances were measured using a
Dionex UltiMate 3000 ultra-high performance liquid chromatography system
connected to a Q Exactive benchtop Orbitrap mass spectrometer equipped with an
Ion Max source and a HESI II probe (Thermo Fisher Scientific). To quantify
metabolite abundance, the chromatogram XCalibur QuanBroswer 2.2 (Thermo

273
Fisher Scientific) was used in conjunction with the in-house retention time library
of chemical standards.
Generation of gpASNase1 expressing cell lines: The protein sequence of
gpASNase1 was reverse translated into a nucleotide sequence which was
synthesized and inserted into a pUC57 plasmid (Biomatik). Primers were designed
to amplify the gpASNase1 sequence, encode a C-terminal FLAG tag, and use
restriction cloning to insert gpASNase1 into the plasmid pLHCX. Retrovirus was
generated in HEK293T cells by transfection using standard techniques. Cells were
infected with virus containing either empty vector pLHCX or gpASNase1 pLHCX
and were selected with 200µg/mL hygromycin B (Invitrogen). Cell were maintained
in hygromycin B containing media until all uninfected control cells had died.
References
Birsoy, K., Wang, T., Chen, W.W., Freinkman, E., Abu-Remaileh, M., and Sabatini, D.M. (2015). An Essential Role of the Mitochondrial Electron Transport Chain in Cell Proliferation Is to Enable Aspartate Synthesis. Cell 162, 540-551.
Bridges, H.R., Jones, A.J., Pollak, M.N., and Hirst, J. (2014). Effects of metformin and other biguanides on oxidative phosphorylation in mitochondria. Biochem J 462, 475-487.
Broome, J.D. (1963). Evidence that the L-asparaginase of guinea pig serum is responsible for its antilymphoma effects. I. Properties of the L-asparaginase of guinea pig serum in relation to those of the antilymphoma substance. J Exp Med 118, 99-120.

274
Dell'Aglio, D.M., Perino, L.J., Kazzi, Z., Abramson, J., Schwartz, M.D., and Morgan, B.W. (2009). Acute metformin overdose: examining serum pH, lactate level, and metformin concentrations in survivors versus nonsurvivors: a systematic review of the literature. Ann Emerg Med 54, 818-823.
El-Mir, M.Y., Nogueira, V., Fontaine, E., Averet, N., Rigoulet, M., and Leverve, X. (2000). Dimethylbiguanide inhibits cell respiration via an indirect effect targeted on the respiratory chain complex I. J Biol Chem 275, 223-228.
Gui, D.Y., Sullivan, L.B., Luengo, A., Hosios, A.M., Bush, L.N., Gitego, N., Davidson, S.M., Freinkman, E., Thomas, C.J., and Vander Heiden, M.G. (2016). Environment Dictates Dependence on Mitochondrial Complex I for NAD+ and Aspartate Production and Determines Cancer Cell Sensitivity to Metformin. Cell Metab 24, 716-727.
Luengo, A., Sullivan, L.B., and Heiden, M.G. (2014). Understanding the complex-I-ty of metformin action: limiting mitochondrial respiration to improve cancer therapy. BMC Biol 12, 82.
Madiraju, A.K., Erion, D.M., Rahimi, Y., Zhang, X.M., Braddock, D.T., Albright, R.A., Prigaro, B.J., Wood, J.L., Bhanot, S., MacDonald, M.J., et al. (2014). Metformin suppresses gluconeogenesis by inhibiting mitochondrial glycerophosphate dehydrogenase. Nature 510, 542-546.
Mayers, J.R., and Vander Heiden, M.G. (2015). Famine versus feast: understanding the metabolism of tumors in vivo. Trends Biochem Sci 40, 130-140.
Owen, M.R., Doran, E., and Halestrap, A.P. (2000). Evidence that metformin exerts its anti-diabetic effects through inhibition of complex 1 of the mitochondrial respiratory chain. Biochem J 348 Pt 3, 607-614.
Schalk, A.M., Nguyen, H.A., Rigouin, C., and Lavie, A. (2014). Identification and structural analysis of an L-asparaginase enzyme from guinea pig with putative tumor cell killing properties. J Biol Chem 289, 33175-33186.
Sullivan, L.B., Luengo, A., Danai L.V., Bush L.N., Diehl F.F., Hosios A.M., Lau A.N., Elmiligy S., Malstrom S., Lewis C.A., Vander Heiden M.G. (2018). Evidence for Aspartate as an Endogenous Metabolic Limitation for Tumour Growth. Nat Cell Bio. Manuscript Accepted
Sullivan, L.B., Gui, D.Y., Hosios, A.M., Bush, L.N., Freinkman, E., and Vander Heiden, M.G. (2015). Supporting Aspartate Biosynthesis Is an Essential Function of Respiration in Proliferating Cells. Cell 162, 552-563.

275
Titov, D.V., Cracan, V., Goodman, R.P., Peng, J., Grabarek, Z., and Mootha, V.K. (2016). Complementation of mitochondrial electron transport chain by manipulation of the NAD+/NADH ratio. Science 352, 231-235.
Wheaton, W.W., Weinberg, S.E., Hamanaka, R.B., Soberanes, S., Sullivan, L.B., Anso, E., Glasauer, A., Dufour, E., Mutlu, G.M., Budigner, G.S., et al. (2014). Metformin inhibits mitochondrial complex I of cancer cells to reduce tumorigenesis. Elife 3, e02242.