examining reproducibility in psychology: a hybrid method for … · 2018-07-31 · for combining a...
TRANSCRIPT

Examining reproducibility in psychology: A hybrid methodfor combining a statistically significant originalstudy and a replication
Robbie C. M. van Aert1 & Marcel A. L. M. van Assen1,2
Published online: 21 September 2017# The Author(s) 2017. This article is an open access publication
Abstract The unrealistically high rate of positive results withinpsychology has increased the attention to replication research.However, researchers who conduct a replication and want tostatistically combine the results of their replication with a statis-tically significant original study encounter problems when usingtraditional meta-analysis techniques. The original study’s effectsize is most probably overestimated because it is statisticallysignificant, and this bias is not taken into consideration in tradi-tional meta-analysis. We have developed a hybrid method thatdoes take the statistical significance of an original study intoaccount and enables (a) accurate effect size estimation, (b) esti-mation of a confidence interval, and (c) testing of the null hy-pothesis of no effect. We analytically approximate the perfor-mance of the hybrid method and describe its statistical proper-ties. By applying the hybrid method to data from theReproducibility Project: Psychology (Open ScienceCollaboration, 2015), we demonstrate that the conclusions basedon the hybrid method are often in line with those of the replica-tion, suggesting that many published psychological studies havesmaller effect sizes than those reported in the original study, andthat some effects may even be absent. We offer hands-on guide-lines for how to statistically combine an original study and
replication, and have developed a Web-based application(https://rvanaert.shinyapps.io/hybrid) for applying the hybridmethod.
Keywords Replication .Meta-analysis . p-Uniform .
Reproducibility
Increased attention is being paid to replication research inpsychology, mainly due to the unrealistic high rate of positiveresults within the published psychological literature.Approximately 95% of the published psychological researchcontains statistically significant results in the predicted direc-tion (Fanelli, 2012; Sterling, Rosenbaum, &Weinkam, 1995).This is not in line with the average amount of statistical power,which has been estimated at .35 (Bakker, van Dijk, &Wicherts, 2012) or .47 (Cohen, 1990) in psychological re-search and .21 in neuroscience (Button et al., 2013), indicatingthat statistically nonsignificant results often do not get pub-lished. This suppression of statistically nonsignificant resultsfrom being published is called publication bias (Rothstein,Sutton, & Borenstein, 2005). Publication bias causes the pop-ulation effect size to be overestimated (e.g., Lane & Dunlap,1978; van Assen, van Aert, & Wicherts, 2015) and raises thequestion whether a particular effect reported in the literatureactually exists. Other research fields have also shown an ex-cess of positive results (e.g., Ioannidis, 2011; Kavvoura et al.,2008; Renkewitz, Fuchs, & Fiedler, 2011; Tsilidis,Papatheodorou, Evangelou, & Ioannidis, 2012), so publica-tion bias and the overestimation of effect size by publishedresearch is not only an issue within psychology.
Replication research can help to identify whether a particulareffect in the literature is probably a false positive (Murayama,Pekrun, & Fiedler, 2014), and to increase accuracy and precisionof effect size estimation. The Open Science Collaboration
Electronic supplementary material The online version of this article(https://doi.org/10.3758/s13428-017-0967-6) contains supplementarymaterial, which is available to authorized users.
* Robbie C. M. van [email protected]
1 Department of Methodology and Statistics, Tilburg University,P.O. Box 90153, 5000 LE Tilburg, The Netherlands
2 Department of Sociology, Utrecht University,Utrecht, The Netherlands
Behav Res (2018) 50:1515–1539DOI 10.3758/s13428-017-0967-6

carried out a large-scale replication study to examine the repro-ducibility of psychological research (Open ScienceCollaboration, 2015). In this so-called Reproducibility Project:Psychology (RPP), articles were sampled from the 2008 issuesof three prominent and high-impact psychology journals and akey effect of each article was replicated according to a structuredprotocol. The results of the replications were not in line with theresults of the original studies for the majority of replicated ef-fects. For instance, 97% of the original studies reported a statis-tically significant effect for a key hypothesis, whereas only 36%of the replicated effects were statistically significant (OpenScience Collaboration, 2015). Moreover, the average effect sizeof the replication studies was substantially smaller (r = .197)than those of original studies (r = .403). Hence, the results ofthe RPP confirm both the excess of significant findings andoverestimation of published effects within psychology.
The larger effect size estimates in the original studies than intheir replications can be explained by the expected value of astatistically significant original study being larger than the truemean (i.e., overestimation). The observed effect size of a repli-cation, which has not (yet) been subjected to selection for sta-tistical significance, will usually be smaller. This statistical prin-ciple of an extreme score on a variable (in this case a statisticallysignificant effect size) being followed by a score closer to thetrue mean is also known as regression to the mean (e.g., Straits& Singleton, 2011, chap. 5). Regression to the mean occurs ifsimultaneously (i) selection occurs on the first measure (in ourcase, only statistically significant effects), and (ii) both of themeasures are subject to error (in our case, sampling error).
It is crucial to realize that the expected value of statisticallysignificant observed effects of the original studies will be largerthan the true effect size irrespective of the presence of publica-tion bias. That is, conditional on being statistically significant,the expected value of the original effect size will be larger thanthe true effect size. The distribution of the statistically signifi-cant original effect size is actually a truncated distribution at thecritical value, and these effect sizes are larger than the nonsig-nificant observed effects. Hence, the truncated distribution ofstatistically significant effects has a larger expected value thanthe true effect size. Publication bias only determines how oftenstatistically nonsignificant effects get published, and therefore itdoes not influence the expected value of the statistically signif-icant effects. Consequently, statistical analyses based on an ef-fect that was selected for replication because of its significanceshould correct for the overestimation in effect size irrespectiveof the presence of publication bias.
Estimating effect size and determining whether an effecttruly does exist on the basis of an original published studyand a replication is important. This is not only relevant forprojects such as the RPP. Because replicating published re-search is often the starting point for new research in which thereplication is the first study of a multistudy article (Neuliep &Crandall, 1993), it is also relevant for researchers who carry out
a replication and want to aggregate the results of the originalstudy and their own replication. Cumming (2012, p. 184) em-phasized that combining two studies by means of a meta-analysis has added value over interpreting two studies in isola-tion. Moreover, researchers in the field of psychology have alsostarted to use meta-analysis to combine the studies within asingle article, in what is called an internal meta-analysis(Ueno, Fastrich, &Murayama, 2016). Additionally, the propor-tion of published replication studies will increase in the nearfuture due to the widespread attention to the replicability ofpsychological research nowadays. Finally, we must note thatthe Makel, Plucker, and Hegarty’s (2012) estimate of 1% ofpublished studies in psychology being replications is a grossunderestimation. They merely searched for the wordBreplication^ and variants thereof in psychological articles.However, researchers often do not label studies as replications,to increase the likelihood of publication (Neuliep & Crandall,1993), even though many of them carry out a replication beforestarting their own variation of the study. To conclude, makingsense of and combining the results of an original study and areplication is a common and important problem.
The main difficulty with combining an original study and areplication is how to aggregate a likely overestimated effect sizein the published original study with the unpublished and prob-ably unbiased replication. For instance, what should a research-er conclude when the original study is statistically significantand the replication is not? This situation often arises—for ex-ample, of the 100 effects examined in the RPP, in 62% of thecases the original study was statistically significant, whereas thereplication was not. To examine the main problem in moredetail, consider the following hypothetical situation. Both theoriginal study and replication consist of two independent groupsof equal size, with the total sample size in the replication beingtwice as large as in the original study (80 vs. 160). The research-er may encounter the following standardized effect sizes(Hedges’ g),1 t values, and two-tailed p values: g = 0.490,t(78) = 2.211, p = .03, for the original study, and g = 0.164,t(158) = 1.040, p = .3, for the replication. A logical next step forinterpreting these results would be to combine the observedeffect sizes of both the original study and replication by meansof a fixed-effect meta-analysis. The results of such a meta-analysis suggest that there is indeed an effect in the populationafter combining the studies with meta-analytic effect size esti-
mate θ̂= 0.270, z = 2.081, p = .0375 (two-tailed). However, theresearcher may not be convinced that the effect really exists anddoes not know how to proceed, since the original study is
1 Hedges’ g is an effect size measure for a two-independent-groups design thatcorrects for the small positive bias in Cohen’s d by multiplying the Cohen’s deffect sizes with the correction factor J ¼ 1− 1
4df −1, where df refers to thedegrees of freedom (Hedges, 1981). Note that different estimators foreffect size in a two-independent-groups design exist, and that Hedges’ gand Cohen’s d are just two of these estimators (for others, seeViechtbauer, 2007, and Hedges, 1981).
1516 Behav Res (2018) 50:1515–1539

probably biased, and the meta-analysis does not take this biasinto account.
The aim of this article is threefold. First, we developed amethod (i.e., the hybrid method of meta-analysis, hybrid forshort) that combines a statistically significant original studyand replication and that does correct for the likely overesti-mation in the original study’s effect size estimate. The hybridmethod yields (a) an accurate estimate of the underlyingpopulation effect based on the original study and the repli-cation, (b) a confidence interval around this effect size esti-mate, and (c) a test of the null hypothesis of no effect for thecombination of the original study and replication. Second,we applied the hybrid and traditional meta-analysis methodsto the data of the RPP to examine the reproducibility of psy-chological research. Third, to assist practical researchers inassessing effect size using an original and replication study,we have formulated guidelines for which method to use un-der what conditions, and we explain a newly developedWeb-based application for estimation based on thesemethods.
The remainder of the article is structured as follows. Weexplain traditional meta-analysis and propose the new hy-brid method for combining an original study and a replica-tion while taking into account statistical significance of theoriginal study’s effect. We adopt a combination of theframeworks of Fisher and Neyman–Pearson that is nowa-days commonly used in practice to develop and examineour procedures for testing and estimating effect size. Next,we analytically approximate the performance of meta-analysis and the hybrid method in a situation in which anoriginal study and its replication are combined. The perfor-mance of meta-analysis and the hybrid method are com-pared to each other, and to estimation using only the repli-cation. On the basis of the performance of the methods, weformulate guidelines on which method to use under whatconditions. Subsequently, we describe the RPP and applymeta-analysis and the hybrid method to these data. Thearticle concludes with a discussion and an illustration of aWeb-based application (https://rvanaert.shinyapps.io/hybrid) allowing straightforward application of the hybridmethod to researchers’ applications.
Methods for estimating effect size
The statistical technique for estimating effect size based onmultiple studies is meta-analysis (Borenstein, Hedges,Higgins, & Rothstein, 2009, Preface). The advantage ofmeta-analysis over interpreting the studies in isolation is thatthe effect size estimate in a meta-analysis is more precise. Twometa-analysis methods are often used: fixed-effect meta-anal-ysis and random-effects meta-analysis. Fixed-effect meta-analysis assumes that one common population effect size
underlies the studies in the meta-analysis, whereas random-effects meta-analysis assumes that the each study has its ownpopulation effect size. The studies’ population effect sizes inrandom-effects meta-analysis are assumed to be a randomsample from a normal distribution of population effect sizes,and one of the aims of random-effects meta-analysis is toestimate the mean of this distribution (e.g., Borenstein et al.,2009, chap. 10). Fixed-effect rather than random-effects meta-analysis is the recommended method to aggregate the findingsof an original study and an exact or direct replication, assum-ing that both studies assess the same underlying populationeffect. Note also that statistically combining two studies bymeans of random-effects meta-analysis is practically infeasi-ble, since the amount of heterogeneity among a small numberof studies cannot be accurately estimated (e.g., Borenstein,Hedges, Higgins, & Rothstein, 2010; IntHout, Ioannidis, &Borm, 2014). After discussing fixed-effect meta-analysis, weintroduce the hybrid method as an alternative method thattakes into account the statistical significance of the originalstudy.
Fixed-effect meta-analysis
Before the average effect size with a meta-analysis can becomputed, studies’ effect sizes and sampling variances haveto be transformed to one common effect size measure (seeBorenstein, 2009; Fleiss & Berlin, 2009). The true effect size(θ) is estimated in each study with sampling error (εi). Thismodel can be written as
yi ¼ θþ εi;
where yi reflects the effect size in the ith study and it is as-sumed that the εi is normally and independently distributed, εi~ N(0, σ2
i ) with σ2i being the sampling variance in the popu-
lation for each study. These sampling variances are assumedto be known in meta-analysis.
The average effect size is computed by weighting each yiwith the reciprocal of the estimated sampling variance(wi ¼ 1
σ̂2i). For k studies in a meta-analysis, the weighted av-
erage effect size estimate (θ̂ ) is computed by
θ̂¼∑k
i¼1wiyi
∑k
i¼1wi
; ð1Þ
with variance
vθ̂¼ 1
∑k
i¼1wi
:
Behav Res (2018) 50:1515–1539 1517
A 95% confidence interval around θ̂ can be obtained by
θ̂� 1:96ffiffiffiffivθ̂pwith 1.96 being the 97.5th percentile of the nor-
mal distribution and a z test can be used to test H0: θ = 0,
z ¼ θ̂ffiffiffiffivθ̂
q
Applying fixed-effect meta-analysis to the example as pre-sented in the introduction, we first have to compute the sam-pling variance of the Hedges’ g effect size estimates for theoriginal study and replication. An unbiased estimator of thevariance of y is computed by
σ̂2¼ 1
n1þ 1
n2þ 1− n1 þ n2−4ð Þ
n1 þ n2−2ð ÞJ 2� �
g2
where n1 and n2 are the sample sizes for Groups 1 and 2(Viechtbauer, 2007). This yields weights 19.390 and 39.863for the original study and replication, respectively. Computingthe fixed-effect meta-analytic estimate (Eq. 1) with yi beingthe Hedges’ g observed effect size estimates gives
θ̂¼ 19:390� 0:490þ 39:863� 0:164
19:390þ 39:863¼ 0:270;
with the corresponding variance
vθ̂¼ 1
19:390þ 39:863ð Þ ¼ 0:017:
The 95% confidence interval of the fixed-effect meta-ana-lytic estimate ranges from 0.016 to 0.525, and the null hypoth-esis of no effect is rejected (z = 2.081, two-tailed p value =.0375). Note that the t distribution was used as reference dis-tribution for testing the original study and replication individ-ually whereas a normal distribution was used in the fixed-effect meta-analysis. The use of a normal distribution as ref-erence distribution in fixed-effect meta-analysis is a conse-quence of the common assumptions in meta-analysis ofknown sampling variances and normal sampling distributionsof effect size (Raudenbush, 2009).
Hybrid method
Like fixed-effect meta-analysis, the hybrid method estimatesthe common effect size of an original study and replication.By taking into account that the original study is statisticallysignificant, the proposed hybrid method corrects for the likelyoverestimation in the effect size of the original study. The hy-brid method is based on the statistical principle that the distri-bution of p values at the true effect size is uniform. A specialcase of this statistical principle is that the p values are uniformly
distributed under the null hypothesis (e.g., Hung, O’Neill,Bauer, & Köhne, 1997). This principle also underlies the re-cently developed meta-analytic techniques p-uniform (vanAert, Wicherts, & van Assen, 2016; van Assen et al., 2015)and p-curve (Simonsohn, Nelson, & Simmons, 2014a, b).These methods discard statistically nonsignificant effect sizes,and only use the statistically significant effect sizes in a meta-analysis to examine publication bias. P-uniform and p-curvecorrect for publication bias by computing probabilities of ob-serving a study’s effect size conditional on the effect size beingstatistically significant. The effect size estimate of p-uniformand p-curve equals that effect size for which the distributionof these conditional probabilities is best approximated by auniform distribution. Both methods yield accurate effect sizeestimates in the presence of publication bias if heterogeneityin true effect size is at most moderate (Simonsohn et al., 2014a;van Aert et al., 2016, 2015). In contrast to p-uniform and p-curve, which assume that all included studies are statisticallysignificant, only the original study is assumed to be statisticallysignificant in the hybrid method. This assumption hardly re-stricts the applicability of the hybridmethod since approximate-ly 95% of the published psychological research contains statis-tically significant results (Fanelli, 2012; Sterling et al., 1995).
To deal with bias in the original study, its p value is trans-formed by computing the probability of observing the effectsize or larger conditional on the effect size being statisticallysignificant and at the population effect size (θ).2 This can bewritten as
qO ¼ P y≥yO; θð ÞP y≥yCVO ; θ� � ; ð2Þ
where the numerator refers to the probability of observing alarger effect size than in the original study (yO) at effect size θ,and the denominator denotes the probability of observing aneffect size larger than its critical value (yCVO ) at effect size θ.Note that yCVO is independent of θ. The conditional probabilityqO at true effect size θ is uniform whenever yO is larger thanyCVO . These conditional probabilities are also used in p-uniformfor estimation and testing for an effect while correcting forpublication bias (van Aert et al., 2016, 2015). The replicationis not assumed to be statistically significant, so we computethe probability of observing a larger effect size than in thereplication (qR) at effect size θ
qR ¼ P y≥yR; θð Þ; ð3Þ
with the observed effect size of the replication denoted byyR. Both qO and qR are calculated under the assumption that
2 Without loss of generality we assume the original study’s effect size is pos-itive. If the original effect size is negative, the direction of the original study,the replication, and the resulting combined estimated effect size should bereversed to obtain the required results.
1518 Behav Res (2018) 50:1515–1539

the sampling distributions of yO and yR are normally distrib-uted, which is the common assumption in meta-analysis(Raudenbush, 2009).
Testing of H0: θ = 0 and estimation is based on the principlethat each (conditional) probability is uniformly distributed atthe true value θ. Different methods exist for testing whether adistribution deviates from a uniform distribution. The hybridmethod uses the distribution of the sum of independently uni-formly distributed random variables (i.e., the Irwin–Hall dis-tribution),3 x = qO + qR, because this method is intuitive,showed good statistical properties in the context of p-uniform,and can also be used for estimating a confidence interval (vanAert et al., 2016). The probability density function of theIrwin–Hall distribution for x based on two studies is
f xð Þ ¼ x 0≤x≤12−x 1≤x≤2 ;
�
and its cumulative distribution function is
F xð Þ ¼1
2x2 0≤x≤1
−1
2x2 þ 2x−1 1≤x≤2
8><>: : ð4Þ
Two-tailed p values of the hybrid method can be obtainedwith G(x),
G xð Þ ¼ x2 0≤x≤12− −x2 þ 4x−2
� �1≤x≤2
�: ð5Þ
The null hypothesis H0: θ = 0 is rejected if F(x | θ = 0) ≤ .05in case of a one-tailed test, and G(x |θ = 0) ≤ .05 in case of atwo-tailed test. The 2.5th and 5th percentiles of the Irwin–Halldistribution are 0.224 and 0.316, respectively. Effect size θ is
estimated as F(x | θ = θ̂ ) = .5, or equivalently, that value of θ
for which x = 1. The 95% confidence interval of θ, (θ̂L; θ̂H ), is
calculated as F(x | θ = θ̂L ) = .975 and F(x | θ = θ̂H ) = .025.We will now apply the hybrid method to the example pre-
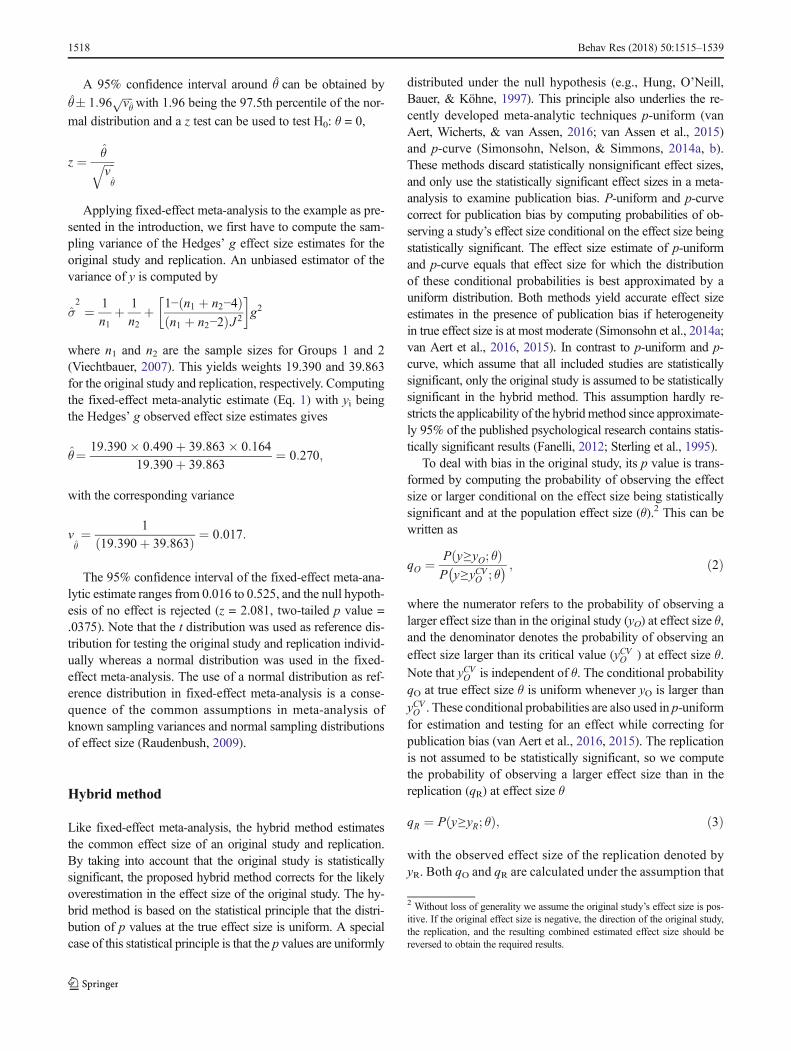
sented in the introduction. The effect size measure of the ex-ample in the introduction is Hedges’ g, but the hybrid methodcan also be applied to an original study and replication inwhich another effect size measure (e.g., the correlation coef-ficient) is computed. Figure 1 illustrates the computation of qOand qR for θ = 0 (Fig. 1a) and for θ = θ̂ (Fig. 1b), based on the
example presented in the introduction. The steepest distribu-tion in both panels refers to the effect size distribution of thereplication, which has the largest sample size. The conditionalprobability qO for θ = 0 (Fig. 1a) equals the area larger thanyCVO (intermediate gray color) divided by the area larger than
yO (dark gray): qO ¼ 0:0150:025 ¼ 0:6. The probability qR equals
the one-tailed p value (.3/2 = .15) and is indicated by the lightgray area.4 Summing these two probabilities gives x = .75,which is lower than the expected value of the Irwin–Hall dis-tribution, suggesting that the effect size exceeds 0. The nullhypothesis of no effect is not rejected, with a two-tailed pvalue equal to .558 as calculated by Eq. 5. Shifting θ to hy-brid’s estimate = 0.103 yields x = 1, as depicted in Fig. 1b,with qO = .655 and qR = .345. Estimates of the lower andupper bounds of a 95% confidence interval can also be obtain-
ed by shifting θ̂until x equals the 2.5th and 97.5th percentiles,for the lower and upper bounds of the confidence interval. Theconfidence interval of the hybrid method for the exampleranges from – 1.109 to 0.428.
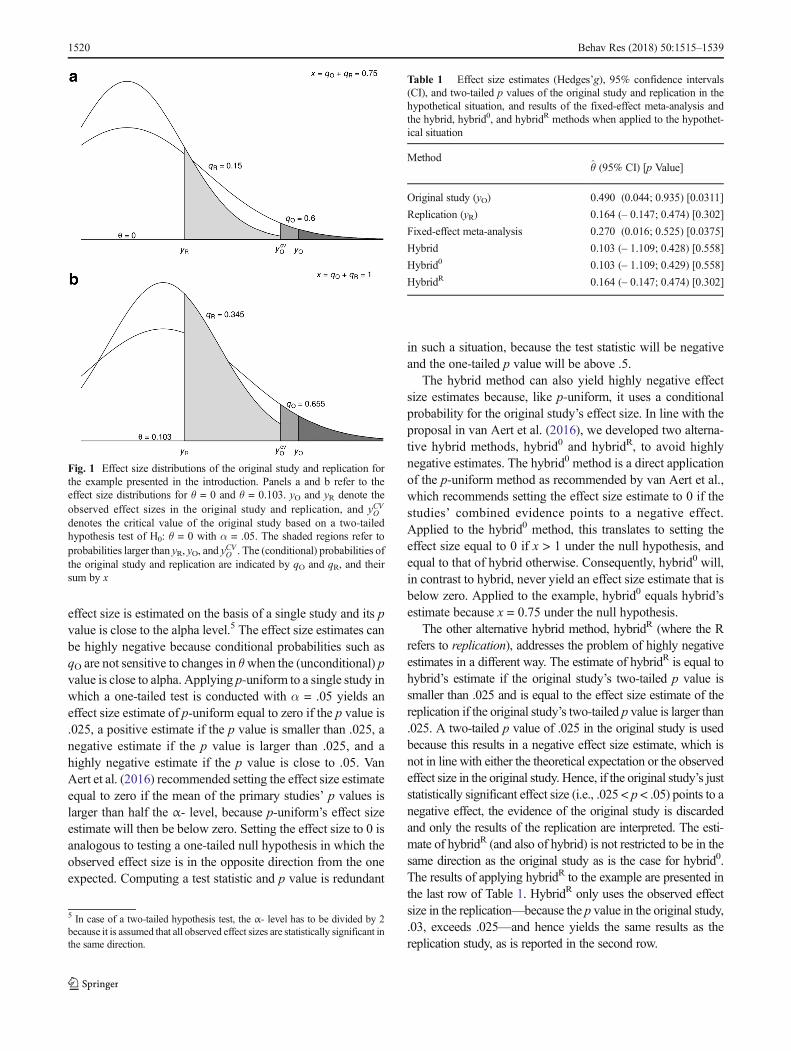
The results of applying fixed-effect meta-analysis andthe hybrid method to the example are summarized inTable 1. The original study suggests that the effect size ismedium and statistically significantly different from zero(first row), but the effect size in the replication is small atbest and not statistically significant (second row). Fixed-effect meta-analysis (third row) is usually seen as the bestestimator of the true effect size in the population and sug-gests that the effect size is small to medium (0.270) andstatistically significant (p = .0375). However, the hybrid’sestimate is small (0.103) and not statistically significant (p =.558) (fourth row). Hybrid’s estimate is lower than the esti-mate of fixed-effect meta-analysis because it corrects for thefirst study being statistically significant. Hybrid’s estimateis even lower than the estimate of the replication because,when taking the significance of the original study into ac-count, the original study suggests a zero or even negativeeffect, which pulls the estimate to zero.
Van Aert et al. (2016) showed that not only the lowerbound of a 95% confidence interval, but also the estimatedeffect sizes by p-uniform can become highly negative if the
3 Estimation was based on the Irwin–Hall distribution instead of maximumlikelihood. The distribution of the likelihood is typically highly skewed if thetrue effect size is close to zero and the sample size of the original study is small(as is currently common in psychology), making the asymptotic standarderrors of maximum likelihood inaccurate. The probability density functionand the cumulative distribution function of the Irwin–Hall distribution areavailable through the software package Mathematica (Wolfram ResearchInc., 2015).
4 The probabilities qO and qR are not exactly equal to .6 and .15, due totransforming the effect sizes from Cohen’s d to Hedges’ g. The conditionalprobabilities based on the transformed effect sizes are qO ¼ 0:0156
0:0261 ¼ 0:596and qR = .151. Transforming the effect sizes from Cohen’s d to Hedges’g may bias effect size estimates of the hybrid method. We studied towhat extent qO and qR are influenced by this transformation of effectsize. This distributions of qO and qR based on the transformed effectsizes were analytically approximated by means of numerical integration(see the supplementary material for more information and the results),and these distributions should closely follow a uniform distributionaccording to the theory underlying the hybrid method. The results showthat distributions of qO and qR after the transformation are accurateapproximations of uniform distributions. Hence, the transformationfromCohen’s d to Hedges’ gwill hardly bias the estimates of the hybridmethod.
Behav Res (2018) 50:1515–1539 1519
effect size is estimated on the basis of a single study and its pvalue is close to the alpha level.5 The effect size estimates canbe highly negative because conditional probabilities such asqO are not sensitive to changes in θwhen the (unconditional) pvalue is close to alpha. Applying p-uniform to a single study inwhich a one-tailed test is conducted with α = .05 yields aneffect size estimate of p-uniform equal to zero if the p value is.025, a positive estimate if the p value is smaller than .025, anegative estimate if the p value is larger than .025, and ahighly negative estimate if the p value is close to .05. VanAert et al. (2016) recommended setting the effect size estimateequal to zero if the mean of the primary studies’ p values islarger than half the α- level, because p-uniform’s effect sizeestimate will then be below zero. Setting the effect size to 0 isanalogous to testing a one-tailed null hypothesis in which theobserved effect size is in the opposite direction from the oneexpected. Computing a test statistic and p value is redundant
in such a situation, because the test statistic will be negativeand the one-tailed p value will be above .5.
The hybrid method can also yield highly negative effectsize estimates because, like p-uniform, it uses a conditionalprobability for the original study’s effect size. In line with theproposal in van Aert et al. (2016), we developed two alterna-tive hybrid methods, hybrid0 and hybridR, to avoid highlynegative estimates. The hybrid0 method is a direct applicationof the p-uniform method as recommended by van Aert et al.,which recommends setting the effect size estimate to 0 if thestudies’ combined evidence points to a negative effect.Applied to the hybrid0 method, this translates to setting theeffect size equal to 0 if x > 1 under the null hypothesis, andequal to that of hybrid otherwise. Consequently, hybrid0 will,in contrast to hybrid, never yield an effect size estimate that isbelow zero. Applied to the example, hybrid0 equals hybrid’sestimate because x = 0.75 under the null hypothesis.
The other alternative hybrid method, hybridR (where the Rrefers to replication), addresses the problem of highly negativeestimates in a different way. The estimate of hybridR is equal tohybrid’s estimate if the original study’s two-tailed p value issmaller than .025 and is equal to the effect size estimate of thereplication if the original study’s two-tailed p value is larger than.025. A two-tailed p value of .025 in the original study is usedbecause this results in a negative effect size estimate, which isnot in line with either the theoretical expectation or the observedeffect size in the original study. Hence, if the original study’s juststatistically significant effect size (i.e., .025 < p < .05) points to anegative effect, the evidence of the original study is discardedand only the results of the replication are interpreted. The esti-mate of hybridR (and also of hybrid) is not restricted to be in thesame direction as the original study as is the case for hybrid0.The results of applying hybridR to the example are presented inthe last row of Table 1. HybridR only uses the observed effectsize in the replication—because the p value in the original study,.03, exceeds .025—and hence yields the same results as thereplication study, as is reported in the second row.
5 In case of a two-tailed hypothesis test, the α- level has to be divided by 2because it is assumed that all observed effect sizes are statistically significant inthe same direction.
Fig. 1 Effect size distributions of the original study and replication forthe example presented in the introduction. Panels a and b refer to theeffect size distributions for θ = 0 and θ = 0.103. yO and yR denote theobserved effect sizes in the original study and replication, and yCVOdenotes the critical value of the original study based on a two-tailedhypothesis test of H0: θ = 0 with α = .05. The shaded regions refer toprobabilities larger than yR, yO, and yCVO . The (conditional) probabilities ofthe original study and replication are indicated by qO and qR, and theirsum by x
Table 1 Effect size estimates (Hedges’g), 95% confidence intervals(CI), and two-tailed p values of the original study and replication in thehypothetical situation, and results of the fixed-effect meta-analysis andthe hybrid, hybrid0, and hybridR methods when applied to the hypothet-ical situation
Methodθ̂ (95% CI) [p Value]
Original study (yO) 0.490 (0.044; 0.935) [0.0311]
Replication (yR) 0.164 (– 0.147; 0.474) [0.302]
Fixed-effect meta-analysis 0.270 (0.016; 0.525) [0.0375]
Hybrid 0.103 (– 1.109; 0.428) [0.558]
Hybrid0 0.103 (– 1.109; 0.429) [0.558]
HybridR 0.164 (– 0.147; 0.474) [0.302]
1520 Behav Res (2018) 50:1515–1539

Since all of the discussed methods may yield different re-sults, it is important to examine their statistical properties. Thenext section describes the performance of the methods evalu-ated using an analytical approximation of these methods’results.
Performance of estimation methods: Analyticalcomparison
Method
We used the correlation coefficient as effect size measure be-cause our application discussed later, the RPP, also used cor-relations. However, all methods can also deal with other effectsize measures as for instance standardized mean differences.We analytically compared the performance of five methods;fixed-effect meta-analysis, estimation using only the replica-tion (maximum likelihood), and the hybrid, hybrid0, andhybridR methods.
We evaluated the methods’ statistical properties by using aprocedure analogous to the procedure described in van Aertand van Assen (2017). The methods were applied to the jointprobability density function (pdf) of statistically significantoriginal effect size and replication effect size. This joint pdfwas a combination of the marginal pdfs of the statisticallysignificant original effect size and the replication effect size,and was approximated by using numerical integration. Bothmarginal pdfs depended on the true effect size and the samplesize in the original study and replication. The marginal pdf ofstatistically significant original effect sizes was approximatedby first creating 1,000 evenly distributed cumulative probabil-
ities or percentiles POi of this distribution given true effect size
and sample size in the original study, with
POi ¼ 1−πþ i� πð Þ
1; 001:
Here, π denotes the power of the null hypothesis test of noeffect—that is, the probability that effect size exceeds the crit-ical value.We used the Fisher z test, withα = .025 correspond-ing to common practice in psychological research in whichtwo-tailed hypothesis tests are conducted and only results inthe predicted direction get published. For instance, if the null
hypothesis is true the cumulative probabilities POi are evenly
distributed and range from 1−0:025þ 1�:025ð Þ1;001 ¼ 0:975025 to
1−0:025þ 1;000�:025ð Þ1;001 ¼ 0:999975. Finally, the 1,000 PO
i
values were converted by using a normal distribution to thecorresponding 1,000 (statistically significant) Fisher-transformed correlation coefficients.
The marginal pdf of the replication was approximated byselecting another 1,000 equally spaced cumulative
probabilities given true effect size and sample size of the rep-lication with PR
i ¼ i1;001. These cumulative probabilities range
from 11;001 ¼ 0:000999001 to 1;000
1;001 ¼ 0:999001, and were sub-
sequently also transformed to Fisher-transformed correlationcoefficients by using a normal distribution. The joint pdf wasobtained bymultiplying the two statistically independent mar-ginal pdfs, and yielded 1,000×1,000 = 1,000,000 differentcombinations of statistically significant original effect sizeand replication effect size. The methods were applied to eachof the combination of effect sizes in the original study andreplication. For presenting the results, Fisher-transformed cor-relations were transformed to correlations.6
Statistical properties of the different methods were evalu-ated on the basis of average effect size estimate, median effectsize estimate, standard deviation of effect size estimate, rootmean square error (RMSE), coverage probability (i.e., theproportion describing how often the true effect size falls insidethe confidence interval), and statistical power and Type I errorfor testing the null hypothesis of no effect. Population effectsize (ρ) and sample size in the original study (NO) and repli-cation (NR) were varied. Values for ρwere chosen to reflect no(0), small (0.1), medium (0.3), and large (0.5) true effects, asspecified by Cohen (1988, chap. 3). Representative samplesizes within psychology were used for the computations byselecting the first quartile, median, and third quartile of theoriginal study’s sample size in the RPP: 31, 55, and 96. Thesesample sizes were used for the original study and replication.A sample size of 783 was also included for the replication toreflect a recommended practice in which the sample size isdetermined with a power analysis to detect a small true effectwith a statistical power of 0.8. The computations were con-ducted in R, using the parallel package for parallel computing(R Development Core Team, 2015). The root-finding bisec-tion method (Adams & Essex, 2013, pp. 85–86) was used toestimate the effect size and the confidence interval of the hy-brid method. R code of the analyses is available via https://osf.io/tzsgw/.
Results
A consequence of analyzing Fisher-transformed correlationsinstead of raw correlations is that the estimator of true effectsize becomes slightly underestimated. However, this
6 The variance of 1,000 equally spaced probabilities (.08325), which wereused to generate the observed effect sizes in the replication, was not exactlyequal to the variance in the population (.08333). To examine whether thissmaller variance would bias the effect size estimates of the methods, we alsocomputed the effect size estimates for 5,000 equally spaced probabilities forboth the original study and replication (i.e., based on 25 instead of 1 millionpoints). These effect size estimates were almost equal to the estimates based on1,000 equally spaced probabilities (i.e., difference less than .0002). Therefore,we continued using 1,000 equally spaced probabilities for both marginal den-sities in our analyses.
Behav Res (2018) 50:1515–1539 1521
underestimation is negligible under the selected conditionsfor sample size and true effect size.7 The results of usingonly the replication data are the reference because the ex-pected value of the replication’s effect size is equal to thepopulation effect size if no p-hacking or questionable re-search practices have been used. Both fixed-effect meta-analysis and the hybrid methods also use the data of theoriginal study. In describing the results, we will focus onanswering the question under which conditions thesemethods will improve upon estimation and testing usingonly the replication data.
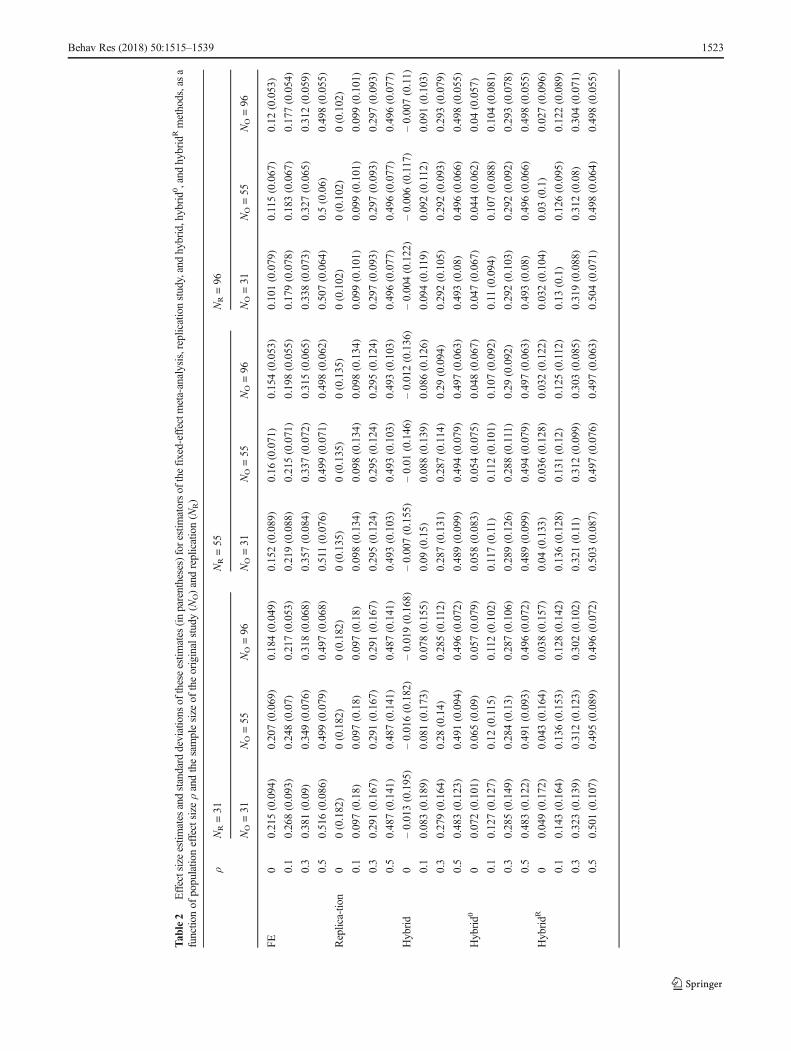
Mean and median of effect size estimates Table 2 shows themethods’ expected values as a function of the populationeffect size (ρ) and sample sizes in the original study (NO)and the replication (NR). Expected values of the methods’estimators at NR = 783 are presented in Table 6 of theAppendix because their bias is very small in those condi-tions. We also present the median effect size estimates (Fig.28), since the expected value of the hybrid method is nega-tive, because hybrid’s estimate becomes highly negative ifthe conditional probability is close to 1 (in other words, theprobability distribution of hybrid’s estimate is skewed to theleft). Note that the median effect size estimates of the repli-cation, hybrid, and hybrid0 are all exactly equal to each other,and therefore coincide in Fig. 2.
The expected values based on the replication are exactlyequal to the population effect size for ρ = 0 but are slightlysmaller than the true value for larger population effect sizes.This underestimation is caused by transforming the Fisher zvalues to correlation coefficients.9 The median estimate ofthe replication is exactly equal to the population effect sizein all conditions (solid lines with filled bullets in Fig. 2).Fixed-effect meta-analysis generally yields estimates thatare too high when there is no or only a small effect in the
population, particularly if the sample sizes are small (biasequal to .215 and .168 for no and small effect). However, itsbias is small for a very large sample size in the replication (atmost .026, for a zero true effect size and NO = 96 and NR =783; see Table 6). Bias decreases as the population effectsize and sample size increase, becoming .037 or smaller ifthe population effect size is at least medium and both samplesizes are at least 55.
The estimator of the hybrid method has a slight negativebias relative to the replication (never more than – 0.021;Table 2) caused by the highly negative estimates if x is closeto 2 under the null hypothesis. However, its median (dashedlines with filled squares in Fig. 2) is exactly equal to thepopulation effect size. Hybrid0, which was developed to cor-rect for the negative bias of hybrid’s estimator, overcorrectsand yields an overestimated effect size for ρ = 0, with biasesequal to .072 and .04 for small and large sample sizes, respec-tively. The positive bias of hybrid0’s estimator is small for asmall effect size (at most .027, for small sample sizes), where-as there is a small negative bias for medium and large effectsizes. Hybrid0’s median estimate is exactly equal to the popu-lation effect size (dashed lines with asterisks in Fig. 2). Theresults of estimator hybridR parallel those of hybrid0, but withless positive bias for no effect (.049 and .027 for small andlarge sample sizes, respectively), and more bias for a smalleffect size (at most .043) and a medium effect size (at most.023). The median estimate of hybridR (dashed lines withtriangles in Fig. 2) slightly exceeds the population effect size,because the data of the original study are omitted only if theyindicate a negative effect.
To conclude, the negative bias of the hybrid’s estimatoris small, whereas the estimators of hybridR and hybrid0
overcorrect this bias for no and small population effectsizes. The fixed-effect meta-analytic estimator yields se-verely overestimated effect sizes for no and small popula-tion effect sizes, but yields approximately accurate esti-mates for a large effect size. The bias of all methods de-creases if sample sizes increase, and all methods yieldaccurate effect size estimates for large population effectsizes.
Precision Table 2 also presents the standard deviation of eacheffect size estimate, reflecting the precision of these estimates.The standard deviations of the effect size estimates for NR =783 are presented in Table 6 and are substantially smaller thanthe standard deviations of the other conditions for NR. Thefixed-effect meta-analytic estimator yields the most preciseestimates. The precision of hybrid’s estimator increases rela-tive to the precision of the replication’s estimator in populationeffect size and the ratio of original to replication sample size.For zero and small population effect sizes, the estimator ofhybrid has lower precision than the replication’s estimator ifthe replication sample size is equal or lower than the original
7 We examined the underestimation caused by transforming the correlations toFisher-transformed correlations by computing the expected value and varianceof the exact probability density distribution of the correlation (Hotelling, 1953)and the probability density distribution of the correlation that is obtained byapplying the Fisher transformation. This procedure for computing the expectedvalue and variance is analogous to the one described in Schulze (2004, pp.119–123). Of the conditions for sample size and true effect size (ρ) included inour study, bias in expected value and variance is largest for a sample size of 31and true effect size of ρ = .5. For this condition, the expected value andvariance of the exact probability density distribution are .494 and .0260, re-spectively, and .487 and .0200 for the probability density distribution afterapplying the Fisher transformation. In other conditions, bias was less than.004 and .002 for the expected value and variance, respectively.8 A line for each method is drawn through the points in Figs. 2–5 to improvetheir interpretability. The lines do not reflect extrapolated estimates of theperformance of the different methods for true effect sizes that were not includ-ed in our analytical approximation.9 The observed effect sizes were first transformed from Fisher z values tocorrelation coefficients before the average effect size was calculated. Thiscaused a slight underestimation in the effect size estimate based on the repli-cation study.
1522 Behav Res (2018) 50:1515–1539
Tab
le2
Effectsizeestim
ates
andstandard
deviations
oftheseestim
ates
(inparentheses)forestim
atorsof
thefixed-effectmeta-analysis,replicationstudy,andhybrid,hybrid0,and
hybridRmethods,asa
functio
nof
populatio
neffectsize
ρandthesamplesize
oftheoriginalstudy(N
O)andreplication(N
R)
ρNR=31
NR=55
NR=96
NO=31
NO=55
NO=96
NO=31
NO=55
NO=96
NO=31
NO=55
NO=96
FE0
0.215(0.094)
0.207(0.069)
0.184(0.049)
0.152(0.089)
0.16
(0.071)
0.154(0.053)
0.101(0.079)
0.115(0.067)
0.12
(0.053)
0.1
0.268(0.093)
0.248(0.07)
0.217(0.053)
0.219(0.088)
0.215(0.071)
0.198(0.055)
0.179(0.078)
0.183(0.067)
0.177(0.054)
0.3
0.381(0.09)
0.349(0.076)
0.318(0.068)
0.357(0.084)
0.337(0.072)
0.315(0.065)
0.338(0.073)
0.327(0.065)
0.312(0.059)
0.5
0.516(0.086)
0.499(0.079)
0.497(0.068)
0.511(0.076)
0.499(0.071)
0.498(0.062)
0.507(0.064)
0.5(0.06)
0.498(0.055)
Replica-tio
n0
0(0.182)
0(0.182)
0(0.182)
0(0.135)
0(0.135)
0(0.135)
0(0.102)
0(0.102)
0(0.102)
0.1
0.097(0.18)
0.097(0.18)
0.097(0.18)
0.098(0.134)
0.098(0.134)
0.098(0.134)
0.099(0.101)
0.099(0.101)
0.099(0.101)
0.3
0.291(0.167)
0.291(0.167)
0.291(0.167)
0.295(0.124)
0.295(0.124)
0.295(0.124)
0.297(0.093)
0.297(0.093)
0.297(0.093)
0.5
0.487(0.141)
0.487(0.141)
0.487(0.141)
0.493(0.103)
0.493(0.103)
0.493(0.103)
0.496(0.077)
0.496(0.077)
0.496(0.077)
Hybrid
0–0.013(0.195)
–0.016(0.182)
–0.019(0.168)
–0.007(0.155)
–0.01
(0.146)
–0.012(0.136)
–0.004(0.122)
–0.006(0.117)
–0.007(0.11)
0.1
0.083(0.189)
0.081(0.173)
0.078(0.155)
0.09
(0.15)
0.088(0.139)
0.086(0.126)
0.094(0.119)
0.092(0.112)
0.091(0.103)
0.3
0.279(0.164)
0.28
(0.14)
0.285(0.112)
0.287(0.131)
0.287(0.114)
0.29
(0.094)
0.292(0.105)
0.292(0.093)
0.293(0.079)
0.5
0.483(0.123)
0.491(0.094)
0.496(0.072)
0.489(0.099)
0.494(0.079)
0.497(0.063)
0.493(0.08)
0.496(0.066)
0.498(0.055)
Hybrid0
00.072(0.101)
0.065(0.09)
0.057(0.079)
0.058(0.083)
0.054(0.075)
0.048(0.067)
0.047(0.067)
0.044(0.062)
0.04
(0.057)
0.1
0.127(0.127)
0.12
(0.115)
0.112(0.102)
0.117(0.11)
0.112(0.101)
0.107(0.092)
0.11
(0.094)
0.107(0.088)
0.104(0.081)
0.3
0.285(0.149)
0.284(0.13)
0.287(0.106)
0.289(0.126)
0.288(0.111)
0.29
(0.092)
0.292(0.103)
0.292(0.092)
0.293(0.078)
0.5
0.483(0.122)
0.491(0.093)
0.496(0.072)
0.489(0.099)
0.494(0.079)
0.497(0.063)
0.493(0.08)
0.496(0.066)
0.498(0.055)
HybridR
00.049(0.172)
0.043(0.164)
0.038(0.157)
0.04
(0.133)
0.036(0.128)
0.032(0.122)
0.032(0.104)
0.03
(0.1)
0.027(0.096)
0.1
0.143(0.164)
0.136(0.153)
0.128(0.142)
0.136(0.128)
0.131(0.12)
0.125(0.112)
0.13
(0.1)
0.126(0.095)
0.122(0.089)
0.3
0.323(0.139)
0.312(0.123)
0.302(0.102)
0.321(0.11)
0.312(0.099)
0.303(0.085)
0.319(0.088)
0.312(0.08)
0.304(0.071)
0.5
0.501(0.107)
0.495(0.089)
0.496(0.072)
0.503(0.087)
0.497(0.076)
0.497(0.063)
0.504(0.071)
0.498(0.064)
0.498(0.055)
Behav Res (2018) 50:1515–1539 1523

sample size. For medium and large population effect sizes, theestimator of hybrid generally has higher precision, exceptwhen the sample size in the original study is much smallerthan the replication’s sample size. The estimators of hybrid0
and hybridR have higher precision than hybrid’s estimatorbecause they deal with the possibly strongly negative esti-mates of hybrid, with hybrid0’s estimator in general beingmost precise for zero and small population effect sizes, andthe estimator of hybridR being most precise for medium andlarge population effect sizes. They also have higher precisionthan the estimator of the replication, but not when the replica-tion’s sample size is larger than the sample size of the originalstudy and at the same time the effect size in the population ismedium or large (hybrid0; NO = 31/55 and NR = 96) or zero(hybridR; NO = 31 and NR = 96).
RMSE The RMSE combines two important statisticalproperties of an estimator: bias and precision. A slightlybiased and very precise estimator is often preferred over anunbiased but very imprecise estimator. The RMSE is anindicator of this trade-off between bias and precision andis displayed in Fig. 3. As compared to the replication’sestimator, the RMSE of the fixed-effect meta-analytic esti-mator is higher for no effect in the population, and smallerfor medium and large effect sizes. For small populationeffect sizes, the RMSE of the estimators of the replicationand of fixed-effect meta-analysis are roughly the same forequal sample sizes, whereas the RMSE of the replication’sestimator was higher for NO > NR and lower for NO < NR.Comparing the estimators of hybrid to the replication forequal sample sizes of both studies, hybrid’s RMSE is
Fig. 2 Median effect size estimates of the estimators of fixed-effect meta-analysis (solid line with open bullets), replication study (solid line withfilled bullets) and hybrid (dashed line with filled squares), hybrid0
(dashed line with asterisks), and hybridR method (dashed line with filled
triangles) as a function of population effect size ρ and sample size of theoriginal study (NO) and replication (NR). Median effect size estimates ofthe replication study, hybrid, and hybrid0 are exactly equal to the popu-lation effect size and therefore coincide
1524 Behav Res (2018) 50:1515–1539

higher for zero and small population effect sizes, but lowerfor medium and large population effect sizes. However, theperformance of hybrid’s estimator relative to the estimatorof the replication depends on both sample sizes and in-creases with the ratio NO/NR. The RMSEs of the estimatorsof hybrid0 and hybridR are always lower than that of hy-brid’s estimator. They are also lower than the RMSE of thereplication, except for NO = 31 and NR = 96 with a zero orsmall population effect size (hybridR), or a medium orlarge population effect size (hybrid0). The RMSEs of theestimators of hybrid0 and hybridR are lower than that of thefixed-effect meta-analytic estimator for zero or small pop-ulation effect size, and higher for medium or large popula-tion effect size. For NR = 783, the RMSEs of all estimatorswere close to each other (see the figures in the last columnof Fig. 3).
Statistical properties of the test of no effect Figure 4 pre-sents the Type I error and statistical power of all methods’testing procedures. The Type I error rate is exactly .025 forthe replication, hybrid, and hybrid0 method. The Type I errorrate is slightly too high for hybridR (.037 in all conditions),and substantially too high for fixed-effect meta-analysis (in-creases with NO/NR, up to .551 for NO = 96 and NR = 31).Concerning statistical power, fixed-effect meta-analysis hasby far the highest power, because of its overestimation incombination with high precision.With respect to the statisticalpower of the other methods, we first consider the cases withequal sample sizes of both studies. Here, hybridR has higheststatistical power, followed by the replication. Hybrid and hy-brid0 have about equal statistical power relative to the replica-tion for zero and small population effect sizes, but lower sta-tistical power for medium and large population effect sizes.
Fig. 3 Root mean square errors (RMSE) of the estimators of fixed-effectmeta-analysis (solid line with open bullets), replication study (solid linewith filled bullets) and hybrid (dashed line with filled squares), hybrid0
(dashed line with asterisks), and hybridR method (dashed line with filledtriangles) as a function of population effect size ρ and sample size of theoriginal study (NO) and replication (NR)
Behav Res (2018) 50:1515–1539 1525

For NO > NR, all hybrid methods have higher power than thereplication. For NO < NR and NR < 783, hybridR has higherstatistical power than the replication for zero or small popula-tion effect size, but lower statistical power for medium or largepopulation effect size; hybrid and hybrid0 have lower statisti-cal power than the replication in this case. The statistical pow-er of the replication is .8 for ρ = .1 and NR = 783 because thesample size was determined to obtain a power of .8 in thiscondition, and 1 for ρ > .1 and NR = 783.
Coverage is presented in Fig. 5.10 The replication and hy-brid yield coverage probabilities exactly equal to 95% in all
conditions. The coverage probabilities of fixed-effect meta-analysis are substantially too low for ρ = 0 and ρ = .1, dueto overestimation of the average effect size; generally, its cov-erage improves with effect size and ratioNR/NO. The coverageprobabilities of hybrid0 and hybridR are close to .95 in allconditions.
Guidelines for applying methods Using the methods’ statis-tical properties, we attempted to answer the essential questionof which method to use under what conditions. Answeringthis question is difficult because an important condition, pop-ulation effect size, is unknown, and in fact has to be estimatedand tested. We present guidelines (Table 3) that take this un-certainty into account. Each guideline is founded on and ex-plained by using the previously described results.
Fig. 4 Type I error rate and statistical power of the testing procedures offixed-effect meta-analysis (solid line with open bullets), replication study(solid line with filled bullets) and hybrid (dashed line with filled squares),
hybrid0 (dashed line with asterisks), and hybridR method (dashed linewith filled triangles) as a function of population effect size ρ and samplesize of the original study (NO) and replication (NR)
10 The hybrid0 method is omitted from Fig. 5, illustrating the coverage prob-abilities, because the average effect size estimate was set to zero if the p valueof the original study was larger than .0125. This made the confidence intervalmeaningless, since the average effect size estimate could not be included in theconfidence interval.
1526 Behav Res (2018) 50:1515–1539
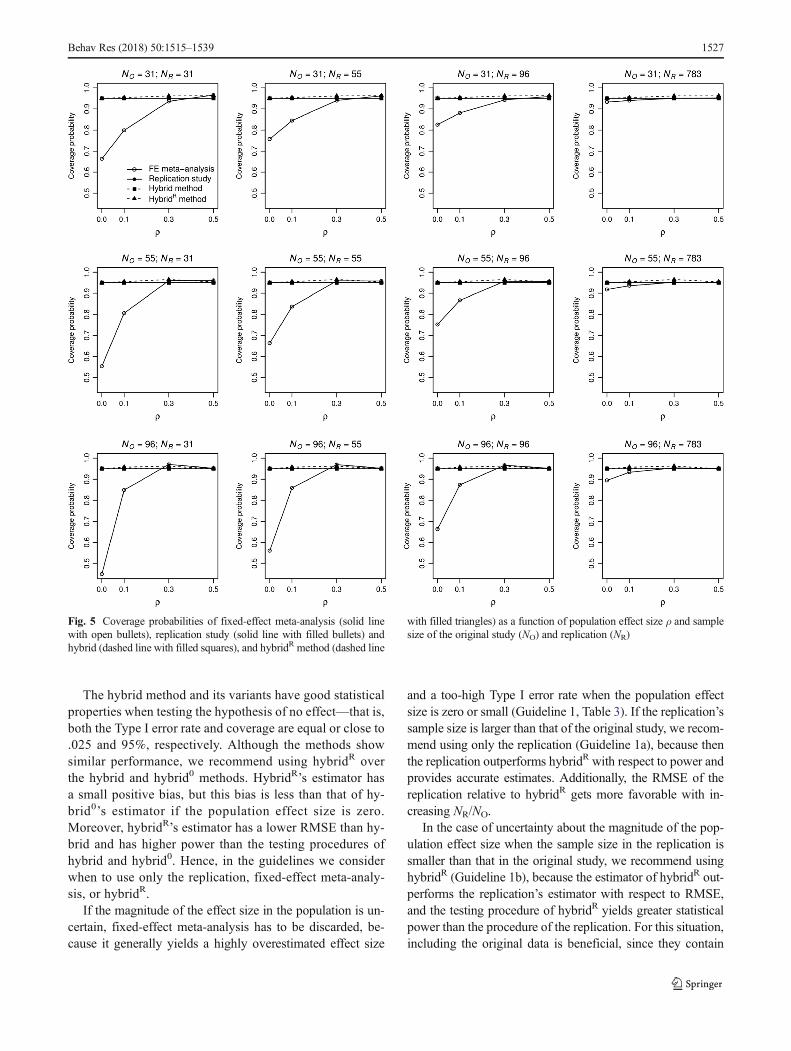
The hybrid method and its variants have good statisticalproperties when testing the hypothesis of no effect—that is,both the Type I error rate and coverage are equal or close to.025 and 95%, respectively. Although the methods showsimilar performance, we recommend using hybridR overthe hybrid and hybrid0 methods. HybridR’s estimator hasa small positive bias, but this bias is less than that of hy-brid0’s estimator if the population effect size is zero.Moreover, hybridR’s estimator has a lower RMSE than hy-brid and has higher power than the testing procedures ofhybrid and hybrid0. Hence, in the guidelines we considerwhen to use only the replication, fixed-effect meta-analy-sis, or hybridR.
If the magnitude of the effect size in the population is un-certain, fixed-effect meta-analysis has to be discarded, be-cause it generally yields a highly overestimated effect size
and a too-high Type I error rate when the population effectsize is zero or small (Guideline 1, Table 3). If the replication’ssample size is larger than that of the original study, we recom-mend using only the replication (Guideline 1a), because thenthe replication outperforms hybridR with respect to power andprovides accurate estimates. Additionally, the RMSE of thereplication relative to hybridR gets more favorable with in-creasing NR/NO.
In the case of uncertainty about the magnitude of the pop-ulation effect size when the sample size in the replication issmaller than that in the original study, we recommend usinghybridR (Guideline 1b), because the estimator of hybridR out-performs the replication’s estimator with respect to RMSE,and the testing procedure of hybridR yields greater statisticalpower than the procedure of the replication. For this situation,including the original data is beneficial, since they contain
Fig. 5 Coverage probabilities of fixed-effect meta-analysis (solid linewith open bullets), replication study (solid line with filled bullets) andhybrid (dashed line with filled squares), and hybridR method (dashed line
with filled triangles) as a function of population effect size ρ and samplesize of the original study (NO) and replication (NR)
Behav Res (2018) 50:1515–1539 1527

sufficient information to improve the estimation of effect sizerelative to using only the replication data. A drawback ofusing the hybridR method is that its Type I error rate is slightlytoo high (.037 vs. .025), but a slightly smaller α- level can beselected to decrease the probability of falsely concluding thatan effect exists. If information on the population effect size isknown on the basis of previous research, it is valuable toinclude this information in the analysis (akin to using an in-formative prior distribution in Bayesian analyses). If the pop-ulation effect size is suspected to be zero or small, we alsorecommend using hybridR (Guideline 2), because its estimatorthen has lower RMSE and only a small positive bias, and itstesting procedure has higher statistical power than the replica-tion. Fixed-effect meta-analysis should be abandoned in thiscase because its estimator overestimates zero and small pop-ulation effects.
Fixed-effect meta-analysis is recommended if a mediumor larger population effect size is expected (Guideline 3).Bias of the fixed-effect meta-analytic estimator is minor inthis case, but its RMSE is smaller, and the testing procedurehas a greater statistical power than of any other method. Animportant qualification of this guideline is the sample size ofthe original study, because bias is a decreasing function ofNO. If NO is small, the statistical power of the originalstudy’s testing procedure is small when the population ef-fect size is medium, and consequently the original’s effectsize estimate is generally too high. Hence, to be on the safeside, if expecting a medium population effect size in com-bination with a small sample size in the original study, onecan decide to use only the replication data (if NR > NO) orhybridR (if NR ≤ NO). When expecting a large populationeffect size and the main focus is not only on effect sizeestimation, but also on testing, fixed-effect meta-analysisis the optimal choice. However, if the ultimate goal of theanalysis is to get an unbiased estimate of the effect size, onlythe replication data should be used for the analysis: Thereplication is not published, and its effect size estimate istherefore not affected by publication bias. Of course, thereplication only provides an unbiased estimate if the re-search is conducted well—for instance, no questionable re-search practices were used.
Reproducibility Project: Psychology
The RPP was initiated to examine the reproducibility ofpsychological research (Open Science Collaboration,2015). Articles from three high-impact psychology journals(Journal of Experimental Psychology: Learning, Memory,and Cognition [JEP: LMC], Journal of Personality andSocial Psychology [JPSP], and Psychological Science[PSCI]) published in 2008 were selected to be replicated.The key effect of each article’s final study was replicatedaccording to a structured protocol, with the authors of theoriginal study being contacted for study materials andreviewing the planned study protocol and analysis plan toensure the quality of the replication.
A total of 100 studies were replicated in the RPP. Onerequirement for inclusion in our analysis was that thecorrelation coefficient and its standard error could becomputed for both the original study and the replication.This was not possible for 27 study pairs.11 Moreover,transforming the effect sizes to correlation coefficientsmay have biased the estimates of the hybrid method, sinceqO and qR might not exactly be uniformly distributed atthe true effect size due to the transformation. We exam-ined the influence of transforming effect sizes to correla-tion coefficients on the distributions of qO and qR, andconcluded that the transformation of effect size will hard-ly bias the effect size estimates of the hybrid method (seethe supplemental materials).
Another requirement for including a study pair in the analy-sis was that the original study had to be statistically significant,whichwas not the case for six studies. Hence, fixed-effect meta-analysis and the hybrid methods could be applied to 67 studypairs. The effect sizes of these study pairs and the results ofapplying fixed-effect meta-analysis and the hybrid methodsare available in Table 7 in the Appendix. For completeness,we present the results of all three hybrid methods. The resultsin Table 7 show that hybrid0 set the effect size to zero in 11study pairs (16.4%)—that is, where the hybrid’s effect size wasnegative—and that hybridR also yielded 11 studies with resultsdifferent from hybrid (16.4%); in five studies (7.5%), all threehybrid variants yielded different estimates.
Table 4 summarizes the resulting effect size estimates forreplication, fixed-effect meta-analysis, and the hybridmethods. For each method, the mean and standard deviationof the estimates and the percentage of statistically significantresults (i.e., p < .05) are presented. The columns in Table 4refer to the overall results or to the results grouped per jour-nal. Since PSCI is a multidisciplinary journal, the original
11 If the test statistics of the original study or replication were, for instance,F(df1 > 1, df2) or χ
2, the standard error of the correlation coefficient using theFisher transformation could not be computed, and fixed-effect meta-analysisand the hybrid methods could not be applied to these study pairs.
Table 3 Guidelines for applying which method to use whenstatistically combining an original study and replication
(1a) When uncertain about population effect size and sample size in thereplication is larger than in the original study (NR > NO), use only thereplication data.
(1b) When uncertain about population effect size and the sample size inthe replication is equal or smaller than in the original study (NR ≤ NO),use hybridR.
(2) When suspecting zero or small population effect size, use hybridR
(3) When suspecting medium or larger population effect size, usefixed-effect meta-analysis.
1528 Behav Res (2018) 50:1515–1539

studies published in PSCI were classified as belonging tocognitive or social psychology, as in Open ScienceCollaboration (2015).
The estimator of fixed-effect meta-analysis yielded thelargest average effect size estimate (0.322) and the highestpercentage of statistically significant results (70.1%). Welearned from the previous section to distrust these highnumbers when we are uncertain about the true effect size,particularly in combination with a small sample size in theoriginal study. The estimator of the replication yielded onaverage the lowest effect size estimates (0.199), with only34.3% of cases in which the null hypothesis was rejected.The estimators of the hybrid variants yielded a higher aver-age estimate (0.250–0.268), with an equal (hybridR) or alower (hybrid and hybrid0) percentage rejecting the nullhypothesis of no effect, relative to simple replication. Thelower percentage of rejections of the null hypothesis by thehybrid methods is caused not only by the generally lowereffect size estimates, but also by the much higher uncertain-ty of these estimates. The methods’ uncertainty values,expressed by the average widths of the confidence intervals,were 0.328 (fixed-effect meta-analysis), 0.483 (replication),0.648 (hybrid), 0.615 (hybrid0), and 0.539 (hybridR). Thehigher uncertainty from the hybrid methods than from thereplications demonstrates that controlling for the signifi-cance of the original study may come at a high cost (i.e.,an increase in uncertainty relative to estimation by the rep-lication only), particularly when the ratio of the replication’sto the original’s sample size gets larger.
If we apply our guidelines to the data of the RPP andsuppose that we are uncertain about the population effectsize (Guidelines 1a and 1b in Table 3), only the replicationdata are interpreted in 43 cases, because NR > NO, andhybridR is applied 24 times (NO ≥ NR). The average effect
size estimate of the replication’s estimator with NR > NO islower than that of the fixed-effect meta-analytic estimator(0.184 vs. 0.266), and the number of statistically significantpooled effect sizes is also lower (34.9% vs. 55.8%). Theaverage effect size estimate of hybridR’s estimator appliedto the subset of 24 studies with NO ≥ NR is also lower thanthat of the fixed-effect meta-analytic estimator (0.375 vs.0.421), and the same holds for the number of statisticallysignificant results (54.2% vs. 95.8%).
The results per journal show higher effect size estimates andmore rejections of the null hypothesis of no effect for cognitivepsychology (JEP: LMC and PSCI: cog.) than for social psy-chology (JPSP and PSCI: soc.), independent of the method.The estimator of fixed-effect meta-analysis yielded higher es-timates, and the null hypothesis was more often rejected thanwith the other methods. The estimates of the replication werealways lower than those of the hybrid methods. The numbersof statistically significant results of hybrid and hybrid0 wereequal to or lower than with replication, whereas the number ofstatistically significant results of hybridR was equal to or higherthan with either hybrid or hybrid0. Particularly striking are thelow numbers of statistically significant results for JPSP: 16.7%(hybridR) and 11.1% (replication, hybrid, and hybrid0).
We also computed a measure of association, to examinehow often the methods yielded the same conclusions withrespect to the test of no effect, for all study pairs both togetherand grouped per journal. Since this resulted in a dichotomousvariable, we used Loevinger’s H (Loevinger, 1948) as themeasure of association. Table 5 shows Loevinger’s H of thereplication as compared to each other method for all 67 studypairs. The associations between fixed-effect meta-analysis,hybrid, hybrid0, and hybridR were perfect (H = 1), implyingthat a hybrid method only rejected the null hypothesis if fixed-effect meta-analysis did as well. The associations of the
Table 4 Summary results of effect size estimates and percentages of times the null hypothesis of no effect was rejected of fixed-effect meta-analysis(FE), replication, hybrid, hybridR, and hybrid0 methods to 67 studies of the Reproducibility Project: Psychology
Overall JEP: LMC JPSP PSCI: Cog. PSCI: Soc.
Number of study pairs 67 20 18 13 16
Mean (SD) FE 0.322 (0.229) 0.416 (0.205) 0.133 (0.083) 0.464 (0.221) 0.300 (0.241)
Replication 0.199 (0.280) 0.291 (0.264) 0.026 (0.097) 0.289 (0.365) 0.206 (0.292)
Hybrid 0.250 (0.263) 0.327 (0.287) 0.071 (0.087) 0.388 (0.260) 0.245 (0.275)
Hybrid0 0.266 (0.242) 0.353 (0.237) 0.080 (0.075) 0.400 (0.236) 0.257 (0.259)
HybridR 0.268 (0.254) 0.368 (0.241) 0.083 (0.093) 0.394 (0.272) 0.247 (0.271)
%Significant results(i.e., p value < .05)
FE 70.1% 90% 44.4% 92.3% 56.2%
Replication 34.3% 50% 11.1% 46.2% 31.2%
Hybrid 28.4% 45% 11.1% 30.8% 25%
Hybrid0 28.4% 45% 11.1% 30.8% 25%
HybridR 34.3% 55% 16.7% 38.5% 25%
% Significance was based on two-tailed p values; JEP: LMC = Journal of Experimental Psychology: Learning, Memory, and Cognition; JPSP = Journalof Personality and Social Psychology; PSCI: cog. = Psychological Science cognitive psychology; PSCI: soc. = Psychological Science social psychology
Behav Res (2018) 50:1515–1539 1529

replication with hybrid, hybrid0, and hybridR were .519, .519,and .603, respectively.
To conclude, when correcting for the statistical signifi-cance of the original study, the estimators of the hybridmethods on average provided smaller effect size estimatesthan did the fixed-effect meta-analytic estimator. The uncer-tainty of the hybrid estimators (the width of the confidenceinterval) was invariably larger than that of the fixed-effectmeta-analytic estimator, which together with their lower es-timates explain the hybrids’ lower percentages of rejectionsof the null hypothesis of no effect. If a hybridmethod rejectedthe null hypothesis, this hypothesis was also rejected byfixed-effect meta-analysis, but not the other way around.This suggests that the testing procedures of the hybridmethods are primarily more conservative than the testingprocedure of fixed-effect meta-analysis. As compared tothe replication alone, the hybrid methods’ estimators on av-erage provided somewhat larger effect sizes, but higher un-certainties, with similar percentages reflecting how often thenull hypothesis of no effect was rejected. The results of thehybrid methods were more in line with those of only thereplication thanwith the results of fixed-effectmeta-analysisor the original study.
Discussion
One of the pillars of science is replication; does a findingwithstand replication in similar circumstances, or can theresults of a study generalized across different settings andpeople, and do the results persist over time? According toPopper (1959/2005), replications are the only way to con-vince ourselves that an effect really exists and is not a falsepositive. The replication issue is particularly relevant in psy-chology, which shows an unrealistically high rate of positivefindings (e.g., Fanelli, 2012; Sterling et al., 1995). The RPP(OpenScienceCollaboration, 2015) replicated100 studies inpsychology and confirmed these unrealistic findings; lessthan 40% of original findings were statistically significant.
The present article examined several methods for estimatingand testing effect size combining a statistically significanteffect size of theoriginal study andeffect size of a replication.By approximating analytically the joint probability densityfunction of original study and replication effect sizewe showthat the estimator of fixed-effect meta-analysis yieldsoverestimated effect size, particularly if the population effectsize is zeroor small, andyields a toohighType I error rate.Wedeveloped a new method, called hybrid, which takes intoaccount that the expected value of the statistically significantoriginal study is larger than the population effect size, andenables point and interval estimation, andhypothesis testing.The statistical properties of hybrid and twovariants of hybridare examined and compared to fixed-effect meta-analysisand to using only replication data. On the basis of this com-parison, we formulated guidelines for when to use whichmethod to estimate effect size.Allmethodswere also appliedto the data of the RPP.
The hybrid method is based on the statistical principlethat the distribution of p values at the population effect sizehas to be uniform. Since positive findings are overrepresent-ed in the literature, the method computes probabilities at thepopulation effects size for both the original study and repli-cation in which likely overestimation of the original study istaken into account. The hybrid method showed good statis-tical properties (i.e., Type I error rate equal to α- level, cov-erage probabilities matching the nominal level, and medianeffect size estimate equal to the population effect size) whenits performance was analytically approximated. However,hybrid’s estimator is slightly negatively biased if the meanof the (conditional) probabilities was close to 1. This nega-tive bias was also observed in another meta-analytic method(p-uniform) using conditional probabilities. To correct forthis bias, we developed two alternative methods (hybrid0
and hybridR) that do not suffer from these highly negativeestimates and have the same desirable statistical propertiesas the hybrid method. We recommend using the hybridR
method among the three hybrid variants because its estima-tor is least biased, its RMSE is lower than hybrid’s estimator,and hybridR’s testing procedure has the most statisticalpower.
We formulated guidelines (see Table 3) to help researchersselect the most appropriate method when combining an orig-inal study and replication. The first two guidelines supposethat a researcher does not have knowledge about the magni-tude of the population effect size. In this case, we advise to useonly the replication data if the original study’s sample size issmaller than of the replication and to use the hybridRmethod ifthe sample size in the original study is larger or equal to thesample size of the replication. The hybridR method is alsorecommended to be used if the effect size in the populationis expected to be either absent or small. Fixed-effect meta-analysis has the best statistical properties and is advised to
Table 5 Loevinger’s H across all 67 studies of all methods’ results ofhypothesis testing
FE Hybrid Hybrid0 HybridR
Replication 1 .519 .519 .603
FE 1 1 1
Hybrid 1 1
Hybrid0 1
HybridR
JEP: LMC = Journal of Experimental Psychology: Learning, Memory,and Cognition; JPSP = Journal of Personality and Social Psychology;PSCI: cog. = Psychological Science, cognitive psychology; PSCI: soc. =Psychological Science, social psychology
1530 Behav Res (2018) 50:1515–1539

be used if the expected population effect size is medium orlarge. To prevent researchers from selecting a method on thebasis of its results (Bp-hacking^), we recommend selecting themethod using our guidelines before analyzing the data.
Applying the hybrid methods to studies of RPP largelyconfirmed the results of only the replication study as reportedby the Open Science Collaboration (2015). Average effect sizeand proportion of statistically significant effects was consid-erably larger for fixed-effect meta-analysis than for the othermethods, providing indirect evidence of overestimation byfixed-effect meta-analysis. The results suggest that many find-ings published in the three included psychology journals havesmaller effect sizes than reported and that some effects mayeven be absent. In addition, uncertainty of the estimates of thehybrid methods was generally high, meaning that discardingthe original studies generally made effect size estimates moreprecise. We draw two general conclusions from our reanalysisof the RPP. First, estimates of only the replication and thehybrid methods are generally more accurate than both theoriginal study and fixed-effect meta-analysis that tend to over-estimate because of publication bias. Second, most estimatesof the replication and the hybrid methods were too uncertainto draw strong conclusions on the magnitude of the effectsize—that is, sample sizes were too small to provide preciseestimates. These two conclusions are in line with a Bayesianre-analysis of the RPP (Etz & Vandekerckhove, 2016).
The effect size estimates of the hybrid methods can also beused to estimate the power of the original study, on the basis ofhybrid’s effect size estimate. This alternative calculation of so-called ‘observed power’ has the advantage that it is based onevidence of both the original study and the replication. Theobserved power of the original study may be interpreted as anindex of the statistical quality of the original study, with valuesof .8 or higher signaling good quality (Cohen, 1990).However, we recommend caution in interpreting this alterna-tive observed value, because it is imprecise particularly whenboth studies’ sample sizes is low. To work out an example ofthis approach we applied it to the example in the introductionand Table 1. Following our guidelines in Table 3, we use thereplication’s effect size estimate equal to d = 0.164 in combi-nation with the original sample size equal to 80 for our poweranalysis. Entering these numbers in G*Power 3.1.9.2 (Faul,Erdfelder, Lang, & Buchner, 2007) yields a power equal to .18of a one-tailed t test (α = .05), suggesting that the originalstudy had low statistical quality.
We developed R code12 and aWeb-based application thatenables researchers to apply the hybrid methods, as well asfixed-effect meta-analysis, to their own data (https://rvanaert.shinyapps.io/hybrid). Although the hybrid
methods can in principle be applied to any effect sizemeasure, the software can currently be applied to threedifferent effect size measures: one-sample mean, two-independent means, and correlation coefficients. For the ef-fect size measures one-sample mean and two-independentmeans, Hedges’ g effect sizes and their sampling variancesare computedby the software before themethods are applied.This is the same procedure illustrated when we applied thehybrid method to the example in the introduction. If correla-tion coefficients are used as the effect size measure (as wasthe case in the application to the RPP data), the software firsttransforms the correlation coefficients to Fisher-transformedcorrelation coefficients and computes the correspondingsampling variances. The Fisher-transformed correlation co-efficients and their sampling variances are then used for ap-plying the methods, where the output provides the back-transformed correlation coefficients. Figure 6 shows ascreenshot of the application after it was applied to the exam-ple presented in the introduction. Data for one-sample meanand two-independent means can be entered via either groupmeans, sample sizes, and standard deviations or t values andsample sizes. Users should also specify the α- level and thedirection of the hypothesis test that was used in the primarystudies. The right-hand side of the Web application presentsthe results (showing the estimate, test statistic [t value, z val-ue, or x], two-tailed p value, and confidence interval) of hy-brid, hybrid0, hybridR, fixed-effect meta-analysis, and thereplication. The application includes a link to a short manualon how to use the application.
Thehybridmethods assume that researchers have selectedstatistically significant original findings to replicate. The ex-pected value of a statistically significant finding exceeds thepopulation effect size, irrespective of publication bias, andthe hybridmethod corrects for this overestimation. A criticalquestion is how to estimate effect size if a researcherwants toreplicate a statistically significant original study, but thisstudy was not selected because of its significance. How toproceed in this case depends on the existence of publicationbias. If no publication bias exists in the study’s field, fixed-effect meta-analysis is the optimal method to combine anoriginal study and replication, assuming that both estimatethe same underlying true effect size. However, if strong pub-lication bias exists, as seems to be the case in psychology, theliterature rather than the researcher has alreadymainly select-ed the statistically significant findings. Thus, even thoughresearchers did not select a study to replicate on the basis ofits being statistically significant, we recommend applyingthe presented guidelines (Table 3) because the literaturemainly presents significant and overestimated effect sizeestimates.
Another assumption of the hybrid methods is that a com-mon effect (i.e., a fixed effect) underlies the original study andreplication. This assumption can be violated if there are
12 An R function (called hybrid) for applying the different hybrid methods isincluded in the Bpuniform^ package and can be installed by running the fol-lowing code: devtools::install_github(BRobbievanAert/puniform^).
Behav Res (2018) 50:1515–1539 1531

substantial discrepancies between the original study and rep-lication. These discrepancies may be caused by differences inthe methodologies used in both studies (Gilbert, King,Pettigrew, & Wilson, 2016). Discrepancies may also becaused by findings that can only be replicated under specificconditions and that do not generalize to different settings orsubjects, or that do not persist over time (Amir & Sharon,1990; Henrich, Heine, & Norenzayan, 2010; Klein et al.,2014; S. Schmidt, 2009). Although the assumption of homo-geneity in effect sizes can be tested in a meta-analysis, it isdifficult to draw reliable inferences in the case of only twostudies. The Q test, which is used for testing homogeneity,lacks statistical power if the number of studies in a meta-analysis is small (e.g., Borenstein et al., 2009, chap. 16;Jackson, 2006).
We will extend the hybrid methods such that they caninclude more than one original study and one replication.These extended hybrid methods can be applied if, for in-stance, a researcher replicates a finding on which multiple
original studies or a meta-analysis has already been pub-lished. These variants would use only the statistically signif-icant findings of theoriginal studies ormeta-analysis, as doesp-uniform (van Aert et al., 2016, 2015), and would combinethese with the replication finding(s) to estimate common ef-fect size.
An important implication of our analysis is that it may beoptimal to discard information of the original study whenestimating effect size. This is the case when being uncertainabout population effect size and sample size in the replicationis larger than in the original study, a situation that occurs veryfrequently. For instance, the sample size of 70 out of 100replications in RPP is larger in the replication than in theoriginal study. This implication may be generalized whenmultiple original studies and one replication are combined.Fixed-effect meta-analyses overestimate particularly if theyincorporate more original studies with a relatively small sam-ple size, and accuracy of estimation is better served by one orfew large studies (Button et al., 2013; Gerber, Green, &
Fig. 6 Screenshot of the Web-based application, showing the results of applying the hybrid variants, fixed-effect meta-analysis, and replication to theexemplary data presented in the introduction
1532 Behav Res (2018) 50:1515–1539

Nickerson, 2001; Kraemer, Gardner, Brooks, & Yesavage,1998; Nuijten, van Assen, Veldkamp, & Wicherts, 2015).We contend that extended hybrid methods, although theycan correct for probable overestimation by original studies inthe meta-analysis, their accuracy and precision is better servedbymore replication studies. Discarding all original studies andestimation by only one or a few large replication studies mayeven be the optimal choice (Nuijten et al., 2015). Omittingbiased original studies from a meta-analysis is not a researchwaste since the effect size estimate will become moreaccurate.
The present study has several limitations that offer oppor-tunities for future research. First, at present the hybrid meth-od only allows for estimation based on one original and onereplication study. We plan to extend the hybrid method toincorporate multiple original and replication studies, and toexamine its performance as a function of true effect size,publication bias, and the number of studies and their samplesizes. Second, p-hacking or questionable research practicesdistort the distribution of p values, and therefore also ofconditional probabilities (Bruns & Ioannidis, 2016;Simonsohn et al., 2014a; Ulrich & Miller, 2015; van Aertet al., 2016, 2015), which will bias the effect size estimatesof the hybrid methods. However, note that the results oftraditional meta-analytic methods are also distorted by p-hacking. Future research may examine to what extent theresults of the hybrid methods become biased due to p--hacking. A third limitation is that the performance of hybridmethods relative to other methods is dependent on thestrength of the population effect, which is the object of theresearch. The guidelineswe propose in Table 3 acknowledgethis fact by advising the researcher what to do if the magni-tude of the population effect size is uncertain. We must note,however, that the guidelines are formulated in the context ofsample sizes presently used in psychological research. Theguidelines lose their practical relevance if the sample size ofthe original study and replication allow for accurate effectsize estimation in both studies. For instance, if original andreplication sample sizes are 2,000 and 2,050, respectively, itwould be naive to discard the original study and only use thereplication for interpretation (Guideline 1a, Table 3). In thatcase, fixed-effect meta-analysis is the recommended meth-od, because overestimation due to publication bias is verysmall at worst.
The unrealistically high rate of statistically significantresults in the published psychological literature suggeststhat the literature is distorted with false-positive resultsand overestimated effect sizes. Replication research and sta-tistically combining these replications with the publishedresearch via meta-analytic techniques can be used to gatherinsight into the existence of true effects. However, tradition-al meta-analytic techniques generally yield overestimatedeffect sizes. We developed hybrid meta-analytic methods
and have demonstrated their good statistical properties.We have also proposed guidelines for conducting meta-analysis by combining the original study and replicationand provided a Web application (https://rvanaert.shinyapps.io/hybrid) that estimates and tests the effectsizes of all methods described in this article. Applying thehybrid methods and our guidelines for meta-analyzing anoriginal study and replication will give better insight intopsychological phenomena by accurately estimating their ef-fect sizes.
Author note The preparation of this article was supported byGrant No. 406-13-050 from the Netherlands Organization forScientific Research. We thank Hilde Augusteijn, MarjanBakker, Chris Hartgerink, Michèle Nuijten, CoosjeVeldkamp, and Jelte Wicherts for their valuable commentson an earlier draft of this article.
Appendix
Table 6 Effect size estimates and standard deviations of this estimate inbrackets for the estimators of fixed-effect meta-analysis, replication studyand hybrid, hybrid0, and hybridR method as a function of populationeffect size ρ and sample size of the original study (NO)
ρ NR = 783
NO = 31 NO = 55 NO = 96
FE 0 .015 (.034) .02 (.033) .026 (.032)
.1 .112 (.034) .115 (.033) .116 (.032)
.3 .306 (.031) .305 (.031) .302 (.03)
.5 .501 (.026) .5 (.026) .5 (.025)
Replication 0 0 (.036) 0 (.036) 0 (.036)
.1 .1 (.035) .1 (.035) .1 (.035)
.3 .3 (.032) .3 (.032) .3 (.032)
.5 .5 (.027) .5 (.027) .5 (.027)
Hybrid 0 – .001 (.047) – .001 (.046) – .001 (.045)
.1 .099 (.047) .099 (.045) .099 (.044)
.3 .299 (.042) .299 (.04) .299 (.036)
.5 .499 (.033) .499 (.031) .499 (.028)
Hybrid0 0 .019 (.027) .018 (.026) .018 (.025)
.1 .099 (.046) .099 (.044) .099 (.043)
.3 .299 (.042) .299 (.04) .299 (.036)
.5 .499 (.033) .499 (.031) .499 (.028)
HybridR 0 .013 (.039) .013 (.039) .012 (.038)
.1 .112 (.038) .112 (.038) .111 (.036)
.3 .309 (.035) .306 (.034) .303 (.033)
.5 .503 (.03) .5 (.03) .499 (.028)
The sample size of the replication (NR) is 783
Behav Res (2018) 50:1515–1539 1533

Tab
le7
Dataof
theReproducibilityProject:Psychology
andtheresults
ofapplying
fixed-effectmeta-analysisandthehybrid,hybrid0,and
hybrid
Rmethods
tothesedata
Study
r o(N
O)[p
Value]
r r(N
R)[p
Value]
FEMA(95%
CI)[p
Value]
Hybrid(95%
CI)[p
Value]
HybridR
(95%
CI)[p
Value]
Roelofs(2008)
.595
(15)[.0
18]
.148
(30)[.437]
.304
(0;.557)
[.0498]
.176
(–.347;.615)
[.328]
.176
(–.347;.615)
[.328]
MorrisandStill
(2008)
.611
(25)[.001]
.23(25)[.2
73]
.44(.175;
.646)[.0
02]
.405
(.054;
.698)[.024]
.405
(.054;
.698)[.0
24]
Liefooghe,B
arrouillet,Vandierendonck,
andCam
os(2008)
.425
(26)[.0
3]–.215(33)[.231]
.073
(–.194;.33)[.594]
–.208(–.755;.311)
[.275]
0–.215(–.52;
.138)[.231]
Storm,B
jork,and
Bjork
(2008)
.229
(192)[.001]
–.006(270)[.92]
.093
(.001;
.183)[.047]
.077
(–.055;.276)
[.322]
.077
(–.055;.276)
[.322]
Mitchell,
Nash,andHall(2008)
.461
(33)[.0
06]
.135
(49)[.358]
.272
(.054;
.465)[.015]
.217
(–.04;
.534)[.093]
.217
(–.04;
.534)[.0
93]
Berry,S
hanks,andHenson(2008)
.595
(25)[.0
01]
.396
(33)[.022]
.487
(.254;
.666)[<.001]
.47(.218;
.687)[.0
01]
.47(.218;
.687)[.001]
Beaman,N
eath,and
Surprenant(2008)
.715
(101)[<.001]
.131
(16)[.317]
.668
(.552;
.759)[<.001]
.6(–.078;.751)
[.1]
.6(–.078;.751)
[.1]
Dodson,Darragh,and
Williams(2008)
.561
(39)[<.001]
–.111(33)[.5
43]
.287
(.055;
.491)[.016]
.232
(–.245;.641)
[.535]
.232
(–.245;.641)
[.535]
Ganor-Stern
andTzelgov
(2008)
.699
(30)[<.001]
.781
(31)[<.001]
.743
(.6;
.84)
[<.001]
.743
(.599;
.838)[<.001]
.743
(.599;
.838)[<.001]
Mirman
andMagnuson(2008)
.672
(23)[<.001]
.466
(31)
[.007]
.561
(.338;
.725)[<.001]
.558
(.318;
.755)[<.001]
.558
(.318;
.755)[<.001]
J.R.S
chmidtand
Besner(2008)
.195
(96)[.0
28]
.247
(243)[<.001]
.233
(.129;
.331)[<.001]
.19(–.373;.304)
[.321]
.247
(.125;
.361)[<.001]
Oberauer(2008)
.56(33)[.001]
.402
(21)[.071]
.505
(.266;
.685)[<.001]
.482
(.204;
.666)[.002]
.482
(.204;
.666)[.0
02]
Sahakyan,D
elaney,and
Waldum
(2008)
.224
(96)[.0
28]
.019
(108)[.842]
.117
(–.022;.251)
[.099]
.004
(–.397;.198)
[.96]
.019
(–.17;
.208)[.8
42]
Bassok,Pedigo,and
Oskarsson
(2008)
.364
(154)[<.001]
.284
(50)[.045]
.345
(.217;
.462)[<.001]
.335
(.175;
.444)[.001]
.335
(.175;
.444)[.0
01]
Yap,B
alota,Tse,andBesner(2008)
.378
(33)[.0
29]
.38(72)[.0
01]
.379
(.199;
.534)[<.001]
.294
(–.689;.482)
[.345]
.38(.162;
.562)[.001]
Turk-Browne,Isola,S
choll,andTreat(2008)
.738
(9)[.021]
.704
(16)[.002]
.715
(.42;.873)
[<.001]
.626
(–.635;.84)[.169]
.626
(–.635;.84)[.1
69]
White(2008)
.623
(38)[<.001]
.481
(39)[.002]
.555
(.374;
.695)[<.001]
.554
(.362;
.701)[<.001]
.554
(.362;
.701)[<.001]
Farrell(2008)
.517
(41)[<.001]
.316
(41)[.044]
.422
(.221;
.588)[<.001]
.408
(.179;
.603)[.001]
.408
(.179;
.603)[.0
01]
Pacton
andPerruchet(2008)
.714
(22)[<.001]
.682
(22)[<.001]
.698
(.497;
.828)[<.001]
.696
(.508;
.816)[<.001]
.696
(.508;
.816)[<.001]
Makovski,Su
ssman,and
Jiang(2008)
.551
(13)[.0
499]
.35(19)[.1
44]
.433
(.079;
.69)
[.018]
–.312(–1;
.505)[.8
65]0
.35(–.124;.694)
[.144]
Payne,Burkley,and
Stokes
(2008)
.352
(69)[.0
03]
.15(178)[.045]
.208
(.084;
.325)[.001]
.202
(.067;
.419)[.006]
.202
(.067;
.419)[.0
06]
Cox
etal.(2008)
.225
(94)[.0
29]
–.052(194)[.469]
.039
(–.078;.154)
[.517]
–.055(–.425;.169)
[.439]0
–.052(–.192;.089)
[.469]
Albarracínetal.(2008)
.378
(36)[.0
22]
–.03
(88)[.779]
.089
(–.091;.263)
[.332]
–.013(–.373;.36)[.894]
0–.013(–.373;.36)[.894]
Centerbar,S
chnall,
Clore,and
Garvin(2008)
.206
(133)[.017]
.094
(113)[.323]
.155
(.03;.275)
[.015]
.092
(–.114;.242)
[.258]
.092
(–.114;.242)
[.258]
Amodio,D
evine,andHarmon-Jones
(2008)
.377
(33)[.0
3].077
(75)[.514]
.169
(–.023;.35)[.084]
.04(–.707;.3)
[.728]
.077
(–.153;.298)
[.514]
vanDijk
,van
Kleef,S
teinel,and
vanBeest(2008)
.379
(101)[<.001]
–.042(40)[.798]
.271
(.109;
.419)[.001]
.211
(–.166;.442)
[.363]
.211
(–.166;.442)
[.363]
Lem
ayandClark
(2008)
.167
(184)[.023]
.037
(280)[.541]
.089
(–.003;.179)
[.057]
.033
(–.183;.163)
[.536]
.033
(–.183;.163)
[.536]
Ersner-Hershfield,Mikels,Su
llivan,and
Carstensen(2008)
.22(110)[.021]
–.005(222)[.9
44]
.07(–.038;.177)
[.205]
.008
(–.188;.215)
[.894]
.008
(–.188;.215)
[.894]
Correll(2008)
.274
(70)[.0
21]
.074
(147)[.375]
.139
(.005;
.268)[.042]
.072
(–.244;.27)[.378]
.072
(–.244;.27)[.3
78]
Exline,Baumeister,Z
ell,Kraft,and
Witvliet(2008)
.432
(43)[.0
03]
.012
(133)[.894]
.117
(–.033;.262)
[.125]
.111
(–.07;
.508)[.266]
.111
(–.07;
.508)[.266]
Risen
andGilo
vich
(2008)
.186
(118)[.044]
.003
(224)[.964]
.066
(–.041;.172)
[.224]
–.065(–.979;.077)
[.413]0
.003
(–.128;.134)
[.964]
StanovichandWest(2008)
.222
(375)[<.001]
.073
(177)[.332]
.175
(.093;
.255)[<.001]
.16(.016;
.26)
[.028]
.16(.016;
.26)
[.028]
Blankenship
andWegener
(2008)
.208
(259)[.001]
.044
(249)[.485]
.129
(.042;
.213)[.004]
.114
(–.007;.25)[.0
66]
.114
(–.007;.25)[.066]
Shnabeland
Nadler(2008)
.268
(92)[.0
09]
–.102(139)[.2
34]
.047
(–.083;.176)
[.48]
–.02
(–.186;.309)
[.861]
0–.02
(–.186;.309)
[.861]
Goff,Steele,and
Davies(2008)
.396
(53)[.0
03]
.013
(49)[.929]
.22(.024;
.4)[.028]
.156
(–.114;.468)
[.277]
.156
(–.114;.468)
[.277]
Murray,Derrick,L
eder,and
Holmes
(2008)
.317
(85)[.0
03]
–.135(70)[.266]
.119
(–.041;.273)
[.144]
.037
(–.228;.379)
[.856]
.037
(–.228;.379)
[.856]
McC
rea(2008)
.344
(28)[.0
36]
.29(61)[.0
12]
.306
(.101;
.487)[.004]
.179
(–.926;.41)[.545]
.29(.041;
.505)[.023]
Purdie-Vaughns,S
teele,Davies,Ditlmann,
andCrosby(2008)
.378
(75)[.0
01]
–.037(1488)
[.154]
–.017(–.066;.033)
[.506]
.018
(–.057;.448)
[.879]
.018
(–.057;.448)
[.879]
Dessalegn
andLandau(2008)
.382
(36)[.0
21]
–.223(47)[.133]
.043
(–.179;.26)[.707]
–.153(–.44;
.374)[.42]0
–.153(–.44;
.374)[.42]
Eitam,H
assin,andSchul(2008)
.222
(86)[.0
39]
–.105(158)[.19]
.010
(–.116;.136)
[.874]
–.146(–.889;.039)
[.094]0
–.105(–.257;.052)
[.19]
Farris,T
reat,V
iken,and
McFall(2008)
.554
(280)[<.001]
.091
(144)[.278]
.418
(.335;
.494)[<.001]
.385
(.027;
.585)[.019]
.385
(.027;
.585)[.0
19]
Janiszew
skiand
Uy(2008)
.333
(57)[.0
11]
.226
(118)[.014]
.261
(.116;
.395)[.001]
.226
(0;.392)
[.0501]
.226
(0;.392)
[.0501]
McK
instry,D
ale,andSp
ivey
(2008)
.701
(11)[.014]
.75(11)[.006]
.727
(.407;
.888)[<.001]
.666
(–.171;.868)
[.079]
.666
(–.171;.868)
[.079]
Arm
or,M
assey,andSackett(2008)
.681
(126)[<.001]
.764
(177)[<.001]
.732
(.675;
.78)
[<.001]
.728
(.643;
.787)[<.001]
.728
(.643;
.787)[<.001]
1534 Behav Res (2018) 50:1515–1539

Tab
le7
(contin
ued)
Study
r o(N
O)[p
Value]
r r(N
R)[p
Value]
FEMA(95%
CI)[p
Value]
Hybrid(95%
CI)[p
Value]
HybridR
(95%
CI)[p
Value]
Addis,W
ong,andSchacter
(2008)
.571
(32)[<.001]
.653
(32)[<.001]
.613
(.428;
.749)[<.001]
.61(.409;
.742)[<.001]
.61(.409;
.742)[<.001]
NurmsooandBloom
(2008)
.502
(33)[.0
03]
–.45
(10)[.199]
.341
(.033;
.59)
[.031]
.068
(–.649;.586)
[.903]
.068
(–.649;.586)
[.903]
Vul
andPashler(2008)
.288
(174)[<.001]
.323
(141)[<.001]
.303
(.199;
.401)[<.001]
.303
(.204;
.394)[<.001]
.303
(.204;
.394)[<.001]
Masicam
poandBaumeister
(2008)
.214
(113)[.023]
–.049(160)[.54]
.061
(–.059;.179)
[.322]
–.032(–.237;.2)
[.661]
0–.032(–.237;.2)
[.661]
HajcakandFo
ti(2008)
.38(31)[.017]
.25(43)[.0
53]
.305
(.077;
.503)[.009]
.23(–.191;.464)
[.157]
.23(–.191;.464)
[.157]
Alvarez
andOliv
a(2008)
.722
(9)[.026]
.923
(18)[<.001]
.887
(.754;
.951)[<.001]
.847
(–.865;.948)
[.261]
.923
(.801;
.971)[<.001]
Lau,K
ay,and
Spencer(2008)
.384
(36)[.0
2]–.034(70)[.779]
.11(–.085;.297)
[.268]
–.003(–.309;.384)
[.98]
0–.003(–.309;.384)
[.98]
Winaw
er,H
uk,and
Boroditsky
(2008)
.685
(30)[<.001]
.527
(27)[.004]
.617
(.418;
.759)[<.001]
.613
(.392;
.761)[<.001]
.613
(.392;
.761)[<.001]
Nairne,Pandeirada,and
Thompson
(2008)
.446
(25)[.0
25]
.423
(39)[.007]
.432
(.202;
.617)[<.001]
.338
(–.552;.563)
[.245]
.338
(–.552;.563)
[.245]
LarsenandMcK
ibban(2008)
.21(117)[.023]
.5(236)[<.001]
.413
(.322;
.496)[<.001]
.382
(–.223;.537)
[.209]
.382
(–.223;.537)
[.209]
VohsandSchooler
(2008)
.498
(30)[.0
04]
.102
(58)[.446]
.244
(.032;
.434)[.024]
.209
(–.039;.578)
[.098]
.209
(–.039;.578)
[.098]
Halevy,Bornstein,and
Sagiv(2008)
.769
(78)[<.001]
.653
(38)[<.001]
.736
(.638;
.811)[<.001]
.726
(.573;
.806)[<.001]
.726
(.573;
.806)[<.001]
Janssen,Alario,andCaram
azza
(2008)
.65(16)[.005]
.497
(13)[.085]
.588
(.26;.795)
[.001]
.529
(.109;
.768)[.021]
.529
(.109;
.768)[.0
21]
Bressan
andStranieri(2008)
.189
(196)[.008]
–.03
(261)[.628]
.064
(–.028;.155)
[.171]
.023
(–.093;.221)
[.715]
.023
(–.093;.221)
[.715]
Bressan
andStranieri(2008)
.189
(196)[.008]
.018
(316)[.746]
.084
(–.003;.17)[.058]
.055
(–.048;.221)
[.284]
.055
(–.048;.221)
[.284]
Fortiand
Hum
phreys
(2008)
.723
(15)[.0
02]
.208
(20)[.385]
.463
(.136;
.699)[.007]
.424
(0;.804)
[.0501]
.424
(0;.804)
[.0501]
Schnall,Benton,andHarvey(2008)
.4(43)[.007]
.003
(126)[.975]
.106
(–.047;.254)
[.176]
.078
(–.1;.463)
[.403]
.078
(–.1;.463)
[.403]
Palm
erandGhose
(2008)
.86(9)[.002]
.12(9)[.768]
.608
(.139;
.854)[.014]
.516
(–.211;.917)
[.172]
.516
(–.211;.917)
[.172]
Heine,B
uchtel,and
Norenzayan(2008)
.43(70)[<.001]
.11(16)[.69]
.383
(.182;
.553)[<.001]
.327
(–.101;.517)
[.122]
.327
(–.101;.517)
[.122]
Moeller,Robinson,andZabelina(2008)
.31(53)[.023]
–.034(72)[.778]
.114
(–.065;.286)
[.21]
–.019(–.354;.287)
[.847]0
–.019(–.354;.287)
[.847]
Goschke
andDreisbach
(2008)
.375
(40)[.0
17]
.411
(95)[<.001]
.401
(.247;
.535)[<.001]
.358
(–.16;
.504)[.11]
.358
(–.16;
.504)[.11]
Lobue
andDeL
oache(2008)
.483
(46)[.0
01]
.178
(46)[.239]
.34(.141;
.512)[.0
01]
.317
(.055;
.564)[.017]
.317
(.055;
.564)[.0
17]
Estes,V
erges,andBarsalou(2008)
.595
(19)[.0
06]
.254
(23)[.245]
.421
(.122;
.65)
[.007]
.348
(–.017;.678)
[.06]
.348
(–.017;.678)
[.06]
The
firstcolum
nliststhearticlefrom
which
akeyeffectwas
replicated.T
henexttwocolumns
show
thecorrelationcoefficient(r oandr r),samplesize
(NOandNR),andpvaluefrom
theoriginalstudyand
replication,
respectiv
ely.The
finalthreecolumns
presenttheaverageeffectsize
estim
ate,95%
confidence
interval(CI),and
pvalueof
fixed-effectmeta-analysis(FEMA)andthehybrid
andhybrid
R
method.
0behind
theestim
ates
ofthehybridmethodindicatesthatthehybrid0methodwouldsetthe
averageeffectsize
estim
atetozero.A
llpvalues
forthe
originalstudy(secondcolumn)
andreplication
(third
column)
weretwo-tailedexcept
forthosefrom
thestudiesby
Beaman
etal.(2008),Schm
idtandBesner(2008),McC
rea(2008),andHajcakandFo
ti(2008).These
studiesreported
one-tailed
pvalues.T
hepvalues
forfixed-effectmeta-analysis(FEMA),thehybrid
andhybrid
Rmethods
weretwo-tailed
Behav Res (2018) 50:1515–1539 1535

Open Access This article is distributed under the terms of the CreativeCommons At t r ibut ion 4 .0 In te rna t ional License (h t tp : / /creativecommons.org/licenses/by/4.0/), which permits unrestricted use,distribution, and reproduction in any medium, provided you giveappropriate credit to the original author(s) and the source, provide a linkto the Creative Commons license, and indicate if changes were made.
References
Adams, R. A., & Essex, C. (2013).Calculus: A complete course (8th ed.).Toronto: Pearson.
Addis, D. R., Wong, A. T., & Schacter, D. L. (2008). Age-related changesin the episodic simulation of future events. Psychological Science,19, 33–41. doi:https://doi.org/10.1111/j.1467-9280.2008.02043.x
Albarracín, D., Handley, I. M., Noguchi, K., McCulloch, K. C., Li, H.,Leeper, J., … Hart, W. P. (2008). Increasing and decreasing motorand cognitive output: A model of general action and inaction goals.Journal of Personality and Social Psychology, 95, 510–523. doi:https://doi.org/10.1037/a0012833
Alvarez, G. A., & Oliva, A. (2008). The representation of simple ensem-ble visual features outside the focus of attention. PsychologicalScience, 19, 392–398. doi:https://doi.org/10.1111/j.1467-9280.2008.02098.x
Amir, Y., & Sharon, I. (1990). Replication research: A Bmust^ for thescientific advancement of psychology. Journal of Social Behaviorand Personality, 5, 51–69.
Amodio, D. M., Devine, P. G., & Harmon-Jones, E. (2008). Individualdifferences in the regulation of intergroup bias: The role of conflictmonitoring and neural signals for control. Journal of Personalityand Social Psychology, 94, 60–74. doi:https://doi.org/10.1037/0022-3514.94.1.60
Armor, D. A., Massey, C., & Sackett, A. M. (2008). Prescribed optimism:Is it right to be wrong about the future? Psychological Science, 19,329–331. doi:https://doi.org/10.1111/j.1467-9280.2008.02089.x
Bakker, M., van Dijk, A., &Wicherts, J. M. (2012). The rules of the gamecalled psychological science. Perspectives on Psychological Science,7, 543–554. doi:https://doi.org/10.1177/1745691612459060
Bassok, M., Pedigo, S. F., & Oskarsson, A. T. (2008). Priming additionfacts with semantic relations. Journal of Experimental Psychology,34, 343–352. doi:https://doi.org/10.1037/0278-7393.34.2.343
Beaman, C. P., Neath, I., & Surprenant, A. M. (2008). Modeling distri-butions of immediate memory effects: No strategies needed?Journal of Experimental Psychology, 34, 219–229. doi:https://doi.org/10.1037/0278-7393.34.1.219
Berry, C. J., Shanks, D. R., & Henson, R. N. (2008). A single-systemaccount of the relationship between priming, recognition, and fluen-cy. Journal of Experimental Psychology, 34, 97–111. doi:https://doi.org/10.1037/0278-7393.34.1.97
Blankenship, K. L., & Wegener, D. T. (2008). Opening the mind to closeit: Considering a message in light of important values increasesmessage processing and later resistance to change. Journal ofPersonality and Social Psychology, 94, 196–213. doi:https://doi.org/10.1037/0022-3514.94.2.94.2.196
Borenstein, M. (2009). Effect sizes for continuous data. In H. Cooper, L.V. Hedges, & J. C. Valentine (Eds.), The Handbook of ResearchSynthesis and Meta-Analysis (pp. 221–236). New York: RussellSage Foundation.
Borenstein, M., Hedges, L. V., Higgins, J. P., & Rothstein, H. R. (2010).A basic introduction to fixed-effect and random-effects models formeta-analysis. Research Synthesis Methods, 1, 97–111. doi:https://doi.org/10.1002/jrsm.12
Borenstein, M., Hedges, L. V., Higgins, J. P. T., & Rothstein, H. R.(2009). Introduction to meta-analysis. Chichester: Wiley.
Bressan, P., & Stranieri, D. (2008). The best men are (not always) alreadytaken: Female preference for single versus attached males dependson conception risk. Psychological Science, 19, 145–151. doi:https://doi.org/10.1111/j.1467-9280.2008.02060.x
Bruns, S. B., & Ioannidis, J. P. (2016). P-curve and p-hacking in obser-vational research. PLoS ONE, 11, e0149144. doi:https://doi.org/10.1371/journal.pone.0149144
Button, K. S., Ioannidis, J. P., Mokrysz, C., Nosek, B. A., Flint, J.,Robinson, E. S., &Munafò,M. R. (2013). Power failure: Why smallsample size undermines the reliability of neuroscience. NatureReviews Neuroscience, 14, 365–376. doi:https://doi.org/10.1038/nrn3475
Centerbar, D. B., Schnall, S., Clore, G. L., & Garvin, E. D. (2008).Affective incoherence: When affective concepts and embodied re-actions clash. Journal of Personality and Social Psychology, 94,560–578. doi:https://doi.org/10.1037/0022-3514.94.4.560
Cohen, J. (1988). Statistical power analysis for the behavioral sciences(2nd ed.). Hillsdale, NJ: Lawrence Erlbaum Associates.
Cohen, J. (1990). Things I have learned (so far). American Psychologist,45, 1304–1312.
Correll, J. (2008). 1/f noise and effort on implicit measures of bias.Journal of Personality and Social Psychology, 94, 48–59. doi:https://doi.org/10.1037/0022-3514.94.1.48
Cox, C. R., Arndt, J., Pyszczynski, T., Greenberg, J., Abdollahi, A., &Solomon, S. (2008). Terror management and adults’ attachment totheir parents: The safe haven remains. Journal of Personality andSocial Psychology, 94, 696–717. doi:https://doi.org/10.1037/0022-3514.94.4.696
Cumming, G. (2012).Understanding the new statistics: Effect sizes, con-fidence intervals, and meta-analysis. New York: Routledge.
Dessalegn, B., & Landau, B. (2008).More thanmeets the eye: The role oflanguage in binding and maintaining feature conjunctions.Psychological Science, 19, 189–195. doi:https://doi.org/10.1111/j.1467-9280.2008.02066.x
Dodson, C. S., Darragh, J., & Williams, A. (2008). Stereotypes andretrieval-provoked illusory source recollections. Journal ofExperimental Psychology, 34, 460–477. doi:https://doi.org/10.1037/0278-7393.34.3.460
Eitam, B., Hassin, R. R., & Schul, Y. (2008). Nonconscious goal pursuitin novel environments: The case of implicit learning. PsychologicalScience, 19, 261–267. doi:https://doi.org/10.1111/j.1467-9280.2008.02078.x
Ersner-Hershfield, H., Mikels, J. A., Sullivan, S. J., & Carstensen, L. L.(2008). Poignancy: Mixed emotional experience in the face ofmeaningful endings. Journal of Personality and SocialPsychology, 94, 158–167. doi:https://doi.org/10.1037/0022-3514.94.1.158
Estes, Z., Verges, M., & Barsalou, L. W. (2008). Head up, foot down:Object words orient attention to the objects’ typical location.Psychological Science, 19, 93–97. doi:https://doi.org/10.1111/j.1467-9280.2008.02051.x
Etz, A., & Vandekerckhove, J. (2016). A Bayesian perspective on theReproducibility Project: Psychology. PLoS ONE, 11 e0149794.doi:https://doi.org/10.1371/journal.pone.0149794
Exline, J. J., Baumeister, R. F., Zell, A. L., Kraft, A. J., & Witvliet, C. V.(2008). Not so innocent: Does seeing one’s own capacity for wrong-doing predict forgiveness? Journal of Personality and SocialPsychology, 94, 495–515. doi:https://doi.org/10.1037/0022-3514.94.3.495
Fanelli, D. (2012). Negative results are disappearing from most disci-plines and countries. Scientometrics, 90, 891–904. doi:https://doi.org/10.1007/s11192-011-0494-7
Farrell, S. (2008).Multiple roles for time in short-termmemory: Evidencefrom serial recall of order and timing. Journal of ExperimentalPsychology, 34, 128–145. doi:https://doi.org/10.1037/0278-7393.34.1.128
1536 Behav Res (2018) 50:1515–1539

Farris, C., Treat, T. A., Viken, R. J., & McFall, R. M. (2008). Perceptualmechanisms that characterize gender differences in decodingwomen’s sexual intent. Psychological Science, 19, 348–354. doi:https://doi.org/10.1111/j.1467-9280.2008.02092.x
Faul, F., Erdfelder, E., Lang, A.-G., & Buchner, A. (2007). G*Power 3: Aflexible statistical power analysis program for the social, behavioral,and biomedical sciences. Behavior ResearchMethods, 39, 175–191.doi:https://doi.org/10.3758/BF03193146
Fleiss, J. L., & Berlin, J. A. (2009). Effect sizes for dichotomous data. InH. Cooper, L. V. Hedges, & J. C. Valentine (Eds.), The handbook ofresearch synthesis and meta-analysis (pp. 237–253). New York:Russell Sage Foundation.
Forti, S., &Humphreys, G.W. (2008). Sensitivity to object viewpoint andaction instructions during search for targets in the lower visual field.Psychological Science, 19, 42–48. doi:https://doi.org/10.1111/j.1467-9280.2008.02044.x
Ganor-Stern, D., & Tzelgov, J. (2008). Across-notation automatic numer-ical processing. Journal of Experimental Psychology, 34, 430–437.doi:https://doi.org/10.1037/0278-7393.34.2.430
Gerber, A. S., Green, D. P., & Nickerson, D. (2001). Testing for publica-tion bias in political science. Political Analysis, 9, 385–392.
Gilbert, D. T., King, G., Pettigrew, S., & Wilson, T. D. (2016). Commenton BEstimating the reproducibility of psychological science.^Manuscript submitted for publication.
Goff, P. A., Steele, C. M., & Davies, P. G. (2008). The space between us:Stereotype threat and distance in interracial contexts. Journal ofPersonality and Social Psychology, 94, 91–107. doi:https://doi.org/10.1037/0022-3514.94.1.91
Goschke, T., & Dreisbach, G. (2008). Conflict-triggered goal shielding:Response conflicts attenuate backgroundmonitoring for prospectivememory cues. Psychological Science, 19, 25–32. doi:https://doi.org/10.1111/j.1467-9280.2008.02042.x
Hajcak, G., & Foti, D. (2008). Errors are aversive: Defensive motivationand the error-related negativity. Psychological Science, 19, 103–108. doi:https://doi.org/10.1111/j.1467-9280.2008.02053.x
Halevy, N., Bornstein, G., & Sagiv, L. (2008). In-group love and out-group hate as motives for individual participation in intergroup con-flict: A new game paradigm. Psychological Science, 19, 405–411.doi:https://doi.org/10.1111/j.1467-9280.2008.02100.x
Hedges, L. V. (1981). Distribution theory for Glass’s estimator of effectsize and related estimators. Journal of Educational Statistics, 6,107–128.
Heine, S. J., Buchtel, E. E., & Norenzayan, A. (2008). What do cross-national comparisons of personality traits tell us? The case of con-scientiousness. Psychological Science, 19, 309–313. doi:https://doi.org/10.1111/j.1467-9280.2008.02085.x
Henrich, J., Heine, S. J., & Norenzayan, A. (2010). The weirdest peoplein the world? Behavioral and Brain Sciences, 33, 61–83. doi:https://doi.org/10.1017/S0140525X0999152X
Hotelling, H. (1953). New light on the correlation coefficient and itstransforms. Journal of the Royal Statistical Society: Series B, 15,193–232.
Hung, H. M., O’Neill, R. T., Bauer, P., & Köhne, K. (1997). The behaviorof the p-value when the alternative hypothesis is true. Biometrics,53, 11–22.
IntHout, J., Ioannidis, J. P., & Borm, G. F. (2014). The Hartung–Knapp–Sidik–Jonkman method for random effects meta-analysis is straight-forward and considerably outperforms the standard DerSimonian-Laird method. BMCMedical Research Methodology, 14. doi:https://doi.org/10.1186/1471-2288-14-25
Ioannidis, J. P. (2011). Excess significance bias in the literature on brainvolume abnormalities. Archives of General Psychiatry, 68, 773–780. doi:https://doi.org/10.1001/archgenpsychiatry.2011.28
Jackson, D. (2006). The power of the standard test for the presence ofheterogeneity in meta-analysis. Statistics in Medicine, 25, 2688–2699. doi:https://doi.org/10.1002/sim.2481
Janiszewski, C., & Uy, D. (2008). Precision of the anchor influences theamount of adjustment. Psychological Science, 19, 121–127. doi:https://doi.org/10.1111/j.1467-9280.2008.02057.x
Janssen, N., Alario, F. X., & Caramazza, A. (2008). A word-order con-straint on phonological activation. Psychological Science, 19, 216–220. doi:https://doi.org/10.1111/j.1467-9280.2008.02070.x
Kavvoura, F. K., McQueen, M. B., Khoury, M. J., Tanzi, R. E., Bertram,L., & Ioannidis, J. P. (2008). Evaluation of the potential excess ofstatistically significant findings in published genetic associationstudies: Application to Alzheimer’s disease. American Journal ofEpidemiology, 168, 855–865. doi:https://doi.org/10.1093/aje/kwn206
Klein, R. A., Ratliff, K. A., Brooks, B., Vianello, M., Galliani, E. M.,Adams Jr, R. B.,… Hasselman, F. (2014). Investigating variation inreplicability: A Bmany labs^ replication project. Social Psychology,45, 142–152. doi:https://doi.org/10.1027/1864-9335/a000178
Kraemer, H. C., Gardner, C., Brooks, J., & Yesavage, J. A. (1998).Advantages of excluding underpowered studies in meta-analysis:Inclusionist versus exclusionist viewpoints. PsychologicalMethods, 3, 23–31. doi:https://doi.org/10.1037/1082-989X.3.1.23
Lane, D. M., & Dunlap, W. P. (1978). Estimating effect size: Biasresulting from the significance criterion in editorial decisions.British Journal of Mathematical & Statistical Psychology, 31,107–112.
Larsen, J. T., & McKibban, A. R. (2008). Is happiness having what youwant, wanting what you have, or both? Psychological Science, 19,371–377. doi:https://doi.org/10.1111/j.1467-9280.2008.02095.x
Lau, G. P., Kay, A. C., & Spencer, S. J. (2008). Loving those who justifyinequality: The effects of system threat on attraction to women whoembody benevolent sexist ideals. Psychological Science, 19, 20–21.doi:https://doi.org/10.1111/j.1467-9280.2008.02040.x
Lemay, E. P., & Clark, M. S. (2008). BWalking on eggshells^: Howexpressing relationship insecurities perpetuates them. Journal ofPersonality and Social Psychology, 95, 420–441. doi:https://doi.org/10.1037/0022-3514.95.2.420
Liefooghe, B., Barrouillet, P., Vandierendonck, A., & Camos, V. (2008).Working memory costs of task switching. Journal of ExperimentalPsychology, 34, 478–494. doi:https://doi.org/10.1037/0278-7393.34.3.478
Lobue, V., & DeLoache, J. S. (2008). Detecting the snake in the grass:Attention to fear-relevant stimuli by adults and young children.Psychological Science, 19, 284–289. doi:https://doi.org/10.1111/j.1467-9280.2008.02081.x
Loevinger, J. (1948). The technic of homogeneous tests compared withsome aspects of scale analysis and factor analysis. PsychologicalBulletin, 45, 507–529.
Makel, M. C., Plucker, J. A., & Hegarty, B. (2012). Replications in psy-chology research: How often do they really occur? Perspectives onPsychological Science, 7, 537–542. doi:https://doi.org/10.1177/1745691612460688
Makovski, T., Sussman, R., & Jiang, Y. V. (2008). Orienting attention invisual working memory reduces interference from memory probes.Journal of Experimental Psychology, 34, 369–380. doi:https://doi.org/10.1037/0278-7393.34.2.369
Masicampo, E. J., & Baumeister, R. F. (2008). Toward a physiology ofdual-process reasoning and judgment: Lemonade, willpower, andexpensive rule-based analysis. Psychological Science, 19, 255–260. doi:https://doi.org/10.1111/j.1467-9280.2008.02077.x
McCrea, S. M. (2008). Self-handicapping, excuse making, and counter-factual thinking: Consequences for self-esteem and future motiva-tion. Journal of Personality and Social Psychology, 95, 274–292.doi:https://doi.org/10.1037/0022-3514.95.2.274
McKinstry, C., Dale, R., & Spivey, M. J. (2008). Action dynamics revealparallel competition in decision making. Psychological Science, 19,22–24. doi:https://doi.org/10.1111/j.1467-9280.2008.02041.x
Behav Res (2018) 50:1515–1539 1537

Mirman, D., &Magnuson, J. S. (2008). Attractor dynamics and semanticneighborhood density: Processing is slowed by near neighbors andspeeded by distant neighbors. Journal of Experimental Psychology,34, 65–79. doi:https://doi.org/10.1037/0278-7393.34.1.65
Mitchell, C., Nash, S., & Hall, G. (2008). The intermixed-blocked effectin human perceptual learning is not the consequence of trial spacing.Journal of Experimental Psychology, 34, 237–242. doi:https://doi.org/10.1037/0278-7393.34.1.237
Moeller, S. K., Robinson, M. D., & Zabelina, D. L. (2008). Personalitydominance and preferential use of the vertical dimension of space:Evidence from spatial attention paradigms. Psychological Science,19, 355–361. doi:https://doi.org/10.1111/j.1467-9280.2008.02093.x
Morris, A. L., & Still, M. L. (2008). Now you see it, now you don’t:Repetition blindness for nonwords. Journal of ExperimentalPsychology, 34, 146–166. doi:https://doi.org/10.1037/0278-7393.34.1.146
Murayama, K., Pekrun, R., & Fiedler, K. (2014). Research practices thatcan prevent an inflation of false-positive rates. Personality andSocial Psychology Review, 18, 107–118. doi:https://doi.org/10.1177/1088868313496330
Murray, S. L., Derrick, J. L., Leder, S., &Holmes, J. G. (2008). Balancingconnectedness and self-protection goals in close relationships: Alevels-of-processing perspective on risk regulation. Journal ofPersonality and Social Psychology, 94, 429–459. doi:https://doi.org/10.1037/0022-3514.94.3.429
Nairne, J. S., Pandeirada, J. N., & Thompson, S. R. (2008). Adaptivememory: The comparative value of survival processing.Psychological Science, 19, 176–180. doi:https://doi.org/10.1111/j.1467-9280.2008.02064.x
Neuliep, J. W., & Crandall, R. (1993). Everyone was wrong—There arelots of replications out there. Journal of Social Behavior andPersonality, 8(6), 1–8.
Nuijten, M. B., van Assen, M. A. L. M., Veldkamp, C. L. S., &Wicherts,J. M. (2015). The replication paradox: Combining studies can de-crease accuracy of effect size estimates. Review of GeneralPsychology, 19, 172–182. doi:https://doi.org/10.1037/gpr0000034
Nurmsoo, E., & Bloom, P. (2008). Preschoolers’ perspective taking inword learning: Do they blindly follow eye gaze? PsychologicalScience, 19, 211–215. doi:https://doi.org/10.1111/j.1467-9280.2008.02069.x
Oberauer, K. (2008). How to say no: Single- and dual-process theories ofshort-term recognition tested on negative probes. Journal ofExperimental Psychology, 34, 439–459. doi:https://doi.org/10.1037/0278-7393.34.3.439
Open Science Collaboration. (2015). Estimating the reproducibility ofpsychological science. Science, 349, aac4716. doi:https://doi.org/10.1126/science.aac4716
Pacton, S., & Perruchet, P. (2008). An attention-based associative accountof adjacent and nonadjacent dependency learning. Journal ofExperimental Psychology, 34, 80–96. doi:https://doi.org/10.1037/0278-7393.34.1.80
Palmer, S. E., & Ghose, T. (2008). Extremal edges: A powerful cue todepth perception and figure–ground organization. PsychologicalScience, 19, 77–84. doi:https://doi.org/10.1111/j.1467-9280.2008.02049.x
Payne, B. K., Burkley, M. A., & Stokes, M. B. (2008). Why do implicitand explicit attitude tests diverge? The role of structural fit. Journalof Personality and Social Psychology, 94, 16–31. doi:https://doi.org/10.1037/0022-3514.94.1.16
Popper, K. R. (1959/2005). The logic of scientific discovery (2nd ed.).New York, NY: Routledge.
Purdie-Vaughns, V., Steele, C. M., Davies, P. G., Ditlmann, R., & Crosby,J. R. (2008). Social identity contingencies: How diversity cues sig-nal threat or safety for AfricanAmericans inmainstream institutions.Journal of Personality and Social Psychology, 94, 615–630. doi:https://doi.org/10.1037/0022-3514.94.4.615
R Development Core Team. (2015). R: A language and environment forstatistical computing. Vienna: R Foundation for StatisticalComputing. Retrieved from http://www.R-project.org/
Raudenbush, S. W. (2009). Analyzing effect sizes: Random-effectsmodels. In H. Cooper, L. V. Hedges, & J. C. Valentine (Eds.), TheHandbook of Research Synthesis and Meta-Analysis (pp. 295–315).New York: Russell Sage Foundation.
Renkewitz, F., Fuchs, H. M., & Fiedler, S. (2011). Is there evidence ofpublication biases in JDM research? Judgment and DecisionMaking, 6, 870–881.
Risen, J. L., & Gilovich, T. (2008). Why people are reluctant to temptfate. Journal of Personality and Social Psychology, 95, 293–307.doi:https://doi.org/10.1037/0022-3514.95.2.293
Roelofs, A. (2008). Tracing attention and the activation flow of spokenwordplanning using eye movements. Journal of Experimental Psychology,34, 353–368. doi:https://doi.org/10.1037/0278-7393.34.2.353
Rothstein, H. R., Sutton, A. J., & Borenstein, M. (2005). Publication biasin meta-analysis. In H. R. Rothstein, A. J. Sutton, & M. Borenstein(Eds.), Publication bias in meta-analysis: Prevention, assessmentand adjustments. Chichester: Wiley.
Sahakyan, L., Delaney, P. F., &Waldum, E. R. (2008). Intentional forget-ting is easier after two Bshots^ than one. Journal of ExperimentalPsychology, 34, 408–414. doi:https://doi.org/10.1037/0278-7393.34.2.408
Schmidt, J. R., & Besner, D. (2008). The Stroop effect: Why proportioncongruent has nothing to do with congruency and everything to dowith contingency. Journal of Experimental Psychology, 34, 514–523. doi:https://doi.org/10.1037/0278-7393.34.3.514
Schmidt, S. (2009). Shall we really do it again? The powerful concept ofreplication is neglected in the social sciences. Review of GeneralPsychology, 13, 90–100. doi:https://doi.org/10.1037/a0015108
Schnall, S., Benton, J., & Harvey, S. (2008). With a clean conscience:Cleanliness reduces the severity of moral judgments. PsychologicalScience, 19, 1219–1222. doi:https://doi.org/10.1111/j.1467-9280.2008.02227.x
Schulze, R. (2004). Meta-analysis: A comparison of approaches.Cambridge: Hogrefe & Huber.
Shnabel, N., & Nadler, A. (2008). A needs-based model of reconciliation:Satisfying the differential emotional needs of victim and perpetratoras a key to promoting reconciliation. Journal of Personality andSocial Psychology, 94, 116–132. doi:https://doi.org/10.1037/0022-3514.94.1.116
Simonsohn, U., Nelson, L. D., & Simmons, J. P. (2014a). P-curve andeffect size: Correcting for publication bias using only significantresults. Perspectives on Psychological Science, 9, 666–681. doi:https://doi.org/10.1177/1745691614553988
Simonsohn, U., Nelson, L. D., & Simmons, J. P. (2014b). P-curve: A keyto the file-drawer. Journal of Experimental Psychology: General,143, 534–547. doi:https://doi.org/10.1037/a0033242
Stanovich, K. E., & West, R. F. (2008). On the relative independence ofthinking biases and cognitive ability. Journal of Personality andSocial Psychology, 94, 672–695. doi:https://doi.org/10.1037/0022-3514.94.4.672
Sterling, T. D., Rosenbaum, W. L., & Weinkam, J. J. (1995). Publicationdecisions revisited: The effect of the outcome of statistical tests onthe decision to publish and vice versa. American Statistician, 49,108–112. doi:https://doi.org/10.2307/2684823
Storm, B. C., Bjork, E. L., & Bjork, R. A. (2008). Accelerated relearningafter retrieval-induced forgetting: The benefit of being forgotten.Journal of Experimental Psychology, 34, 230–236. doi:https://doi.org/10.1037/0278-7393.34.1.230
Straits, B. C., & Singleton, R. A. (2011). Social research: Approachesand fundamentals. New York: Oxford University Press.
Tsilidis, K. K., Papatheodorou, S. I., Evangelou, E., & Ioannidis, J. P.(2012). Evaluation of excess statistical significance in meta-analysesof 98 biomarker associations with cancer risk. Journal of the
1538 Behav Res (2018) 50:1515–1539

National Cancer Institute, 104, 1867–1878. doi:https://doi.org/10.1093/jnci/djs437
Turk-Browne, N. B., Isola, P. J., Scholl, B. J., & Treat, T. A. (2008).Multidimensional visual statistical learning. Journal of ExperimentalPsychology, 34, 399–407. doi:https://doi.org/10.1037/0278-7393.34.2.399
Ueno, T., Fastrich, G. M., & Murayama, K. (2016). Meta-analysis tointegrate effect sizes within an article: Possible misuse and Type Ierror inflation. Journal of Experimental Psychology: General, 145,643–654. doi:https://doi.org/10.1037/xge0000159
Ulrich, R., & Miller, J. (2015). p-hacking by post hoc selection withmultiple opportunities: Detectability by skewness test?: Commenton Simonsohn, Nelson, and Simmons (2014). Journal ofExperimental Psychology: General, 144, 1137–1145. doi:https://doi.org/10.1037/xge0000086
van Aert, R. C. M., & van Assen, M. A. L. M. (2017). Bayesian evalu-ation of effect size after replicating an original study. PLoSONE, 12,e0175302. doi:https://doi.org/10.1371/journal.pone.0175302
van Aert, R. C. M., Wicherts, J. M., & van Assen, M. A. L. M. (2016).Conducting meta-analyses on p-values: Reservations and recom-mendations for applying p-uniform and p-curve. Perspectives onPsychological Science, 11, 713–729. doi:https://doi.org/10.1177/1745691616650874
van Assen, M. A. L. M., van Aert, R. C. M., & Wicherts, J. M. (2015).Meta-analysis using effect size distributions of only statistically sig-nificant studies. Psychological Methods, 20, 293–309. doi:https://doi.org/10.1037/met0000025
van Dijk, E., van Kleef, G. A., Steinel, W., & van Beest, I. (2008). Asocial functional approach to emotions in bargaining: When
communicating anger pays and when it backfires. Journal ofPersonality and Social Psychology, 94, 600–614. doi:https://doi.org/10.1037/0022-3514.94.4.600
Viechtbauer, W. (2007). Approximate confidence intervals for standard-ized effect sizes in the two-independent and two-dependent samplesdesign. Journal of Educational and Behavioral Statistics, 32, 39–60.doi:https://doi.org/10.3102/1076998606298034
Vohs, K. D., & Schooler, J. W. (2008). The value of believing in free will:Encouraging a belief in determinism increases cheating.Psychological Science, 19, 49–54. doi:https://doi.org/10.1111/j.1467-9280.2008.02045.x
Vul, E., & Pashler, H. (2008). Measuring the crowd within: Probabilisticrepresentations within individuals. Psychological Science, 19, 645–647. doi:https://doi.org/10.1111/j.1467-9280.2008.02136.x
White, P. A. (2008). Accounting for occurrences: A new view of the useof contingency information in causal judgment. Journal ofExperimental Psychology, 34, 204–218. doi:https://doi.org/10.1037/0278-7393.34.1.204
Winawer, J., Huk, A. C., & Boroditsky, L. (2008). A motion aftereffectfrom still photographs depicting motion. Psychological Science, 19,276–283. doi:https://doi.org/10.1111/j.1467-9280.2008.02080.x
Wolfram Research Inc. (2015). Mathematica. Champaign: WolframResearch, Inc.
Yap,M. J., Balota, D. A., Tse, C. S., & Besner, D. (2008). On the additiveeffects of stimulus quality and word frequency in lexical decision:Evidence for opposing interactive influences revealed by RT distri-butional analyses. Journal of Experimental Psychology, 34, 495–513. doi:https://doi.org/10.1037/0278-7393.34.3.495
Behav Res (2018) 50:1515–1539 1539