examining the effects of implementation of i-ready to
TRANSCRIPT
University of Central Florida University of Central Florida
STARS STARS
Electronic Theses and Dissertations, 2020-
2021
Examining the Effects of Implementation of i-Ready to Fidelity on Examining the Effects of Implementation of i-Ready to Fidelity on
Reading and its Effects on Free or Reduced Lunch Students in Reading and its Effects on Free or Reduced Lunch Students in
Seven Middle Schools Seven Middle Schools
Ryan Martin University of Central Florida
Part of the Educational Assessment, Evaluation, and Research Commons, and the Language and
Literacy Education Commons
Find similar works at: https://stars.library.ucf.edu/etd2020
University of Central Florida Libraries http://library.ucf.edu
This Doctoral Dissertation (Open Access) is brought to you for free and open access by STARS. It has been accepted
for inclusion in Electronic Theses and Dissertations, 2020- by an authorized administrator of STARS. For more
information, please contact [email protected].
STARS Citation STARS Citation Martin, Ryan, "Examining the Effects of Implementation of i-Ready to Fidelity on Reading and its Effects on Free or Reduced Lunch Students in Seven Middle Schools" (2021). Electronic Theses and Dissertations, 2020-. 730. https://stars.library.ucf.edu/etd2020/730
EXAMINING THE EFFECTS OF IMPLEMENTATION OF I-READY TO FIDELITY ON
READING AND ITS EFFECTS ON FREE OR REDUCED LUNCH STUDENTS IN SEVEN
MIDDLE SCHOOLS
by
RYAN K. MARTIN
B.S. University of Central Florida, 2012
M.Ed. University of Florida, 2016
A dissertation submitted in partial fulfillment of the requirements
for the degree of Doctor of Education in Educational Leadership
in the Department of Educational Leadership and Higher Education
in the College of Community Innovation and Education
at the University of Central Florida
Orlando, Florida
Summer Term
2021
Major Professor: Daniel Eadens

ii
©2021 Ryan K. Martin

iii
ABSTRACT
The purpose of this study was to contribute to the literature and to policy and practice in
the educational field on how individual student diagnostic scores was affected in the area of
reading. This study specifically examined full or partial fidelity of implementation of the i-
Ready reading instructional and computerized program was applied in seven middle schools in a
school district in Central Florida for all students in intensive reading courses. Additionally, this
study contributed to how individual student diagnostic scores was affected in the area of reading
for students on free or reduced lunch. Data were analyzed from the second and third diagnostic
assessments from i-Ready. The second diagnostic assessment was administered in January of
2021 after students returned from Winter Break and 1,774 students completed that assessment.
The third diagnostic assessment was administered in March of 2021 after students returned from
Spring Break and 1,687 students completed that assessment. Overall, 3,461 students completed
the assessments. Analyses showed that students in schools who used the i-Ready reading
program to full fidelity had slightly higher scores than students in schools used the i-Ready
reading program only to partial fidelity, yet the data was not statistically significant. Further
analyses found that students who were on free or reduced lunch performed far worse than
students who were not considered on free or reduced lunch, there was a statistically significant
difference, and that implementing the i-Ready reading program to complete fidelity actually had
a significant negative effect for students on free or reduced lunch.

iv
ACKNOWLEDGMENTS
I would like to begin by expressing my gratitude and appreciation for all the professors in
the Educational Leadership program in the Educational Doctorate program here at the University
of Central Florida. Without your constant guidance, feedback, and leadership, I would not be
here today. It has been a long three-year process and happened to play out through the COVID-
19 pandemic, but I cannot thank you all enough. Specifically, I would like to thank my
dissertation chair, Dr. Daniel Eadens. You have been extremely patient, honest, and pushed me
to get to this point. I would also like to thank Dr. Connie Goodman, who has been one of my
mentors since I was an undergraduate student. By taking me under your wing since day one, you
have pushed me to be the best educator possible and I will never be able to repay your guidance
and support. To Dr. Thomas Vitale, I have enjoyed the classes that we took with you, and I
appreciate your support throughout this journey. To Dr. Sherron Roberts, your support, feedback,
and probing my thought processes throughout this journey has been invaluable and I thank you
deeply. I would also like to thank Cohort IX, who I began this process with back in Fall 2018. 13
in, 13 out. Ohana.
Next, I would like to thank my wife, Bailey, who has been a constant voice of support,
guidance, and pushing me when I needed it most. Words will never express how much you mean
to me and assisting me throughout this journey. Finally, I would like to send a heartfelt thanks to
all the friends and family who have stuck with me throughout my academic career. There were
many instances of having to cancel or change plans because of schoolwork, and I thank you all
from the bottom of my heart.

v
TABLE OF CONTENTS
LIST OF FIGURES ix
LIST OF TABLES x
CHAPTER ONE: INTRODUCTION 1
Background of the Study 1
Statement of the Problem 3
Purpose of the Study 3
Significance of the Study 4
Definition of Terms 5
Philosophical Framework 9
Theoretical Framework 10
Conceptual Framework 11
Research Questions 13
Delimitations 14
Limitations 14
Assumptions 16
Organization of the Study 16
Summary 17
CHAPTER TWO: LITERATURE REVIEW 19
Introduction 19
Philosophical Framework 19
Constructivist Assumptions in Education: Considering the Data 20
Why Constructivism? 24

vi
Theoretical Framework 24
Maslow’s Hierarchy of Needs 24
Why Maslow? 26
Conceptual Framework 26
Adherence 27
Dosage 27
Quality of Delivery 28
Participant Responsiveness 30
Program Differentiation 30
Fidelity of Implementation and Reading Interventions 32
Multi-Tiered System of Support (MTSS) 34
Free or Reduced Lunch Students 35
What Role can Schools Play? 36
i-Ready Reading in Elementary School 37
i-Ready Reading in Middle School 38
i-Ready Research in General 39
Summary 40
CHAPTER THREE: METHODOLOGY 51
Introduction 51
Purpose of the Study 53
Significance of the Study 53
Method and Design 54
Research Questions 57

vii
Hypotheses 57
Population 57
Data Collection and Instruments 58
Reliability 59
Marginal Reliability 59
Standard Error of Measurement (SEM) 60
Test-Retest Reliability 61
Validity 61
Data Analysis 62
Summary 63
CHAPTER 4: RESULTS 65
Introduction 65
Descriptive Statistics 66
Second Diagnostic Assessment Demographic Information 67
Third Diagnostic Assessment Demographic Information 70
Testing the Research Questions 73
Additional Analysis 77
Summary 77
CHAPTER 5: DISCUSSION 80
Introduction 80
Recapitulation of the Study 80
Statement of the Problem 80
Purpose 81

viii
Theoretical Framework 81
Research Questions 81
Hypotheses 82
Methodology 82
Findings 83
Limitations 85
Discussion of the Findings 87
Research Question One 87
Data Visualization for Research Question One 89
Research Question Two 91
Data Visualization for Research Question Two 92
Implications for Policy 94
Implications for Practice 95
Recommendations for Further Research 96
Conclusions 97
Summary 98
APPENDIX A: UCF IRB APPROVAL 100
APPENDIX B: SCHOOL DISTRICT APPROVAL 102
LIST OF REFERENCES 104

ix
LIST OF FIGURES
Figure 1: Histogram for Research Question One 90
Figure 2: Histogram for Research Question Two 93

x
LIST OF TABLES
Table 1 Thematically Organized Review of the Reading Literature ........................................... 42 Table 2 Research Questions for Analysis .................................................................................... 63 Table 3 Student Grade Levels ...................................................................................................... 67 Table 4 Gender ............................................................................................................................. 68 Table 5 Race/Ethnicity ................................................................................................................. 68 Table 6 Free or Reduced Lunch Students .................................................................................... 69 Table 7 ESE .................................................................................................................................. 69 Table 8 School .............................................................................................................................. 70 Table 9 Student Grade Levels ...................................................................................................... 70 Table 10 Gender ........................................................................................................................... 71 Table 11 Race/Ethnicity ............................................................................................................... 71 Table 12 Free or Reduced Lunch Students .................................................................................. 72 Table 13 ESE ................................................................................................................................ 72 Table 14 School ............................................................................................................................ 73 Table 15 Full vs. Partial Fidelity .................................................................................................. 74 Table 16 Independent Samples T-Test ......................................................................................... 75 Table 17 Free or Reduced Lunch Students .................................................................................. 76

1
CHAPTER ONE: INTRODUCTION
Background of the Study
Historically, as a group, students on free or reduced lunch have performed worse than
higher-income students on most measures of academic success. Students who were considered
economically disadvantaged, referred to from here on out as students who were on free and
reduced lunch, have performed not as well as students who were not considered on free and
reduced lunch on standardized test scores, grades, high school completion rates, college
enrollment, and completion rates (Reardon, 2013). In his meta-analysis, Reardon aimed to
conduct a comprehensive study of the relationship between academic achievement scores and
family income in the United States over the past 50 years. Reardon used data from 12 nationally
representative studies that included information on family income and achievement performance
on a standardized test in reading. Because each criterion measured reading skills on a different
scale, Reardon standardized all the test scores and expressed the income achievement gap in
standard deviation units (Reardon, 2011). From this comprehensive study, Reardon found three
striking findings. First, the income achievement gap has grown significantly in the last three
decades. Second, income achievement gaps in other measures of educational success have
increased as well. Finally, the income achievement gap is already significant when children
enter kindergarten, and the income achievement gap does not significantly widen as they
progress through school.
One attempt to close the income achievement gap in one school district in Central
Florida, specifically in their middle schools, is to use a commercialized instructional and
computerized program called i-Ready. This district uses i-Ready in all middle schools as an
intervention and measurement tool for each student who has scored a Level 1 or Level 2 on the

2
Florida Standards assessment (FSA). According to the Florida Department of Education, a
student who scores a Level 1 or Level 2 on the FSA is considered below grade level. The idea
behind placing these students into an intensive reading course is that i-Ready (both the
instructional and computerized components) has the capacity to fill the gaps in their reading
scores. i-Ready intends to fill gaps in their knowledge and skills, so that students can eventually
pass the FSA with a Level 3 or higher.
In a recent study, Swain, Randel and Dvorak (2020) set out to determine i-Ready
instruction's impact on student diagnostic scores in reading. Their research question focused on
students who used the i-Ready diagnostic and i-Ready instructional components to determine if
those students had higher reading diagnostic scores compared to students who only took the i-
Ready diagnostic assessment. This study exclusively focused on K-5 students. Swain, Randel,
and Dvorak (2020) hypothesized that reading diagnostic scores would be higher for students who
used i-Ready instruction with fidelity. Students in the i-Ready instructional group had a
statistically significantly higher reading i-Ready diagnostic scores at each grade than did students
in a matched comparison group (Swain, Randel & Dvorak, 2020). Thus, this study aims to prove
data for post-elementary students to fill the gap in the literature that exists for i-Ready’s impact
in regards to middle school students.
Statement of the Problem
Due to the lack of detailed research on the effectiveness of using the i-Ready instructional
and computerized program to complete fidelity in middle schools and its effects on individual
student diagnostic scores, this dissertation focused on 3,461 students in seven middle schools in
one Central Florida school district and their implementation of the i-Ready reading program.
This study examined which schools used the instructional and computerized program to full

3
fidelity of implementation and which schools used the i-Ready reading program to partial fidelity
of implementation as it relates to individual student scores.
This dissertation also focused on the problem that there was a lack of detailed research on
using the i-Ready reading instructional and computerized program to full (to complete fidelity)
or to partial (not to complete fidelity) implementation of the i-Ready instructional and
computerized program. A third problem this dissertation addressed was the lack of detailed
research on how i-Ready’s reading instructional and computerized program affected the
individual student diagnostic scores reading scores from the second and third diagnostic
assessments of for students on free or reduced lunch and how the intervention attempted to close
the income diagnostic scores gap.
Purpose of the Study
One purpose of this study was to contribute to the literature and the field on how
individual student diagnostic scores was possibly affected in the area of reading. This study
specifically examined when the full (to complete fidelity) or partial (not to complete fidelity)
implementation of the i-Ready instructional and computerized program was implemented in
seven middle schools in a school district in Central Florida for all students in reading.
Another purpose of this study was to contribute to the literature and the field on how
individual student diagnostic scores was possibly affected in the area of reading for students on
free or reduced lunch. This study specifically examined when the full (to complete fidelity) or
partial (not to complete fidelity) implementation of the i-Ready instructional and computerized
program was implemented in seven middle schools in a Central Florida District for all students
in reading.

4
Significance of the Study
The educational significance of this study was to determine whether full or partial fidelity
to the i-Ready reading program works for each middle school. School leaders might benefit
from understanding the possible impacts of working toward fidelity or only implementing partial
fidelity. This school district and beyond could gain valuable insight into whether the i-Ready
program is effective at closing the income achievement gap. Finally, this study could provide
evidence that full fidelity to the i-Ready program matters for student diagnostic scores.
Furthermore, this study could provide evidence that could lead to changes in how this
district and possibly others might use these findings to make changes to policy and practice. For
example, if it were found that full fidelity to the i-Ready instructional and computerized program
significantly affects individual student diagnostic scores in reading, districts could mandate that
all middle schools, in this district and possibly others, must adhere to the instructional and
computerized components solely. On the other hand, it could have been found that full fidelity
to the program does not significantly affect individual student diagnostic scores, and districts
could allow schools to use both the i-Ready instructional and computerized components and
outside resources to supplement the curriculum.
Definition of Terms
Every Student Succeeds Act (ESSA): In December 2015, former President Obama's signature
reauthorized the Elementary and Secondary Education Act of 1965 as the Every Student
Succeeds Act, which opened up new possibilities for how student and school success are defined
and supported in American public education. One of the most notable shifts from ESSA's
immediate predecessor, the No Child Left Behind Act (NCLB), is that states have greater
responsibility for designing and building their state accountability systems. Another shift is

5
determining supports and interventions for schools and districts (Darling-Hammond, Bae, Cook-
Harvey, Lam, Mercer, Podolsky, & Stosich, 2016, p.1).
ESSA Levels:
1. Level One- Strong Evidence: supported by one or more well-designed and well-
implemented randomized control experimental studies
2. Level Two- Moderate Evidence: supported by one or more well-designed and well-
implemented quasi-experimental studies
3. Level Three- Promising Evidence: supported by one or more well-designed and well-
implemented correlational studies (with statistical controls for selection bias).
4. Level Four- Demonstrates and Rationale: practices that have a well-defined logic or
theory of action are supported by research and have some effort underway by an outside
research organization to determine their effectiveness.
Florida Standards assessment (FSA): The Florida Department of Education defines the FSA as
an assessment to serve Florida students by measuring education gains and progress in English
Language Arts (ELA), Mathematics, and end-of-course (EOC) subjects (Algebra 1 and
Geometry).
FSA Levels: According to the FLDOE, a student who scores a Level 1 is considered to be at an
"inadequate" performance level and is highly likely to need substantial support for the next
grade/course. A student who scores a Level 2 is considered "below satisfactory" on a
performance level and is likely to need substantial support for the next grade/course. A student
who scores a Level 3 is considered to be "satisfactory" on a performance level and may need
additional support for the next grade/course. A student who scores a Level 4 is considered
"proficient" on a performance level and is likely to excel in the next grade/course. A student

6
who scores a Level 5 is considered "mastery" on a performance level and is highly likely to excel
in the next grade/course.
Full Versus Partial Fidelity: Once there was approval from both UCF and one school district in
Central Florida, the researcher e-mailed each of the twelve middle school principals to ask
whether they would be interested in participating in this study. Of the twelve middle schools in
the school district, nine agreed and three did not respond. However, two schools were removed
for time constraints, leading to seven middle schools that were included in this study. Once there
was approval from each of the seven principals, the researched asked to meet with an
administrator, instructional coach, department head, or anyone who worked directly with the
reading teachers and students in the intensive reading courses. The researcher asked four
questions during the meetings to gauge how each of the seven middle schools was using the i-
Ready reading program. Those questions included: (1) how are you using the i-Ready reading
program in your school, (2) to what extent are you using the i-Ready reading program to fidelity,
(3) does it vary from teacher-to-teacher or is the same across the reading department, and (4)
how often would you estimate you are in classrooms to verify this information. After each of the
meetings, the researcher categorized each school as using the program to full fidelity or partial
fidelity. In total, the researcher categorized four schools as using the i-Ready reading program to
full fidelity and three schools as using the i-Ready reading program to partial fidelity.
Implementation Fidelity: Carroll, Patterson, Wood, Booth, Rick, and Balain (2007) refer to
implementation fidelity as the degree to which an intervention or program is delivered as
intended. Only by understanding and measuring whether an intervention is implemented to
complete fidelity can researchers and practitioners gain a better understanding of how and why
an intervention works or does not work and the extent to which outcomes can be improved.

7
i-Ready: According to Curriculum Associates, creator and owner of the program, i-Ready is a
commercial product and comprehensive assessment and instruction program that empowers
educators with the resources they need to help all students succeed. Furthermore, by connecting
diagnostic data and Personalized Instruction, i-Ready reduces complexity, saves educators time,
and makes differentiated instruction achievable in every classroom. i-Ready: (1) Provides user-
friendly dashboards and clear reports with actionable data that give teachers a foundational
understanding of students' strengths and areas of needs, (2) enables educators to confidently
determine each student's on-grade level proficiency based on state and national standards, (3)
delivers online lessons that provide tailored instruction and practice for each student to accelerate
growth, and (4) supports teachers with in-the-moment resources for remediation and reteaching
at individualized, small group, and whole-class levels of instruction.
In 2016, according to Curriculum Associates, Curriculum Associates served more than 1
million students with its i-Ready program in 48 of the 70 districts that comprise the Council of
the Great City Schools (CGCS) in Florida. The program informs instruction, which, in turn,
improves student diagnostic scores. The CGCS is the only national organization to exclusively
represent the needs of urban public schools.
In the 2016-2017 school year, according to Curriculum Associates, i-Ready was being
used by approximately 10% of all K-10 students serving over 3.5 million students across all 50
states. Additionally, more than one million students used the program every school day.
i-Ready Diagnostic: According to Curriculum Associates, the creator and operator of the i-
Ready program, offering a continuum of scale scores from kindergarten through high school, the
i Ready diagnostic is a web-based adaptive screening assessment for reading. Evidence-based,
proven valid and reliable, and aligned to state and Common Core standards, i-Ready claims to

8
meets the expected rigor of the FSA and to provide actionable data and reports for each of the six
domains: Phonological Awareness, Phonics, High-Frequency Words, Vocabulary,
Comprehension of Informational Text, and Comprehension of Literature. Screenings from the
diagnostic assessments are administered up to three times per academic year, with 12-18 weeks
of instruction between assessments. Each screening takes approximately 30-60 minutes, which
may be broken into multiple sittings, and may be conducted with all students or with specific
groups of students who have been identified as at risk of academic failure. i-Ready’s
sophisticated adaptive algorithm automatically selects from thousands of technology-enhanced
and multiple-choice items to get to the core of each student's strengths and challenges, regardless
of the grade level at which he or she is performing. The system automatically analyzes, scores,
and reports student responses and results. Available as soon as a student completes the
assessment, the i-Ready diagnostic reports provide comprehensive information, including
developmental analyses, about student performance, group students who struggle with the same
concepts, make instructional recommendations to target skill deficiencies, and monitor progress
and growth as students follow their individualized instructional paths. Reports include suggested
next steps for instruction and PDF Tools for Instruction lesson plans for the teacher to use during
individual, small-group, or whole-class instruction.
Intensive Reading: This school district with seven middle schools in Central Florida defines the
intensive reading course under the category of Supplemental and intensive Instructional Support.
Students in grades six through eight who are not demonstrating satisfactory progress (Level three
or higher on FSA) may be enrolled in an acceleration support program during the school day to
provide immediate instructional support. Principals may assign students to any one or all of the
following acceleration support programs. Students assigned to these programs will remain in the

9
placement until they have demonstrated satisfactory performance as determined by a school-
wide system of progress monitoring. Intensive reading is designed for students who do not meet
the requirements for satisfactory performance in English Language Arts (ELA). These students
may be enrolled the following year in an accelerated reading support program.
Philosophical Framework
The philosophical framework used in this dissertation of practice was the framework of
constructivism. According to constructivism, particularly radical constructivism, the child
functions in relation to its environment, constructing, modifying, and interpreting the information
s/he encounters in her/his relationship with the world (Glaserfeld, 1995). The individual’s
capacity to construct his/her own understanding of the world is connected with thinking and with
the fact that the individual is able to construct his or her own thoughts and interpretations
(Sutinen, 2008).
Constructivism was included as a theoretical framework in this dissertation of practice
because teaching and learning are about how teachers construct their classrooms and how
students learn to make sense of different aspects of the curriculum in different ways and will be
discussed further in Chapter Two.
Theoretical Framework
The theoretical framework used in this dissertation of practice centered around Maslow’s
hierarchy of needs. Maslow (1987), a humanistic psychologist, focused on potentials, believing
that human beings strive to reach their highest level of competence in all areas. Maslow
developed a theory of personality that has influenced many fields, especially education, and also
believed that the fundamental human goal is to become a fully functioning person, or as he called
it, a self-actualizing person.

10
Maslow established a five-level hierarchy of basic needs. They include (1) physiological
needs, (2) safety needs, (3) needs of love, affection, and belongingness, (4) needs for esteem, and
(5) needs for self-actualization.
Maslow’s hierarchy of needs has been included in this dissertation of practice because
student’s most basic needs must be met before any actual learning can begin to occur, especially
with students on free or reduced lunch, which is a significant focus of this dissertation of practice
and will be discussed further in Chapter Two.
Finally, a well-known theorist, Vygotsky, stressed the fundamental role of social
interaction in the development of cognition (Vygotsky, 1978). He believed strongly that
community plays a central role in the process of "making meaning." This quote was included in
this dissertation because administrators, instructional coaches, teachers, students, and their
families all play crucial role in impacting individual student diagnostic scores of students,
specifically with students on free or reduced lunch and aiming to close or reduce the income
achievement gap.
Conceptual Framework
The conceptual framework used in this dissertation of practice was the concept of
implementation fidelity and is currently described and defined in the literature in terms of five
elements that need to be measured (Dane & Schneider, 1998; Dusenbury, Brannigan, Falco, &
Hansen, 2003; Mihalic, 2004). These included: adherence to the intervention, exposure or dose,
quality of delivery, participant responsiveness, and program differentiation.
Within this idea of implementation fidelity, adherence to the intervention is the first
aspect and is defined as whether "a program or service or intervention is being delivered as it

11
was designed or written" (Mihalic, 2004, p. 2). Adherence to the intervention was included in
this dissertation of practice because four of the schools used the i-Ready reading program as
intended while the other three schools used only parts of the program and then supplemented the
curriculum with other instructional materials.
Dosage or exposure refers to the amount of intervention received by participants. In
other words, whether the frequency and duration of the intervention are as full as prescribed by
its designers (Dusenbury et al., 2003; Mihalic, 2004). For example, it may be that not all of the
elements of the intervention are delivered or are delivered less often than required. Coverage is
included under this element, i.e., whether all the people should be participating in or receiving
the benefits of an intervention actually do so (Carroll et al., 2007). Dosage is included in this
dissertation of practice because this allowed the researcher to examine how often and for how
long are teachers implementing the i-Ready reading program within each of the schools in this
study.
Quality of delivery, also known as fidelity, is the third aspect and is defined as "the
manner in which a teacher, volunteer, or staff member delivers a program" (Mihalic, 2004, p. 2).
However, quality of delivery is perhaps a more ambiguous element than this suggests. An
evaluation of this may require using a benchmark, either within or beyond that stipulated by an
intervention's designers; this element of fidelity could involve either delivering the intervention
using "techniques . . . prescribed by the program" (Mihalic, 2004, p.2), or applying a benchmark
from outside the program, i.e., "the extent to which a provider approaches a theoretical ideal in
terms of delivering program content" (Dusenbury et al., 2003, p.240). If a clear benchmark
exists, then the quality of delivery may be treated, along with adherence and dosage, as one of
three discrete aspects are required to assess the fidelity of an intervention (Carroll et al., 2007).

12
However, it may also be viewed as a moderator of the relationship between an intervention and
the fidelity with which it is implemented. For example, an intervention could be delivered but
delivered poorly; in turn, the degree of fidelity achieved by the implemented intervention could
be adversely affected.
Participant responsiveness is the fourth aspect and measures how far participants respond
to or are engaged by an intervention. It involves judgments by participants or recipients about
the outcomes and relevance of an intervention. In this sense, what is termed "reaction
evaluation" in the evaluation literature may be considered an essential part of any evaluation of
an intervention (Kirkpatrick, 1967). In a reading intervention, like i-Ready’s instructional and
computerized program, participant responsiveness may measure how much time a student
remains on task during the reading session
Program differentiation, the fifth aspect, is defined as "identifying unique features of
different components or programs" and identifying "which elements of . . . programs are
essential", without which the program will not have its intended effect (Dusenbury et al., 2003,
p.244-245). Despite it being viewed as an element of the implementation of the program to
complete fidelity by the literature, program differentiation actually measures something distinct
from fidelity. It is concerned with determining those elements that are essential for its success.
This exercise is an integral part of any evaluation of new interventions. It enables the discovery
of those elements that make a difference to outcomes and whether some elements are redundant.
Such so-called "essential" elements may be discovered either by canvassing the designers of the
intervention or, preferably, by "component analysis,” assessing the effect of the intervention on
outcomes and determining which components have the most impact (Hermens, Hak, Hulscher,
Braspenning, & Grol, 2001). This element would, therefore, be more usefully described as the

13
"identification of an intervention's essential components" (Carroll et al., 2007, p.3). This process
may also have implications for implementation fidelity; if, for example, these essential
components are the most difficult to implement, then this may then explain a lack of success
afflicting the intervention (Carroll et al., 2007).
Program differentiation was assessed in this dissertation of practice in terms of four
schools that used the i-Ready reading program to full fidelity and the other three schools used the
program to partial fidelity. These essential pillars of fidelity will be explored and discussed more
in Chapter Two.
Research Questions
1. To what extent, if at all, does using the i-Ready reading program to full or partial fidelity
impact reading diagnostic scores among middle school students based on the diagnostic
assessment scale scores?
2. To what extent, if at all, does using the i-Ready reading program to full or partial fidelity
impact reading diagnostic scores among middle school students who are on free or
reduced lunch based on the diagnostic assessment scale scores?
Delimitations
One delimitation in this study was that the research data was only gathered and analyzed
from the i-Ready reading diagnostic assessment scores from the second diagnostic assessment,
which was administered in January of 2021 after Winter Break, and the third diagnostic
assessment, which was administered in March of 2021 after Spring Break. FSA scores were not
analyzed in this study because of time constraints.
A second delimitation in this study was that students who have rushed or appear to have
rushed were not included in this study. i-Ready has two different indicators that allowed the

14
researcher to determine which students rushed. A red flag indicated that the student
unequivocally rushed through the diagnostic, and a yellow flag indicated that the student might
have possibly rushed through the diagnostic.
Limitations
One of the limitations in this study was that the data that will be collected, analyzed, and
interpreted may not be generalizable to all middle schools in the district, even though most were
included in this study. Other districts may use i-Ready diagnostics and instruction differently at
the middle school level and not the way that this district uses it (as an intervention), therefore
interpretations may not reflect the effectiveness, or possibly the lack thereof, in other districts.
A second limitation of this study was the accuracy of the data from the second and third
reading diagnostic assessments. Other factors could likely contribute to student scores. For
example, some factors that could have contributed to students’ scores include: classroom
management by the teacher in each classroom or setting, students taking the assessments
seriously, the teachers taking the assessment seriously, and students receiving accurate
accommodations for those students who have Individualized Education Plans (IEP’s).
A third limitation of this study was that individual teacher’s effectiveness of
implementing the i-Ready reading program, or possibly lack thereof, was not examined. For
example, a first-year teacher might use the i-Ready reading program to complete fidelity and that
teacher’s students’ scores may be lower than a veteran teacher who was rated as highly effective
and uses the i-Ready reading program to partial fidelity, but their students’ scores are higher than
that first-year teacher who was rated as developing or needs improvement. Also, teachers may
have added their own materials in addition to i-Ready reading curriculum, and that was not
examined in this study.

15
A fourth limitation of this study was that the i-Ready reading program is a
commercialized product that is packaged and sold to school districts. The i-Ready reading
diagnostic assessments are made by Curriculum Associates, and there may be a conflict of
interest in the product.
A fifth limitation of this study was that the second and third diagnostic assessments were
collapsed together when analyses began. Both assessments were analyzed together because they
were the same assessment, just given at two different points in the school year. The second
diagnostic assessment was administered right after Winter Break in January 2021 and the third
diagnostic assessment was administered right after Spring Break in March 2021.
Finally, this dissertation was completed during the 2020-21 school year and during the
COVID-19 pandemic. The school district in this study utilized three learning models throughout
the school year: face-to-face, hybrid, and at-home, with students logging into their classes as if
they were on campus. Considering the students’ capacity to alternate between the three models
throughout the school year, it is challenging to know how this might have affected student
diagnostic scores in terms of the research questions.
Assumptions
There were three assumptions in this study. First, all middle school reading teachers in
this study were using i-Ready to full or partial fidelity. The second assumption was that the
responses of the instructional coaches, assistant principals, and/or department heads who met
with the researcher to gauge the level of implementation of the i-Ready reading program were
open, honest, and accurate.
The third assumption in this study was that the teachers, coaches, and administrators who
are expected to implement or oversee the i-Ready instructional and computerized program were

16
adequately trained on how to properly implement the program, whether it be with full or partial
fidelity. This training could have come from trainers who work for Curriculum Associates,
district trainers who have been trained in i-Ready, or school-based staff members who have been
trained in the i-Ready program.
Organization of the Study
This research study is presented in five chapters. Chapter One is the Introductory chapter
and includes the background of the study, the statement of the problem, the purpose of the study,
the significance of the study, the definition of terms, the philosophical framework, the theoretical
framework, the conceptual framework, the research questions, the delimitations, the limitations,
the assumptions, the organization of the study, and finally a summary.
Chapter Two consists of the Literature Review chapter and includes reviews of the
philosophical framework, the theoretical framework, the conceptual framework, fidelity of
implementation and reading interventions, students on free or reduced lunch, i-Ready reading in
elementary school, i-Ready reading in middle school, i-Ready research in general, a summary,
and concludes with a summary table for the literature review.
Chapter Three outlines this study’s Methodology and includes an introduction, the
purpose of the study, the significance of the study, the method and design of the study, the
research questions, hypotheses, the population that will be utilized, how the data will be
collected, reliability and validity, how the data will be analyzed and will conclude with a
summary.
Chapter Four is the Results chapter and includes an introduction, descriptive statistics,
how to test the research questions (or hypotheses), the research design and statistical analysis
plan, and will conclude with a summary.

17
Chapter Five provides the Discussion related to the results of the study and includes an
introduction, a summary of the study, a discussion of the findings, limitations, implications for
policy, implications for practices, recommendations for future research, conclusions, and will
conclude with a summary.
Summary
In conclusion, an income diagnostic scores gap persists in education, specifically when
looking at students on free or reduced lunch and their families. Because of this income
diagnostic scores gap, some interventions are required at Title I schools with the aim of closing
or reducing that gap. One of those interventions, at least at the middle school level in this district
in Central Florida, is a commercial product purchased by the district and required
implementation, is a computer and instructional program called i-Ready. At the middle school
level in this district, students are placed into intensive reading when their FSA scores are a Level
1 or Level 2. Level 1 and Level 2 scores are considered "not proficient" according to the FSA
and i-Ready is the primary curriculum the schools are required to use.
However, not all of the middle schools in this school district used the i-Ready program to
complete fidelity. Therefore, the purpose of the study was to examine the effectiveness of the
full or partial implementation of i-Ready to complete fidelity because little research exists on its
effectiveness at the middle school level in terms of reading diagnostic scores.
The philosophical framework used in this study centered around constructivism and was
included because teaching and learning are about how teachers construct their classrooms and
how students learn to make sense of different aspects of the curriculum in different ways. The
theoretical framework used in this study centered around Maslow’s hierarchy of needs and was
included because student’s most basic needs must be met before any actual learning can begin to

18
occur, especially with students on free or reduced lunch. The conceptual framework of this
study centered around five essential pillars to the definition of fidelity: adherence to the
intervention, exposure or dose, quality of delivery, participant responsiveness, and program
differentiation and were included to gauge the level of implementation of the i-Ready reading
program at each of the seven schools in one Central Florida school district. The research
questions centered around full or partial implementation within intensive reading courses in
middle school and its effects on closing the income achievement gap. One of the delimitations
of this study was focusing on seven of the middle schools within the Central Florida school
district and not all of them. One of the limitations of this study was that the results might not
have generalizability to other middle schools in the district. Finally, one significant assumption
was that instructional coaches and assistant principals who met with the researcher were active
and truthful participants in this research process.

19
CHAPTER TWO: LITERATURE REVIEW
Introduction
This chapter represents the rationale for conducting research on fidelity to the i-Ready
program, in reading, at the middle school level, and how that affects student diagnostic scores.
While all students in intensive reading were used in this study, students on free or reduced lunch
were specifically examined to see how the i-Ready program attempted to close the diagnostic
scores gap for this subgroup.
This chapter provides a review of the literature to this study. It includes an overview of
the philosophical framework, the theoretical framework, the conceptual framework, fidelity of
implementation and reading interventions, students on free or reduced lunch, i-Ready in
elementary school, i-Ready in middle school, i-Ready research in general, a summary, and
concludes with a summary table of the literature review.
While this chapter will outline the significant research that exists on i-Ready and its
effectiveness at the elementary school level, this chapter will also highlight the fact that there is a
lack of research on using the i-Ready program to complete fidelity at the middle school level.
This study aimed to contribute to the research on the effectiveness, or lack thereof, of using the i-
Ready reading program to full or partial fidelity.
Philosophical Framework
The philosophical framework used in this dissertation of practice is the philosophy of
constructivism. According to constructivism, particularly radical constructivism, the child
functions in relation to its environment, constructing, modifying, and interpreting the information
s/he encounters in her/his relationship with the world (Glaserfeld, 1995). The individual’s
capacity to construct his/her own understanding of the world is connected with thinking and with

20
the fact that the individual is able to construct his or her own thoughts and interpretations
(Sutinen, 2008).
Cunningham (1990, p. 429) found that first-grade children given what she termed “meta-
level phonemic awareness training (training in speech sound segmentation and blending)”
displayed more significant reading comprehension growth than a group given skill-and-drill
phonemic awareness training. Unlike the skill-and-drill group, the meta-level group was taught
to reflect on the role of phonemic awareness in aiding their decoding, explicitly discussed the
goals and purposes of the training, were taught how to integrate the skill with other strategies,
were taught to reflect on the utility of the strategy, and “the teacher modeled the skill in a
hypothetical reading context, whereafter the child had an opportunity to perform the skill under
her tutelage” (Cunningham, 1990, p.436).
Constructivist Assumptions in Education: Considering the Data
Developmentalist notions of the natural tendency toward learning and the importance of
not interfering with the natural learning process are key assumptions that underpin current
constructivist teaching practices (Matthews, 2003). One essential notion contends that the learner
has an active role in interpreting the learning process and that education should be child-directed
and not teacher-directed. According to Piaget (1973), children, as operational thinkers, progress
through three stages of thinking: preoperational, concrete, and formal operational. Based on the
assumed reality of these stages, constructivist teachers need to adapt their teaching styles,
approach, and content to the specific developmental stage of the child. As Waite-Stupiansky
(1997, p.9) states, “Children need to progress through levels of representation at a rate that fits
their levels of understanding. If highly abstract symbols are presented too quickly, such as

21
flashcards with words printed on them, children may achieve only a surface-level of memorization
without deeper understanding”.
Related to the above notion of the importance of a deeper understanding of learning is the
assumption that social interactions and context is necessary for learning to occur (Matthews,
2003). Again, as Waite-Stupiansky (1997, p.22) stated, “The context provided by social
interactions among peers is a natural learning environment in which logical reasoning can
develop. The feedback is usually immediate, and the motivation to succeed is high”.
Constructivist teaching practice assumes the motivation to learn is internally generated by
the child (Matthews, 2003). Waite-Stupiansky (1997, p. 23) states, "Extrinsic rewards, fear of
punishment, and traditional grading systems work against the child's intrinsic motivation to make
sense out of the world. If children work toward pleasing the teacher instead of satisfying their
natural search for understanding, they will not progress toward intellectual autonomy".
The previous notions, in their current form, are value statements. However, with a little
clarity regarding measurability and an operational definition or two, irrefutable value statements
become empirically testable hypotheses. Constructivist teaching practices are relatively clear
about the underlying assumptions; however, there is considerably less clarity regarding the
empirical validity of those assumptions (Matthews, 2003).
As mentioned above, a fundamental notion in constructivist teaching is the importance of
matching teaching style to student learning style. This idea has been referred to in the
psychological literature as aptitude by treatment interactions (ATI) (Cronbach & Webb, 1975).
ATI is an idea, which has held great diagnostic and practical appeal in the area of applied
psychology. For the latter half of the 20th century, the ATI approach has been the driving
principle of special education. Thus, for children who demonstrate problems in learning, various

22
standardized tests (e.g., the Weschler Intelligence Scales for Children) have been used in an
attempt to diagnose an underlying learning deficit (e.g., auditory processing) for which a specific
treatment intervention will be applied. However, after much scientific effort, there is simply no
empirical evidence supporting the notion that matching teaching and learning style has any effect
on any educational outcome (Cronbach, 1957, 1975; Kavale & Fomess, 1987; Yesseldyke,
1973). Matching the teaching style to the child's aptitude for the general or special education
student, while a tenet of developmentalism and constructivist practice, is not an empirically
defensible practice.
A second assumption discussed earlier is the claim that context is necessary for learning
to occur. The claims for contextualized learning are overstated and reject the considerable body
of research on the importance of decontextualized learning, as anyone who has ever played
tennis, a musical instrument, or learned to drive a car will attest. There is well-documented
evidence that: (1) human cognitive processing breaks down large tasks into smaller ones; and (2)
learning transfer and generalization occur and are more efficient than only stimulus-specific
context learning (Stone & Clements, 1998). For example, with regard to the use of context in
early reading development, there is strong empirical evidence that suggests not only do poor
readers use context, but they show larger contextual use when compared to strong readers
(Stanovich, 2009). Thus, the whole-language based notion that the skilled reader barely looks at
the words on the page when subjected to empirical testing failed to receive support (Goodman &
Smith, 1973).
Finally, developmentally based educational proponents argue that drill, corrective
feedback, and the use of incentives are inhibitory to the naturally occurring learning process
(Deci & Ryan, 1985). However, a comprehensive review of the research literature by Cameron

23
and Pierce (1994) concluded that the data simply does not support the assertion that external
incentives should be eliminated from the classroom. Most school psychologists and special
educators have known the value of positive reinforcement for years. For example, in a
comprehensive review of experimental interventions employed over the previous 30 years with
students identified as learning disabled, Swanson and Hoskyn (1998) found significant and large
effects for direct instructional models (i.e., skills-based behaviorally oriented instruction) with
this population. The empirical literature is replete with considerable support for the claims that
increased instructional time is directly related to improved student performance (Paine, 1983),
external reinforcers can increase diagnostic scores performance (Cameron & Pierce, 1994),
students can and do learn in decontextualized settings (Stanovich, 2009; Stone & Clements,
1998), and specific skills are required for various aspects of learning (e.g., phonological skills
and reading fluency) (Adams, 1990; Stanovich, 2009; Foorman, 1995; Gough & Hillinger,
1980).
One might ask why the gap between evidence-based and developmental/constructivist
teaching practices? The answer lies in the fundamental and conflicting assumptions of each
view. According to Matthews (2003), the goal of science is to eliminate error variance, or bias,
in the explanation of the effect of the independent variable on the dependent variable. At the
same time, such error variance or alternative explanations can never be entirely eliminated.
Through careful experimentation based on probability statements are when generalizable causal
inferences can be made, which have utility to inform the practice of teaching and student
learning. However, as stated earlier, notions of an observable and objective reality are in direct
conflict with the basic assumptions of a developmental or constructivist worldview (Matthews,
2003). The developmental/constructivist belief is that learning is the result of an emergent

24
process. Any process that is contrary to the belief in emergent learning is met with (non-
empirical) skepticism. Since beliefs are not testable propositions, scientific methodology and its
resultant data typically have little meaning for the developmental/constructivist educator.
Why Constructivism?
In conclusion, constructivism was included as a theoretical framework in this dissertation
of practice because teaching and learning are about how teachers construct their classrooms and
how students learn to make sense of different aspects of the curriculum in different ways.
Theoretical Framework
Maslow’s Hierarchy of Needs
Maslow (1987), a humanistic psychologist, focused on potentials, believing that human
beings strive to reach their highest level of competence in all areas. Maslow developed a theory
of personality that has influenced many fields, especially education, and also believed that the
fundamental human goal is to become a fully functioning person, or as he called it, a self-
actualizing person.
Maslow established a five-level hierarchy of basic needs. They include (1) physiological
needs, (2) safety needs, (3) needs of love, affection, and belongingness, (4) needs for esteem, and
(5) needs for self-actualization.
The first level of Maslow’s (1987) hierarchy is physiological needs. Physiological
needs are the most vital and most basic needs necessary to sustain life. That includes oxygen,
food, and water. They are the most vital needs because if a person were deprived of all needs,
the physiological ones would come first in the person’s search for satisfaction.

25
The second level of Maslow’s (1987) hierarchy is safety needs. When all the
physiological needs are satisfied and are no longer controlling thoughts and behaviors, the needs
for security can become active. Adults have little awareness of their security needs except in
times of emergency or periods of disorganization in the social structure, and children often
display the signs of insecurity and the need to be safe.
The third level of Maslow’s (1987) hierarchy is the needs of love, affection, and
belongingness. When the needs for safety and for physiological well-being are satisfied, then the
needs for love, affection, and belongingness can begin to emerge. Maslow believed that people
seek to overcome feelings of loneliness and alienation. This involves both giving and receiving
love, affection, and a sense of belonging.
The fourth level of Maslow’s (1987) hierarchy of needs is the need for esteem. When
and only when the first three levels of needs are satisfied, then the needs for esteem can become
dominant. These involve the needs for both self-esteem and for the esteem a person gets from
others. Humans have a need for a stable, firmly based, high level of self-respect and respect
from others. When the needs are satisfied, then the person feels self-confident and valuable as a
person in the world. When these needs are frustrated, the person feels inferior, weak, and
helpless.
The fifth and final level of Maslow’s (1987) hierarchy of needs is the need for self-
actualization. Only when all the foregoing’s are satisfied can the needs for self-actualization be
activated. This is a person's need to be and do what the person was ‘born to do’ (Kezar,
Walpole, & Perna, 2015). These needs make themselves felt in signs of restlessness. The person
feels on edge, tense, lacking something, in short, restless. If a person is hungry, unsafe, not loved

26
or accepted, or lacking self-esteem, it is straightforward to know what the person is restless
about. It is not always clear what a person wants when there is a need for self-actualization.
Maslow believed that the only reason people would not move towards self-actualization
is because of hindrances placed in their way by society. He recommended ways educators could
use approaches that helped students make personal growth by responding to the potential in each
individual. Maslow suggested that if people were asked for their philosophy of the future -such
as what their ideal life or world would be like – researchers would get vital information as to
what needs they do or do not have covered (Boeree, 1998).
Why Maslow?
Maslow’s hierarchy of needs has been included in this dissertation of practice because
student’s most basic needs must be met before any actual learning can begin to occur, especially
with students on free or reduced lunch, which is a significant focus of this dissertation of
practice.
Conceptual Framework
Within this framework, it measures whether an intervention, as implemented as intended,
is crucial to understanding and interpreting outcomes. However, just like comprehension,
fidelity is an unwieldy construct that involves multiple dimensions that are measured through
varied methodologies (Fogarty, Oslund, Simmons, Davis, Simmons, Anderson, & Roberts,
2014).
The concept of implementation fidelity is currently described and defined in the literature
in terms of five elements that need to be measured (Dane & Schneider, 1998; Dusenbury,
Brannigan, Falco & Hansen, 2003; Mihalic, 2004). The essential elements that will be used in
27
this study to define and determine fidelity include adherence to the intervention, exposure or
dose, quality of delivery, participant responsiveness, and program differentiation.
Adherence
Within this idea of implementation fidelity, adherence to the intervention is defined as
whether "a program or service or intervention is being delivered as it was designed or written"
(Mihalic, 2004, p.2).
Adherence also addresses whether the components of the intervention are delivered as
intended. Surface fidelity is a term coined by Dane and Schneider (1998) and should be
considered synonymous within the dimension of adherence. When studies do examine the
fidelity of implementation, adherence is usually the primary measure considered (Fogarty et al.,
2014). Several studies have found statistically significant effects on the assessment of adherence
in reading (Benner, Nelson Stage, & Ralston, 2011; Browder, Trela, & Jimenez, 2007) and other
curricular areas (Allinder, Bolling, Oats & Gagnon, 2000; Penuel & Means, 2004; Ysseldyke,
Spicuzza, Kosciolek, Teelucksingh, Boys, & Lemkuil, 2003).
Adherence to the intervention was included in this dissertation of practice because four of
the schools used the i-Ready reading program as intended while the other three schools used only
parts of the program and then supplemented the curriculum with other instructional materials.
Dosage
Dosage or exposure refers to the amount of intervention received by participants. In other
words, whether the frequency and duration of the intervention are as full as prescribed by its
designers (Dusenbury et al., 2003; Mihalic, 2004). For example, it may be that not all the

28
elements of the intervention are delivered or are delivered less often than required. Coverage
may be included under this element, i.e., whether all the people should be participating in or
receiving the benefits of an intervention actually do so (Carroll et al., 2007).
Dane and Schneider (1998) articulated three ways to collect dosage information,
including (a) the number of sessions the intervention was implemented, (b) the length of the
session, and (c) frequency with which program components were implemented. Determining the
quantity of the intervention implementation can help determine whether students received an
acceptable amount of reading intervention and the relationship between dosage and outcomes
(Fogarty et al., 2014). Cantrell, Almasi, Carter, Rintamaa, and Madden (2010) found limited
variation among participating teachers in terms of aggregated minutes of strategy-based reading
intervention implementation per week. The number of minutes teachers implemented the
intervention was not significantly correlated with student outcomes. Despite these initial
findings, the dosage is a prominent variable within theoretical models of fidelity (Dane &
Schneider, 1998; Jones, Clarke, & Power, 2008). To examine the potential impact of exposure to
the intervention on student outcomes, specific examination of dose and variation of dose among
implementers appears wanted (Fogarty et al., 2014).
Dosage is included in this dissertation of practice because this allowed the researcher to
examine how often and for how long are teachers implementing the i-Ready reading program
within each of the schools in this study.
Quality of Delivery
Quality of delivery is defined as "the manner in which a teacher, volunteer, or staff
member delivers a program" (Mihalic, 2004, p. 2). However, it is perhaps a more ambiguous
29
element than this suggests. An evaluation of this may require using a benchmark, either within
or beyond that stipulated by an intervention's designers; this element of fidelity could involve
either delivering the intervention using "techniques . . . prescribed by the program" (Mihalic,
2004), or applying a benchmark from outside the program, i.e., the extent to which a provider
approaches a theoretical ideal in terms of delivering program content (Dusenbury et al., 2003). If
a clear benchmark exists, then the quality of delivery may be treated, along with adherence and
dosage, as one of three discrete aspects are required to assess the fidelity of an intervention
(Carroll et al., 2007). However, it may potentially also be viewed as a moderator of the
relationship between an intervention and the fidelity with which it is implemented. This role of
the moderator is simply not explored in the literature to date. For example, an intervention could
be delivered but delivered poorly; in turn, the degree of fidelity achieved by the implemented
intervention could be adversely affected.
Dane and Schneider (1998) described the quality of delivery as a measure that captures
aspects that are not prescribed by the intervention but can have an impact on student outcomes,
such as preparedness, enthusiasm, and attitude. Gersten, Fuchs, Compton, Coyne, Greenwood,
and Innocenti (2005) discussed the importance of quality in providing insights into the effects or
non-effects of an intervention beyond the mere adherence to an intervention’s components.
Gresham (2009, p. 534) concluded, “One can adhere to a particular intervention with perfect
integrity yet do so in an incompetent manner.” In a study of the effects of the Corrective reading
Decoding Program with middle school students, Benner et al. (2011) found a statistically
significant relationship between the quality of implementation and reading outcomes.
Nonetheless, the quality of implementation is not routinely incorporated in the fidelity of
implementation measures (Fogarty et al., 2014).
30
Participant Responsiveness
Participant responsiveness measures how far participants respond to or are engaged by an
intervention. It involves judgments by participants or recipients about the outcomes and
relevance of an intervention. In this sense, what is termed "reaction evaluation" in the evaluation
literature may be considered an essential part of any evaluation of an intervention (Kirkpatrick,
1967).
According to Dane and Schneider (1998), this dimension can measure participant
enthusiasm and engagement in the intervention. In a reading intervention, like i-Ready’s
instructional and computerized program, participant responsiveness may measure how much
time a student remains on task during the reading session. Theoretically, higher engagement
would positively influence reading outcomes. One study found a strong relationship between
student engagement in reading activities and reading comprehension outcomes of secondary
students, however, participant responsiveness is not typically assessed in intervention studies
(Taboada, Townsend, & Boynton, 2013).
Program Differentiation
Program differentiation, the fifth and final aspect, is defined as "identifying unique
features of different components or programs" and identifying "which elements of . . . programs
are essential", without which the program will not have its intended effect (Dusenbury et al.,
2003, p. 244-245). Despite being viewed as an element of implementation fidelity by the
literature, program differentiation actually measures something distinct from fidelity. Program
differentiation is concerned with determining those elements that are essential for its success.
This exercise is an essential part of any evaluation of new interventions. Program differentiation

31
enables the discovery of those elements that make a difference to outcomes and whether some
elements are redundant. Such so-called "essential" elements may be discovered either by
canvassing the designers of the intervention or, preferably, by "component analysis," assessing
the effect of the intervention on outcomes and determining which components have the most
impact (Hermens et al., 2001). This element would, therefore, be more usefully described as the
"identification of an intervention's essential components." This process may also have
implications for implementation fidelity; if, for example, these essential components are the most
difficult to implement, then this may then explain a lack of success afflicting the intervention
(Carroll et al., 2007).
Dane and Schneider (1998, p.45) described this dimension as a “safeguard against the
diffusion of treatment.” Hulleman and Cordray (2009, p. 91) emphasized program
differentiation in their definition of fidelity as “the treatment has to be stronger or different from
the counterfactual condition.”
In intervention research, accurate differentiation between the intervention and typical
practice conditions is crucial in establishing internal validity (Fogarty et al., 2014). In reading
comprehension, Vaughn, Roberts, Klingner, Swanson, Boardman, Stillman-Spisak, and Leroux
(2013) examined the Collaborative Strategic reading Program and found no statistically
significant difference between conditions in the reading classrooms. The authors attributed a
lack of intervention effects on contamination measured by program differentiation occurred more
frequently in reading classes than in English Language Arts classes. Given the need to
authentically express intervention effects, and the need for objective information to differentiate
targeted interventions from other practices, specific assessment of program differentiation is
warranted (Fogarty et al., 2014).

32
Dane and Schneider (1998) advocated that a comprehensive approach to complete
fidelity assessment that addresses all five dimensions would allow researchers to better
understand the relationship between treatment implementation and student outcomes, as well as
compare findings across studies. Although their framework was designed for the health
sciences, it has applicability to reading comprehension research where intervention effects are
often difficult to achieve and interpret (Fogarty et al., 2014).
Among existing studies on the relationship between multiple fidelity measures and
student outcomes, Benner et al. (2011) examined fidelity in relation to student outcomes for
decoding intervention for fifth-grade to eighth-grade struggling readers. Fidelity was captured in
three ways: overall fidelity, adherence, and quality. Overall treatment fidelity accounted for
twenty-two % of the variance in basic reading skills and eighteen % of passage comprehension.
Adherence and quality scores were given for five different targeted teacher actions required for
the decoding program to be considered that it was implemented. Adherence and quality also had
a statistically significant effect on the reading outcomes of students’ basic reading and passage
comprehension scores. In 2004, Klingler et al. found that high quantity and quality of the
Collaborative Strategic reading implementation was associated with higher student performance
on a standardized reading outcome.
Program differentiation was assessed in this dissertation of practice in terms of four
schools that used the i-Ready reading program to full fidelity and the other three schools used the
program to partial fidelity.
Fidelity of Implementation and Reading Interventions
Typically, research on adolescent reading interventions reports an overall Fidelity of
Implementation (FoI) score and is usually operationalized as adherence to the intervention

33
(Denton, Wexler, Vaughn, & Bryan, 2008). This study investigated the effectiveness of a
multicomponent reading intervention implemented with middle school students with severe
reading difficulties, all of whom had received remedial and/or special education for several years
with minimal response to the intervention. Participants were 38 students in grades 6-8 who had
severe deficits in word reading, reading Fluency, and reading comprehension. Now, most of
these students were English Language Learners (ELLs) with identified disabilities. However,
nearly all students demonstrated severely limited vocabulary for both English and Spanish.
Students were randomly assigned to receive an intervention (n = 20) or typical instruction
provided in their school’s remedial reading or special education classes (n = 18). Students in the
treatment group received daily direct and systematic small-group intervention for 40 minutes
over 13 weeks, consisting of a modified version of a phonics-based remedial program augmented
with English as a Second Language (ESOL) practices and instruction in vocabulary, fluency, and
comprehension strategies. Results from this study indicated that treatment students did not
demonstrate significantly higher outcomes in word recognition, comprehension, or fluency than
students who received the school’s typical instruction and that neither group demonstrated
significant growth over the course of the study. Denton et al. (2008) noted that significant
correlations were found between scores on teachers’ ratings of students’ social skills and
problem behaviors and posttest decoding and spelling scores, and between English oral
vocabulary scores and scores in word identification and comprehension. Denton et al. (2008)
hypothesized that middle school students with the most severe reading difficulties, particularly
those who are ELLs and those with limited oral vocabularies, may require the intervention of
considerably greater intensity than provided in their study. The researchers noted that further
research directly addressing features of effective remediation for these students as needed.
34
In terms of fidelity of an implementation score, this score is generally reported across
teachers to support the claim that overall, the intervention was implemented with high fidelity
(Troyer, 2017). In this study, Troyer (2017) documented the process of implementation of an
adolescent reading intervention. Using data from 17 observations of teachers (n = 17) during the
2013-2014 school year, Troyer (2017) conducted a nuanced descriptive analysis of fidelity of
implementation. The researcher analyzed weekly logs completed by literacy coaches (n = 3) to
examine the variation in quantity and intensity of coaching. The researcher then compared
variation in coaching with variation in FoI and then finally compared FoI to outcomes for
students (n = 287). Troyer (2017) found that FoI at observation one was found to predict
coaching time, and FoI across both observations predicted student outcomes, which emphasizes
the critical role of implementation in intervention research.
Multi-Tiered System of Support (MTSS)
The Positive Behavior Interventions and Supports (PBIS) system have been consistently
correlated with reductions in student exclusion suspensions, expulsions, poor attendance, and
high school dropout rates (Scott, Gage, Hirn, Lingo, & Burt, 2019). However, schoolwide
strategies that do not specifically involve effective instruction in academic areas are unlikely to
result in academic diagnostic scores. To address this reality, MTSS involving tiered intervention
for both academic and behavior have become commonplace (Scott et al. 2019). The Academic
and Behavior Response to Intervention School assessment (ASA) was developed to assess
fidelity with which schools are implementing MTSS for reading, Mathematics, and behavior. In
this study, Scott et al. (2019) used the ASA to assess MTSS fidelity across 29 schools, and over
the course of four years, analyses were conducted to determine the predictive validity of sub-

35
group domain scores. The question these researchers analyzed was whether the ASA scores
were predictive of student outcomes in terms of suspension and of state academic diagnostic
scores in the areas of reading, Math, and Language. Results showed that schools with higher
fidelity in the behavior domain had significantly lower suspension events than matched
comparison schools. In comparison, higher fidelity in the reading domain was associated with
more students at or above proficient on both the Language Mechanics measure and the
mathematics measure, but not in reading. Furthermore, higher fidelity in the Math domain was
also associated with more students at proficiency or above on the Language Mechanics, but not
in Math or reading. Scott et al. (2019) noted that the results indicated the need for further
development of fidelity assessments and future research was needed.
Free and Reduced Lunch Students
Historically, as a group, students on free or reduced lunch have performed less well than
high-income students on most measures of academic success-including standardized test scores,
grades, high school completion rates, college enrollment, and college completion rates (Reardon,
2013, p.10). In his research, Reardon aimed to conduct a comprehensive study of the
relationship between academic achievement and family income in the United States over the past
50 years. Reardon (2013) used data from 12 nationally representative studies that included
information on family income and student performance on a standardized test in math or reading.
Because each of the criteria measured reading and Math skills on a different scale, Reardon
standardized all the test scores and expressed the income achievement gap in standard deviation
units (Reardon, 2011). From this comprehensive study, Reardon found three striking findings.
First, the income achievement gap has grown significantly in the last three decades. Second,
income gaps in other measures of educational success have increased as well. Finally, the

36
income achievement gap is already significant when children enter kindergarten, and it does not
significantly grow as they progress through school.
In 2012, Ladd supported these findings when he argued that current policy initiatives
were misguided because they either denied or set aside a basic body of evidence that documented
how students from free or reduced lunch households, on average, performed less well in school
than those who were not on free or reduced lunch. Ladd (2012) also argued that addressing the
educational outcomes faced by children from on free or reduced lunch families will require a
broader and bolder approach to educational policy than the recent efforts to reform schools.
What Role can Schools Play?
Schools have a pivotal role to play in the efforts to reduce the diagnostic scores gap in
students on free or reduced lunch. Reardon (2013, p.14) suggests three specific areas that
schools should focus on. First, states and school districts could devote a more significant share
of their resources and efforts to the earliest grades, including kindergarten and preschool.
Second, there is growing evidence that suggests, if used efficiently, more time in school may
help to narrow academic diagnostic scores gaps (Dobbie & Fryer, 2011). Third, states and
school districts can do more to ensure that all students have equal access to high-quality teachers,
stimulating curriculum and instruction, and adequate school resources (computers, libraries, and
the like). Reardon (2013, p.14) also explains that school districts can work against the growing
segregation by developing student assignment systems that promote socioeconomic diversity
within schools.
The district in Central Florida used in this study uses i-Ready as an intervention in middle
schools for these purposes. Funds to purchase the i-Ready reading program come out of the

37
district budget. The next section few sections examine the research behind i-Ready, its recent
and broad implementation, and its use at various levels and subjects.
i-Ready Reading in Elementary School
Swain, Randel, and Dvorak (2020) implemented a quasi-experimental design (QED)
using 2018–19 i-Ready diagnostic and Instruction data to evaluate the impact of Curriculum
Associates' reading i-Ready Instruction on student reading diagnostic scores at grades K–5. The
researchers hypothesized that student diagnostic scores, as measured by the i-Ready diagnostic,
would be higher for students using i-Ready instruction for reading over a comparison group of
students who did not use this instruction. They conducted matching to identify a set of
comparison students demographically similar to their i-Ready instruction treatment students for
each grade level.
First, they stratified the sample by gender, English learner status, disability status, and
economic disadvantage status. Next, they used propensity score matching to identify analytic
samples of i-Ready Instruction and comparison students matched on baseline reading student
diagnostic scores. Students who received the i-Ready instruction and students in the comparison
group were administered the reading i-Ready diagnostic assessments.
Hierarchical-linear modeling (HLM) was conducted separately for each analytic sample
with students at a level I and school at a level II to evaluate its impact. Results suggest students
using i-Ready instruction with fidelity performed statistically significantly better on reading
performance than students in grades K–5 who did not use this instruction. The effect sizes fall
within or exceed (in the case of kindergarten) the range for which recent research by Kraft (2020,
p. 248) has found it typical of education interventions. These findings provide the support that,

38
when used with fidelity, student use of i-Ready Instruction for reading is tied to higher student
reading diagnostic scores.
In a similar but contradictory study, Silva (2016) set out to determine the effectiveness of
the i-Ready computerized reading program in improving the reading diagnostic scores of first
graders. This quantitative study was conducted at an elementary school in California during the
2014-2015 academic school year. Students in both the treatment and control groups took an
Open Court fluency pretest and posttest as well as a pretest and posttest for the i-Ready reading
diagnostic.
Silva (2016) wanted to determine if there were differences in reading and fluency
diagnostic scores that existed between the two groups. In the end, an ANCOVA was performed
on the pre-assessment and post-assessment data of the first-graders who participated in the i-
Ready program and those students who did not. In overall reading diagnostic scores, the first-
grade students who did not participate outperformed those who did. However, as Silva (2016)
points out, there was no significant difference in reading fluency diagnostic scores between those
first-grade students who participated in the i-Ready program and those who did not.
i-Ready Reading in Middle School
HumRRO, a third-party research firm, examined the impact of i-Ready Instruction for
reading among middle school students in Grades 6–8 during the 2017–2018 school year
(Randel & Swain, 2019). Using a quasi-experimental design with propensity score matching
designed to meet ESSA Level 2 criteria, which is considered Moderate Evidence, HumRRO
identified a final sample of 24 schools and nearly 19,000 students. Using hierarchical linear
modeling, HumRRO found that sixth-grade students using i-Ready instruction for reading
experienced statistically significantly higher spring diagnostic assessment scores than students
39
not using i-Ready instruction. Students using i-Ready instruction in Grades 7 and 8 experienced
higher spring scores than students not using i-Ready instruction, but the differences were not
statistically significant.
In 2019, Aguilar began a program evaluation that was designed to explore the use of the
i-Ready diagnostic as part of a rural middle school's assessment process. The program
evaluation sought to gather evidence regarding the availability of different i-Ready reading
measures that were administered in the Fall, Winter, and Spring to predict student performance
on the end-of-the-year high-stakes tests in New York (NYS). This evaluation by Aguilar (2019)
also examined the variability in student performance on i-Ready measures based on demographic
characteristics, including grade, gender, socio-economic status, ethnicity, and educational
program. The evaluation was conducted using archival student data from the 2016-2017 school
year and was analyzed using multivariate statistical methods.
Just like the previous study from Dvorak, Randel, and Swain (2019c), the data revealed
that i-Ready reading diagnostic scores demonstrated a strong relationship with the NYS exam
scores. However, the repeated measures that were administered in the Fall, Winger, and Spring
provided little new information about variability in student reading performance compared to one
single measure. In regards to differences in i-Ready performance across disaggregated
subgroups of students, the results suggest significant differences exist across time based on
grade, gender, socio-economic status, ethnicity, and educational program.
i-Ready Research in General
The following general study was conducted by Curriculum Associates, themselves, which
is the company that created and sold the i-Ready reading program. Curriculum Associates
analyzed data from more than one million students who took the i-Ready diagnostic in the 2017–
40
2018 school year in grades K-8 (Curriculum Associates, 2019a). In reading, students who used
i-Ready instruction for an average of 45 minutes or more per subject per week for at least 18
weeks experienced more significant learning gains compared to students who did not, when
controlling for prior diagnostic scores. 45 minutes per week would fall under the category of
dosage when analyzing using the i-Ready reading program to full fidelity. This study also
examined differences among special populations. Students with disabilities, students who were
English Language Learners (ELL), and students who were on free or reduced lunch who used i-
Ready instruction all saw more significant growth than students from the same subgroups who
did not have access to the i-Ready reading program. The significance of the findings from the i-
Ready reading diagnostic and the rigorous study design provide support for i-Ready as an
intervention program that meets the criteria for Level Three on ESSA, which is considered
Promising Evidence. Promising evidence, according to ESSA, is supported by one or more well-
designed and well-implemented correlational studies with statistical controls for selection bias.
Summary
In reviewing and analyzing these studies, one might conclude that using i-Ready to
complete fidelity tends to yield the best results. However, other programs or other strategies
could be used as a substitute or as supplemental curriculum to also achieve equal or better
reading scores the i-Ready reading diagnostic assessments. In all of the research studies, no
mention was made of teacher-created lessons that had significant impacts on student diagnostic
scores, when students have shown that the classroom teacher is the most important variable in
reading diagnostic scores. There was also no mention of other supplemental curricula that
improved individual student diagnostic scores for reading; it was only math. So, in terms of i-
Ready reading instruction, should teachers follow the program to complete fidelity? These
41
questions, along with the research question mentioned previously, will be explored throughout
this study.
A review of the literature showed several themes. As shown in Table 1, reading
encompasses constructivism, Malow’s hierarchy of needs, the fidelity of implementation, fidelity
of implementation and reading interventions, students on free or reduced lunch, how i-Ready is
in elementary schools for reading and how i-Ready is used at the middle school level for reading,
and finally i-Ready research in general.

42
Table 1 Thematically Organized Review of the Reading Literature
Study Theme Relevant Findings
Glaserfeld (1995) Constructivism The child functions in relation to their environment.
Sutinen (2008) Constructivism An individual’s capacity to construct his or her own
understanding of the world is connected with thinking.
Cunningham (199) Constructivism First-grade children given “meta-level phonemic
awareness training” displayed greater reading
comprehension growth than a group given skill-and-
drill phonemic awareness training.
Matthews (2003) Constructivism Developmentalist notions of the natural tendency
toward learning and the importance of not interfering
with the learning process are vital assumptions.
Piaget (1973) Constructivism Children, as operational thinkers, progress through
three stages of thinking: preoperational, concrete, and
formal operational.
Waite-Stupiansky
(1997)
Constructivism Children need to progress through levels of
representation at a rate that fits their levels of
understanding.
Cronbach & Webb
(1975)
Constructivism A fundamental notion in constructivist teaching is the
importance of matching teaching style to student
learning style.
Cronbach (1957);
Kavale & Fomess
(1987);
Yesseldyke (1973)
Constructivism There is simply no empirical evidence supporting the
notion that matching teaching style and learning style
has any effect on any educational outcomes.
Stone & Clements
(199)
Constructivism The human cognitive process breaks down large tasks
into smaller ones, and learning transfer and
generalization occur and are more efficient than only
stimulus-specific context learning.

43
Study Theme Relevant Findings
Stanovich (2009) Constructivism In early reading development, there is strong empirical
evidence that suggests that not only do poor readers
use context, but they show more considerable
contextual usage when compared to strong readers.
Goodman & Smith
(1973)
Constructivism The whole-language based notion that the skilled
reader barely looks at the words on the page when
subjected to empirical testing has failed to receive
support.
Deci & Ryan
(1985)
Constructivism The researchers argued that drill, corrective feedback,
and the use of incentives are inhibitory to the naturally
occurring learning process.
Cameron & Pierce
(1985)
Constructivism The researchers concluded that the data simply does
not support the assertion that external incentives should
be eliminated from the classroom.
Swanson &
Hoskyn (1998)
Constructivism Found significant and large effects for direct
instructional usage models.
Paine et al. (1983) Constructivism Support was found for the claim that increased
instructional time is directly related to improved
student performance.
Cameron & Pierce
(1994)
Constructivism External reinforcers can increase diagnostic scores
performance.
Stanovich (1986);
Stone & Clements
(1998)
Constructivism Students can and do learn in decontextualized settings.
Adams (1990);
Stanovich (1998);
Foorman (1995);
Gough & Hillinger
(1980)
Constructivism Specific skills are required for various aspects of
learning (phonological skills and reading fluency)
Maslow (1987) Maslow’s
Hierarchy of
Needs
Established a five-level hierarchy of basic needs:
physiological needs, safety needs, needs of love
affection and belonging, needs for esteem, and needs
for self-actualization

44
Study Theme Relevant Findings
Fogarty et al.
(2014)
Fidelity Fidelity is an unwieldy construct that involves multiple
dimensions that are measured through varied
methodologies.
Dusenbury et al.
(2003); Dane &
Schneider (1998);
Mihalic (2004)
Fidelity When defining fidelity, there are five elements that
need to be measured: adherence to the intervention,
exposure or dose, quality of delivery, participant
responsiveness, and program differentiation.
Benner et al.
(2011); Browder et
al. (2007)
Fidelity Found statistically significant effects on the assessment
of adherence in reading.
Alinder et al.
(2000); Penuel &
Means (2004);
Ysseldyle et al.
(2003)
Fidelity Found statistically significant effects on the assessment
of adherence in other curricular areas.
Dusenbury et al.
(2003); Mihalic
(2004)
Fidelity The researchers defined dosage as to whether the
frequency and duration of the intervention are as full as
prescribed by the designers.
Carrol et al. (2007) Fidelity Whether or not all the people should be participating in
or receiving the benefits of an intervention actually do
so.
Dane and
Schneider (1998)
Fidelity Articulated three ways to collect dosage information:
the number of sessions the intervention was
implemented, the length of the session, and the
frequency with which program components were
implemented.
Fogarty et al.
(2014)
Fidelity Determining the quality of the intervention
implementation can help determine whether students
received an acceptable amount of reading intervention
and the relationship between dosage and outcomes.

45
Study Theme Relevant Findings
Cantrell et al.
(2010)
Fidelity Found limited variation among participating teachers
in terms of aggregated minutes of strategy-based
reading intervention implementation per week.
Dane & Schneider
(1998); Jones et al.
(2008)
Fidelity Dosage is a prominent variable within theoretical
models of fidelity.
Fogarty et al.
(2014)
Fidelity Specific examination of dose and variation of dose
among implementers appears warranted.
Mihalic (2004) Fidelity Defines quality of delivery as the manner in which a
teacher, volunteer, or staff member delivers a program.
Carroll et al.
(2007)
Fidelity If a clear benchmark exists, then the quality of delivery
may be treated, along with adherence and dosage, as
one of the three discrete aspects are required to assess
the fidelity of an intervention.
Gersten et al.
(2005)
Fidelity Discussed the importance of quality in providing
insights into the effects or non-effects of an
intervention beyond the mere adherence to an
intervention’s components.
Gresham (2009) Fidelity Concluded that one can adhere to a particular
intervention with perfect integrity yet do so in an
incompetent manner.
Benner et al.
(2011)
Fidelity Found a statistically significant relationship between
the quality of implementation and reading outcomes.
Fogarty et al.
(2014)
Fidelity Quality of implementation is not routinely incorporated
in fidelity implementation measures.
Kirkpatrick (1967) Fidelity What is termed “reaction evaluation” in the evaluation
literature may be considered an essential part of any
evaluation of an intervention.
Dane and
Schneider (1998)
Fidelity The dimension of participant responsiveness can
measure participant enthusiasm and engagement in the
intervention.

46
Study Theme Relevant Findings
Taboada.
Townsend, &
Boynton (2013)
Fidelity Found a strong relationship between student
engagement in reading activities and reading
comprehension outcomes of secondary students.
Dusenbury et al.
(2003)
Fidelity Defined program differentiation as identifying unique
features of different components or programs and
identifying which elements of programs are essential.
Hermens et al.
(2001)
Fidelity Such so-called “essential” elements may be discovered
either by canvassing the designers of the intervention
or assessing the effect of the intervention on outcomes
and determining which components have the most
impact.
Carroll et al.
(2007)
Fidelity The process may have implications for implementation
fidelity if, for example, these essential components are
the most difficult to implement.
Dane & Schneider
(1998)
Fidelity The researchers defined program differentiation as a
safeguard against the diffusion of treatment.
Hulleman and
Cordray (2009)
Fidelity The researchers defined program differentiation as the
treatment that has to be stronger or different from the
counterfactual condition.
Fogarty et al.
(2014)
Fidelity Accurate differentiation between the typical practice
conditions is crucial in establishing internal validity.
Vaughn et al.
(2013)
Fidelity Examined the Collaborative Strategic reading Program
and found no statistically significant difference
between conditions in the reading classrooms.
Fogarty et al.
(2014)
Fidelity Specific assessment of program differentiation is
warranted.
Dane & Schneider
(1998)
Fidelity Advocated that a comprehensive approach to complete
fidelity assessment that addresses all five dimensions
would allow researchers to better understand the
relationship between treatment implementation and
student outcomes.

47
Study Theme Relevant Findings
Fogarty et al.
(2014)
Fidelity Although Dane and Schneider’s framework was
designed for the health sciences, it has applicability to
reading comprehension research where intervention
effects are often difficult to achieve and interpret.
Benner et al.
(2011)
Fidelity Examined fidelity in relation to student outcomes for
decoding intervention for fifth-grade to eighth-grade
struggling readers and found that adherence and quality
had a statistically significant effect on the reading
outcomes of students’ basic reading and
comprehension scores.
Klinger et al.
(2004)
Fidelity Found that high quantity and quality of the
Collaborative Strategic reading Program
implementation was associated with higher student
performance on a standardized reading outcome.
Denton et al.
(2008)
Fidelity of
Implementation
and reading
Interventions
Investigated the effectiveness of a multicomponent
reading intervention implemented with middle school
students with severe reading difficulties and found that
the treatment students did not demonstrate significantly
higher outcomes in terms of word recognition,
comprehension, or fluency than students who received
the school’s typical instruction and that neither group
demonstrated significant growth over the course of the
study.
Troyer (2017) Fidelity of
Implementation
and reading
Interventions
Documented the process of implementation of an
adolescent reading intervention and found that FoI at
observation one was found to predict coaching time
and FoI across both observations predicted student
outcomes, which emphasizes the role of
implementation in intervention research.

48
Study Theme Relevant Findings
Scott et al. (2019) Fidelity of
Implementation
and reading
Interventions
Uses the ASA to assess fidelity with schools that are
implementing MTSS for reading, Mathematics, and
behavior. Results showed that schools with higher
fidelity in the behavior domain had significantly lower
suspension events than matched comparison schools.
In comparison, higher fidelity in the reading domain
was associated with more students at or above
proficiency on both the Language Mechanics measure
and the Mathematics measure, but not in reading.
Reardon (2013) Economically
Disadvantaged
Students
The researchers aimed to conduct a comprehensive
study of the relationship between academic diagnostic
scores and family income in the United States over the
past 50 years. He found three striking findings. First,
the diagnostic scores gap has grown significantly over
the last three decades. Second, income gaps in other
measures of educational success have increased as
well. Third, the income diagnostic scores gap is
already significant when children enter kindergarten,
and it does not significantly grow as they progress
through school.
Ladd (2012) Free or
Reduced Lunch
Students
The researcher supported Reardon’s (2013) findings
when the argument that current policy initiatives were
misguided because they either denied or set aside a
basic body of evidence that documented how students
from on free or reduced lunch households, on average,
performed less well in school than those from more
economically advantaged households.
Dobbie & Fryer
(2011)
Free or
Reduced Lunch
Students
Found evidence that suggests, if used correctly, more
time in school may help to narrow academic diagnostic
scores gaps.

49
Study Theme Relevant Findings
Swain et al. (2020) i-Ready
reading in
Elementary
School
Implemented a quasi-experimental design using 2018-
2019 i-Ready diagnostic and Instruction data to
evaluate the impact of the i-Ready program on student
diagnostic scores at grades K-5. Results suggest
students using i-Ready instruction with fidelity
performed statistically significantly better on reading
performance than students in grades K-5 who did not
use this instruction.
Silva (2016) i-Ready
reading in
Elementary
School
This study set out to determine the effectiveness of the
i-Ready computerized reading program in improving
the reading diagnostic scores of first graders. In overall
reading diagnostic scores, the first-grade students who
did not participate in the i-Ready program
outperformed those who did. However, Silva notes that
there was a significant difference in reading fluency
diagnostic scores between those first-grade students
who participated in the i-Ready program and those
who did not.
Randel & Swain
(2019)
i-Ready
reading in
Middle School
Examined the impact of i-Ready Instruction for reading
among middle school students in grades six through
eight. Research indicates that sixth-grade students
using i-Ready Instruction for reading experienced
statistically significantly higher Spring scores than
students not using i-Ready instruction. Students in
grades seven and eight experienced higher Spring
scores than students not using i-Ready instruction, but
the differences were not statistically significant.

50
Study Theme Relevant Findings
Aguilar (2019) i-Ready
reading in
Middle School
The researcher began a program evaluation that was
designed to explore the use of the i-Ready diagnostic
as part of a rural middle school’s assessment process.
The data revealed that i-Ready scores demonstrated a
strong relationship with the NYS exam scores.
However, the repeated measures that were
administered in the Fall, Winter, and Spring provided
little new information about variability in student
performance compared to a single measure.
Curriculum
Associates (2019)
i-Ready
Overall
Analyzed data from more than one million students
who took the i-Ready diagnostic in the 2017-2018
school year in grades K-8. In reading, students who
used i-Ready instruction for an average of 45 minutes
or more per week for at least 18 weeks experienced
more significant learning gains compared to students
who did not, when controlling for prior diagnostic
scores.
51
CHAPTER THREE: METHODOLOGY
Introduction
This chapter represents the methodology for conducting research for this dissertation of
practice. Due to the lack of detailed research on the effectiveness of using the i-Ready
instructional program to complete fidelity in middle schools and its effects on diagnostic scores,
this dissertation focuses on seven middle schools in a Central Florida district and their
implementation of the i-Ready instructional and computerized program to full or partial fidelity.
An achievement gap continues to exist in education, specifically when looking at students
on free or reduced lunch and their families (Reardon, 2013). Because of this achievement gap,
some interventions are put into place that are aimed to close or reduce that gap. One of those
interventions, at the middle school level in one district in Central Florida, is a computer and
instructional program called i-Ready. At the middle school level in this district, students are
placed into intensive reading when their FSA scores are a Level 1 or Level 2. Level 1 and Level
2 scores are considered "not proficient," and i-Ready is the primary curriculum the schools are
required to use.
The philosophical framework used in this study is the idea of constructivism. According
to constructivism, particularly radical constructivism, the child functions in relation to its
environment, constructing, modifying, and interpreting the information s/he encounters in her/his
relationship with the world (Glaserfeld, 1995). The individual’s capacity to construct his/her
own understanding of the world is connected with thinking and with the fact that the individual is
able to construct his or her own thoughts and interpretations (Sutinen, 2008).
The theoretical framework used in this dissertation of practice centered around Maslow’s
hierarchy of needs. Maslow (1987), a humanistic psychologist, focused on potentials, believing

52
that human beings strive to reach their highest level of competence in all areas. Maslow
developed a theory of personality that has influenced many fields, especially education, and also
believed that the fundamental human goal is to become a fully functioning person, or as he called
it, a self-actualizing person.
Maslow established a five-level hierarchy of basic needs. They include (1) physiological
needs, (2) safety needs, (3) needs of love, affection, and belongingness, (4) needs for esteem, and
(5) needs for self-actualization.
The conceptual framework of this study centered around five pillars or essential elements
to complete fidelity: adherence to the intervention, exposure or dose, quality of delivery,
participant responsiveness, and program differentiation (Mihalic, 2004).
The research questions, as follows, center around full (to complete fidelity) or partial (not
to complete fidelity) implementation of the i-Ready instructional and computerized components
within intensive reading courses:
1. To what extent, if at all, does using the i-Ready reading program to full or partial fidelity
impact reading diagnostic scores among middle school students based on the diagnostic
assessment scale scores?
2. To what extent, if at all, does using the i-Ready reading program to full or partial fidelity
impact reading diagnostic scores among middle school students on free or reduced lunch
based on the diagnostic assessment scale scores?
One of the limitations of this study was focusing on seven of the middle schools within
the Central Florida school district and not all of them. One of the limitations of this study was
that the results might not have generalizability to other middle schools in the district. A second
limitation of this study was that individual teacher’s effectiveness of implementing the i-Ready

53
reading program, or lack thereof, was not examined in this study. Finally, one significant
assumption was that instructional coaches and assistant principals who met with the researcher
were active and truthful participants in this research process.
Purpose of the Study
One purpose of this study was to contribute to the literature and the field on how
individual student diagnostic scores was possibly affected in the area of reading. This study
specifically looked at when the full (to complete fidelity) or partial (not to complete fidelity)
implementation of the i-Ready instructional and computerized program was implemented in
seven middle schools in a school district in Central Florida for all students in intensive reading
courses.
Another purpose of this study was to contribute to the literature and the field on how
individual student diagnostic scores was possibly affected in the area of reading for students on
free or reduced lunch. This study specifically examined when the full (to complete fidelity) or
partial (not to complete fidelity) implementation of the i-Ready instructional and computerized
program was implemented in seven middle schools in a Central Florida District.
Significance of the Study
One significance of this study was to determine whether full or partial fidelity to the
program works for each school. School leaders might benefit from understanding the possible
impacts of working toward fidelity or only implementing partial fidelity. This school district and
beyond could gain valuable insight into whether the i-Ready program is effective at closing the
income diagnostic scores gap. Finally, this study could provide evidence that full fidelity to the
i-Ready program matters for student diagnostic scores.

54
Furthermore, this study could provide evidence that could lead to changes in how this
district and possibly others might use these findings to make changes to policy and practice. For
example, if it was found that full fidelity to the i-Ready instructional and computerized program
significantly affects individual student diagnostic scores in reading, districts could mandate that
all middle schools, in this district and possibly others, must adhere to the instructional and
computerized components solely. On the other hand, it could have been found that full fidelity
to the program does not significantly affect individual student diagnostic scores, and districts
could allow schools to use both the i-Ready instructional and computerized components and
outside resources to supplement the curriculum.
Method and Design
The methodology that was used in this study was quantitative. According to Fraenkel,
Wallen, and Hyun (2015, p. 188), quantitative data are appropriate for this study because the
variable being studied is measured along a scale that indicates how much of the variable is
present. Higher scores would indicate that more of the variable is present than do lower scores.
Furthermore, a qualitative method would not be appropriate for this study. In 2015, this method
of research differs from other methodologies because there is a greater emphasis on the holistic
description-that is, describing in detail all of what occurs in a particular activity or situation
rather than comparing the effects of a particular treatment or describing the attitudes or behaviors
of people. There was one small qualitative element to this study. As Fraenkel, Wallen, and
Hyun (2015) pointed out, writing down the questions asked, as well as the answers received,
helped with the triangulation to this study. The research met with representatives of each of the
four schools to gauge their level of implementation of the i-Ready reading program. Four
different questions were asked, which included: (1) how are you using the i-Ready reading

55
program in your school, (2) to what extent are you using the i-Ready reading program to fidelity,
(3) does it vary from teacher-to-teacher or is the same across the reading department, and (4)
how often would you estimate you are in classrooms to verify this information. After each of the
meetings, the researcher categorized each school as using the program to full fidelity or partial
fidelity. In total, the researcher categorized four schools as using the i-Ready reading program to
full fidelity and three schools as using the i-Ready reading program to partial fidelity. From
there, the researcher began the quantitative piece which included demographic information for
students at each of the seven schools and diagnostic assessment scale scores from the second and
third assessments.
The design was causal-comparative because the independent variables (IVs) were not
manipulated and the IVs were measured categorically, not continuously. According to Salkind
(2010), a causal-comparative design is research that seeks to find relationships between
independent and dependent variables after an action or event has already occurred. The goal was
to determine whether the independent variable affected the outcome, or dependent variable, by
comparing two or more groups of individuals. There are similarities and differences between
causal-comparative research, also referred to as ex post facto research, and both correlation and
experimental research.
Once there was approval from both UCF and one school district in Central Florida, the
researcher e-mailed each of the twelve middle school principals to ask whether they would be
interested in participating in this study. Of the twelve middle schools in the school district, nine
agreed and three did not respond. However, two schools were removed for time constraints,
leading to seven middle schools that were included in this study. Once there was approval from
each of the seven principals, the researched asked to meet with an administrator, instructional

56
coach, department head, or anyone who worked directly with the reading teachers and students in
the intensive reading courses. The researcher asked four questions during the meetings to gauge
how each of the seven middle schools was using the i-Ready reading program. Those questions
included: (1) how are you using the i-Ready reading program in your school, (2) to what extent
are you using the i-Ready reading program to fidelity, (3) does it vary from teacher-to-teacher or
is the same across the reading department, and (4) how often would you estimate you are in
classrooms to verify this information. After each of the meetings, the researcher categorized
each school as using the program to full fidelity or partial fidelity. In total, the researcher
categorized four schools as using the i-Ready reading program to full fidelity and three schools
as using the i-Ready reading program to partial fidelity.
For Research Question One, the IVs included full or partial implementation of the i-
Ready computerized and instructional program. For Research Question Two, the IVs include
full or partial implementation of the i-Ready computerized and instructional program and
socioeconomic status. Socioeconomic status, as coded by the school district as being on free or
reduced lunch, was included for Research Question 2 because this study aimed to examine the
income diagnostic scores gap and to measure how i-Ready, by using the computerized and
instructional component to full or partial fidelity, aimed to close the income diagnostic scores
gap with students on free or reduced lunch. The dependent variables included i-Ready
diagnostic scores from the second and third assessments. The second assessment was
administered when students came back to school in January of 2021 after Winter Break and the
third assessment was administered in March of 2021 when the students came back from Spring
Break. In brief, the research questions that ground this study are as follows.

57
Research Questions
1. To what extent, if at all, does using the i-Ready reading program to full or partial fidelity
impact reading diagnostic scores among middle school students based on the diagnostic
assessment scale scores?
2. To what extent, if at all, does using the i-Ready reading program to full or partial fidelity
impact reading diagnostic scores among middle school students who are on free or
reduced lunch based on the diagnostic assessment scale scores?
Hypotheses
H0 1. There is no significant difference for how the i-Ready reading program impacts reading
diagnostic scores among middle school students based on the diagnostic assessment scale scores.
HA There is a significant difference between for how the i-Ready reading program impacts
reading diagnostic scores among middle school students based on the diagnostic assessment
scale scores.
H0 2. There is no significant difference for how the i-Ready reading program impacts reading
diagnostic scores among middle school students who are on free or reduced lunch based on the
diagnostic assessment scale scores. HA There is a significant difference for how the i-Ready
reading program impact reading diagnostic scores among middle school students who are on free
or reduced lunch based on the diagnostic assessment scale scores.
Population
The target population for this study was all sixth, seventh, and eighth graders who were
taking the intensive reading courses at seven middle schools in one district in Central Florida for
the 2020-21 school year. All of the middle schools in the district were requested to participate
and seven middle schools agreed. The targeted sample in this study also focused explicitly on

58
students on free or reduced lunch and how using the i-Ready instructional and computerized
program affected their diagnostic scores in reading. This district had a specific indicator that
labeled students as on free or reduced lunch and that indicator was used as a proxy to identify
this specific population.
Convenience sampling of seven middle schools in one Central Florida school district and
the students within those schools was also utilized within this study. Convenience sampling
involves including in the sample whoever happens to be available at the time (Lunenburg & Irby,
2008). Examples of convenience sampling include the use of volunteers and the use of existing
groups just because they are there. Generalizations to the broader population derived from the
findings this convenience sampling to another population is not recommended or should be made
cautiously. Furthermore, convenience sampling was an easier method for data collection
because it is typically a relatively easy sample to obtain, inexpensive when compared to other
methods, and the participants are generally more readily available (Steinberg, 2010).
Data Collection and Instruments
No data was collected until full approval was granted by the Internal Review Board’s
(IRB) of both the school district and the university. All data was anonymous, aggregated, and
collected with safeguards in place for five years by securely storing and locking information with
no access to others. After five years, the data will be destroyed.
After approval from the university’s IRB, the researcher completed the following steps:
1. Submit the Research Permission Request to the school district.
2. Upon approval and receipt of the seven school’s data, the researcher used
a secure server to store it.
59
3. From the diagnostic data, the researcher removed any students who were
flagged to appear to have rushed or did rush on either of the diagnostics.
4. Student demographic data was coded based on the Florida Department of
Education reporting requirements and included Economically
Disadvantaged students. It included: gender, race, ESE, ethnicity, on free
or reduced lunch, grade, and advanced opportunities.
5. Data were analyzed using SPSS version 27. Sample sizes for effect were
determined using G-Power analyses.
Data collection came from the second and third diagnostic assessments from i-Ready.
The second assessment was administered when students came back to school in January of 2021
after Winter Break and the third assessment was administered in March of 2021 when the
students came back from Spring Break.
Reliability
According to the National Center on intensive Intervention (NCII), the i-Ready
diagnostic provides two types of reliability estimates. The first item is the Item Response Theory
(IRT). The IRT is a measure of the marginal reliability estimate. The second reliability estimate
is the standard error of measurement and test-retest reliability coefficients.
Marginal Reliability
Given that the i-Ready diagnostic is a computer-adaptive assessment that does not have a
fixed form, some traditional reliability estimates such as Cronbach’s alpha are not an appropriate
index for quantifying consistency or inconsistency in student performance. The IRT analogue to
classical reliability is called marginal reliability, and operates on the variance of the theta scores

60
and the average of the expected error variance. The marginal reliability uses the classical
definition of reliability as proportion of variance in the total observed score due to true score
under an IRT model (the i-Ready diagnostic uses a Rasch model to be specific).
Standard Error of Measurement (SEM)
In an IRT model, SEMs are affected by factors such as how well the data fit the
underlying model, student response consistency, student location on the ability continuum, match
of items to student ability, and test length. Given the adaptive nature of i-Ready and the wide
difficulty range in the item bank, standard errors are expected to be low and very close to the
theoretical minimum for the test of the given length. The theoretical minimum would be reached
if each interim estimate of student ability is assessed by an item with difficulty matching
perfectly to the student’s ability estimated from previous items. Theoretical minimums are
restricted by the number of items served in the assessment; therefore, the more items that are
served up, the lower the SEM could potentially be. For ELA, the minimum SEM for overall
scores is 8.9. The NCII also possesses graphical representations of the conditional standard
errors of measurement (CSEM) that provide additional evidence of the precision with which i-
Ready measures student ability across the operational score scale. In the context of model-based
reliability analyses for computer adaptive tests, such as i Ready, CSEM plots permit test users to
judge the relative precision of the estimate. These figures, which help contextualize the table of
reliability analysis results, are available from the NCII upon request.

61
Test-Retest Reliability
The i-Ready diagnostic is often used as an interim assessment, and students can take the
assessment multiple times a year. Therefore, the test-retest reliability estimate was appropriate to
provide stability estimates for the same students who completed two diagnostic assessments.
Validity
According to the NCII, the internal structure of the i-Ready diagnostic assessments is
supported by the construct maps and the ordering of the skills addressed at different stages on the
map. The NCII recognizes that the coverage of skills and difficulty of items will overlap a fair
amount across grades, as much material is reviewed from year to year. However, what should be
apparent from the estimated item difficulties is that, generally, items measuring skills targeting
lower levels of the map should be easier, and items measuring skills targeting higher levels of the
map should be more difficult.
In terms of internal validity, one major threat to consider was the loss of subjects (mortality).
According to Fraenkel, Wallen, and Hyun (2015), some individuals, especially in intervention
studies, may drop out of the study. When the data set was received, any student who was
flagged for rushing or who appeared to have rushed were removed. According to Curriculum
Associates, i-Ready used two types of “rushing flags” to help identify the possibility of low
effort on the diagnostic. A red rushing flag indicated that the student’s score was likely lower
than his/her true ability. To receive a red rushing flag, the student must have spent less than 11
seconds on average per item on the assessment. A yellow rushing flag indicated that the
student’s score may have been lower than his/her true ability. To receive a yellow rushing flag,
the student must have spent between 12 and 15 seconds on average per item for the assessment.
A second major threat, according to Fraenkel, Wallen, and Hyun (2015), was testing. For the

62
second and third diagnostic assessments, students took the exact same assessment. Therefore,
students may have seen the same questions and passages more than one time. Because all seven
middle schools took the same assessment and faced the same threats, the outcomes of the study
were not affected by them.
Data Analysis
The research questions in this study focused on differences between full or partial
implementation of the i-Ready program and its possible impact on student diagnostic scores in
reading and how full or partial fidelity to the i-Ready program had an impact on the diagnostic
scores gap with students on free or reduced lunch.
According to Laerd Statistics (2013), the independent samples t-tests were appropriate for
these research questions because it was used to determine if a difference exists between the
means of two independent groups on a continuous dependent variable. More specifically, it
determined whether the difference between the two groups was statistically different. Effect sizes
were also calculated using Cohen’s d.

63
Table 2 Research Questions for Analysis
Research Question Data Source Variable Data Analysis
1 To what extent, if at all,
does using the i-Ready
reading program to full
or partial fidelity impact
reading diagnostic
scores among middle
school students based on
the diagnostic
assessment scale scores?
i-Ready diagnostic II
and III scores
IV: Full or partial
implementation of
the i-Ready
program
DV: i-Ready
reading diagnostic
II and III Scores
Independent
samples t-test
Effect Size
calculated
2 To what extent, if at all,
does using the i-Ready
reading program to full
or partial fidelity impact
reading diagnostic
scores among middle
school students on free
or reduced lunch based
on the diagnostic
assessment scale scores?
i-Ready diagnostic II
and III scores
IV: SES Level
DV: i-Ready
reading diagnostic
II and III Scores
Independent
samples t-test
Effect Size
calculated
Summary
This chapter represented the methodology for conducting research on full or partial
fidelity to the i-Ready reading program at seven middle schools in one school district in Central
Florida and how that affected student diagnostic scores in reading. The population for this study
included all sixth, seventh, and eighth graders who were taking the intensive reading courses, but
it also specifically focused on students who were on free or reduced lunch and their individual
student diagnostic scores on the i-Ready diagnostic assessments. Data to be collected was
diagnostic assessment scores from the second (administered in January of 2021 after Winter
Break) and third assessments (administered in March of 2021 after Spring Break). Independent
samples t-tests were then conducted to analyze the second and third i-Ready reading diagnostic
scale scores. Each of the research questions focuses on reading or students on free or reduced

64
lunch and how the implementation of full or partial fidelity to the i-Ready program possibly
affected individual student diagnostic scores.

65
CHAPTER FOUR: RESULTS
Introduction
The results from the analyses in this dissertation are presented in this chapter. Due to the
lack of detailed research on the effectiveness of using the i-Ready instructional program to
complete fidelity in middle schools and its effects on individual student diagnostic scores, this
dissertation focused on seven middle schools in one Central Florida school district and their
implementation of the i-Ready instructional and computerized program to full or partial fidelity.
The research questions, as follows, centered around full (to complete fidelity) or partial
(not to complete fidelity) implementation of the i-Ready reading instructional and computerized
components within intensive reading courses:
1. To what extent, if at all, does using the i-Ready reading program to full or partial
fidelity impact reading diagnostic scores among middle school students based on
the diagnostic assessment scale scores?
2. To what extent, if at all, does using the i-Ready reading program to full or partial
fidelity impact reading diagnostic scores among middle school students on free or
reduced lunch based on the diagnostic assessment scale scores?
The methodology used in this study was quantitative. According to Fraenkel, Wallen, and
Hyun (2015), quantitative data are appropriate for this study, because the variable being studied
is measured along a scale that indicates how much of the variable is present. Higher scores
would indicate that more of the variable is present.
The design was causal-comparative because the independent variables (IV) were not
manipulated and the IV were measured categorically, not continuously. According to Salkind
(2010), a causal-comparative design is research that seeks to find relationships between

66
independent and dependent variables after an action or event has already occurred. The goal is
to determine whether the independent variable affected the outcome, or dependent variable, by
comparing two or more groups of individuals.
For Research Question One, the IV included full or partial implementation of the i-Ready
reading program. Students’ socioeconomic status was included for Research Question Two,
because this study aimed to examine the income diagnostic scores gap and to measure how i-
Ready, by using the reading program to full or partial fidelity, could close that gap for students
on free or reduced lunch. The dependent variables included i-Ready reading diagnostic scores
from the second and third assessments. The second assessment was administered when students
returned to school in January of 2021 after Winter Break, and the third assessment was
administered in March of 2021 when the students returned from Spring Break.
Descriptive Statistics
This section includes the descriptive statistics for each of the seven schools and for each
of the two diagnostic assessments that were administered at each school. The descriptive
statistics include demographic information regarding students’ grade level, gender,
race/ethnicity, participation in free or reduced lunch, and exceptional student education (ESE)
programs. The descriptive statistics for demographic information are divided into two sections.
The first section includes demographic information from the second i-Ready reading diagnostic
assessment, and the second section includes demographic information from the third i-Ready
reading diagnostic assessment.
When the data set was received, any student who was flagged for rushing or who appeared to
have rushed were removed. According to Curriculum Associates, i-Ready used two types of

67
“rushing flags” to help identify the possibility of low effort on the diagnostic. A red rushing flag
indicated that the student’s score was likely lower than his/her true ability. To receive a red
rushing flag, the student must have spent less than 11 seconds on average per item on the
assessment. A yellow rushing flag indicated that the student’s score may have been lower than
his/her true ability. To receive a yellow rushing flag, the student must have spent between 12
and 15 seconds on average per item for the assessment.
Second Diagnostic Assessment Demographic Information
For the second diagnostic assessment that was administered in January of 2021 when
students returned from Winter Break, 1,774 students completed the assessment within a two-
week window. Table 3 displays the number of students who completed the second i-Ready
reading diagnostic assessment by grade level. There is a fairly even distribution of students in
each grade level in the intensive reading courses as they range from 32% to 34% of students.
Table 3 Student Grade Levels
Student Grade N Percent Valid Percent Cumulative
Percent
6 589 33.2 33.2 33.2
7 570 32.1 32.1 65.3
8 615 34.7 34.7 100.0
Total 1774 100.0 100.0
Information within Table 4 is a breakdown of how many students completed the second i-
Ready reading diagnostic assessment by gender. Overall, over two hundred more male students
than female students took the second diagnostic assessment.

68
Table 4 Gender
Gender N Percent Valid Percent Cumulative
Percent
Female 779 43.9 43.9 43.9
Male 995 56.1 56.1 100.0
Total 1774 100.0 56.1 100.0
The data within Table 5 illustrates a how many students completed the second i-Ready
reading diagnostic assessment by race/ethnicity. Overall, Hispanic students accounted for more
than 40% of the students who took the second diagnostic, while Black and White students
accounted for more than 20% of students each, with Asian and students considered as “Other”
who accounted for less than 5% of students each.
Table 5 Race/Ethnicity
Race/Ethnicity N Percent Valid Percent Cumulative
Percent
Asian 51 2.9 2.9 2.9
Black 492 27.7 27.7 30.6
Hispanic 765 43.1 43.1 73.7
Other 63 3.6 3.6 77.3
White 403 22.7 22.7 100.0
Total 1774 100.0 100.0
Table 6 exhibits how many students completed the second i-Ready reading diagnostic
assessment by whether students were identified as on free or reduced lunch and participate in
free or reduced lunch programs. Overall, students on free or reduced lunch accounted for an
overwhelming majority of students at over 80% who took the second diagnostic and students
who were not considered on free or reduced lunch at less than 20%.
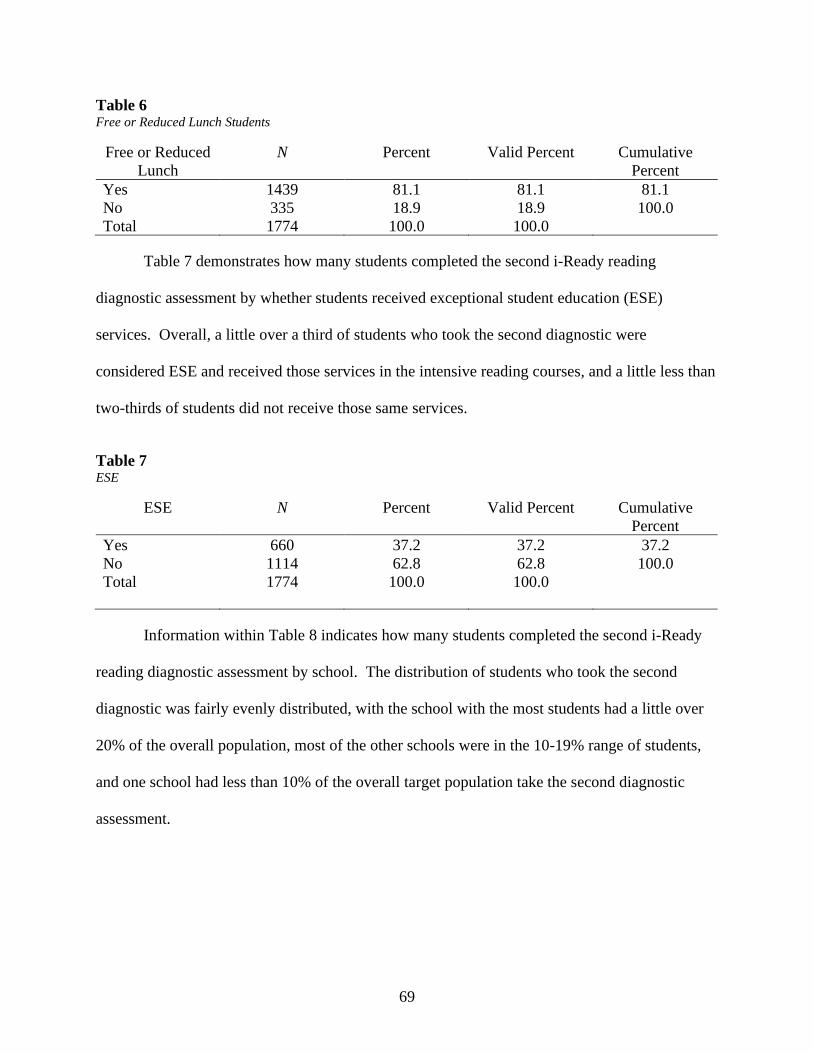
69
Table 6 Free or Reduced Lunch Students
Free or Reduced
Lunch
N Percent Valid Percent Cumulative
Percent
Yes 1439 81.1 81.1 81.1
No 335 18.9 18.9 100.0
Total 1774 100.0 100.0
Table 7 demonstrates how many students completed the second i-Ready reading
diagnostic assessment by whether students received exceptional student education (ESE)
services. Overall, a little over a third of students who took the second diagnostic were
considered ESE and received those services in the intensive reading courses, and a little less than
two-thirds of students did not receive those same services.
Table 7 ESE
ESE N Percent Valid Percent Cumulative
Percent
Yes 660 37.2 37.2 37.2
No 1114 62.8 62.8 100.0
Total 1774 100.0 100.0
Information within Table 8 indicates how many students completed the second i-Ready
reading diagnostic assessment by school. The distribution of students who took the second
diagnostic was fairly evenly distributed, with the school with the most students had a little over
20% of the overall population, most of the other schools were in the 10-19% range of students,
and one school had less than 10% of the overall target population take the second diagnostic
assessment.

70
Table 8 School
School N Percent Valid Percent Cumulative
Percent
1 187 10.5 10.5 10.5
2 186 10.5 10.5 21.0
3 376 21.2 21.2 42.2
4 136 7.7 7.7 49.9
5 267 15.1 15.1 64.9
6 328 18.5 18.5 83.4
7 294 16.6 16.6 100.0
Total 1774 100.0 100.0
Third Diagnostic Assessment Demographic Information
For the Third diagnostic assessment that was administered in March of 2021 when
students returned from Spring Break, 1,687 students completed the assessment within a two-
week window. The data in Table 9 indicates the number of students who completed the third i-
Ready reading diagnostic assessment by grade level. Similarly, to the second diagnostic, the
number of students who completed the third diagnostic were evenly distributed across grade
levels, with each grade level ranging from about 31% to just under 35% of students.
Table 9 Student Grade Levels
Grade Level N Percent Valid Percent Cumulative
Percent
6 588 34.9 34.9 34.9
7 537 31.8 31.8 66.7
8 562 33.3 33.3 100.0
Total 1687 100.0 100.0
Information within Table 10 illuminates how many students completed the third i-Ready
reading diagnostic assessment by gender. Male students accounted for more than half of the
students who took the third diagnostic assessment with over 55% and females accounted for a
little more than 40% of students.

71
Table 10 Gender
Gender N Percent Valid Percent Cumulative
Percent
Female 730 43.3 43.3 43.3
Male 957 56.7 56.7 100.0
Total 1687 100.0 100.0
Table 11 illustrates how many students completed the third i-Ready reading diagnostic
assessment by race/ethnicity. Hispanic students accounted for over 40% of students who took
the third diagnostic assessment, with Black and White students accounting for over 20% each,
and finally Asian and “Other” students accounting for less than 5% of students each.
Table 11 Race/Ethnicity
Race/Ethnicity N Percent Valid Percent Cumulative
Percent
Asian 45 2.7 2.7 2.7
Black 463 27.4 27.4 30.1
Hispanic 721 42.7 42.7 72.9
Other 67 4.0 4.0 76.8
White 391 23.2 23.2 100.0
Total 1687 100.0 100.0
The information within Table 12 displays how many students completed the third i-
Ready reading diagnostic assessment by whether students were considered on free or reduced
lunch. The vast majority of students were considered on free or reduced lunch, with that
population accounting for over 80% of students who completed the third diagnostic and under
20% of students who were not considered on free or reduced lunch.

72
Table 12 Free or Reduced Lunch Students
Free or Reduced
Lunch
N Percent Valid Percent Cumulative
Percent
Yes 1355 80.3 80.3 80.3
No 332 19.7 19.7 100.0
Total 1687 100.0 100.0
The data within Table 13 illustrates how many students completed the third i-Ready
reading diagnostic assessment by whether those students received ESE services. Overall, a little
over one-third of students received ESE services with more than 60% of students did not receive
those same ESE services.
Table 13 ESE
ESE N Percent Valid Percent Cumulative
Percent
Yes 634 37.6 37.6 37.6
No 1053 62.4 62.4 100.0
Total 1687 100.0 100.0
The information within Table 14 shows how many students completed the third i-Ready
reading diagnostic assessment by school. Distribution of students at each of the seven schools
was fairly evenly distributed, with the school with the highest percentage of students at a little
over 20%, five of the schools ranged from about 10% to 19% of students, and finally two schools
had less than 10% of the overall population take the third diagnostic assessment.
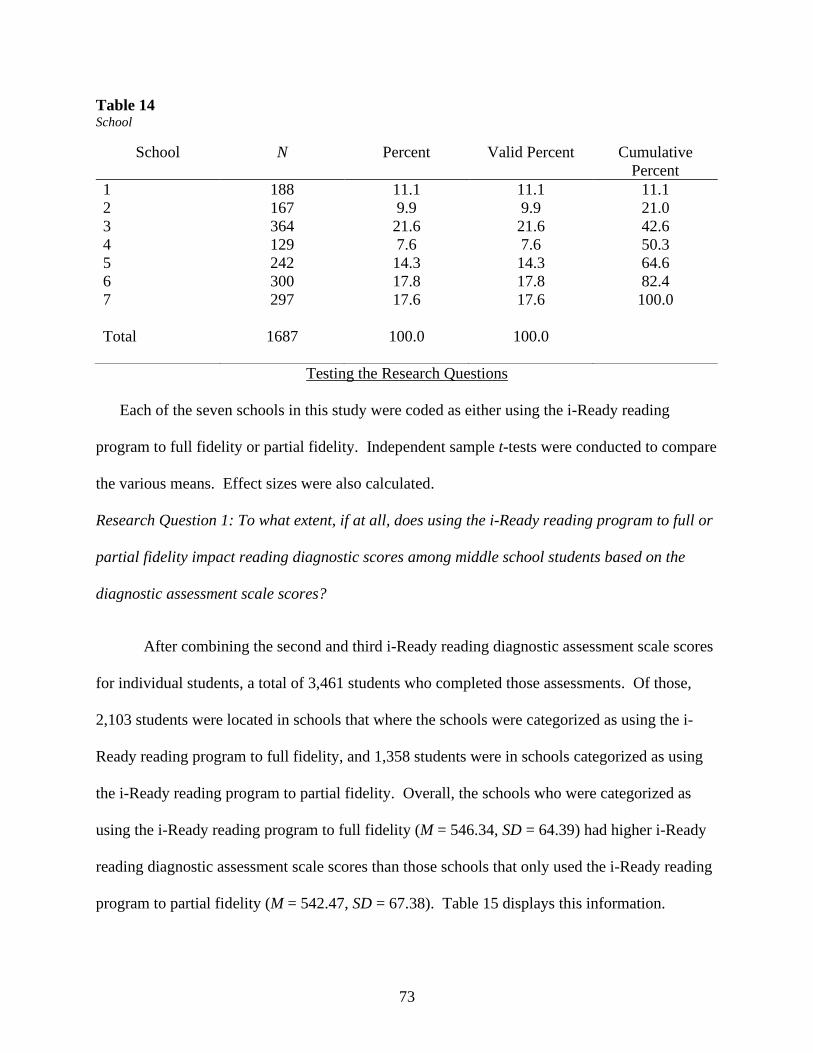
73
Table 14 School
School N Percent Valid Percent Cumulative
Percent
1 188 11.1 11.1 11.1
2 167 9.9 9.9 21.0
3 364 21.6 21.6 42.6
4 129 7.6 7.6 50.3
5 242 14.3 14.3 64.6
6 300 17.8 17.8 82.4
7 297 17.6 17.6 100.0
Total 1687 100.0 100.0
Testing the Research Questions
Each of the seven schools in this study were coded as either using the i-Ready reading
program to full fidelity or partial fidelity. Independent sample t-tests were conducted to compare
the various means. Effect sizes were also calculated.
Research Question 1: To what extent, if at all, does using the i-Ready reading program to full or
partial fidelity impact reading diagnostic scores among middle school students based on the
diagnostic assessment scale scores?
After combining the second and third i-Ready reading diagnostic assessment scale scores
for individual students, a total of 3,461 students who completed those assessments. Of those,
2,103 students were located in schools that where the schools were categorized as using the i-
Ready reading program to full fidelity, and 1,358 students were in schools categorized as using
the i-Ready reading program to partial fidelity. Overall, the schools who were categorized as
using the i-Ready reading program to full fidelity (M = 546.34, SD = 64.39) had higher i-Ready
reading diagnostic assessment scale scores than those schools that only used the i-Ready reading
program to partial fidelity (M = 542.47, SD = 67.38). Table 15 displays this information.

74
Table 15
Full vs. Partial Fidelity
Fidelity:
1=Full
2=Partial
N Mean Std. Deviation Std. Error
Mean
Diagnostic
Assessment
Scale Scores
1.00 2103 546.3414 64.39591 1.40042
2.00 1358 542.4757 67.38226 1.8285
For the independent samples t-test, Levene’s Test for Equality of Variances were
calculated in SPSS. Levene’s test was used to calculate the equality of variances. Leven’s test
determined whether the two samples (full vs. partial fidelity) came from populations within the
same variance. Results of Levene’s test indicated a homogeneity of variances for the i-Ready
reading diagnostic assessment scale scores (p = 0.79). Schools that used the i-Ready reading
program to full fidelity presented as 3.87, 95% CI [-.61 to 8.34] higher than schools that used the
i-Ready reading program to partial fidelity when derived from reading diagnostic assessment
scale scores. However, there was not a statistically significant difference in mean i-Ready
reading diagnostic assessment scale scores between schools who use the i-Ready reading
program to full fidelity when compared to schools that use i-Ready reading program to partial
fidelity, t (3459) = 1.7, p = 0.91. One possible reason that a statistically significant difference
was not found could be individual teachers and their ability, or lack thereof, to implement the i-
Ready reading program with fidelity could have affected the results for this research question.
Examining individual teachers and their implementation of the i-Ready reading program was not
included in this study and was a major limitation. Finally, Cohen’s d was also calculated to
analyze the effect size and it was found to have a medium effect (d = 0.6). There was no
statistically significant difference between means (p. .05); therefore, the alternative hypothesis

75
was rejected and the null hypothesis was accepted. Table 16 incorporates a summary of this
information.
Table 16 Independent Samples T-Test
Leven’s Test
for Equality of
Variances
t-test for Equality of Means 95% Confidence
Interval of the
Difference
F Sig. t df Sig.
(2-
tailed)
Mean
Difference
Std. Error
Difference
Lower Upper
diagnostic
assessment
Scale
Scores
Equal
Variances
Assumed
3.084 .079 1.693 3459 .091 3.86572 2.28311 -
0.61067
8.34210
Equal
Variances
Not
Assumed
1.677 2800.743 .094 3.86572 2.30549 -
0.65492
8.38635
Research Question 2: To what extent, if at all, does using the i-Ready reading program to full or
partial fidelity impact reading diagnostic scores middle school students on free or reduced lunch
based on the diagnostic assessment scale scores?
After combining the second and third i-Ready diagnostic assessment scale scores for
individual students, a total of 3,461 students who completed those assessments. Of those, 2,794
(81%) students were considered on free or reduced lunch, and 667 (19%) students were not
considered on free or reduced lunch. Overall, the students who were considered on free or
reduced lunch (M = 541.15, SD = 66.09) performed significantly worse than the students who
were not considered on free or reduced lunch (M = 560.22, SD = 61.23). Similarly, to research
question one, individual teachers’ style or effectiveness were not considered as a part of this
study. If they had been included in this study, a more specific focus could have been examined
to account for teacher experience in implementing the program, teacher evaluations, training on
the i-Ready program, etc. Table 17 features demographic information for students on free or
reduced lunch compared to students who were not considered on free or reduced lunch.

76
Table 17 Free or Reduced Lunch Students
Free or
Reduced
Lunch
N Mean Std. Deviation Std. Error
Mean
Diagnostic
Assessment
Scale Scores
Yes 2794 541.1496 66.08522 1.25023
No 667 560.2189 61.22748 2.37074
For the independent samples t-test, Levene’s test for quality of variances was analyzed
and the assumption of homogeneity was violated (p = .001). The i-Ready reading diagnostic
assessment scale scores were significantly lower for students on free or reduced lunch -19.07,
95% CI [-24.58 to -13.56]. Even though the assumption of homogeneity of variance failed, the
population is robust to such violations.
One possible explanation as to why this might have been the case is that the i-Ready
reading program does not benefit students on free or reduced lunch and actually increases the
income diagnostic scores gap between the two groups of students. A second possible reason for
this gap is that students are not motivated, find no meaning, and are burnt out from using this
program. In this school district, all students are required to use the i-Ready instructional
program beginning in kindergarten throughout all grades of elementary school. Then, when
student begin middle school, i-Ready is used as an intervention for struggling readers in this
school district and students.
The current study showed a significant difference for students on free or reduced lunch
scale scores for the reading diagnostic assessments t (1068.25) = -7.12, p = .001. Cohen’s d was
also calculated to analyze if there was an effect size, and there was a small negative effect (d = -
0.29). One possible explanation for the small negative effect could be that students found no

77
meaning in the i-Ready reading program or that teachers were not adequately trained on how to
support students on free or reduced lunch within the i-Ready reading format.
Additional Analysis
Because no significant difference was found between the mean i-Ready reading
diagnostic scores for schools who used the program to full fidelity versus schools who used the
program to partial fidelity, a Mann-Whitney U test was run to determine if differences existed
between the two groups using the dependent variables, which were the i-Ready reading
diagnostic scale scores from the combined second and third assessments.
Distributions of median scale scores for full versus partial fidelity were similar. Median
scale scores were not statistically significantly different for schools who used the program to full
fidelity when compared to schools who did not use the program to partial fidelity, U = 1387349,
z = 1.414, p = .157. As previously discussed, one possible explanation for this could be that
individual teachers and their ability to implement the i-Ready reading program, or lack thereof,
were not included in this study.
Summary
This chapter included the results from the statistical analyses promulgated from this
dissertation. The chapter began with the problem statement, the purpose statement, research
questions, and the corresponding results. The chapter also included the descriptive statistics
regarding demographics for each of the seven schools and for each of the two i-Ready reading
diagnostic assessments that were administered at each school. The descriptive statistics included
demographic information regarding grade level, gender, race/ethnicity, participation in free or

78
reduced lunch, and ESE programs. The descriptive statistics for demographic information was
divided into two different sections. The first section included demographic information from the
second i-Ready reading diagnostic assessment and the second section included demographic
information from the third i-Ready reading diagnostic assessment.
In testing for research question one, which asked about full or partial implementation of
the i-Ready reading program and its effect on individual student diagnostic scores, an
independent samples t-test was run and Levene’s test of equality of variances were calculated. It
was found that there was no statistically significance between schools that used the program to
full fidelity and schools that used it to partial fidelity. Cohen’s d was also calculated to examine
the effect size and it was found to have a medium effect. A Mann-Whitney U test was also run
and also saw no statistically significant difference for research question one. One possible
reason that no statistically different difference was found could be that the individual teachers
were not examined for their impact, or possibly lack thereof, on implementing the i-Ready
reading format and how their impact had on student diagnostic scores and is considered a major
limitation to this study.
In testing for research question two, which asked about how the i-Ready reading
program’s impact on students on free or reduced lunch, an independent samples t-test was run
again to compare the means for students on free or reduced lunch versus students who were not
considered on free or reduced lunch and Levene’s test for quality of variances was calculated.
The current study found that there was a statistically significant existed difference between the
individual scores from the second and third diagnostic assessments of students who were on free
or reduced lunch and those of students who were not on free or reduced lunch. Students who
were considered on free or reduced lunch performed far worse than students who were not

79
considered on free or reduced lunch. Cohen’s d was also calculated for effect size and it was
found to have a negative effect on students on free or reduced lunch. One possible explanation
for the negative effect could be that the teachers were not adequately trained on how to support
students on free or reduced lunch within the i-Ready reading format.

80
CHAPTER FIVE: DISCUSSION
Introduction
In the previous chapter, the results and data analysis were presented. Chapter 5 is the
includes a recapitulation of the study, limitations to the study, a discussion of the research
findings, as well as the educational implications for policy and practice, recommendations for
future research, conclusions, and a final summary.
These latter sections, which include the discussion of the findings, educational
implications for policy and practice, recommendations for future research, and conclusions,
expand on the concepts that were studied in an attempt to provide further understanding of using
the i-Ready reading program to full and/or partial fidelity and of the importance of impacting
individual student diagnostic scores, with an emphasis on students receiving free or reduced
lunch and possible ways to attempt to close the income diagnostic scores gap.
Recapitulation of the Study
Statement of the Problem
This study focused on analyzing extant data in order to fill a gap in the research literature
regarding the lack of detailed research on the effectiveness of using the i-Ready reading program
to fidelity in middle schools. This study aimed to analyze the effectiveness, or lack thereof, that
the i-Ready reading program has on individual student diagnostic scores, with a specific focus on
examining students who were on free or reduced lunch. Finally, this study aimed to examine
how, possibly, the i-Ready reading program attempted to close the income diagnostic scores gap.

81
Purpose
The purpose of this study was to determine whether using the i-Ready reading program
(both the computerized and instructional components) to full or partial fidelity had a significant
effect on individual student diagnostic scores based on their second and third diagnostic
assessments.
Theoretical Framework
The theoretical framework for this dissertation of practice centered around
Maslow’s hierarchy of needs. Maslow (1987), a humanistic psychologist, focused on potentials,
believing that human beings strive to reach their highest level of competence in all areas.
Maslow developed a theory of personality that has influenced many fields, especially education,
and also believed that the fundamental human goal is to become a fully functioning person or, as
Maslow categorizes it, a self-actualizing person.
Maslow established a five-level hierarchy of basic needs. There are (1) physiological
needs; (2) safety needs; (3) needs of love, affection, and belongingness; (4) needs for esteem;
and (5) needs for self-actualization.
Research Questions
1. To what extent, if at all, does using the i-Ready reading program to full or partial fidelity
impact reading diagnostic scores among middle school students based on the diagnostic
assessment scale scores?

82
2. To what extent, if at all, does using the i-Ready reading program to full or partial fidelity
impact reading diagnostic scores among middle school students on free or reduced lunch
based on the diagnostic assessment scale scores?
Hypotheses
H0 1. There is no significant difference to how the i-Ready reading program impacts reading
diagnostic scores among middle school students based on the diagnostic assessment scale scores.
HA There is a significant difference between in how the i-Ready reading program impacts
reading diagnostic scores among middle school students based on the diagnostic assessment
scale scores.
H0 2. There is no significant difference to how the i-Ready reading program impacts reading
diagnostic scores among middle school students who are on free or reduced lunch based on the
diagnostic assessment scale scores. HA There is a significant difference in how the i-Ready reading
program impact reading diagnostic scores among middle school students who are on free or
reduced lunch based on the diagnostic assessment scale scores.
Methodology
The methodology used in this study was quantitative. According to Fraenkel, Wallen,
and Hyun (2015), quantitative data are appropriate for such a study because the variable being
studied is measured using a scale that indicates the extent to which the variables are present.
Higher scale scores would indicate that more of the variable is present than do lower scores.
The design was causal-comparative because the independent variables (IVs) were not
manipulated and were measured categorically, not continuously. For Research Question One,
the IVs included full or partial implementation of the i-Ready reading computerized and

83
instructional program. For Research Question Two, the IVs include full or partial
implementation of the i-Ready reading computerized and instructional program and
socioeconomic status. Socioeconomic status was included for Research Question 2 because this
study aimed to examine the income diagnostic scores gap and determine how i-Ready, by using
the computerized and instructional component to full or partial fidelity for reading, aimed to
close the income diagnostic scores gap with students on free or reduced lunch. The dependent
variables included i-Ready diagnostic scale scores from the second and third assessments. The
second assessment was administered when students returned to school in January 2021 after
winter break, and the third assessment was administered when the students returned from spring
break in March 2021.
Regarding the second and third i-Ready reading diagnostic assessment scale scores for
individual students, a total of 3,461 students completed these assessments. Of those, 2,103 were
in schools that were categorized as using the i-Ready reading program to full fidelity, and 1,358
students were in schools categorized as using the i-Ready reading program to partial fidelity.
Findings
Research Question One
To what extent, if at all, does using the i-Ready reading program to full or partial fidelity impact
reading diagnostic scores among middle school students based on the diagnostic assessment
scale scores?
To answer this research question, an independent samples t-test was conducted for
analysis. According to Laerd Statistics (2013), the independent samples t-test was appropriate

84
for this research question because it was used to determine whether a difference exists between
the means of two independent groups on a continuous dependent variable. More specifically, it
could determine whether the difference between the two groups was statistically different. For
this study, the two independent groups included schools that used the i-Ready reading program
to full fidelity and schools who used the i-Ready reading program to partial fidelity. Effect sizes
were also calculated for this research question using Cohen’s d.
After conducting the independent samples t-test, it was found that schools who used the i-
Ready reading program to full fidelity had an overall mean scale score that was about four points
higher than schools who used the i-Ready reading program to partial fidelity. Furthermore, the
effect size was found to be medium.
Research Question Two
To what extent, if at all, does using the i-Ready reading program to full or partial fidelity impact
reading diagnostic scores among middle school students on free or reduced lunch based on the
diagnostic assessment scale scores?
To answer this research question, an independent samples t-test was conducted for
analysis. According to Laerd Statistics (2013), the independent samples t-test was also
appropriate for this research question because it was used to determine if a difference exists
between the means of two independent groups on a continuous dependent variable. More
specifically, it determined whether the difference between the two groups was statistically
different. For this study, the two independent groups included students who were considered on
free or reduced lunch and students who were not considered on free or reduced lunch. Effect
sizes were also calculated for this research question using Cohen’s d.

85
After conducting the independent samples t-test, it was found that students who were
considered on free or reduced lunch had an overall mean scale score that was approximately 19
points lower than that of students who were not considered on free or reduced lunch.
Furthermore, when effect sizes were calculated using Cohen’s d, and it was found that the i-
Ready reading program had a negative effect on students on free or reduced lunch. The next
section includes limitations to this study that were important to note.
Limitations
One of the limitations of this study is that the data that was collected, analyzed, and
interpreted may not be generalizable to all middle schools in the district, even though most were
included in this study. Other school districts may use i-Ready diagnostic instruction differently
at the middle school level to those in this study (as an intervention); therefore, interpretations
may not reflect the effectiveness, or possibly the lack thereof, in other school districts.
A second limitation of this study is the accuracy of the data from the second and third i-
Ready reading diagnostic assessments. There could be other factors that contributed to the
individual student scale scores, such as the classroom management by the teacher in each setting,
whether students and teachers took the assessment seriously, and whether those students with
individualized education plan (IEPs) received the appropriate services and accurate
accommodations.
A third limitation of this study was that individual teacher’s effectiveness of
implementing the i-Ready reading program, or possibly lack thereof, was not examined. For
example, a first-year teacher might use the i-Ready reading program to complete fidelity but that
teacher’s students’ scores may be lower than a veteran teacher who was rated as highly effective

86
and uses the i-Ready reading program to partial fidelity and their students’ scores are higher.
Also, teachers may have added their own materials in addition to the i-Ready reading curriculum,
and that was not examined in this study.
A fourth limitation of this study was that the i-Ready reading program is a
commercialized product that is packaged and sold to school districts. The i-Ready reading
diagnostic assessments are made by Curriculum Associates, and there may be a conflict of
interest in the product.
A fifth limitation of this study was that the second and third diagnostic assessments were
collapsed together when analyses began. Both assessments were analyzed together because they
were the same assessment, just given at two different points in the school year. The second
diagnostic assessment was administered right after Winter Break in January 2021 and the third
diagnostic assessment was administered right after Spring Break in March 2021.
Sixth, this dissertation was completed during the 2020-21 school year and during the
COVID-19 pandemic. The school district in this study utilized three learning models throughout
the school year: face-to-face, hybrid, and at-home, with students logging into their classes as if
they were on campus. Considering the students’ capacity to alternate between the three models
throughout the school year, it is challenging to know how this might have affected student
diagnostic scores in terms of the research questions. Finally, as a seventh limitation, even though
the assumption of homogeneity of variance failed, the population is robust to such violations.
The next section is a discussion of the findings for each of the research questions.

87
Discussion of the Findings
Research Question One
To what extent, if at all, does using the i-Ready reading program to full or partial fidelity impact
reading diagnostic scores among middle school students based on the diagnostic assessment
scale scores?
The findings of this research indicated that schools that used the i-Ready reading program
to full fidelity achieved higher mean scores on the second and third diagnostic assessments, but
by only approximately four points. Therefore, there was no statistically different difference
between the two groups, and the null hypothesis was accepted. Moreover, when calculating
effect size using Cohen’s d, it was only found to be medium effect
These findings are somewhat consistent with those of Dvorak et al. (2019), who
examined the impact of using i-Ready instruction for reading among middle school students in
grades six through eight. In the Dvorak et al. (2019) study, their research indicated that sixth
grade students using i-reading reading instruction experienced statistically significant higher
Spring scores than students who were not using the i-Ready reading instruction. However,
students in grades seven and eight who used i-Ready reading instruction also experienced higher
Spring scores than students who were not using i-Ready reading instruction, but those scores
were not statistically significant. The findings that are somewhat consistent between Dvorak et
al. (2019) and this study were that students did score higher than students who did not use the i-
Ready reading instruction, but the difference in overall scale scores were not statistically
significant.
88
These findings were also somewhat consistent with Swain, Randel, and Dvorak (2020)
who implemented a quasi-experimental design using 2018-2019 i-Ready diagnostic and
instructional data to evaluate the impact of i-Ready reading instruction on student reading
diagnostic scores for grades K-5. The results from their work suggest students who use the i-
Ready reading instruction with fidelity performed statistically significantly better on reading
performance than students in K-5 who did not use this instruction. The similarity here is that
students performed better on reading assessments when using the program to full fidelity, but the
difference between both studies was that this study did not find a statistically significant
difference in overall scale scores, even though students who used the i-Ready reading program to
full fidelity did score higher than students who only used the program to partial fidelity.
One possibility as to why the mean scale scores were not statistically different could have
been that individual teachers were not examined or included in this study. For example, a
teacher who was rated highly effective and worked at a school that was categorized as using the i-
Ready reading program to partial fidelity could have had students who scored higher than a
teacher who was rated as effective or needs improvement/developing and used the program to full
fidelity. Furthermore, there was no way to know if teachers added or subtracted from i-Ready
with supplemental material. Teachers could have used the i-Ready reading program to fidelity
but then also added material based on student needs. This notion would be with Gersten et al.
(2005), who discussed the importance of quality in providing insights into the effects or non-
effects of an intervention beyond the mere adherence to its components. It would also be
consistent with Gresham (2009), who concluded that one can adhere to a particular intervention
with perfect integrity yet do so in an incompetent manner. The exclusion of individual teachers
at each school was a significant limitation of this study.
89
Data Visualization for Research Question One
Below are two histograms that were created to show a data visualization for Research
Question One. The top histogram refers to students who were in schools that used the i-Ready
reading program to full fidelity, whereas the bottom histogram refers to students who were in
schools that used the i-Ready reading program to partial fidelity.
In comparing the images, the right-hand side shows that the mean scale scores for
students who were in schools that used the i-Ready reading program to complete fidelity showed
approximately a four-point difference in their average mean scale scores than students who were
in schools that used the i-Ready reading program to partial fidelity. A second point is that in the
bottom histogram, for students who were located in schools who used the i-Ready reading
program to partial fidelity, there were 1,062 students who scored in the 200-400 range, compared
to just 416 students who scored in that same range for students who were located in schools that
use the i-Ready reading program to full fidelity. According to i-Ready, a score in the 200-400
range is considered at least two grade levels behind.

90
Figure 1: Histogram for Research Question One

91
Research Question Two
To what extent, if at all, does using the i-Ready reading program to full or partial fidelity impact
reading diagnostic scores among middle school students on free or reduced lunch based on the
diagnostic assessment scale scores?
Following the independent samples t-test, a significant difference was found between
students who were considered on free or reduced lunch and those who were not considered on
free or reduced lunch. Economically disadvantaged students scored approximately 19 points
lower than students who were not on free or reduced lunch. Furthermore, when effect sizes were
calculated using Cohen’s d, it was found that the i-Ready reading program had a negative effect
on students on free or reduced lunch.
These findings are consistent with those of Reardon (2013), who found that the income
diagnostic scores gap has grown significantly over the past three decades, the income diagnostic
scores gaps for other measures of educational success have also increased, and the income
diagnostic scores gap is already significant when children enter kindergarten, growing only
marginally as they progress through school. These findings are also consistent with those of
Ladd (2012), who supported Reardon’s findings when he argued that current policy initiatives
were misguided because they denied or disregarded a basic body of evidence that indicated that
students from on free or reduced lunch households, on average, performed less well in school
than those not from on free or reduced lunch households.
Maslow’s hierarchy of needs (1987) includes (1) physiological needs; (2) safety needs;
(3) needs of love, affection, and belonging; (4) needs for esteem; and (5) needs for self-
actualization. These factors could have played a role in the statistically significant difference

92
between the mean scale scores for students on free or reduced lunch compared to non-students
on free or reduced lunch. When the most basic needs are not met for one of the most vulnerable
populations, it might affect expected learning outcomes.
Referring back to research question one, the findings of Mihalic (2004) suggest that the
quality of the delivery of the intervention might have also played a role in the statistically
significant difference in mean scale scores between students on free or reduced lunch and
students who are not on free or reduced lunch. Mihalic (2004) also argues that quality of
delivery is significant and needs to be measured to gauge how well, or not, an intervention is
working. When comparing Mihalic’s (2004) study to this study, the quality of delivery of the i-
Ready reading program, or not, may have affected expected learning outcomes as well.
Finally, this dissertation was completed during the 2020-21 school year and during the
COVID-19 pandemic. The school district in this study utilized three learning models throughout
the school year: face-to-face, hybrid, and at-home, with students logging into their classes as if
they were on campus. Considering the students’ capacity to alternate between the three models
throughout the school year, it is challenging to know how this might have affected student
diagnostic scores in terms of the research questions.
Data Visualization for Research Question Two
The two histograms below were created to visually depict the data collected and analyzed
for research question two. The top histogram refers to students who were considered on free or
reduced lunch, and the bottom, to students who were not considered on free or reduced lunch.
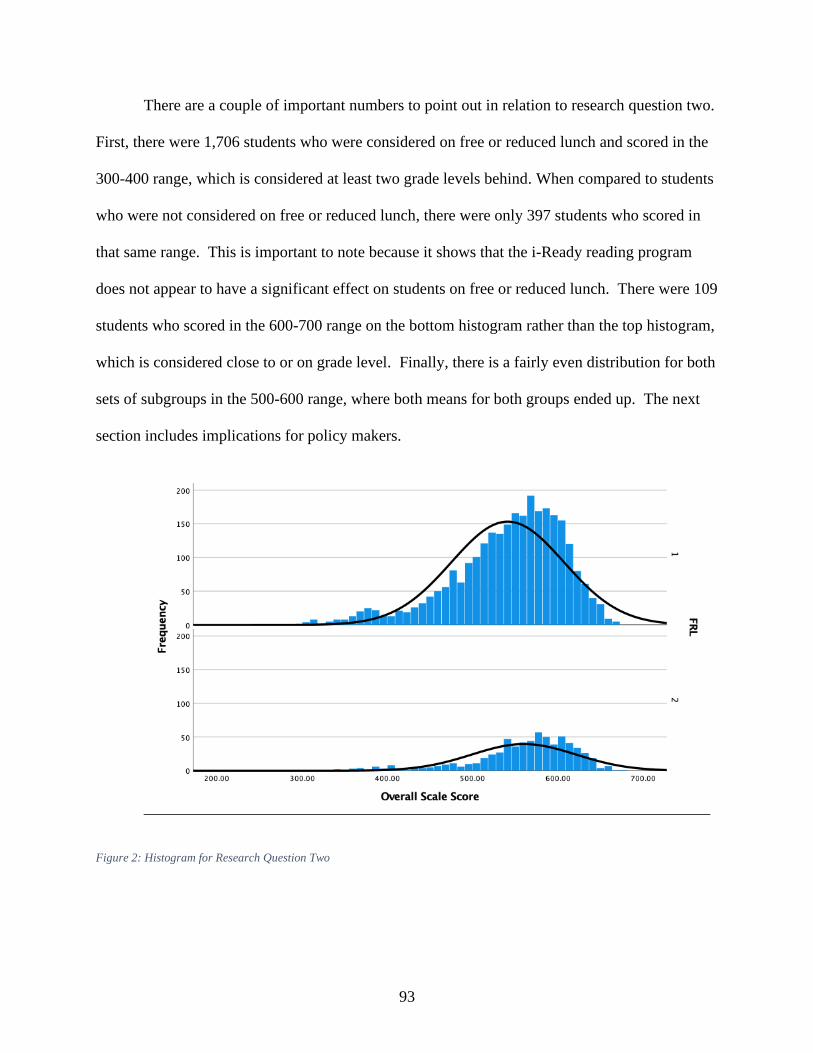
93
There are a couple of important numbers to point out in relation to research question two.
First, there were 1,706 students who were considered on free or reduced lunch and scored in the
300-400 range, which is considered at least two grade levels behind. When compared to students
who were not considered on free or reduced lunch, there were only 397 students who scored in
that same range. This is important to note because it shows that the i-Ready reading program
does not appear to have a significant effect on students on free or reduced lunch. There were 109
students who scored in the 600-700 range on the bottom histogram rather than the top histogram,
which is considered close to or on grade level. Finally, there is a fairly even distribution for both
sets of subgroups in the 500-600 range, where both means for both groups ended up. The next
section includes implications for policy makers.
Figure 2: Histogram for Research Question Two

94
Implications for Policy
Because no statistically different difference was found in terms of mean scores for
schools that used the i-Ready reading program to full fidelity and schools that used the i-Ready
reading program to partial fidelity, this school district might consider a review of its relationship
with i-Ready to determine if there are certain components that should be removed or if other
components should be added. For example, if a school is not going to use the i-Ready reading
curriculum in its everyday instruction, it would not need to purchase the licenses and would
therefore, save money. However, if a school is going to use all of the i-Ready components, the
school or the district might want to considering hiring i-Ready consultants for small group or
individual training sessions at that school. Small group or individual training sessions might be
necessary because, in terms of implementation fidelity, adherence to the intervention is necessary
to ensure it is being delivered as it was designed or written to be delivered (Mihalic, 2004).
There was a statistically significant difference in mean scale scores for students on free or
reduced lunch and those who are not on free or reduced lunch. While this may not be seminal
information, as Reardon (2011) found that the income diagnostic scores gap has grown in the last
three decades, income diagnostic scores gaps for other measures of educational success have
increased as well, and the income diagnostic scores gap is already significant when children
enter kindergarten. Therefore, school districts and individual schools might strongly consider a
need to train teachers on how to work with these vulnerable and underserved populations of
students. There could also be training on Maslow’s (1987) hierarchy of needs, cultural
responsiveness, and ways to help these students be as successful as possible. Curriculum needs
might also need be addressed to ensure that these populations are not being marginalized and
underserved. Working with i-Ready and Curriculum Associates might be beneficial for policy

95
makers to ensure the content they are creating for lessons (both instructional and computerized)
is appropriate for students and meeting their needs. Finally, policy makers at the school district
and school levels should address whether these teachers need extra support in their classrooms.
For example, in Language Arts and Math classes in this school district, there are support
facilitators in certain classrooms during specific periods, if there is a high ESE population in a
class and services are required to support those students in addition to their regular teacher.
Many of those students are placed in the intensive reading courses, but often it might be the case
that there is one teacher with approximately 15-20 students in this type of class. Therefore, they
might consider the benefits of hiring additional support facilitators, paraprofessionals, or other
staff members.
Implications for Practice
For practitioners, referring to teachers who are in classrooms on a daily basis, they might
want to examine how they are using the i-Ready reading program in their classrooms and
addressing how they are using the program to full or partial fidelity. This outcome is because the
i-Ready at the middle school level, at least in this school district, is used as an intervention in an
attempt to help students attain grade level proficiency.
First, teachers might find a need to examine if they are adhering to the intervention as
defined by Mihalic (2004, p. 2) defined adherence as referring to “whether a program or service
or intervention is being delivered as it was designed or written”. If teachers are not adhering the
program design, they could examine what needs to be corrected or adapted to ensure that they
can adhere to the intervention as intended.

96
Second, teachers may find a need to determine whether they are following the proper
dosage as outlined by the program. According to Curriculum Associates, the recommendation
for computer time on i-Ready is at least 45 minutes per week and one lesson passed. This is to
ensure students’ progress through the online curriculum for the intended amount of time.
Third, and perhaps most importantly, teachers could examine their quality of delivery of
instruction and the delivering the intervention as intended. Mihalic (2004) defined this as the
manner in which a teacher, volunteer, or staff member delivers a program. If there were
benchmarks, then quality of delivery may be examined, along with adherence and dosage as
three discrete aspects that could be required to assess the fidelity of the intervention (Carroll et
al., 2007).
Recommendations for Further Research
This study examined schools on a case-by-case basis and categorized each school as
using the i-Ready reading program to full or partial fidelity. However, this study did not
examine individual teachers and how their students scored on the second and third diagnostic
assessments, a limitation of this study. Therefore, a recommendation for future research is to
include teachers and how certain teacher’s effect student diagnostic scores. For example, a
teacher who has an evaluation rating of highly effective and works at one of the schools that was
categorized as using the program to partial fidelity may have higher scores than a teacher who
has an evaluation rating of developing or effective but they may work at a school who was
considered to be using the program to partial fidelity. Examining these teachers on a case-by-
case basis may lead to more significant findings.
97
A second recommendation for future research could be to examine how the i-Ready
program, or possibly another curriculum, could help to close the income diagnostic scores gap
for students on free or reduced lunch. This study found that the i-Ready mean scale scores were
significantly lower for students on free or reduced lunch when compared to students who were
not considered on free or reduced lunch. Furthermore, approximately 80% of students who were
included in this study were considered on free or reduced lunch. With such a high number of
students deemed on free or reduced lunch and in intensive reading courses, research could be
conducted to identify more effective ways to serve this population.
A third recommendation for future research aligns with Dane and Schneider (1998), who
discussed the notion fidelity to an intervention and examined the dimension of participant
responsiveness. Dane and Schneider (1998) argued that participant responsiveness can be
measured by enthusiasm and engagement in the intervention. This recommendation for future
research might include qualitative pieces about the i-Ready reading program. For example,
interviews or focus groups could include teachers that take into account their perceptions and
opinions of the i-Ready reading program. Students might also be included for interviews or
focus groups that take into account their own perceptions and opinions of the i-Ready reading
program.
Conclusions
Overall, the goal of this study was to expand on the limited existing research of how
using the i-Ready reading program affected individual student diagnostic scores for schools who
used the program to full fidelity compared to schools who used the program to partial fidelity.
For research question one, no statistically significant difference was found between each type of

98
school, but schools who use the i-Ready reading program to full fidelity had mean scale scores
that were approximately four points higher than schools that use the i-Ready reading program to
partial fidelity.
This study also examined how the program affects students on free or reduced lunch and
its attempt to close the income diagnostic scores gap. It was found that students on free or
reduced lunch had a statistically significant difference in terms mean scale scores and those
students scored approximately 19 points lower than students who were not considered on free or
reduced lunch. This research question aimed to expand on research regarding students on free or
reduced lunch and how to close the income diagnostic scores gap.
Finally, a well-known theorist, Vygotsky, stressed the fundamental role of social
interaction in the development of cognition (Vygotsky, 1978). He believed strongly that
community plays a central role in the process of making meaning. This statement was included
in this dissertation because administrators, instructional coaches, teachers, students, and their
families all play crucial role in impacting individual student diagnostic scores of students,
specifically with students on free or reduced lunch and aiming to close or reduce the income
achievement gap.
Summary
This chapter represented the discussion for the dissertation of practice. It began with a
summary of the study which included the problem, purpose, theoretical framework, and the two
research questions. Then, the two different hypotheses were discussed prior to shifting to the
methodology. After analyses for research question one, it was found that students in schools that
used the i-Ready reading program to full fidelity had slightly higher scores than students in

99
schools that used the i-Ready reading program to partial fidelity, but the scores were not
statistically significant. For the second research question, it was found that students who were
on free or reduced lunch scored significantly lower than students who were not considered on
free or reduced lunch and that the i-Ready reading program actually had negative effects on
those students.
Limitations to this study included facts that data may not be generalizable to all middle
schools in this school district, accuracy of the data that was received, and individually teachers
and their effectiveness of implementing the i-Ready reading program were not analyzed. A
discussion of the findings was also included, along with implications for policy and practice,
recommendations for future research, a conclusion, and a summary.

100
APPENDIX A: UCF IRB APPROVAL

101

102
APPENDIX B: SCHOOL DISTRICT APPROVAL

103

104
LIST OF REFERENCES
Adams, M. J. (1990). Beginning to read: Learning and thinking about print. MIT Press
Aguilar, R. E. (2019). Predictive validity of i-Ready diagnostic Scores for high-stakes test
outcomes with Middle School Students: A Program Evaluation.
Allinder, R. M., Bolling, R. M., Oats, R. G., & Gagnon, W. A. (2000). Effects of teacher self-
monitoring on the implementation of curriculum-based measurement and mathematics
computation diagnostic scores of students with disabilities. Remedial and Special
Education, 21(4), 219-226.
Benner, G. J., Nelson, J. R., Stage, S. A., & Ralston, N. C. (2011). The influence of fidelity of
implementation on the reading outcomes of middle school students experiencing reading
difficulties. Remedial and Special Education, 32(1), 79-88.
Boeree, C. G. (2006). Abraham Maslow. Personality Theories 1-11.
Browder, D. M., Trela, K., & Jimenez, B. (2007). Training teachers to follow a task analysis to
engage middle school students with moderate and severe developmental disabilities in
grade-appropriate literature. Focus on Autism and Other Developmental
Disabilities, 22(4), 206-219.
Cameron, J., & Pierce, W. D. (1994). Reinforcement, reward, and intrinsic motivation: a meta-
analysis. Review of Educational Research, 64(3), 363-423.
Cantrell, S. C., Almasi, J. F., Carter, J. C., Rintamaa, M., & Madden, A. (2010). The impact of a
strategy-based intervention on the comprehension and strategy use of struggling
adolescent readers. Journal of Educational Psychology, 102(2), 257.
Carroll, C., Patterson, M., Wood, S., Booth, A., Rick, J., & Balain, S. (2007). A conceptual
framework for implementation fidelity. Implementation Science, 2(1), 40.

105
Cronbach, L. J. (1957). The two disciplines of scientific psychology. American
psychologist, 12(11), 671.
Cronbach, L. J., & Webb, N. (1975). Between-class and within-class effects in a reported
aptitude* treatment interaction: Reanalysis of a study by GL Anderson.
Cunningham, A. E. (1990). Explicit versus implicit instruction in phonemic awareness. Journal
of Experimental Child Psychology, 50(3), 429-444.
Curriculum Associates, LLC. (2019a). i-Ready efficacy: Research on i-Ready instruction
program impact. (Curriculum Associates research report No. RR 2019-55). North
Billerica, MA: Author.
Dane, A. V., & Schneider, B. H. (1998). Program integrity in primary and early secondary
prevention: are implementation effects out of control?. Clinical Psychology Review,
18(1), 23-45.
Darling-Hammond, L., Bae, S., Cook-Harvey, C. M., Lam, L., Mercer, C., Podolsky, A., &
Stosich, E. L. (2016). Pathways to new accountability through the Every Student
Succeeds Act. Learning Policy Institute.
Deci, E. L., & Ryan, R. M. (1985). (1985b). Intrinsic motivation and self-determination in
human behavior. Springer Science & Business Media.
Denton, C. A., Wexler, J., Vaughn, S., & Bryan, D. (2008). The intervention provided to
linguistically diverse middle school students with severe reading difficulties. Learning
Disabilities Research & Practice, 23(2), 79-89.
Dobbie, W., & Fryer Jr, R. G. (2011). Are high-quality schools enough to increase diagnostic
scores
among the poor? Evidence from the Harlem Children's Zone. American Economic

106
Journal: Applied Economics, 3(3), 158-87.
Dusenbury, L., Brannigan, R., Falco, M., & Hansen, W. B. (2003). A review of research on
fidelity of implementation: Implications for drug abuse prevention in school settings.
Health Education Research, 18(2), 237-256.
Dvorak, R. N., Randel, B., & Swain, M. (2019c). An impact evaluation of reading i-Ready
Instruction for middle school grades. (HumRRO Report, 2019, No. 074). Alexandria,
VA: HumRRO.
Florida Department of Education (n.d.). Retrieved from
http://www.fldoe.org/core/fileparse.php/5662/urlt/UndFSAReports17.pdf
Florida Department of Education (n.d.). Retrieved from
http://www.fldoe.org/accountability/assessments/k-12-student-assessment/fsa.stml
Fogarty, M., Oslund, E., Simmons, D., Davis, J., Simmons, L., Anderson, L., ... & Roberts, G.
(2014). Examining the effectiveness of a multicomponent reading comprehension
intervention in middle schools: A focus on treatment fidelity. Educational Psychology
Review, 26(3), 425-449.
Foorman, B.R. (1995). Research on the "Great Debate": Code oriented versus whole language
approaches to reading instruction. School Psychology Review, 34 (3), 376 392
Fraenkel, J. R., Wallen, N. E., & Hyun, H. H. (2015). The nature of research. How to design and
evaluate research in education, 1-26.
Gersten, R., Fuchs, L. S., Compton, D., Coyne, M., Greenwood, C., & Innocenti, M. S. (2005).
Quality indicators for group experimental and quasi-experimental research in special
education. Exceptional Children, 71(2), 149-164.
Glaserfeld, (von) E. (1995). A constructivist approach to teaching. In: L.P. Steffe & J. Gale
107
(Eds.), Constructivism in Education. Lawrence Erlbaum Associates.
Gough, P. B., & Hillinger, M. L. (1980). Learning to read: An unnatural act. Bulletin of the
Orton Society, 30(1), 179-196.
Gresham, F. M. (2009). Evolution of the treatment integrity concept: Current status and future
directions. School Psychology Review, 38(4), 533-540.
Hermens, R. P., Hak, E., Hulscher, M. E., Braspenning, J. C., & Grol, R. P. (2001). Adherence to
guidelines on cervical cancer screening in general practice: program elements of
successful implementation. British Journal of General Practice, 51(472), 897-903.
National center on intensive intervention. (n.d.). Retrieved March 31, 2021, from
http://www.intensiveintervention.org/
Hulleman, C. S., & Cordray, D. S. (2009). Moving from the lab to the field: The role of fidelity
and achieved relative intervention strength. Journal of Research on Educational
Effectiveness, 2(1), 88-110.
Jones, H. A., Clarke, A. T., & Power, T. J. (2008). Expanding the concept of intervention
integrity: A multidimensional model of participant engagement. Balance, 23(1), 4-5.
Kavale, K. A., & Forness, S. R. (1987). Substance over style: Assessing the efficacy of modality
testing and teaching. Exceptional Children, 54(3), 228-239.
Kezar, A. J., Walpole, M., & Perna, L. W. (2015). Chapter 15: Engaging low-income
students. Student engagement in higher education: Theoretical perspectives and practical
approaches for diverse populations, 237-255.
Kirkpatrick, D. L., & Craig, R. (1967). Evaluation of training. Evaluation of Short-Term
training in Rehabilitation. Monograph, (3), 35-56.

108
Kraft, M. A. (2020). Interpreting the effect sizes of education interventions. Educational
Researcher, 49(4), 241-253.
Ladd, H. F. (2012). Education and poverty: Confronting the evidence. Journal of
Policy Analysis and Management, 31(2), 203-227.
Lunenburg, F. C., & Irby, B. J. (2008). Writing a successful thesis or dissertation: Tips and
strategies for students in the social and behavioral sciences. Corwin Press.
Maslow, A., & Lewis, K. J. (1987). Maslow's hierarchy of needs. Salenger Incorporated, 14,
987.
Matthews, W. J. (2003). Constructivism in the classroom: Epistemology, history, and empirical
evidence. Teacher Education Quarterly, 30(3), 51-64.
Mihalic, S. (2004). The importance of implementation fidelity. Emotional and Behavioral
Disorders in Youth, 4(4), 83-105.
National Center on Intensive Intervention. (n.d.). Retrieved March 31, 2021, from
http://www.intensiveintervention.org/
Paine, S. C. (1983). Structuring your classroom for academic success. Research PressPub
Penuel, W. R., & Means, B. (2004). Implementation variation and fidelity in an inquiry science
program: Analysis of GLOBE data reporting patterns. Journal of Research in Science
Teaching, 41(3), 294-315.
Piaget, J. (1973). The Child and Reality: Problems of Genetic Psychology.(Trans. Arnold Rosin).
Grossman.
Randel, B., & Swain, M. (2019). An Impact Evaluation of reading i-Ready Instruction for
Middle School Grades.

109
Reardon, S. F. (2011). The widening academic diagnostic scores gap between the rich and the
poor:
New evidence and possible explanations. Whither opportunity, 1(1), Chapter 5, 91-116.
Reardon, S. F. (2013). The widening income diagnostic scores gap. Educational Leadership,
70(8),
10-16.
Salkind, N. J. (2010). Causal-comparative design. Encyclopedia of research design, 1, 124-131.
Scott, T. M., Gage, N. A., Hirn, R. G., Lingo, A. S., & Burt, J. (2019). An examination of the
association between MTSS implementation fidelity measures and student
outcomes. Preventing School Failure: Alternative Education for Children and
Youth, 63(4), 308-316.
Seminole County Public Schools (n.d.). Retrieved from
https://www.scps.k12.fl.us/_resources/documents/StudentProgressionPlan.pdf
Silva, T. B. (2016). The effects of the i-Ready computer-assisted instruction
program on the reading and fluency diagnostic scores of first graders. (Doctoral
dissertation). Turlock, California. California State University, Stanislaus.
Smith, F., & Goodman, K. S. (1971). On the psycholinguistic method of teaching reading. The
Elementary School Journal, 71(4), 177-181.
Stanovich, K. E. (2009). Matthew effects in reading: Some consequences of individual
differences in the acquisition of literacy. Journal of Education, 189(1-2), 23-55.
Statistics, L. (2013). The ultimate IBM® SPSS® guides. Laerd Statistics.
Steinberg, W. J. (2010). Statistics Alive!. Sage Publications.
Stone, J. E., & Clements, A. D. (1998). Research and innovation: Let the buyer beware. The
110
Superintendent of the Future.
Sutinen, A. (2008). Constructivism and education: education as an interpretative
transformational process. Studies in philosophy and education, 27(1), 1-14.
Swain, M., Randel, B., & Norman Dvorak, R. (2020). Impact Evaluation of reading" i-Ready
Instruction" for Elementary Grades Using 2018-19 Data. Final Report. No. 107. Online
Submission.
Swanson, H. L., & Hoskyn, M. (1998). Experimental intervention research on students with
learning disabilities: A meta-analysis of treatment outcomes. Review of Educational
Research, 68(3), 277-321.
Taboada, A., Townsend, D., & Boynton, M. J. (2013). Mediating effects of reading engagement
on the reading comprehension of early adolescent English language learners. reading &
Writing Quarterly, 29(4), 309-332.
Troyer, M. (2017). Teacher implementation of an adolescent reading intervention. Teaching and
Teacher Education, 65, 21-33.
Vaughn, S., Roberts, G., Klingner, J. K., Swanson, E. A., Boardman, A., Stillman-Spisak, S. J.,
... & Leroux, A. J. (2013). Collaborative strategic reading: Findings from experienced
implementers. Journal of Research on Educational Effectiveness, 6(2), 137-163.
Vygotsky, L. (1978). Interaction between learning and development. readings on the
development of children, 23(3), 34-41.
Waite-Stupiansky, S. (1997). Building understanding together: A constructivist approach to
early childhood education. Cengage Learning.
Ysseldyke, J. E. (1973). diagnostic-prescriptive teaching: The search for aptitude-treatment
interactions. The First Review of Special Education, 1, 5-32.

111
Ysseldyke, J., Spicuzza, R., Kosciolek, S., Teelucksingh, E., Boys, C., & Lemkuil, A. (2003).
Using a curriculum-based instructional management system to enhance math diagnostic scores in
urban schools. Journal of Education for Students Placed at Risk, 8(2), 247-265.