examining the impact of protective clothing on range …
TRANSCRIPT

________________________________________________________
Range of movement
1
EXAMINING THE IMPACT OF PROTECTIVE CLOTHING
ON RANGE OF MOVEMENT
Lucy Dorman and George Havenith
Loughborough University, Environmental Ergonomics Research Centre.
European Union project THERMPROTECT G6RD-CT-2002-00846.
Report 2007-7
1. Introduction
This chapter will address another of the possible contributors to the
increased metabolic rate observed when wearing protective clothing. The
nature of the protection required in industries where workers are exposed to
extreme cold, heat and fire often means garments are constructed of thick,
heavy, insulative material. The impact of these garments on ease of
movement, range of motion and work efficiency has been referred to in the
literature using various terms; clothing bulk, movement restriction and
hobbling effect. But the effects have been hard to measure and quantify and
so the possible involvement of clothing bulk in increasing energy cost in the
wearer is still not clear.
1.1 Previous research
It is well documented that Personal Protective Clothing (PPC) can
negatively affect worker performance (Nunneley 1989; Adams et al. 1994;
Rintamaki 2005). The previous chapters have investigated the effects of
clothing weight and number of layers worn, but the additional bulkiness of
PPC can also contribute to performance degradation (Patton et al. 1995;
Murphy et al. 2001). Ideally clothing must have sufficient ease. If a garment
binds or restricts the wearer, or is too large, wearer mobility and the level of
protection it provides can be adversely affected (Huck et al. 1997). Bulky
clothing compromises movement, requiring added movement or force to
complete tasks thereby increasing the metabolic cost of work (Nunneley
________________________________________________________
Range of movement
2
1989). Performance degradation can also be measured as decreased range
of movement, impaired dexterity, reduced speed and decreased accuracy
(Nunneley 1989; Adams et al. 1994; Murphy et al. 2001; Rintamaki 2005).
Teitlebaum and Goldman (1972) cite Belding et al. (1945) who observed
that as bulk of clothing increased, the increase in caloric expenditure was
much greater than could be accounted for by the increased weight of
clothing. Belding et al. concluded that the extra caloric output was due to the
hobbling effect of clothing. Also cited by Teitlebaum and Goldman (1972) is
the work of Gray, Consolazio and Kark (1951) who suggested a binding or
hobbling effect of heavier clothing worn in the cold which increased the
required work output, thus increasing the caloric demand. Teitlebaum and
Goldman (1972) found a significant 16 % increase in metabolic rate walking
in arctic clothing and discuss a possible hobbling effect due to interference
with movement at the body’s joints, produced by clothing bulk.
These observations and comments are backed up more recently by others
who have also detailed higher energy costs in a variety of protective clothing
ensembles. The bulk and stiffness of the chemical protective clothing (CPC)
used by Patton et al. (1995) was reported to have contributed to a hobbling /
binding effect by interfering with joint movements. The same authors using
the same clothing later showed that the CPC had little impact on tasks of a
stationary / intermittent nature but a marked impact on tasks requiring whole
body mobility (Murphy et al. 2001). The continuous tasks (31 Army physical
tasks categorised by the degree of whole body mobility. Stationary tasks
included; lifting, assembling/disassembling a rifle, intermittent tasks
included; lifting and carrying, continuous tasks included; load carriage tasks,
obstacle course) required more mobility and demonstrated a greater
increase in absolute VO2 compared to the stationary and intermittent tasks.
Murphy et al. (2001) also cite White et al. (1989) who reported that tolerance
times in their study attenuated rapidly as garments became more
cumbersome and work intensity increased.

________________________________________________________
Range of movement
3
The literature discussed so far has covered the physiological implications of
bulky clothing, where higher VO2 and increased energy costs have been
attributed to extra movement and effort required to overcome garment bulk,
particularly at the joints. However, in a number of studies the authors have
been unable to conclude the exact contribution clothing bulk makes to the
wearer performance, due to the clothing also having extra weight, a loose fit
and an increase in discomfort (Duggan 1988; Rissanen and Rintamaki
1997). Lotens (1982) identifies the difficulty of quantifying the energetic
effects of motion restriction experimentally. As he explains, in the laboratory,
treadmills and bikes are not well suited for measuring motion restriction
movements. In reviewing the data available, he concludes that the effect of
bulkiness of clothing cannot be analysed as it is often confounded by other
impeding effects (Lotens 1982).
Havenith and Heus (2004) explain that specialised protective clothing is
usually tested only to standards which give requirements for the materials
used, consequently the effects of the manufacturing process on the material
and the effects of clothing design, sizing and fit are overlooked. They
therefore suggest the use of a battery of tests which cover the ergonomics
of the clothing including ‘freedom of movement’.
Ideally PPC and personal protective equipment (PPE) should not restrict
movement or otherwise impede job performance, however PPC ensembles
often incorporate multiple fabric layers leading to bulky, heavy and inflexible
garments (Huck 1988). Range of movement (ROM) can be affected by
garment bulk and although anecdotal evidence from workers wearing bulky
winter clothing suggest stiffness and bulk may restrict mobility, quantitative
evidence is lacking (Adams and Keyserling 1995). If workers are required to
wear PPC that limits mobility, worker productivity is likely to drop and in
extreme cases contributes to injury (Huck 1988). One needs to consider to
what extent is protective clothing an advantage and what degree of mobility
loss should be permitted before the clothing becomes a greater danger than
the threat the clothing protects against (Lotens 1982).

________________________________________________________
Range of movement
4
Adams and Keyserling (1995) evaluated the effects of garment size and
fabric weight on range of movement using undersized, appropriately sized
and oversized overalls and three different weights of polyester/cotton fabric.
The measured variable in the study was the ROM during 12 gross body
movements measured with a 2-arm manual goniometer. The ROM, defined
as the maximum angular change available at a joint was measured in
degrees from a reference / neutral position. The results indicated that the
effect of garment size was greater than the garment weight, although
increased garment weight decreased the ROM slightly. Compared to nude
the undersized garments reduced mean ROM by up to 24 % (hip flexion)
with all movements significantly reduced except shoulder extension and
trunk lateral flexion. The differences in ROM between undersized and
correctly sized garments were also significant, the differences between
correct sized and oversized garments were not significant (Adams and
Keyserling 1995).
Huck (1988) cites some of the earlier studies that looked at movement
restriction, Saul and Jaffe (1955) tested the effects of clothing on gross
motor performance, with results indicating performance decreased as the
amount of clothing worn increased. An arm and shoulder harness was
developed by Nicoloff (1957) (cited in Huck 1988) to simulate body
movement restriction in upper body segments and wearing the harness
produced significant decrements in movement. The final study cited by Huck
(1988) is that of Bachrach et al. (1975) who were able to discriminate
between diving ensembles using goniometer type apparatus to quantify the
restriction to movement of deep sea divers wearing 2 different designs of
diving gear.
Various tools and techniques have been devised for measuring joint angles
and ROM, the simplest of which is the goniometer (Huck 1988). Using a
Leighton flexometer (a gravity goniometer developed by Leighton (1955), for
more detail see Huck 1988) and 8 joint movements based on firefighting
requirements, Huck (1988) compared 3 different firefighter clothing designs,

________________________________________________________
Range of movement
5
2 different moisture barrier materials and wearing / not wearing self
contained breathing apparatus (SCBA). The Leighton flexometer was
strapped over the clothing and for each of the static movements participants
were given the command “move to the fullest extent possible without
straining”. The effect of the moisture barrier configurations were not
significant and the clothing designs were only significant for 2 movements,
shoulder adduction / abduction and trunk lateral flexion. The SCBA imposed
the greatest restriction to movement, with the upper body, arms and torso
movements being significantly affected (Huck 1988).
Bensel et al. (1987) examined the effects of standard army chemical
protective (CP) clothing and the highest level of chemical warfare protection
(known as MOPP IV) on a number of aspects of soldiers performance
including body mobility. The impact of the CP clothing on body mobility
(measured with a goniometer) varied as a function of the task being
performed and items worn. The CP overgarment restricted simple
movements of the leg in the sagittal plane and of the arm in the body’s
frontal plane compared to t-shirt and shorts. A number of gross mobility
tasks were also studied along with a questionnaire. The gross movements
were only minimally affected by the CP clothing compared to standard
battledress uniform (BDU), however superior performance was evident in
the BDU compared to the MOPP IV ensemble in all mobility tasks except
standing trunk flexion and upper arm forward extension. Subjectively higher
ratings were also recorded for the MOPP IV ensemble showing participants
were subjectively aware of the restriction imposed by the protection (Bensel
et al. 1987).
Fit and design issues can also impinge upon movement and performance,
Graveling and Hanson (2000) showed that there was scope for
improvement in the wearability and fit of firefighter clothing. In their study,
inadequate allowance for arm extension, particularly in sleeves with thumb
loops, restricted arm movements and bending movements were limited by
insufficient body length in garments. Trousers with insufficient provision for

________________________________________________________
Range of movement
6
expansion in thigh diameter when squatting or kneeling also limited
movements (Graveling and Hanson 2000).
Adams and Keyserling (1995) discuss three possible mechanisms by which
garments act to constrain movement;
i) garments interfere with movement by preventing body from
changing volume or shape, e.g. garment lacks volume or the
volume is not distributed as needed if a key dimension is too
short.
ii) anchoring or tying of a garment can prevent displacement, e.g. a
tight sleeve cannot slide up the arm, garments can pull at the
crotch and thighs when the hip is flexed.
iii) multiple constraint mechanisms can act together to impede
movement, however these may not be apparent when looking at
simple movements e.g. no problem identified with a deep squat or
arm abduction but inability to effectively abduct arms when in a
deep squat.
When considering the results discussed above, particularly those looking at
ROM (Huck 1988; Adams and Keyserling 1995; Huck et al. 1997) it is
important to note that the movements are static and participants are given
verbal instructions, for example “move to the fullest extent possible without
straining” (Huck 1988). These static movements may give an accurate
picture of what is happening at the extreme joint ranges, e.g. shoulder
adduction / abduction and hip flexion / extension, but are these isolated and
somewhat simple movements representative of the demands on a firefighter
during a shift?
Additionally the goniometer measurements are often stated to have been
taken over the top of the protective garments or suits being tested but PPC
can complicate angle measurements by hiding body landmarks and joint
centres (Adams and Keyserling 1993). The accuracy of this method also
needs to be considered as Huck (1988) admits measurements of joint
________________________________________________________
Range of movement
7
motion taken over large, bulky protective clothing present a greater
challenge in obtaining accurate, reproducible measurements.
In summary, the literature reviewed has reported that;
PPC can negatively affect worker performance and the additional
bulkiness of many PPC garments is a likely contributor to
performance degradation.
There are two main groups of papers;
Papers that have suggested that bulky clothing can compromise
movement which then requires added effort, increasing the metabolic
cost, to complete the task. This theory is normally put forward in the
discussion or conclusion of the article.
Papers that have used goniometers to measure the maximum
angular change available at a joint from a reference / neutral position,
with the goniometers normally attached over the clothing, and in a
static situation.
Therefore the present study will attempt to measure the joint angles on the
skin during continuous movements such as walking and stepping in a
number of garments that have already been to shown to induce an increase
in metabolic rate when worn during work.
1.2 Aims
The aims of this study are;
To investigate if wearing protective clothing affects the wearers range
of movement during walking, stepping and crawling activities.
To measure hip and knee angles whilst walking, stepping and
crawling in a range of protective clothing garments.
To test the hypothesis that protective clothing restricts movement,
requiring extra effort to complete the same task compared to a lightly
clothed control.

________________________________________________________
Range of movement
8
2. Materials and Methods
2.1 Participants
Six participants took part in the study. They were all volunteers drawn from
the student population at Loughborough University. Their physical
characteristics are summarised in Table 2.1.
Table 2.1. Participant details.
Gender Age (yrs) Height (cms) Weight (kg)F 22.1 173 65 M 22.2 173 85 M 29.3 176 91 M 28.6 177 75 M 24.8 185 85 F 25.0 172 70
ave 25.3 176.0 78.5 SD 3.1 4.8 10.1
2.2 Clothing
The clothing used in this study was a sample drawn from the original 14
garments tested in the first study in this thesis. The garments were selected
on the basis of their high clothing bulk and previously recorded significant
increase in metabolic rate. The Chainsaw (J) protection suit, two coldstore
suits (Coldsuit black (H) an all-in-one design, Coldsuit green (I) separate
jacket and trousers design) and two firefighters suits, Grey fire (B) and Gold
fire (D) were selected. It was also decided to test the firefighter trousers
without the jacket. For more information and photographs of the garments,
see Methodology (Chapter 2). Participants attended the lab for one session
and were supplied with a pair of shorts and a t-shirt to wear, which were
worn throughout, for the control and under the protective clothing.
Participants wore their own trainers.
________________________________________________________
Range of movement
9
2.3 Work modes
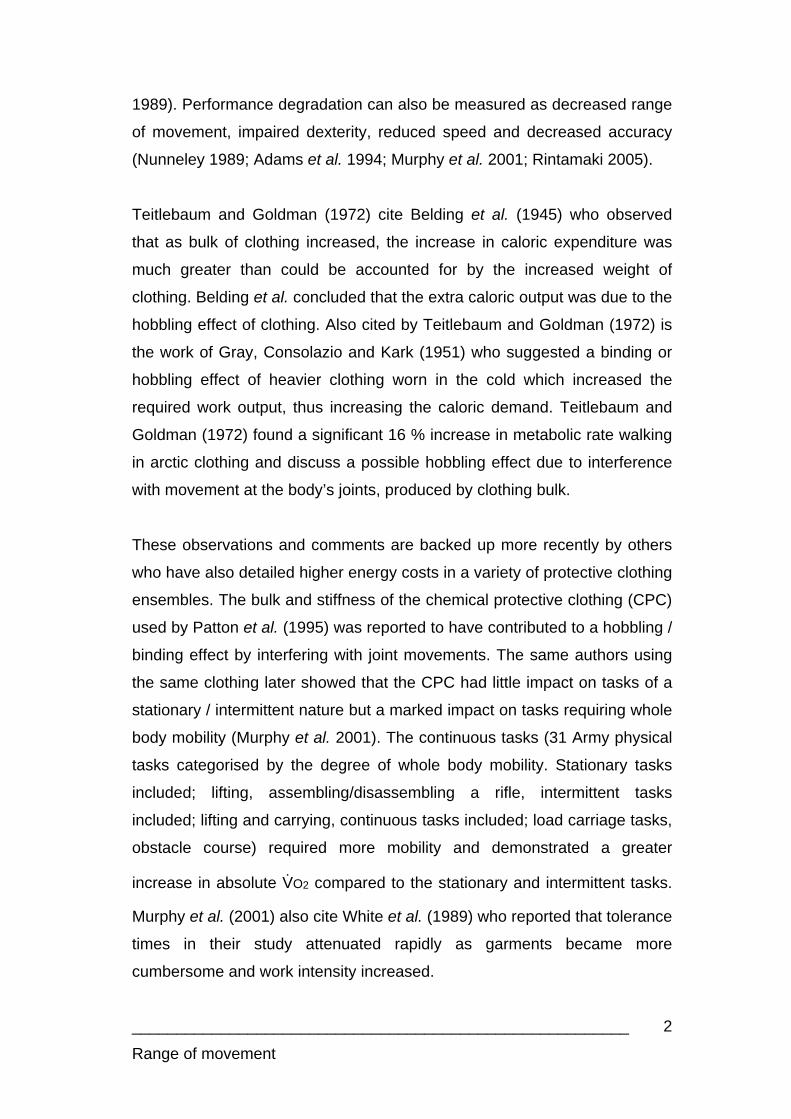
Walking was the most obvious work mode to study due to the fact that the
metabolic effects of the clothing had been studied whilst walking previously
and to allow comparison with existing literature. Participants walked on a
treadmill for a minute at 5 km/hr, as shown in Figure 2.1.
Figure 2.1. Photograph of participant walking on the treadmill.
Stepping and completing an obstacle course were the other work modes for
which the metabolic effects were measured previously. These activities were
broken down to enable more accurate data collection and analysis. The
metronome with verbal counting was used as previously described, but for
this study the rate was quicker, set at 72 beeps per minute, or 1 beep every
0.83 seconds. Participants were instructed to move one foot on each beep,
this method of a movement per beep was used because it was easier to
repeat consistently and accurately. Participants were given a chance to
practice the movements and timing so they were smooth during the testing.
The stepping and crawling sequences are documented fully in Table 2.2 and
2.3, including photographs and details of timing. Participants repeated the
stepping sequence and the crawling sequence six times in each garment.

________________________________________________________
Range of movement
10
Table 2.2. Timing details, descriptions of movements and photographs to illustrate the stepping sequence.
0.83 secs; Right foot onto top step
1.66 secs; Left foot onto top step
2.49 secs; Right foot down to floor
3.32; Left foot down to floor
4.15; Right foot to base of steps
4.98; Left foot to base of steps
5.81; Right foot up to 1st step
6.64; Left foot up to 2nd step
7.47; Right foot down to 3rd step

________________________________________________________
Range of movement
11
8.30; Left foot down to floor
9.13; Right foot back to beginning
9.96; Left foot back to beginning
Table 2.3. Timing details, descriptions of movements and photographs to illustrate the crawling sequence.
0.83 secs; Right leg over hurdle
1.66 secs; Left leg over hurdle
2.49 secs; Right leg bends to duck under hurdle
3.32; Left leg bends to duck under hurdle
4.15; Right leg turns around to face hurdle
4.98; Left leg turns around to face hurdle

________________________________________________________
Range of movement
12
5.81; Right leg steps forward
6.64; Left leg steps forward, right knee bends to floor
7.47; Right foot steps forward
8.30; Left leg over hurdle
9.13; Right leg over hurdle
9.96; Turn around
2.4 Measurements and calibration
A number of methods have been used to evaluate restriction to movement,
the paper by Huck et al. (1997) mentions five (see paper for more detail);
1. movement analysis; involves measurement of ROM for various body
joints using goniometers or other similar instrumentation
2. seam stress analysis; evaluation of the strain exerted on a garment
due to wearer movement
3. garment slash analysis; also looks at strain on the garment
4. visual analysis; trained observers can provide additional insight into
the problems associated with movement while wearing protective
clothing
5. subjective preferences; using wearer acceptability scales.
________________________________________________________
Range of movement
13
In the Human Sciences Department there were 2 systems available for the
present study; electrical goniometers and a CODA motion analysis system.
The CODA system is a real-time 3D motion capture and analysis system
with sensor units independently capable of measuring the 3-D coordinates
of markers in real-time. The automatic intrinsic identification of markers
combined with processing of all 3-D co-ordinates in real-time means that
graphs and stick figures of the motion and many types of calculated data
can be displayed on a computer screen during and immediately after the
movement occurs (http://www.charndyn.com/index.html). The CODA system
is predominantly used for gait analysis in the department. The markers are
normally attached to the skin at anatomical landmarks, if they are to be used
with clothing, the markers would need to be secured by straps over the top
of the clothing to prevent them moving around. However placing straps
around the clothing (above and below the joint) will additionally affect the
clothing bulk and range of movement, therefore this method was deemed
unacceptable.
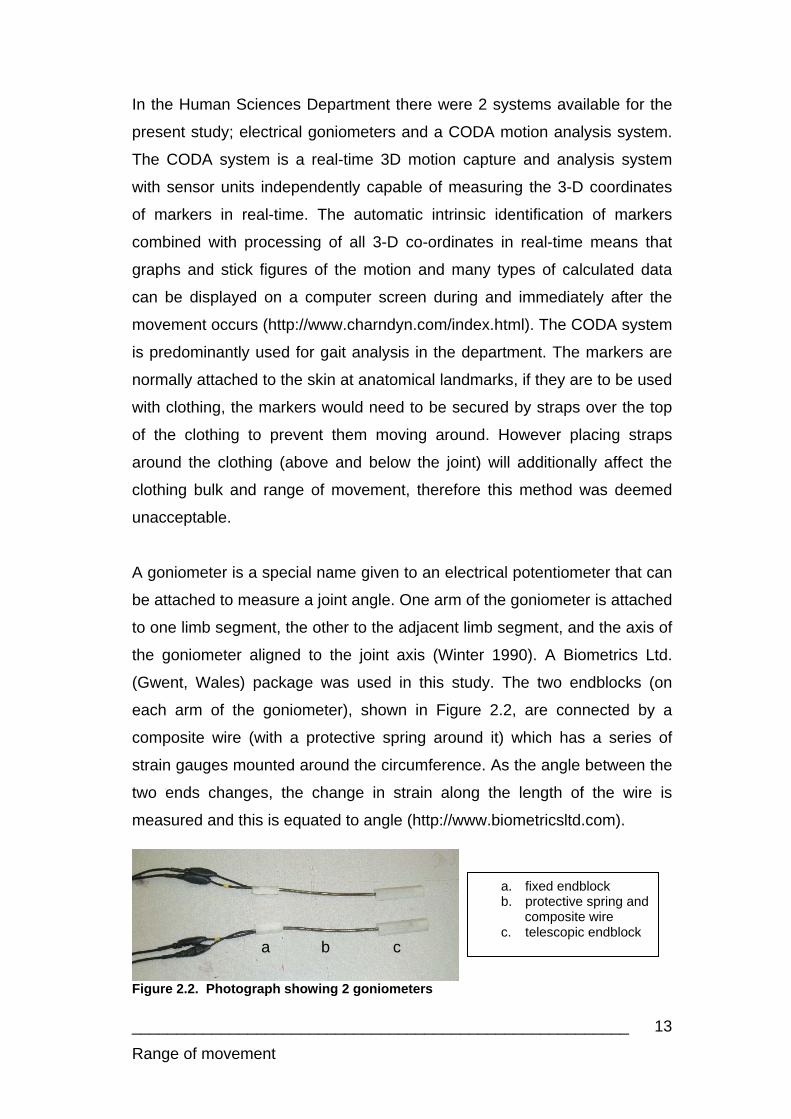
A goniometer is a special name given to an electrical potentiometer that can
be attached to measure a joint angle. One arm of the goniometer is attached
to one limb segment, the other to the adjacent limb segment, and the axis of
the goniometer aligned to the joint axis (Winter 1990). A Biometrics Ltd.
(Gwent, Wales) package was used in this study. The two endblocks (on
each arm of the goniometer), shown in Figure 2.2, are connected by a
composite wire (with a protective spring around it) which has a series of
strain gauges mounted around the circumference. As the angle between the
two ends changes, the change in strain along the length of the wire is
measured and this is equated to angle (http://www.biometricsltd.com).
Figure 2.2. Photograph showing 2 goniometers
a b c
a. fixed endblock b. protective spring and
composite wire c. telescopic endblock
________________________________________________________
Range of movement
14
Electrical goniometers can be used to record movements, not just static
positions. The goniometers can be secured on the skin (the endblocks taped
above and below the joint to be studied) and the clothing worn over the top,
this ensures the goniometers are in the same position for all clothing
ensembles as they do not need to be removed to change the clothing. By
contrast, the CODA system places markers over the top of the clothing,
which would make it very difficult to repeatedly place the markers accurately
and consistently in the same place. The goniometers also have the
advantage of not affecting or influencing joint movement due to their small
size and fact that they are taped to the skin. Based on these advantages of
using the goniometers over the CODA system it was decided to use the
goniometer system in this experiment.
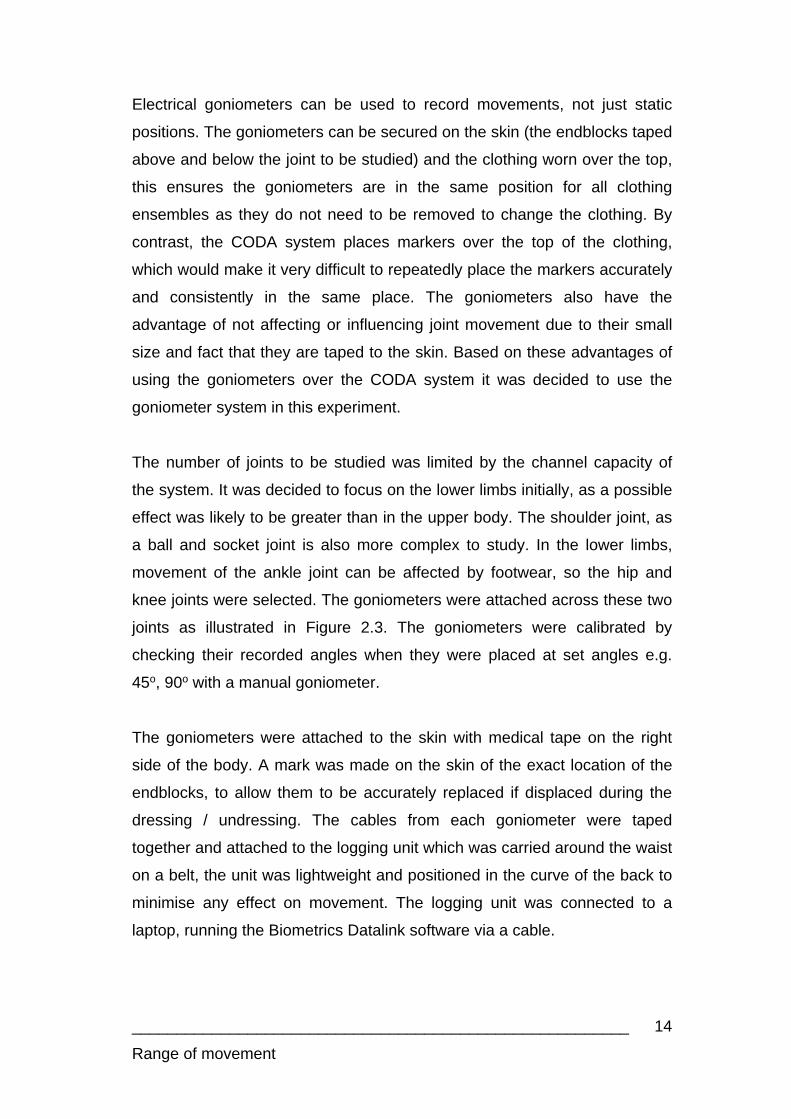
The number of joints to be studied was limited by the channel capacity of
the system. It was decided to focus on the lower limbs initially, as a possible
effect was likely to be greater than in the upper body. The shoulder joint, as
a ball and socket joint is also more complex to study. In the lower limbs,
movement of the ankle joint can be affected by footwear, so the hip and
knee joints were selected. The goniometers were attached across these two
joints as illustrated in Figure 2.3. The goniometers were calibrated by
checking their recorded angles when they were placed at set angles e.g.
45o, 90o with a manual goniometer.
The goniometers were attached to the skin with medical tape on the right
side of the body. A mark was made on the skin of the exact location of the
endblocks, to allow them to be accurately replaced if displaced during the
dressing / undressing. The cables from each goniometer were taped
together and attached to the logging unit which was carried around the waist
on a belt, the unit was lightweight and positioned in the curve of the back to
minimise any effect on movement. The logging unit was connected to a
laptop, running the Biometrics Datalink software via a cable.
________________________________________________________
Range of movement
15
Once the participants had changed into the shorts and t-shirt provided, the
goniometers were attached and the range of movement checked. With the
participants then standing in a neutral reference posture (standing upright)
the goniometers were set to zero.
Figure 2.3. Illustrations of the sites and positions where the goniometers were attached (notes included for positioning of the goniometers as provided in the Biometrics manual).
2.5 Experimental design
The study was a within-subjects design with each participant acting as their
own control. They completed all the protective garments and a control
condition (shorts and t-shirt) in one session. The shorts and t-shirt were
worn throughout, with the protective garments over the top, trainers (their
own) were also worn for all conditions by participants. The garment order
Mount the telescopic endblock laterally on the leg so the axes of the leg and endblock coincide, when viewed in the sagittal plane (as shown above) with the leg fully extended in the position of reference, and attach the fixed endblock to the thigh so the axes of the thigh and endblock coincide. The knee may be fully extended or flexed.
Attach the fixed endblock to the side of the trunk in the pelvic region (as shown above). With the limb in the position of reference, attach the telescopic endblock to the thigh so that the axes of the thigh and endblock coincide (when viewed in the sagittal plane, as above). The hip may now be flexed or extended.
HIP KNEE

________________________________________________________
Range of movement
16
was balanced. For each condition participants walked first, stepped, then
completed the crawling. Each work mode was repeated six times and
recorded as a separate file, before moving onto the next work mode.
2.6 Procedure
On arrival at the lab, the format of the session was explained to the
participants and they were given a chance to ask questions before
completing a consent form and health screen questionnaire. The work
modes and timing was demonstrated to the participants and they were given
a chance to practice before changing into the shorts and t-shirt provided.
The goniometers were attached to the right leg of the participants with
medical tape and marks drawn on the skin of the position of the goniometers
in case they were displaced, as described above. With the participant
standing in a neutral posture the zero was set on the goniometers.
Participants donned the first set of clothing and the goniometers were
connected to the logging unit on a belt which was fastened around the
participants waist with the logging unit sitting in the curve of the back.
Participants walked for 1 minute on the treadmill, followed by 6 repeats of
the stepping cycle and then 6 repeats of the crawling cycle. After all the
work modes had been completed for each garment participants were asked
to comment generally on the garment; comfort, fit, restriction to movement
etc.
2.7 Analysis
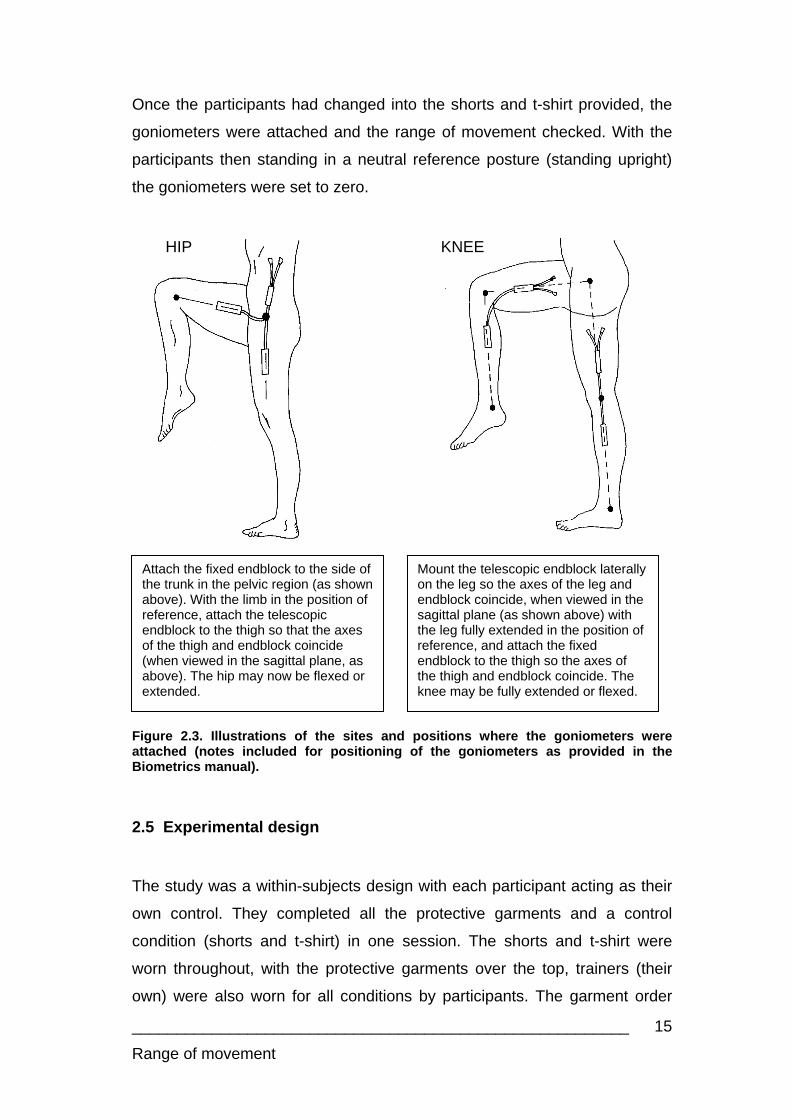
The data was exported from the data link software into Microsoft Excel
spreadsheets and converted into joint angles. Graphs were plotted for each
participant for each condition (7 garments and control) and each workmode
(walking, stepping, crawling). Examples of the traces plotted are shown in
Figures 2.4, 2.5 and 2.6 for knee and hip angles.

________________________________________________________
Range of movement
17
For the walking data, 5 gait cycles were analysed and the maximum and
minimum values for knee and hip angles were recorded, the arrows and
labels in Figure 2.4 illustrate the points that were recorded from one gait
cycle.
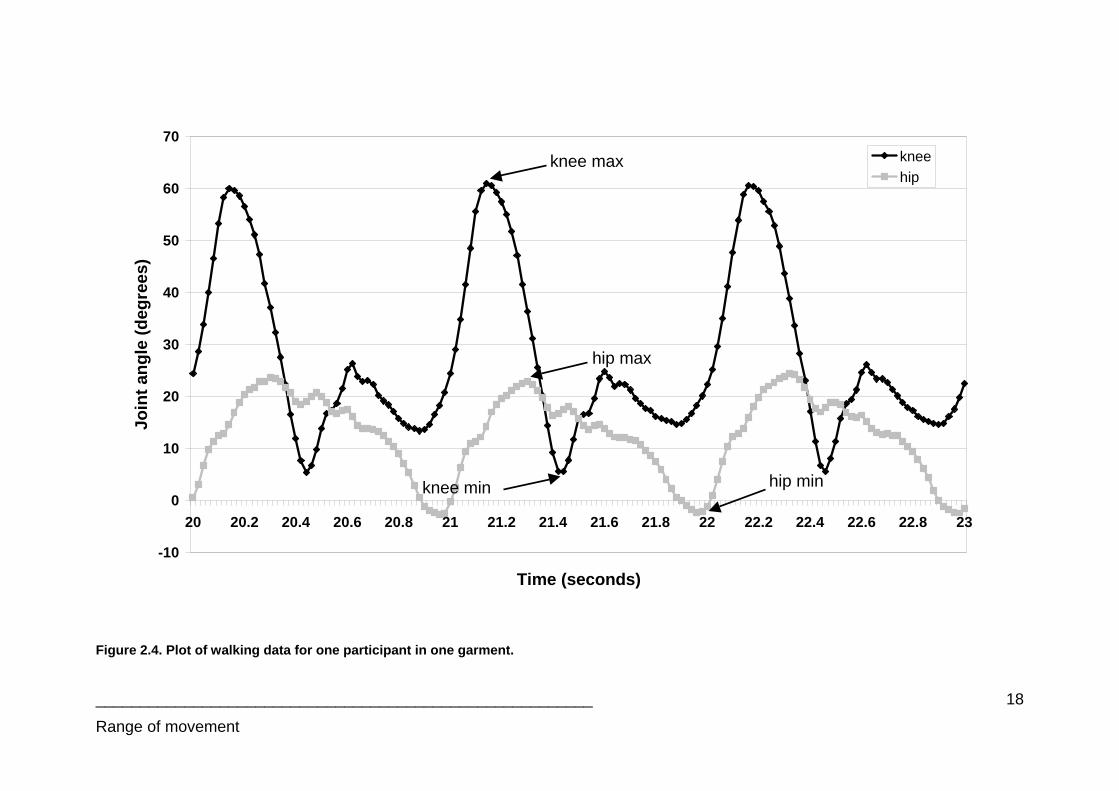
The stepping sequence was made up of 6 main movements, described in
Table 2.2, these have been highlighted again in Table 2.4. The maximum
and minimum angles for these 6 movements were recorded and 5 cycles of
the stepping sequence were analysed. The arrows and labels in Figure 2.5
have been provided to illustrate the points recorded for one sequence.
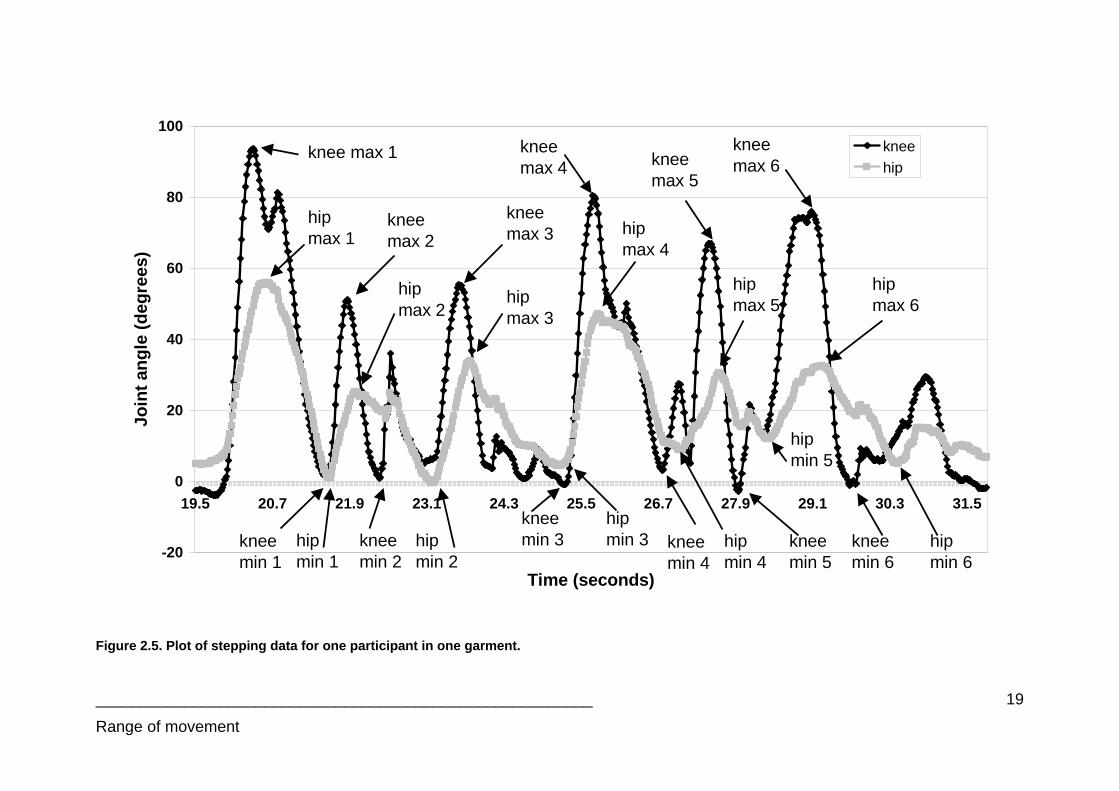
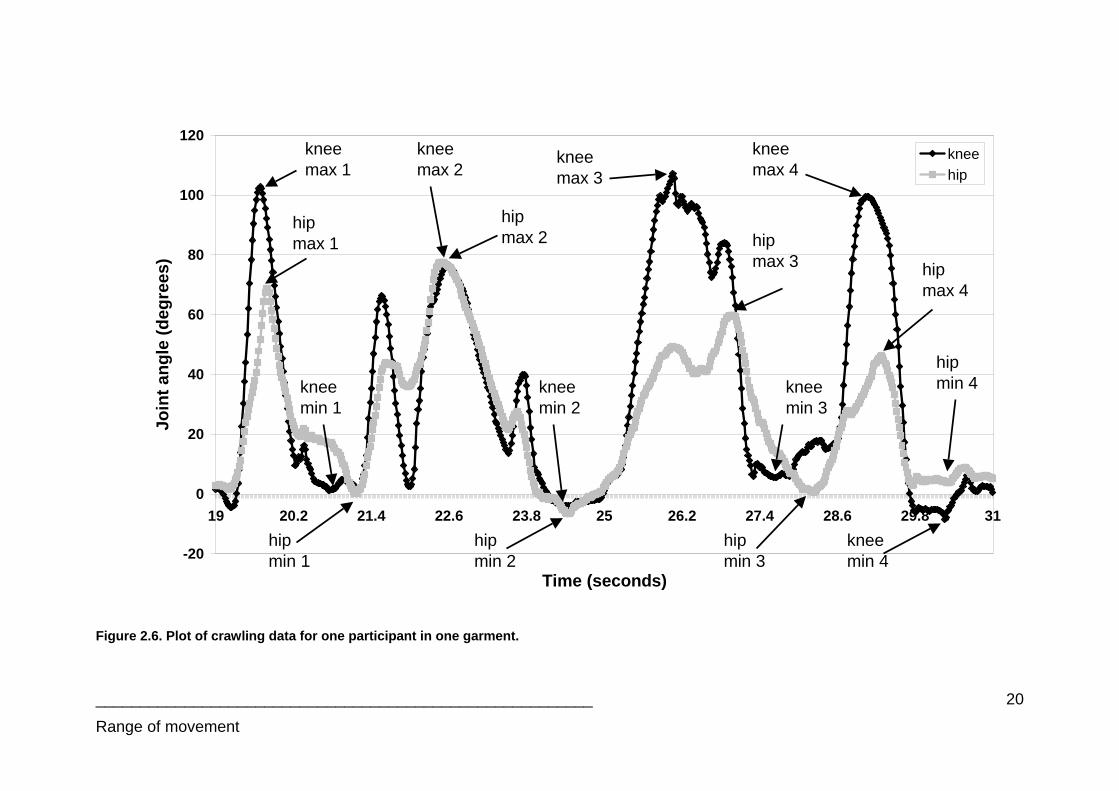
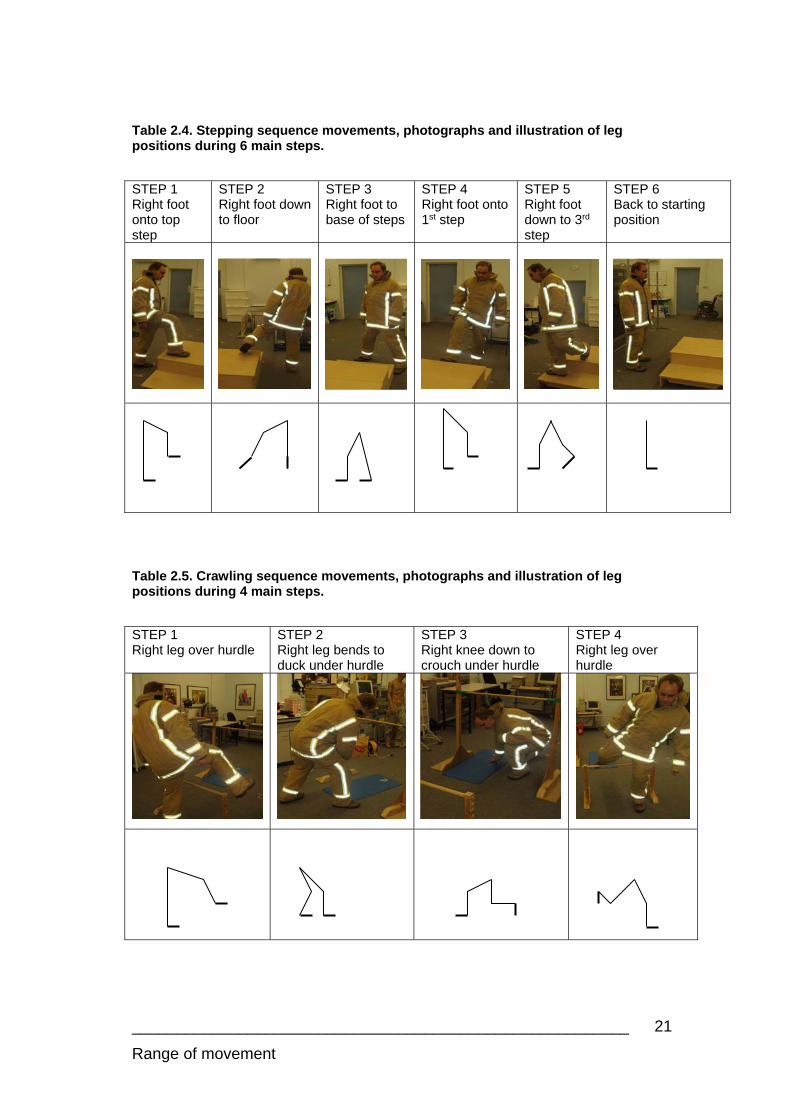
The crawling sequence, previously illustrated in Table 2.3 was made up of 4
main movements, highlighted again in Table 2.5. The maximum and
minimum angles for these 4 movements over 5 cycles of the crawling
sequence were analysed. Figure 2.6 indicates the points taken for the knee
and hip angles for one sequence.
The analysis described above resulted in summary graphs of the control
and garments for each participant, for each work mode. As the differences
between garments were small a clothing average for all the garments was
then calculated, this was analysed with the control average (based on the 6
participants). Paired t-tests were carried out on the control and clothing
average values for the maximum knee angle, minimum knee angle, knee
angle range (range of movement), maximum hip angle, minimum hip angle,
hip angle range (range of movement).
________________________________________________________
Range of movement
18
Figure 2.4. Plot of walking data for one participant in one garment.
-10
0
10
20
30
40
50
60
70
20 20.2 20.4 20.6 20.8 21 21.2 21.4 21.6 21.8 22 22.2 22.4 22.6 22.8 23
Time (seconds)
Join
t an
gle
(d
egre
es)
knee
hipknee max
knee min
hip max
hip min
________________________________________________________
Range of movement
19
Figure 2.5. Plot of stepping data for one participant in one garment.
-20
0
20
40
60
80
100
19.5 20.7 21.9 23.1 24.3 25.5 26.7 27.9 29.1 30.3 31.5
Time (seconds)
Join
t an
gle
(d
egre
es)
knee
hipknee max 1
knee max 2
knee max 3
knee max 4 knee
max 5
knee max 6
kneemin 1
knee min 4
knee min 3knee
min 2knee min 5
knee min 6
hipmin 1
hipmin 2
hipmin 3 hip
min 4hipmin 6
hipmin 5
hip max 1
hip max 6
hip max 5
hip max 4
hip max 2
hip max 3
________________________________________________________
Range of movement
20
Figure 2.6. Plot of crawling data for one participant in one garment.
-20
0
20
40
60
80
100
120
19 20.2 21.4 22.6 23.8 25 26.2 27.4 28.6 29.8 31
Time (seconds)
Join
t an
gle
(d
egre
es)
knee
hip
knee max 2
knee max 1
knee max 3
knee max 4
kneemin 1
kneemin 2
kneemin 3
kneemin 4
hip max 1
hip max 2 hip
max 3 hip max 4
hipmin 1
hipmin 2
hipmin 3
hipmin 4
________________________________________________________
Range of movement
21
Table 2.4. Stepping sequence movements, photographs and illustration of leg positions during 6 main steps.
STEP 1 Right foot onto top step
STEP 2 Right foot down to floor
STEP 3 Right foot to base of steps
STEP 4 Right foot onto 1st step
STEP 5 Right foot down to 3rd step
STEP 6 Back to starting position
Table 2.5. Crawling sequence movements, photographs and illustration of leg positions during 4 main steps.
STEP 1 Right leg over hurdle
STEP 2 Right leg bends to duck under hurdle
STEP 3 Right knee down to crouch under hurdle
STEP 4 Right leg over hurdle
________________________________________________________
Range of movement
22
3. Results
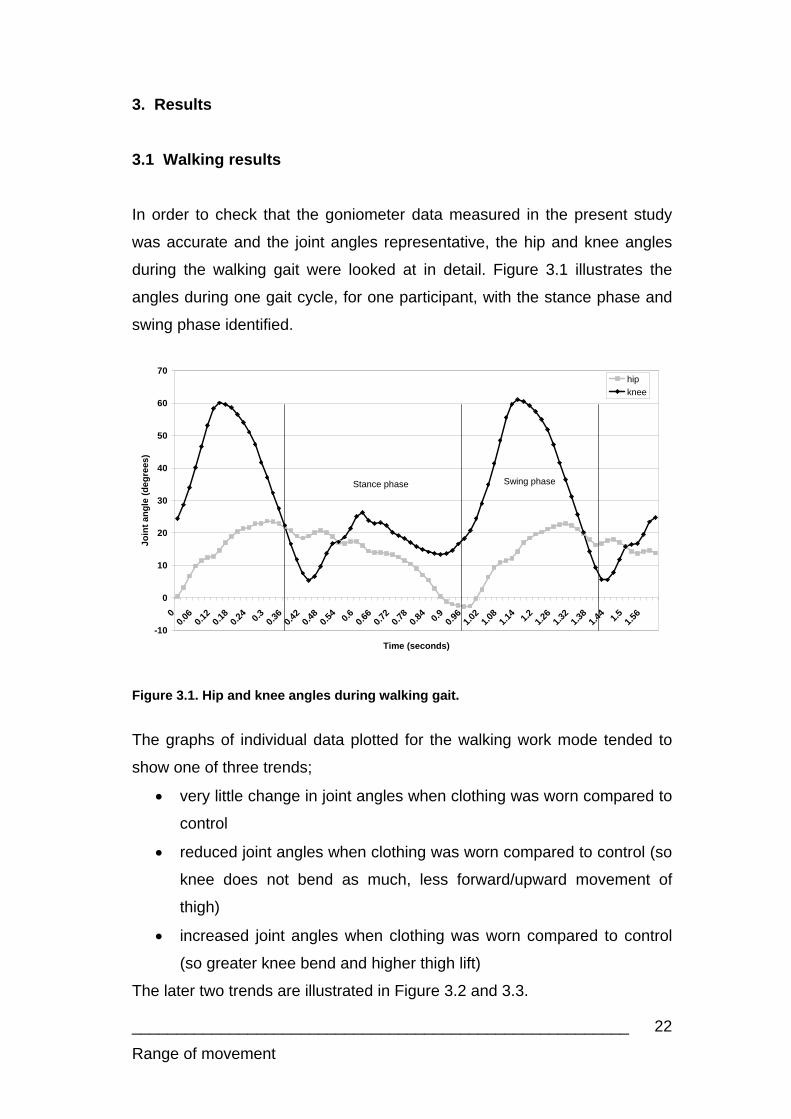
3.1 Walking results
In order to check that the goniometer data measured in the present study
was accurate and the joint angles representative, the hip and knee angles
during the walking gait were looked at in detail. Figure 3.1 illustrates the
angles during one gait cycle, for one participant, with the stance phase and
swing phase identified.
Figure 3.1. Hip and knee angles during walking gait.
The graphs of individual data plotted for the walking work mode tended to
show one of three trends;
very little change in joint angles when clothing was worn compared to
control
reduced joint angles when clothing was worn compared to control (so
knee does not bend as much, less forward/upward movement of
thigh)
increased joint angles when clothing was worn compared to control
(so greater knee bend and higher thigh lift)
The later two trends are illustrated in Figure 3.2 and 3.3.
-10
0
10
20
30
40
50
60
70
00.
060.
120.
180.
24 0.3
0.36
0.42
0.48
0.54 0.
60.
660.
720.
780.
84 0.9
0.96
1.02
1.08
1.14 1.
21.
261.
321.
381.
44 1.5
1.56
Time (seconds)
Jo
int
an
gle
(d
eg
rees
)
hip
knee
Stance phase Swing phase
________________________________________________________
Range of movement
23
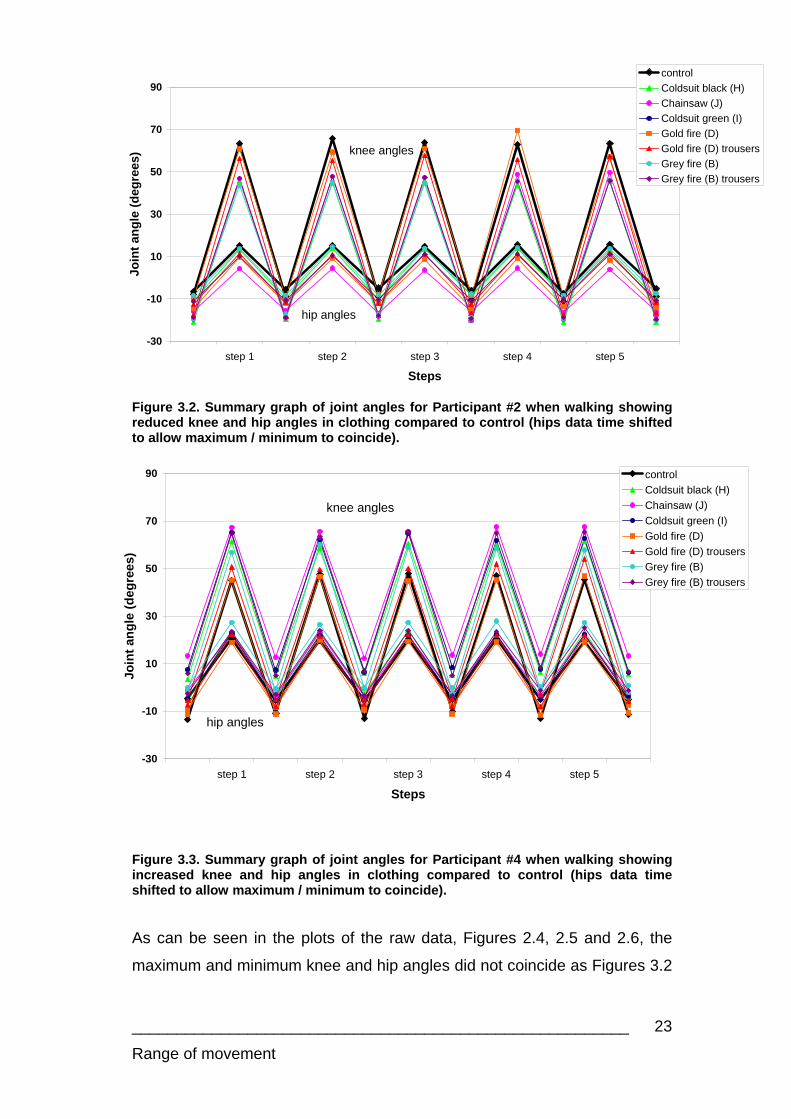
Figure 3.2. Summary graph of joint angles for Participant #2 when walking showing reduced knee and hip angles in clothing compared to control (hips data time shifted to allow maximum / minimum to coincide).
Figure 3.3. Summary graph of joint angles for Participant #4 when walking showing increased knee and hip angles in clothing compared to control (hips data time shifted to allow maximum / minimum to coincide).
As can be seen in the plots of the raw data, Figures 2.4, 2.5 and 2.6, the
maximum and minimum knee and hip angles did not coincide as Figures 3.2
-30
-10
10
30
50
70
90
step 1 step 2 step 3 step 4 step 5
Steps
Join
t an
gle
(d
egre
es)
control
Coldsuit black (H)
Chainsaw (J)
Coldsuit green (I)
Gold fire (D)
Gold fire (D) trousers
Grey fire (B)
Grey fire (B) trousers
knee angles
hip angles
-30
-10
10
30
50
70
90
step 1 step 2 step 3 step 4 step 5
Steps
Join
t an
gle
(d
egre
es)
control
Coldsuit black (H)
Chainsaw (J)
Coldsuit green (I)
Gold fire (D)
Gold fire (D) trousers
Grey fire (B)
Grey fire (B) trousers
knee angles
hip angles
________________________________________________________
Range of movement
24
– 3.4 suggest, but for the purposes of summarising the values the data has
been presented as such.
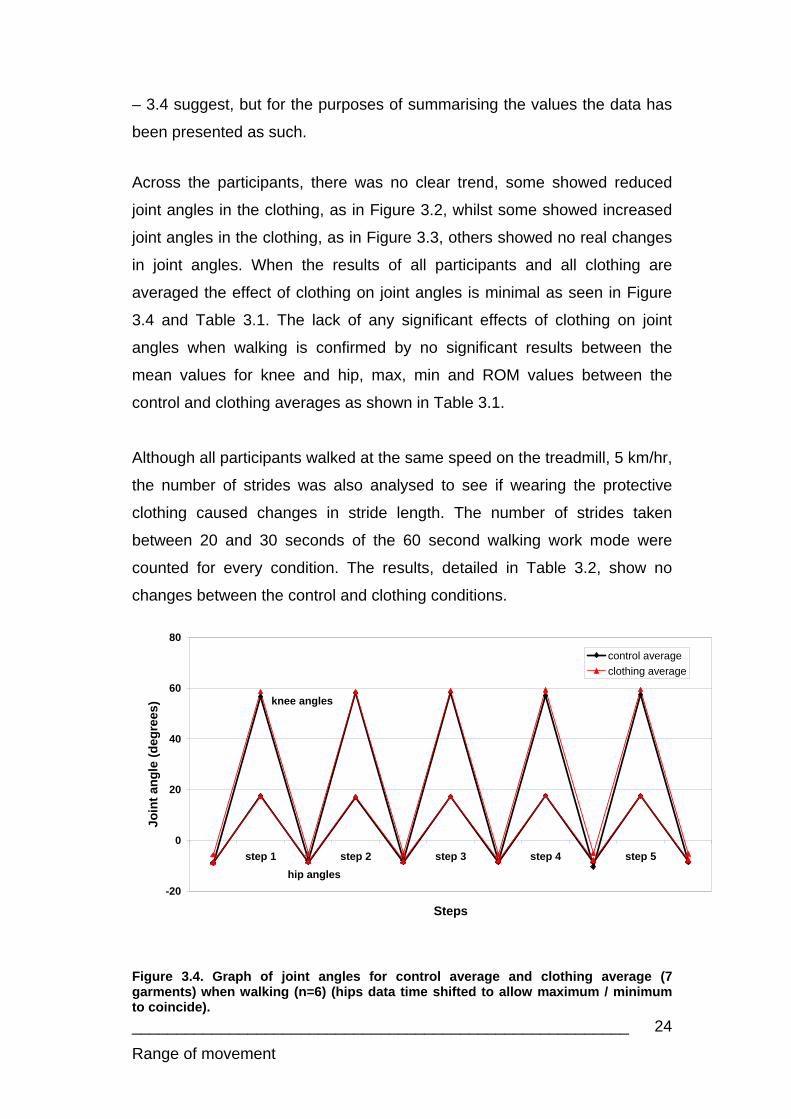
Across the participants, there was no clear trend, some showed reduced
joint angles in the clothing, as in Figure 3.2, whilst some showed increased
joint angles in the clothing, as in Figure 3.3, others showed no real changes
in joint angles. When the results of all participants and all clothing are
averaged the effect of clothing on joint angles is minimal as seen in Figure
3.4 and Table 3.1. The lack of any significant effects of clothing on joint
angles when walking is confirmed by no significant results between the
mean values for knee and hip, max, min and ROM values between the
control and clothing averages as shown in Table 3.1.
Although all participants walked at the same speed on the treadmill, 5 km/hr,
the number of strides was also analysed to see if wearing the protective
clothing caused changes in stride length. The number of strides taken
between 20 and 30 seconds of the 60 second walking work mode were
counted for every condition. The results, detailed in Table 3.2, show no
changes between the control and clothing conditions.
Figure 3.4. Graph of joint angles for control average and clothing average (7 garments) when walking (n=6) (hips data time shifted to allow maximum / minimum to coincide).
-20
0
20
40
60
80
step 1 step 2 step 3 step 4 step 5
Steps
Jo
int
ang
le (
deg
rees
)
control average
clothing average
knee angles
hip angles
________________________________________________________
Range of movement
25
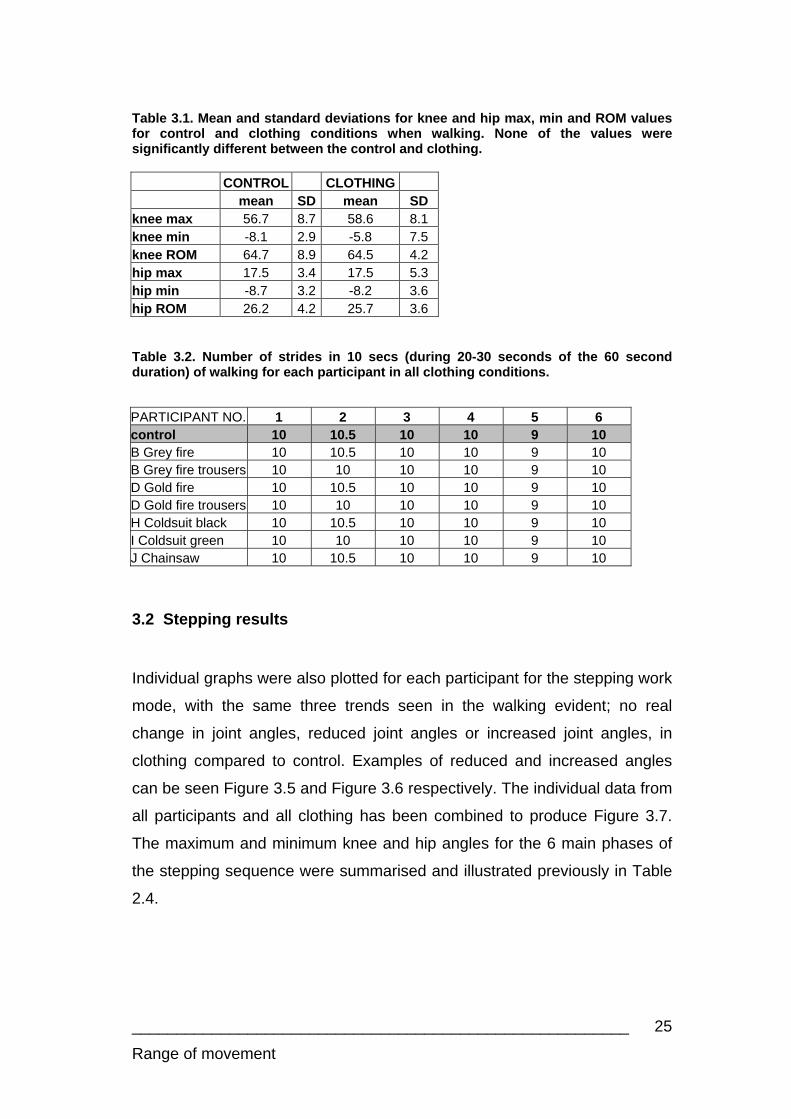
Table 3.1. Mean and standard deviations for knee and hip max, min and ROM values for control and clothing conditions when walking. None of the values were significantly different between the control and clothing.
Table 3.2. Number of strides in 10 secs (during 20-30 seconds of the 60 second duration) of walking for each participant in all clothing conditions.
PARTICIPANT NO. 1 2 3 4 5 6 control 10 10.5 10 10 9 10 B Grey fire 10 10.5 10 10 9 10 B Grey fire trousers 10 10 10 10 9 10 D Gold fire 10 10.5 10 10 9 10 D Gold fire trousers 10 10 10 10 9 10 H Coldsuit black 10 10.5 10 10 9 10 I Coldsuit green 10 10 10 10 9 10 J Chainsaw 10 10.5 10 10 9 10
3.2 Stepping results
Individual graphs were also plotted for each participant for the stepping work
mode, with the same three trends seen in the walking evident; no real
change in joint angles, reduced joint angles or increased joint angles, in
clothing compared to control. Examples of reduced and increased angles
can be seen Figure 3.5 and Figure 3.6 respectively. The individual data from
all participants and all clothing has been combined to produce Figure 3.7.
The maximum and minimum knee and hip angles for the 6 main phases of
the stepping sequence were summarised and illustrated previously in Table
2.4.
CONTROL CLOTHING mean SD mean SD knee max 56.7 8.7 58.6 8.1 knee min -8.1 2.9 -5.8 7.5 knee ROM 64.7 8.9 64.5 4.2 hip max 17.5 3.4 17.5 5.3 hip min -8.7 3.2 -8.2 3.6 hip ROM 26.2 4.2 25.7 3.6
________________________________________________________
Range of movement
26
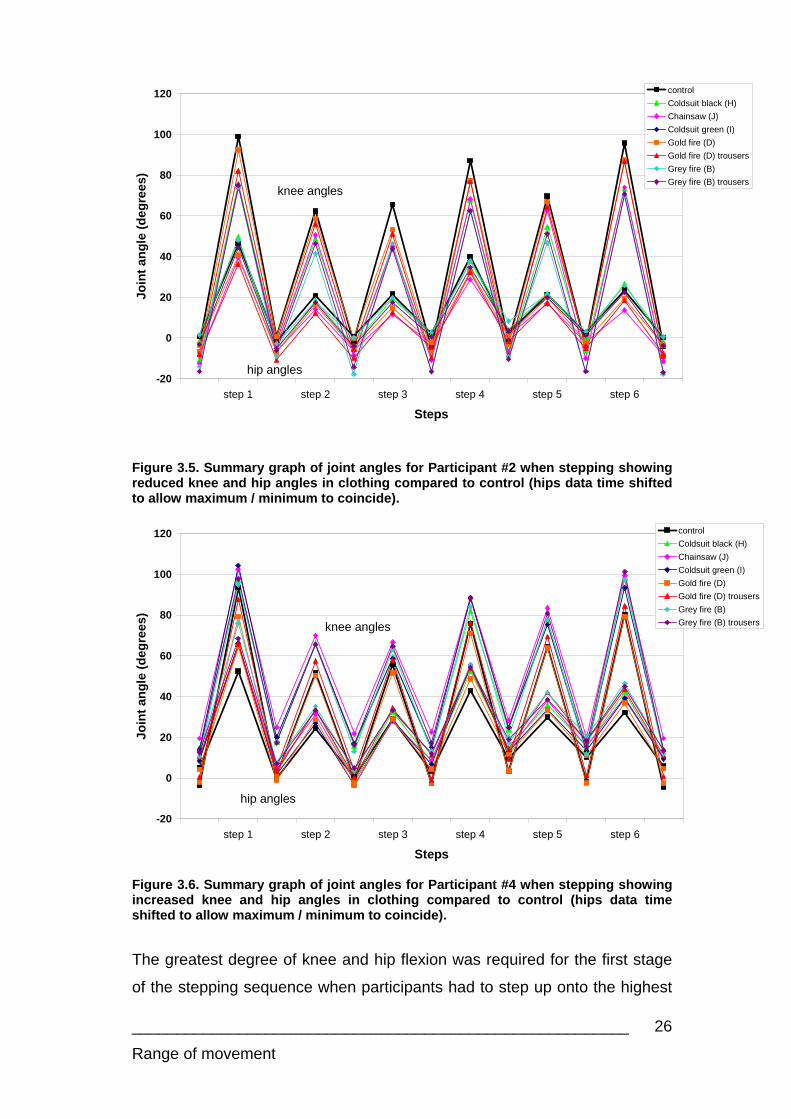
Figure 3.5. Summary graph of joint angles for Participant #2 when stepping showing reduced knee and hip angles in clothing compared to control (hips data time shifted to allow maximum / minimum to coincide).
Figure 3.6. Summary graph of joint angles for Participant #4 when stepping showing increased knee and hip angles in clothing compared to control (hips data time shifted to allow maximum / minimum to coincide).
The greatest degree of knee and hip flexion was required for the first stage
of the stepping sequence when participants had to step up onto the highest
-20
0
20
40
60
80
100
120
step 1 step 2 step 3 step 4 step 5 step 6
Steps
Join
t a
ng
le (
de
gre
es)
control
Coldsuit black (H)
Chainsaw (J)
Coldsuit green (I)
Gold fire (D)
Gold fire (D) trousers
Grey fire (B)
Grey fire (B) trousers
hip angles
knee angles
-20
0
20
40
60
80
100
120
step 1 step 2 step 3 step 4 step 5 step 6
Steps
Join
t an
gle
(d
egre
es)
control
Coldsuit black (H)
Chainsaw (J)
Coldsuit green (I)
Gold fire (D)
Gold fire (D) trousers
Grey fire (B)
Grey fire (B) trousers
hip angles
knee angles

________________________________________________________
Range of movement
27
step. Stepping up onto the first step and stepping down also required high
degrees of knee and hip flexion. As with the walking, the average change in
joint angle in clothing compared to control is relatively small due to the fact
that for some participants clothing reduced their joint angles and for some
clothing increased their joint angles compared to control. The average
graph, illustrated in Figure 3.7, shows reduced maximum knee flexion and
increased minimum knee flexion with clothing, reducing the overall range of
movement (ROM) of the knee joint. The hip angles are slightly increased at
maximum flexion and increased at minimum flexion, shifting the ROM
without altering it considerably.
Figure 3.7. Graph of joint angles for control average and clothing average (7 garments) when stepping (n=6) (hips data time shifted to allow maximum / minimum to coincide).
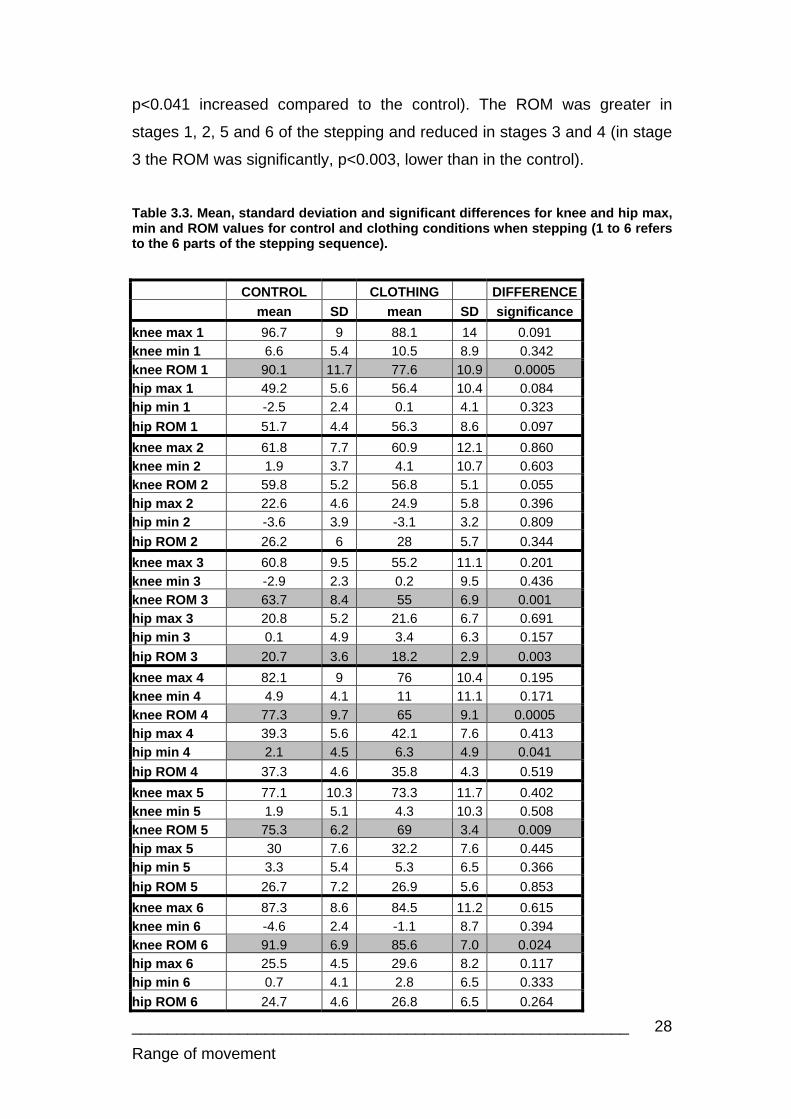
The data from Figure 3.7 is also displayed in Table 3.3, which highlights the
significant differences between control and clothing angles. For the knee
joint, in all stages of the stepping sequence (1 to 6), the maximum angle
recorded was reduced, the minimum angle was increased and the ROM
reduced. The reduction in ROM was significant for all the movements apart
from the second (right foot down to the floor). For the hip joint, the maximum
angle was increased and minimum angle increased in all movements (the
minimum angle during step 4, right foot onto 1st step was significantly
-20
0
20
40
60
80
100
step 1 step 2 step 3 step 4 step 5 step 6
Steps
Join
t an
gle
(d
egre
es)
control average
clothing average
right foot onto top stepknee
angles
hip angles
right foot down to floor
right foot to base of step
right foot onto 1st step
right foot down to 3rd step
right foot back to starting position
________________________________________________________
Range of movement
28
p<0.041 increased compared to the control). The ROM was greater in
stages 1, 2, 5 and 6 of the stepping and reduced in stages 3 and 4 (in stage
3 the ROM was significantly, p<0.003, lower than in the control).
Table 3.3. Mean, standard deviation and significant differences for knee and hip max, min and ROM values for control and clothing conditions when stepping (1 to 6 refers to the 6 parts of the stepping sequence).
CONTROL CLOTHING DIFFERENCE
mean SD mean SD significance
knee max 1 96.7 9 88.1 14 0.091
knee min 1 6.6 5.4 10.5 8.9 0.342
knee ROM 1 90.1 11.7 77.6 10.9 0.0005
hip max 1 49.2 5.6 56.4 10.4 0.084
hip min 1 -2.5 2.4 0.1 4.1 0.323
hip ROM 1 51.7 4.4 56.3 8.6 0.097
knee max 2 61.8 7.7 60.9 12.1 0.860
knee min 2 1.9 3.7 4.1 10.7 0.603
knee ROM 2 59.8 5.2 56.8 5.1 0.055
hip max 2 22.6 4.6 24.9 5.8 0.396
hip min 2 -3.6 3.9 -3.1 3.2 0.809
hip ROM 2 26.2 6 28 5.7 0.344
knee max 3 60.8 9.5 55.2 11.1 0.201
knee min 3 -2.9 2.3 0.2 9.5 0.436
knee ROM 3 63.7 8.4 55 6.9 0.001
hip max 3 20.8 5.2 21.6 6.7 0.691
hip min 3 0.1 4.9 3.4 6.3 0.157
hip ROM 3 20.7 3.6 18.2 2.9 0.003
knee max 4 82.1 9 76 10.4 0.195
knee min 4 4.9 4.1 11 11.1 0.171
knee ROM 4 77.3 9.7 65 9.1 0.0005
hip max 4 39.3 5.6 42.1 7.6 0.413
hip min 4 2.1 4.5 6.3 4.9 0.041
hip ROM 4 37.3 4.6 35.8 4.3 0.519
knee max 5 77.1 10.3 73.3 11.7 0.402
knee min 5 1.9 5.1 4.3 10.3 0.508
knee ROM 5 75.3 6.2 69 3.4 0.009
hip max 5 30 7.6 32.2 7.6 0.445
hip min 5 3.3 5.4 5.3 6.5 0.366
hip ROM 5 26.7 7.2 26.9 5.6 0.853
knee max 6 87.3 8.6 84.5 11.2 0.615
knee min 6 -4.6 2.4 -1.1 8.7 0.394
knee ROM 6 91.9 6.9 85.6 7.0 0.024
hip max 6 25.5 4.5 29.6 8.2 0.117
hip min 6 0.7 4.1 2.8 6.5 0.333
hip ROM 6 24.7 4.6 26.8 6.5 0.264

________________________________________________________
Range of movement
29
The changes in maximum joint angles compared to control have been
plotted in Figure 3.8. The changes in hip angles (black bars) with clothing
compared to control were all positive, with the largest increase in flexion, 7.2
degrees for the initial step up onto the top step. This initial movement also
caused the greatest change in knee angle (grey bars), a reduction of 8.6
degrees of flexion in the clothing compared to the control. The clothing also
had an effect on the hip and knee angles for the other main stepping
movements, with increased flexion in the hip and reduced flexion in the
knee.
Figure 3.8. Difference in maximum joint angles compared to control for the hip and knee during all phases of the stepping sequence.
3.3 Crawling results
Individual graphs were again plotted for each participant for the crawling
work mode, with the trends for no angle change, reduced angles and
increased angles with clothing, seen in the walking and stepping. An
individual plot illustrating predominantly reduced knee and hip angles when
clothing is worn compared to the control is included in Figure 3.9. The
individual data from all participants and all clothing has been combined to
produce Figure 3.10. The graphs illustrate the maximum and minimum knee
7.2
2.30.8
2.8 2.2
4.1
-8.6
-0.8
-5.6 -6.1
-3.8-2.8
-10
-8
-6
-4
-2
0
2
4
6
8
step 1 step 2 step 3 step 4 step 5 step 6
Steps
Join
t an
gle
co
mp
are
d t
o c
on
tro
l (d
egre
es) hip
knee
right foot back to starting position
right foot down to 3rd step
right foot onto 1st step
right foot to base of step
right foot down to floor
right foot onto top step

________________________________________________________
Range of movement
30
and hip angles for the 4 main phases of the crawling sequence as described
and illustrated previously in Table 2.5.
Figure 3.9. Summary graph of joint angles for Participant #2 when crawling showing predominantly reduced knee and hip angles in clothing compared to control (hips data time shifted to allow maximum / minimum to coincide).
Figure 3.10. Graph of joint angles for control average and clothing average (7 garments) when crawling (n=6) (hips data time shifted to allow maximum / minimum to coincide).
-20
0
20
40
60
80
100
120
140
step 1 step 2 step 3 step 4
Steps
Join
t an
gle
(d
egre
es)
control
Coldsuit black (H)
Chainsaw (J)
Coldsuit green (I)
Gold fire (D)
Gold fire (D) trousers
Grey fire (B)
Grey fire (B) trousers
hip angles
knee angles
-20
0
20
40
60
80
100
120
step 1 step 2 step 3 step 4
Steps
Join
t a
ng
le (
deg
rees
)
control average
clothing average
right leg over hurdle
right leg bends to duck under hurdle
right knee down to crouch under hurdle
right leg over hurdle
hip angles
knee angles
________________________________________________________
Range of movement
31
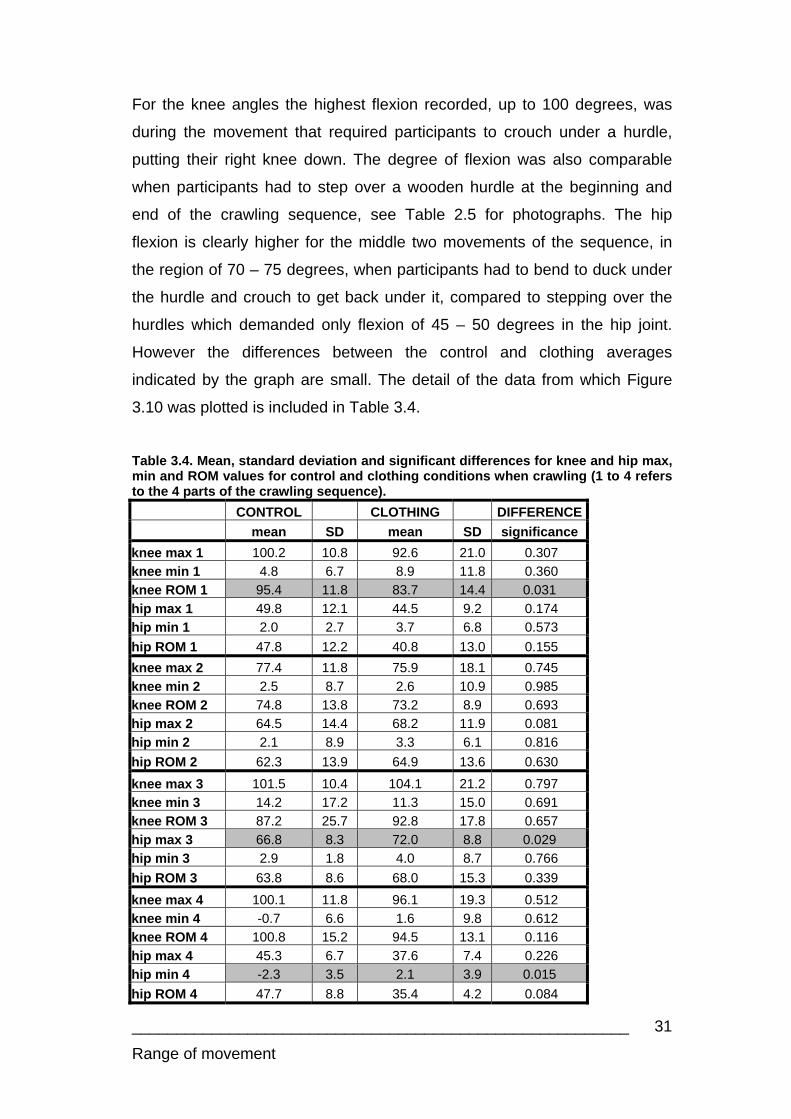
For the knee angles the highest flexion recorded, up to 100 degrees, was
during the movement that required participants to crouch under a hurdle,
putting their right knee down. The degree of flexion was also comparable
when participants had to step over a wooden hurdle at the beginning and
end of the crawling sequence, see Table 2.5 for photographs. The hip
flexion is clearly higher for the middle two movements of the sequence, in
the region of 70 – 75 degrees, when participants had to bend to duck under
the hurdle and crouch to get back under it, compared to stepping over the
hurdles which demanded only flexion of 45 – 50 degrees in the hip joint.
However the differences between the control and clothing averages
indicated by the graph are small. The detail of the data from which Figure
3.10 was plotted is included in Table 3.4.
Table 3.4. Mean, standard deviation and significant differences for knee and hip max, min and ROM values for control and clothing conditions when crawling (1 to 4 refers to the 4 parts of the crawling sequence).
CONTROL CLOTHING DIFFERENCE
mean SD mean SD significance
knee max 1 100.2 10.8 92.6 21.0 0.307
knee min 1 4.8 6.7 8.9 11.8 0.360
knee ROM 1 95.4 11.8 83.7 14.4 0.031
hip max 1 49.8 12.1 44.5 9.2 0.174
hip min 1 2.0 2.7 3.7 6.8 0.573
hip ROM 1 47.8 12.2 40.8 13.0 0.155
knee max 2 77.4 11.8 75.9 18.1 0.745
knee min 2 2.5 8.7 2.6 10.9 0.985
knee ROM 2 74.8 13.8 73.2 8.9 0.693
hip max 2 64.5 14.4 68.2 11.9 0.081
hip min 2 2.1 8.9 3.3 6.1 0.816
hip ROM 2 62.3 13.9 64.9 13.6 0.630
knee max 3 101.5 10.4 104.1 21.2 0.797
knee min 3 14.2 17.2 11.3 15.0 0.691
knee ROM 3 87.2 25.7 92.8 17.8 0.657
hip max 3 66.8 8.3 72.0 8.8 0.029
hip min 3 2.9 1.8 4.0 8.7 0.766
hip ROM 3 63.8 8.6 68.0 15.3 0.339
knee max 4 100.1 11.8 96.1 19.3 0.512
knee min 4 -0.7 6.6 1.6 9.8 0.612
knee ROM 4 100.8 15.2 94.5 13.1 0.116
hip max 4 45.3 6.7 37.6 7.4 0.226
hip min 4 -2.3 3.5 2.1 3.9 0.015
hip ROM 4 47.7 8.8 35.4 4.2 0.084

________________________________________________________
Range of movement
32
The data concerning the changes in knee angle when clothing is worn
compared to control show that in 3 of the 4 stages of the crawling work
mode the maximum flexion of the knee is reduced, the minimal flexion is
increased and the overall range of movement (ROM) reduced, significantly
in the first stage, stepping over the hurdle (p<0.031). The trends in the third
movement in the sequence, crouching down to crawl under the obstacle, are
reversed, with a greater maximal knee flexion and lower minimal knee
flexion, thus greater ROM. For the hip data the minimal angles achieved
were higher for all movements in the clothing, for the last movement,
stepping over the hurdle at the end the difference was significant (p<0.015).
For the maximal hip flexion and hip ROM results, there was a split between
the movements, for the hurdle obstacle which had to be stepped over at the
beginning and end of each repeat, the maximal hip angle reached was lower
and the ROM was lower. For the middle two obstacles, bending under a
hurdle and crouching down to come back under it, the maximal angle
recorded in the hip was increased (significantly so in the crouching,
p<0.029), increasing the overall ROM.
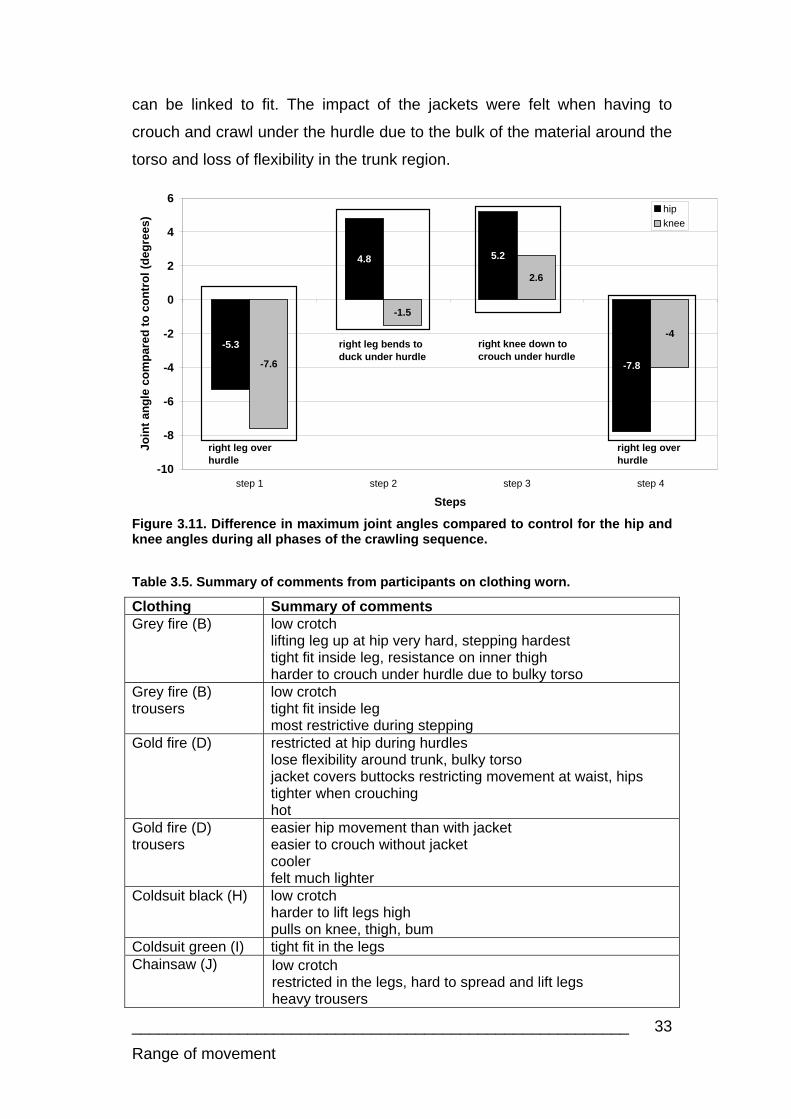
These patterns of change are illustrated graphically in Figure 3.11. The
reductions in knee angles in the clothing compared to the control, maximally
reduced by 7.6 degrees stepping over the first hurdle and the increase, 2.6
degrees in the third movement are evident. The two different trends seen in
the hip angles when clothing is worn are also made clearer, reduced flexion
when stepping over the hurdle (greater at the end of the sequence) and
increased flexion when bending down.
3.4 Subjective results
The participants’ comments on the clothing are summarised in Table 3.5.
The comments are predominantly about the trousers, and how the
participants felt they restricted their movement in the legs, by making it
harder to lift and spread the legs and creating resistance in the thighs. A low
crotch was also cited as a problem in many of the garments, although this
________________________________________________________
Range of movement
33
can be linked to fit. The impact of the jackets were felt when having to
crouch and crawl under the hurdle due to the bulk of the material around the
torso and loss of flexibility in the trunk region.
Figure 3.11. Difference in maximum joint angles compared to control for the hip and knee angles during all phases of the crawling sequence.
Table 3.5. Summary of comments from participants on clothing worn.
Clothing Summary of comments Grey fire (B) low crotch
lifting leg up at hip very hard, stepping hardest tight fit inside leg, resistance on inner thigh harder to crouch under hurdle due to bulky torso
Grey fire (B) trousers
low crotch tight fit inside leg most restrictive during stepping
Gold fire (D) restricted at hip during hurdles lose flexibility around trunk, bulky torso jacket covers buttocks restricting movement at waist, hips tighter when crouching hot
Gold fire (D) trousers
easier hip movement than with jacket easier to crouch without jacket cooler felt much lighter
Coldsuit black (H) low crotch harder to lift legs high pulls on knee, thigh, bum
Coldsuit green (I) tight fit in the legs Chainsaw (J) low crotch
restricted in the legs, hard to spread and lift legs heavy trousers
-5.3
4.8 5.2
-7.8-7.6
-1.5
2.6
-4
-10
-8
-6
-4
-2
0
2
4
6
step 1 step 2 step 3 step 4
Steps
Jo
int
ang
le c
om
par
ed
to
co
ntr
ol
(deg
rees
)
hip
knee
right leg over hurdle
right leg bends to duck under hurdle
right knee down to crouch under hurdle
right leg over hurdle
________________________________________________________
Range of movement
34
4. Discussion
Analysis of the hip and knee angles during walking gait as illustrated in
Figure 3.1, fit very well with the values and patterns of angle change seen in
other gait studies, particularly in the biomechanics literature (Winter 1984;
Winter 1990; Winter 1991). This indicates that the goniometers and
placements used in the present study produced accurate results, and
although it is very difficult to compare the stepping and movements made in
the obstacle course in the present study to the literature, by validating the
walking results against existing walking data, we can assume the data
recorded during the stepping and obstacle course is also accurate.
Analysis of the average walking data (Figure 3.4) showed no significant
differences between control and clothing data (Table 3.1) and also no
noteworthy difference in number of strides taken to maintain walking pace
(Table 3.2). The lack of significance during walking is not surprising because
of the limited leg swing required as 5km/hr is a comfortable walking pace for
most. At a higher walking speed, the differences may have been greater for
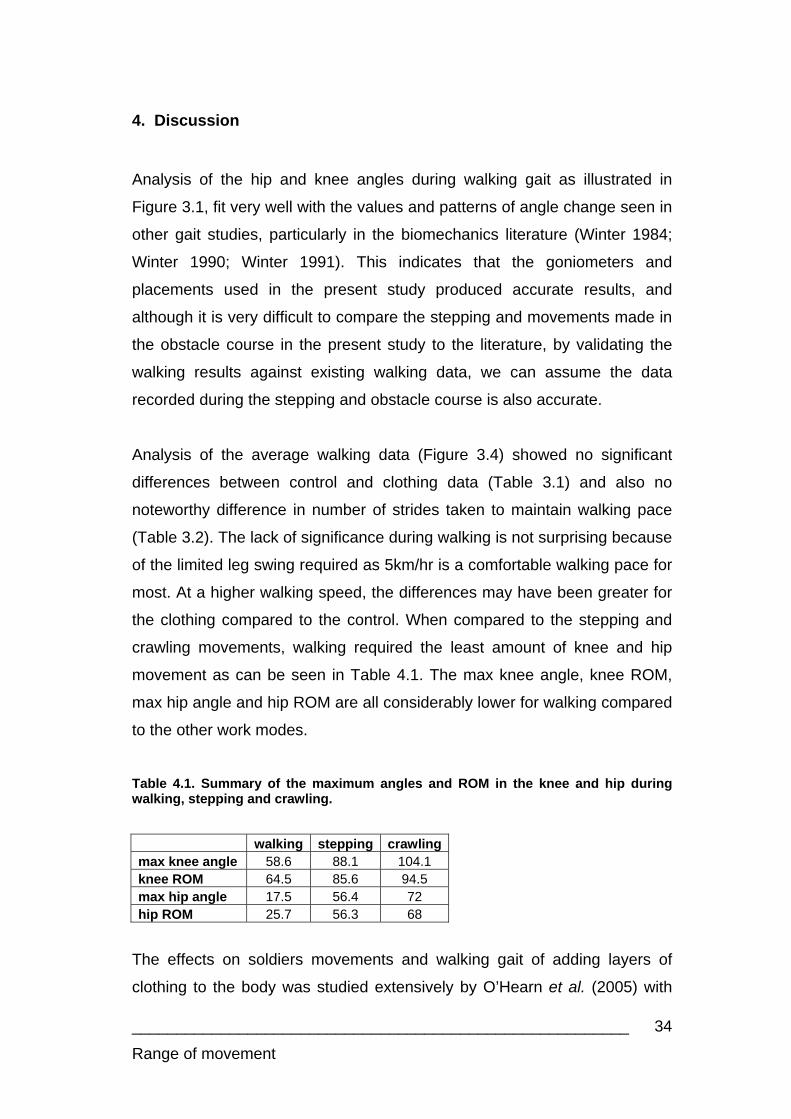
the clothing compared to the control. When compared to the stepping and
crawling movements, walking required the least amount of knee and hip
movement as can be seen in Table 4.1. The max knee angle, knee ROM,
max hip angle and hip ROM are all considerably lower for walking compared
to the other work modes.
Table 4.1. Summary of the maximum angles and ROM in the knee and hip during walking, stepping and crawling.
walking stepping crawlingmax knee angle 58.6 88.1 104.1 knee ROM 64.5 85.6 94.5 max hip angle 17.5 56.4 72 hip ROM 25.7 56.3 68
The effects on soldiers movements and walking gait of adding layers of
clothing to the body was studied extensively by O’Hearn et al. (2005) with
________________________________________________________
Range of movement
35
US Army cold weather clothing. Using a video based motion analysis
system to capture gait kinematics and kinetics they compared performance
in temperate duty uniform with cold weather clothing layers. Previous
studies of the mobility effects of army ‘extended cold weather clothing
systems’ (ECWCS) had been largely based on subjective ratings. The work
of O’Hearn et al. (2005) showed that the effects of the increased clothing
layer conditions appeared to be a constrained gait manifesting in a forward
lean position of the trunk and reduced arm swing. Increasing the number of
layers from 2 to 3 or 4 when walking resulted in a significant increase in hip
abduction, which the authors suggest is due to the thickness of the layers at
the crotch and thighs. An increase in hip abduction was also evident in
some of the data in the present study as a greater max hip angle. The gait
patterns are described by O’Hearn et al. (2005) as more laboured and the
movement, a “somewhat waddling gait”. O’Hearn et al. (2005) also present
evidence that this is a less efficient gait (decreased propelling force and
sharper initial vertical amplitude spike) and so is likely to increase the
energy cost of working in these garments as shown in the studies of this
thesis. The most extreme clothing conditions contrasted in their study were
the regular army uniform and 4 layers of cold weather clothing. In the later
clothing, participants were reported to have walked and moved differently,
leaning forwards, holding the arms forward and down, with less movement
at the shoulder. However this forward lean posture with restrained arm
movement may have been an adjustment that allowed the gait to remain
similar to when the body was unencumbered by clothing as there were no
significant differences in temporal and kinetic gait variables (O'Hearn et al.
2005) this may also have been the case for some participants in the present
study.
In conclusion, O’Hearn et al. (2005) note that bulky clothing can induce
altered gait patterns, which are adaptive and not necessarily inefficient. But
similar levels of clothing protection may differ in mobility restrictions,
resulting in a trade-off between protection and mobility.
________________________________________________________
Range of movement
36
A substantial amount of the work looking at gait and posture changes has
been undertaken in relation to carrying load. A number of papers have
looked at the energy cost of load carriage (Goldman and Iampietro 1962,
Soule and Goldman 1969, Hughes and Goldman 1970) and equations have
been designed to predict energy cost based on walking grades, terrains and
loads carried (Givoni and Goldman 1971, Pandolf et al. 1977). Others have
looked at the most efficient mode of carrying the load, including weight,
dimensions and placement of load (Datta and Ramanathan 1971, Legg and
Mahanty 1986, Haisman 1988). As has been described in previous chapters
the weights of the PPC garments do add extra load to the participant, with
the extra load, particularly of the heavier garments such as the firefighter
ensembles likely to have an impact on posture and gait. However there is
scant consideration of the effects of clothing weight as load in the literature,
with many papers comparing load carriage systems and much greater
weights.
Using 5 loads of 9-36 kg and high speed cinematography Martin and Nelson
(1986) report significantly different gait patterns under all load conditions.
Increasing the load, decreased the stride length and increased the stride
rate as well as causing an increased forward lean of the trunk for the 2
heaviest loads, stressing the importance of the magnitude and positioning of
the load. More detail can be found on postural adjustments in the studies of
Bloom and Woodhull-McNeal (1987), Fiolkowski et al. (2006) and Kinoshita
(1985).
Fiolkowski et al. (2006) and Kinoshita (1985) compared a backpack and a
front pack or double pack (weight spread over front and back packs).
Fiolkowski et al. (2006) concluded that use of a front pack results in a more
upright posture in gait compared to a backpack carrying the same load.
Wearing a backpack, participants walked with a greater forward lean and
greater forward flexion at the hip compared to the front pack and control.
Kinoshita’s (1985) results also conclude that the body posture and gait
pattern for a double pack are much nearer to those for normal walking,

________________________________________________________
Range of movement
37
revealing that loads substantially modified a normal walking gait pattern, but
a double pack system was biomechanically more effective than the
backpack (which increased the thigh orientation and knee angle in addition
to the increased trunk inclination and leg orientation seen with the double
pack) (Kinoshita 1985).
In the current study, the total weight of the protective clothing ensembles is
much lower (maximum 7 kg) than many of the loads carried (up to 40-50 kg)
in the military studies. However a recent study by Attwells et al. (2006) has
shown that adding loads of 8kg in the form of webbing, increased the ROM
at the knee, and the increases in the femur angle (same as hip angle
measured in the present study) they observed were significantly (p<0.001)
higher than the control.
The lower weights of the clothing and the distribution of the clothing weight
across the body is also much more uniform than when carrying load, for
example, in a rucksack. Therefore it is understandable that the changes in
posture described in this study are not as great as reported in other studies.
When wearing the clothing in the present study participants were not given
any additional instructions. The individual plots for the stepping, examples of
which can be seen in Figure 3.5 and 3.6, seem to show two different
behavioural responses. The joint angles and range of movements (ROM) of
some participants were reduced in the clothing (compared to the control) as
hypothesised. However in others the joint angles and ROM were increased,
it seems that some participants exaggerated the movements required, most
notably lifting the thigh higher (producing a greater hip angle) when stepping
up onto the highest step (height 40 cm). Although this goes against the
hypothesis of reduced movement, increasing the ROM to overcome the
restriction of the clothing would also be expected to raise the energy cost of
the activity.

________________________________________________________
Range of movement
38
In summary, for stepping, the maximum knee angle was reduced (the knee
was not bending as far due to the clothing) and the minimum knee angle
was increased (the knee was not straightening out at the end of the
movements) which resulted in a significantly reduced range of movement in
4 of the 6 stepping stages. In the hip, the maximum angle was increased
(thigh raised higher) and the minimum angle increased (not straightening
out at the hip/waist), on average this meant the hip angle was shifted slightly
rather than the ROM being significantly increased or reduced.
When the two joints are considered together, a reduced ability to bend the
knee due to the bulk around the knee can seem to be compensated for by
exaggerating lifting of the thigh especially when stepping up onto the steps.
The clothing also seems to affect the standing posture, with a slight bend in
the knee and slight inclination in the thigh, possibly caused by the size and
weight of the jackets. O’Hearn et al. (2005) also observed that bulky clothing
not only constrained movement but also affected the resting posture.
The highest maximum knee and hip angles and greatest knee and hip
ROMs across the work modes were recorded during the crawling (Table
4.1). Stepping over a 55 cm high hurdle, required lifting the leg (hip flexion
of 37.6 to 49.8o) and bending the knee (knee flexion of 92.6 to 100.2o). Both
hip flexion and knee flexion were reduced when clothing was worn
compared to the control, as hypothesised. The range of movement in the
knee joint was significantly lower (p<0.031) in the clothing for the first step
over the hurdle at the beginning of the crawling sequence.
The first of the two middle movements of the crawling sequence (bending to
duck under a hurdle) prompted a maximum knee flexion of 77.4o in the
control and 75.9o in the clothing and hip flexion of 64.5o in the control and
68.2o in the clothing. Having to put the right knee down to crouch when
coming back under the hurdle (participants were instructed to do so and a
mat was placed on the floor for cushioning), saw similar hip flexion values
66.8 – 72o (although the clothing value was significantly higher than the
________________________________________________________
Range of movement
39
control (p<0.029)), but much higher knee flexion values, 101.5 to 104.1o due
to the fact that participants were actually putting a fully bent knee down on
the floor.
In Figure 3.11, the plot of hip and knee joint angles compared to the control
for the four main movements, the middle two boxes show that when the right
leg bends to duck under the hurdle there is an increase of 4.8o in hip flexion
and a reduction in knee flexion of 1.5o when the clothing is worn compared
to the control, indicating a change in posture. Participants may have felt a
degree of restriction at the knee and to compensate leant further forward
with the upper thigh. However when crouching they were forced to put the
knee down so there was an increase of 2.6o in knee flexion but also still an
increase in hip flexion of 5.2o in the clothing. Differences can also be seen in
the approach to the hurdles, for the first hurdle, hip and knee angles were
reduced compared to the control but the greatest reduction was in the knee
(-7.6o flexion than control) compared to the hip (-5.3o flexion than control).
However when approaching the hurdle at the end, the greater reduction in
flexion is seen in the hip (-7.8o) than in the knee (-4o). So the greatest
constraint to movement is in the knee at the beginning and the hip by the
end of the sequence.
The comments about the clothing recorded during the study are mainly
concerned with the trousers and restrictions to movement in the legs
through for example, a low crotch or tight fit on the inside leg pulling on the
thigh. These comments suggest there was a subjective awareness of the
restrictions imposed by the clothing which was measured as altered joint
angles. In the study by Bensel et al. (1987) questionnaire responses
reflected subjects awareness of the restriction of the full protection MOPP IV
suit compared to the battledress uniform (BDU). Subjects also generally
rated the BDU positively and the MOPP IV negatively on a number of
bipolar dimensions that were selected to describe characteristics of clothing
(Bensel et al. 1987).
________________________________________________________
Range of movement
40
A low crotch may also have been a fit issue and it is likely that this reduced
the hip flexion because it would have been much harder to raise the thigh
because of the extra material. This was backed up by specific comments
about the difficulty of lifting the legs and suggestion that the stepping was
the hardest activity particularly in the Grey fire (B) garment. Other comments
hinting at the restriction in the legs were; pulls on knee, thigh and bum, tight
fit inside leg and resistance on inner thigh.
Although the goniometers focused on the lower limbs, the bulky torso of
some garments, particularly the firefighters clothing impeded movements.
Specific comments included; harder to crouch under hurdle due to bulky
torso, loss of flexibility around trunk, easier to crouch without jacket, these
issues were also observed by O’Hearn et al. (2005) who attributed a
decrease in the extent of standing trunk flexion to the additional bulk of
garments as the number of layers increased. When bending at the waist, the
garments were compressed but occupied space that could not be displaced,
so the ability to bend was therefore impeded because the compressed
garments got in the way.
________________________________________________________
Range of movement
41
5. Chapter summary
A review of the literature included at the beginning of this chapter showed a
widespread awareness of clothing affecting performance, for example,
interfering with joint movements (Teitlebaum and Goldman 1972, Patton et
al. 1995). Some authors reported clothing requiring added movement by the
wearer (Nunneley 1989), others a decreased ROM in the clothing (Adams et
al. 1994, Rintamaki 2005). Whether the required movement is increased or
decreased the constraint is clearly due to the external agent, in this situation
the clothing (Adams and Keyserling 1995). A number of constraint
mechanisms are discussed by Adams and Keyserling (1995) and were
described earlier. The literature also seemed to suggest a greater impact on
tasks requiring whole body mobility (Murphy et al. 2001) although much of
the data on range of movement has been collected on static gross body
movements and the maximum range of motion with and without the clothing
(Huck 1988, Adams and Keyserling 1995).
When the data for all participants was averaged there was no significant
difference when walking in clothing compared to a control condition. For the
stepping work mode there were statistically significant reductions in the
knee ROM in five of the six stages in the clothing compared to the control.
The crawling work mode produced fewer significant results, the knee ROM
was significantly reduced for the first movement, stepping over a hurdle. The
maximum hip angle in the third (crouching under a hurdle) movement and
minimum hip angle in the fourth (stepping over a hurdle) movement were
significantly higher in the clothing. Comments recorded from the participants
also suggest they were aware of the restrictions imposed by the clothing
with the area around the crotch the most problematic due to its influence on
movements of the thigh and hip.
The present study has investigated the effect of protective clothing on range
of movement during walking, stepping and crawling activities, including
measuring hip and knee angles. The hypothesis that the protective clothing
________________________________________________________
Range of movement
42
(PPC) garments would restrict movement and therefore range of motion was
not proven conclusively as although some participants showed a reduced
ROM in the clothing, others demonstrated an increased ROM. The
increased ROM can be best explained by the somewhat exaggerated
movements of some participants to overcome the constraint of the PPC, for
example, lifting the upper leg (increasing the ROM in the hip) higher when
stepping up to accommodate the bulk and restriction to movement around
the crotch.
REFERENCES
Adams, P. H. and Keyserling, W. M. (1993). 'Three methods for measuring range of motion
while wearing protective clothing; a comparative study.' International Journal of Industrial Ergonomics 12: 177-191.
Adams, P. S. and Keyserling, W. M. (1995). 'The effect of size and fabric weight of protective coveralls on range of gross body motions.' American Industrial Hygiene Association Journal 56: 333 -340.
Adams, P. S., Slocum, A. C. and Monroe Keyserling, W. (1994). 'A model for protective clothing effects on performance.' International Journal of Clothing Science and Technology 6(4): 6 - 16.
Adriaens, P. E., Schoffelen, P. F. M. and Westerterp, K. R. (2003). 'Intra-individual variation of basal metabolic rate and the influence of daily habitual physical activity before testing.' British Journal of Nutrition 90: 419-423.
Ainsworth, B. E., Haskell, W. L., Leon, A. S., Jacobs Jr, D. R., Montoye, H. J., Sallis, J. F. and Paffenbarger Jr, R. S. (1993). 'Compendium of Physical Activities: classification of energy costs of human physical activities.' Medicine and Science in Sports and Exercise 25(1): 71 - 80.
Ajayi, J. O. (1992a). 'Effects of fabric structure on frictional properties.' Textile Research Journal 62(2): 87-93.
Ajayi, J. O. (1992b). 'Fabric smoothness, friction and handle.' Textile Research Journal 62(1): 52-59.
Amor, A. F., Vogel, J. A. and Worsley, D. E. (1973). ‘The energy cost of wearing multilayer clothing.’ Army Personnel Research Establishment, Ministry of Defence. (Farnborough, Hants, UK). Report No. 18/73.
Anttonen, H., Rintamaki, H., Risikko, T., Oksa, J., Lehtonen, M., Meinander, H., Nousiainen, P. and Makinen, M. (2000). ‘Friction and function of clothing’ (in Finnish) Report to Scientific Board of National Defence, Oulu Regional Institute of Occupational Health.
Anttonen, H., Oksa, J., Lehtonen, M., Meinander, H. and Makinen, M. (2001). 'Friction of clothing and it's effect on performance'. Nordic Military Clothing Seminar, Helsinki, Finland (20-22 August 2001).
Attwells, R. L., Birrell, S. A., Hooper, R. H. and Mansfield, N. J. (2006). 'Influence of carrying heavy loads on soldiers' posture, movements and gait.' Ergonomics 49(14 / 15): 1527 - 1537.
Auble, T. E., Schwartz, L. and Robertson, R. J. (1987). 'Aerobic requirements for moving handweights through various ranges of motion while walking.' The Physician and Sportsmedicine 15(6): 133-140.
Baker, S. J., Grice, J., Roby, L. and Matthews, C. (2000). 'Cardiorespiratory and thermoregulatory response of working in fire-fighter protective clothing in a temperate environment.' Ergonomics 43(9): 1350 - 1358.
________________________________________________________
Range of movement
43
Barker, R. L. (2002). 'From fabric hand to thermal comfort: the evolving role of objective measurements in explaining human comfort response to textiles.' International Journal of Clothing Science and Technology 14(3/4): 181-200.
Bennett, B. L., Hagan, D. R., Banta, G. and Williams, F. (1995). 'Physiological responses during shipboard fire fighting.' Aviation, Space and Environmental Medicine 65: 225 - 231.
Bensel, C. K., Teixeria, R. A. and Kaplan, D. B. (1987). ‘The Effects of US Army Chemical Protective Clothing on Speech Intelligibility, Visual Field, Body Mobility and Psychomoter Coordination of Men.’ United States Army Natick Research, Development and Engineering Centre, Natick, Massachusetts. Technical Report Natick /TR-87/037.
Bernard, T. E. and Matheen, F. (1999). 'Evaporative resistance and sustainable work under heat stress conditions for two cloth anticontamination ensembles.' International Journal of Industrial Ergonomics 23: 557 - 564.
Bernard, T. E., Luecke, C. L., Schwartz, S. W., Kirkland, K. S. and Ashley, C. D. (2005). 'WBGT clothing adjustments for four clothing ensembles under three relative humidity levels.' Journal of Occupational and Environmental Hygiene 2: 251 -256.
Bilzon, J. L. J., Scarpello, E. G., Smith, C. V., Ravenhill, N. A. and Rayson, M. P. (2001). 'Characterisation of the metabolic demands of simulated shipboard Royal Navy fire-fighting tasks.' Ergonomics 44(8): 766 - 780.
Bishop, P., Gu, D. and Clapp, A. (2000). 'Climate under impermeable protective clothing.' International Journal of Industrial Ergonomics 25: 233 - 238.
Bishop, P., Ray, P. and Reneau, P. (1995). 'A review of the ergonomics of work in the US military chemical protective clothing.' International Journal of Industrial Ergonomics 15: 271 - 283.
Bishop, P. A., Pieroni, R. E., Smith, J. F. and Constable, S. H. (1991). 'Limitations to heavy work at 21oC of personnel wearing the US military chemical defense ensemble.' Aviation, Space and Environmental Medicine 62: 216 - 220.
Bloom, D. and Woodhull-McNeal, A. P. (1987). 'Postural adjustments while standing with two types of loaded backpack.' Ergonomics 30(10): 1425 - 1430.
British Standards (2000). ‘7963: Ergonomics of the thermal environment - Guide to the assessment of heat strain in workers wearing personal protective equipment.’ British Standards Institute.
Budd, G. M. (2001). 'How do wildland fire-fighters cope? Physiological and behavioural temperature regulation in men suppressing Australian summer bushfires with hand tools.' Journal of Thermal Biology 26: 381 - 386.
Budd, G. M., Brotherhood, J. R., Hendrie, A. L., Cheney, N. P. and Dawson, M. P. (1997). 'Stress, strain and productivity in men suppressing wildland fires with hand tools.' International Journal of Wildland Fire 7(2).
Cadarette, B. S., Levine, L., Staab, J. E., Kolka, M. A., Correa, M., Whipple, M. and Sawka, M. N. (2001). 'Heat strain imposed by toxic agent protective systems.' Aviation, Space and Environmental Medicine 72(1): 32 - 37.
Carter, J. and Jeukendrup, A. E. (2002). 'Validity and reliability of three commercially available breath-by-breath respiratory systems.' European Journal of Applied Physiology 86: 435 - 441.
Chattopadhyay, R. and Banerjee, S. (1996). 'The frictional behaviour of ring-, rotor- and friction-spun yarn.' Journal of the Textile Institute 87(Part 1, No. 1): 59-67. Claremont, A. D. and Hall, S. J. (1988). 'Effects of extremity loading upon energy
expenditure and running mechanics.' Medicine and Science in Sports and Exercise 20(2): 167-171.
Consolazio, C. F., Matoush, L. O., Nelson, R. A., Torres, J. B. and Isaac, G. J. (1963). 'Environmental temperature and energy expenditures.' Journal of Applied Physiology 18(1): 65-68.
Crockford, G. W. (1999). 'Protective clothing and heat stress: Introduction.' Annals of Occupational Hygiene 43(5): 287 - 288.
Das, A., Kothari, V. K. and Vandana, N. (2005). 'A study on frictional characteristics of woven fabrics.' AUTEX Research Journal 5(3): 133-140.
Datta, S. R. and Ramanathan, N. L. (1971). 'Ergonomic comparison of seven modes of carrying loads on the horizontal plane.' Ergonomics 14(2): 269-278.
________________________________________________________
Range of movement
44
Davis, P. O., Dotson, C. O. and Laine Santa Maria, D. (1982). 'Relationship between simulated fire fighting tasks and physical performance measures.' Medicine and Science in Sports and Exercise 14(1): 65 - 71.
Dorman, L. E. and Havenith, G. (2005). 'The effects of protective clothing on metabolic rate'. Proceedings of the 11th International Conference of Environmental Ergonomics, Ystad, Sweden. Holmer,I., Kuklane, K. and Gao.C. (eds).
Duggan, A. (1988). 'Energy cost of stepping in protective clothing ensembles.' Ergonomics 31(1): 3 - 11.
Duggan, A. and Haisman, M. F. (1992). 'Prediction of the metabolic cost of walking with and without loads.' Ergonomics 35(4): 417 - 426.
Duncan, H. W., Gardner, G. W. and Barnard, J. B. (1979). 'Physiological responses of men working in fire fighting equipment in the heat.' Ergonomics 22(5): 521 - 527.
Durnin, J. V. G. A. and Passmore, R. (1967). Energy Expenditure in Occupational Activities. Energy, work and leisure. London, Heinemann Educational Books Ltd.: 47 - 82.
El Mogahzy, Y. E. and Gupta, B. S. (1993). 'Friction in fibrous materials. Part II: Experimental study of the effects of structural and morphological factors.' Textile Research Journal 63(4): 219-230.
Faerevik, H. and Reinertsen, R. E. (2003). 'Effects of wearing aircrew protective clothing on physiological and cognitive responses under various ambient conditions.' Ergonomics 46(8): 780 - 799.
Faff, J. and Tutak, T. (1989). 'Physiological responses to working with fire fighting equipment in the heat in relation to subjective fatigue.' Ergonomics 32(6): 629 - 638.
Fine, B. J. (2002). ‘Human performance of military tasks while wearing chemical protective clothing.’ GlobalSecurity.Org.webpage
http://www.globalsecurity.org/wmd/library/report/2002/mopp-human-performance.htm Fiolkowski, P., Horodyski, M., Bishop, M., Williams, M. and Stylianou, L. (2006). 'Changes
in gait kinematics and posture with the use of a front pack.' Ergonomics 49(9): 885 - 894.
Francis, K. and Hoobler, T. (1986). 'Changes in oxygen consumption associated with treadmill walking and running with light hand-carried weights.' Ergonomics 29(8): 999-1004.
Fredrix, E. W. H. M., Soeters, P. B., von Meyerfeldt, M. F. and Saris, W. H. M. (1990). 'Measurement of resting energy expenditure in a clinical setting.' Clinical Nutrition 9: 299-340.
Frim, J., Heslegrave, R., Bossi, L. and Popplow.J. (1992). 'Thermal strain in F-18 pilots
during sustained chemical defence operations'. Proceedings of the Fifth International Conference on Environmental Ergonomics, Maastricht, The Netherlands. Lotens, W.A. and Havenith,G. (eds).
Frisancho, A. R. (1993). Chapter 2. Human Adaptation and Accommodation, University of Michigan Press: 25-52.
Ftaiti, F., Duflot, J. C., Nicol, C. and Grelot, L. (2001). 'Tympanic temperature and heart rate changes in fire-fighters during treadmill runs performed with different fireproof jackets.' Ergonomics 44(5): 502 - 512.
Gavhed, D. C. E. and Holmer, I. (1989). 'Thermoregulatory responses of firemen to exercise in the heat.' European Journal of Applied Physiology 59(115 - 122).
Givoni, B. and Goldman, R. F. (1971). 'Predicting metabolic energy cost.' Journal of Applied Physiology 30(3): 429 - 433.
Goldman, R. F. (1963). 'Tolerance time for work in the heat when wearing CBR protective clothing.' Military Medicine 128(8): 776-786.
Goldman, R. F. (1965). 'Energy cost of soldiers performing combat type activity.' Ergonomics 8: 321 - 327.
Goldman, R. F. (1969). 'Physiological costs of body armor.' Military Medicine 134(3): 204-210.
Goldman, R. F. (1988). ‘Standards for human exposure to heat.’ Environmental Ergonomics: Sustaining Human Performance in Harsh Environments. I. B. Mekjavic, E. W. Banister and J. B. Morrison (eds) London, Taylor and Francis: 99 - 136.
________________________________________________________
Range of movement
45
Goldman, R. F. (1990). 'Heat stress in firefighting ; the relationship between work, clothing and environment.' Fire Engineering: 47 - 52.
Goldman, R. F. and Iampietro, P. F. (1962). 'Energy cost of load carriage.' Journal of Applied Physiology 17(4): 675-676.
Graveling, R. and Hanson, M. (2000). 'Design of UK firefighter clothing.' Nokobetef 6 and 1st European Conference on Protective Clothing: 277 - 280.
Graves, J. E., Pollock, M. L., Montain, S. J., Jackson, A. S. and O'Keefe, J. M. (1987). 'The effect of hand-held weights on the physiological responses to walking exercise.' Medicine and Science in Sports and Exercise 1987(3): 260-265.
Graves, J. E., Martin, A. D., Miltenberger, L. A. and Pollock, M. L. (1988). 'Physiological
responses to walking with hand weights, wrists weights and ankle weights.' Medicine and Science in Sports and Exercise 20(3): 265-271.
Gwosdow, A. R., Stevens, J. C., Berglund, L. G. and Stolwijk, J. A. J. (1986). 'Skin friction and fabric sensations in neutral and warm environments.' Textile Research Journal 56: 574.
Haisman, M. F. (1988). 'Determinants of load carrying ability.' Applied Ergonomics 19(2): 111-121.
Hanson, M. (1999). 'Development of a draft British Standard: the assessment of heat strain for workers wearing personal protective equipment.' Annals of Occupational Hygiene 43(5): 309 - 319.
Hanson, M. and Graveling, R. (1999). 'Development of a draft British Standard: the assessment of heat strain for workers wearing personal protective equipment.' Institute of Occupational Medicine Report Research Report(TM/99/03).
Harrabi, L., Dolez, P. I., Vu-Khanh, T. and Lara, J. (2006). 'Evaluation of the flexibility of protective gloves'. 3rd European Conference on Protective Clothing (ECPC) and NOKOBETEF 8, Gydnia, Poland.
Hausswirth, C., Bigard, A. X. and Le Chevalier, J. M. (1997). 'The Cosmed K4 Telemetry System as an accurate device for oxygen uptake measurements during exercise.' International Journal of Sports Medicine 18: 449 - 453.
Havenith, G. (1999). 'Heat balance when wearing protective clothing.' Annals of Occupational Hygiene 43(5): 289 - 296.
Havenith, G. and Heus, R. (2004). 'A test battery related to ergonomics of protective clothing.' Applied Ergonomics: 3 - 20.
Havenith, G., Heus, R. and Lotens, W. A. (1990). 'Clothing ventilation, vapour resistance and permeability index: changes due to posture, movement and wind.' Ergonomics 33(8): 989 - 1005.
Havenith, G., Holmer, I. and Parsons, K. C. (2002). 'Personal factors in thermal comfort assessment: clothing properties and metabolic heat production.' Energy and Buildings 34: 581 - 591.
Henane, R., Bittel, J., Viret, R. and Morino, S. (1979). 'Thermal strain resulting from protective clothing of an armored vehicle crew in warm conditions.' Aviation, Space and Environmental Medicine 50(6): 599 - 603.
Holewijn, M. (1990). 'Physiological strain due to load carrying.' European Journal of Applied Physiology 61: 237-245.
Holmer, I. and Nilsson, H. (1995). 'Heated manikins as a tool for evaluating clothing.' Annals of Occupational Hygiene 39(6): 809 - 818.
Holmes, G. T., Marsh, P. L., Barnett, R. B. and Scott, R. A. (1988). ’Clothing materials - their required characteristics and their impact on biomedical factors’ (Chapter 4). Handbook on clothing. Biomedical effects of military clothing and equipment systems., NATO AC/243 (Panel 8).
Huck, J. (1988). 'Protective clothing systems; a technique for evaluating restriction of wearer mobility.' Applied Ergonomics 19(3): 185 - 190.
Huck, J. (1991). 'Restriction to movement in fire-fighter protective clothing; evaluation of alternate sleeves and liners.' Applied Ergonomics 22(2): 91-100.
Huck, J., Maganga, O. and Kim, Y. (1997). 'Protective overalls: evaluation of garment design and fit.' International Journal of Clothing Science and Technology 9(1): 45 - 61.
Hughes, A. L. and Goldman, R. F. (1970). 'Energy cost of hard work.' Journal of Applied Physiology 29(5): 570 - 572.
________________________________________________________
Range of movement
46
Ilmarinen, R., Griefahn, B., Makinen, H. and Kunemund, C. (1994). 'Physiological responses to wearing a fire fighters turnout suit with and without a microporous membrane in the heat.' Proceedings of the Sixth Conference on Environmental Ergonomics. Montebello, Canada: Frim,J., Ducharme,M.B. and Tikuisis, P. (eds).
Ilmarinen, R. and Makinen, H. (1992). 'Heat strain in fire-fighting drills.' Proceedings of the Fifth Conference on Environmental Ergonomics Maastricht, The Netherlands: Lotens, W.A. and Havenith, G. (eds).
ISO (1989). 7243: Hot environments - Estimation of the heat stress on working man, based on the WBGT index (wet bulb globe temperature), Geneva: International Standards Organisation.
ISO (2003). 9920: Ergonomics of the thermal environment - Estimation of the thermal insulation and evaporative resistance of a clothing ensemble, Geneva, International Standards Organisation.
ISO (2004). 7933: Hot environments - Analytical determination and interpretation of thermal stress using calculation of required sweat rate, Geneva: International Standards Organisation.
ISO (2004). 8996: Ergonomics - Determination of metabolic heat production, Geneva: International Standards Organisation.
Jones, B. H., Toner, M. M., Daniels, W. L. and Knapik, J. J. (1984). 'The energy cost and heart rate response of trained and untrained subjects walking and running in shoes and boots.' Ergonomics 27(8): 895-902.
Joy, R. J. T. and Goldman, R. F. (1968). 'A method of relating physiology and military performance; A study of some effects of vapor barrier clothing in a hot climate.' Military Medicine 133(6): 458 - 470.
Kawabata, S. (1980). The Standardization and Analysis of Hand Evaluation (2nd edition). The Hand Evaluation and Standardization Committee, The Textile Machinery Society of Japan, Osaka Tiger Printing Co., Ltd. Osaka, Japan.
Kawakami, Y., Nozaki, D., Matsuo, A. and Fukunaga, T. (1992). 'Reliability of measurement of oxygen uptake by a portable telemetric system.' European Journal of Applied Physiology 65: 409 - 414.
Kenins, P. (1994). 'Influence of fiber type and moisture on measured fabric-to-skin friction.' Textile Research Journal 64(12): 722-728.
Kerslake, D. M. (1972). ‘Clothing’ (Chapter 5). The Stress of Hot Environments, Cambridge University Press.
Kinoshita, H. (1985). 'Effects of different loads and carrying systems on selected biomechanical parameters describing walking gait.' Ergonomics 28(9): 1347 - 1362.
Knapik, J. J., Harman, E. and Reynolds, K. (1996). 'Load carriage using packs: A review of physiological, biomechanical and medical aspects.' Applied Ergonomics 27(3): 207-216.
Larsson, P. U., Wadell, K. M. E., Jakobsson, E. J. I., Burlin, L. U. and Henriksson-Larsen, K. B. (2004). 'Validation of the MetaMax II portable metabolic measurement system.' International Journal of Sports Medicine 25: 115-123.
Legg, S. L. and Mahanty, A. (1985). 'Comparison of five modes of carrying a load close to the trunk.' Ergonomics 28(12): 1653-1660.
Legg, S. L. and Mahanty, A. (1986). 'Energy cost of backpacking in heavy boots.' Ergonomics 29(3): 433-438.
Li, Y. (2001). The Science of Clothing Comfort, The Textile Institute. Lima, M., Hes, L., Vasconcelos, R. and Martins, J. (2005). 'Frictorq, Accessing fabric friction
with a novel fabric surface tester.' AUTEX Research Journal 5(4): 194-201. Lotens, W. A. (1982). Clothing design and its relation to military performance. Soesterberg,
The Netherlands, TNO Institute for perception. Report No. IZF 1982-34. Lotens, W. A. (1986). Loss of performance due to military clothing and equipment.
Soesterberg, The Netherlands, TNO Institute for perception. Report No. IZF 1986-13
Lotens, W. A. (1988a). ‘Military performance of clothing’ (Chapter 15). Handbook on clothing. Biomedical effects of military clothing and equipment systems., NATO AC/243 (Panel 8).
Lotens, W. A. (1988b). ‘Optimal design principles for clothing systems’ (Chapter 17). Handbook on clothing. Biomedical effects of military clothing and equipment systems., NATO AC/243 (Panel 8).
________________________________________________________
Range of movement
47
Lotens, W. A. and Havenith, G. (1991). 'Calculation of clothing insulation and vapour resistance.' Ergonomics 34(2): 233 - 254.
Louhevaara, V., Ilmarinen, R., Griefahn, B., Kunemund, C. and Makinen, H. (1995). 'Maximal physical work performance with European standard based fire-protective clothing system and equipment in relation to individual characteristics.' European Journal of Applied Physiology 71: 223 - 229.
MacDougall, J. D., Reddan, W. G., Layton, C. R. and Dempsey, J. A. (1974). 'Effects of metabolic hyperthermia on performance during heavy prolonged exercise.' Journal of Applied Physiology 36(5): 538 - 544.
Macfarlane, D. J. (2001). 'Automated Metabolic Gas Analysis Systems: A Review.' Sports Medicine 31(12): 841 - 861.
Malcolm, S., Armstrong, R., Michaliades, M. and Green, R. (2000). 'A thermal assessment of army wet weather jackets.' International Journal of Industrial Ergonomics 26: 417 - 424.
Marszalek, A., Smolander, J., Soltynski, K. and Sobolewski, A. (1999). 'Physiological strain of wearing aluminized protective clothing at rest in young, middle-aged and older men.' International Journal of Industrial Ergonomics 25: 195 - 202.
Martin, P. E. and Nelson, R. C. (1986). 'The effect of carried loads on the walking patterns of men and women.' Ergonomics 29(10): 1191 - 1202.
Mayer, A. (2006). 'The need of continuous improvement of the EN standards on PPE and of the information given to consumers'. 3rd European Conference on Protective Clothing (ECPC) and NOKOBETEF 8, Gydnia, Poland.
McArdle, W. D., Katch, F. I. and Katch, V. L. (2001). Exercise Physiology; Energy, Nutrition and Human Performance. Baltimore, USA, Lippincott Williams and Wilkins.
McLaughlin, J. E., King, G. A., Howley, E. T., Bassett Jr, D. R. and Ainsworth, B. E. (2001). 'Validation of the COSMED K4 b2 portable metabolic system.' International Journal of Sports Medicine 22: 208 - 284.
McLellan, T. M. (1996). 'Heat strain while wearing the current Canadian or a new hot-weather French NBC protective clothing ensemble.' Aviation, Space and Environmental Medicine 67(11): 1057 - 1062.
McLellan, T. M., Bell, D. G. and Dix, J. K. (1994). 'Heat strain with combat clothing worn over a chemical defence (CD) vapor protective layer.' Aviation, Space and Environmental Medicine 65: 757 - 763.
McLellan, T. M., Jacobs, I. and Bain, J. B. (1993). 'Influence of temperature and metabolic rate on work performance with Canadian forces NBC clothing.' Aviation, Space and Environmental Medicine 64(7): 587 - 594.
McLellan, T. M., Pope, J. I., Cain, J. B. and Cheung, S. S. (1996). 'Effects of metabolic rate and ambient vapour pressure on heat strain in protective clothing.' European Journal of Applied Physiology 74: 518 - 527.
McLellan, T. M. and Selkirk, G. A. (2004). 'Heat stress while wearing long pants or shorts under firefighting protective clothing.' Ergonomics 47(1): 75 - 90.
Meinander, H., Anttonen, H., Bartels, V., Holmer, I., Reinertsen, R. E., Soltynski, K. and Varieras, S. (2004). 'Manikin measurements versus wear trials of cold protective clothing (Subzero project).' European Journal of Applied Physiology 92: 619-621.
Meyer, T., Davison, R. C. R. and Kinderman, W. (2005). 'Ambulatory Gas Exchange Measurements - Current Status and Future Options.' International Journal of Sports Medicine 26: S19 - S27.
Meyer, T., Georg, T., Becker, C. and Kinderman, W. (2001). 'Reliability of gas exchange measurements from two different spiroergometry systems.' International Journal of Sports Medicine 22: 593 - 597.
Millard, C. E. (1994). 'Thermoregulation of armoured fighting vehicle crew in hot climates'. Sixth International Conference on Environmental Ergonomics, Montebello, Canada. Frim,J., Ducharme,M.B. and Tikuisis, P. (eds).
Millard, C. E., Spilsbury, P. M. and Withey, W. R. (1994). 'The effects of heat acclimation on the heat strain of working in protective clothing'. Sixth International Conference on Environmental Ergonomics, Montebello, Canada. Frim,J., Ducharme,M.B. and Tikuisis, P. (eds).
Montain, S. J., Sawka, M. N., Cadarette, B. S., Quigley, M. D. and McKay, J. M. (1994). 'Physiological tolerance to uncompensable heat stress: effects of exercise intensity, protective clothing and climate.' Journal of Applied Physiology 77(1): 216 - 222.
________________________________________________________
Range of movement
48
Murgatroyd, P. R., Shetty, P. S. and Prentice, A. M. (1993). 'Techniques for the measurement of human energy expenditure: a practical guide.' International Journal of Obesity 17: 549 - 568.
Murgatroyd, P. R., Davies, H. L. and Prentice, A. M. (1987). 'Intra-individual variability and measurement noise in estimates of energy expenditure by whole body indirect calorimetry.' British Journal of Nutrition 58: 347-356.
Murphy, M. M., Patton, J., Mello, R., Bidwell, T. and Harp, M. (2001). 'Energy cost of physical task performance in men and women wearing chemical protective clothing.' Aviation, Space and Environmental Medicine 72(1): 25 - 31.
Nunneley, S. A. (1988). ‘Design and evaluation of clothing for protection from heat stress: An overview.’ Environmental Ergonomics: Sustaining Human Performance in Harsh Environments. I. B. Mekjavic, E. W. Banister and J. B. Morrison. (eds) London, Taylor and Francis: 87 - 98.
Nunneley, S. A. (1989). 'Heat stress in protective clothing: Interactions among physical and physiological factors.' Scandinavian Journal of Work and Environmental Health 15(Suppl 1): 52 - 57.
O'Hearn, B. E., Bensel, C. K. and Fronduti, A. P. (2005). ‘Biomechanical analyses of body movement and locomotion as affected by clothing and footwear for cold weather climates.’ US Army Research, Development and Engineering Command, Natick Soldier Centre, Natick, MA, USA.
Report No. Natick/TR-05/013 Ohnaka, T., Tochihara, Y. and Muramatsu, T. (1993). 'Physiological strains in hot-humid
conditions while wearing disposable protective clothing commonly used by the asbestos removal industry.' Ergonomics 36(10): 1241 - 1250.
Oksa, J., Kaikkonen, H., Sorvisto, P., Vaapo, M., Martikkala, V. and Rintamaki, H. (2004). 'Changes in submaximal cardiorespiratory capacity and submaximal strain while exercising in the cold.' Journal of Thermal Biology 29: 815 - 818.
Pandolf, K. B., Givoni, B. and Goldman, R. F. (1977). 'Predicting energy expenditure with loads while standing or walking very slowly.' Journal of Applied Physiology 43(4): 577-581.
Parsons, K. C. (1988). 'Protective clothing: heat exchange and physiological objectives.' Ergonomics 31(7): 991 - 1007.
Parsons, K. C. (1994). ‘Heat transfer through human body and clothing systems.’ Protective clothing systems and materials. M. Raheel. (eds) New York, USA, Marcel Dekker Inc.: 137 - 171.
Parsons, K. C. (1999). 'International Standards for the Assessment of the Risk of Thermal Strain on Clothed Workers in Hot Environments.' Annals of Occupational Hygiene 43(5): 297 - 308.
Parsons, K. C. (2000). 'An adaptive approach to the assessment of risk for workers wearing protective clothing in hot environments'. Nokobetef 6 and 1st European Conference on Protective Clothing, Stockholm, Sweden May 7-10th 2000.
Parsons, K. C. (2003). Human Thermal Environments: The effects of hot, moderate and cold environments on human health, comfort and performance. London, Taylor and Francis.
Patton, J. F., Bidwell, T. E., Murphy, M. M., Mello, R. P. and Harp, M. E. (1995). 'Energy cost of wearing chemical protective clothing during progressive treadmill walking.' Aviation, Space and Environmental Medicine 66: 238 - 242.
Peel, C. and Utsey, C. (1993). 'Oxygen consumption using the K2 telemetry system and a metabolic cart.' Medicine and Science in Sports and Exercise 25(3): 396 - 400.
Peirce, F. T. (1930). 'The handle of cloth as a measurable quantity.' Shirley Institute Memoirs 9(8): 83 - 122.
Pierrynowski, M. R., Winter, D. A. and Norman, R. W. (1981). 'Metabolic measures to ascertain the optimal load to be carried by man.' Ergonomics 24(5): 393-399.
Raheel, M. (1994). ‘Protective clothing; An Overview.’ Protective clothing systems and materials. M. Raheel (eds) New York, USA, Marcel Dekker Inc.: 1 - 23.
Rietjens, G. J. W. M., Kuipers, H., Kester, A. D. M. and Keizer, H. A. (2001). 'Validation of a computerised metabolic measurement system (Oxycon-Pro) during low and high intensity exercise.' International Journal of Sports Medicine 22: 291 - 294.
________________________________________________________
Range of movement
49
Rintamaki, H. (2005). 'Protective clothing and performance in cold environments'. The Third International Conference on Human-Environment System (ICHES) 12 -15 September, Tokyo, Japan.
Rissanen, S. and Rintamaki, H. (1994). 'Thermal responses and physical strain in men wearing protective clothing in the cold'. Sixth International Conference on Environmental Ergonomics, Montebello, Canada. Frim,J., Ducharme,M.B. and Tikuisis, P. (eds).
Rissanen, S. and Rintamaki, H. (1997). 'Thermal responses and physiological strain in men wearing impermeable and semipermeable protective clothing in the cold.' Ergonomics 40(2): 141 - 150.
Roecker, K., Prettin, S. and Sorichter, S. (2005). 'Gas Exchange Measurements with High Temporal Resolution: The Breath-by-Breath Approach.' International Journal of Sports Medicine 26: S11 - S18.
Romet, T. T. and Frim, J. (1987). 'Physiological responses to fire fighting activities.' European Journal of Applied Physiology 56: 633 - 638.
Rossi, R. (2003). 'Fire fighting and its influence on the body.' Ergonomics 46(10): 1017 - 1033.
Schulz, H., Helle, S. and Heck, H. (1997). 'The validity of the Telemetric system CORTEX X1 in the ventilatory and gas exchange measurement during exercise.' International Journal of Sports Medicine 18: 454 - 457.
Shishoo, R. (2002). 'Recent developments in materials for use in protective clothing.' International Journal of Clothing Science and Technology 14(3/4): 201 - 215.
Skoldstrom, B. (1987). 'Physiological responses of fire fighters to workload and thermal stress.' Ergonomics 30(11): 1589 - 1597.
Smith, D. L. and Petruzzello, S. J. (1998). 'Selected physiological and psychological responses to live-fire drills in different configurations of fire fighting gear.' Ergonomics 41(8): 1141 - 1154.
Smith, D. L., Petruzzello, S. J., Kramer, J. M. and Misner, J. E. (1997). 'The effects of different thermal environments on the physiological and psychological responses of fire-fighters to a training drill.' Ergonomics 40(4): 500 - 510.
Soule, R. G. and Goldman, R. F. (1969). 'Energy cost of loads carried on the head, hands or feet.' Journal of Applied Physiology 27(5): 687 - 690.
Spitzer, H., Hettinger, T. and Kaminsky, G. (1982). Tafeln fur den Energieumsatz bei korperlicher Arbeit, Beuth Verlag GmbH, Berlin, Koln.
Stirling, M. (2000). 'Aspects of firefighter protective clothing selection.' Nokobetef 6 and 1st European Conference on Protective Clothing: 269 - 272.
Taylor, H. L. and Orlansky, J. O. (1993). 'The effects of wearing protective chemical warfare combat clothing on human performance.' Aviation, Space and Environmental Medicine(March): A1 - A41.
Taylor, N. A. S., Fogarty, A. and Armstrong, K. (2001). 'Metabolic heat storage in thermal protective clothing; a comparison of fire-fighter personal protective ensembles.' University of Wollongong and New South Wales Fire Brigades.
Teitlebaum, A. and Goldman, R. F. (1972). 'Increased energy cost with multiple clothing layers.' Journal of Applied Physiology 32(6): 743 - 744.
Thorndike, G. H. and Varley, L. (1961). 'Measurement of the coefficient of friction between samples of the same cloth.' Journal of the Textile Institute 52: P255-P266.
White, M. K., Hodous, T. K. and Vercruyssen, M. (1991). 'Effects of thermal environment and chemical protective clothing on work tolerance, physiological responses and subjective ratings.' Ergonomics 34(4): 445 - 457.
White, M. K., Vercruyssen, M. and Houdous, T. K. (1989). 'Work tolerance and subjective responses to wearing protective clothing and respirators during physical work.' Ergonomics 32(9): 1111 - 1123.
Wideman, L., Stoudemire, N. M., Pass, K. A., McGinnes, C. L., Gaesser, G. A. and Weltman, A. (1996). 'Assessment of the Aerosport TEEM 100 portable metabolic measurement system.' Medicine and Science in Sports and Exercise 28(4): 509 - 515.
Williams, N. (1993). 'Working in a hot environment.' Occupational health 1993 (August): 275 - 277.
Wilmore, J. H. and Costill, D. L. (1999). Physiology of Sport and Exercise. Champaign, IL, Human Kinetics.
________________________________________________________
Range of movement
50
Wilson, D. (1963). 'A study of fabric-on-fabric dynamic friction.' Journal of the Textile Institute 54(4): T143-T155.
Winter, D. A. (1984). 'Kinematic and kinetic patterns in human gait; variability and compensating effects.' Human Movement Science 3: 51-76.
Winter, D. A. (1990). Biomechanics and Motor Control of Human Movement, John Wiley and Sons Inc.
Winter, D. A. (1991). The Biomechanics and Motor Control of Human Gait: Normal, Elderly and Pathological, University of Waterloo Press.
Young, A. J., O'Brien, C., Sawka, M. N. and Gonzalez, R. R. (2000). 'Physiological problems associated with wearing NBC protective clothing during cold weather.' Aviation, Space and Environmental Medicine 71(2): 184 - 189.