examining the level and inequality in health insurance
TRANSCRIPT

1Barasa E, et al. BMJ Global Health 2021;6:e004712. doi:10.1136/bmjgh-2020-004712
Examining the level and inequality in health insurance coverage in 36 sub- Saharan African countries
Edwine Barasa ,1,2 Jacob Kazungu,1 Peter Nguhiu,1 Nirmala Ravishankar3
Original research
To cite: Barasa E, Kazungu J, Nguhiu P, et al. Examining the level and inequality in health insurance coverage in 36 sub- Saharan African countries. BMJ Global Health 2021;6:e004712. doi:10.1136/bmjgh-2020-004712
Handling editor Lei Si
Received 10 December 2020Revised 7 April 2021Accepted 8 April 2021
1Health Economics Research Unit, KEMRI- Wellcome Trust Research Programme, Nairobi, Kenya2Center for Tropical Medicine and Global Health, Nuffield Department of Medicine, University of Oxford, Oxford, UK3Stratetic purchasing for PHC, Thinkwell, Washington, District of Columbia, USA
Correspondence toProf Edwine Barasa; EBarasa@ kemri- wellcome. org
© Author(s) (or their employer(s)) 2021. Re- use permitted under CC BY. Published by BMJ.
ABSTRACTIntroduction Low/middle- income countries (LMICs) in sub- Saharan Africa (SSA) are increasingly turning to public contributory health insurance as a mechanism for removing financial barriers to access and extending financial risk protection to the population. Against this backdrop, we assessed the level and inequality of population coverage of existing health insurance schemes in 36 SSA countries.Methods Using secondary data from the most recent Demographic and Health Surveys, we computed mean population coverage for any type of health insurance, and for specific forms of health insurance schemes, by country. We developed concentration curves, computed concentration indices, and rich–poor differences and ratios to examine inequality in health insurance coverage. We decomposed the concentration index using a generalised linear model to examine the contribution of household and individual- level factors to the inequality in health insurance coverage.Results Only four countries had coverage levels with any type of health insurance of above 20% (Rwanda—78.7% (95% CI 77.5% to 79.9%), Ghana—58.2% (95% CI 56.2% to 60.1%), Gabon—40.8% (95% CI 38.2% to 43.5%), and Burundi 22.0% (95% CI 20.7% to 23.2%)). Overall, health insurance coverage was low (7.9% (95% CI 7.8% to 7.9%)) and pro- rich; concentration index=0.4 (95% CI 0.3 to 0.4, p<0.001). Exposure to media made the greatest contribution to the pro- rich distribution of health insurance coverage (50.3%), followed by socioeconomic status (44.3%) and the level of education (41.6%).Conclusion Coverage of health insurance in SSA is low and pro- rich. The four countries that had health insurance coverage levels greater than 20% were all characterised by substantial funding from tax revenues. The other study countries featured predominantly voluntary mechanisms. In a context of high informality of labour markets, SSA and other LMICs should rethink the role of voluntary contributory health insurance and instead embrace tax funding as a sustainable and feasible mechanism for mobilising resources for the health sector.
INTRODUCTIONThe inclusion of Universal Health Coverage (UHC) as a health- related Sustainable Devel-opment Goal has cemented its position as a global health priority. The goal of UHC is to
ensure that everyone has access to high- quality healthcare services that they need, without the risk of financial ruin or impoverishment.1 Low/middle- income countries (LMICs) are increasingly prioritising UHC and reforming their health systems to accelerate progress to achieve this target.2 To attain UHC, countries need to scale up access to needed services,
Key questions
What is already known? ► The literature on health insurance coverage in sub- Saharan Africa (SSA) is mostly focused on individu-al countries and specific forms of health insurance (such as social health insurance or community- based health insurance).
► No study has conducted a multicountry analysis of health insurance coverage with different forms of health insurance in SSA.
► There is also scant literature on inequality in health insurance coverage and certainly no multicountry study that gives a glimpse of inequality in health in-surance in SSA.
What are the new findings? ► The level of health insurance coverage in SSA is low; only 8 of the 36 countries examined had a mean lev-el of insurance coverage with any type of health in-surance of above 10%, while only 4 had a coverage level of above 20%.
► Health insurance coverage in SSA is characterised by substantial income inequalities.
► Exposure to media, socioeconomic rank and the level of education had the greatest contribution to inequality in coverage with any type of health insur-ance in SSA.
What do the new findings imply? ► SSA countries will not achieve Universal Health Coverage using health insurance that is de facto vol-untary as a health financing scheme.
► SSA countries should therefore reconsider voluntary contributory health insurance mechanisms and in-stead reorient their health financing system towards non- contributory tax- funded arrangements.
on Decem
ber 26, 2021 by guest. Protected by copyright.
http://gh.bmj.com
/B
MJ G
lob Health: first published as 10.1136/bm
jgh-2020-004712 on 26 April 2021. D
ownloaded from

2 Barasa E, et al. BMJ Global Health 2021;6:e004712. doi:10.1136/bmjgh-2020-004712
BMJ Global Health
Table 1 Analysis of countries and relevant characteristics
CountryPoverty rate* (%)
Unemployment rate† (%)
Informal employment rate‡ (%)
Characteristics of the country’s publicly owned insurance scheme
Revenue source/contribution mechanism Population eligible for enrolment
Angola 30.1 7.3 42.1 ► No publicly owned insurer
Benin 49.5 1.0 53.4 ► Member contributions ► Taxes on tobacco and alcohol ► Government contributions as an
employer
► Government employees ► Private sector formal workers ► Informal sector workers
Burkina Faso 40.1 3.0 18.0 ► Member contributions ► Formal sector ► Elderly and people with disability
Burundi 64.6 1.6 10.0 ► Member contributions ► General revenue allocation
► Government employees ► Informal sector workers
Cameroon 37.5 4.5 91.0 ► No publicly owned insurer
Chad 38.1 1.1 66.3
Comoros 18.0 20.1 30.0
Congo 46.5 11.4 –
Congo Democratic Republic
63.9 3.6 98.6
Cote d'Ivoire 46.3 9.2 92.8 ► Member contributions ► Government contributions as an
employer
► All population: – Government employees – Private sector formal workers – Informal sector workers – The poor
Eswatini 63.0 25.7 17.7 ► No publicly owned insurer
Ethiopia 29.6 5.4 46.7 ► Member contribution ► Government contributions as an
employer
► Government employees ► Private sector formal employees
Gabon 32.7 18.5 38.0 ► General revenue allocation ► 10% tax on mobile phones ► Compulsory levy called the Special
Solidarity Contribution ► Member contributions
► Government employees ► Private sector formal workers ► Informal sector workers ► The poor
Gambia 24.2 29.8 76.5 ► No publicly owned insurer
Ghana 48.4 5.8 92.1 ► 2.5% VAT ► Member contribution ► Government revenue allocation ► An earmarked portion of social
security taxes from formal sector workers
► Government employees ► Private sector formal workers ► Informal sector workers ► The poor
Guinea 36.1 4.5 77.6 ► No publicly owned insurer
Kenya 36.1 11.0 77.9 ► Member contributions ► Government contributions as an
employer ► Government revenue allocation
► Government employees ► Private sector formal workers ► Informal sector workers ► The poor
Lesotho 57.1 29.2 34.9 ► No publicly owned insurer
Liberia 63.8 4.0 86.7 ► Member contributions ► Employer contributions ► Government contributions as an
employer
► Government employees ► Private sector formal employees
Madagascar 70.7 2.4 12.0 ► No publicly owned insurer
Malawi 50.7 6.7 89.0 ► No publicly owned insurer
Mali 43.6 9.7 42.6 ► Member contribution ► Government revenue allocation ► Government contributions as an
employer
► Government employees ► Private sector formal employees ► The poor
Mozambique 46.1 24.5 95.7 ► General revenue allocation ► Donor funding
► All population: – Government employees – Private sector formal workers – Informal sector workers – The poor
Continued
on Decem
ber 26, 2021 by guest. Protected by copyright.
http://gh.bmj.com
/B
MJ G
lob Health: first published as 10.1136/bm
jgh-2020-004712 on 26 April 2021. D
ownloaded from

Barasa E, et al. BMJ Global Health 2021;6:e004712. doi:10.1136/bmjgh-2020-004712 3
BMJ Global Health
as well as extend financial risk protection to the whole population.
There is a consensus that financing arrangements featuring prepayment—as opposed to patients paying out of pocket for services at the time of use—are pref-erable for ensuring financial risk protection.3 There are several options for organising prepayment in healthcare financing, with the main categories being a tax- financed government scheme (along the lines of a national health service) and health insurance.3 The latter can take the form of social health insurance, private compul-sory health insurance and voluntary health insurance (examples include private voluntary health insurance schemes and voluntary community- based health insur-ance (CBHI)).3 A common characteristic of health insur-ance as a financing scheme is the fact that entitlement to benefits is contributory.3 This means that a contribution
payment made by or on behalf of the covered individual is required as a condition for access to care under the financing scheme.3 The mode of participation in health insurance schemes may be compulsory/mandatory or voluntary.3
Historically, a majority of LMICs opted to set up tax- financed government schemes in the mid- to- late 20th century.4 5 They were attracted to the potential that such a scheme offers for extending comprehensive coverage to the whole population, raising revenue from a broad base of tax and non- tax sources (as opposed to member contributions), and containing costs through vertical integration. In practice, these schemes have suffered from insufficient and unstable funding, which in turn led many LMICs to introduce user fees in the public sector. Health facilities in the public sector have also come to be associated with inefficiency and low quality of care, which
CountryPoverty rate* (%)
Unemployment rate† (%)
Informal employment rate‡ (%)
Characteristics of the country’s publicly owned insurance scheme
Revenue source/contribution mechanism Population eligible for enrolment
Namibia 28.7 22.3 67.0 ► Government contributions as an employer
► Member contributions
► Government employees
Niger 46.0 2.6 95.4 ► Government contributions as an employer
► Member contributions
► Government employees
Nigeria 44.5 5.5 – ► Member contributions ► Employer contributions ► Government contributions as an
employer
► All population: – Government employees – Private sector formal workers – Informal sector workers – The poor
Rwanda 39.1 2.6 73.4 ► Member contribution ► Employer contribution ► General government revenue
allocation ► Donor funding
► All population: – Government employees – Private sector formal workers – Informal sector workers – The poor
Sao Tome and Principe
66.2 13.7 73.0 ► No publicly owned insurer
Senegal 46.7 9.5 93.4 ► Member contribution ► General government revenue
allocation
► Government employees and retirees
Sierra Leone 52.9 2.8 9.0 ► Member contribution ► Employer contribution
► Government employees ► Private sector formal workers
South Africa 18.8 27.6 27.1 ► Government taxes
Tanzania 28.2 2.7 90.8 ► Member contribution ► Employer contribution
► Government employees ► Private sector formal employees ► Informal sector workers
Togo 55.1 6.2 84.0 ► Member contribution ► Government contributions as an
employer ► Employer contribution
► Government employees ► Private sector formal employees
Uganda 19.5 2.3 91.7 ► No publicly owned insurer
Zambia 54.4 7.4 74.4 ► No publicly owned insurer
Zimbabwe 72.3 5.3 85.6 ► Member contribution ► Government contributions as an
employer
► Government employees
*Poverty rate refers to the proportion of the population who lives below the international poverty line, that is, US$1.90 per day. This was obtained from the World Bank (https://data.worldbank.org/indicator/SI.POV.DDAY?end=2017&start=2017&view=bar).†Unemployment rate refers to the proportion of individuals in the labour force who do not have any form of employment. This was obtained from the World Bank (https://data.worldbank.org/indicator/SL.UEM.TOTL.NE.ZS).‡Informality rate refers to the proportion of employed individuals in a country whose employment is in the informal sector of the economy—this was computed from DHS data.DHS, Demographic and Health Surveys; VAT, value- added tax.
Table 1 Continued
on Decem
ber 26, 2021 by guest. Protected by copyright.
http://gh.bmj.com
/B
MJ G
lob Health: first published as 10.1136/bm
jgh-2020-004712 on 26 April 2021. D
ownloaded from

4 Barasa E, et al. BMJ Global Health 2021;6:e004712. doi:10.1136/bmjgh-2020-004712
BMJ Global Health
drives households to seek care from private providers and pay out of pocket for it.
Against this backdrop, LMICs are increasingly turning to health insurance as an alternative way of organising
prepayment healthcare financing.6 While many of these countries had previously set up social health insurance schemes for formal sector employees and witnessed a mushrooming of CBHI schemes in recent decades,7 8
Table 2 Mean level of coverage by type of health insurance in 36 SSA countries
CountrySurvey year Total N
% coverage with any insurance(95% CI)
% coverage with national (public) health insurance(95 % CI)
% coverage with private or employer health insurance(95 % CI)
% coverage with community- based health insurance (CBHI)(95 % CI)
Rwanda 2014 12 699 78.7 (77.5 to 79.9) 5.0 (4.5 to 5.6) 0.7 (0.5 to 1.0) 76.4 (75.2 to 77.6)*
Ghana 2014 13 780 58.2 (56.2 to 60.1) 57.7 (56.9 to 58.5) 0.8 (0.7 to 1.0) 0.1 (0.0 to 0.1)
Gabon 2012 14 043 40.8 (38.20 to 43.5) – – –
Burundi 2017 24 821 22.0 (20.7 to 23.2) – 16.4 (15.9 to 16.9) 5.2 (5.0 to 5.5)
Kenya 2014 27 548 19.9 (18.7 to 21.1) 15.9 (15.5 to 16.3) 4.1 (3.8 to 4.4) 0.3 (0.2 to 0.4)
Namibia 2013 14 492 18.8 (17.1 to 20.6) 5.0 (4.7 to 5.4) 14.0 (13.5 to 14.6) –
South Africa 2016 7811 14.9 (12.9 to 17.1) – – –
Zimbabwe 2015 18 351 11.6 (10.1 to 13.3) 0.3 (0.2 to 0.3) 10.2 (9.7 to 10.6) 1.0 (0.82 to 1.1)
Tanzania 2015 16 778 9.2 (8.2 to 10.2) 1.6 (1.4 to 1.8) 3.1 (2.9 to 3.4) 4.5 (4.1 to 4.8)
Senegal 2010 20 615 6.9 (5.9 to 8.0) 0.6 (0.5 to 0.7) 2.0 (1.8 to 2.2) 1.6 (1.6 to 1.9)
Eswatini 2006 9131 6.2 (5.4 to 7.2) – 2.4 (2.1 to 2.7) –
Ethiopia 2016 28 371 5.9 (4.7 to 7.2) 0.8 (0.7 to 0.9) 0.6 (0.5 to 0.7) 4.5 (4.2 to 4.7)
Angola 2016 20 063 5.8 (5.1 to 6.6) – – –
Togo 2013 13 951 5.8 (4.1 to 6.6) 0.2 (0.1 to 0.3) 1.5 (1.3 to 1.7) 0.4 (0.3 to 0.5)
Mali 2018 15 137 5.6 (4.5 to 6.8) 1.6 (1.2 to 2.2) 1.8 (1.3 to 2.3) 2.6 (2.1 to 3.1)
Liberia 2013 13 340 5.3 (4.1 to 7.0) 1.7 (1.2 to 2.3) 4.6 (4.3 to 5.0) 1.3 (0.8 to 1.9)
Comoros 2012 7485 5.3 (4.4 to 6.4) 0.4 (0.1 to 0.8) 2.6 (2.2 to 2.9) 2.5 (2.0 to 3.0)
Congo Democratic Republic
2013 27 465 5.0 (4.2 to 5.9) 0.04 (0.02 to 0.1) 3.7 (3.5 to 3.9) 1.2 (1.1 to 1.3)
Cote d'Ivoire 2011 15 165 4.6 (3.6 to 5.8) 1.7 (1.1 to 2.3) 2.2 (1.9 to 2.4) 3.6 (3.0 to 4.3)
Madagascar 2008 17 085 3.8 (3.2 to 4.6) 1.2 (0.7 to 1.7) 2.9 (2.6 to 3.1) 1.9 (1.4 to 2.4)
Congo 2011 15 955 3.3 (2.8 to 3.9) 0.3 (0.2 to 0.5) 2.1 (1.9 to 2.3) 1.1 (0.9 to 1.3)
Cameroon 2018 20 505 3.2 (2.8 to 3.7) 0.6 (0.5 to 0.8) 2.1 (1.9 to 2.3) 0.5 (0.4 to 0.8)
Mozambique 2011 17 780 2.7 (2.4 to 3.1) – – –
Gambia 2013 14 030 2.62 (2.2 to 3.2) – 2.5 (2.2 to 2.7) –
Zambia 2018 25 815 2.54 (2.06 to 3.13) 0.03 (0.01 to 0.06) 2.13 (1.95 to 2.31) 0.2 (0.2 to 0.3)
Nigeria 2018 56 155 2.3 (2.0 to 2.7) 0.6 (0.5 to 0.8) 1.9 (1.8 to 2.0) 0.86 (0.7 to 1.1)
Sao Tome and Principe
2008 4898 2.2 (1.7 to 2.7) 0.7 (0.2 to 1.2) 1.1 (0.8 to 1.4) 0.9 (0.4 to 1.5)
Lesotho 2014 9552 2.09 (1.70 to 2.56) – 1.4 (1.2 to 1.7) 0.4 (0.2 to 0.5)
Niger 2012 15 074 2.03 (1.68 to 2.5) 2.1 (1.4 to 2.7) 1.1 (0.9 to 1.2) 2.2 (1.6 to 2.9)
Malawi 2016 32 040 1.8 (1.3 to 2.6) – 1.8 (1.7 to 1.9) –
Guinea 2018 14 991 1.6 (1.21 to 2.2) 0.2 (0.1 to 0.2) 1.3 (1.2 to 1.5) 0.1 (0.1 to 0.2)
Uganda 2016 23 842 1.5 (1.3 to 1.8) 0.0 (0.0 to 0.1) 1.1 (0.9 to 1.2) 0.4 (0.3 to 0.5)
Sierra Leone 2013 23 887 1.5 (1.1 to 1.9) 0.5 (0.3 to 0.7) 0.9 (0.7 to 1.0) 0.6 (0.4 to 0.8)
Chad 2015 11 380 1.2 (0.9 to 1.6) 0.1 (0.0 to 0.2) 0.7 (0.6 to 0.9) 0.4 (0.2 to 0.7)
Benin 2018 23 523 1.2 (0.1 to 1.4) 0.1 (0.1 to 0.2) 0.8 (0.7 to 0.9) 0.2 (0.2 to 0.3)
Burkina Faso 2010 24 382 0.9 (0.7 to 1.1) 0.6 (0.3 to 0.9) 0.4 (0.3 to 0.4) 0.9 (0.5 to 1.0)
Total† 637 752 7.9 (7.8 to 7.9) – – –
– means data are not available.*Rwanda’s CBHI is now managed by the national government rather than local communities and is more suitably classified as a national public health insurance scheme rather than a CBHI.†Pooled data.SSA, sub- Saharan Africa.
on Decem
ber 26, 2021 by guest. Protected by copyright.
http://gh.bmj.com
/B
MJ G
lob Health: first published as 10.1136/bm
jgh-2020-004712 on 26 April 2021. D
ownloaded from
Barasa E, et al. BMJ Global Health 2021;6:e004712. doi:10.1136/bmjgh-2020-004712 5
BMJ Global Health
they are now embracing the idea of large publicly owned health insurance that extends coverage to all. In sub- Saharan Africa (SSA), Ghana, Kenya, Nigeria, Rwanda and Tanzania have established such schemes, while countries such as Ethiopia, Senegal, Swaziland, Lesotho, Zambia, Uganda, Burkina Faso and Zimbabwe are considering it.8 9 Since most SSA countries are character-ised by high levels of informality in the labour market, health insurance mechanisms are predominantly volun-tary (either de facto or de jure).
Given the increasing interest by LMICs in SSA to adopt health insurance, in this paper we examine the perfor-mance of health insurance schemes in these countries. Specifically, we use data from the Demographic and Health Surveys (DHS) from 36 SSA countries to examine the level and equity of health insurance coverage in health insurance enrolment, as well as factors that contribute to observed inequality in coverage. We use this evidence to address ongoing debates about key design features of UHC schemes. Health insurance schemes are often viewed as a way to raise additional resources for the health sector through member contributions. We explore if this
is a reasonable expectation in light of the experience of existing health insurance schemes. Furthermore, the distribution of insurance coverage across wealth quintiles is an important consideration given that equity is one of the central tenets of UHC.10 When UHC cannot be achieved immediately, it is critical that progress is made equitably.11 In this context, we examine how well health insurance schemes in SSA fare in terms of equity.
METHODSWe analysed secondary datasets from the DHS for 36 SSA countries. The decision to include a country in the anal-ysis was informed by (1) the availability of DHS survey dataset that was collected after the year 1999 and (2) availability of data on health insurance coverage in the country’s latest standard DHS dataset as of 6 October 2020. The DHS is a household survey that uses a two- stage cluster sampling design to collect nationally representa-tive data on marriage, fertility, family planning, repro-ductive health and child health every 5 years.12 In some countries, the DHS collects data on whether respondents
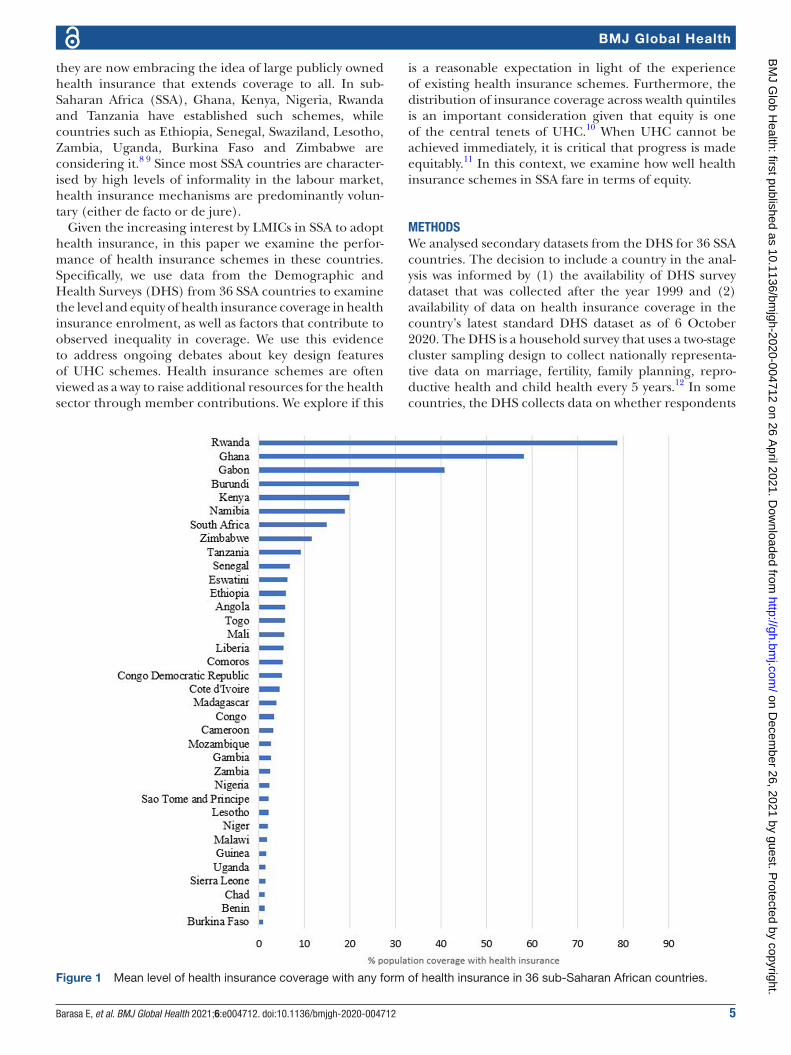
Figure 1 Mean level of health insurance coverage with any form of health insurance in 36 sub- Saharan African countries.
on Decem
ber 26, 2021 by guest. Protected by copyright.
http://gh.bmj.com
/B
MJ G
lob Health: first published as 10.1136/bm
jgh-2020-004712 on 26 April 2021. D
ownloaded from

6 Barasa E, et al. BMJ Global Health 2021;6:e004712. doi:10.1136/bmjgh-2020-004712
BMJ Global Health
Tab
le 3
Le
vel o
f cov
erag
e w
ith a
ny t
ype
of h
ealth
insu
ranc
e ac
ross
sel
ecte
d s
ocio
dem
ogra
phi
c fa
ctor
s in
36
SS
A c
ount
ries
Co
untr
y
Em
plo
ymen
t st
atus
Res
iden
ceE
xpo
sure
to
med
iaLe
vel o
f ed
ucat
ion
So
cio
eco
nom
ic s
tatu
s
Une
mp
loye
dIn
form
alFo
rmal
Rur
alU
rban
No
t at
al
lLe
ss t
han
onc
e a
wee
kA
t le
ast
onc
e a
wee
kN
o
educ
atio
nP
rim
ary
Sec
ond
ary
Hig
her
Po
ore
stP
oo
rer
Mid
dle
Ric
her
Ric
hest
Ang
ola
6.0
4.2
8.4
2.3
7.3
3.6
4.8
7.1
2.9
3.0
7.1
22.1
1.2
3.0
3.4
6.2
12.3
Ben
in1.
10.
72.
20.
62.
00.
20.
52.
10.
20.
92.
010
.30.
10.
40.
40.
73.
8
Bur
kina
Fas
o0.
90.
52.
00.
22.
50.
00.
31.
40.
20.
62.
818
.60.
10.
20.
20.
22.
9
Bur
und
i18
.120
.449
.621
.525
.115
.921
.928
.719
.821
.323
.756
.711
.216
.821
.026
.032
.6
Cam
eroo
n2.
43.
24.
40.
95.
10.
52.
45.
20.
31.
03.
414
.50.
00.
71.
12.
99.
2
Cha
d1.
00.
82.
20.
33.
70.
10.
83.
80.
10.
92.
516
.70.
00.
30.
70.
24.
0
Com
oros
4.3
3.8
12.3
3.5
8.7
1.6
4.0
6.5
1.5
3.9
5.6
17.0
1.3
1.6
4.4
5.8
11.8
Con
go3.
12.
84.
31.
34.
22.
03.
24.
40.
60.
83.
510
.60.
91.
12.
13.
48.
1
Con
go
Dem
ocra
tic
Rep
ublic
6.8
2.1
8.8
1.7
10.4
1.7
3.9
9.0
1.5
1.3
6.3
22.7
0.9
0.7
1.7
4.1
14.9
Cot
e d
'Ivoi
re6.
22.
46.
61.
47.
60.
31.
47.
00.
92.
310
.927
.30.
21.
21.
33.
813
.4
Esw
atin
i3.
05.
817
.12.
915
.17.
64.
55.
53.
42.
65.
926
.51.
30.
92.
34.
217
.4
Eth
iop
ia3.
17.
55.
56.
05.
44.
87.
16.
56.
54.
95.
78.
02.
84.
78.
07.
95.
4
Gab
on40
.936
.246
.855
.238
.939
.239
.442
.914
.442
.739
.158
.756
.334
.632
.335
.649
.6
Gam
bia
1.8
1.8
5.5
0.7
4.0
0.6
1.1
3.2
0.7
1.0
3.8
12.1
0.2
0.8
1.0
2.6
6.7
Gha
na63
.052
.662
.056
.359
.954
.156
.558
.958
.350
.958
.073
.659
.053
.153
.858
.365
.1
Gui
nea
1.5
1.0
3.8
0.4
3.6
0.1
1.1
2.7
0.4
1.0
3.7
9.2
0.1
0.1
0.5
1.2
5.3
Ken
ya9.
618
.152
.813
.928
.03.
09.
022
.62.
610
.822
.755
.93.
28.
013
.923
.439
.5
Leso
tho
7.8
1.4
5.1
0.9
4.2
0.1
0.4
3.0
0.0
0.8
1.6
11.5
0.0
0.4
0.6
1.4
6.0
Lib
eria
5.0
4.4
7.4
4.2
6.1
1.9
3.5
7.7
2.2
4.3
6.1
20.4
0.7
1.3
5.4
7.0
10.1
Mad
agas
car
4.6
2.7
24.5
2.1
12.2
2.5
4.0
7.1
0.3
1.3
7.9
26.0
0.3
0.3
0.7
2.2
12.9
Mal
awi
1.2
0.8
9.7
0.7
7.1
0.2
1.2
3.6
0.4
0.4
2.8
26.1
0.1
0.1
0.4
0.5
6.7
Mal
i5.
22.
311
.32.
913
.21.
82.
17.
71.
53.
113
.345
.51.
70.
90.
74.
217
.7
Moz
amb
ique
2.0
2.1
6.5
1.6
4.6
1.7
2.1
3.3
1.4
1.8
5.3
23.6
0.9
0.9
1.5
2.6
6.6
Nam
ibia
8.8
22.9
33.4
8.4
26.9
2.5
10.0
22.9
4.8
5.0
18.1
61.9
1.6
4.2
10.4
19.8
47.8
Nig
er1.
60.
94.
10.
67.
50.
40.
74.
00.
62.
19.
926
.20.
20.
20.
30.
77.
3
Nig
eria
1.5
1.8
3.4
1.0
4.0
0.3
1.4
3.5
0.2
0.7
2.1
11.9
0.0
0.2
0.9
2.0
7.0
Rw
and
a–
––
––
––
––
––
–63
.575
.082
.487
.888
.9
Sao
Tom
e an
d
Prin
cip
e1.
42.
42.
52.
02.
32.
42.
12.
00.
61.
33.
56.
80.
81.
21.
51.
85.
0
Sen
egal
6.4
4.6
11.4
2.3
11.3
1.5
1.6
8.0
1.6
6.6
16.7
39.9
1.3
2.1
4.6
6.9
16.0
Sie
rra
Leon
e1.
30.
99.
20.
53.
10.
40.
72.
50.
41.
42.
011
.60.
30.
40.
71.
43.
9
Sou
th A
fric
a8.
514
.848
.58.
118
.13.
18.
016
.84.
44.
212
.445
.12.
34.
08.
716
.146
.4
Tanz
ania
9.3
7.2
45.1
8.5
10.4
3.6
7.8
11.1
4.8
6.6
15.6
51.2
4.1
5.6
7.3
10.4
14.8
Con
tinue
d
on Decem
ber 26, 2021 by guest. Protected by copyright.
http://gh.bmj.com
/B
MJ G
lob Health: first published as 10.1136/bm
jgh-2020-004712 on 26 April 2021. D
ownloaded from
Barasa E, et al. BMJ Global Health 2021;6:e004712. doi:10.1136/bmjgh-2020-004712 7
BMJ Global Health
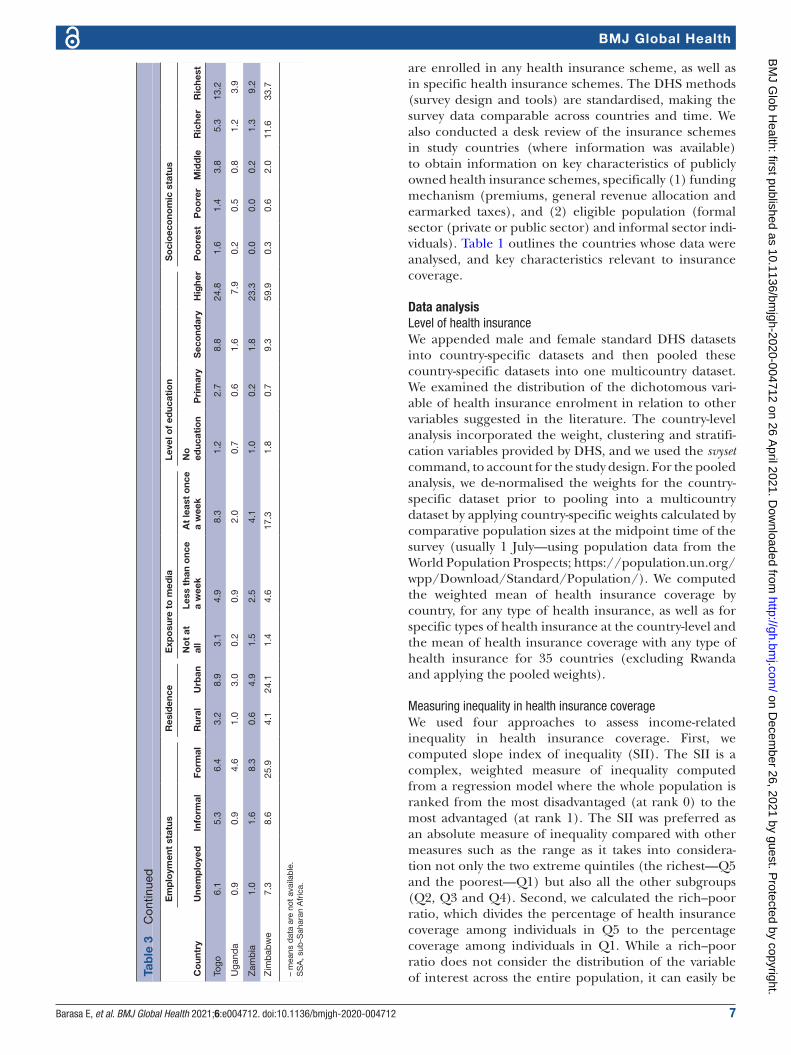
are enrolled in any health insurance scheme, as well as in specific health insurance schemes. The DHS methods (survey design and tools) are standardised, making the survey data comparable across countries and time. We also conducted a desk review of the insurance schemes in study countries (where information was available) to obtain information on key characteristics of publicly owned health insurance schemes, specifically (1) funding mechanism (premiums, general revenue allocation and earmarked taxes), and (2) eligible population (formal sector (private or public sector) and informal sector indi-viduals). Table 1 outlines the countries whose data were analysed, and key characteristics relevant to insurance coverage.
Data analysisLevel of health insuranceWe appended male and female standard DHS datasets into country- specific datasets and then pooled these country- specific datasets into one multicountry dataset. We examined the distribution of the dichotomous vari-able of health insurance enrolment in relation to other variables suggested in the literature. The country- level analysis incorporated the weight, clustering and stratifi-cation variables provided by DHS, and we used the svyset command, to account for the study design. For the pooled analysis, we de- normalised the weights for the country- specific dataset prior to pooling into a multicountry dataset by applying country- specific weights calculated by comparative population sizes at the midpoint time of the survey (usually 1 July—using population data from the World Population Prospects; https:// population. un. org/ wpp/ Download/ Standard/ Population/). We computed the weighted mean of health insurance coverage by country, for any type of health insurance, as well as for specific types of health insurance at the country- level and the mean of health insurance coverage with any type of health insurance for 35 countries (excluding Rwanda and applying the pooled weights).
Measuring inequality in health insurance coverageWe used four approaches to assess income- related inequality in health insurance coverage. First, we computed slope index of inequality (SII). The SII is a complex, weighted measure of inequality computed from a regression model where the whole population is ranked from the most disadvantaged (at rank 0) to the most advantaged (at rank 1). The SII was preferred as an absolute measure of inequality compared with other measures such as the range as it takes into considera-tion not only the two extreme quintiles (the richest—Q5 and the poorest—Q1) but also all the other subgroups (Q2, Q3 and Q4). Second, we calculated the rich–poor ratio, which divides the percentage of health insurance coverage among individuals in Q5 to the percentage coverage among individuals in Q1. While a rich–poor ratio does not consider the distribution of the variable of interest across the entire population, it can easily be C
oun
try
Em
plo
ymen
t st
atus
Res
iden
ceE
xpo
sure
to
med
iaLe
vel o
f ed
ucat
ion
So
cio
eco
nom
ic s
tatu
s
Une
mp
loye
dIn
form
alFo
rmal
Rur
alU
rban
No
t at
al
lLe
ss t
han
onc
e a
wee
kA
t le
ast
onc
e a
wee
kN
o
educ
atio
nP
rim
ary
Sec
ond
ary
Hig
her
Po
ore
stP
oo
rer
Mid
dle
Ric
her
Ric
hest
Togo
6.1
5.3
6.4
3.2
8.9
3.1
4.9
8.3
1.2
2.7
8.8
24.8
1.6
1.4
3.8
5.3
13.2
Uga
nda
0.9
0.9
4.6
1.0
3.0
0.2
0.9
2.0
0.7
0.6
1.6
7.9
0.2
0.5
0.8
1.2
3.9
Zam
bia
1.0
1.6
8.3
0.6
4.9
1.5
2.5
4.1
1.0
0.2
1.8
23.3
0.0
0.0
0.2
1.3
9.2
Zim
bab
we
7.3
8.6
25.9
4.1
24.1
1.4
4.6
17.3
1.8
0.7
9.3
59.9
0.3
0.6
2.0
11.6
33.7
– m
eans
dat
a ar
e no
t av
aila
ble
.S
SA
, sub
- Sah
aran
Afr
ica.
Tab
le 3
C
ontin
ued
on Decem
ber 26, 2021 by guest. Protected by copyright.
http://gh.bmj.com
/B
MJ G
lob Health: first published as 10.1136/bm
jgh-2020-004712 on 26 April 2021. D
ownloaded from

8 Barasa E, et al. BMJ Global Health 2021;6:e004712. doi:10.1136/bmjgh-2020-004712
BMJ Global Health
interpreted by lay readers and policymakers .13 Third, we constructed concentration curves of health insurance coverage. A concentration curve is a plot of the cumula-tive percentage of a variable of interest (health insurance coverage) (y- axis) against the cumulative proportion of the population, ranked by socioeconomic status, from the poorest to the richest (x- axis).14 The concentration curve is a 45° line (line of equality) when every individual, irrespective of their socioeconomic status, receives the same value of the variable of interest.14 A concentration curve that lies above (below) the line of equality indicates that the variable of interest is concentrated among the poor (rich).14 The further the curve is above (below) the line of equality, the higher the pro- poor (pro- rich) inequality.14 Fourth, while the concentration curve signals the presence (or absence) and the direction of inequalities, it does not reveal the magnitude. We, there-fore, computed the concentration index (CIX), defined as twice the area between the concentration curve and the line of equality.14 A CIX of zero denotes equality, while a negative (positive) CIX indicates a pro- poor (pro- rich) distribution of the health variable.14 We used the Wagstaff’s normalised CIX because our variable of interest is a dichotomous variable with a lower bound of 0 and an upper bound of 1.15
Decomposition of inequality in health insurance coverageWagstaff et al have demonstrated that the CIX (C) can be decomposed into contributions of individual factors to income- related inequality in a variable of interest, in which each contribution is the product of the elasticity (βk is the coefficient of X from the regression model and X̄k is the mean of xk) of the variable of interest with respect to that factor, and the degree of income- related inequality in that factor (Ck) and the last term, GCε /μ being the residual contribution for the error term (unmeasurable component) ε, as below.16
C =
∑K
(βK
−XK / µ
)CK + GβCE / µ
The elasticity of a variable is a unit- free measure of association interpreted as the percentage change in the dependent variable (health insurance coverage in this case) associated with a percentage change in the predictor variable.17 To examine the factors contributing to observed inequality in health insurance coverage, we used a country- stratified, survey- weighted generalised linear model (GLM) with a binomial logit link to decom-pose the computed CIX of health insurance coverage. The GLM was preferred due to the binary nature of our outcome variable (whether an individual had or did not have any form of health insurance) and has been widely used to decompose socioeconomic- related inequalities in health.17–19 A positive (negative) contribution indicates that a factor increases pro- rich (pro- poor) inequality of health insurance coverage. To assess whether the contri-butions were statistically significant, we computed 95% CIs from bootstrapped SEs of the absolute contributions.
We identified the factors to include in the regression model from existing literature on factors that are asso-ciated with individual enrolment to health insurance schemes.20–22 Data analyses were performed in STATA V.14, and all estimates were weighted to take into account the complex study design employed in the DHS.
RESULTSFigure 1 shows the mean level of health insurance coverage with any form of health insurance, while table 2 shows the mean level of health insurance coverage by type of health insurance in the 36 countries examined. The level of coverage with any form of health insurance varied across the countries ranging from 0.9% (95% CI: 0.7% to 1.1%) in Burkina Faso to 78.7% (95% CI: 77.5% to 79.9%) in Rwanda. The weighted mean level of coverage for the pooled dataset of 36 countries was 7.9% (95% CI: 7.8% to 7.9%).
Table 3 shows the distribution of coverage with any form of health insurance by selected sociodemographic variables status. Across all countries, health insurance coverage increased with employment status, exposure to media, level of education and socioeconomic status.
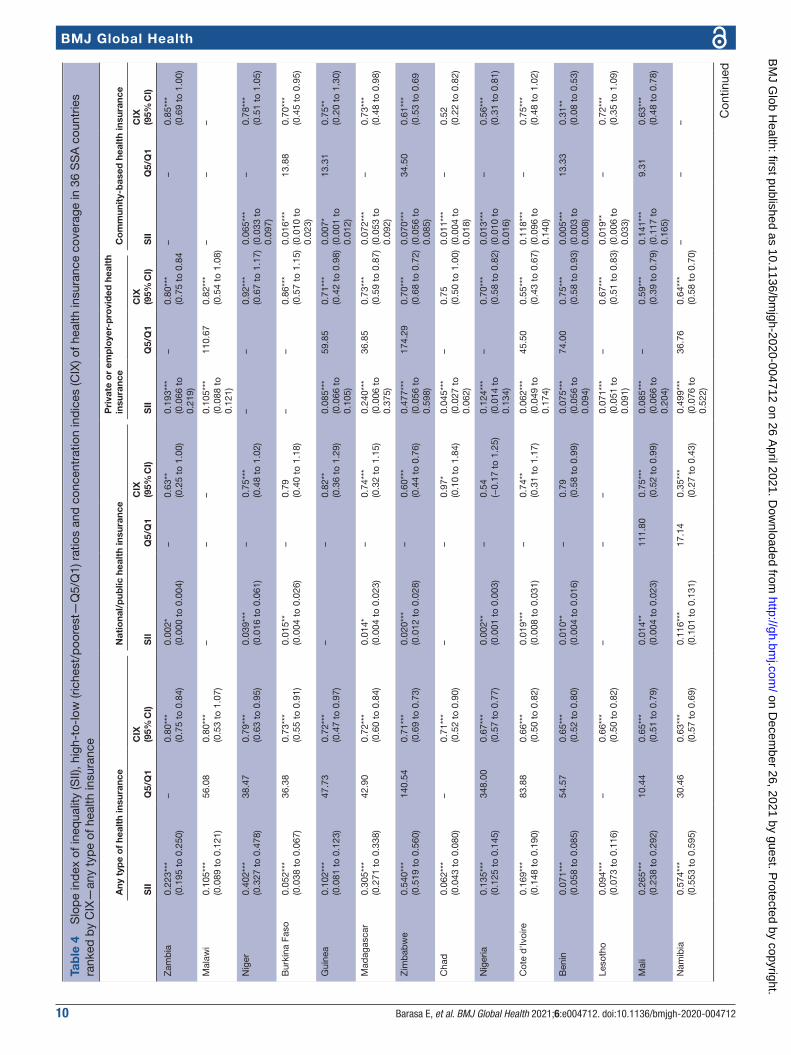
Inequalities in health insurance coverageFigure 2 presents concentration curves for coverage with any form of health insurance for the 36 study countries, while table 4 presents the SII, rich–poor ratios and CIX. Overall, health insurance coverage in the 36 SSA coun-tries was characterised by pro- rich inequality. Health insurance coverage for each type of health insurance was also characterised by pro- rich inequality. There was great variability in the extent of inequality of health insurance coverage across the 36 countries. In absolute terms, Namibia had the largest gap between the richest and the poorest (46.25%); whereas in Gabon, the poorest had a 6.72% higher coverage than the richest. The highest inequalities in coverage with any type of health insurance were observed in Zambia (SII=0.223, CIX=0.80 (95% CI: 0.75 to 0.84; p<0.001) and Malawi (SII=0.11, Q5/Q1=56.08, CIX=0.80 (95% CI 0.53 to 1.07; p<0.001)), while the lowest (or no) inequalities were observed in Gabon (SII=−0.21, Q5/Q1=0.88, CIX=0.00 (95% CI −0.04 to 0.04; p=0.893)). Furthermore, out of the 27 countries that had data on both national/public health insurance and private or employer- provided health insurance, 59% (16) had a lower CIX for the national or public insurance schemes than that of private or employer- provided insur-ance schemes. This indicates that national/public health insurance schemes can potentially reduce inequalities in health insurance coverage.
Decomposition of the CIXTable 5 shows the decomposition analysis results of inequality with any type of health insurance. These find-ings reveal that exposure to media, socioeconomic rank and the level of education had the greatest contribution to inequality in coverage with any type of health insurance.
on Decem
ber 26, 2021 by guest. Protected by copyright.
http://gh.bmj.com
/B
MJ G
lob Health: first published as 10.1136/bm
jgh-2020-004712 on 26 April 2021. D
ownloaded from

Barasa E, et al. BMJ Global Health 2021;6:e004712. doi:10.1136/bmjgh-2020-004712 9
BMJ Global Health
Specifically, exposure to media (58.49%), belonging to the richest quintile (41.19%), having secondary educa-tion (29.40%) and having higher education (17.74%) significantly increased pro- rich inequalities in health insurance coverage. Age (40 years and above), employ-ment status (informal employment), marital status and primary education cumulatively reduced the pro- rich inequalities in health insurance coverage by 15.61%.
DISCUSSIONAs LMICs reform their health systems to achieve UHC, evidence on the performance of alternative health financing mechanisms is critical. This study analysed population coverage with health insurance as a financing scheme in 36 SSA countries. All these countries have other financing schemes that also provide population coverage, and hence the results presented here offer only a partial view of population coverage with health financing systems in these countries. From the results presented in this paper, it is evident that the level of health insurance coverage across SSA countries is very low. Only 8 of the 36 countries examined had a mean level of insurance coverage with any type of health insurance of above 10%, while only 4 had a coverage level of above 20%. This low level of coverage persists regardless of the type of health insurance (public, private and CBHI). The low coverage of health insurance in the study countries is perhaps explained by the fact that these countries are characterised by high levels of informal labour markets and a high incidence of poverty (table 1). International evidence has shown that it is problematic to enrol, retain and collect insurance premiums from individuals in the
informal sector.6 8 While making enrolment mandatory is theoretically an option, it is practically difficult to enforce. Most SSA countries have hence taken a voluntary approach to covering individuals in the informal sector with health insurance; these individuals are expected—and encouraged—to enrol for the scheme and make a contribution.23 24 Even in instances where the schemes are de jure mandatory, such as in Kenya, the inability to enforce makes these schemes de facto voluntary.25 ‘Bottom- up’ CBHI schemes were seen as a way to expand insurance coverage to the informal sector, and have been implemented for this reason in many SSA countries, with considerable external support.8 26 However, they have yielded mixed results in terms of boosting coverage. As a health financing mechanism, therefore, health insurance that is de facto voluntary for the majority of the popu-lation is clearly not effective in achieving population coverage at scale and mobilising sufficient revenues in settings with high poverty and informal labour markets. LMICs outside of Africa that have achieved relatively high levels of health insurance coverage have one character-istic in common; their public health insurance schemes are significantly funded by general revenues rather than premium contributions. For example, Asian countries with high health insurance coverage such as Vietnam, the Philippines and Thailand all have social health insur-ance schemes that are characterised by significant tax funding.21
Our findings also show that health insurance in SSA countries is highly inequitable. This inequality is not only seen in private forms of health insurance but also in publicly owned health insurance schemes; however,
Figure 2 Concentration curves for health insurance coverage, by country, in 36 sub- Saharan African countries (ranked in decreasing inequality).
on Decem
ber 26, 2021 by guest. Protected by copyright.
http://gh.bmj.com
/B
MJ G
lob Health: first published as 10.1136/bm
jgh-2020-004712 on 26 April 2021. D
ownloaded from
10 Barasa E, et al. BMJ Global Health 2021;6:e004712. doi:10.1136/bmjgh-2020-004712
BMJ Global Health
Tab
le 4
S
lop
e in
dex
of i
neq
ualit
y (S
II), h
igh-
to- l
ow (r
iche
st/p
oore
st—
Q5/
Q1)
rat
ios
and
con
cent
ratio
n in
dic
es (C
IX) o
f hea
lth in
sura
nce
cove
rage
in 3
6 S
SA
cou
ntrie
s ra
nked
by
CIX
—an
y ty
pe
of h
ealth
insu
ranc
e
Any
typ
e o
f he
alth
insu
ranc
eN
atio
nal/
pub
lic h
ealt
h in
sura
nce
Pri
vate
or
emp
loye
r- p
rovi
ded
hea
lth
insu
ranc
eC
om
mun
ity-
bas
ed h
ealt
h in
sura
nce
SII
Q5/
Q1
CIX
(95%
CI)
SII
Q5/
Q1
CIX
(95%
CI)
SII
Q5/
Q1
CIX
(95%
CI)
SII
Q5/
Q1
CIX
(95%
CI)
Zam
bia
0.22
3***
(0.1
95 t
o 0.
250)
–0.
80**
*(0
.75
to 0
.84)
0.00
2*(0
.000
to
0.00
4)–
0.63
**(0
.25
to 1
.00)
0.19
3***
(0.0
66 t
o 0.
219)
–0.
80**
*(0
.75
to 0
.84
––
0.85
***
(0.6
9 to
1.0
0)
Mal
awi
0.10
5***
(0.0
89 t
o 0.
121)
56.0
80.
80**
*(0
.53
to 1
.07)
––
–0.
105*
**(0
.088
to
0.12
1)
110.
670.
82**
*(0
.54
to 1
.08)
––
–
Nig
er0.
402*
**(0
.327
to
0.47
8)38
.47
0.79
***
(0.6
3 to
0.9
5)0.
039*
**(0
.016
to
0.06
1)–
0.75
***
(0.4
8 to
1.0
2)–
–0.
92**
*(0
.67
to 1
.17)
0.06
5***
(0.0
33 t
o 0.
097)
–0.
78**
*(0
.51
to 1
.05)
Bur
kina
Fas
o0.
052*
**(0
.038
to
0.06
7)36
.38
0.73
***
(0.5
5 to
0.9
1)0.
015*
*(0
.004
to
0.02
6)–
0.79
(0.4
0 to
1.1
8)–
–0.
86**
*(0
.57
to 1
.15)
0.01
6***
(0.0
10 t
o 0.
023)
13.8
80.
70**
*(0
.45
to 0
.95)
Gui
nea
0.10
2***
(0.0
81 t
o 0.
123)
47.7
30.
72**
*(0
.47
to 0
.97)
––
0.82
**(0
.36
to 1
.29)
0.08
5***
(0.0
66 t
o 0.
105)
59.8
50.
71**
*(0
.42
to 0
.98)
0.00
7*(0
.001
to
0.01
2)
13.3
10.
75**
(0.2
0 to
1.3
0)
Mad
agas
car
0.30
5***
(0.2
71 t
o 0.
338)
42.9
00.
72**
*(0
.60
to 0
.84)
0.01
4*(0
.004
to
0.02
3)–
0.74
***
(0.3
2 to
1.1
5)0.
240*
**(0
.006
to
0.37
5)
36.8
50.
73**
*(0
.59
to 0
.87)
0.07
2***
(0.0
53 t
o 0.
092)
–0.
73**
*(0
.48
to 0
.98)
Zim
bab
we
0.54
0***
(0.5
19 t
o 0.
560)
140.
540.
71**
*(0
.69
to 0
.73)
0.02
0***
(0.0
12 t
o 0.
028)
–0.
60**
*(0
.44
to 0
.76)
0.47
7***
(0.0
56 t
o 0.
598)
174.
290.
70**
*(0
.68
to 0
.72)
0.07
0***
(0.0
56 t
o 0.
085)
34.5
00.
61**
*(0
.53
to 0
.69
Cha
d0.
062*
**(0
.043
to
0.08
0)–
0.71
***
(0.5
2 to
0.9
0)–
–0.
97*
(0.1
0 to
1.8
4)0.
045*
**(0
.027
to
0.06
2)
–0.
75(0
.50
to 1
.00)
0.01
1***
(0.0
04 t
o 0.
018)
–0.
52(0
.22
to 0
.82)
Nig
eria
0.13
5***
(0.1
25 t
o 0.
145)
348.
000.
67**
*(0
.57
to 0
.77)
0.00
2**
(0.0
01 t
o 0.
003)
–0.
54(−
0.17
to
1.25
)0.
124*
**(0
.014
to
0.13
4)
–0.
70**
*(0
.58
to 0
.82)
0.01
3***
(0.0
10 t
o 0.
016)
–0.
56**
*(0
.31
to 0
.81)
Cot
e d
'Ivoi
re0.
169*
**(0
.148
to
0.19
0)83
.88
0.66
***
(0.5
0 to
0.8
2)0.
019*
**(0
.008
to
0.03
1)–
0.74
**(0
.31
to 1
.17)
0.06
2***
(0.0
49 t
o 0.
174)
45.5
00.
55**
*(0
.43
to 0
.67)
0.11
8***
(0.0
96 t
o 0.
140)
–0.
75**
*(0
.48
to 1
.02)
Ben
in0.
071*
**(0
.058
to
0.08
5)54
.57
0.65
***
(0.5
2 to
0.8
0)0.
010*
*(0
.004
to
0.01
6)–
0.79
(0.5
8 to
0.9
9)0.
075*
**(0
.056
to
0.09
4)
74.0
00.
75**
*(0
.58
to 0
.93)
0.00
5***
(0.0
03 t
o 0.
008)
13.3
30.
31**
(0.0
8 to
0.5
3)
Leso
tho
0.09
4***
(0.0
73 t
o 0.
116)
–0.
66**
*(0
.50
to 0
.82)
––
–0.
071*
**(0
.051
to
0.09
1)
–0.
67**
*(0
.51
to 0
.83)
0.01
9**
(0.0
06 t
o 0.
033)
–0.
72**
*(0
.35
to 1
.09)
Mal
i0.
265*
**(0
.238
to
0.29
2)10
.44
0.65
***
(0.5
1 to
0.7
9)0.
014*
*(0
.004
to
0.02
3)11
1.80
0.75
***
(0.5
2 to
0.9
9)0.
085*
**(0
.066
to
0.20
4)
–0.
59**
*(0
.39
to 0
.79)
0.14
1***
(0.1
17 t
o 0.
165)
9.31
0.63
***
(0.4
8 to
0.7
8)
Nam
ibia
0.57
4***
(0.5
53 t
o 0.
595)
30.4
60.
63**
*(0
.57
to 0
.69)
0.11
6***
(0.1
01 t
o 0.
131)
17.1
40.
35**
*(0
.27
to 0
.43)
0.49
9***
(0.0
76 t
o 0.
522)
36.7
60.
64**
*(0
.58
to 0
.70)
––
–
Con
tinue
d
on Decem
ber 26, 2021 by guest. Protected by copyright.
http://gh.bmj.com
/B
MJ G
lob Health: first published as 10.1136/bm
jgh-2020-004712 on 26 April 2021. D
ownloaded from

Barasa E, et al. BMJ Global Health 2021;6:e004712. doi:10.1136/bmjgh-2020-004712 11
BMJ Global Health
Any
typ
e o
f he
alth
insu
ranc
eN
atio
nal/
pub
lic h
ealt
h in
sura
nce
Pri
vate
or
emp
loye
r- p
rovi
ded
hea
lth
insu
ranc
eC
om
mun
ity-
bas
ed h
ealt
h in
sura
nce
SII
Q5/
Q1
CIX
(95%
CI)
SII
Q5/
Q1
CIX
(95%
CI)
SII
Q5/
Q1
CIX
(95%
CI)
SII
Q5/
Q1
CIX
(95%
CI)
Sou
th A
fric
a0.
441*
**(0
.409
to
0.47
3)19
.99
0.63
***
(0.6
0 to
0.6
6)–
––
––
––
––
Cam
eroo
n0.
136*
**(0
.120
to
0.15
2)–
0.63
***
(0.5
4 to
0.7
1)0.
033*
**(0
.024
to
0.04
3)–
0.65
***
(0.4
8 to
0.8
2)0.
089*
**(0
.076
to
0.10
2)
–0.
64**
*(0
.53
to 0
.74)
0.02
4***
(0.0
16 t
o 0.
032)
–0.
60**
*(0
.37
to 0
.83)
Esw
atin
i0.
316*
**(0
.283
to
0.34
9)13
.30
0.63
***
(0.5
9 to
0.6
7)–
––
0.12
7***
(0.0
04 t
o 0.
351)
11.0
40.
50**
*(0
.42
to 0
.58)
––
–
Con
go
Dem
ocra
tic
Rep
ublic
0.19
3***
(0.1
75 t
o 0.
210)
16.3
30.
63**
*(0
.53
to 0
.73)
0.00
2*(0
.000
to
0.00
4)–
0.75
**(0
.20
to 1
.30)
0.19
9***
(0.0
78 t
o 0.
120)
31.2
50.
71**
*(0
.59
to 0
.83)
0.01
9***
(0.0
13 t
o 0.
024)
4.64
0.34
***
(0.1
8 to
0.5
0)
Sie
rra
Leon
e0.
061*
**(0
.050
to
0.07
1)17
.41
0.55
***
(0.4
9 to
0.6
1)0.
016*
**(0
.011
to
0.02
1)–
0.60
***
(0.4
6 to
0.7
4)0.
041*
**(0
.033
to
0.05
0)
24.2
00.
60**
*(0
.52
to 0
.68)
0.00
8***
(0.0
04 t
o 0.
012)
5.36
0.33
***
(0.2
1 to
0.4
5)
Uga
nda
0.05
2***
(0.0
43 t
o 0.
062)
20.2
60.
54**
*(0
.48
to 0
.60)
0.00
3(0
.000
to
0.00
6)–
0.61
***
(0.1
6 to
1.0
6)0.
055*
**(0
.043
to
0.06
8)
30.6
40.
70**
*(0
.62
to 0
.78)
0.00
5***
(0.0
02 t
o 0.
008)
5.43
0.12
*(0
.00
to 0
.24)
Gam
bia
0.10
9***
(0.0
90 t
o 0.
127)
28.9
60.
54**
*(0
.42
to 0
.67)
––
–0.
111*
**(0
.092
to
0.13
0)
45.7
90.
56**
*(0
.44
to 0
.68)
––
–
Sen
egal
0.17
1***
(0.1
56 t
o 0.
187)
12.7
10.
49**
*(0
.45
to 0
.53)
0.01
8***
(0.0
12 t
o 0.
024)
40.2
50.
55**
*(0
.45
to 0
.65)
0.05
3***
(0.0
43 t
o 0.
162)
21.8
30.
55**
*(0
.49
to 0
.61)
0.05
2***
(0.0
43 t
o 0.
061)
12.5
50.
43**
*(0
.37
to 0
.49)
Ken
ya0.
448*
**(0
.433
to
0.46
4)12
.44
0.49
***
(0.4
5 to
0.5
3)0.
362*
**(0
.346
to
0.37
7)12
.34
0.44
***
(0.4
0 to
0.4
8)0.
127*
**(0
.013
to
0.44
0)
24.3
80.
59**
*(0
.49
to 0
.69)
0.00
7***
(0.0
04 t
o 0.
010)
4.09
0.30
**(0
.10
to 0
.50)
Togo
0.15
0***
(0.1
32 t
o 0.
169)
8.24
0.48
***
(0.4
4 to
0.5
2)0.
009*
*(0
.004
to
0.01
5)–
0.69
***
(0.4
5 to
0.9
3)0.
080*
**(0
.059
to
0.10
1)
52.0
00.
72**
*(0
.64
to 0
.80)
(−0.
011*
**(-
0.01
6 to
−
0.00
5)
0.33
−0.
25**
*(−
0.39
to
−0.
11)
Moz
amb
ique
0.09
0***
(0.0
76 t
o 0.
104)
6.99
0.48
***
(0.3
8 to
0.5
8)–
––
––
––
––
Con
go0.
070*
**(0
.057
to
0.08
2)8.
660.
47**
*(0
.35
to 0
.59)
0.00
9**
(0.0
03 t
o 0.
015)
26.6
70.
62**
(0.2
3 to
1.0
1)0.
065*
**(0
.052
to
0.07
8)
49.0
80.
58**
*(0
.44
to 0
.72)
0.01
0**
(0.0
03 t
o 0.
016)
2.17
0.20
*(0
.00
to 0
.40)
Com
oros
0.14
6***
(0.1
23 t
o 0.
170)
8.81
0.45
***
(0.3
3 to
0.5
7)0.
008*
(0.0
02 t
o 0.
015)
–0.
56*
(0.0
1 to
1.1
1)0.
076*
**(0
.058
to
0.19
4)
6.89
0.42
***
(0.2
8 to
0.5
6)0.
057*
**(0
.042
to
0.07
3)
9.33
0.43
***
(0.2
5 to
0.6
1)
Ang
ola
0.10
3***
(0.0
90 t
o 0.
116)
10.1
50.
44**
*(0
.35
to 0
.53)
––
––
––
––
–
Lib
eria
0.17
6***
(0.1
56 t
o 0.
195)
14.6
80.
42**
*(0
.29
to 0
.55)
0.01
0***
(0.0
05 t
o 0.
015)
23.0
00.
39(−
0.00
2 to
0.7
8)0.
164*
**(0
.045
to
0.18
3)
17.4
10.
40**
*(0
.26
to 0
.54)
0.01
0(−
0.00
2 to
0.
023)
–0.
72*
(0.0
7 to
1.3
7)
Tab
le 4
C
ontin
ued
Con
tinue
d
on Decem
ber 26, 2021 by guest. Protected by copyright.
http://gh.bmj.com
/B
MJ G
lob Health: first published as 10.1136/bm
jgh-2020-004712 on 26 April 2021. D
ownloaded from

12 Barasa E, et al. BMJ Global Health 2021;6:e004712. doi:10.1136/bmjgh-2020-004712
BMJ Global Health
Any
typ
e o
f he
alth
insu
ranc
eN
atio
nal/
pub
lic h
ealt
h in
sura
nce
Pri
vate
or
emp
loye
r- p
rovi
ded
hea
lth
insu
ranc
eC
om
mun
ity-
bas
ed h
ealt
h in
sura
nce
SII
Q5/
Q1
CIX
(95%
CI)
SII
Q5/
Q1
CIX
(95%
CI)
SII
Q5/
Q1
CIX
(95%
CI)
SII
Q5/
Q1
CIX
(95%
CI)
Sao
Tom
e an
d
Prin
cip
e0.
046*
**(0
.026
to
0.06
6)6.
510.
39**
*(0
.27
to 0
.51)
0.00
6(−
0.00
2 to
0.0
14)
3.67
0.38
**(0
.09
to 0
.67)
0.03
8***
(0.0
19 t
o 0.
058)
7.10
0.51
***
(0.3
5 to
0.6
7)0.
003
(−0.
005
to
0.01
0)
6.55
0.20
(−0.
02 t
o 0.
42)
Rw
and
a0.
329*
**(0
.304
to
0.35
3)1.
400.
34**
*(0
.03
to 0
.38)
0.36
6***
(0.3
35 t
o 0.
396)
470.
500.
73**
*(0
.65
to 0
.81)
––
0.89
***
(0.6
2 to
1.1
6)0.
237*
**(0
.211
to
0.26
4)
1.29
0.24
***
(0.2
0 to
0.2
8)
Tanz
ania
0.13
0***
(0.1
14 t
o 0.
146)
3.65
0.29
***
(0.2
5 to
0.3
3)0.
016*
**(0
.009
to
0.02
2)4.
020.
17**
*(0
.09
to 0
.25)
0.13
8***
(0.0
19 t
o 0.
157)
52.8
10.
66**
*(0
.60
to 0
.72)
0.01
3**
(0.0
03 t
o 0.
024)
1.25
0.04
*(0
.01
to 0
.08)
Bur
und
i0.
301*
**(0
.283
to
0.31
9)2.
910.
26**
*(0
.22
to 0
.30)
––
–0.
031*
**(0
.016
to
0.04
6)
1.23
0.05
**(−
0.34
to
0.44
)
0.42
1***
(0.3
96 t
o 0.
446)
99.1
60.
74**
*(0
.64
to 0
.84)
Eth
iop
ia0.
045*
**(0
.037
to
0.05
3)1.
930.
10**
(0.0
4 to
0.1
6)0.
004*
*(0
.001
to
0.00
7)1.
850.
11(−
0.03
to
0.25
)0.
088*
**(0
.066
to
0.00
9)
49.7
50.
76**
*(0
.58
to 0
.94)
−0.
004
(0.0
09 t
o 0.
002)
1.09
−0.
003
(−0.
08 t
o 0.
08)
Gha
na0.
075*
**(0
.047
to
0.10
3)1.
100.
07**
(0.0
3 to
0.1
1)0.
061*
**(0
.033
to
0.09
0)1.
080.
06*
(0.0
2 to
0.1
0)0.
050*
**(0
.035
to
0.06
5)
–0.
72**
*(0
.37
to 1
.07)
0.00
1(−
0.00
1 to
0.
003)
–0.
62(−
0.20
to
1.44
)
Gab
on−
0.21
4***
(−0.
243
to −
0.18
5)0.
880.
00(−
0.04
to
0.04
)–
––
––
––
–
Ove
rall
0.11
***
(0.1
1 to
0.1
1)4.
440.
38**
*(0
.35
to 0
.)–
––
––
––
––
***P
<0.
001;
**p
<0.
01; *
p<
0.05
.–
mea
ns d
ata
are
unav
aila
ble
or
zero
val
ue a
mon
g p
oore
st; Q
1 p
oore
st q
uint
ile; Q
5 ric
hest
qui
ntile
.S
SA
, sub
- Sah
aran
Afr
ica.
Tab
le 4
C
ontin
ued
on Decem
ber 26, 2021 by guest. Protected by copyright.
http://gh.bmj.com
/B
MJ G
lob Health: first published as 10.1136/bm
jgh-2020-004712 on 26 April 2021. D
ownloaded from

Barasa E, et al. BMJ Global Health 2021;6:e004712. doi:10.1136/bmjgh-2020-004712 13
BMJ Global Health
Table 5 Contribution of independent factors to the concentration index (CIX) for health insurance coverage in the SSA region
Elasticity Individual CIXContribution to overall CIX
% contribution to overall CIX
Age category 15–24 (reference)
Age category 25–39 0.067 0.017***(0.011 to 0.023)
0.001(0.001 to 0.002)
0.32***(0.21 to 0.43)
Age category 40–64 0.099 −0.050***(−0.057 to −0.043)
0.005(−0.006 to −0.004)
−1.40***(−1.58 to −1.22)
Subtotal age −0.004 −1.08
Not employed (reference)
Informally employed 0.127 −0.241***(−0.253 to −0.229)
−0.031(−0.039 to −0.024)
−8.21***(−9.99 to −6.43)
Formally employed 0.059 0.294***(0.280 to 0.308)
0.020(0.016 to 0.023)
5.33***(4.38 to 6.29)
Subtotal employment status −0.011 −2.88
Gender (1=male) −0.029 0.016***(0.010 to 0.022)
0.000(−0.001 to 0.000)
−0.13***(−0.18 to −0.08)
Residence (1=urban) −0.012 0.778***(0.761 to 0.794)
−0.010(−0.042 to 0.028)
−2.56(−9.67 to 4.54)
Marital status (1=married) 0.073 −0.176***(−0.184 to −0.168)
−0.014(−0.017 to −0.009)
−3.61***(−4.63 to −2.60)
Exposure to media (1=exposed)
0.455 0.452***(0.438 to 0.465)
0.221(0.193 to 0.257)
58.49***(51.43 to 65.54)
Household size >5 (reference)
Household size 4–5 0.062 0.024***(0.014 to 0.033)
0.002(0.001 to 0.003)
0.43***(0.23 to 0.62)
Household size 1–3 0.056 0.080***(0.069 to 0.092)
0.005(0.004 to 0.006)
1.40***(1.10 to 1.71)
Subtotal household size 0.007 1.83
No education (reference)
Primary education 0.047 −0.181***(-0.195 to −0.167)
−0.009(-0.014 to −0.003)
−2.39***(−3.95 to −0.84)
Secondary education 0.264 0.384***(0.371 to 0.396)
0.111(0.098 to 0.125)
29.40***(25.41 to 33.39)
Higher education 0.082 0.665***(0.637 to 0.693)
0.067(0.061 to 0.073)
17.74***(16.03 to 19.45)
Subtotal education 0.169 44.75
Poorest (reference)
Poorer −0.003 −0.574***(−0.591 to −0.556)
0.002(−0.010 to 0.018)
0.48(−3.73 to 4.69)
Middle 0.034 −0.101***(−0.118 to −0.084)
−0.004(−0.006 to −0.001)
−0.97*(−1.61 to −0.33)
Rich 0.074 0.367***(0.349 to 0.384)
0.029(0.015 to 0.040)
7.59***(4.54 to 10.65)
Richest 0.156 0.947***(0.929 to 0.966)
0.156(0.118 to 0.185)
41.19***(33.86 to 48.51)
Subtotal socioeconomic 0.183 48.29
Residual −0.163(−0.205 to −0.126)
−43.09***(−55.62 to −30.56)
Overall CIX 0.38***(0.37 to 0.38)
100%
***P<0.001; **p<0.01; *p<0.05.SSA, sub- Saharan Africa.
on Decem
ber 26, 2021 by guest. Protected by copyright.
http://gh.bmj.com
/B
MJ G
lob Health: first published as 10.1136/bm
jgh-2020-004712 on 26 April 2021. D
ownloaded from

14 Barasa E, et al. BMJ Global Health 2021;6:e004712. doi:10.1136/bmjgh-2020-004712
BMJ Global Health
public health insurance schemes were characterised by lower inequality than private schemes. Decomposition of the CIX reveals that exposure to media was the greatest contributor to the pro- rich inequality in health insurance coverage. Exposure to media is a proxy for individual socioeconomic status given that richer individuals and households have better access to media. Furthermore, the media is often used to pass health insurance informa-tion and mobilise people into joining health insurance schemes. Individual social economic status was the second highest contributor to pro- rich inequality in health insurance coverage. This is consistent with literature that shows that enrolment with health insurance is posi-tively correlated with the ability to pay (socioeconomic status). This highlights the implication of the choice of contribution mechanisms of health financing schemes. Schemes that require individuals to make contributions in order to access benefits select for higher socioeco-nomic individuals and hence promoting inequality. This perhaps explains why the African countries with the least inequality in health insurance coverage (Gabon, Ghana, Rwanda) also happen to be the ones whose public health insurance schemes have significant funding from general tax revenues, rather than individual member premium contributions. The third highest contributor to pro- rich inequality in health insurance coverage was the level of education. This can be explained by the fact that better- educated individuals are more likely to enrol to a health insurance scheme, and also that high levels of educa-tion are concentrated among the rich. These findings highlight the inequality of these factors (education and incomes) in the study countries and the fact that they, in turn, drive inequality in health insurance coverage.
The inequality in health insurance coverage in SSA is also likely driven by the pattern of the introduction of publicly owned health insurance schemes. These schemes have typically been characterised by a phased introduction that begins with government officials, then formal workers, and finally those in the informal sector, and or the poor.8 Where the introduction of interven-tions has started with the well- off in society, it has resulted in entrenching inequalities in coverage.27 Further, when efforts to specifically target the poor with social health insurance are fragmented, contributory schemes have been shown to remain inequitable.28
Policy implicationsFrom the foregoing, it is evident that SSA countries will not achieve UHC using health insurance that is de facto volun-tary as a health financing scheme. This is because of the chal-lenges presented by high levels of poverty and informality of labour markets. The combination of these contextual realities reduces the proportion of the population that has the ability to pay insurance premiums and also reduces the capacity of insurance agencies to enforce mandatory premium contri-butions among those with the ability to pay.8 As a result, these schemes are characterised by lower population coverage, low retention and adverse selection which compromises their
equity, efficiency and financial sustainability.8 SSA countries can learn not only from countries outside SSA but also from the few SSA countries that have rapidly increased health insurance coverage and are characterised by less inequities in health insurance coverage. Three out of the four coun-tries (Rwanda, Ghana and Gabon) that have health insur-ance coverage levels greater than 20% all have one thing in common; they have publicly owned health insurance systems that are significantly tax funded, as opposed to dependence on voluntary contributions (table 1). The CBHI programme in Rwanda is in practice centrally managed by a national government agency, is mandatory for all members of the informal sector and covers over three- quarters of the coun-try’s population. Under the scheme, all poor people receive full government subsidies while some informal sector indi-viduals receive partial subsidies. The scheme is significantly financed by non- contributory mechanisms (donor funding and general taxes).8 29 Ghana’s National Health Insurance scheme is predominantly financed by a combination of government allocation from general tax revenues and an earmarked tax (2.5% of value- added tax and 2.5% of social security contributions).30 Gabon social health insurance scheme has mixed sources of financing, including general and earmarked taxes (10% tax on mobile phone company turnover and a compulsory levy called the Special Solidarity Contribution), and social security contributions (employer–employee contributions).31 32
For countries that have already established publicly owned health insurance schemes, one consideration would be to repurpose them as strategic purchasers of healthcare services rather than revenue mobilisation agencies. Revenue mobilisation could be moved to the country’s tax agencies, accompanied by the reorientation of healthcare financing towards tax funding. Under such an arrangement, revenues for the health sector are collected through taxes (direct and indirect) and transferred to the purchasing agency to purchase services for the whole population. This is similar to the arrangement in Thailand where revenues are collected through tax and allocated to the National Health Securities Office which then purchases healthcare for the poor and the informal sector.33
Countries that have not set up, but are planning to set up, publicly owned health insurance schemes should reconsider this decision. Perhaps a more feasible path for them would be to strengthen their tax funding system by increasing funding allocation to the health sector, strengthen the supply- side capacity of public healthcare facilities and adopt strategic purchasing practices. This includes establishing independent healthcare purchasing authorities that can then enter into contracts with both public and private healthcare facilities for the provision of healthcare services. Ultimately, moving from volun-tary contributions to tax funding will not only resolve the challenge of low coverage but will also contribute to tack-ling the prevalent inequalities characteristics of health insurance schemes in SSA.Twitter Edwine Barasa @edwinebarasa
on Decem
ber 26, 2021 by guest. Protected by copyright.
http://gh.bmj.com
/B
MJ G
lob Health: first published as 10.1136/bm
jgh-2020-004712 on 26 April 2021. D
ownloaded from

Barasa E, et al. BMJ Global Health 2021;6:e004712. doi:10.1136/bmjgh-2020-004712 15
BMJ Global Health
Contributors EB designed the study, analysed the data and wrote the first draft of the manuscript. JK compiled the data, did a literature search, analysed the data and contributed to the writing of subsequent versions of the manuscript. PN analysed the data and contributed to the writing of subsequent versions of the manuscript. NR designed the study, did a literature search and contributed to the writing of subsequent versions of the manuscript.
Funding EB is funded by a Wellcome Trust Research Training Fellowship (#107527). Additional funds from a Wellcome Trust core grant awarded to the KEMRI- Wellcome Trust Research Program (#092654) supported this work.
Competing interests None declared.
Patient and public involvement statement The public and patients were not involved since this is an analysis of publicly available secondary data (Demographic and Health Surveys).
Patient consent for publication Not required.
Ethics approval Ethics approval was not required since this is an analysis of publicly available secondary data (Demographic and Health Surveys).
Provenance and peer review Not commissioned; externally peer reviewed.
Data availability statement Data are available in a public, open access repository.
Open access This is an open access article distributed in accordance with the Creative Commons Attribution 4.0 Unported (CC BY 4.0) license, which permits others to copy, redistribute, remix, transform and build upon this work for any purpose, provided the original work is properly cited, a link to the licence is given, and indication of whether changes were made. See: https:// creativecommons. org/ licenses/ by/ 4. 0/.
ORCID iDEdwine Barasa http:// orcid. org/ 0000- 0001- 5793- 7177
REFERENCES 1 Organization WH. Who | health systems financing: the path to
universal coverage: World Health organization 2012. 2 Sachs JD. Achieving universal health coverage in low- income
settings. Lancet 2012;380:944–7. 3 global forum for health research Geneva. Learning from experience:
health care financing in low- and middle- income countries 2007. 4 Gottret P, Schieber G. Health financing revisited: a practitioner’s
guide: The World Bank 2006. 5 Organization WH. The world health report: 2004: changing history:
World Health organization 2004. 6 Lagomarsino G, Garabrant A, Adyas A, et al. Moving towards
universal health coverage: health insurance reforms in nine developing countries in Africa and Asia. Lancet 2012;380:933–43.
7 Jakab M, Krishnan C. Review of the strengths and weaknesses of community financing. Health financing for poor people: resource mobilization and risk sharing Washington: The World Bank 2004:53–117.
8 McIntyre D, Obse AG, Barasa EW. Challenges in financing universal health coverage in sub- Saharan Africa. Oxford research encyclopedia of economics and finance 2018.
9 Tetteh EK. Responding to the challenges of social health insurance in African countries. Dev South Afr 2012;29:657–80.
10 Chan M. Making fair choices on the path to universal health coverage. Health Syst Reform 2016;2:5–7.
11 Norheim OF. Ethical perspective: five unacceptable trade- offs on the path to universal health coverage. Int J Health Policy Manag 2015;4:711–4.
12 Rutstein SO, Rojas G. Guide to DHS statistics: demographic and health surveys methodology. Calverton: ORC Macro, 2006.
13 Anand S, Diderichsen F, Evans T. Measuring disparities in health: methods and indicators. Challenging inequities in health: from ethics to action 2001:49–67.
14 O'donnell O, Van Doorslaer E, Wagstaff A. Analyzing health equity using household survey data: a guide to techniques and their implementation: the world bank 2007.
15 Wagstaff A, van Doorslaer E, Paci P. On the measurement of horizontal inequity in the delivery of health care. J Health Econ 1991;10:169–205.
16 Wagstaff A, vE D, Watanabe N. On decomposing the causes of health sector inequalities with an application to malnutrition inequalities in Vietnam: the world bank 2001.
17 Hosseinpoor AR, Van Doorslaer E, Speybroeck N, et al. Decomposing socioeconomic inequality in infant mortality in Iran. Int J Epidemiol 2006;35:1211–9.
18 Xu Y, Gao J, Zhou Z, et al. Measurement and explanation of socioeconomic inequality in catastrophic health care expenditure: evidence from the rural areas of Shaanxi Province. BMC Health Serv Res 2015;15:256.
19 Yiengprugsawan V, Lim LL, Carmichael GA, et al. Decomposing socioeconomic inequality for binary health outcomes: an improved estimation that does not vary by choice of reference group. BMC Res Notes 2010;3:57.
20 Adebayo EF, Uthman OA, Wiysonge CS, et al. A systematic review of factors that affect uptake of community- based health insurance in low- income and middle- income countries. BMC Health Serv Res 2015;15:543.
21 Dror DM, Hossain SAS, Majumdar A, et al. What factors affect voluntary uptake of community- based health insurance schemes in low- and middle- income countries? A systematic review and meta- analysis. PLoS One 2016;11:e0160479.
22 van der Wielen N, Falkingham J, Channon AA. Determinants of national health insurance enrolment in Ghana across the life course: are the results consistent between surveys? Int J Equity Health 2018;17:49.
23 Bredenkamp C, Evans T, Lagrada L, et al. Emerging challenges in implementing universal health coverage in Asia. Soc Sci Med 2015;145:243–8.
24 Pettigrew LM, Mathauer I. Voluntary health insurance expenditure in low- and middle- income countries: exploring trends during 1995-2012 and policy implications for progress towards universal health coverage. Int J Equity Health 2016;15:67.
25 Barasa EW, Mwaura N, Rogo K, et al. Extending voluntary health insurance to the informal sector: experiences and expectations of the informal sector in Kenya. Wellcome Open Research 2017;2:94.
26 Wang H, Pielemeier N. Community- Based health insurance: an evolutionary approach to achieving universal coverage in low- income countries. Journal of Life Sciences 2012;6:320–9.
27 Gwatkin DR, Wagstaff A, Yazbeck AS. Reaching the poor with health, nutrition and population services: What works, what doesn't, and why: The World Bank 2005.
28 Fenny AP, Yates R, Thompson R. Social health insurance schemes in Africa leave out the poor: Oxford university press 2018.
29 Chemouni B. The political path to universal health coverage: power, ideas and community- based health insurance in Rwanda. World Dev 2018;106:87–98.
30 Fusheini A. The Politico- Economic challenges of Ghana's National health insurance scheme implementation. Int J Health Policy Manag 2016;5:543–52.
31 Mouelet AM, El Idrissi M, Mouelet AM. Gabon indigents scheme: a social health insurance program for the poor: world bank 2018.
32 Saleh K, Couttolenc FB, Barroy H. Health financing in the Republic of Gabon: the world bank 2014.
33 Limwattananon S, Tangcharoensathien V, Tisayaticom K, et al. Why has the universal coverage scheme in Thailand achieved a pro- poor public subsidy for health care? BMC Public Health 2012;12 Suppl 1:S6.
on Decem
ber 26, 2021 by guest. Protected by copyright.
http://gh.bmj.com
/B
MJ G
lob Health: first published as 10.1136/bm
jgh-2020-004712 on 26 April 2021. D
ownloaded from