examining the relationships between performance appraisal
TRANSCRIPT
University of Texas at TylerScholar Works at UT Tyler
Human Resource Development Theses andDissertations Human Resource Development
Spring 4-25-2017
Examining the Relationships Between PerformanceAppraisal Reactions and Employee EngagementKenneth B. LeVanUniversity of Texas at Tyler
Follow this and additional works at: https://scholarworks.uttyler.edu/hrd_grad
Part of the Business Administration, Management, and Operations Commons, PerformanceManagement Commons, and the Training and Development Commons
This Dissertation is brought to you for free and open access by the HumanResource Development at Scholar Works at UT Tyler. It has been acceptedfor inclusion in Human Resource Development Theses and Dissertationsby an authorized administrator of Scholar Works at UT Tyler. For moreinformation, please contact [email protected].
Recommended CitationLeVan, Kenneth B., "Examining the Relationships Between Performance Appraisal Reactions and Employee Engagement" (2017).Human Resource Development Theses and Dissertations. Paper 18.http://hdl.handle.net/10950/558

EXAMINING THE RELATIONSHIPS BETWEEN PERFORMANCE APPRAISAL
REACTIONS AND EMPLOYEE ENGAGEMENT
by
BEN LeVAN
A dissertation submitted in partial fulfillment of the requirements for the degree of
Doctor of Philosophy Department of Human Resource Development and Technology
Jerry W. Gilley, Ed.D., Committee Chair
College of Business and Technology
The University of Texas at Tyler April 2017

The University of Texas at Tyler Tyler, Texas
This is to certify that the Doctoral Dissertation of
BEN LeVAN
has been approved for the dissertation proposal requirement on April 7, 2017
for the Doctor of Philosophy degree

© Copyright by Ben LeVan 2017 All rights reserved

Acknowledgements
Words cannot adequately express the gratitude in my heart for the countless ways
that so many have labored alongside me in this doctoral journey. I thank, first and
foremost, the Lord above from whom all blessing flow. I also thank my precious wife
Stephanie who shouldered numerous family and household responsibilities, affording me
the needed time to work on my degree. For all your many sacrifices, my love, I am
deeply grateful.
To my children, Julia and Dawson, who do not remember a time when their father
was not working on a degree, I say thank you for your patience and support. Know that
you are deeply treasured and loved. I pray that you may be similarly encouraged as you
persevere through all of life’s many challenges.
To my in-laws, William and Rilla Crothers, I thank you for your faithfulness to
me and our family through this circuitous journey. I am most appreciative to you, mom,
for proofreading an unending stream of drafts without complaint or hesitation and always
doing so in a timely fashion.
To my dissertation chair, Dr. Jerry Gilley, I thank you for the inspiration that
sparked the idea to examine the relationship between the performance appraisal process
and employee engagement. It is my hope that this work advances your efforts to improve
the skills of those in leadership positions. I am especially grateful for your courage and
advocacy when the “going got tough.” Your dedication and fortitude are deeply
appreciated.

To Dr. Jim Wilkerson, I thank you for being there in my time of need even though
your plate was already full. Your insights into the social sciences, statistics, and the
English language have been profound and have made me a better scholar and practitioner.
I am also grateful for your editorial expertise, finding all those serial commas, split
infinitives, and ill-used gerunds. May God grant you a ten-fold return for all your efforts
on my behalf.
To Dr. Ann Gilley, I thank you for your straightforward way of injecting sanity
into the dissertation process and validating so many of my thoughts and concerns. Your
reminder to me that, “we work for you” was especially heartening. Directly and
indirectly you have made such an impact to my personal and professional career.
To Dr. Paul Roberts, thank you for being consistently supportive throughout the
entire process. Right from the beginning, at my first AHRD conference, your
encouraging words and steadying support have been reassuring.
To the UT Tyler faculty, I thank you for your devotion to your discipline and your
dedication to your students. You have modeled the way I now conduct myself in my
university classroom.
To my fellow classmates, I thank you for sharing your insights on the subjects we
studied and for the words of encouragement to continue the journey. It has been a
privilege to travel this path alongside you; I am grateful for our time together.
Finally, I thank the many friends, family, and colleagues who encouraged me
along the way through words of affirmation, by covering classes for me when I needed to
be in Texas, or by offering up countless prayers on my behalf. I am a blessed man.

i
Table of Contents
List of Tables ......................................................................................................... vi
List of Figures ....................................................................................................... vii
Chapter One ............................................................................................................ 1
Background to the Problem .............................................................................. 1
Need for the Study ............................................................................................ 3
Purpose of the Study ......................................................................................... 6
Theoretical/Conceptual Underpinnings of the Study ........................................ 6
Identified Research Gap .................................................................................. 10
Research Questions ......................................................................................... 11
Overview of the Design of the Study .............................................................. 12
Delimitations ................................................................................................... 12
Limitations ...................................................................................................... 12
Definition of Terms ......................................................................................... 14
Summary of the Chapter and Organization of the Dissertation ...................... 17
Chapter Two – Review of Literature .................................................................... 19
Introduction ..................................................................................................... 19
Desired Outcomes of the PA Process ............................................................. 19
Organizational Goal Alignment. ............................................................... 20
Manager-employee Communications. ...................................................... 20
ii
Employee Development. ........................................................................... 21
Effective Personnel Administration. ......................................................... 21
Reactions to the PA Process ........................................................................... 21
PA Reactions and Employee Engagement ..................................................... 24
System Satisfaction. .................................................................................. 24
Session Satisfaction. ................................................................................. 25
Perceived Utility. ...................................................................................... 26
Perceived Accuracy. ................................................................................. 26
Procedural Justice. .................................................................................... 27
Distributive Justice. ................................................................................... 29
PA Reactions. ............................................................................................ 32
Chapter Summary ........................................................................................... 32
Chapter Three – Methodology .............................................................................. 33
Introduction ..................................................................................................... 33
Research Hypotheses ...................................................................................... 33
Design of the Study ......................................................................................... 33
Population ....................................................................................................... 36
Sample ............................................................................................................. 36
Measurement Instruments ............................................................................... 38
PA Reactions. ............................................................................................ 39
System Satisfaction. .................................................................................. 39

iii
Session Satisfaction. ................................................................................. 40
Perceived Utility. ...................................................................................... 40
Perceived Accuracy. ................................................................................. 40
Procedural Justice. .................................................................................... 41
Distributive Justice. ................................................................................... 41
Employee Engagement. ............................................................................ 42
Physical Engagement. ............................................................................... 42
Emotional Engagement. ............................................................................ 43
Cognitive Engagement. ............................................................................. 43
Demographics. .......................................................................................... 43
PA Characteristics. .................................................................................... 44
Survey Design ................................................................................................. 44
Data Collection Procedures ............................................................................. 47
Data Analysis Procedures ............................................................................... 47
Data Screening. ......................................................................................... 48
Demographic Analysis. ............................................................................. 49
Measurement and Structural Model Analysis. .......................................... 49
Summary of the Chapter ................................................................................. 52
Chapter Four – Results .......................................................................................... 53
Introduction ..................................................................................................... 53
Data Screening ................................................................................................ 53

iv
Sample Demographics .................................................................................... 53
Assumption Testing ........................................................................................ 61
Data Reliability ............................................................................................... 61
Measurement Model Analysis ........................................................................ 63
Theoretical Structural Model Analysis ........................................................... 65
Chapter Summary ........................................................................................... 67
Chapter Five – Discussion .................................................................................... 70
Introduction ..................................................................................................... 70
Study Summary ............................................................................................... 70
Implications ..................................................................................................... 71
Ambiguity between PA process components. .......................................... 72
PA ratings affect employee engagement. .................................................. 74
Frequent feedback will result in higher employee engagement. ............... 76
Alternatives to the PA process. ................................................................. 77
Limitations ...................................................................................................... 78
Future Research .............................................................................................. 79
Chapter Summary ........................................................................................... 81
References ............................................................................................................. 83
Appendix A: Participant Survey ........................................................................... 96
Appendix B: Survey Invitation ........................................................................... 109
Appendix C: Instruments .................................................................................... 110

v
Appendix D: Permissions ................................................................................... 118

vi
List of Tables
Table 1. Organizational Uses for the Performance Appraisal Process ............................... 3
Table 2. Articles That Have Examined the Relationship Between Variables in Keeping
and Levy’s (2000) Appraisal Reactions Construct and Employee Engagement ...... 11
Table 3. Sampling of Concerned Reactions to the PA Process ........................................ 23
Table 4. Categorized Areas of Concern with the Performance Appraisal Process ........... 24
Table 5. CFA Indices and Their Recommended Values ................................................... 51
Table 6. Frequencies of Demographic Variables .............................................................. 55
Table 7. PA Process Statistics ........................................................................................... 58
Table 8. PA Reaction/Engagement Means for PA Characteristics ................................... 59
Table 9. Descriptive Statistics and Variable Correlations ................................................ 62
Table 10. Cronbach’s Alpha Values for Latent Constructs .............................................. 62
Table 11. CFA Measurement Model Fit Indices .............................................................. 63
Table 12. Factor Loadings for Latent Constructs ............................................................. 64
Table 13. Construct Validity Measurements .................................................................... 65
Table 14. Theoretical Model and Alternative Model Fit Indices ...................................... 65
Table 15. PA Reactions Exploratory Factor Analysis ...................................................... 73

vii
List of Figures
Figure 1. Theorized Relationship Between PA Reactions and Employee Engagement. . 34
Figure 2. Theorized Relationship Between the Components of PA Reactions and
Employee Engagement. ............................................................................................ 34
Figure 3. Hierarchical Model of Appraisal Satisfaction (Keeping & Levy, 2000, p. 715).
Used with Permission. .............................................................................................. 38
Figure 4. Example of a Table Matrix Survey Question. .................................................. 45
Figure 5. Measurement Model for the Study. .................................................................. 50
Figure 6. Structural Relationships of the Theorized Model ............................................. 66
Figure 7. Performance Coaching Process Model (Gilley & Boughton, 1996, p. 31). Used
with Permission from McGraw-Hill Publishing. ...................................................... 78
viii
Abstract
EXAMINING THE RELATIONSHIPS BETWEEN PERFORMANCE APPRAISAL
REACTIONS AND EMPLOYEE ENGAGEMENT
Ben LeVan
Dissertation Chair: Jerry W. Gilley, Ed.D.
The University of Texas at Tyler
April 2017
This study examines the long-standing debate among scholars and practitioners
regarding the effectiveness of the performance appraisal (PA) process as a useful tool to
manage individual and organizational performance (Glover, 1996; Gruman & Saks, 2011;
Kondrasuk, 2012; Light, 2010; Pulakos & O’Leary, 2011; Thomas & Bretz, 1994). To
further this discussion, the relationship between employees’ reactions to the PA process
and perceptions of engagement in the workplace is examined.
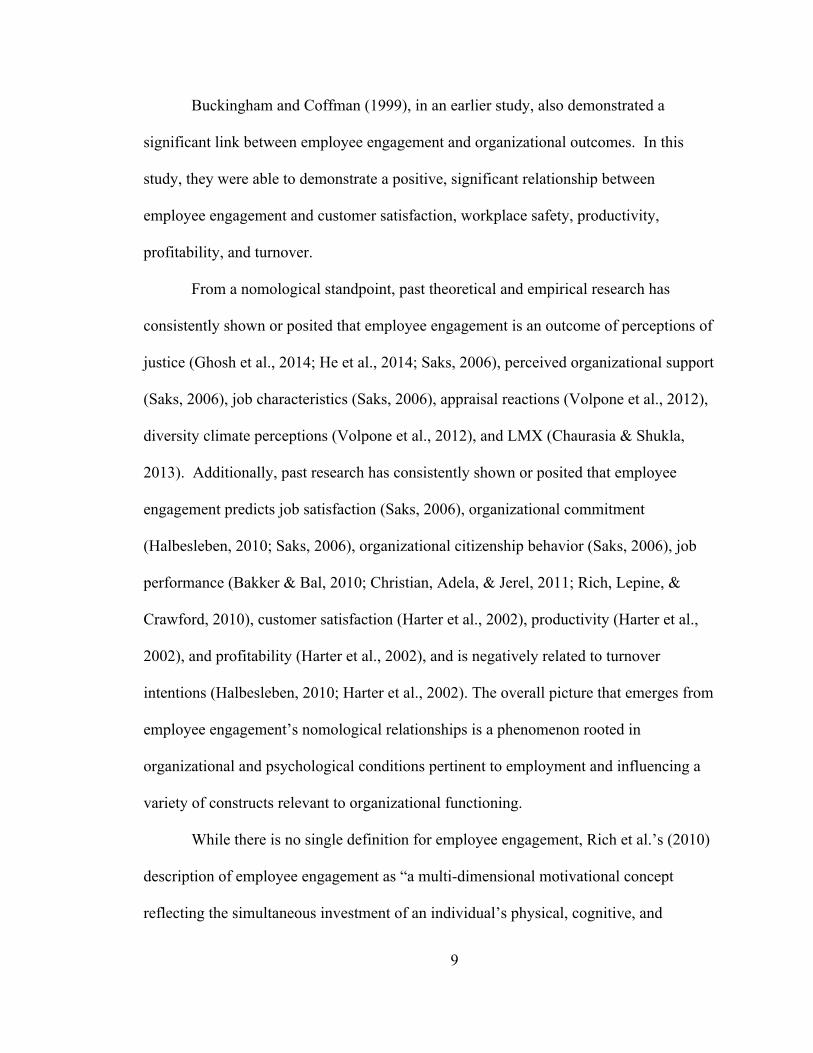
A survey of 466 respondents finds there to be a significant positive relationship
between PA reactions and employee engagement. Other significant findings of the study
include: 1) high correlations among Keeping and Levy’s (2000) PA reaction first-order
factors, 2) a significant correlation between PA ratings and employee engagement, and 3)
a significant correlation between PA frequency and employee engagement. The
implications of these findings suggest that an organization’s ability to create, implement,
and manage its PA process will affect employee engagement and, ultimately,

ix
organizational productivity. Given employees’ tendencies to view the PA process en
masse and the complexities of the PA process, it is suggested that a forward-looking
developmental process, similar to Gilley and Boughton’s (1996) model, be substituted for
the traditional, backward-looking PA process. Finally, limitations of the study are
discussed along with ideas for future research.

1
Chapter One
Introduction
Background to the Problem
For decades, scholars and practitioners alike have debated the effectiveness of the
performance appraisal (PA) process as a useful tool to manage individual and
organizational performance (Glover, 1996; Gruman & Saks, 2011; Kondrasuk, 2012;
Light, 2010; Pulakos & O’Leary, 2011; Thomas & Bretz, 1994). To further this
discussion, a study was done to examine the relationship between employees’ reactions to
the PA process, using the Keeping and Levy (2000) PA reactions construct, and their
perceptions of their engagement in the workplace. A significant positive relationship
between these variables would suggest validity to the widespread claims suggesting a
relationship between reactions to the PA process and employee organizational attitudes
and performance (Bouskila-Yam & Kluger, 2011; Budworth & Mann, 2011; DeNisi &
Pritchard, 2006; Gruman & Saks, 2011; Kondrasuk, 2012; Kruse, 2012; Spence &
Keeping, 2010).
The practice of evaluating another’s performance can be traced as far back as the
third century to the Wei Dynasty in China. Interestingly enough, the evidence of the
practice comes in the form of a grievance: “The Imperial Rater of Nine Grades seldom
rates men according to their merits, but always according to his likes and dislikes”
(Banner & Cooke, 1984, p. 328). The modern-day PA process has its roots in the
Industrial Revolution. Managers, needing to supervise large staffs, created the
performance appraisal as the proverbial stick to motivate poor performers (Kondrasuk,

2
2012). Today, this same process is often a key component of an organization’s overall
performance management strategy (Seiden & Sowa, 2011).
The PA process is defined as “the process of determining how well employees do
their jobs relative to a standard and communicating that information to them” (Mathis &
Jackson, 2011, p. 320). Najafi, Hamidi, Ghiasi, Shahhoseini, and Emami (2011)
described the PA process as one of “obtaining, analyzing and recording information
about the relative worth of an employee. The focus of the performance appraisal is
measuring and improving the actual performance of the employee and also the future
potential of the employee” (p. 1761). The PA process is commonly comprised of seven
steps: 1) setting employee objectives and performance expectations, 2) observing
performance and providing feedback, 3) collecting and compiling multisource feedback,
4) completing the formal performance appraisal documentation and assigning the
employee a performance rating, 5) discussing the formal performance appraisal with the
employee, 6) building an individual development plan, and 7) using the performance
appraisal data for administrative purposes (compensation plans, promotion/succession
plans, and legal documentation) (Buckingham & Vosburgh, 2001; Grote, 2002; Mathis &
Jackson, 2011). Thomas and Bretz (1994) identified sixteen important uses for the PA
(see Table 1).
There is, however, a growing concern about the effectiveness of this mainstay
process of global enterprise. An increasing amount of research suggests that the PA
process does not improve organizational performance and may even be counterproductive
(Bouskila-Yam & Kluger, 2011; Budworth & Mann, 2011; DeNisi & Pritchard, 2006;
Gruman & Saks, 2011; Kondrasuk, 2012; Kruse, 2012; Spence & Keeping, 2010).

3
Despite these concerns, the PA process remains the common tool used to manage
employee performance (Society for Human Resource Management, 2011). This may be
Table 1. Organizational Uses for the Performance Appraisal Process
Important Uses for Performance Appraisal in Ranked Order 1. Improving work performance 2. Administering merit pay 3. Advising employees of work expectations 4. Counseling employees 5. Making promotion decisions 6. Motivating employees 7. Assessing employees 8. Identifying training needs 9. Better working relationships 10. Helping employees set career goals 11. Assigning work more efficiently 12. Making transfer decisions 13. Making decisions about layoffs and terminations 14. Assisting in long-range planning 15. Validating hiring procedures 16. Justifying other managerial actions (Thomas & Bretz, 1994, p. 30) Used with permission.
due, in part, to the limited empirical evidence in literature detailing the impact that PAs
have on employees’ attitudes and actions in the workplace.
Need for the Study
This study is compelling given the widespread usage of PAs, the centrality of the
PA process to talent management, PA’s significance to individual employees, its
significance to the field of human resource development (HRD), and the lack of
quantitative data describing the relationship between appraisal reactions and employee
engagement. Furthermore, the study answers calls for additional research to identify
precursors to employee engagement other than those reported in extant research
(Karatepe, 2013; Saks, 2006; Saks & Gruman, 2014). It also answers the call from

4
Volpone, Avery, and McKay (2012) to explore further the relationship between PA
perceptions and engagement and the call from Keeping and Levy (2000) to explore
further the PA reactions construct.
Understanding individual reactions to the PA process is significant given the
widespread usage of the process. Per a 2011 Society for Human Resource Management
(SHRM) poll, 98% of organizations with 100 or more people in the United States have a
formal PA process for their employees. Per the 2011 statistics from the U.S. Census
Bureau (census.gov), there were over 74 million individuals working for firms with 100
or more employees, which suggests that the PA process impacts up to 72.5 million
workers.
Studying the PA process is also considered compelling given its significance to
talent management within many organizations. The PA is typically “the centerpiece of a
performance management system” used to align individual and organizational goals,
motivate employees, and administer compensation (Seiden & Sowa, 2011, p. 252). Yet,
per SHRM, this system is increasingly undergoing serious scrutiny with many Fortune
500 companies abandoning the process, believing it to be ineffective (Meinert, 2015;
Wilkie, 2015). Given the criticality of the PA process to performance management,
investigation of the process becomes powerfully compelling, especially if it can be shown
to have a significant positive relationship with employee engagement. Bates (2004)
estimated that many organizations are running at 30 percent efficiency due to a lack of
employee engagement, costing U.S. businesses an estimated $300 billion every year
(Gruman & Saks, 2011).

5
Also compelling is the significance of the PA process to individual employees.
Given this process often determines one’s salary, bonuses, promotion potential, and
ongoing employment, the process is highly significant to the individuals comprising the
global workforce and is often the subject of heated debate (Kruse, 2012; Seiden & Sowa,
2011).
Finally, the research is significant to the field of human resource development
(HRD) as it will provide empirical data exploring the relationship between employees’
reactions to the PA process and their perceptions of their engagement in the workplace.
Currently, there is a lack of quantitative empirical evidence in literature examining this
relationship. While numerous articles point to the shortcomings of the PA process and its
purported impact on employee engagement, these are largely qualitative and anecdotal in
nature (Glover, 1996; Gruman & Saks, 2011; Kondrasuk, 2012; Light, 2010; Pulakos &
O’Leary, 2011; Thomas & Bretz, 1994). At the time of writing, there was only one
known article that had quantitatively tested the relationship between PA reactions and
employee engagement, and no research was known to test this relationship using Keeping
and Levy’s (2000) construct or Rich et al.’s (2010) instrument for employee engagement,
which is aligned to Kahn’s (1990) conceptualization of the employee engagement
construct. The one known article by Volpone et al. (2012) concluded that PA reactions
were significantly correlated with employee engagement, and this relationship was
partially mediated by diversity climate perceptions among employees working in the
retail industry.

6
Purpose of the Study
The purpose of the study is to examine the relationships between employees’
reactions to their organization’s PA process and their level of engagement in the
workplace. While numerous scholars and practitioners have noted issues with the PA
process and have recommended alternatives to the process, there is limited quantitative
empirical data to support the need for change. This study endeavors to provide such data.
Understanding this relationship may provide valuable insights to aid practitioners in
developing effective talent management practices.
Theoretical/Conceptual Underpinnings of the Study
The theoretical link between the PA process and employee engagement is rooted
in the concept of organizational justice, which predicts how employees will respond to
perceptions of fairness within their environment (Ghosh, Rai, & Sinha 2014; He, Zhu, &
Zheng, 2014; Saks, 2006). In short, if employees believe their evaluation process to be
fair and just, they are more likely to be engaged in their work environments. Conversely,
if they perceive injustices in their appraisal process, they are likely to respond
unfavorably. Erdogan (2002) theorized that employee organizational justice perceptions
of their firm’s PA process are related to organizational commitment, prosocial behavior,
increased LMX, task performance, and motivation to improve. Similarly, Volpone et al.
(2012) postulated a positive relationship between employees’ reactions to their
performance appraisal process and employee engagement beyond individuals working in
the retail industry, of whom they demonstrated a positive relationship to be present.
Nomologically, past theoretical and empirical research has consistently shown or
posited that reactions to the PA process are outcomes of ratees’ perceptions of justice,

7
LMX, perceptions of utility, perceived organizational support, and their performance
rating (Dusterhoff, Cunningham, & MacGregor, 2014; Elicker, Levy, & Hall, 2006;
Erdogan, 2002). Additionally, past research has consistently shown or posited that
reactions to the PA process predict emotional exhaustion (Brown & Benson, 2003),
employee engagement (Volpone et al., 2012), perceptions of organizational justice
(Budworth & Mann, 2011; Kondrasuk, 2012; Thurston & McNall, 2010; Youngcourt,
Leiva, & Jones, 2007), manager-employee relationships (Levy & Williams, 2004;
Pulakos & O’Leary, 2011; Sparr & Sonnentag, 2008; Stalinski & Downey, 2012), and
organizational productivity (Youngcourt et al., 2007). The overall picture that emerges
from the nomological relationships of the PA reactions construct is a phenomenon rooted
in organizational and psychological effects pertinent to employment and that influences a
variety of factors relevant to employment and organizational functioning.
Employee engagement, for its part, has its roots in Kahn’s (1990) seminal article
on the topic. Shuck (2011), in an integrative literature review, found that “four major
approaches defined the existing state of employee engagement: (a) Kahn’s (1990) need-
satisfying approach, (b) Maslach, Schaufeli, and Leiter’s (2001) burnout-antithesis
approach, (c) Harter, Schmidt, and Hayes’s (2002) satisfaction-engagement approach,
and (d) Saks’s (2006) multidimensional approach” (p. 307).
Kahn (1990) defined engagement to be “the simultaneous employment and
expression of a person’s ‘preferred self’ in task behaviors that promote connections to
work and to others, personal presence (physical, cognitive, and emotional), and active,
full role performances” (p. 700). He noted that employees were engaged in their work
when the elements of psychological meaningfulness (i.e., sense of the work’s significance

8
relative to personal values), psychological safety (i.e., ability to express oneself in work-
role matters without negative repercussions), and psychological availability (i.e., being
ready, motivated, and able to do the work) were present.
Maslach et al. (2001) described engagement as the “positive antithesis of burnout”
(p. 397). Burnout, they surmised, resulted from “a prolonged response to chronic
emotional and interpersonal stressors on the job, and is defined by the dimensions of
exhaustion, cynicism, and inefficacy” (p. 397). Thus, if burnout’s dimensions are
exhaustion, cynicism, and inefficacy, then one might readily imagine the highly engaged
employee as energized at work, fairly optimistic about work and the organization, and
possessing a good sense of self-efficacy with respect to job performance.
Harter et al. (2002) defined engagement to be an “individual’s involvement and
satisfaction with as well as enthusiasm for work” (p. 417). In an extension of this
research, Luthans and Peterson (2002) demonstrated a relationship between managerial
self-efficacy, effective management perceptions, and employee engagement.
Finally, Saks (2006) divided engagement into two components: organizational
engagement and job engagement. He defined organizational engagement as “the degree
to which an individual is attentive and absorbed in the performance of their [sic] roles”
(p. 602) and job engagement as “how individuals employ themselves in the performance
of their job” (p. 602). His study concluded that job characteristics, perceived
organizational support, and procedural justice are antecedents to employee engagement.
He further asserted that there is a positive relationship between employee engagement
and the organizational outcomes of organizational commitment, organizational
citizenship behaviors, and intentions to quit.
9
Buckingham and Coffman (1999), in an earlier study, also demonstrated a
significant link between employee engagement and organizational outcomes. In this
study, they were able to demonstrate a positive, significant relationship between
employee engagement and customer satisfaction, workplace safety, productivity,
profitability, and turnover.
From a nomological standpoint, past theoretical and empirical research has
consistently shown or posited that employee engagement is an outcome of perceptions of
justice (Ghosh et al., 2014; He et al., 2014; Saks, 2006), perceived organizational support
(Saks, 2006), job characteristics (Saks, 2006), appraisal reactions (Volpone et al., 2012),
diversity climate perceptions (Volpone et al., 2012), and LMX (Chaurasia & Shukla,
2013). Additionally, past research has consistently shown or posited that employee
engagement predicts job satisfaction (Saks, 2006), organizational commitment
(Halbesleben, 2010; Saks, 2006), organizational citizenship behavior (Saks, 2006), job
performance (Bakker & Bal, 2010; Christian, Adela, & Jerel, 2011; Rich, Lepine, &
Crawford, 2010), customer satisfaction (Harter et al., 2002), productivity (Harter et al.,
2002), and profitability (Harter et al., 2002), and is negatively related to turnover
intentions (Halbesleben, 2010; Harter et al., 2002). The overall picture that emerges from
employee engagement’s nomological relationships is a phenomenon rooted in
organizational and psychological conditions pertinent to employment and influencing a
variety of constructs relevant to organizational functioning.
While there is no single definition for employee engagement, Rich et al.’s (2010)
description of employee engagement as “a multi-dimensional motivational concept
reflecting the simultaneous investment of an individual’s physical, cognitive, and

10
emotional energy in active, full work performance” (p. 619) captures the essence of the
construct described by numerous researchers and, as such, will be the definition used in
the study. The question then becomes, could employees’ reactions to their PA process
affect their physical, cognitive, and emotional state and subsequently the organizational
outcomes described in Rich et al.’s (2010) definition? Once again, organizational justice
research/theories would suggest the answer to this question is yes. Given the significance
of the PA process to individual employment decisions (raises, promotions, layoffs, etc.),
it is logical to conclude that employees will cognitively compare their self-evaluations to
those of their supervisors and react emotionally to the perceived justice of their
evaluation and subsequently behave in a manner that corresponds with this perception.
Identified Research Gap
While various studies have examined one or more of Keeping and Levy’s (2000)
PA reaction components and employee engagement (see Table 2), only one known study
by Volpone et al. (2012) is known to have examined the second-order construct of these
components, PA reactions. In this 2012 study, the authors used an abbreviated, modified
version of Keeping and Levy’s (2000) instrument to measure PA reactions and an
abbreviated, modified version of Harter’s et al. (2002) instrument to measure employee
engagement among employees working exclusively in the retail industry. The present
study is intended to be more comprehensive, using Keeping and Levy’s (2000) full
instrument and Rich et al.’s (2010) full instrument, thus providing researchers with new
evidence and further insights about the impact of the PA process in the workplace, while
at the same time spawning new ideas for other areas of research.

11
Research Questions
Given the theoretical relationship between reactions to the PA process and
workplace attitudes, and given the lack of empirical evidence supporting the relationship
between PA reactions and employee engagement, two questions emerge:
1. Is there a positive relationship between PA reactions, as measured by the
Keeping and Levy (2000) instrument, and employee engagement, as measured
by the Rich et al. (2010) instrument?
2. Is there a relationship between the individual factors of Keeping and Levy’s
(2000) instrument (system satisfaction, session satisfaction, perceived utility,
Table 2. Articles That Have Examined the Relationship Between Variables in Keeping and Levy’s (2000) Appraisal Reactions Construct and Employee Engagement
Author(s) Findings Saks (2006) Demonstrated a positive correlation between
distributive justice and employee engagement via a multi-regression analysis.
Volpone et al., (2012) Demonstrated that PA reactions are positively correlated with employee engagement via a structural equation modeling (SEM) analysis.
Dusterhoff et al. (2014) Demonstrated a positive relationship between PA utility and organizational justice via a multivariate regression analysis.
Ghosh et al. (2014) Found that distributive justice was positively correlated with employee engagement via a multivariate regression analysis.
He et al. (2014) Demonstrated a positive relationship between procedural justice and employee engagement via a SEM analysis.

12
perceived accuracy, procedural justice, and distributive justice) and employee
engagement?
Overview of the Design of the Study
To test the aforementioned hypotheses, a survey was distributed among
individuals who, as a normal part of their annual work experience, receive a performance
appraisal that includes an ordinal rating. Participants of the study were sourced via
snowball non-probability sampling and an online research panel. Online panels offer
affordable, reliable data that closely approximates the labor force (Dillman, Christian, &
Smyth, 2014; Heen, Lieberman, & Miethe, 2014; Roulin, 2015). After the data was
collected, structural equation modeling (SEM) was employed using the software package
IBM® SPSS® AMOS 23.0.0 to analyze the information.
Delimitations
Delimitations of the study included non-probability sampling and restricting
participants to individuals who were at least eighteen years of age and actively employed,
and who, as a normal part of their annual employment, receive a written performance
appraisal. The rationale for these delimitations is as follows:
• Non-probability sampling – the minimization of time and financial constraints
• Age minimum – to eliminate the requirement of parental consent for minors
• Active employment – to capture current perceptions/data • Written PA – to limit the sample to individuals who participate in a formal
PA process Limitations
Limitations of the study include the use of cross-sectional, self-reported data, non-
probability sampling, and respondent fatigue. Bono and McNamara (2011) note that the

13
use of cross-sectional data limits any inference of causality between independent and
dependent variables.
A second limitation of the study is the use of self-reported data. Podsakoff,
MacKenzie, Lee, and Podsakoff (2003) noted numerous method biases that are associated
with self-reported data, many of which may affect the validity of the data to be collected
in the study. Given the same individual is providing data regarding the independent and
dependent variables, any covariance between these variables may be inflated. An
artificial covariance may result from one or more of the following issues: consistency
motif, the desire by respondents to have their answers appear consistent; social
desirability, the desire by respondents to have their answers be socially acceptable; and
mood state, which notes that respondents’ emotions may affect how questions are
answered. Spector (2006), however, purported that these limitations are overstated and
extolled the benefits of the self-reporting methodology. Nevertheless, the procedural
remedies of ensuring participant anonymity and assessing dependent variables before
independent variables recommended by Podsakoff et al. (2003) were employed in this
study to minimize any effect of common methods bias.
A third limitation of the study is non-probability sampling. Bryman and Bell
(2011) noted that this type of sampling may increase sampling error and may adversely
affect the ability to generalize conclusions for the entire population.
A fourth limitation of the study is respondent fatigue. Smith, Roster, Golden, and
Albaum (2016) noted that some participants of online panels speed through surveys,
compromising the instrument’s data integrity and quality. To mitigate this limitation,

14
several instructional manipulation checks (IMC), as recommended by Oppenheimer,
Meyvis, and Davidenko (2009), were randomly placed throughout the survey.
Definition of Terms
Appraisal Reactions – Employees’ perceptions of their company-administered
performance appraisal process to include satisfaction with the PA session, satisfaction
with the PA system, perceived utility of the PA process, perceived accuracy of the PA
process, perceptions of procedural justice, and perceptions of distributive justice in the
PA process (Keeping & Levy, 2000; Volpone et al., 2012). This term is used
synonymously with the term performance appraisal reactions.
Cognitive Engagement – The intensity of an individual’s intellectual focus and
concentration directed towards organizational outcomes (Kahn, 1990; Rich et al., 2010;
Rothbard, 2001; Shuck & Wollard, 2010).
Distributive Justice – The perceived fairness of how rewards are allocated
(Dusterhoff et al., 2014; Ghosh et al., 2014).
Emotional Engagement – Energetic feelings of excitement, enthusiasm, and
interest directed towards organizational outcomes (Kahn, 1990; Rich et al., 2010; Shuck
& Wollard, 2010).
Employee Engagement – “A multi-dimensional motivational concept reflecting
the simultaneous investment of an individual’s physical, cognitive, and emotional energy
in active, full work performance” (Rich et al., 2010, p. 619). Used synonymously with the
terms job engagement and worker engagement.
Interactional Justice – The perceived fairness of individuals administering
organizational processes and procedures to include informational justice (completeness

15
of information) and interpersonal justice (demonstrated respect and courtesy) (Colquitt,
2001; Dusterhoff et al., 2014; Ghosh et al., 2014).
Job Engagement – “A multi-dimensional motivational concept reflecting the
simultaneous investment of an individual’s physical, cognitive, and emotional energy in
active, full work performance” (Rich et al., 2010, p. 619). Used synonymously with the
terms employee engagement and worker engagement.
Leader-Member Exchange (LMX) – The social reciprocity among leaders and
their subordinates (Gerstner & Day, 1997; Shweta & Srirang, 2013).
Organizational Engagement – “The degree to which an individual is attentive and
absorbed in the performance of his or her role” (Saks, 2006, p. 602).
Organizational Justice – Perceived organizational fairness as demonstrated by
distributive, interactive, and procedural justice (Colquitt, 2001; Dusterhoff et al., 2014;
Ghosh et al., 2014).
Perceived Accuracy – The extent to which employees perceived the performance
appraisal rating as a true measure of their actual performance (Keeping & Levy, 2000).
Perceived Utility – Employees’ assessment of the usefulness of the performance
appraisal process (Dusterhoff et al., 2014; Keeping & Levy, 2000).
Performance Appraisal (PA) – The meeting between employees and their
supervisor to review past performance and develop plans to enhance future performance
(Kondrasuk, 2011). This term is used synonymously with the terms performance
evaluation and performance review.
Performance Appraisal (PA) Process – “The process of determining how well
employees do their jobs relative to a standard and communicating that information to

16
them” (Mathis & Jackson, 2011, p. 320). This process typically includes setting goals
and objectives, observing performance, providing feedback, and assigning the employee
a performance rating (Buckingham & Vosburgh, 2001; Grote, 2002; Mathis & Jackson,
2011).
Performance Appraisal Reactions – Employees’ perceptions of their company
administered performance appraisal process to include satisfaction with the PA session,
satisfaction with the PA system, perceived utility of the PA process, perceived accuracy
of the PA process, perceptions of procedural justice, and perceptions of distributive
justice in the PA process (Keeping & Levy, 2000; Volpone et al., 2012). This term is
used synonymously with the term appraisal reactions.
Performance Appraisal Satisfaction – Employees’ perceptions of fairness,
accuracy, and the utility of their company administered performance appraisal process
(Dusterhoff et al., 2012; Waldman, 1997).
Performance Evaluation – The meeting between employees and their supervisor
to review past performance and develop plans to enhance future performance
(Kondrasuk, 2011). This term is used synonymously with the terms performance
appraisal and performance review.
Performance Management – The comprehensive set of activities to improve
employee performance and productivity in the workplace to include the use of coaching,
performance appraisals, salary, rewards, recognition, management of work-life balance,
etc. (DeNisi & Pritchard, 2006; Mathis & Jackson, 2011).
Performance Rating – An ordinal evaluation of an employee’s performance on
the job. This rating is often used as input for various employment actions including

17
salary adjustments and layoffs (Dusterhoff et al., 2014; Kondrasuk, Crowell, Emi, Dillon,
Kilzer, & Teely, 2008; Mathis & Jackson, 2011).
Performance Review – The meeting between employees and their supervisor to
review past performance and develop plans to enhance future performance (Kondrasuk,
2011). This term is used synonymously with the terms performance appraisal and
performance evaluation.
Physical Engagement – The intensity of effort and energy an individual exerts
towards organizational outcomes (Kahn, 1990; Rich et al., 2010; Shuck & Wollard,
2010).
Procedural Justice – The perceived fairness of organizational processes and
procedures to include due process, consistency, and specificity (Colquitt, 2001;
Dusterhoff et al., 2014).
Session Satisfaction – Employees’ assessment of their meeting with their
supervisor to evaluate their past performance (Keeping & Levy, 2000).
System Satisfaction – Employees’ assessment of the performance appraisal
process (Keeping & Levy, 2000).
Worker Engagement – “A multi-dimensional motivational concept reflecting the
simultaneous investment of an individual’s physical, cognitive, and emotional energy in
active, full work performance” (Rich et al., 2010, p. 619). This term is used
synonymously with the term employee engagement and job engagement.
Summary of the Chapter and Organization of the Dissertation
Chapter 1 provides an overview of the long-standing discussion regarding the
effectiveness of the performance appraisal process and how this study furthers this

18
conversation by exploring the relationship between performance appraisal reactions and
employee engagement among working individuals. Chapter 2 explores literature relevant
to the performance appraisal process, reactions to the process, and the impact these
reactions may have on employee engagement. Chapter 3 describes the hypotheses and
methodology for the study, including the specifics about study participants, sample size,
data collection procedures, data instruments, survey design, and data analysis techniques.
Chapter 4 details the data collected from the study including the results of data screening,
sample demographics, assumption testing, data reliability, measurement model analysis,
and theoretical model analysis. Finally, chapter 5 examines the findings of the study
including implications of the study, limitations of the study, and areas for future research.

19
Chapter Two – Review of Literature
Introduction
This review explores literature relevant to the PA process, reactions to the
process, and the impact these reactions may have on employee engagement. The review
is divided into three sections. The first section explores the desired outcomes of the PA
process; section two explores reactions to the PA process; section three examines the
components of Keeping and Levy’s (2000) appraisal reactions construct and their
relationship to employee engagement; and finally, section four presents a summary of the
chapter.
The literature review was conducted using online database queries licensed by
The University of Texas at Tyler. Databases queried included Business Source
Complete, Emerald, SAGE: Management and Organization, and PsycINFO. The
reference sections of reviewed documents were also used as resources to identify
additional articles pertinent to the topic. Search terms used for the study were
performance review, performance appraisal, performance management, performance
appraisal reactions, performance appraisal satisfaction, appraiser feedback, employee
engagement, and work engagement along with the terms effectiveness, issues, definition,
feedback, and alternatives.
Desired Outcomes of the PA Process
The desired outcome of the PA process is to improve individual and
organizational performance (DeNisi & Pritchard, 2006; Grote, 2000; Mathis & Jackson,
2011; Stalinski & Downey, 2012; Youngcourt et al., 2007). This is accomplished
through organizational goal alignment (Grote, 1996; Seiden & Sowa, 2011), manager-
20
employee communications (Pulakos & O’Leary, 2011), employee development (Grote,
2000; Mathis & Jackson, 2011; Thomas & Bretz, 1994), and effective personnel
administration (Kondrasuk, 2012). Following is a brief description of each of these
performance interventions.
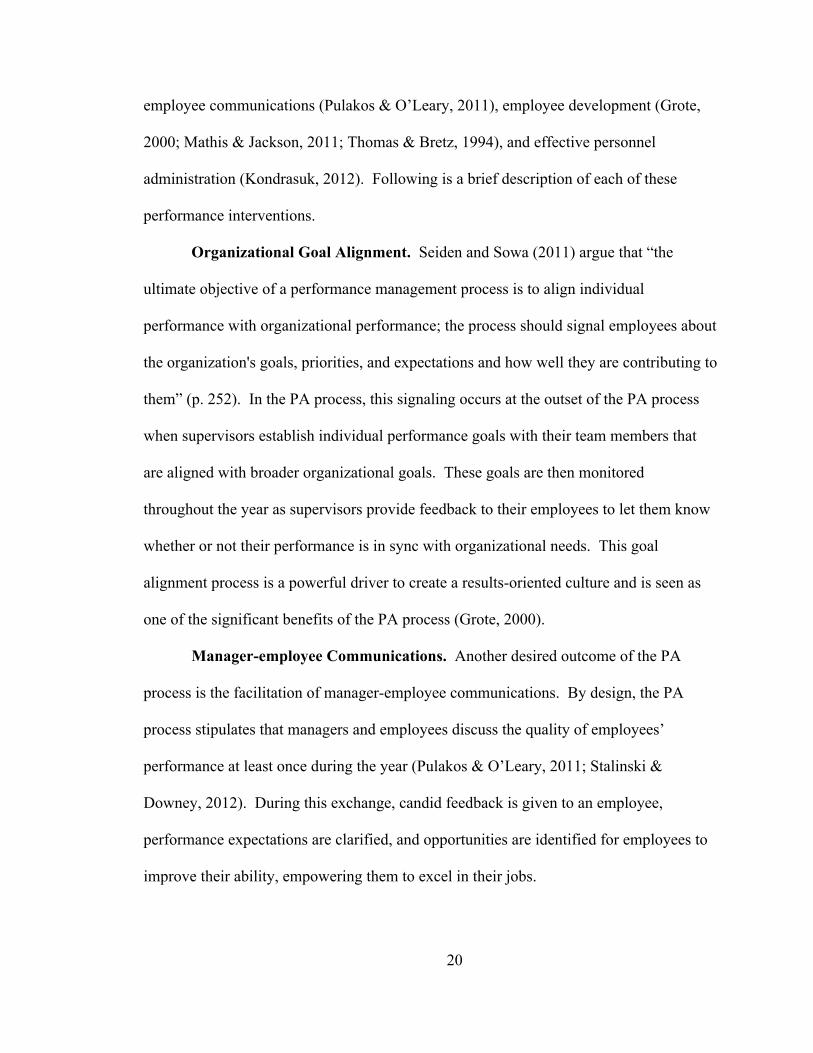
Organizational Goal Alignment. Seiden and Sowa (2011) argue that “the
ultimate objective of a performance management process is to align individual
performance with organizational performance; the process should signal employees about
the organization's goals, priorities, and expectations and how well they are contributing to
them” (p. 252). In the PA process, this signaling occurs at the outset of the PA process
when supervisors establish individual performance goals with their team members that
are aligned with broader organizational goals. These goals are then monitored
throughout the year as supervisors provide feedback to their employees to let them know
whether or not their performance is in sync with organizational needs. This goal
alignment process is a powerful driver to create a results-oriented culture and is seen as
one of the significant benefits of the PA process (Grote, 2000).
Manager-employee Communications. Another desired outcome of the PA
process is the facilitation of manager-employee communications. By design, the PA
process stipulates that managers and employees discuss the quality of employees’
performance at least once during the year (Pulakos & O’Leary, 2011; Stalinski &
Downey, 2012). During this exchange, candid feedback is given to an employee,
performance expectations are clarified, and opportunities are identified for employees to
improve their ability, empowering them to excel in their jobs.

21
Employee Development. The performance appraisal process may also facilitate
employee development. Ideally, managers and their employees discuss the employees’
strengths and weaknesses, career goals, and training needs. The culmination of the
conversation results in the creation of individual development plans for employees.
These plans, enacted throughout the course of a year, become tangible evidence of an
organization’s willingness to invest in employees’ professional growth, promoting both
personal and organizational effectiveness (Grote, 2000; Mathis & Jackson, 2011; Thomas
& Bretz, 1994).
Effective Personnel Administration. Another desired outcome of the PA
process is accurate performance data that can be used to manage human resource
administration functions. This performance data often comes in the form of a
performance rating or score during an employee’s performance review. These scores,
gauging employees’ effectiveness, are a key input for compensation, promotion, and
layoff decisions (Kondrasuk et al., 2008; Youngcourt et al., 2007). These ratings, in
addition to written comments, become a critical part of employees’ records and can serve
as legal documentation to warrant the termination of an employee when necessary
(Mathis & Jackson, 2011).
Reactions to the PA Process
While the desired outcomes of the PA process are noble, reactions to
implementation of the process are varied. Dipboye and de Pontbriand (1981) found that
employees react positively to the PA process when they feel they are able to express their
views, are evaluated on relevant factors, and discuss performance objectives and plans.
Dusterhoff et al. (2014) found that employees react positively to the process based on the

22
ratings they receive, when they have a positive relationship with their leader, and when
they perceive the PA process to be useful and fair. Brown, Hyatt, and Benson (2010)
found that the quality of the PA process, as measured by clear expectations, fairness,
valuable feedback, and trust, results in increased job satisfaction, organizational
commitment, and lower intentions of leaving the organization.
Yet, while some cite positive reactions to the PA process, others note the
limitations of the process and how these shortcomings precipitate negative reactions and
behaviors among employees and the supervisors responsible for administering the
process (Allan, 1994; Bouskila-Yam & Kluger, 2011; Gilley & Drake, 2003; Gilley &
Maycunich, 2000; Glendinning, 2002; Glover, 1996; Kruse, 2012; Laird & Clampitt,
1985; Light, 2010; Pulakos & O’Leary, 2011). Pulakos and O’Leary (2011) argue that
the performance appraisal process “has rightly earned its distinction as the ‘Achilles
Heel’ of human capital management, rarely working well irrespective of the time, effort,
and resources that are devoted to it” (p. 147). To subjectively gauge the level of
agreement with Pulakos and O’Leary’s (2011) assessment of the PA process, the term
"performance appraisals are a joke" was entered into the Google® search engine. In .37
seconds, 11,600,000 hits were returned, suggesting that there is a mainstream disdain for
the PA process among the populous. A sampling of reactions echoing this viewpoint,
from scholars and practitioners alike, is listed in Table 3. Kondrasuk et al. (2008), in
their investigation of the topic, categorized employee concerns with the PA process into
three distinct categories (see Table 4).

23
Table 3. Sampling of Concerned Reactions to the PA Process
“In theory performance appraisals are an effective developmental activity designed to reward past performance, improve future performance, and encourage career development. In reality, nothing could be further from the truth” (Gilley & Maycunich, 2000, p. 136).
“Obsessing over poor performance proves a waste of time for both employee and manager” (Gilley & Drake, 2003, p. 120).
"To my way of thinking, a one-side-accountable, boss-administered review is little more than a dysfunctional pretense. It's a negative to corporate performance, an obstacle to straight-talk relationships, and a prime cause of low morale at work. Even the mere knowledge that such an event will take place damages daily communications and teamwork" (Culbert, 2008, p. 4).
"Yet, with a near unanimous voice, both management scholars and practitioners speak to the limitations of an annual performance review that, at best, only partially captures an employee’s performance" (Ford, Latham & Lennox, 2011, p. 158).
“Today’s widespread ranking and ratings-based performance management is damaging employee engagement, alienating high performers, and costing managers valuable time" (Deloitte Consulting, 2014, p. 44).
The performance appraisal is "a bureaucratic, legalistic process that is universally loathed and whose primary contribution to organizational life seems to be endless material for Dilbert strips that adorn cubicle walls” (Hantula, 2011, p. 194).
"The annual performance review — as it is traditionally practiced — is an evil, toxic ritual that must be abolished" (Kruse, 2012, p. 3).
"Performance reviews are getting a poor review from the very people who run them. About 58% of human-resources executives graded their own performance-management systems a C or below, according to a May and June survey of 750 HR professionals conducted by New York-based consulting firm Sibson Consulting Inc. and World at Work, a professional association" (Light, 2010, para. 2).
“Survey data consistently show poor attitudes toward performance management, with many employees reporting that their system fails to provide useful feedback and establish clear expectations. Thus, after extensive analysis and study, the formula for effective performance management remains elusive" (Pulakos & O’Leary, 2011, p. 147).
Managers, when "asked why they have to do annual performance reviews, often respond with a shrug of the shoulder and/or ‘HR makes us do them.’ Meanwhile, HR managers are dreading the annual ritual of goading the completion of this industrial-age artifact" (Stalinski & Downey, 2012, p. 39).

24
PA Reactions and Employee Engagement
Given the significance of the PA process, Keeping and Levy (2000) developed
and validated a construct to gauge employee reactions to the organizational practice.
This second-order construct, comprised of six factors, was found to be valid
(confirmatory factor loadings ranged from .76 to .97) and reliable (α ranged from .90 to
.96). The factors used to build the construct were system satisfaction, session satisfaction,
perceived utility, perceived accuracy, procedural justice, and distributive justice.
Following is a description of these six factors and their theorized relationship to
employee engagement.
System Satisfaction. The first variable in Keeping and Levy’s (2000) construct
is system satisfaction. This variable gauges employees’ assessment of the PA process in
Table 4. Categorized Areas of Concern with the Performance Appraisal Process
False Perceptions and Expectations Does not meet or satisfy performer’s expectation (refuses to agree) Fairness/Trust are not perceived in PA systems Performer perceptions of past performance are contradictory to PA results
Communication Performers are unclear as to how they should use feedback to direct future work Inaccurate performance measures (weighted criteria) Evaluation process not taken seriously by performers
Negative Emotions Surrounding PA Belief that PA is connected only to wages Employees are not comfortable or at ease with the PA process Performer dissatisfaction with amount and type of performance feedback received Non-work related events and exigencies not taken into account during PA Lacks subordinate support 360-degree feedback is not weighted or validated properly Non-analytical approach Cultural differences
Adapted from Kondrasuk et al. (2008, p. 241). Used with Permission.

25
its entirety to include the establishment of objectives, ongoing observation and feedback,
reporting tools, and the quality of PA assessment instruments. Giles and Mossholder
(1990) noted the importance of including these systemic components when evaluating
performance appraisal reactions, and how failing to do so is a potentially serious error.
Erdogan (2002) postulated a relationship between how fair employees believe
their PA system to be with organizational commitment, turnover intentions, and
organizational prosocial behaviors. This theoretical relationship is supported by the
comments listed in Tables 3 and 4, documenting reactions to the PA system, and suggests
that there is a significant positive relationship between system satisfaction and employee
engagement.
Session Satisfaction. The second variable in Keeping and Levy’s (2000)
construct is session satisfaction. This variable gauges employees’ assessment of their
performance review meeting with their supervisor. Typically, there are two outputs from
this meeting: 1) an employee development plan and 2) a performance rating or score used
to make administrative decisions (salary increases, promotions, layoffs, etc.). According
to Kondrasuk (2012), these two outputs are in conflict with one another and place a
tremendous strain on manager-employee relationships because the supervisor is expected
to be both counselor and judge, and the employee is accordingly torn between seeking
developmental advice and avoiding negative performance feedback.
Stalinski and Downey (2012) suggest that there might be something even more
basic that is occurring during these manager-employee meetings. They suggest that in
these confrontational encounters, employees perceive the experience as a physical threat
and are unable to respond effectively in a rational manner.

26
Pulakos and O’Leary (2011) further suggest that manager-employee relationships
are damaged during this process to the point where employees avoid their superiors in the
day-to-day working relationship. These damaged relationships, precipitated by the PA
process, are suspected to have a negative effect on employee engagement and ultimately
organizational outcomes as predicted by leader-member exchange (LMX) theory
(Erdogan, 2002; Shweta & Srirang, 2013). Based on these findings, it is reasoned that
there is also a significant positive relationship between PA session satisfaction and
employee engagement.
Perceived Utility. The third variable in Keeping and Levy’s (2000) construct is
perceived utility. This variable gauges employees’ perceptions of the usefulness of the
PA process and is also conjectured to have a bearing on employee engagement in the
workplace. Qualitative data would suggest that employees often do not find the PA
process to be particularly useful for either development or improvement of their
performance (Bouskila-Yam & Kluger, 2011; Gilley & Maycunich, 2000; Gruman &
Saks, 2011). As such, the PA process is perceived as a meaningless activity and a waste
of valuable time.
Perceived Accuracy. The fourth variable in Keeping and Levy’s (2000)
construct is perceived accuracy. This variable gauges the extent to which employees
perceive the PA rating as a true measure of their actual performance. Banner and Cooke
(1984) note that decisions based on inaccurate data may be particularly harmful and
inadvertently incent poor performance and discourage positive performance.
Youngcourt et al. (2007) held that a goal of the performance appraisal process is
to improve employees’ knowledge, skill, ability, and motivation in order that they

27
perform their jobs more effectively and ultimately improve organizational performance.
Here the aim is to identify the strengths and weaknesses and build an individual
development plan to capitalize on individual strengths and minimize personal
weaknesses. Employees are unlikely, however, to commit to a performance development
plan when they think that the manager’s evidence for suggesting such a plan is
inaccurate, unrealistic, or biased (Ford et al., 2011). This would suggest that data
perceived as inaccurate adversely affects the level of engagement employees exert in the
workplace. It is therefore conjectured that there is a significant positive relationship
between PA perceived accuracy and employee engagement.
Procedural Justice. The fifth variable in Keeping and Levy’s (2000) construct is
procedural justice. This variable gauges the perceived fairness of organizational
processes and procedures to include due process, consistency, and specificity. Research
has well established the relationship between procedural justice and employee
engagement (Ghosh et al., 2014; Gupta & Kumar, 2013; He et al., 2014; Saks, 2006).
Given the significance of the PA process in the workplace, in particular the determination
of one’s salary, it is suspected that the perceived fairness of the PA process will have a
significant impact upon employees’ engagement in the workplace.
Further impacting procedural justice perceptions are the problems associated with
establishing performance objectives and goals. This fundamental step is all too frequently
done poorly, or not done at all, resulting in frustration and distrust among employees
(Deloitte Consulting, 2014; Kondrasuk, 2011; Laird & Clampitt, 1985; Pulakos &
O’Leary, 2011; Thurston & McNall, 2010). In a poll of 23,000 full-time U.S. employees,
“only 37% said they have a clear understanding of what their organization is trying to

28
achieve and why” and “only one in five said they have a clear ‘line of sight’ between
their tasks and their team's and organization's goals” (Covey, 2004, p. 160). When
performance standards and objectives are not created and clearly communicated to
employees, the PA process, by definition, cannot proceed. Yet organizations do proceed,
precipitating employee frustrations and non-productive behaviors (Brown et al., 2010;
Dusterhoff et al., 2014).
Another procedural issue with the PA process results when objectives have been
communicated but are outdated and do not reflect changes in the business climate. This
is especially problematic when employees regard working conditions and external factors
affecting their performance to be beyond their personal control, no matter how much they
may improve their skills or try to maintain their motivation to perform (Kondrasuk,
2012).
Another documented issue with the PA process is the ability of supervisors to
effectively observe employee performance and provide timely feedback. Unfortunately,
busy supervisors find it easy to neglect this crucial responsibility. When this occurs,
employees may feel slighted and become critical of their leaders and the PA process
(Levy & Williams, 2004; Sparr & Sonnentag, 2008). Kruse (2012) argues that the annual
appraisal actually enables delayed feedback, especially for leaders who are non-
confrontational by nature, requiring them to provide feedback to their employees only
once a year. As a result, the credibility of the performance appraisal meeting is seriously
undermined. Observations that are limited, out-of-date, non-relevant, biased, or
otherwise suspect lead to employee skepticism and greatly diminish the employee’s
motivation to improve his or her performance (Ford et al., 2011).

29
Multisource feedback used to evaluate employee performance may also impact
employees’ perceptions of procedural justice. Prior to the scheduled performance
appraisal, a manager will often survey individuals who have worked with the employee
being reviewed. This survey is commonly referred to as a 360-degree or multisource
assessment. The intention of the assessment is “for employees to learn how they are
perceived by direct reports, colleagues, managers, customers, and strategic business
partners — hence the term 360-degree because it generates a ‘full circle’ of information
concerning job performance” (Robertson, 2008, p. 63). While the concept of gaining
more than one perspective about an employee’s performance is valuable, this step in the
process can be time-consuming and fear-invoking, producing erroneous and untimely
data (Ford et al., 2011; Robertson, 2008; Tosti & Addison, 2009). Being assessed with
data that is perceived as inaccurate is likely to heighten employees’ sense of distrust with
the PA process.
Youngcourt et al. (2007) noted that when employees perceive procedural
injustices, employee engagement and subsequent organizational productivity are
adversely affected. Given the above findings, it is surmised that there is a significant
positive relationship between PA procedural justice and employee engagement.
Distributive Justice. The final variable in Keeping and Levy’s (2000) construct
is distributive justice. This variable gauges the perceived fairness of how rewards are
allocated within an employee’s organization. In the case of the PA process, distributive
justice reflects employees’ perceptions of the congruence between their contribution to an
organization and the performance rating awarded by their supervisor in a PA (Dusterhoff
et al., 2014; Keeping & Levy, 2000). This rating, often represented via a 5-, 7-, or 9-

30
point Likert scale, has added significance for many employees, given it is often tied to
employment actions such as salary increases, bonuses, and layoffs (Mathis & Jackson,
2011).
Budworth and Mann (2011), Culbert (2008), and Kruse (2012) suggest that
perhaps the largest concern with the PA process is the inconsistency of performance
ratings handed out by managers to their subordinates. Mathis and Jackson (2011) note
several issues with the rating process: 1) Varying Standards – applying different
standards to different individuals; 2) Recency Effects – giving greater weight to recently
occurring events; 3) Central Tendency – rating everyone at or near average; 4) Rater Bias
– unfairly rating certain groups due to personal prejudice; 5) Halo/Horn Effect – basing
ratings almost entirely on one area of performance; 6) Contrast Error – comparing
individuals to one another instead of the performance standards; and 7) Sampling Error –
rating an employee on an erroneous data sample (p. 347). Kruse (2012) mocks this
practice as completely outdated and meaningless. Others concur with Kruse’s
assessment, citing that ratings are inconsistent, biased, and often forced (Spence &
Keeping, 2011).
In some occurrences, managers trying to nullify the adverse impact of employee
ratings and preserve manager-employee relationships will inflate performance ratings
(Pulakos & O’Leary, 2011). To mitigate this problem, some organizations pressure
managers to lower employees’ performance ratings. These ratings, which are directly
tied to compensation ranges, are artificially lowered for financial purposes. The lower the
rating, the fewer raises the company will need to award. Employees who suspect that
31
appraisal ratings are either inflated or artificially lowered may certainly regard the ratings
as unfair.
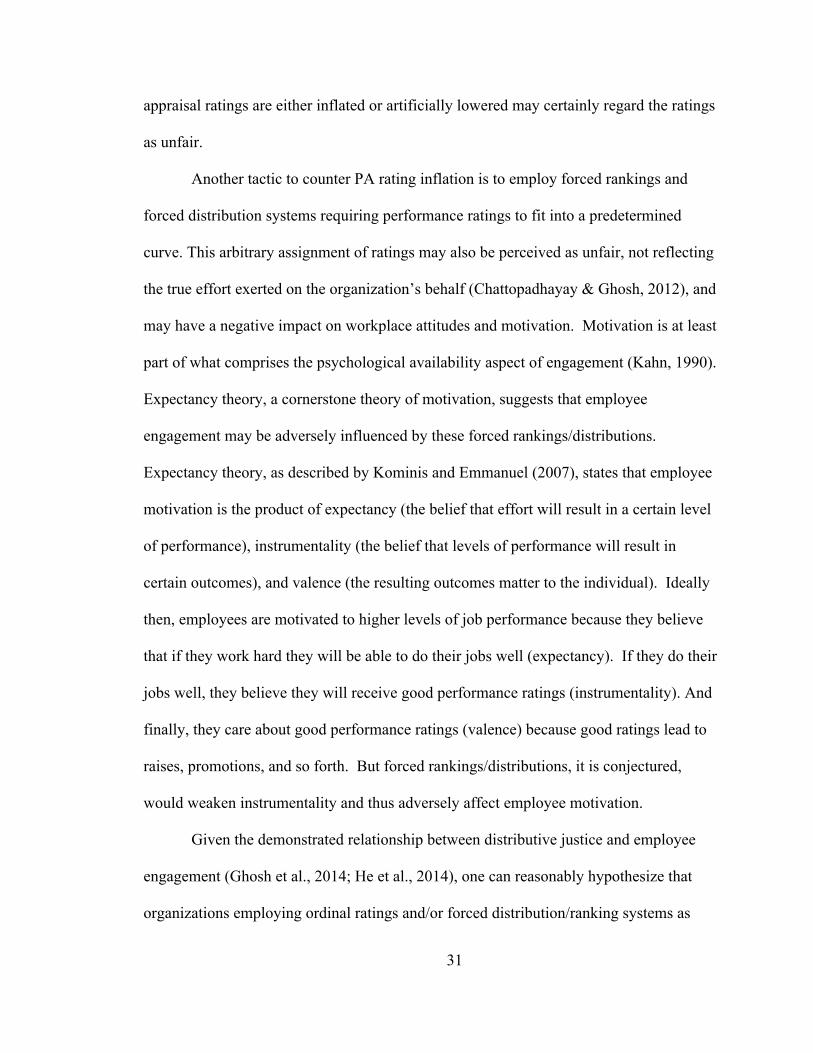
Another tactic to counter PA rating inflation is to employ forced rankings and
forced distribution systems requiring performance ratings to fit into a predetermined
curve. This arbitrary assignment of ratings may also be perceived as unfair, not reflecting
the true effort exerted on the organization’s behalf (Chattopadhayay & Ghosh, 2012), and
may have a negative impact on workplace attitudes and motivation. Motivation is at least
part of what comprises the psychological availability aspect of engagement (Kahn, 1990).
Expectancy theory, a cornerstone theory of motivation, suggests that employee
engagement may be adversely influenced by these forced rankings/distributions.
Expectancy theory, as described by Kominis and Emmanuel (2007), states that employee
motivation is the product of expectancy (the belief that effort will result in a certain level
of performance), instrumentality (the belief that levels of performance will result in
certain outcomes), and valence (the resulting outcomes matter to the individual). Ideally
then, employees are motivated to higher levels of job performance because they believe
that if they work hard they will be able to do their jobs well (expectancy). If they do their
jobs well, they believe they will receive good performance ratings (instrumentality). And
finally, they care about good performance ratings (valence) because good ratings lead to
raises, promotions, and so forth. But forced rankings/distributions, it is conjectured,
would weaken instrumentality and thus adversely affect employee motivation.
Given the demonstrated relationship between distributive justice and employee
engagement (Ghosh et al., 2014; He et al., 2014), one can reasonably hypothesize that
organizations employing ordinal ratings and/or forced distribution/ranking systems as

32
part of their PA process are likely to impact adversely the level of engagement exhibited
by their employees in the workplace.
PA Reactions. Given the demonstrated empirical, qualitative, and nomological
relationship between the components of Keeping and Levy’s (2000) appraisal reactions
construct and Rich et al.’s (2010) employee engagement construct, it is reasonable to
conclude that there is also a significant relationship between Keeping and Levy’s (2000)
second-order construct, PA reactions, and employee engagement. This assertion is
further supported by Erdogan’s (2002) theories linking PA justice and employee
attitudes, and the work of Volpone et al. in their 2012 study of racial perceptions as a
mediator between PA reactions and employee engagement.
Chapter Summary
This chapter provides an overview of the debate surrounding the effectiveness of
the PA process, citing the intended benefits of the process (organizational goal alignment,
facilitation of manager-employee communications, employee development, and effective
personnel administration) and its limitations (see Tables 3 & 4). Theoretical support for
the study is then offered by examining the empirical, qualitative, and nomological
relationship in literature of the Keeping and Levy (2000) PA reactions construct, along
with each of its components, and Rich et al.’s (2010) employee engagement construct.

33
Chapter Three – Methodology
Introduction
This third chapter describes the research hypotheses and methodology planned to
gather and analyze data to determine whether employee reactions to the PA process, as
measured by Keeping and Levy’s (2000) construct, are significantly related to employee
engagement. The chapter is divided into eight sections: 1) design of the study, 2)
population, 3) sample, 4) measurement instruments, 5) survey design, 6) data collection
procedures, 7) data analysis procedures, and 8) a summary of the chapter.
Research Hypotheses
Given the nomological and theoretical connections between reactions to the PA
process and employee engagement that have been reported, it is hypothesized that:
H1: There is a positive relationship between employees’ reactions to their
performance appraisal process and employee engagement (see Figure 1).
In addition to H1, an alternate hypothesis will be examined to determine which
model best fits the data. This alternative suggests that there is a significant positive
relationship between the individual variables identified in Keeping and Levy’s (2000)
appraisal reactions construct and employee engagement:
H1a1: System satisfaction, session satisfaction, perceived utility, perceived
accuracy, procedural justice, and distributive justice predict employee engagement (see
Figure 2).
Design of the Study
The design of the study is quantitative, using data collected from a cross-sectional
survey similar to the work of Ghosh et al. (2014), He et al. (2014), Saks (2006), and
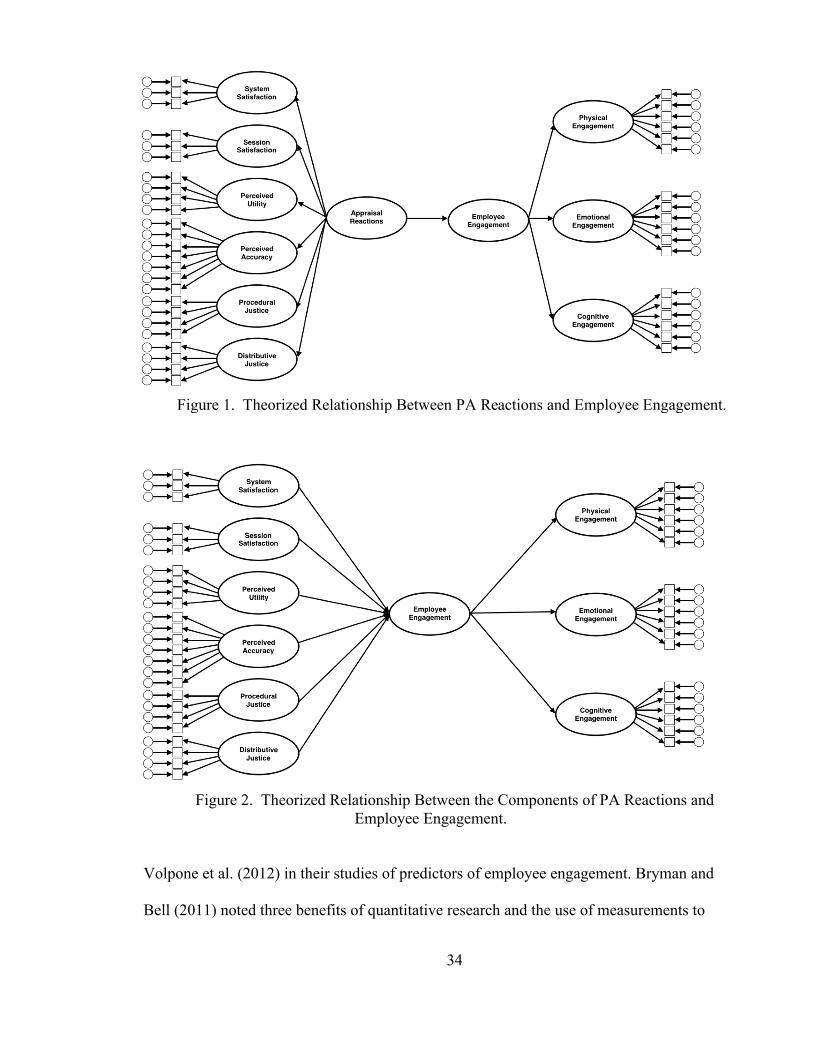
34
Figure 2. Theorized Relationship Between the Components of PA Reactions and Employee Engagement.
Volpone et al. (2012) in their studies of predictors of employee engagement. Bryman and
Bell (2011) noted three benefits of quantitative research and the use of measurements to
Figure 1. Theorized Relationship Between PA Reactions and Employee Engagement.

35
analyze data: (a) measurement allows one to assess even subtle differences between
people regarding the focal variable, (b) measurement makes such assessment more
consistent, and (c) measurement lends precision in estimating relationships between
variables.
Furthermore, a quantitative design was deemed appropriate given the limited
amount of empirical data in the literature examining the relationship between PA
reactions and employee engagement. While numerous articles point to the shortcomings
of the PA process (Glover, 1996; Gruman & Saks, 2011; Kondrasuk, 2012; Light, 2010;
Pulakos & O’Leary, 2011; Thomas & Bretz, 1994), at the time of this writing, only one
by Volpone et al. (2012) was found to have measured the relationship between PA
reactions and employee engagement.
A cross-sectional approach to collect data was reasoned appropriate given that the
purpose of the study is to examine a point-in-time relationship between PA reactions and
employee engagement and not the manipulation of variables via a treatment to determine
causality. As Bryman and Bell (2011) note, in most business research “it is not possible
to manipulate variables in which we are interested. This is why most quantitative
business research employs a cross-sectional research design rather than an experimental
one” (p. 56). It should further be noted that the point-in-time measurements for the study
need not coincide with the PA meeting between an employee and his or her supervisor to
evaluate prior performance. A common misconception of the PA process is that it is
minimized to this single meeting. As Giles and Mossholder (1990) note, failing to
examine the PA process in its entirety is a potentially serious error.

36
A self-reporting design was also employed for the study. As Conway and Lance
(2010) point out, self-reporting measures are suitable for constructs that gauge personal
evaluations or reflections, which is the case for this study. They also affirm the validity
of a self-reporting methodology, dispelling various misconceptions with the practice.
Population
The population for the study are individuals working in the United States who, as
a normal part of their annual work experience, receive a formal performance appraisal
with an ordinal rating. Per a 2011 Society for Human Resource Management poll, 98%
of organizations with 100 or more people in the United States have a formal evaluation
process for their employees. According to the 2011 statistics from the U.S. Census
Bureau (census.gov), there were over 74 million individuals working for firms with 100
or more employees, which suggests the PA process impacts up to 72.5 million workers in
the United States.
The PA process is also widely studied in organizations outside the U.S.,
indicating its widespread use globally (Bouskila-Yam & Kluger, 2011; Kominis &
Emmanuel, 2007; Kumari, 2012). While the study was focused on the U.S. population, it
is worthy to note that the worldwide population affected by this phenomenon is
significantly greater.
Sample
The sample for the study was sourced via snowball non-probability sampling and
an online research panel. Online panels offer affordable, reliable data that closely
approximates the labor force (Dillman et al., 2014; Heen, et al., 2014; Roulin, 2015).

37
The sample size to test the models needed to be large enough to obtain a statistical
power level of .8 at a significance level of .05, which is the accepted practice for a wide
variety of social science studies (Lieber, 1990; Stevens, 2009). Kline (2016) and
Schumacker and Lomax (2010) noted that larger sample sizes are required when using
structural equation modeling (SEM), as opposed to other forms of statistical analyses.
They found that many researchers employing SEM typically had sample sizes between
200 and 500 subjects. Bentler and Chou (1987) suggest a minimum of a 5:1 ratio between
sample size and the number of estimated parameters in a study when the data are
normally or elliptically distributed. The authors, however, recommend a 10:1 ratio as a
more conservative target increasing the likelihood of trustworthy data. In this study, 45
questions were used to measure 11 latent variables (system satisfaction, session
satisfaction, perceived utility, perceived accuracy, procedural justice, distributive justice,
appraisal reactions, physical engagement, emotional engagement, cognitive engagement,
and employee engagement). Using Bentler and Chou’s (1987) guidelines, 450
participants should provide a large enough sample to allow for credible significance
testing and model assessment. Schumacker and Lomax (2010) suggested Dr. Daniel
Soper’s statistical SEM calculator
(http://www.danielsoper.com/statcalc3/calc.aspx?id=89#) for calculating minimum
sample sizes to obtain specific effect sizes, power, and probability levels, taking into
consideration the number of latent variables in the model as well as the number of
observed variables. This calculator suggested a sample size of 96 to detect an effect size
of .25, with a power level of .8 and a probability level of .05, and a sample size of 298 to
determine a model structure. Kline (2016) suggested using a 20:1 N:q ratio where q is

38
the number of parameters that require statistical estimates. Using this methodology, 200
surveys would be needed for the study. It was the goal of this study to err on the
conservative side and obtain data from a minimum of 450 respondents in accordance with
Bentler and Chou’s (1987) guidelines.
Measurement Instruments
The instrument used in the study to measure the independent variable, PA
reactions, was taken from Keeping and Levy’s (2000) study examining PA reaction
measures (see Figure 3). The instrument used to measure the dependent variable,
employee engagement, was taken from Rich et al.’s (2010) study of job engagement.
While there are many instruments used to measure engagement, Saks and Gruman (2014)
recommend instruments measuring employee engagement be in line with Kahn’s (1990,
1992) original engagement construct, as is the case with Rich et al.’s (2010) instrument.
Figure 3. Hierarchical Model of Appraisal Satisfaction (Keeping & Levy, 2000, p. 715). Used with Permission.

39
The instruments used in the study were also considered noteworthy given their
demonstrated reliability and validity. Factor loadings and Cronbach’s alpha coefficients
for each instrument are well within acceptable established ranges and are listed below.
PA Reactions. This 27-item, six-factor scale measures individual perceptions of
PA system satisfaction, PA session satisfaction, PA utility, PA accuracy, PA procedural
justice, and PA distributive justice. Keeping and Levy (2000) demonstrated the validity
of the hierarchical model (PA reactions as a higher-order factor and the measurement
model’s six factors as first-order, latent indicators) with latent factor loadings ranging
from .69 to .96 and model fit statistics of χ2 = 349.47, df = 175, SRMSR = .06, TLI = .95
and RMSEA = .08.
System Satisfaction. The instrument for gathering system satisfaction data, used
in Keeping and Levy’s (2000) study, contains three items and was originally sourced
from Giles and Mossholder’s (1990) work examining employee reactions to the PA
process. Keeping and Levy (2000) demonstrated the unidimensionality of this latent
variable with factor loadings ranging from .76 to .96 with α = .90. Giles and
Mossholder’s (1990) original article reported α = .81 and Elicker et al. (2006) used this
variable with α = .89. These values are well above the .70 established limits of
acceptability as documented by Bryman and Bell (2011). The instrument uses a 6-point
Likert scale (1 = Strongly Disagree, 6 = Strongly Agree). Sample questions include “The
performance appraisal system does a good job of indicating how an employee has
performed in the period covered by the appraisal” and “The appraisal system provides a
fair and unbiased measure of the level of an employee's performance.”
40
Session Satisfaction. Like system satisfaction, the instrument for gathering
session satisfaction data contains three items and was also sourced from Keeping and
Levy’s (2000) study with its origins in Giles and Mossholder’s (1990) work. Keeping
and Levy (2000) demonstrated the unidimensionality of this latent variable with factor
loadings ranging from .88 to .95 and with α = .95. Giles and Mossholder’s (1990)
original article reported α = .89 and Elicker et al. (2006) used this variable with α = .94.
The instrument uses a 6-point Likert scale (1 = Strongly Disagree, 6 = Strongly Agree).
Sample questions include “I felt quite satisfied with my last appraisal discussion,” “I feel
good about the way the last appraisal discussion was conducted,” and “My manager
conducts a very effective appraisal discussion with me.”
Perceived Utility. The instrument for gathering perceived utility perceptions,
used in Keeping and Levy’s (2000) study, contains four items and was originally sourced
from Greller's (1978) work describing employee participation in the PA interview.
Keeping and Levy (2000) demonstrated the unidimensionality of this latent variable with
factor loadings ranging from .78 to .87 with α = .91. Greller's (1978) original article
reported α = .87. The instrument uses a 4-point scale (1 = I do not feel this way at all, not
at all, 4 = I feel exactly this way, completely). Sample questions include “The
performance appraisal helped me learn how I can do my job better,” “I learned a lot from
the performance appraisal,” and “The performance appraisal helped me understand my
mistakes.”
Perceived Accuracy. The instrument for gathering perceived accuracy
perceptions, used in Keeping and Levy’s (2000) study, contains nine items, three of
which are reverse-coded, and was originally sourced from Stone, Gueutal, and Mclntosh's

41
(1984) work exploring feedback accuracy. Keeping and Levy (2000) demonstrated the
unidimensionality of this latent variable with factor loadings ranging from .89 to .96 with
α = .96. Stone et al.’s (1984) original article reported α = .94. The instrument uses a 7-
point Likert scale (1 = Strongly Disagree, 7 = Strongly Agree). Sample questions include
“The feedback was an accurate evaluation of my performance,” “I do not feel the
feedback reflected my actual performance,” and “I believe the feedback was correct.”
Procedural Justice. The instrument for gathering procedural justice perceptions,
used in Keeping and Levy’s (2000) study, contains four items and was originally sourced
from Keeping, Makiney, Levy, Moon, and Gillette’s (1999) work exploring feedback
accuracy. Keeping and Levy (2000) demonstrated the unidimensionality of this latent
variable with factor loadings ranging from .89 to .97 with α = .96. The instrument uses a
7-point Likert scale (1 = Strongly Disagree, 7 = Strongly Agree). Sample questions
include “The procedures used to evaluate my performance were fair,” “The process used
to evaluate my performance was fair,” and “The procedures used to evaluate my
performance were appropriate.”
Distributive Justice. The instrument for gathering distributive justice
perceptions, used in Keeping and Levy’s (2000) study, was originally sourced from
Korsgaard and Roberson’s (1995) work exploring procedural justice in the context of
performance evaluations. The instrument contains four items. Keeping and Levy (2000)
demonstrated the unidimensionality of this latent variable with factor loadings ranging
from .89 to .95 with α = .95. Korsgaard and Roberson’s (1995) original article reported α
= .93. The instrument uses a 7-point Likert scale (1 = Strongly Disagree, 7 = Strongly

42
Agree). Sample questions include “The performance appraisal was fair,” “I agree with
my final rating,” and “I agree with the way my manager rated my performance.”
Employee Engagement. Whereas several scales have been developed in the past
two decades, Saks and Gruman (2014) suggested using only those measures that have
their roots “in line with Kahn’s (1990, 1992) original conceptualization” (p. 167) of
employee engagement. The authors go on to note that the Rich et al. (2010) instrument is
such a measure. This 18-item, three-factor scale measures the cognitive, emotional, and
physical attributes of employee engagement in alignment with Kahn’s (1990) original
research highlighting the psychological meaningfulness, psychological safety, and
psychological availability elements of the construct. Internal consistency reliabilities for
the instrument have been demonstrated to be strong. Rich et al.’s (2010) original work
yielded α = .95; Shuck, Shuck, and Reio’s (2013) work yielded α = .96; and Shuck,
Twyford, Reio, and Shuck’s (2014) work also yielded α = .96.
Physical Engagement. The instrument for gathering physical engagement
perceptions contains six items and was sourced from Rich et al.’s (2010) original study
that explored antecedents and job performance outcomes of employee engagement. Rich
et al. (2010) demonstrated the unidimensionality of this latent variable with factor
loadings ranging from .60 to .89. Similarly, He et al. (2014), using the Rich et al. (2010)
instrument, demonstrated factor loadings ranging from .84 to .93 with α = .94. The
instrument uses a 5-point Likert scale (1 = Strongly Disagree, 5 = Strongly Agree).
Sample questions include “I work with intensity on my job,” “I devote a lot of energy to
my job,” and “I strive as hard as I can to complete my job.”

43
Emotional Engagement. The instrument for gathering emotional engagement
perceptions contains six items and was sourced from Rich et al.’s (2010) original study
that explored antecedents and job performance outcomes of employee engagement. Rich
et al. (2010) demonstrated the unidimensionality of this latent variable with factor
loadings ranging from .68 to .91. Similarly, He et al. (2014), using the Rich et al. (2010)
instrument, demonstrated factor loadings ranging from .83 to .94 with α = .94. The
instrument uses a 5-point Likert scale (1 = Strongly Disagree, 5 = Strongly Agree).
Sample questions include “I am enthusiastic in my job,” “I feel energetic at my job,” and
“I am excited about my job.”
Cognitive Engagement. The instrument for gathering cognitive engagement
perceptions contains six items and was sourced from Rich et al.’s (2010) original study
that explored antecedents and job performance outcomes of employee engagement. Rich
et al. (2010) demonstrated the unidimensionality of this latent variable with factor
loadings ranging from .67 to .92. Similarly, He et al. (2014), using the Rich et al. (2010)
instrument, demonstrated factor loadings ranging from .82 to .94 with α = .91. The
instrument uses a 5-point Likert scale (1 = Strongly Disagree, 5 = Strongly Agree).
Sample questions include “At work, my mind is focused on my job,” “At work, I focus a
great deal of attention on my job,” and “At work, I am absorbed by my job.”
Demographics. The demographic information collected for the study, based on
the recommendations of Nimon, Zientek, and Henson (2012), included gender, age, race,
education, organization tenure, employment geography, firm size, organization type,
industry, and individual occupation.

44
PA Characteristics. Eight questions were used to gather information regarding
organizational PA practices. This information included the frequency of PAs, personal
PA rating information, and whether respondents administer PAs.
Survey Design
Data for the study was gathered via a cross-sectional, web-based survey (see
Appendix A). The data collected from the survey included participant consent,
demographic information, organizational PA practices, the respondent’s most recent PA
rating, reflections of engagement, PA process reactions, and instructional manipulation
check (IMC) questions. The survey was designed in such a way to maximize participant
response rates, minimize missing/erroneous data, and mitigate the effects of common
method bias.
The first piece of data collected on the survey was the participant’s willingness to
voluntarily take the survey and acknowledgement that they are at least 18 years of age.
This informed consent question explained the topic of the survey (the employee’s work
environment), detailed survey logistics, informed participants that there are no right or
wrong answers, and emphasized that responses are confidential. Dillman et al. (2014)
note that if the topic of a survey is relevant to respondents, then they are more likely to
respond. Furthermore, stating that there are no right or wrong survey responses and that
responses are confidential should, according to Podsakoff et al. (2003), minimize the
likelihood of common method bias.
Once respondents consented to take the survey, they were asked a series of
demographic questions. While there are differing opinions of where to place demographic
survey questions, this study placed these questions at the start of the survey in accordance

45
with the empirical research of Teclaw, Price, and Osatuke (2012), who observed
improved response rates with this type of placement.
The third series of questions gathered individual and organizational PA
information including the frequency of appraisals, the length of the respondent’s last
appraisal, and PA rating data. These questions were used to gather insights regarding any
effects that an organization’s PA practices had on PA reactions or employee engagement.
In this series of questions, respondents were also asked if they received a performance
appraisal during the normal course of employment. If their response was “no” to this
question, the survey was terminated.
Next, survey participants were asked about emotional, cognitive, and physical
engagement using the instruments from Rich et al.’s (2010) study noted above. These
dependent variables were assessed prior to the independent variables in the study to
reduce the likelihood of common method bias (Podsakoff et al., 2003). Additionally,
these questions were placed in table matrices, with the Likert responses listed in the first
row and the individual questions listed to the side (see Figure 4), versus each question
Figure 4. Example of a Table Matrix Survey Question.
46
being listed with its own Likert scale, to shorten the overall length of the survey. Fan and
Yan (2010) noted that individuals are more likely to complete surveys that are shorter in
length.
Subsequent to engagement questions, survey participants were asked about their
reactions to their organization’s PA process using the instruments from Keeping and
Levy’s (2000) study noted earlier. PA reaction questions, like engagement questions,
were placed in table matrices to minimize the overall length of the survey.
Finally, IMC questions were scattered throughout the survey. These questions
directed respondents to answer a survey question with a specific answer. Smith et al.
(2016) noted that attention filter questions are a good way to gauge whether survey
respondents are reading the questions for which they are supplying answers, and
Oppenheimer et al. (2009) have shown that these types of questions help to keep survey
participants focused and increase the statistical power and reliability of the data collected.
The survey contained five such questions.
Fan and Yan (2010) noted increased response rates among government and
academic surveys. As such, the administered survey contained a University of Texas at
Tyler banner on each page of the survey and noted that the survey was part of an
academic study (see Figure 4).
To minimize missing data, the survey required that all answers be completed
before the survey can be submitted. Similarly, to minimize erroneous data being entered
into the survey, there were no fields that required a user to type in a response with the
exception of one IMC and two demographic questions where the respondent could

47
indicate an “other” response. All dependent variable (DV) and independent variable (IV)
questions required the user select one response from a Likert scale.
Data Collection Procedures
The data collection process began by first seeking approval from the University of
Texas at Tyler’s and Charleston Southern University’s Institutional Review Boards (IRB)
to collect data for the study. Once the IRBs were satisfied that the proper protections
were in place and approval was granted to proceed with the study, participants were
recruited using the non-probability approach of snowball sampling. Initial contacts, some
of which were to well-established leaders in business and education, were made via social
media and email. Baltar and Brunet (2012) note that the time, speed, and magnitude
benefits of snowball sampling using social media venues like Facebook® allow individual
researchers to do what would have taken teams of researchers to do in the past. Those
contacted were invited to participate in the study and encouraged to invite others to take
the survey as well, provided they met the minimum qualifications of the study (See
Appendix B). These qualifications included being an employee who is at least 18 years
of age and, as part of their normal employment, receives a performance appraisal,
preferably with an ordinal rating, at least annually. Given there was difficulty in
obtaining the minimum number of 450 participants needed for the study, an online
research panel was engaged to collect additional data.
Data Analysis Procedures
Data collected from the surveys was analyzed using SEM with IBM® SPSS®
AMOS 23.0.0 to determine the reliability and validity of the data, examine any
significant relationships between the latent variables, and examine which, if any, of the

48
models above best fit the data. Schumacker and Lomax (2010) noted that SEM is
particularly effective in analyzing complex models with numerous observed variables.
Data Screening. Once the survey was closed, the data were reviewed for
response rate and missing/erroneous data. Surveys were first examined to ensure that all
questions had been answered. If a survey had been aborted before completion, it was not
used to evaluate the models in the study.
Subsequent to the incomplete survey check, screening questions were reviewed.
Valid participants must have indicated that they were at least 18 years of age, actively
employed, and received written performance appraisals. Surveys that failed the screening
questions were noted, but the data in these surveys was not included in the study.
Next, IMC questions were examined in each survey. Surveys that failed this
check were noted, but excluded from the study. Five IMC questions were included in the
survey. These checks were in the form of questions where the respondent was instructed
to answer a question with a specific response. For example, a participant might have
been instructed to choose “moderately agree” for a particular item. These checks also
served the purpose of identifying and eliminating any straight-line responders.
Once IMC questions had been verified, the survey was screened for speeders,
individuals who speed through a survey with little to no thought (Schoenherr, Ellram, &
Tate, 2015). Any individual who completed the survey in under two minutes was
deemed a speeder. Surveys completed by speeders were noted, but their results were
excluded from the study.
Once the surveys were screened and invalid surveys removed, the data was tested
to determine whether it was suitable for factor analysis by examining normality,

49
Cronbach alpha coefficients, factorability, Kaiser-Meyer-Olkin (KMO) measure of
sampling adequacy, and Bartlett's test of sphericity. Kline (2016) suggests normality be
determined by determining the skewness (g1) and kurtosis (g2) of the collected data. Data
are considered to be normal if |g1| < 3 and |g2| < 10. Bryman and Bell (2011) recommend
α > .7 (preferably > .8) to demonstrate adequate reliability. Brown and Onsman (2013)
recommend that correlation coefficients be > .3 to demonstrate the presence of significant
relationships between variables, KMO be > .50 to indicate the data is suitable for factor
analysis, and Bartlett’s test of sphericity be significant with p < .05 to determine
homoscedasticity. Should any of these tests fail, further scrubbing of the data may be
necessary before any further analyses can be done. If the data are found not to be suitable
for analysis, more data would need to be gathered.
Demographic Analysis. Demographic and PA characteristic questions were
examined to determine if there were any significant differences in PA reactions and
employee engagement when examined through the filter of a particular demographic or
PA characteristic. Those items with significant, between group, variances were reported
and the impact of these variances discussed.
Measurement and Structural Model Analysis. Once data screening had been
completed, the measurement and structural models were analyzed. Anderson and
Gerbing (1988) recommend a two-step process when using SEM. The first step is to test
the validity of the constructs used in the study (measurement model), and the second step
is to test the study’s hypotheses (structural model) by examining the relationships
between the validated constructs. The validity of the constructs was tested using the
measurement model shown in Figure 5. This was done via a confirmatory factor analysis

50
(CFA) to examine the goodness of fit between the data and the measurement model using
the following indices recommended by Groenland and Stalpers (2012), Kline (2016), and
Schumacker and Lomax (2010): chi-square (χ2) with its degrees of freedom (df) and p-
value, comparative fit index (CFI), standardized root-mean square residual (SRMR),
root-mean-square error of approximation (RMSEA), and the Tucker-Lewis Index (TLI).
A summary of these indices and their recommended values are shown in Table 5.
Models that indicated a poor fit were reassessed (i.e., assessment of modification
indices, scrutiny of item wording, etc.) and modified, if appropriate, to be congruent with
the data (Byrne, 2010). The goal was to determine a model that had cleanly
unidimensional factors with sufficient loadings for all items, no problematic cross-
loadings for any items, and sufficient summative scale reliabilities.
Once the measurement model fit had been validated, the validity of the constructs
was assessed by examining the model’s factor loadings, critical ratios (Z value),
Figure 5. Measurement Model for the Study.

51
convergent validities, and discriminant validities, in addition to the nomological validity
of the constructs already noted above. The factor loadings of each latent construct were
evaluated against Groenland and Stalpers’ (2012) standards. They noted that factor
loadings > .5 (> .7 preferably) confirm the existence of a relationship between an
indicator item and its latent construct. CRs of each latent construct were also evaluated
against Groenland and Stalpers’ (2012) standards. They noted that Z values > 2 confirm
the significance of the relationship between an indicator item and its latent construct.
Next, the authenticity of the constructs was examined through the lens of
convergent validity. Convergent validity assesses the covariance of construct indicators
and was assessed by calculating the average variance extracted (AVE) of a given
construct. Values greater than .5, as recommended by Hair, Black, Babin, and Anderson
(2010), were deemed valid. Additionally, construct reliability was determined for each
factor and its corresponding items. Values > .7, as recommended by Hair et al. (2010),
were deemed significant.
The final test of the measurement model was its discriminant validity, which
indicates the uniqueness of a given construct. Discriminant validity is demonstrated when
Table 5. CFA Indices and Their Recommended Values
Index Recommended Value
χ2 with df and p-value p > .05* CFI > .90
RMSEA < .08 SRMR < .07
TLI > .90 * “Chi square may not be a reliable index for the evaluation of model fit for models of some complexity and with large sample sizes. In such cases, this fit should not be interpreted (it should however, be published)” (Groenland and Stalpers, 2012, p. 17). Groenland and Stalpers (2012)

52
the maximum shared squared variance (MSV) of a construct is less that the AVE (Hair et
al., 2010). Results of the above indicators were analyzed and reported.
Once the constructs were validated in the measurement model, the theorized
relationships between the constructs were examined. Similar to the measurement model,
the structural model was validated by examining goodness of fit indices listed in Table 5
and deemed reliable by examining the critical ratios of the model’s regression paths
between independent and dependent variables. Both the theoretical model and the
alternative model were assessed to determine which model best fit the data.
Summary of the Chapter
This third chapter describes the research hypotheses and the methodology that
was used to gather and analyze data to determine whether employee perceptions of the
PA process are significantly related to employee engagement. To obtain statistical power
and significance, the study needed to gather data from at least 450 participants using
snowball sampling and an online research panel. This number of respondents provided a
maximum significance level of .05 and a minimum power level of .8. Data was analyzed
using SEM with IBM® SPSS® AMOS 23.0.0 to determine the reliability and validity of
the data, examine any significant relationships between the latent variables, and examine
which of the study’s models best fit the data. Anderson and Gerbing’s (1988) two-step
process was used first to test the validity of the constructs used in the study (measurement
model) and then to test the study’s hypotheses (structural model) by examining the
relationships between the validated constructs.

53
Chapter Four – Results
Introduction
This fourth chapter details the data collected from the study and is divided into
seven sections: 1) data screening, 2) sample demographics, 3) assumption testing, 4) data
reliability, 5) measurement model analysis, 6) theoretical model analysis, and 7) a
summary of the chapter.
Data Screening
Sample data were collected via snowball non-probability sampling and a Qualtrics
online research panel. Fifty-eight surveys were collected via the snowball sample and 408
surveys were collected via the Qualtrics online research panel for a total sample of 466
respondents. Twenty-three surveys (4.9%) were not completed and therefore were not
included in the final data sample for analysis. Additionally, seven surveys (1.5%) were
removed from the sample because they failed an instructional manipulation check
gauging respondent attentiveness. Four hundred thirty-six surveys were therefore deemed
acceptable for analysis. No further analysis was performed on the unusable surveys,
given their small group size. Additionally, no respondent data were collected for any
individual who did not meet all the screening requirements for the study, which included
providing informed consent, being at least 18 years old, being currently employed, being
a recipient of performance appraisals, and taking at least two minutes to complete the
survey.
Sample Demographics
Of the 436 qualified surveys, 51.8% were females, which closely approximated
the 54.3% noted by the Bureau of Labor Statistics (BLS) in 2016. 71.8% of the

54
respondents fell between the ages of 30 and 59 (BLS = 65.4%), with the majority of
individuals (28.2%) being between 50 and 59 years of age. 79.1% of respondents were
Caucasian, which was substantially higher than the 59.8% reported by the BLS in 2016.
65.2% of acceptable survey respondents had a bachelor’s degree or higher, which was
noticeably higher than the 2016 BLS statistic of 39.6%. The majority of the respondents
(55%) had worked for their employer for more than 6 years and 87.6% were full-time
employees, intimating that respondents had ample experience with their organizations’
PA practices. 99.1% of those surveyed were employed in the United States working for
mostly private organizations (47.5%) ranging in size from one to over five thousand.
47.2% of qualified survey participants identified themselves as professionals, which was
noticeably higher than the 2015 BLS statistic of 38.9%. Finally, 17% of respondents
reported being a member of an organized labor union, which was higher than the 2016
BLS statistic of 10.7%.
Demographics were analyzed to determine if any item had a significant impact on
individuals’ reactions to the PA process and/or their engagement in the workplace.
Differences between group means for age, occupation, and union membership were
found to be significant (p < .05) for at least one of these variables. Workers over 60 years
of age and those whose who indicated farming as their occupation were slightly more
engaged in the workplace, and those in a union were slightly more favorable to their
organization’s PA process. Full demographic data can be found in Table 6.
In addition to demographic data, participants were asked about how the PA
process is administered in their places of employment (see Table 7). The majority
(58.3%) stated that the frequency of their PAs was annual. 8.7% of survey respondents

55
Table 6. Frequencies of Demographic Variables Demographic n %
Gender Male 210 48.2 Female 226 51.8
Age < 17 0 0.0 18-20 4 0.9 21-29 57 13.1 30-39 102 23.4 40-49 88 20.2 50-59 123 28.2 > 60 62 14.2
Race Caucasian/White 345 79.1 Asian 31 7.1 Black 27 6.2 Hispanic or Latino 18 4.1 American Indian or Alaskan Native 3 0.7 Native Hawaiian or other Pacific Islander 1 0.2 From multiple races 9 2.1 Other 2 0.5
Education No Formal Education 1 0.2 Some High School 3 0.9 High School 81 18.6 Associate’s 67 15.4 Bachelor’s 176 40.4 Master’s 87 20.0 Doctorate 21 4.8
Length with Current Employer < 6 months 19 4.4 6 – 12 months 27 6.2 1 – 2 years 47 10.8 2 – 5 years 103 23.6 6 – 10 years 93 21.3 > 10 years 147 33.7
Employment Status Full-Time 382 87.6 Part-Time 54 12.4
Country of Employment United States 432 99.1 Other 4 0.9
Organization Size 0 – 25 41 9.4 26 – 100 50 11.5 101 – 500 96 22.0 501 – 1,000 61 14.0 1,001 – 5,000 80 18.3 > 5,000 108 24.8
Organization Type Private 207 47.5 Public 170 39.0 Non-Profit 53 12.2 (continued)

56
Table 6 (Continued) Demographic n %
Other 6 1.4 Industry
Agriculture, Forestry, and Fishing and Hunting 3 0.7 Arts, Entertainment, and Recreation 6 1.4 Construction 11 2.5 Educational Services 73 16.7 Finance and Insurance 34 7.8 Health Care and Social Assistance 57 13.1 Hospitality 14 3.2 Management of Companies and Enterprises 5 1.1 Manufacturing 32 7.3 Mining, Quarrying, and Oil and Gas Extraction 3 0.7 Professional, Scientific, and Technical Services 36 8.3 Public Administration 11 2.5 Real Estate and Rental and Leasing 3 0.7 Retail 39 8.9 Transportation and Warehousing 12 2.8 Utilities 5 1.1 Wholesale Trade 3 0.7 Other 89 20.4
Occupation Management, professional, and related 206 47.2 Service 51 11.7 Sales and office 35 8.0 Farming, fishing, and forestry 1 0.2 Construction, extraction, and maintenance 13 3.0 Production, transportation, and material moving 16 3.7 Government 26 6.0 Other 88 20.2
Organized Labor Union Member 74 17.0 Non-Union Member 362 83.0
Note. Percentages may not sum to 100 due to rounding.
noted that it had been over a year since their last PA, with 4.8% noting it been more than
18 months since their last appraisal, suggesting possible organizational issues with the
timely administration of the PA process. A third of the respondents (33.7%) noted they
completed PAs for others. These respondents had statistically more positive reactions to
the PA process than did those who were on the receiving end of the PA, presumably
because they better understood the process and the rationale for its existence. 87.2%
reported that their PA contained some sort of summary rating, and 65.8% said that PA

57
ratings were used to determine salary or other employment actions, highlighting the
significance of the PA process to employees and employers alike. Of the 87.2% who
received a summary rating, 24.8% said they were unsure if ratings were used to rank
employees, and 28.4% said they were unsure if ratings were used to create a forced
distribution of employees. This lack of knowledge may suggest that there is a lack of
understanding regarding the PA process’ utility, as well as potential, for a lack of trust in
the process. As shown in Table 8, those who were unsure if their individual PA ratings
were being used to rank them against fellow employees had less favorable perceptions of
the PA process and were less engaged in the workplace. 75.6% of respondents stated that
they received an equivalent of “exceeds expectations” or “exceptional” on their last PA
rating. This higher than expected statistic would suggest that respondents were inflating
their ratings, were not representative of the general population, or were subject to
supervisor rating inflation, a noted phenomenon that occurs by supervisors to preserve
manager-employee relationships and foster worker productivity (Pulakos & O’Leary,
2011). Complete PA administration data can be found in Table 7.
PA characteristics were analyzed to determine if any characteristic of the PA
process had a significant impact on individuals’ reactions to the PA process and/or their
engagement in the workplace. Differences between group means for all characteristics
were found to be significant (p < .05) for at least one of these variables (see Table 8).
Key findings from this analysis are as follows:
• PA frequency – Those individuals who received PAs four or more times a year
showed a markedly higher level of satisfaction with their organization’s PA
process and were more engaged in the workplace.
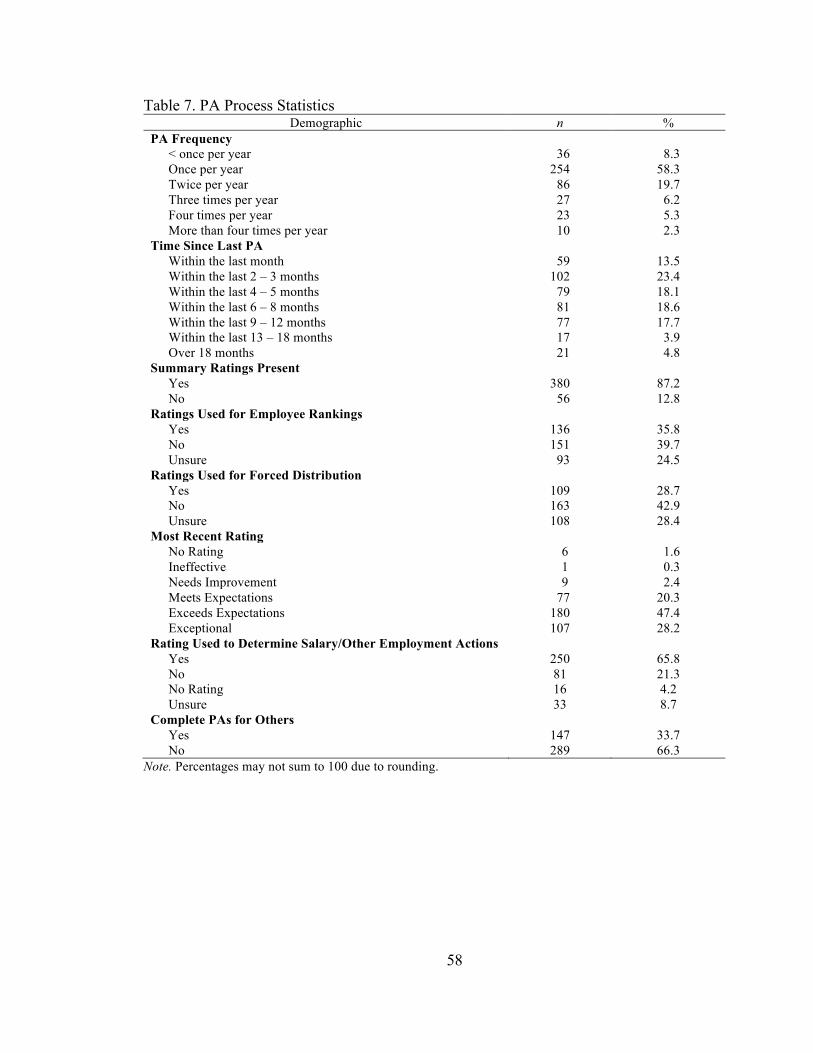
58
Table 7. PA Process Statistics Demographic n %
PA Frequency < once per year 36 8.3 Once per year 254 58.3 Twice per year 86 19.7 Three times per year 27 6.2 Four times per year 23 5.3 More than four times per year 10 2.3
Time Since Last PA Within the last month 59 13.5 Within the last 2 – 3 months 102 23.4 Within the last 4 – 5 months 79 18.1 Within the last 6 – 8 months 81 18.6 Within the last 9 – 12 months 77 17.7 Within the last 13 – 18 months 17 3.9 Over 18 months 21 4.8
Summary Ratings Present Yes 380 87.2 No 56 12.8
Ratings Used for Employee Rankings Yes 136 35.8 No 151 39.7 Unsure 93 24.5
Ratings Used for Forced Distribution Yes 109 28.7 No 163 42.9 Unsure 108 28.4
Most Recent Rating No Rating 6 1.6 Ineffective 1 0.3 Needs Improvement 9 2.4 Meets Expectations 77 20.3 Exceeds Expectations 180 47.4 Exceptional 107 28.2
Rating Used to Determine Salary/Other Employment Actions Yes 250 65.8 No 81 21.3 No Rating 16 4.2 Unsure 33 8.7
Complete PAs for Others Yes 147 33.7 No 289 66.3
Note. Percentages may not sum to 100 due to rounding.

59
Table 8. PA Reaction/Engagement Means for PA Characteristics Demographic n PA
Reactions Employee
Engagement PA Frequency < 1 per year 36 4.90 4.28 Once per year 254 4.65 4.24 Twice per year 86 4.89 4.16 Three times per year 27 5.23 4.19 Four times per year 23 5.48 4.60 More than four times per year 10 5.48 4.70 Time since last PA < 1 month 59 5.22 4.43– 2 – 3 months 102 5.07 4.34– 4 – 5 months 79 4.69 4.10– 6 – 8 months 81 4.65 4.20– 9 – 12 months 77 4.47 4.22– 13 – 18 months 17 4.75 4.42– > 18 months 21 4.86 4.13– PA included a rating Yes 380 4.90 4.29 No 56 4.26 3.98 Ratings used to rank employees Yes 136 5.21 4.37 No 151 4.77 4.31 Unsure 93 4.63 4.15 Ratings used for forced distribution Yes 109 5.06 4.30– No 163 4.94 4.31– Unsure 108 4.66 4.25– Last PA rating* Needs Improvement 9 4.46 3.66 Meets Expectations 77 4.03 3.94 Exceeds Expectations 180 4.98 4.30 Exceptional 107 5.41 4.61 Ratings used to determine salary Yes 250 5.03 4.30– No 81 4.67 4.27– Received no rating 16 4.35 4.12– Unsure 33 4.67 4.34– Appraise Others Yes 147 5.15 4.36 No 289 4.64 4.20 Entire Sample 436 4.81 4.25 – ANOVA analysis indicated no significant difference in the combined mean and the PA characteristic. *The PA rating “ineffective” was not listed given there was only 1 respondent in this category.
• Time since last PA – Those individuals who had a PA within the last month
tended to view the process more favorably.
• PAs included a rating – Those employees whose PA process included some sort
of rating were more favorable towards their organization’s PA process and were
more engaged in the workplace.

60
• Ratings used for rankings/forced distribution – Those individuals whose ratings
were used to rank employees or were used in a forced distribution tended to view
the PA process more favorably, and those who were part of a ranking also
reported being more engaged in the workplace than those who were not ranked.
This result was unexpected and incongruent with previous literature. One
possible explanation for this phenomenon is that the ratings for this sample were
negatively skewed with 75.6% of the recipients recording that they received a
rating equivalent to “exceeds expectations” or higher.
• Last PA rating – Respondents who received a higher PA rating in their last
evaluation demonstrated higher levels of PA satisfaction and workplace
engagement.
• PA rating used to determine salary or other employment action – When PA
ratings were used to determine salary or inform other employment decisions,
employees tended to view the PA process more favorably. This result was also
unexpected and may again be attributable to the higher ratings received by
respondents in this survey.
• Appraise others – Those respondents who were also responsible for appraising
others were markedly more favorable to the PA process and more engaged in the
workplace. As noted earlier, the higher levels of PA satisfaction and engagement
may be attributed to a better understanding of the PA process and the rationale for
its existence.

61
Assumption Testing
Data were tested for normality by examining normal Q-Q plots for all variables
and by examining skewness and kurtosis metrics. There were no substantial deviations
from normality observed in the Q-Q plots, and similarly, skewness (g1) and kurtosis (g2)
metrics were within the established guidelines of |g1| < 3 and |g2| < 10 as noted by Kline
(2016). There was, however, evidence of multivariate kurtosis in the sample via
Mardia’s test, but Kline (2016) notes that such tests have limited utility, especially in
larger samples.
The data were also examined for homoscedasticity using Bartlett’s test of
sphericity and for sampling adequacy using Kaiser-Meyer-Olkin (KMO) measure.
Results found p < .001 for sphericity and KMO = .962 and therefore were suitable for
factor analysis (Brown & Onsman, 2013).
Data Reliability
Descriptive statistics for each of the first-order latent variables in the study are
presented in Table 9. As expected, and in accordance with Keeping and Levy’s (2000)
original study, the correlations between PA reaction variables were quite high, suggesting
respondent attitudes about one area of the PA process may influence or be
indistinguishable from other areas of the process. The correlation between distributive
justice and perceived accuracy was particularly high (.903), suggesting multicollinearity
between these two constructs (Tabachnick & Fidell, 2007). These constructs in Keeping
and Levy’s (2000) original were correlated at .88.

62
Table 9. Descriptive Statistics and Variable Correlations Construct M SD 1 2 3 4 5 6 7 8 9 10 11
1. Session Sat 4.97 1.20 – 2. System Sat 4.45 1.40 .764 – 3. Perceived Utility 2.61 0.96 .598 .774 – 4. Perceived Accuracy 5.41 1.51 .780 .755 .610 – 5. Procedural Justice 5.49 1.57 .785 .814 .664 .845 – 6. Distributive Justice 5.61 1.53 .784 .758 .602 .903 .860 – 7. PA Reactions* 4.81 1.25 .866 .887 .756 .944 .936 .937 – 8. Emotional Engagement 4.14 0.88 .515 .542 .471 .496 .516 .462 .552 – 9. Cognitive Engagement 4.25 0.67 .347 .350 .250 .343 .348 .284 .358 .610 – 10. Physical Engagement 4.33 0.70 .314 .294 .259 .319 .307 .251 .325 .613 .798 – 11. Employee Engagement* 4.25 0.67 .456 .462 .383 .448 .454 .388 .479 .863 .894 .893 – *indicates a second-order construct; p < 0.01 for all items.
To determine the reliability of the constructs used in the study, Cronbach’s alpha
coefficients were examined. The Cronbach’s alpha coefficients ranged from 0.92 to 0.98,
well within Bryman and Bell’s (2011) recommended value of α > .7, demonstrating
adequate reliability. Three items from the perceived accuracy construct were removed
due to poor inter-item correlations and poor factor loadings. This raised the α coefficient
for the perceived accuracy construct from .93 to .97. Table 10 lists the Cronbach’s alpha
values for each of the study’s latent constructs.
Table 10. Cronbach’s Alpha Values for Latent Constructs Construct Standardized α # of items
Emotional Engagement .945 6 Cognitive Engagement .920 6 Physical Engagement .916 6 Employee Engagement .956 18 PA Session Sat .930 3 PA System Sat .941 3 PA Perf Utility .936 4 PA Accuracy* .967 6 PA Justice .977 4 PA Distributive Justice .969 4 PA Reactions .978 27 *Three items were removed from this construct due to poor inter-item correlations (see Appendix A).

63
Power for the model was deemed sufficient, via Dr. Soper’s statistical SEM
calculator (http://www.danielsoper.com/statcalc3/calc.aspx?id=89#), to proceed with a
structural equation modeling analysis. With 436 respondents, a power level of .9 would
be attained for detecting an effect size as small as 0.23 for the models in this study.
Measurement Model Analysis
To determine the model fit and the validity of the latent constructs used in the
model, a confirmatory factor analysis (CFA) was performed, using the software package
IBM® SPSS® AMOS 23.0.0, to analyze the measurement model (see Figure 5).
Goodness of fit indices of the measurement model, listed in Table 11, were all well
within acceptable parameters indicating a good model fit. Z values ranged from 15.903
to 45.578 and factor loadings for the model ranged from .741 to .961 (see Table 12),
confirming the existence of a relationship between an indicator item and its latent
construct (Groenland & Stalpers, 2012).
Table 11. CFA Measurement Model Fit Indices Model Fit Indices χ2 p df χ2/df TLI CFI RMSEA Measurement Model 2221.387 < .001 784 2.833 0.930 0.936 0.065 Values indicating a good model fit: significant χ2; TLI > 0.9; CFI > 0.9; RMSEA < .08 (Groenland & Stalpers, 2012).
To ascertain further the validity of the constructs used in the model, convergent
validity, divergent validity, and composite reliability (CR) values were calculated (see
Table 13). The results indicated the existence of composite reliability and convergent
validity but suggested minor issues with divergent validity for the perceived accuracy,
cognitive engagement, and physical engagement constructs. The high correlations
between perceived accuracy, procedural justice, and distributive justice further suggested

64
Table 12. Factor Loadings for Latent Constructs Construct Item Factor Loading
Emotional Engagement EE1(Enthusiasm) 0.878 EE2(Energy) 0.854 EE3(Interest) 0.847 EE4(Pride) 0.826 EE5(Positive Feeling) 0.869 EE6(Excitement) 0.886 Cognitive Engagement CE1(Focus) 0.751 CE2(Attentiveness) 0.837 CE3(Focused & Attentive) 0.882 CE4(Absorbed) 0.741 CE5(Concentration) 0.845 CE6(Attention) 0.826 Physical Engagement PE1(Intensity) 0.791 PE2(Energy) 0.850 PE3(Effort) 0.850 PE4(Performance) 0.773 PE5(Completeness) 0.790 PE6(Energy) 0.774 Employee Engagement* Emotional Engagement 0.720 Cognitive Engagement 0.922 Physical Engagement 0.924 PA System Satisfaction SYS1(Good Indicator) 0.939 SYS2(Excellent System) 0.931 SYS3(Unbiased) 0.886 PA Session Satisfaction SS1(Satisfied) 0.914 SS2(Feel Good) 0.940 SS3(Effective) 0.861 PA Perceived Utility PU1(Helped Me Learn) 0.892 PU2(Learned A Lot) 0.892 PU3(Understand My Mistakes) 0.901 PU4(Expectations) 0.864 PA Perceived Accuracy PA1(Accurate Feedback) 0.890 PA2(Correct Feedback) 0.915 PA3(Consistent) 0.895 PA4(Accuracy) 0.900 PA5(Evaluation Alignment) 0.922 PA6(True Reflection) 0.940 PA Procedural Justice PJ1(Fair Procedures) 0.960 PJ2(Fair Processes) 0.957 PJ3(Appropriate Procedures) 0.961 PJ4(Appropriate Processes) 0.945 PA Distributive Justice DJ1(Fairness) 0.931 DJ2(Rating Agreement) 0.946 DJ3(Manager Agreement) 0.953 DJ4(Fair Representation) 0.937 PA Reactions* PA System Satisfaction 0.878 PA Session Satisfaction 0.874 PA Perceived Utility 0.718 PA Perceived Accuracy 0.943 PA Procedural Justice 0.935 PA Distributive Justice 0.945 *indicates a second-order construct; p < 0.001 for all items.

65
Table 13. Construct Validity Measurements Construct AVE MSV CR
Emotional Engagement 0.740 0.428 0.945 Cognitive Engagement 0.662 0.745 0.921 Physical Engagement 0.649 0.745 0.917 PA Session Sat 0.859 0.669 0.924 PA System Sat 0.844 0.714 0.942 PA Utility 0.787 0.663 0.937 PA Accuracy 0.829 0.867 0.967 PA Procedural Justice 0.913 0.774 0.977 PA Distributive Justice 0.887 0.867 0.969 Threshold validity values: AVE > 0.5; MSV < AVE; CR > 0.7 (Hair, Black, Babin, & Anderson, 2010)
that respondent attitudes about one area of the PA process may influence, or are
indistinguishable from, other areas of the process. Similarly, the subtle differences
between cognitive and physical engagement may be blurred in the minds of respondents.
These high correlations, however, were not deemed to be detrimental when evaluating the
theoretical model given that all the variables loaded well on their second-order
constructs. The lack of divergent validity among the first-order factors of PA reaction,
however, may help to explain the poorer fit of the alternative model that examines the
direct relationship between these factors and employee engagement.
Theoretical Structural Model Analysis
An analysis of the theoretical model (see Figure 1) and the alternative model (see
Figure 2) were completed after the analysis of the measurement model. The results of
this analysis are noted in Table 14.
Table 14. Theoretical Model and Alternative Model Fit Indices Model Fit Indices χ2 p df χ2/df TLI CFI RMSEA Theoretical Model 2543.069 < .001 810 3.140 0.918 0.923 0.070 Alternative Model 5051.507 < .001 811 6.229 0.800 0.812 0.110 Values indicating a good model fit: significant χ2; TLI > 0.9; CFI > 0.9; RMSEA < .08 (Groenland & Stalpers, 2012).

66
All the indices for the theoretical model (H1) indicated a good model fit, while
conversely, the indices for the alternative model (H1a1) indicated a poorer fit. A chi-
square difference test performed between the competing models found that χ2diff (df = 1, n
= 436) = 2508.4 (p < .001). Evaluation of the study’s hypotheses based on these findings
are as follows:
H1: There is a positive relationship between employees’ reactions to their
performance appraisal process and employee engagement.
The theoretical model for H1 (see Figure 6) illustrates the strong factor loadings
for the PA reactions construct with loadings ranging from .72 to .95 at a significance
level of p < .001. Similarly, the loadings for the employee engagement construct were
strong, ranging from .72 to .92 at a significance level of p < .001. The relationship
between PA reactions and employee engagement was shown to be positive and
Figure 6. Structural Relationships of the Theorized Model
p < .001 for all relationships

67
significant with β = 0.43 (β = 0.27 - unstandardized), SE = .033, Z = 8.183, and p <.001.
Thus, the first hypothesis purporting a positive relationship between PA reactions and
employee engagement was accepted.
H1a1: System satisfaction, session satisfaction, perceived utility, perceived
accuracy, procedural justice, and distributive justice predict employee engagement.
The suggested alternative model for the study did not hold up to statistical
scrutiny with TLI, CFI, and RMSEA all being outside the norms of a good model fit.
Additionally, the modification indices between the disturbance terms of the independent
variables were extremely high, ranging from 135 to 352, further suggesting that
respondent attitudes about one area of the PA process may influence, or be
indistinguishable from, other areas of the process. Thus, this alternative hypothesis,
theorizing a relationship between the first-order factors of PA reactions and employee
engagement, was rejected.
A summary of the significant findings of the analyzed data included: 1) a
significant, positive relationship between PA reactions and employee engagement, 2)
high correlations among Keeping and Levy’s (2000) PA reaction first-order factors, 3)
PA ratings being significantly correlated with PA reactions and employee engagement,
and 4) a significant correlation between PA frequency and employee engagement. The
implications of these findings are further discussed in chapter five.
Chapter Summary
This fourth chapter describes the data collected from the study. Four hundred
sixty-six surveys were collected via snowball sampling and a Qualtrics online research
panel. Twenty-three surveys were eliminated in the data screening process leaving 436

68
surveys deemed acceptable for analysis. Of the 436 qualified surveys, 51.8% were
completed by females, 79.1% were Caucasian, and 65.2% had a bachelor’s or higher
degree. Per recent BLS statistics, Caucasians, those with bachelor’s or higher degrees,
those whose occupations were management or professionals, and those belonging to a
union were over-sampled in the survey. This deviation from the general population,
however, did not significantly alter individual perceptions of their organization’s PA
process or affect engagement in the workplace.
To the contrary, PA administration did affect individual perceptions of the PA
process and workplace engagement. 87.2% reported that their PA contained some sort of
summary rating, and those receiving a higher PA rating reported to be more engaged in
the workplace.
Assumption testing indicated that the data were univariate normal, but not on a
multivariate level. Minor issues with multicollinearity were also found to be present with
Keeping and Levy’s (2000) model. Cronbach’s alpha and factor loadings were strong for
all latent variables, indicating strong validity and reliability among the study’s
constructs.
Analysis of the measurement model did reveal issues of divergent validity among
three of the study’s variables. A structural analysis of the study’s theoretical model and
the alternative model found the theoretical model (H1) to be a good fit, while conversely
the alternative model (H1a1) was deemed to be a poorer fit. As such, H1, purporting a
positive relationship between PA reactions and employee engagement, was accepted, and
H1a1, theorizing a relationship between the first-order factors of PA reactions and
employee engagement, was rejected. Significant findings from the analysis of the data

69
included: 1) a significant, positive relationship between PA reactions and employee
engagement, 2) high correlations among Keeping and Levy’s (2000) PA reaction first-
order factors, 3) PA ratings were significantly correlated with PA reactions and employee
engagement, and 4) there is a significant correlation between PA frequency and employee
engagement.

70
Chapter Five – Discussion
Introduction
This fifth chapter examines the findings of the study and is divided into five
sections: 1) a summary of the study, 2) implications of the study, 3) limitations, 4) areas
for future research, and 5) a summary of the chapter.
Study Summary
This study examines the long-standing debate among scholars and practitioners
regarding the effectiveness of the performance appraisal (PA) process as a useful tool to
manage individual and organizational performance (Glover, 1996; Gruman & Saks, 2011;
Kondrasuk, 2012; Light, 2010; Pulakos & O’Leary, 2011; Thomas & Bretz, 1994). To
further this discussion, this study examines the relationship between employees’ reactions
to the PA process, using the Keeping and Levy (2000) PA reactions construct and their
perceptions of their engagement in the workplace using Rich et al.’s (2000) construct. It
is theorized that:
H1: There is a positive relationship between employees’ reactions to their
performance appraisal process and employee engagement (see Figure 1), and
H1a1: System satisfaction, session satisfaction, perceived utility, perceived
accuracy, procedural justice, and distributive justice predict employee engagement (see
Figure 2).
If confirmed, these hypotheses would provide empirical evidence supporting the
widespread claims of a relationship between reactions to the PA process and employee
organizational attitudes that, in turn, affect job performance (Bouskila-Yam & Kluger,

71
2011; Budworth & Mann, 2011; DeNisi & Pritchard, 2006; Gruman & Saks, 2011;
Kondrasuk, 2012; Kruse, 2012; Spence & Keeping, 2010).
To test the proposed hypotheses, 466 respondents were surveyed and structural
equation modeling was used to analyze the gathered data. Results confirm the study’s
primary hypothesis asserting a positive relationship between PA reactions and employee
engagement, but reject its alternative hypothesis theorizing a positive relationship
between the first-order factors of Keeping and Levy’s (2000) PA reactions construct and
employee engagement. Other significant findings include: 1) high correlations among
Keeping and Levy’s (2000) PA reaction first-order factors, 2) a significant correlation
between PA ratings and employee engagement, and 3) a significant correlation between
PA frequency and employee engagement.
Implications
Given this study is cross-sectional, inferences to causality are limited.
Nevertheless, when the findings of the study are examined in conjunction with the
qualitative data from earlier literature, causality between PA reactions and employee
engagement is suspected. The implications of this suspected causality and other findings
of the study include: 1) the effectiveness of an organization’s PA process will affect
employee engagement; 2) the ambiguity between the components of the PA process
complicates an organization’s ability to master the entire process; 3) lower PA ratings
will negatively affect employee engagement; 4) frequent feedback will enhance employee
engagement; and 5) alternatives to the annual PA process should be considered to
enhance employee engagement.

72
PA process-employee engagement relationship. The significant positive
relationship between PA reactions and employee engagement suggests an organization’s
ability to create, implement, and manage its PA process will affect its employees’
engagement in the workplace. Given the connection between employee engagement and
organizational outcomes, it becomes apparent that successful management of the PA
process is of paramount importance, ultimately affecting an organization’s ability to
compete in the marketplace. Despite its importance, however, the PA process has been
receiving consistently poor marks in the marketplace. Consider Deloitte Consulting’s
(2014) report that 58% of HR executives assessed their PA process as a waste of time, or
Cornerstone OnDemand (2013) who noted that only 47% of U.S. employees felt that PA
feedback was fair and accurate, or Wilkie (2015) who reported that 95% of managers are
dissatisfied with the PA systems, and that 59% of employees do not feel that PAs are
worth the time. These statistics indicate that U.S. organizations have yet to master the
PA process at the peril of impacting employee engagement and ultimately organizational
performance. Also troubling are the complexity and the interrelationships between the
components of the PA process, which complicate an organization’s ability to master the
process.
Ambiguity between PA process components. A second implication of the
study’s findings is that the ambiguity between the components of the PA process
complicates an organization’s ability to master the entire process. Results from this study
found that participants tend to view the PA process largely as a single entity, versus
individual distinguishable components. Apart from perceived utility, all the factors of
Keeping and Levy’s (2000) PA construct correlated at levels between .755 to .903,

73
indicating the lack of differentiation between the first-order constructs. Divergent
validity measures further confirm this conclusion. A subsequent exploratory factor
analysis (EFA) of the 24 items used in Keeping and Levy’s (2000) original study reveal
that a two-factor solution is preferable to the six-factor solution presented in the original
study (see Table 15). These findings indicate that respondent attitudes about one area of
the PA process may influence, or are indistinguishable from, other areas of the process.
Table 15. PA Reactions Exploratory Factor Analysis Keeping & Levy (2000) Item Factor 1 Factor 2 PA_5 - The feedback was consistent with how I felt I performed 0.990 -0.14 DJ_2 - I agree with my final rating 0.972 -0.07 PA_10 - My manager's evaluation reflected my true performance 0.965 -0.051 PA_9 - My manager's evaluation of my work matched my own evaluation 0.963 -0.076 PA_4 - I believe the feedback was correct 0.938 -0.037 DJ_4 - I agree with the way my manager rated my performance 0.935 -0.016 DJ_6 - The performance review fairly represented my past year’s performance 0.927 -0.021 PA_7 - My manager accurately judged my performance 0.919 -0.038 PA_1 - The feedback was an accurate evaluation of my performance 0.827 0.094 DJ_1 - The performance appraisal was fair 0.819 0.153 SS_1 - I felt quite satisfied with my last appraisal discussion 0.703 0.177 PJ_1 - The procedures used to evaluate my performance were fair 0.647 0.339 PJ_2 - The process used to evaluate my performance was fair 0.645 0.338 PJ_3 - The procedures used to evaluate my performance were appropriate 0.620 0.372 PJ_4 - The process used to evaluate my performance was appropriate 0.606 0.37 SS_2 - I feel good about the way the last appraisal discussion was conducted 0.556 0.313 SS_3 - My manager conducts a very effective appraisal discussion with me 0.412 0.455 SYS_1 - The performance appraisal system does a good job of indicating... 0.321 0.654 SYS_4 - The appraisal system provides a fair and unbiased measure of the level... 0.219 0.726 SYS_2 - In general, I feel the company has an excellent performance appraisal... 0.178 0.781 PU_4 - I have a clearer idea of what my manager expects from me because... 0.063 0.781 PU_1 - The performance appraisal helped me learn how I can do my job better -0.026 0.854 PU_3 - The performance appraisal helped me understand my mistakes -0.071 0.865 PU_2 - I learned a lot from the performance appraisal -0.083 0.874 Extraction Method: Principal Components; Covariance Matrix; Direct Oblimin Rotation; Based on Eigenvalues > 1.
This lack of distinctiveness is problematic given that scholars and practitioners alike have
cited numerous concerns with multiple components of the PA process, including the lack
of credible objectives, supervisors who are too busy to observe and provide valid
feedback for their employees, and the inability of supervisors to provide constructive

74
criticism to their employees. Given the complexity of the PA process, the task of
mastering all the process components simultaneously is daunting. Of particular concern
are the commonly cited issues of rater bias. Is it realistic to expect that human biases can
be eliminated from the PA process to the point where employees view the process as fair
and feel their PA ratings are warranted? It seems unlikely.
PA ratings affect employee engagement. A third implication of the study’s
findings is that the ratings given by supervisors affect employees’ level of engagement in
the workplace. Analyzed data show there to be a statistical difference in PA reactions
and employee engagement depending upon the presence and ordinal value of PA ratings.
Those individuals who received PA ratings were shown to view the PA process more
favorably and to be more engaged in the workplace than those who did not. The
implication is that if an organization is going to go through the trouble of having a PA
process, then the employees expect some sort of concrete feedback to let them know
where they stand within the organization.
The conundrum, however, is that not only do employees want to receive a PA
rating, they desire to have a high rating. Employees who received a rating equivalent to
“needs improvement” had an average employee engagement value of 3.66, whereas
employees whose rating was equivalent to “exceptional” had an average engagement
value of 4.61. This is problematic for organizational leaders who use employee ratings to
determine an employee’s salary (65.8% in this study) as higher ratings equate to higher
salary expenditures for the organization. Yet, if higher ratings are withheld to manage
compensation expenses, employee engagement and ultimately worker productivity are
negatively impacted. This would also suggest that regardless of how sound the

75
organization’s PA process is, the employee’s final rating may ultimately affect how they
feel about the PA process.
Interestingly enough, the employees who were most dissatisfied with the PA
process were those with a PA rating equivalent to “meets expectations”, even more so
than employees with a PA rating equivalent to “needs improvement”. It may be the case
that employees feel slighted when, in their minds, they have been doing “A” work but
receive a “C” from their leaders, whom they might also perceive to be intentionally
withholding higher ratings to avoid paying higher wages.
One could argue that it is not PA ratings that affect PA reactions or employee
engagement, but rather it is employees’ engagement in the workplace that affect their
view of the PA process and the ratings that they receive from their managers. While the
data from this study cannot disprove this notion, nomologically, organizational justice
and leader-member exchange (LMX) research would not support such a conclusion.
Organizational justice theory states that employees’ perceptions of justice are based on 1)
the equity between effort and rewards, 2) the fairness of organizational processes, and 3)
the integrity of those administering organizational processes, and that these perceptions
will affect employees’ engagement, and ultimately their performance, in the workplace
(Cohen-Charash & Spector, 2001; Dusterhoff et al., 2014; Erdogan et al., 2001; Saks,
2006; Thurston & McNall, 2010). Therefore, in congruence with organizational justice
theory, it is the fairness of the PA process, and those administering the process, that will
affect employees’ attitudes and workplace productivity versus their internal attitudes and
productivity affecting their perceptions of organizational justice.

76
Similarly, LMX theory states that there is a social reciprocity among leaders and
their subordinates that significantly determines employee attitudes and effectiveness in
the workplace (Gerstner & Day, 1997; Shweta & Srirang, 2013). This reciprocity is
influenced by affect, loyalty, contribution, and professional respect (Shweta & Srirang,
2013). As such, we can deduce from LMX theory that it is the employees’ perceptions of
their relationship with their leaders and the integrity of these leaders in administering the
PA process that affects their engagement in the workplace versus the employees’
engagement levels affecting leadership relationships and leadership integrity.
Frequent feedback will result in higher employee engagement. A fourth
implication of the study’s findings is that more frequent feedback will lead to higher
levels of engagement in the workplace. Findings indicate a significant difference in
engagement between those individuals who receive PAs four or more times a year versus
those who received PAs three times or fewer per year. This suggests that frequent
performance feedback is of higher value when it is timely and relevant. It also implies
that leaders, charged with evaluating employee performance, should be providing
employees with meaningful feedback at least quarterly. Unfortunately, per the survey’s
findings, only 8% of organizations are doing so. Why is this the case? One possible
reason is that, as Kondrasuk (2012) points out, the annual appraisal, used by 58% of
organizations in this study, is enabling delayed feedback, especially for leaders who are
non-confrontational by nature, requiring them to provide feedback to employees only
once a year. This would imply that the annual PA process, designed to improve worker
productivity, might actually impede productivity.
77
Alternatives to the PA process. Given the positive relationship between PA
reactions and employee engagement and the widespread poor assessment of the process
by managers and employees alike, perhaps it is time to examine alternatives to the PA
process. One such alternative is the implementation of coaching behaviors whereby
leaders develop meaningful relationships with their employees, providing frequent,
timely, and positive feedback centered around the accomplishment of individual goals
and organizational objectives (Bouskila-Yam & Kluger, 2011; Ford et al., 2011; Gilley &
Boughton, 1996; Janove, 2011; Kruse, 2012; Pulakos & O'Leary, 2011; Stalinski &
Downey, 2012). It should be emphasized that this sort of approach does not support
leaders’ ignoring poor performance but rather requires that leaders provide constructive
criticism and, in some cases, take disciplinary action in a timely manner. According to
Bersin (2015), managers should begin to focus on performance coaching versus
evaluation and on employee development with monthly or even weekly feedback
meetings. A model for this alternative type of approach to employee management is
found in Gilley and Boughton’s (1996) work (see Figure 7). Some organizations like
Adobe, Accenture, Microsoft, Netflix, and General Electric have taken significant steps
towards this coaching model, abandoning the traditional PA process altogether. Since its
abandonment of the PA process, Adobe has reported a 30% reduction in voluntary
turnover (Deloitte Consulting, 2014; Wilkie, 2015).
Some may fear this type of approach, believing that the elimination of PA ratings
would limit an organization’s ability to effectively administer compensation. This,
however, need not be the case. Instead of using an employee’s PA rating as the basis for
a salary evaluation, organizations could instead focus their attention on an individual’s

78
current market value and actions that employees could be taking (e.g., increasing
productivity, proficiency, responsibility, etc.) to improve their marketability. By doing
this, conversations with employees could change from being backward-looking,
confrontational, demotivating evaluations to forward-looking, motivational,
developmental conversations. The qualitative and quantitative empirical evidence linking
PA reactions to employee engagement suggests that it is time to examine better and less
costly alternatives to the PA process for managing human talent.
Limitations
Limitations of the study include the use of cross-sectional, self-reported data
gathered via a non-probability sample that contain a large percentage of professional
(47.2%), Caucasian (79.1%), and highly educated (65.2%) workers. Furthermore, data
analysis indicates some issues of multicollinearity and multivariate non-normality. As
Figure 7. Performance Coaching Process Model (Gilley & Boughton, 1996, p. 31). Used with Permission from McGraw-Hill Publishing.

79
such, inferences of causality are limited, co-variances between PA reactions and
employee engagement may be inflated, and reliability of the data cannot be guaranteed
(Bono & McNamara, 2011; Kline, 2016; Podsakoff et al., 2003). It should be noted,
however, the findings of the study, linking PA reactions to employee engagement, are
consistent with existing literature including Brown et al.’s (2010) PA quality-
performance study and Volpone et al.’s (2012) PA reactions-engagement study.
Future Research
Given the limited empirical research examining the relationship between the PA
process and employee engagement, it is suggested that further research be done to
validate the correlation between these two second-order constructs using different data
and different methodologies. Future areas of research include: 1) confirmation of the
reliability of this study, 2) exploration of other PA reaction constructs, 3) further
examination of the relationship between PA ratings and employee engagement, 4)
investigation of the high percentage of employees who have not received a PA within the
last year, and 5) examination of the relationship between coaching versus evaluation
approaches to talent management and employee engagement.
The first area of research recommended is the validation of this study’s findings
demonstrating a significant, positive relationship between PA reactions and employee
engagement. One such study could replicate this study’s design using a larger data
sample that is more racially diverse and contains a larger percentage of non-college
educated, blue-collar workers. Another possible study to validate this study’s findings
could be done by using data, other than self-reported data, to ascertain an employee’s PA
ratings and/or level of engagement within the workplace. These data, which could be

80
sourced from employees’ supervisors and/or employees’ performance documentation,
may normalize the negatively skewed PA ratings and engagement means reported in the
study. Finally, a third study could employ a longitudinal, experimental design where, in
Time 1, actions were taken to enhance PA reactions and, in Time 2, actions were taken to
lower PA reactions to determine whether these actions had any effect on employee
engagement. This third study would not only validate this study’s conclusion of a
relationship between PA reactions and employee engagement, but also determine
directional causality between the constructs.
A second area for further research is the examination of Keeping and Levy’s
(2000) PA reactions construct. This study, as well as the original study, demonstrates
high correlations between the first-order factors of the PA reactions construct to the point
where multicollinearity is suspected. It is recommended that alternatives to Keeping and
Levy’s (2000) PA reactions construct be explored. Possible alternatives include
combining factors from the Keeping and Levy (2000) study and possibly adding items
(e.g., PA rating, clear expectations, trust) from Brown et al.’s (2010) and Dusterhoeff et
al.’s (2014) studies to minimize multicollinearity concerns while strengthening the
integrity of the PA reactions construct.
A third area for further research is the examination of the relationship between PA
ratings and employee engagement. This study finds a significant correlation between
employees’ PA ratings and their level of engagement within the organization. It is
recommended that the strength of this relationship be further explored as well as possible
moderators to minimize the impact of lower PA ratings.

81
A fourth area for further research is investigation of the reasons behind why 3.9%
of survey respondents had not had a PA in the past twelve months and why 4.8% of
respondents had not had a PA in over 18 months. Are supervisors just too busy? Is there
no accountability for overdue evaluations? And why do those with overdue appraisals
respond more favorably to the PA process than others who have received their reviews
between 4 – 12 months?
Finally, it is suggested that the relationship between coaching versus evaluation
approaches to talent management and employee engagement be explored. One possible
approach would be to compare the engagement levels of employees in organizations that
have abandoned the traditional PA process (Adobe, Netflix, etc.) with those still using the
process. Another approach would be to do an experimental study of engagement changes
following a switch from the traditional PA process at Time 1 to Gilley and Boughton’s
(1996) talent management process (see Figure 7) at Time 2.
Chapter Summary
This fifth chapter provides an overview of the study, its findings, and the
implications of these findings, including employing alternatives to the traditional PA
process. Results support existing literature, finding that there 1) is a significant positive
relationship between PA reactions and employee engagement, 2) are high correlations
among Keeping and Levy’s (2000) PA reaction first-order factors, 3) is a significant
correlation between PA ratings and employee engagement, and 4) is a significant
correlation between PA frequency and employee engagement. The implications of these
findings suggest that an organization’s ability to create, implement, and manage its PA
process will affect employee engagement and ultimately organizational productivity.

82
Given the tendencies of employees to view the PA process en masse and given the
complexities of the PA process, it is suggested that a forward-looking developmental
process, similar to Gilley and Boughton’s (1996) model, be substituted for the traditional,
backward-looking PA process. Finally, limitations of the study are discussed along with
ideas for future research.

83
References
Allan, P. (1994). Designing and implementing an effective performance appraisal system.
Review of Business, 16(2), 3.
Anderson, J. C., & Gerbing, D. W. (1988). Structural equation modeling in practice: A
review and recommended two-step approach. Psychological Bulletin, 103(3),
411-423.
Bakker, A. B., & Bal, P. M. (2010). Weekly work engagement and performance: A study
among starting teachers. Journal of Occupational & Organizational Psychology,
83(Part 1), 189-206.
Baltar, F., & Brunet, I. (2012). Social research 2.0: Virtual snowball sampling method
using Facebook. Internet Research, 22(1), 57-74.
Banner, D. K., & Cooke, R. A. (1984). Ethical dilemmas in performance appraisal.
Journal of Business Ethics, 3(4), 327-333.
Bates, S. (2004). Getting engaged. HR Magazine, 49(2), 44-51.
Bentler, P. M., & Chou, C. (1987). Practical issues in structural modeling. Sociological
Methods & Research, 16(1), 78-117.
Bersin, J. (2015). Predictions for 2015, redesigning the organization for a rapidly
changing world. Deloitte Consulting LLP.
Bono, J. E., & McNamara, G. (2011). Publishing in AMJ – part 2: Research design.
Academy of Management Journal, 54(4), 657-660.
Bouskila-Yam, O., & Kluger, A. N. (2011). Strength-based performance appraisal and
goal setting. Human Resource Management Review, 21(2), 137-147.

84
Brown, M., & Benson, J. (2003). Rated to exhaustion? Reactions to performance
appraisal processes. Industrial Relations Journal, 34(1), 67-81.
Brown, M., Hyatt, D., & Benson, J. (2010). Consequences of the performance appraisal
experience. Personnel Review, 39(3), 375-396.
Brown, T., & Onsman, A. (2013). Exploratory factor analysis: A five-step guide for
novices. Australasian Journal of Paramedicine, 8(3), 1-14.
Bryman, A., & Bell, E. (2011). Business research methods. New York, NY: Oxford
University Press.
Buckingham, M., & Coffman, C. (1999). First, break all the rules: What the world’s
greatest managers do differently. New York, NY: Simon and Schuster.
Buckingham, M., & Vosburgh, R. M. (2001). The 21st century human resources
function: It's the talent, stupid! Human Resource Planning, 24(4), 17-23.
Budworth, M. H., & Mann, S. L. (2011). Introduction: Performance management: Where
do we go from here? Human Resource Management Review, 21(2), 81-84.
Byrne, B. M. (2010). Structural equation modeling with AMOS: Basic concepts,
applications, and programming. New York: Routledge.
Chattopadhayay, R., & Ghosh, A. K. (2012). Performance appraisal based on a forced
distribution system: Its drawbacks and remedies. International Journal of
Productivity & Performance Management, 61(8), 881-896.
Chaurasia, S., & Shukla, A. (2013). The influence of leader-member exchange relations
on employee engagement and work role performance. International Journal of
Organization Theory & Behavior, 16(4), 465-493.
85
Christian, M. S., Adela, A., & Jerel, J. (2011). Work engagement: A quantitative review
and test of its relations with task and contextual performance. Personnel
Psychology, 64(1), 89-136.
Cohen-Charash, Y., & Spector, P. E. (2001). The role of justice in organizations: A meta-
analysis. Organizational Behavior and Human Decision Processes, 86(2), 278-
321.
Colquitt, J. A. (2001). On the dimensionality of organizational justice: A construct
validation of a measure. Journal of Applied Psychology, 86(3), 386-400.
Cornerstone OnDemand. (2013). The Cornerstone OnDemand 2013 U.S. Employee
report. Retrieved from csod-rs-cornerstone-kelton-2013-employee-survey-
results.pdf.
Conway, J. M., & Lance, C. E. (2010). What reviewers should expect from authors
regarding common method bias in organizational research. Journal of Business
and Psychology, 25(3), 325-334.
Covey, S. (2004). Get ready for the 8th habit. Fortune, 150(11), 160-168.
Culbert, S. A. (2008). Get rid of the performance review! Wall Street Journal - Eastern
Edition, 94, R4.
Deloitte Consulting. (2014). Global human capital trends 2014. Engaging the 21st-
century workforce. Deloitte University Press.
DeNisi, A. S., & Pritchard, R. D. (2006). Performance appraisal, performance
management and improving individual performance: A motivational framework.
Management & Organization Review, 2(2), 253-277.

86
Dillman, D. A., Christian, L. M., & Smyth, J. D. (2014). Internet, phone, mail, and
mixed-mode surveys: The tailored design method. Hoboken: Wiley, 2014.
Dipboye, R. L., & de Pontbriand, R. (1981). Correlates of employee reactions to
performance appraisals and appraisal systems. Journal of Applied Psychology,
66(2), 248-251.
Dusterhoff, C., Cunningham, J., & MacGregor, J. (2014). The effects of performance
rating, leader-member exchange, perceived utility, and organizational justice on
performance appraisal satisfaction: Applying a moral judgment perspective.
Journal of Business Ethics, 119(2), 265-273.
Elicker, J. D., Levy, P. E., & Hall, R. J. (2006). The role of leader-member exchange in
the performance appraisal process. Journal of Management, 32(4), 531-551.
Erdogan, B. (2002). Antecedents and consequences of justice perceptions in performance
appraisals. Human Resource Management Review, 12(4), 555-578.
Fan, W., & Yan, Z. (2010). Factors affecting response rates of the web survey: A
systematic review. Computers in Human Behavior, 26(2), 132-139.
Ford, R. C., Latham, G. P., & Lennox, G. (2011). Mystery shoppers. Organizational
Dynamics, 40(3), 157-164. doi:10.1016/j.orgdyn.2011.04.002.
Gerstner, C. R., & Day, D. V. (1997). Meta-Analytic review of leader–member exchange
theory: Correlates and construct issues. Journal of Applied Psychology, 82(6),
827-844.
Ghosh, P., Rai, A., & Sinha, A. (2014). Organizational justice and employee engagement:
Exploring the linkage in public sector banks in India. Personnel Review, 43(4),
628-652.

87
Giles, W. F., & Mossholder, K. W. (1990). Employee reactions to contextual and session
components of performance appraisal. The Journal of Applied Psychology, 75(4),
371-377.
Gilley, A. M., & Drake, S. D. (2003). Performance management in the new millennium.
In A. Gilley, J. Callahan, & L. Bierema (Eds.), Critical Issues in HRD: New
Perspectives in Organizational Learning, Performance and Change (pp. 105-
122). Reading, MA: Perseus.
Gilley, J. W., & Boughton, N. W. (1996). Stop managing, start coaching!: How
performance coaching can enhance commitment and improve productivity. Irwin
Professional Pub.
Gilley, J. W., & Maycunich, A. (2000). Beyond the learning organization: Creating a
culture of continuous growth and development through state-of-the-art human
resource practices. New York, NY: Basic Books.
Glendinning, P. M. (2002). Performance management: Pariah or messiah? Public
Personnel Management, 31(2), 161-178.
Glover, R. B. (1996). Why are we ignoring performance appraisal research? Parks &
Recreation, 31(11), 24-27.
Greller, M. M. (1978). The nature of subordinate participation in the appraisal interview.
Academy of Management Journal, 21(4), 646-658.
Groenland, E. A., & Stalpers, J. (2012). Structural equation modeling: A verbal approach.
Nyenrode Research Paper, (12-02).
Grote, D. (1996). Complete Guide to Performance Appraisal.

88
Grote, D. (2000). Performance appraisal reappraised. Harvard Business Review, 78(1),
21.
Grote, R. C. (2002). Performance appraisal question and answer book: A survival guide
for managers. Amacom.
Gruman, J. A., & Saks, A. M. (2011). Performance management and employee
engagement. Human Resource Management Review, 21(2), 123-136.
Gupta, V., & Kumar, S. (2013). Impact of performance appraisal justice on employee
engagement: A study of Indian professionals. Employee Relations, 35(1), 61-78.
Hair, J. F., Black, W., Babin, B., & Anderson, R. (2010). Multivariate data analysis.
Upper Saddle River, NJ: Prentice Hall.
Halbesleben, J. R. (2010). A meta-analysis of work engagement: Relationships with
burnout, demands, resources, and consequences. Work engagement: A handbook
of essential theory and research, 8, 102-117.
Hantula, D. A. (2011). What performance management needs is a good theory: A
behavioral perspective. Industrial & Organizational Psychology, 4(2), 194-197.
Harter, J. K., Schmidt, F. L., & Hayes, T. L. (2002). Business-unit-level relationship
between employee satisfaction, employee engagement, and business outcomes: A
meta-analysis. Journal of Applied Psychology, 87(2), 268-279.
He, H., Zhu, W., & Zheng, X. (2014). Procedural justice and employee engagement:
Roles of organizational identification and moral identity centrality. Journal of
Business Ethics, 122(4), 681-695.

89
Heen, M. S., Lieberman, J. D., & Miethe, T. D. (2014). A comparison of different online
sampling approaches for generating national samples. Center for Crime and
Justice Policy, CCJP, 1.
Janove, J. (2011). Reviews--Good for anything? HR Magazine, 56(6), 121.
Kahn, W. A. (1990). Psychological conditions of personal engagement and
disengagement at work. Academy of Management Journal, 33(4), 692-724.
Kahn, W. A. (1992). To be fully there: Psychological presence at work. Human
Relations, 45(4), 321-349.
Karatepe, O. M. (2013). High-performance work practices and hotel employee
performance: The mediation of work engagement. International Journal of
Hospitality Management, 32, 132-140. doi:10.1016/j.ijhm.2012.05.00.
Keeping, L. M., & Levy, P. E. (2000). Performance appraisal reactions: Measurement,
modeling, and method bias. Journal of Applied Psychology, 85(5), 708-723.
Keeping, L. M., Makiney, J. D., Levy, P. E., Moon, M., & Gillette, L. M. (1999). Self-
ratings and reactions to feedback: It's not how you finish but where you start. In
RA Noe (Chair), New approaches to understanding employees' affective and
behavioral responses to multi-rater feedback systems. Symposium conducted at
the annual meeting of the Academy of Management, Chicago, IL.
Kline, R. B. (2016). Principles and practice of structural equation modeling (4th ed.).
New York, NY: Guilford Publications.
Kominis, G., & Emmanuel, C. R. (2007). The expectancy-valence theory revisited:
Developing an extended model of managerial motivation. Management
Accounting Research, 18(1), 49-75.

90
Kondrasuk, J. N. (2011). So what would an ideal performance appraisal look like?
Journal of Applied Business & Economics, 12(1), 57-71.
Kondrasuk, J. N. (2012). The ideal performance appraisal is a format, not a form.
Academy of Strategic Management Journal, 11(1), 115-130.
Kondrasuk, J. N., Crowell, Emi, C., Dillon, K., Kilzer, S., & Teely, J. (2008).
Proceedings of the 16th International Conference 2008 of the Association on
Employment Practices and Principles: Appraising performance appraisal: The
problems. Chicago, IL.
Korsgaard, M. A., & Roberson, L. (1995). Procedural justice in performance evaluation:
The role of instrumental and non-instrumental voice in performance appraisal
discussions. Journal of Management, 21(4), 657-669.
Kruse, K. (2012). Continuous coaching outperforms annual reviews. Health Care
Registration: The Newsletter for Health Care Registration Professionals, 22(1),
3-5.
Kumari, S. (2012). A study on performance appraisal errors of telecom managers in Navi
Mumbai region. SIES Journal of Management, 8(2), 3-13.
Laird, A., & Clampitt, P. G. (1985). Effective performance appraisal: Viewpoints from
managers. Journal of Business Communication, 22(3), 49-57.
Levy, P. E., & Williams, J. R. (2004). The social context of performance appraisal: A
review and framework for the future. Journal of Management, 30(6), 881-905.
Lieber, R. L. (1990). Statistical significance and statistical power in hypothesis testing.
Journal of Orthopedic Research: Official Publication of the Orthopedic Research
Society, 8(2), 304-309.

91
Light, J. (2010, November 7). Managing & careers: Human-Resources executives say
reviews are off the mark. Wall Street Journal, Eastern Edition, p. B8.
Luthans, F., & Peterson, S. J. (2002). Employee engagement and manager self-efficacy.
Journal of Management Development, 21(5), 376-387.
Maslach, C., Schaufeli, W., & Leiter, M. (2001). Job burnout. Annual Review of
Psychology, 52(1), 397-422.
Mathis, R. L., & Jackson, J. H. (2011). Human resource management (13th ed.). Mason,
OH: Thomson/South-Western.
Meinert, D. (2015). Is it time to put the performance review on a PIP? HR Magazine,
60(3), 1-12.
Najafi, L., Hamidi, Y., Ghiasi, M., Shahhoseini, R., & Emami, H. (2011). Performance
evaluation and its effects on employees' job motivation in Hamedan city health
centers. Australian Journal of Basic & Applied Sciences, 5(12), 1761-1765.
Nimon, K., Zientek, L. R., & Henson, R. K. (2012). The assumption of a reliable
instrument and other pitfalls to avoid when considering the reliability of data.
Frontiers in Psychology, 3(102), 1-12. doi:10.3389/fpsyg.2012.0010.
Oppenheimer, D. M., Meyvis, T., & Davidenko, N. (2009). Instructional manipulation
checks: Detecting satisficing to increase statistical power. Journal of
Experimental Social Psychology, 45(4), 867-872.
Podsakoff, P. M., MacKenzie, S. B., Lee, J. Y., & Podsakoff, N. P. (2003). Common
method biases in behavioral research: A critical review of the literature and
recommended remedies. Journal of Applied Psychology, 88(5), 879-903.
92
Pulakos, E. D., & O'Leary, R. S. (2011). Why is performance management broken?
Industrial & Organizational Psychology, 4(2), 146-164.
Rich, B. L., Lepine, J. A., & Crawford, E. R. (2010). Job engagement: Antecedents and
effects on job performance. Academy of Management Journal, 53(3), 617-635.
Robertson, C. (2008). Getting the information you need through a 360° feedback report.
Chemical Engineering, 115(4), 63-66.
Roulin, N. (2015). Don't throw the baby out with the bathwater: Comparing data quality
of crowdsourcing, online panels, and student samples. Industrial and
Organizational Psychology, 8(02), 190-196.
Rothbard, N. P. (2001). Enriching or depleting? The dynamics of engagement in work
and family roles. Administrative Science Quarterly, 46(4), 655-684.
Saks, A. M. (2006). Antecedents and consequences of employee engagement. Journal of
Managerial Psychology, 21(7), 600-619.
Saks, A. M., & Gruman, J. A. (2014). What do we really know about employee
engagement? Human Resource Development Quarterly, 25(2), 155-182.
Schoenherr, T., Ellram, L. M., & Tate, W. L. (2015). A note on the use of survey research
firms to enable empirical data collection. Journal of Business Logistics, 36(3),
288-300.
Schumacker, R. E., & Lomax, R. G. (2010). A beginner's guide to structural equation
modeling (3rd ed.). New York, NY: Routledge.
Seiden, S., & Sowa, J. (2011). Performance management and appraisal in human service
organizations: Management and staff perspectives. Public Personnel
Management, 40(3), 251-264.

93
Shuck, B. (2011). Four emerging perspectives of employee engagement: An integrative
literature review. Human Resource Development Review, 10(3), 304-328.
Shuck, A., Shuck, B., & Reio, T. ( 2013). Emotional labor and performance in the field of
child life: Initial model exploration and implications for practice. Children's
Health Care, 42(2), 168-190.
Shuck, B., Twyford, D., Reio, T. G., & Shuck, A. (2014). Human resource development
practices and employee engagement: Examining the connection with employee
turnover intentions. Human Resource Development Quarterly, 25(2), 239-270.
Shuck, B., & Wollard, K. (2010). Employee engagement and HRD: A seminal review of
the foundations. Human Resource Development Review, 9(1), 89-110.
Shweta, J., & Srirang, J. (2013). Leader-member exchange: A critique of theory &
practice. Journal of Management & Public Policy, 4(2), 42-53.
Smith, S. M., Roster, C. A., Golden, L. L., & Albaum, G. S. (2016). A multi-group
analysis of online survey respondent data quality: Comparing a regular USA
consumer panel to MTurk samples. Journal of Business Research, 69(8), 3139-
3148.
Society for Human Resource Management (2011). Performance Management and Other
Workplace Practices SHRM Poll. Retrieved from
http://www.shrm.org/Research/SurveyFindings/Articles/Pages/PerformanceMana
gementandOtherWorkplacePracticesSHRMPollfinal.asp.
Sparr, J. L., & Sonnentag, S. (2008). Fairness perceptions of supervisor feedback, LMX,
and employee well-being at work. European Journal of Work and Organizational
Psychology, 17(2), 198-225.
94
Spector, P. E. (2006). Method variance in organizational research: Truth or urban legend?
Organizational Research Methods, 9(2), 221-232.
Spence, J. R., & Keeping, L. M. (2011). Conscious rating distortion in performance
appraisal: A review, commentary, and proposed framework for research. Human
Resource Management Review, 21(2), 85-95.
Spence, J. R., & Keeping, L. M. (2010). The impact of non-performance information on
ratings of job performance: A policy-capturing approach. Journal of
Organizational Behavior, 31(4), 587-608.
Stalinski, S., & Downey, M. (2012). Moving from performance management to
managing performance: A systemic approach. People and Strategy, 35(1), 38-41.
Stevens, J. P. (2009). Applied multivariate statistics for the social sciences (5th ed.). New
York, NY: Routledge.
Stone, D. L., Gueutal, H. G., & Mcintosh, B. (1984). The effects of feedback sequence
and expertise of the rater on perceived feedback accuracy. Personnel Psychology,
37(3), 487-506.
Tabachnick, B. G., & Fidell, L. S. (2007). Using multivariate statistics (5th ed.).
Needham Height, MA: Allyn & Bacon.
Teclaw, R., Price, M. C., & Osatuke, K. (2012). Demographic question placement: Effect
on item response rates and means of a Veterans Health Administration survey.
Journal of Business and Psychology, 27(3), 281-290.
Thomas, S. L., & Bretz, R. D. (1994). Research and practice in performance appraisal:
Evaluating employee performance in America’s largest companies. SAM
Advanced Management Journal, 59(2), 28-34.

95
Thurston, P. W., & McNall, L. (2010). Justice perceptions of performance appraisal
practices. Journal of Managerial Psychology, 25(3), 201-228.
Tosti, D. T., & Addison, R. M. (2009). 360-degree feedback: Going around in circles?
Performance Improvement, 48(3), 36-39.
Volpone, S. D., Avery, D. R., & McKay, P. F. (2012). Linkages between racioethnicity,
appraisal reactions, and employee engagement. Journal of Applied Social
Psychology, 42(1), 252-270.
Waldman, D. A. (1997). Predictors of employee preferences for multirater and group-
based performance appraisal. Group & Organization Management, 22(2), 264-
287.
Wilkie, D. (2015). Is the annual performance review dead? Retrieved from
http://www.shrm.org/hrdisciplines/employeerelations/articles/pages/performance-
reviews-are-dead.asp.
Youngcourt, S. S., Leiva, P. I., & Jones, R. G. (2007). Perceived purposes of performance
appraisal: Correlates of individual- and position-focused purposes on attitudinal
outcomes. Human Resource Development Quarterly, 18(3), 315-343.

96
Appendix A: Participant Survey
Informed Consent You are being invited to participate in this confidential online survey examining the relationship between work environments and employee attitudes. This is a research project being conducted by Ben LeVan in conjunction with The University of Texas at Tyler. The survey will take approximately 15 minutes to complete. Your participation in this research study is completely voluntary. At any time, you may withdraw from the survey without any adverse consequences by simply closing your Internet browser. To protect your confidentiality, your responses will be anonymous and no identifying information such as your name, department, email address, computer number, or IP number will be captured. The researcher anticipates no side effects or risks associated with your participation in this study other than perhaps minor survey fatigue. The results of this study may be shared with The University of Texas at Tyler representatives but will be used only for scholarly purposes. Only a summary of the data will be shared through publication, educational, or conference venues. Potential benefits of the study include lower workplace stress and improved individual productivity. The procedure involves completing an online survey with multiple-choice questions about your perceptions of your work. Please note that there are no right or wrong answers. After you read each question or statement, click the button that best corresponds to your response. You may need to scroll down the page to answer all the questions. Click ">>" to continue after each page. This research has been reviewed and approved according to The University of Texas at Tyler's Institutional Review Board (IRB) procedures. If I have any questions about your rights as a research participant, please contact Dr. Gloria Duke, Chair of the UT Tyler Institutional Review Board at gduke@uttyler, or 903-566-7023. Should you have any questions about the research study and/or would like to receive a copy of the published dissertation, please contact Ben LeVan at 770-539-3212 or [email protected]. Do you agree to participate in this survey? Clicking on the "Agree" button below indicates that: • You have read the above information. • You voluntarily agree to participate. • You are at least 18 years of age. m Agree m Disagree, I choose not to participate in this study

97
Appendix A (Continued)
Please enter the text pictured below into the textbox to verify that this is a human
response.
Demographic Information Gender
m Male m Female
Age (in years)
m 17 or younger m 18-20 m 21-29 m 30-39 m 40-49 m 50-59 m 60 or older
Race
m Caucasian/White m Black/African-American m American Indian or Alaskan Native m Asian m Native Hawaiian or other Pacific Islander m From multiple races m Some other race (please specify) ____________________

98
Appendix A (Continued)
What is the highest degree or level of school you have completed?
m No schooling completed m Some high school, no diploma m High school graduate, diploma or the equivalent m Associate degree m Bachelor’s degree m Master’s degree m Doctorate degree
How long have you worked with your current employer?
m Less than 6 months m 6 months - 1 year m 1 - 2 years m 2 - 5 years m 6 - 10 years m more than 10 years
What is your current employment status? m Active, full-time employee m Active, part-time employee m Other, please specify ____________________ In what country are you currently employed? <drop-down box listing the countries of the world>

99
Appendix A (Continued)
Approximately how many employees are in your organization?
m 0-25 m 26-100 m 101-500 m 501-1000 m 1001-5000 m Greater than 5000
What is your organization type?
m Private m Public m Non-Profit m Other ____________________
What is the principal industry of your organization?
<drop-down box listing the various industries>

100
Appendix A (Continued)
Please indicate your occupation
m Management, professional, and related m Service m Sales and office m Farming, fishing, and forestry m Construction, extraction, and maintenance m Production, transportation, and material moving m Government m Retired m Unemployed m Other
Are you a member of an organized labor union?
m Yes m No
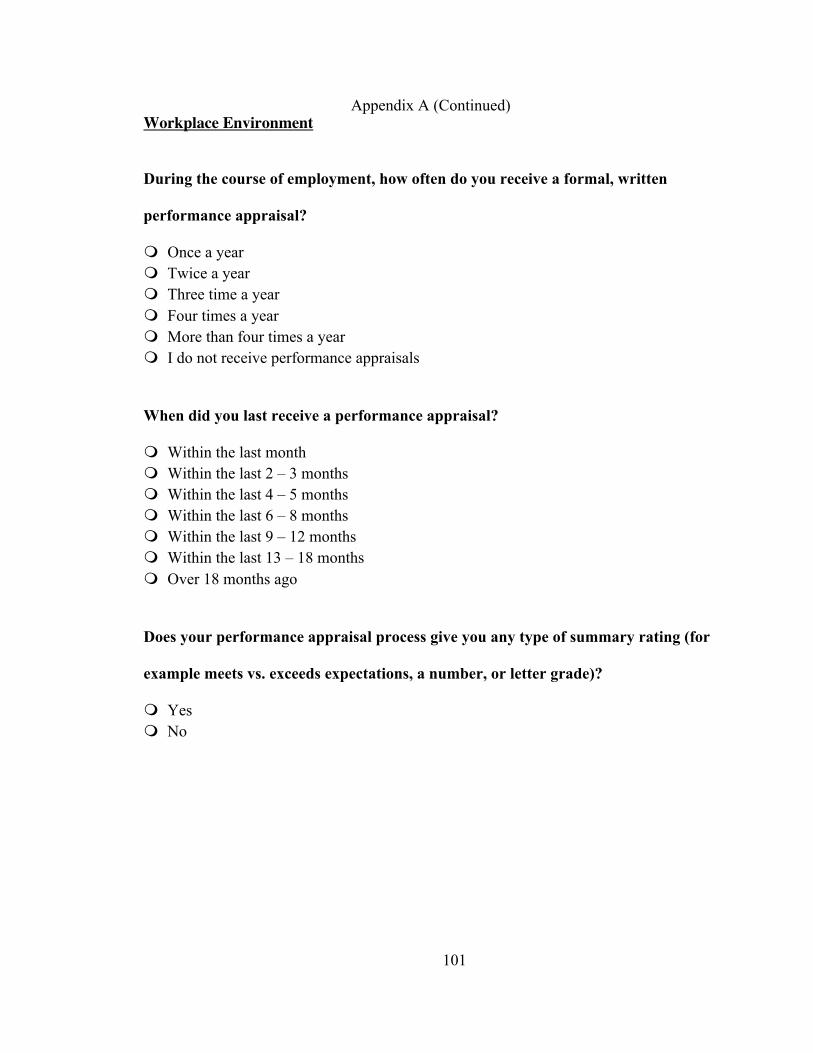
101
Appendix A (Continued) Workplace Environment
During the course of employment, how often do you receive a formal, written
performance appraisal?
m Once a year m Twice a year m Three time a year m Four times a year m More than four times a year m I do not receive performance appraisals
When did you last receive a performance appraisal?
m Within the last month m Within the last 2 – 3 months m Within the last 4 – 5 months m Within the last 6 – 8 months m Within the last 9 – 12 months m Within the last 13 – 18 months m Over 18 months ago
Does your performance appraisal process give you any type of summary rating (for
example meets vs. exceeds expectations, a number, or letter grade)?
m Yes m No

102
Appendix A (Continued)
Which of the following most closely describes the rating you received at your most
recent performance appraisal?
m 1-ineffective m 2-needs improvement m 3-meets expectations m 4-exceeds expectations m 5-exceptional m I don’t receive performance appraisal ratings
If you receive a summary rating, is this rating used to determine salary actions,
promotions or any other employment action?
m Yes m No m I do not receive summary performance ratings m I do not know how my summary rating is used within the organization
Are performance appraisal ratings used to rank employees (highest to lowest) in
your organization?
m Yes m No m Unsure

103
Appendix A (Continued)
Does your organization use a forced distribution curve to help determine
performance appraisal ratings?
m Yes m No m Unsure
Do you complete performance appraisals for other employees?
m Yes m No

104
Appendix A (Continued)
Please select the response that best describes you while at work.
StronglyDisagree
SomewhatDisagree
NeitherAgreenorDisagree
SomewhatAgree
StronglyAgree
I am enthusiastic in my job m m m m m
I feel energetic at my job m m m m m
I am interested in my job m m m m m
I am proud of my job m m m m m
I feel positive about my job m m m m m
I am excited about my job m m m m m
At work, my mind is focused on my job m m m m m
At work, I pay a lot of attention to my job m m m m m
At work, I focus a great deal of attention on my job m m m m m
At work, I am absorbed by my job m m m m m
At work, I concentrate on my job m m m m m
Select strongly disagree for this question m m m m m
At work, I devote a lot of attention to my job m m m m m
I work with intensity on my job m m m m m
I exert my full effort to my job m m m m m
I devote a lot of energy to my job m m m m m
I try my hardest to perform well on my job m m m m m
I strive as hard as I can to complete my job m m m m m
I exert a lot of energy on my job m m m m m
(c) 2010 Rich, Lepine, and Crawford

105
Appendix A (Continued)
Please select the response that best describes your feelings regarding
performance appraisal discussions.
StronglyDisagree
ModeratelyDisagree
SlightlyDisagree
SlightlyAgree
ModeratelyAgree
StronglyAgree
I felt quite satisfied with my last appraisal discussion m m m m m m
I feel good about the way the last appraisal discussion was conducted m m m m m m
My manager conducts a very effective appraisal discussion with me m m m m m m
Please select the response that best describes your feelings regarding your
organization's performance appraisal system.
StronglyDisagree
ModeratelyDisagree
SlightlyDisagree
SlightlyAgree
ModeratelyAgree
StronglyAgree
The performance appraisal system does a good job of indicating how an employee has performed in the period covered by the appraisal
m m m m m m
In general, I feel the company has an excellent performance appraisal system m m m m m m
Please select moderately agree for this question m m m m m m
The appraisal system provides a fair and unbiased measure of the level of an employee's performance
m m m m m m

106
Appendix A (Continued)
Please select the response that best describes your feelings regarding the value of
your organization's performance appraisal.
Idonotfeelthiswayatall,notatall
Ifeelsomewhatlikethis,alittle
Ifeelgenerallylikethis,prettymuch
Ifeelexactlythisway,completely
The performance appraisal helped me learn how I can do my job better
m m m m
I learned a lot from the performance appraisal m m m m
The performance appraisal helped me understand my mistakes
m m m m
I have a clearer idea of what my manager expects from me because of the performance appraisal
m m m m

107
Appendix A (Continued)
Please select the response that best describes your feelings regarding your
performance appraisal feedback.
StronglyDisagree
ModeratelyDisagree
SlightlyDisagree
NeitherAgreenorDisagree
SlightlyAgree
ModeratelyAgree
StronglyAgree
The feedback was an accurate evaluation of my performance m m m m m m m
Choose slightly disagree for this question m m m m m m m
I do not feel the feedback reflected my actual performance*
m m m m m m m
I believe the feedback was correct m m m m m m m
The feedback was consistent with how I felt I performed m m m m m m m
The feedback was not a true assessment of my work* m m m m m m m
My manager accurately judged my performance m m m m m m m
My manager incorrectly evaluated my work* m m m m m m m
My manager's evaluation of my work matched my own evaluation
m m m m m m m
My manager's evaluation reflected my true performance m m m m m m m
*Item removed due to poor inter-item correlation.

108
Appendix A (Continued)
Please select the response that best describes your feelings regarding your
organization's performance processes and procedures.
StronglyDisagree
ModeratelyDisagree
SlightlyDisagree
NeitherAgreenorDisagree
SlightlyAgree
ModeratelyAgree
StronglyAgree
The procedures used to evaluate my performance were fair
m m m m m m m
The process used to evaluate my performance was fair m m m m m m m
The procedures used to evaluate my performance were appropriate
m m m m m m m
The process used to evaluate my performance was appropriate
m m m m m m m
Please select the response that best describes your feelings regarding your
performance appraisal.
StronglyDisagree
ModeratelyDisagree
SlightlyDisagree
NeitherAgreenorDisagree
SlightlyAgree
ModeratelyAgree
StronglyAgree
The performance appraisal was fair m m m m m m m
I agree with my final rating m m m m m m m Select strongly agree for this question m m m m m m m
I agree with the way my manager rated my performance
m m m m m m m
The performance review fairly represented my past year’s performance
m m m m m m m
(c) 2000 Keeping and Levy

109
Appendix B: Survey Invitation
Survey Invitation
Would you please consider being part of a confidential online survey examining the
relationship between work environments and employee attitudes? This survey is part of a
doctoral research project being conducted at The University of Texas at Tyler. The
survey will take approximately 15 minutes to complete.
In order to participate, you need to be at least 18 years of age and receive a performance
appraisal, preferably with some sort of summary rating (meets expectations, above
average, 1 thru 5, etc.), at least annually. If you meet these requirements, please take a
moment to complete this survey found at https://uttyler.az1.qualtrics.com. Also, please
consider passing this invitation onto others in your personal and professional networks. I
understand this sacrifice of your valuable time and am so very grateful for your
consideration.
Should you have any questions about the research study and/or would like to receive a
copy of the published dissertation, please contact Ben LeVan at 770-539-3212 or
Thank you, Ben LeVan Doctoral Candidate University of Texas at Tyler

110
Appendix C: Instruments
Job Engagement (Rich, Lepine, & Crawford, 2010, p. 634)
Participants rated their own job engagement…using a five-point Likert scale that ranged from “strongly disagree” (1) to “strongly agree” (5)”. Physical engagement
I work with intensity on my jobI exert my full effort to my jobI devote a lot of energy to my jobI try my hardest to perform well on my job I strive as hard as I can to complete my job I exert a lot of energy on my job
Emotional engagement I am enthusiastic in my job I feel energetic at my jobI am interested in my jobI am proud of my job I feel positive about my job I am excited about my job
Cognitive engagement
At work, my mind is focused on my jobAt work, I pay a lot of attention to my jobAt work, I focus a great deal of attention on my job At work, I am absorbed by my jobAt work, I concentrate on my jobAt work, I devote a lot of attention to my job

111
Appendix C (Continued)
Performance Appraisal Reactions (Keeping and Levy, 2000) – instrument was received via email from Paul Levy on 7/7/2015.
Satisfaction with the session:
I felt quite satisfied with my last review discussion.
1 2 3 4 5 6
Strongly Disagree
Moderately Disagree
Slightly Disagree
Slightly Agree
Moderately Agree
Strongly Agree
I feel good about the way the last review discussion was conducted.
1 2 3 4 5 6
Strongly Disagree
Moderately Disagree
Slightly Disagree
Slightly Agree
Moderately Agree
Strongly Agree
My manager conducts a very effective review discussion with me.
1 2 3 4 5 6
Strongly Disagree
Moderately Disagree
Slightly Disagree
Slightly Agree
Moderately Agree
Strongly Agree

112
Appendix C (Continued)
Satisfaction with the system:
The performance review system does a good job of indicating how an employee has performed in the period covered by the review.
1 2 3 4 5 6
Strongly Disagree
Moderately Disagree
Slightly Disagree
Slightly Agree
Moderately Agree
Strongly Agree
In general, I feel the company has an excellent performance review system.
1 2 3 4 5 6
Strongly Disagree
Moderately Disagree
Slightly Disagree
Slightly Agree
Moderately Agree
Strongly Agree
The review system provides a fair and unbiased measure of the level of an employee's performance.
1 2 3 4 5 6
Strongly Disagree
Moderately Disagree
Slightly Disagree
Slightly Agree
Moderately Agree
Strongly Agree
Perceived Utility
The performance review helped me learn how I can do my job better.
1 2 3 4
I do not feel this way at all, not at all
I feel somewhat like this, a little
I feel generally like this, pretty much
I feel exactly this way, completely

113
Appendix C (Continued)
I learned a lot from the performance review.
1 2 3 4
I do not feel this way at all, not at all
I feel somewhat like this, a little
I feel generally like this, pretty much
I feel exactly this way, completely
The performance review helped me understand my mistakes.
1 2 3 4
I do not feel this way at all, not at all
I feel somewhat like this, a little
I feel generally like this, pretty much
I feel exactly this way, completely
I have a clearer idea of what my manager expects from me because of the performance review.
1 2 3 4
I do not feel this way at all, not at all
I feel somewhat like this, a little
I feel generally like this, pretty much
I feel exactly this way, completely
Perceived accuracy:
The feedback was an accurate evaluation of my performance.
1 2 3 4 5 6 7
Strongly Disagree
Moderately Disagree
Slightly Disagree
Neither Agree nor Disagree
Slightly Agree
Moderately Agree
Strongly Agree

114
Appendix C (Continued)
I do not feel the feedback reflected my actual performance.
1 2 3 4 5 6 7
Strongly Disagree
Moderately Disagree
Slightly Disagree
Neither Agree nor Disagree
Slightly Agree
Moderately Agree
Strongly Agree
I believe the feedback was correct.
1 2 3 4 5 6 7
Strongly Disagree
Moderately Disagree
Slightly Disagree
Neither Agree nor Disagree
Slightly Agree
Moderately Agree
Strongly Agree
The feedback was consistent with how I felt I performed.
1 2 3 4 5 6 7
Strongly Disagree
Moderately Disagree
Slightly Disagree
Neither Agree nor Disagree
Slightly Agree
Moderately Agree
Strongly Agree
The feedback was not a true assessment of my work.
1 2 3 4 5 6 7
Strongly Disagree
Moderately Disagree
Slightly Disagree
Neither Agree nor Disagree
Slightly Agree
Moderately Agree
Strongly Agree
My manager accurately judged my performance.
1 2 3 4 5 6 7
Strongly Disagree
Moderately Disagree
Slightly Disagree
Neither Agree nor Disagree
Slightly Agree
Moderately Agree
Strongly Agree

115
Appendix C (Continued)
My manager incorrectly evaluated my work.
1 2 3 4 5 6 7
Strongly Disagree
Moderately Disagree
Slightly Disagree
Neither Agree nor Disagree
Slightly Agree
Moderately Agree
Strongly Agree
My manager's evaluation of my work matched my own evaluation.
1 2 3 4 5 6 7
Strongly Disagree
Moderately Disagree
Slightly Disagree
Neither Agree nor Disagree
Slightly Agree
Moderately Agree
Strongly Agree
My manager's evaluation reflected my true performance.
1 2 3 4 5 6 7
Strongly Disagree
Moderately Disagree
Slightly Disagree
Neither Agree nor Disagree
Slightly Agree
Moderately Agree
Strongly Agree
Procedural Justice
The procedures used to evaluate my performance were fair.
1 2 3 4 5 6 7
Strongly Disagree
Moderately Disagree
Slightly Disagree
Neither Agree nor Disagree
Slightly Agree
Moderately Agree
Strongly Agree
The process used to evaluate my performance was fair.
1 2 3 4 5 6 7
Strongly Disagree
Moderately Disagree
Slightly Disagree
Neither Agree nor Disagree
Slightly Agree
Moderately Agree
Strongly Agree

116
Appendix C (Continued)
The procedures used to evaluate my performance were appropriate.
1 2 3 4 5 6 7
Strongly Disagree
Moderately Disagree
Slightly Disagree
Neither Agree nor Disagree
Slightly Agree
Moderately Agree
Strongly Agree
The process used to evaluate my performance was appropriate.
1 2 3 4 5 6 7
Strongly Disagree
Moderately Disagree
Slightly Disagree
Neither Agree nor Disagree
Slightly Agree
Moderately Agree
Strongly Agree
Distributive Justice
The performance review was fair.
1 2 3 4 5
Strongly Disagree
Somewhat Disagree
Neither Agree nor Disagree
Somewhat Agree
Strongly Agree
I agree with my final rating.
1 2 3 4 5
Strongly Disagree
Somewhat Disagree
Neither Agree nor Disagree
Somewhat Agree
Strongly Agree

117
Appendix C (Continued)
I agree with the way my manager rated my performance.
1 2 3 4 5
Strongly Disagree
Somewhat Disagree
Neither Agree nor Disagree
Somewhat Agree
Strongly Agree
The performance review fairly represented my past year’s performance.
1 2 3 4 5
Strongly Disagree
Somewhat Disagree
Neither Agree nor Disagree
Somewhat Agree
Strongly Agree

118
Appendix D: Permissions
Table 1. Organizational Uses for the Performance Appraisal Process
From: Dick, Angelina [email protected] Subject: FW: Permission Request Date: January 27, 2015 at 1:36 PM To: LeVan, Ben [email protected] Cc: Abdelsamad, Moustafa [email protected] Ben, attached is the string of emails giving you permission from the Society for
Advancement of Management, Inc. to use the table from the article published in the SAM
Journal.
Good luck on your dissertation.
Thank you,
Angie Dick
Assistant to Dr. Moustafa H. Abdelsamad, SAM President & CEO Texas A&M University-Corpus Christi College of Business 6300 Ocean Drive, OCNR 380, Unit 5808 Corpus Christi, TX 78412 361.825.5900 (office) 361.825.5609 (fax) [email protected] -----Original Message----- From: Abdelsamad, Moustafa Sent: Tuesday, January 27, 2015 11:24 AM To: Dick, Angelina Subject: Re: Permission Request Let us give him permission free.

119
Appendix D (Continued)
Table 4. Documented Issues with the Performance Appraisal Process From: JOHN [email protected] Subject: Re: Permission Request Date: January 17, 2015 at 1:16 PM To: LeVan, Ben [email protected] Cc: kondrasuk, Jack [email protected] Dear Ben, Yes, as the senior author for "Appraising Performance Appraisal: The Problems," I am granting you permission to use the table in the article for all purposes you listed below in your e-mail to me January 17, 2015. Good luck on your dissertation and getting that doctorate ASAP! Thanks for asking for permission for using the source. If I can be of any further help, let me know. Sincerely, Jack John ("Jack") Kondrasuk From: "Ben LeVan" <[email protected]> To: "kondrasuk" <[email protected]>, [email protected] Sent: Saturday, January 17, 2015 9:26:51 AM Subject: Permission Request Dr. Kondrasuk, I am currently a doctoral student at the University of Texas at Tyler and would like to use Table 1, on page 241 from a paper entitled, "Appraising Performance Appraisal: The Problems", that you presented along with Drs. Emi Crowell, Kelly Dillon, Steven Kilzer, and Jared Teeley at the Proceedings of the 16th International Conference 2008 of the Association on Employment Practices and Principles. The table is intended for use in my dissertation and dissertation proposal. I would gladly contact the AEPP, but it appears that their website has been taken down and that they have not been active since 2013. For your convenience, the paper is attached.

120
Appendix D (Continued) Figure 5. Hierarchical Model of Appraisal Satisfaction From the American Psychological Association website (http://www.apa.org/about/contact/copyright/index.aspx): Permission is Not Required for the Following:
• A maximum of three figures or tables from a journal article or book chapter • Single text extracts of less than 400 words • Series of text extracts that total less than 800 words
No formal requests to APA or the author are required for the items in this clause.
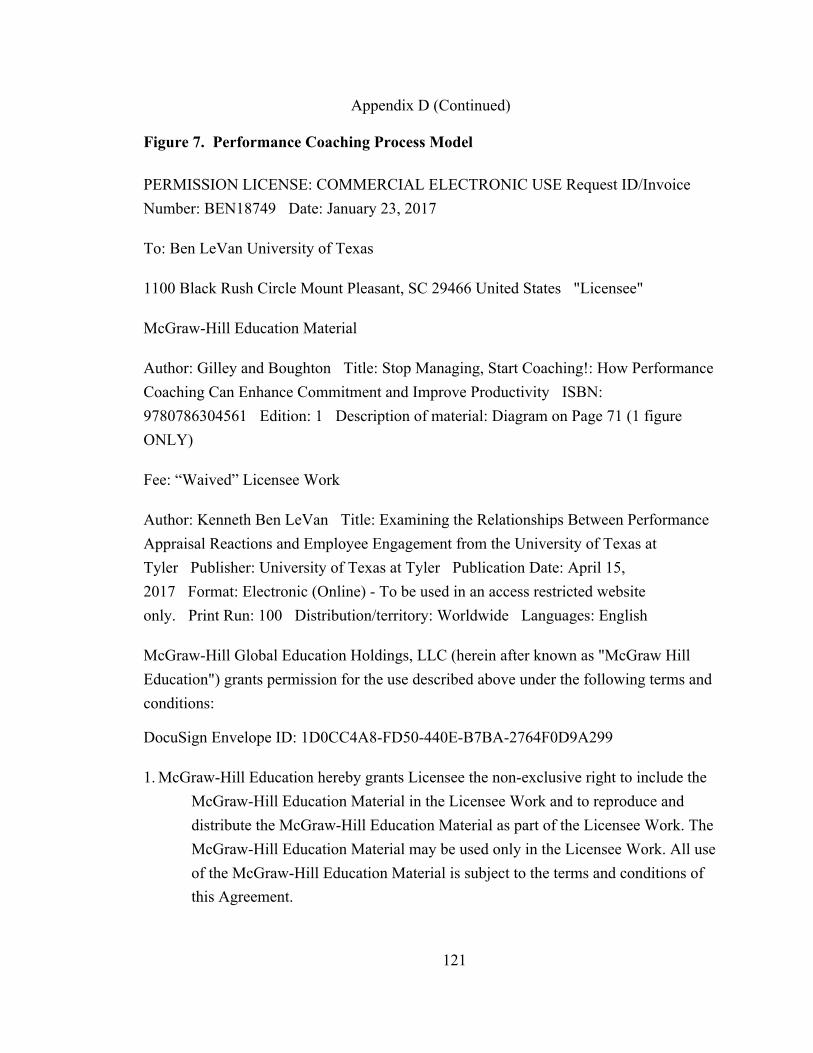
121
Appendix D (Continued)
Figure 7. Performance Coaching Process Model PERMISSION LICENSE: COMMERCIAL ELECTRONIC USE Request ID/Invoice Number: BEN18749 Date: January 23, 2017
To: Ben LeVan University of Texas
1100 Black Rush Circle Mount Pleasant, SC 29466 United States "Licensee"
McGraw-Hill Education Material
Author: Gilley and Boughton Title: Stop Managing, Start Coaching!: How Performance Coaching Can Enhance Commitment and Improve Productivity ISBN: 9780786304561 Edition: 1 Description of material: Diagram on Page 71 (1 figure ONLY)
Fee: “Waived” Licensee Work
Author: Kenneth Ben LeVan Title: Examining the Relationships Between Performance Appraisal Reactions and Employee Engagement from the University of Texas at Tyler Publisher: University of Texas at Tyler Publication Date: April 15, 2017 Format: Electronic (Online) - To be used in an access restricted website only. Print Run: 100 Distribution/territory: Worldwide Languages: English
McGraw-Hill Global Education Holdings, LLC (herein after known as "McGraw Hill Education") grants permission for the use described above under the following terms and conditions:
DocuSign Envelope ID: 1D0CC4A8-FD50-440E-B7BA-2764F0D9A299
1. McGraw-Hill Education hereby grants Licensee the non-exclusive right to include the McGraw-Hill Education Material in the Licensee Work and to reproduce and distribute the McGraw-Hill Education Material as part of the Licensee Work. The McGraw-Hill Education Material may be used only in the Licensee Work. All use of the McGraw-Hill Education Material is subject to the terms and conditions of this Agreement.

122
Appendix D (Continued)
2. No changes may be made to the McGraw-Hill Education Material without the prior written consent of McGraw-Hill Education.
3. Licensee will provide to McGraw-Hill Education the URL and password for the web site in which the McGraw-Hill Education Material appears (if applicable).
4. McGraw-Hill Education makes no representations or warranties as to the accuracy of any information contained in the McGraw-Hill Education Material, including any warranties of merchantability or fitness for a particular purpose. In no event shall McGraw-Hill Education have any liability to any party for special, incidental, tort, or consequential damages arising out of or in connection with the McGraw-Hill Education Material, even if McGraw-Hill Education has been advised of the possibility of such damages. All persons provided with the McGraw-Hill Education Material must be provided with written notice of this disclaimer and limitation liability, either in an end-user license and/or with an on-screen notice that is visible each time the end-user initiates access to the McGraw-Hill Education Material.
5. A credit to McGraw-Hill Education shall be visible each time the end-user initiates access to any screen or page containing any of the McGraw-Hill Education Material. Such credit shall include the title and author of the work and a copyright notice in the name of McGraw-Hill Education.
6. A SIGNED COPY OF THIS AGREEMENT should be sent to McGraw-Hill Global Education Holdings, LLC, Attn: Permissions Department, Wells Fargo Bank, Lockbox #6167, PO Box 8500, Philadelphia, Pa. 19178-6167.
7. This permission does not cover the use of any third-party copyrighted material, including but not limited to photographs and other illustrations, which appears in the McGraw-Hill Education Material with a credit to other sources. Written permission to use such material must be obtained from the cited source.
8. McGraw-Hill Education shall have the right to terminate this Agreement immediately upon written notice to Licensee if Licensee is in material breach of this
123
Appendix D (Continued) Agreement.
9. Licensee shall indemnify McGraw-Hill Education from any damages, lawsuits, claims, liabilities, costs, charges, and expenses, including attorney's fees, relating to its use of the McGraw-Hill Education Material.
10.This Agreement incorporates the parties' entire agreement with respect to its subject matter. This Agreement may be amended only in writing and signed by both parties and shall be governed by the laws of New York. Licensee may not assign this Agreement or any rights granted hereunder to any third party.

124
Appendix D (Continued) Performance Appraisal Reactions Scale From: Levy, Paul E [email protected] Subject: RE: Permission Request Date: July 6, 2015 at 11:33 AM To: Ben LeVan [email protected] Hi Ben: You certainly have my permission to use the scales for your research purposes. I hope they are useful for you. I wish I had more time to chat about your research project, but this week is crazy and then I’m FINALLY taking a vacation for the next 2 weeks. Perhaps we could communicate by email or try to catch up later in the summer. Best, PEL Dr. Paul E. Levy Professor and Chair, Department of Psychology The University of Akron Associate Editor, Organizational Behavior and Human Decision Processes (OBHDP) (330) 972-8369 (w) [email protected] From: Ben LeVan [mailto:[email protected]] Sent: Monday, July 06, 2015 10:48 AM To: Levy, Paul E Subject: Permission Request Dr. Levy, I am currently a doctoral student at the University of Texas at Tyler working on my dissertation and would like to obtain a copy and permission to use your appraisal reactions instrument. I am looking to explore the relationships between the performance appraisal process, LMX, Organizational Justice and Employee Engagement. I find your work in this are to be truly profound. I know your schedule must be very busy, but I would also relish the opportunity to speak with you if that might be a possibility as well. The articles that I am examining that reference performance appraisal reactions are: Keeping, L.M. & Levy, P.E. (2000). Performance appraisal reactions: Measurement, modeling, and method bias. Journal of Applied Psychology, 85(5), 708-723 708-723 Elicker, J.D., Levy, P.E., & Hall, R.J. (2006). The role of leader-member exchange in the performance appraisal process. Journal of Management, 32(4), 531-551.

125
Appendix D (Continued)
Job Engagement Scale From: Bruce Louis Rich [email protected] Subject: Re: Instrument Permission Request Date: May 5, 2015 at 7:56 PM To: Ben LeVan [email protected] Dear Ben, Yes, you may use the JES in your disserta6on research. Best of luck with your work. Bruce From: Ben LeVan <[email protected]> Date: Tuesday, May 5, 2015 at 10:04 AM To: Bruce Rich <[email protected]> Subject: Instrument Permission Request Dr. Rich, I am currently a doctoral student at the University of Texas at Tyler and would like to obtain permission to use your job engagement survey instrument described in you 2010 publication entitled, "Job engagement: Antecedents and effects on job performance” for use in my dissertation. I am hoping to examine the relationship between organizational justice, LMX, PA satisfaction and employee engagement. Your consideration is greatly appreciated. Warm Regards, Ben LeVan, MS, SPHR http://www.linkedin.com/in/benlevan 770-539-3212