examining the representation of causal knowledge · pdf fileexamining the representation of...
TRANSCRIPT

Examining the representation of causal knowledge
Jonathan A. FugelsangUniversity of Waterloo, Ontario, Canada
Valerie A. ThompsonUniversity of Saskatchewan, Saskatoon, SK
Kevin N. DunbarDartmouth College, Hanover, NH, USA
Three experiments investigated reasoners’ beliefs about causal powers; that is,their beliefs about the capacity of a putative cause to produce a given effect.Covariation-based theories (e.g., Cheng, 1997; Kelley, 1973; Novick & Cheng,2004) posit that beliefs in causal power are represented in terms of the degreeof covariation between the cause and its effect; covariation is defined in termsof the degree to which the effect occurs in the presence of the cause, and failsto occur in the absence of the cause. To test the degree to which beliefsin causal power are reflected in beliefs about covariation information,participants in three experiments rated their beliefs that putative causes havethe capacity to produce a given effect (i.e., possess the causal power to producean effect) as well as their beliefs regarding the degree to which the putativecause and effect covary. A strong positive correlation was discovered betweenparticipants’ beliefs in causal power and their beliefs that the effect occurs inthe presence of the cause. However, no direct relationship was found betweenparticipants’ beliefs in causal power and their belief that the effect will failto occur in the absence of the cause. These findings were replicated usingboth within- (Experiments 1 and 3) and between-subject designs (Experiment2). In Experiment 3, we extended these analyses to measures of familiarity,imageability, and detailedness of the representation. We found that par-ticipants’ beliefs in causal power were strongly associated with familiarity, andimageability, but not the perceived detailedness of the cause and effect
# 2006 Psychology Press Ltd
http://www.psypress.com/tar DOI: 10.1080/13546780500145678
Correspondence should be addressed to Jonathan Fugelsang, Department of Psychology,
University of Waterloo, 200 University Avenue West, Waterloo, Ontario, Canada, N2L 3G1.
Email: [email protected]
We would like to thank Ron Borowsky, Marc Buehner, Jamie Campbell, David Green,
David Lagnado, David Over, and Courtney Stein for comments and helpful suggestions on a
previous version of this manuscript. This research was supported by a postgraduate scholarship
from the Natural Sciences and Engineering Research Council of Canada (NSERC) awarded to
Jonathan Fugelsang, an NSERC discovery grant awarded to Valerie Thompson, and a
Dartmouth College research grant awarded to Kevin Dunbar.
THINKING & REASONING, 2006, 12 (1), 1 – 30
relationship. These data provide support for a multidimensional account ofcausal knowledge whereby people’s representations of causation include, butare not limited to, the covariation, familiarity, and imageability of cause andeffect relationships.
For over 400 years, researchers in a wide variety of disciplines haveinvestigated the ways that people come to know that one event causesanother. The predominant view of human causal thinking follows theHumean tradition of radical empiricism (Hume, 1739/1978) wherein allnotions of causality are thought to be deduced from observable statisticalregularities. Models of causality following this theoretical tradition can besubsumed under the label ‘‘Covariation-based models’’. Covariation-basedmodels (e.g., Cheng, 1997; Cheng & Novick, 1990, 1992; Hilton & Slugoski,1986; Kelley, 1973; Novick & Cheng, 2004; White, 2002b) are based on theassumption that an event that exhibits a regularity of association with aneffect (i.e., covaries with that effect) is more likely to be identified as a cause ofthat effect than is an event that does not exhibit a regularity of association.Belief-based representations (i.e., beliefs in causal power) of cause and effectrelationships are also proposed to reflect experience with covariationinformation (Cheng & Lien, 1995; Kelley, 1973; Lien & Cheng, 2000; Young,1995). Specifically, believable causal candidates are those that are known tocovary with the effect; unbelievable candidates are those that are known toshow little covariation with the effect. For example, drinking water might notbe perceived as possessing the causal power to produce an allergic reactionbecause in the reasoner’s experience drinking water has not been associatedwith negative physiological symptoms of this kind. Thus, according to suchmodels, beliefs in causal power are assumed to reflect knowledge regardingthe degree of covariation between a putative cause and effect.
Knowledge regarding the degree of covariation between a cause andeffect is thought to reflect two components: the probability that the effectoccurs in the presence of a potential cause [hereafter denoted P(e/c)], andthe probability that the effect occurs in the absence of a potential cause[hereafter denoted P(e/-c)]. The roles of P(e/c) and P(e/-c) have featuredprominently in contemporary models of causality. For example, Kelley’s(1973) ANOVA model, Hilton and Slugoski’s (1986) abnormal conditionsfocus model, Cheng and Novick’s (1990, 1992) probabilistic contrast model,and Cheng’s power PC theory (Cheng, 1997; Novick & Cheng, 2004) haveall delineated a primary role for P(e/c) and P(e/-c) in human notions ofcausality. Take, for instance, the probabilistic contrast model (Cheng &Novick, 1990). This model, and its successor the power pc theory (Cheng,1997), assumes that causal judgements are based in part on the computationof covariation (denoted DPc) constrained by a contextually determined focalset by subtracting the probability of the effect occurring in the absence of a
2 FUGELSANG, THOMPSON, DUNBAR
cause [P(e/-c)] from the probability of the effect occurring in the presence ofthe cause [P(e/c)]. If DPc is positive, then the candidate cause (c) should bejudged to be a facilitatory factor in producing the effect (e). If DPc isnegative, the potential cause (c) should be judged to be an inhibitory factor.Finally, when DPc is zero, the candidate cause (c) should be judged as a non-causal factor with respect to the observed effect (e).
Research has generally found, however, that people do not weigh P(e/c)and P(e/-c) equally when judging causal relationships (e.g., Anderson &Sheu, 1995; Downing Sternberg, & Ross, 1985; Klayman & Ha, 1987;Mandel & Lehman, 1998; Over & Green, 2001; Schustack & Sternberg,1981; White, 2002a, 2002b), even when they are explicitly provided withboth sources of information (Wasserman, Dorner, & Kao, 1990).Specifically, in such cases reasoners typically give more weight to theevidence concerning P(e/c) than to P(e/-c). This bias has been observed inboth causal and non-causal domains using a variety of task objectives.Similarly, when asked to judge the importance of P(e/c) and P(e/-c)information, the former is judged more critical than the latter (Wassermanet al., 1990). Based on these findings, recent models have devised modifiedalgorithms that more accurately reflect this unequal weighting of P(e/c) andP(e/-c) information in judgements of causality (Anderson & Sheu, 1995;Cheng, 1997; Novick & Cheng, 2004; White, 2002b). Perhaps the mostwidely cited of these models is Cheng’s power PC theory (Cheng, 1997;Novick & Cheng, 2004). She proposes that causal strength (denoted pc) isbest served by a function that divides the covariation (DPc ) of a given causeand effect relationship by the inverse of the base-rate [1-P(e/-c)] of thateffect, thus buffering the impact that P(e/-c) has in judgements of causality.
In summary, past research has clearly demonstrated that (1) people’scausal judgements are strongly influenced by the degree of covariationbetween the cause and effect, and (2) people generally display a bias towardsevaluating the P(e/c) of a candidate cause more heavily than the P(e/-c) ofa candidate cause. The degree to which such cues to causality also form thebasis of the representation of causal knowledge (i.e., one’s belief in causalpower) is unknown. Support for such representations of causal knowledgewould be provided by the degree to which people’s belief in the capacity ofputative causes to produce effects is related to their belief in the degree towhich they covary. This hypothesis is examined in the present series ofexperiments by systemically examining the role of P(e/c) and P(e/-c) in pre-existing representations of beliefs about causal powers.
TERMINOLOGY
Since the reported experiments contain both independent and dependentvariables regarding beliefs about causal powers and the covariation of
CAUSAL KNOWLEDGE 3
causal candidates, we have adopted the following terminology in order tosimplify the dissemination of the findings. In this manuscript we will refer tothe independent variables containing these manipulations as BELIEF andCOVARIATION manipulations. These manipulations comprise pre-select-ing stimuli that vary in terms of one’s pre-existing beliefs about thepropensity of a given causal candidate to produce a given effect (i.e.,BELIEF in the causal power of an object or event) and one’s pre-existingknowledge about the degree to which a given potential cause and effect co-occur together (i.e., beliefs about degree to which two variables possess apositive COVARIATION).
The effects of these independent variables will be examined with respectto how they influence participants’ ratings of the degree to which they cancause a specific outcome (i.e., causal power rating), the degree to which thegiven effect will occur in the presence of the cause (i.e., P(e/c) rating), andthe degree to which the given effect will occur in the absence of the cause(i.e., P(e/-c) rating). For the purposes of the present investigation, it is ofprimary interest to examine the degree to which these dependent variables[i.e., ratings of causal powers, P(e/c) and P(e/-c)] correlate with oneanother. In order to further distinguish the independent and dependentvariables, the independent variables (i.e., the pre-selection of stimulidesigned to vary orthogonally in terms of BELIEF in causal power andCOVARIATION information) will be presented in upper case.
EXPERIMENT 1
The goal of Experiment 1 is to provide a direct test of the relationship betweenP(e/c) and P(e/-c) to reasoners’ beliefs in causal power. To do this, wepresented participants with a series of causal scenarios that depicted putativecauses and effects, and simply asked them to rate their believability in terms ofcausal power, and rate their beliefs in P(e/c) andP(e/-c) information.
Method
Participants. A total of 60 first-year psychology students from theUniversity of Saskatchewan, with a mean age of 19.0 (range 17 – 25),completed the study in partial fulfilment of a course requirement.
Materials and procedure. Ten story scenarios were constructed, whichdepicted an event that had happened and a possible cause for that event.Each scenario was presented with four possible causes. The four causalcandidates were designed to vary orthogonally with respect to: (a) the be-lievability of the causal power linking the cause and effect, and (b) the degreeto which the cause and effect were believed to covary. Therefore, the
4 FUGELSANG, THOMPSON, DUNBAR

presented causal candidates were chosen to be (1) high in BELIEF in causalpower, and high in COVARIATION, (2) low in BELIEF in causal power,and high in COVARIATION, (3) high in BELIEF in causal power, and lowin COVARIATION, and (4) low in BELIEF in causal power, and low inCOVARIATION (see Appendix A for a complete list of stimuli used inExperiment 1).
Participants were first given a brief introductory paragraph, whichdepicted the event that had happened and a possible cause for that event.Following the introductory paragraph, they were asked to provide threejudgements that rated: (1) their a priori beliefs in causal power, (2) their apriori beliefs in the probability that the effect will occur in the presence ofthe cause [i.e., P(e/c)], and (3) their a priori beliefs that the effect will fail tooccur in the absence of the cause [i.e., P(e/-c)].
For the causal power rating, participants were asked to indicate whetherthey believed the causal agent in question could cause the given effect. Thatis, they were not asked to indicate whether the putative cause was actuallyresponsible for the effect, merely whether it had the capacity to do so.Participants made their judgements on an 11-point Likert scale that rangedfrom 0 (not believable) to 10 (highly believable) with 5 (moderatelybelievable) as the mid-point. For example, for the scenario regardingsmoking causing lung cancer, they were given the following scenario:
Imagine you are a researcher who is trying to determine the cause of lung cancer ina group of patients. You have a hypothesis that the lung cancer may be due tosmoking.
How believable do you think it is that smoking can cause lung cancer?
Participants were then asked to rate how often they thought that the givencausal candidate covaried with the given effect in terms of P(e/c) and P(e/-c). For the judgements of P(e/c), participants were asked to estimate thefrequency with which they believed the effect would occur in a sample of 10events in which the cause was present. Participants were then asked toprovide a judgement of P(e/-c). To do this, participants were asked toestimate the frequency with which they believed the effect would occur in asample of 10 events in which the cause was absent. For example, for thesame scenario regarding smoking causing lung cancer, participants weregiven the following statement and two questions:
To determine if there is a relationship between smoking and developing lungcancer, you examine 10 patients who were smoking and 10 patients who were notsmoking.
Of the 10 patients who were smoking, how many would you expect to have lungcancer?
CAUSAL KNOWLEDGE 5

Of the 10 patients who were not smoking, how many would you expect to havelung cancer?
The 40 scenarios (10 effects 6 4 different causal candidates) were each pre-sented on a separate page in a different random order for each participant. Allparticipants were tested in small groups of between four and eight people.Instructionswereallwritten, so the experimenter gaveonlyabrief introductioninforming participants to complete the questions in the order in which theyappeared and to work at their own pace. Participants were encouraged to askany questions they might have at any time during the experiment.
Results
The results will be presented in two sections. The first section presents themean analysis of the causal power, P(e/c), and P(e/-c) estimates as afunction of the manipulations of BELIEF in causal power and COVARIA-TION. The second section analyses the degree to which participants’judgements of causal power correlate with their judgements of P(e/c) andP(e/-c). The alpha level for all statistical tests was set at .01 (two-tailed)unless otherwise stated. Effect size estimates were computed using partial Z2.
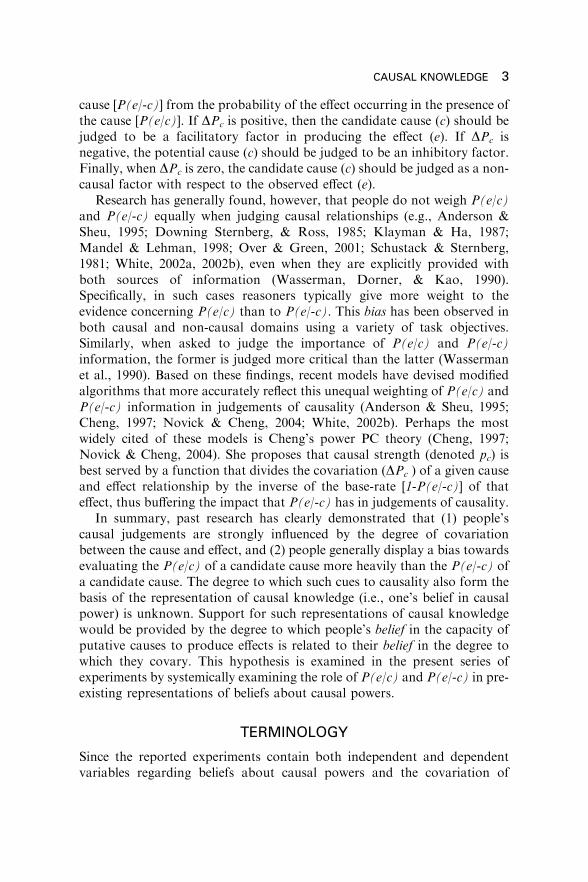
Means analysis. Figure 1 presents the mean causal power ratings, P(e/c) estimates, and P(e/-c) estimates as a function of the level of BELIEF andCOVARIATION of the stimuli. The purpose of this first series of analyses istwofold. First, the means analysis serves as a manipulation check todetermine the extent to which our stimuli, pre-selected to vary in terms ofBELIEF in causal powers and COVARIATION, influence participants’judgements in the predicted manner. In addition, this analysis serves toprovide an initial examination of the degree to which these variablesinfluence participants’ estimates of P(e/c) and P(e/-c).
The omnibus 2 (causal BELIEF manipulation: low and high) 6 2(COVARIATION manipulation: low and high) for the three judgementtypes [causal power, P(e/c), P(e/-c)] ANOVA revealed a main effect of theBELIEF manipulation, F(1, 53)¼ 759.55, MSE¼ 1.01, Z2¼ .94, wherebystimuli that were pre-selected to be highly believable in causal power didindeed result in higher judgements (M¼ 5.45) than stimuli pre-selected to below in beliefs in causal power (M¼ 3.26). In addition, there was a maineffect of the COVARIATION manipulation, F(1, 53)¼ 343.79, MSE¼ 0.72,Z2¼ .87, such that stimuli that were pre-selected to be high in covariationresulted in higher judgements (M¼ 4.97) than stimuli pre-selected to be lowin covariation (M¼ 3.74).
As is evident in Figure 1, judgements of causal powers,P(e/c), andP(e/-c)are differentially influenced by the BELIEF and COVARIATION stimulus
6 FUGELSANG, THOMPSON, DUNBAR

Figure
1.Meancausalpower
ratings,P(e/c)
estimates,andP(e/-c)estimatesasafunctionofthelevelofBELIE
F(lowandhigh)andCOVARIA
TIO
N
(low
andhigh)ofthestim
uli.
7
manipulations. This differential effect is further evidenced by the presenceof interactions between the judgement type and the BELIEF manipulation,F(2, 106)¼ 425.44, MSE¼ 0.86, Z2¼ .89, and the judgement type and theCOVARIATION manipulation F(2, 106)¼ 418.76, MSE¼ 0.29, Z2¼ .89.These interactionsaremainly theproductof a significantly reduced effectof theBELIEFandCOVARIATIONmanipulations for theP(e/-c) estimates (meanBELIEF effect¼ .62, mean COVARIATION effect¼ .48) when contrastedwith the effect of the BELIEF and COVARIATION manipulations for thecausal powers judgements (mean BELIEF effect¼ 4.53, mean COVARIA-TION effect¼ 2.03) and the P(e/c) estimates (mean BELIEF effect¼ 2.61,mean COVARIATION effect¼ 2.15). Paired t-tests comparing the size of theeffects of the BELIEF and COVARIATION manipulations for the threejudgement types support this interpretation (smallest t¼ 10.93, SE¼ .17,p5 .01). In summary, these analyses revealed that the BELIEF andCOVARIATION manipulations successfully influenced participants’ judge-ments in the predicted manner for the causal power ratings and the P(e/c)ratings. In addition, these analyses revealed that theBELIEFandCOVARIA-TION manipulations had a larger effect for judgements of causal powers andP(e/c) than for P(e/-c), suggesting a minimal relationship between partici-pants’ representations of causal power and their judgements regarding thedegree to which the effect will fail to occur in the absence of a cause.
Correlational analyses.
The ratings obtained for the individual stimulus items are presented inAppendix B. Table 1 presents the correlations between participants’ ratingsfor their beliefs in causal power, P(e/c) and P(e/-c), for the 40 scenarios. Inaddition, we also include calculations of DP, and pc in order to provide thereader with an estimate of the degree to which these descriptors may providea better fit to the obtained data. Whereas a reliable positive correlationwas discovered between participants’ ratings of causal power and theirP(e/c) ratings, r(38)¼ þ.83, p5 .01, no reliable correlation was observedbetween participants’ ratings of causal power and their P(e/-c) ratings,r(38)¼ – .20, p¼ .22, despite adequate power to detect a correlation [1 – bfor (r 5 .45)¼ .80].1 Thus, when participants perceived that a candidatecause had the capacity to produce a given effect, they also perceived that theprobability that the effect would occur in the presence of the cause was high.
1The analyses for this experiment and subsequent experiments consist of zero order
correlations between the ratings obtained for each of the stimuli. Therefore, the correlational
analyses in Experiment 1 and 2 have 38 degrees of freedom (40 items) and Experiment 3 has 18
degrees of freedom (20 items). Note that the stability of these correlations is greatly increased
due to the large number of subjects contributing to each data point (60 in Experiment 1, 91 in
Experiment 2, and 40 in Experiment 3).
8 FUGELSANG, THOMPSON, DUNBAR
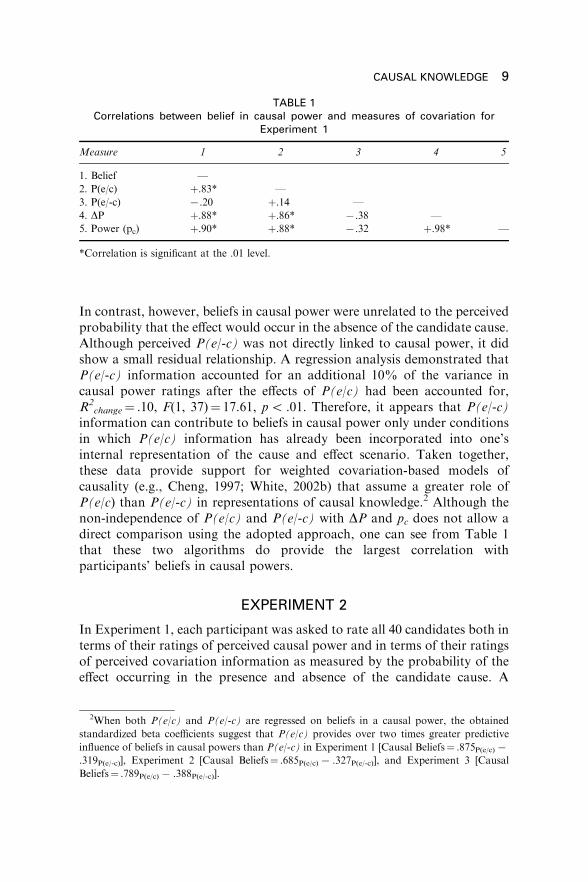
In contrast, however, beliefs in causal power were unrelated to the perceivedprobability that the effect would occur in the absence of the candidate cause.Although perceived P(e/-c) was not directly linked to causal power, it didshow a small residual relationship. A regression analysis demonstrated thatP(e/-c) information accounted for an additional 10% of the variance incausal power ratings after the effects of P(e/c) had been accounted for,R2
change¼ .10, F(1, 37)¼ 17.61, p5 .01. Therefore, it appears that P(e/-c)information can contribute to beliefs in causal power only under conditionsin which P(e/c) information has already been incorporated into one’sinternal representation of the cause and effect scenario. Taken together,these data provide support for weighted covariation-based models ofcausality (e.g., Cheng, 1997; White, 2002b) that assume a greater role ofP(e/c) than P(e/-c) in representations of causal knowledge.2 Although thenon-independence of P(e/c) and P(e/-c) with DP and pc does not allow adirect comparison using the adopted approach, one can see from Table 1that these two algorithms do provide the largest correlation withparticipants’ beliefs in causal powers.
EXPERIMENT 2
In Experiment 1, each participant was asked to rate all 40 candidates both interms of their ratings of perceived causal power and in terms of their ratingsof perceived covariation information as measured by the probability of theeffect occurring in the presence and absence of the candidate cause. A
TABLE 1Correlations between belief in causal power and measures of covariation for
Experiment 1
Measure 1 2 3 4 5
1. Belief —
2. P(e/c) þ.83* —
3. P(e/-c) 7.20 þ.14 —
4. DP þ.88* þ.86* 7.38 —
5. Power (pc) þ.90* þ.88* 7.32 þ.98* —
*Correlation is significant at the .01 level.
2When both P(e/c) and P(e/-c) are regressed on beliefs in a causal power, the obtained
standardized beta coefficients suggest that P(e/c) provides over two times greater predictive
influence of beliefs in causal powers than P(e/-c) in Experiment 1 [Causal Beliefs¼ .875P(e/c)7.319P(e/-c)], Experiment 2 [Causal Beliefs¼ .685P(e/c)7 .327P(e/-c)], and Experiment 3 [Causal
Beliefs¼ .789P(e/c)7 .388P(e/-c)].
CAUSAL KNOWLEDGE 9

possible limitation of this approach is that participants’ judgements of theirbeliefs in causal power may influence their judgements of their beliefs incovariation information. To remedy this, participants in Experiment 2 madeeither beliefs in causal power judgements, or beliefs in covariationjudgements. Otherwise, this experiment was identical to Experiment 1.
Method
Participants. A total of 91 first-year psychology students from theUniversity of Saskatchewan, with a mean age of 19.4 (range 17 – 41),completed the study in partial fulfilment of a course requirement.
Materials and procedure. The materials and procedure were identical tothat of Experiment 1 with the following exceptions. Five causal candidateswere changed to better fit the orthogonal presentation of BELIEF in causalpower and COVARIATION information. These candidates are presented inAppendix C and denoted with an asterisk in Appendix D.
In addition, the beliefs in causal power and beliefs in covariationjudgements were assessed between-subjects, such that one group ofparticipants (n¼ 46) rated their beliefs in causal power of the givenscenarios, and a second group of participants (n¼ 45) rated how often theyfelt that the given causal candidate covaried with the given effect in terms ofboth P(e/c) and P(e/-c). Assignment to the causal power rating and thecovariation rating group was random. As was the case in Experiment 1, allparticipants were tested in small groups of between four and eight people.
Results
The ratings obtained for the individual items are presented in Appendix D.As the stimuli used in this experiment were identical (with the exception offive items), we will concentrate our analyses on the observed correlationsbetween the dependent measures.3 Table 2 presents the correlations betweenparticipants’ ratings of their beliefs in causal power, P(e/c), P(e/-c), DP,and pc for Experiment 2. The data presented in the correlation matrixreplicate and extend those observed in Experiment 1 and thus providesupport for weighted covariation-based models of causality (e.g., Cheng,1997; White, 2002b). Specifically, a reliable positive correlation was
3The overall pattern of data for the omnibus ANOVA between BELIEF and COVARIA-
TION as a function of the three judgment types was replicated in Experiments 2 and 3. In order
to maintain parsimony in the dissemination of the remainder of the findings, these analyses will
not be presented. However, the mean pattern of these data can be extrapolated from the raw
scores in Appendix D and E.
10 FUGELSANG, THOMPSON, DUNBAR
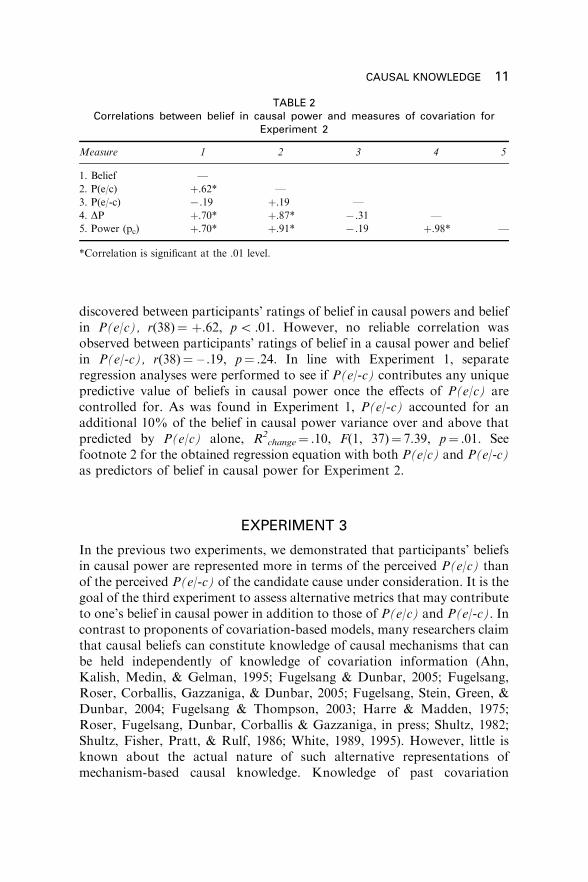
discovered between participants’ ratings of belief in causal powers and beliefin P(e/c), r(38)¼ þ.62, p5 .01. However, no reliable correlation wasobserved between participants’ ratings of belief in a causal power and beliefin P(e/-c), r(38)¼ – .19, p¼ .24. In line with Experiment 1, separateregression analyses were performed to see if P(e/-c) contributes any uniquepredictive value of beliefs in causal power once the effects of P(e/c) arecontrolled for. As was found in Experiment 1, P(e/-c) accounted for anadditional 10% of the belief in causal power variance over and above thatpredicted by P(e/c) alone, R2
change¼ .10, F(1, 37)¼ 7.39, p¼ .01. Seefootnote 2 for the obtained regression equation with both P(e/c) and P(e/-c)as predictors of belief in causal power for Experiment 2.
EXPERIMENT 3
In the previous two experiments, we demonstrated that participants’ beliefsin causal power are represented more in terms of the perceived P(e/c) thanof the perceived P(e/-c) of the candidate cause under consideration. It is thegoal of the third experiment to assess alternative metrics that may contributeto one’s belief in causal power in addition to those of P(e/c) and P(e/-c). Incontrast to proponents of covariation-based models, many researchers claimthat causal beliefs can constitute knowledge of causal mechanisms that canbe held independently of knowledge of covariation information (Ahn,Kalish, Medin, & Gelman, 1995; Fugelsang & Dunbar, 2005; Fugelsang,Roser, Corballis, Gazzaniga, & Dunbar, 2005; Fugelsang, Stein, Green, &Dunbar, 2004; Fugelsang & Thompson, 2003; Harre & Madden, 1975;Roser, Fugelsang, Dunbar, Corballis & Gazzaniga, in press; Shultz, 1982;Shultz, Fisher, Pratt, & Rulf, 1986; White, 1989, 1995). However, little isknown about the actual nature of such alternative representations ofmechanism-based causal knowledge. Knowledge of past covariation
TABLE 2Correlations between belief in causal power and measures of covariation for
Experiment 2
Measure 1 2 3 4 5
1. Belief —
2. P(e/c) þ.62* —
3. P(e/-c) 7.19 þ.19 —
4. DP þ.70* þ.87* 7.31 —
5. Power (pc) þ.70* þ.91* 7.19 þ.98* —
*Correlation is significant at the .01 level.
CAUSAL KNOWLEDGE 11

information, and/or knowledge of mechanism-based cues may be derivedand represented from a variety of distinct and interrelated modalities.
Much can be learned about belief-based representations of causalknowledge by extrapolating from research conducted in conceptrepresentation (e.g., Medin, Lynch, & Solomon, 2000) and deductivereasoning (e.g., Evans, 2003; Feeney, Evans, & Clibbens, 2000; Johnson-Laird, 1983, 2001). For example, one’s belief in causal power may beinfluenced by how typical or familiar one is with a specific example underconsideration (Choi, Nisbett, & Smith, 1997; Kahneman & Tversky, 1996;Ram, 1993; Shafir, Smith, & Osherson, 1990). Furthermore, the extent towhich an individual can create a mental image of the interaction betweena specific cause and effect may influence the believability of that cause aspossessing the necessary mechanism to be responsible for the observedeffect (Baird & Fugelsang, 2004; Clement & Falmagne, 1986; De Soto,London, & Handel, 1965; Fugelsang & Dunbar, 2005; Kahneman &Tversky, 1982; Pearson, Logie, & Gilhooly, 1999). For example, researchon counterfactual thinking by Kahneman and Tversky (1982) suggeststhat people may spontaneously run image-based ‘‘if then’’ simulations ofalternative outcomes when they are presented with various scenarios thatdo not conform to one’s beliefs and expectations (see also Baird &Fugelsang, 2004). As such representations have been shown to play anintegral role in knowledge representations in other domains, it isreasonable to assume that these representations may inform one’s beliefin causal power. Furthermore, the degree to which an individual cancreate a detailed graphical model of the cause, and the nature of thatgraphical model, may inform the degree to which they believe that thecandidate possesses the causal power to produce the observed effect(Glymour, 2001; Green & McManus, 1995; Green, McManus, & Derrick,1998). In the following experiment, we provide a first step in thisdirection by examining the degree to which reasoners’ beliefs in causalpower are related to (1) familiarity, (2) imageability, and (3) thedetailedness of representation. In addition, participants in this experimentwere asked to make the same covariation estimates as in the precedingtwo experiments.
Method
Participants. A total of 40 introductory psychology students fromDartmouth College, with a mean age of 18.8 (range 18 – 21), completed thestudy in partial fulfilment of a course requirement.
Materials and procedure. The materials and procedure were identical tothat of Experiment 1 with the following exceptions. Due to the increased
12 FUGELSANG, THOMPSON, DUNBAR

time required for the additional judgements in this experiment, we opted touse 20 of the 40 stimuli. These stimuli and subsequent ratings appear inAppendix E.
As with Experiments 1 and 2, following the introductory paragraphparticipants were asked to rate: (1) their a priori beliefs in causal powers, (2)their a priori beliefs in P(e/c), and (3) their a priori beliefs in P(e/-c).4
However, due to the subsequent ratings, we changed the causal power ratingscale to reflect a 7-point Likert scale ranging from 1 (not believable) to 7(highly believable) with 4 (moderately believable) as the mid-point. The P(e/c) and P(e/-c) ratings were identical to those used in Experiments 1 and 2.
Participants were then asked to rate the familiarity of the cause and effectsequence. For these judgements, participants were asked to rate howfamiliar they were with the specific candidate cause in acting as a precursorto the effect, using a 7-point Likert scale ranging from 1 (not familiar) to 7(highly familiar) with 4 (moderately familiar) as the mid-point. Participantswere then asked to rate the imageability of the cause and effect scenario. Forthese ratings, participants were asked to rate the degree to which they couldcreate a mental image of the cause actually producing the effect, using a 7-point Likert scale ranging from 1 (not imageable) to 7 (highly imageable)with 4 (moderately imageable) as the mid-point. In order to assess the levelof detail of the participants’ representation of the candidate cause andsubsequent effect, participants were asked to draw a flow chart explicitlydepicting how the candidate cause could produce the observed effect. Theywere instructed to include all factors or events that were involved in theprocess and how they thought they were inter-related. As was the case inExperiments 1 and 2, all participants were tested in small groups of betweenfour and eight people.
Results
The ratings obtained for the individual items are presented in Appendix E.Table 3 presents the correlations between participants’ ratings for theirbeliefs in causal power, P(e/c), P(e/-c), DP, pc, familiarity, imageability,
4All participants in Experiments 1, 2, and 3 made the judgements regarding P(e/c) before
they made the judgements regarding P(e/-c). However, in order to ensure that the order of the
stimulus presentation for P(e/c) and P(e/-c) did not influence participants’ judgements, we ran
an additional group of 20 participants with the reverse presentation order [i.e., they made
judgements regarding P(e/-c) before P(e/c)]. In addition, we counterbalanced the order of the
remaining judgements (familiarity, imageability and belief in causal powers). This new order
did not influence the data in any significant way. Specifically, participants’ beliefs in causal
powers were significantly correlated with their judgements regarding P(e/c), imageability, and
familiarity [r(18)’s¼ .68, .98, and .74 respectively], and were not significantly correlated with
their judgements regarding P(e/-c) [r(18)¼7 .22].
CAUSAL KNOWLEDGE 13

TA
BL
E3
Co
rre
lati
on
sb
etw
ee
nb
elie
fin
cau
sal
po
we
r,m
ea
sure
so
fco
va
ria
tio
n,
fam
ilia
rity
,im
ag
ea
bilit
ya
nd
de
taile
dn
ess
for
Ex
pe
rim
en
t3
Measure
12
34
56
78
1.Causalpower
—
2.P(e/c)
þ.69*
—
3.P(e/-c)
þ.21
þ.19
—
4.Familiarity
þ.73*
þ.66*
þ.03
—
5.Im
ageability
þ.98*
þ.70*
þ.15
þ.79*
—
6.Detailedness
þ.11
þ.13
þ.08
þ.37
þ.18
—
7.DP
þ.77*
þ.74*
þ.48*
þ.57*
þ.74*
þ.06
—
8.Power
(Pc)
þ.82*
þ.85*
þ.26
þ.65*
þ.80*
þ.07
þ.95*
—
*Correlationissignificantatthe.01level.
14
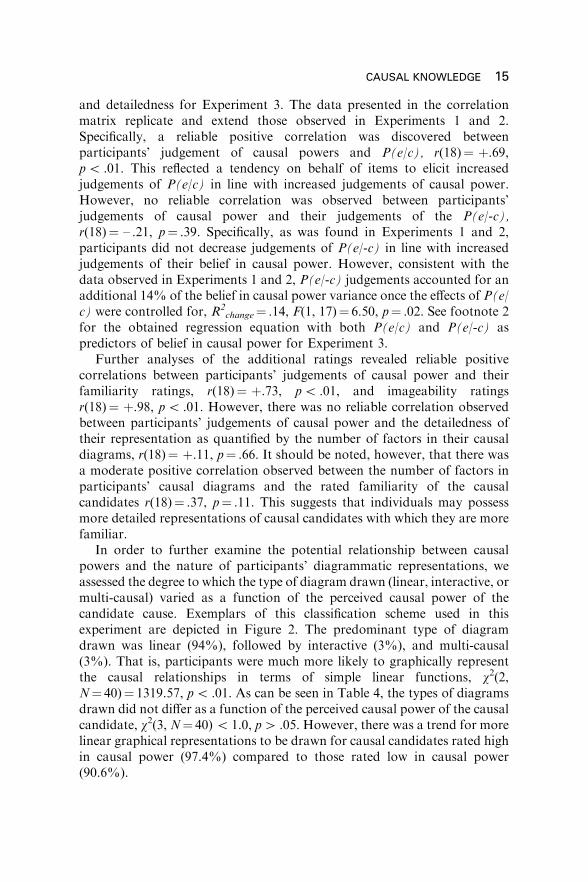
and detailedness for Experiment 3. The data presented in the correlationmatrix replicate and extend those observed in Experiments 1 and 2.Specifically, a reliable positive correlation was discovered betweenparticipants’ judgement of causal powers and P(e/c), r(18)¼ þ.69,p5 .01. This reflected a tendency on behalf of items to elicit increasedjudgements of P(e/c) in line with increased judgements of causal power.However, no reliable correlation was observed between participants’judgements of causal power and their judgements of the P(e/-c),r(18)¼ – .21, p¼ .39. Specifically, as was found in Experiments 1 and 2,participants did not decrease judgements of P(e/-c) in line with increasedjudgements of their belief in causal power. However, consistent with thedata observed in Experiments 1 and 2, P(e/-c) judgements accounted for anadditional 14% of the belief in causal power variance once the effects of P(e/c) were controlled for, R2
change¼ .14, F(1, 17)¼ 6.50, p¼ .02. See footnote 2for the obtained regression equation with both P(e/c) and P(e/-c) aspredictors of belief in causal power for Experiment 3.
Further analyses of the additional ratings revealed reliable positivecorrelations between participants’ judgements of causal power and theirfamiliarity ratings, r(18)¼ þ.73, p5 .01, and imageability ratingsr(18)¼ þ.98, p5 .01. However, there was no reliable correlation observedbetween participants’ judgements of causal power and the detailedness oftheir representation as quantified by the number of factors in their causaldiagrams, r(18)¼ þ.11, p¼ .66. It should be noted, however, that there wasa moderate positive correlation observed between the number of factors inparticipants’ causal diagrams and the rated familiarity of the causalcandidates r(18)¼ .37, p¼ .11. This suggests that individuals may possessmore detailed representations of causal candidates with which they are morefamiliar.
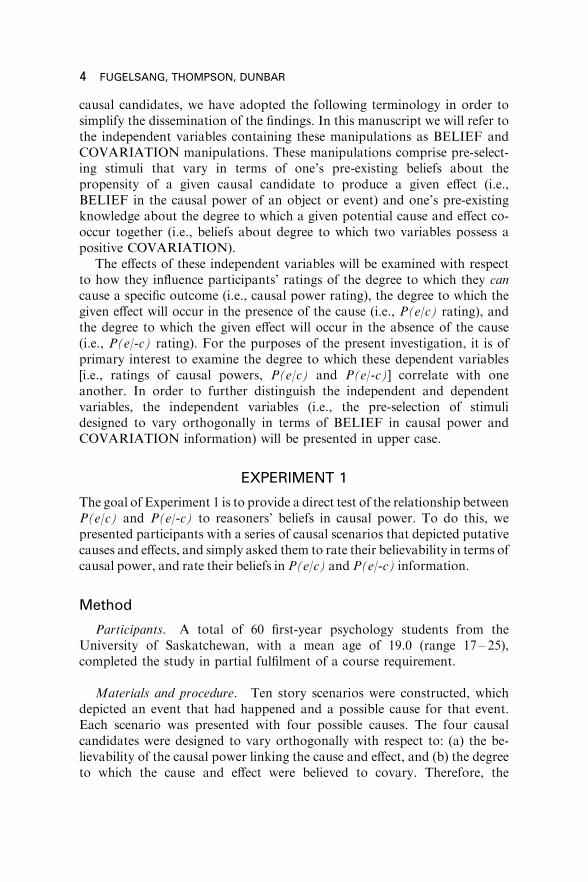
In order to further examine the potential relationship between causalpowers and the nature of participants’ diagrammatic representations, weassessed the degree to which the type of diagram drawn (linear, interactive, ormulti-causal) varied as a function of the perceived causal power of thecandidate cause. Exemplars of this classification scheme used in thisexperiment are depicted in Figure 2. The predominant type of diagramdrawn was linear (94%), followed by interactive (3%), and multi-causal(3%). That is, participants were much more likely to graphically representthe causal relationships in terms of simple linear functions, w2(2,N¼ 40)¼ 1319.57, p5 .01. As can be seen in Table 4, the types of diagramsdrawn did not differ as a function of the perceived causal power of the causalcandidate, w2(3, N¼ 40)5 1.0, p4 .05. However, there was a trend for morelinear graphical representations to be drawn for causal candidates rated highin causal power (97.4%) compared to those rated low in causal power(90.6%).
CAUSAL KNOWLEDGE 15

GENERAL DISCUSSION
We conducted three experiments that set out to investigate how people’sbeliefs in causality are represented. To do this, we first investigated therelationship between participants’ beliefs in causal power and their beliefs incovariation information as measured by both P(e/c) and P(e/-c). Two mainfindings emerged. First, we found a reliably positive relationship between
TABLE 4Types of diagrams drawn as function of the BELIEF in causal power manipulation
Diagram classification
Stimuli type Linear Interactive Multicausal
High causal power/high covariation 97.4% 1.0% 1.5%
High causal power/low covariation 94.4% 2.1% 3.6%
Low causal power/high covariation 94.2% 3.7% 2.1%
Low causal power/low covariation 90.6% 5.8% 3.7%
Figure 2. Exemplars of the scheme used in the classification of linear, interactive, or multicausal
graphical diagrams.
16 FUGELSANG, THOMPSON, DUNBAR

participants’ belief in causal power and their estimates of P(e/c). However,we found no direct relationship between participants’ belief in causal powerand their estimates of P(e/-c). This finding was replicated using both within-(Experiments 1 and 3) and between-subjects designs (Experiment 2). Thesedata are inconsistent with normative contingency-based models, as suchmodels propose that P(e/c) and P(e/-c) contribute equally to judgements ofcausality, and representations of causal knowledge. However, these findingsare consistent with weighted contingency models which propose that peoplemake use of the P(e/c) of the candidate cause more than the P(e/-c) (e.g.,Cheng, 1997; Mandel & Lehman, 1998; Novick & Cheng, 2004; Over &Green, 2001; Schustack & Sternberg, 1981; White, 2002b). Therefore,individuals’ incorporation of covariation-based data in their beliefs in causalpower may in fact mirror their use of such data when evaluating newevidence (see footnote 2). An important avenue for future research would beto examine the extent to which participants’ beliefs about the frequency ofcausal events vary as a function of the sample size examined. Specifically, thecurrent experiments used relatively small set sizes. That is, participants wereasked to make their P(e/c) and P(e/-c) estimates assuming a relativelysmall sample size of 10 events. Several studies have demonstrated that setsize can have a significant impact on participants’ judgements involvingcausal relationships (e.g., Green & Over, 2000). The degree to which suchjudgements will vary as a function of parametric manipulations of set size isan important empirical question for future studies to examine.
In Experiment 3, we replicated the dissociation between participants’belief in causal power with P(e/c) and P(e/-c) in addition to extending ouranalyses to familiarity, imageability and the level of detail in participants’representations of the causal mechanisms. Concerning first the nature of thediagrams drawn, individuals drew equally complex diagrams (mean of 3.73factors) for causal candidates that were rated as high versus low in causalpower. In addition, the causal diagrams drawn were predominantly linear.These data are consistent with recent work on scientific causal thinkingconducted by Dunbar and Fugelsang (2005). Using similar materials, theyasked students to generate verbal protocols while they graphically reasonedabout causes and effects. They also asked participants to rate each of thelinks in their causal diagrams in terms of the perceived probability of eachlink occurring in the natural environment. Several interesting findingsemerged from the analyses of those data. First, although the complexities ofthe diagrams were similar (equal number of factors and predominantlylinear), the nature of the diagrams differed with respect to the ratings of theprobability of the links in the diagrams. Specifically, the overall plausibilityof the graphical causal model was directly related to the probability of theweakest link in the causal chain of events. That is, graphical modelscontaining a plausible causal mechanism contained highly probable links,
CAUSAL KNOWLEDGE 17

whereas graphical models containing an implausible causal mechanism hadat least one link that was rated improbable. These data are consistent withresearch conducted by Green and colleagues (Green & McManus, 1995;Green et al., 1998) who found that people’s representations of complexcausal relationships are associated with the perceived strength of connec-tions between causal factors and not only the presence or absence of factors(see also Einhorn & Hogarth, 1986, for a similar account of causal chains).These findings are also consistent with the work of Keil and colleagues(Keil, 2003; Mills & Keil, 2004; Rozenblit & Keil, 2002) on the ‘‘illusionof explanatory depth’’. They find that people often have a very coarseunderstanding of the details underlying the causal mechanisms of object andevent interactions that occur in the environment.
The imageability data suggest that individuals are better able to generatean internal mental image of the cause and effect relationship for candidatesrated as high in causal power (i.e., possessing a plausible causal mechanism)as opposed to candidates rated as low in causal power (i.e., containing animplausible causal mechanism). These data are consistent with theoreticalapproaches which suggest that complex reasoning can involve the internalmanipulation of quasi-pictorial graphical representations (e.g., de Vega,Intons-Peterson, Johnson-Laird, Denis, & Marschark, 1996; Gentner &Stevens, 1983; Johnson-Laird, 1983). In addition, these data extend andprovide a behavioural measure of recent functional magnetic resonanceimaging work conducted by Fugelsang and Dunbar (2005). They foundsignificantly higher correlated brain activations in the primary visual cortexfor causal candidates that contained plausible as opposed to implausiblecausal mechanisms. Recent research by Kosslyn and his colleagues(Kosslyn, 1994; Kosslyn, Ganis, & Thompson, 2001, 2003; Kosslyn,Thompson, Kim, & Alpert, 1995) has supported the relationship betweenprimary and secondary visual areas with mental imagery. In addition, thesedata are consistent with recent work on deductive reasoning that under-scores the role of visual imagery in complex reasoning tasks (Knauff,Fangmeier, Ruff, & Johnson-Laird, 2003).
The finding that familiarity was related to participants’ beliefs in causalpower provides further support for the predominant role of P(e/c) but notP(e/-c) in representations of causal knowledge. Specifically, our data showthat believable causal candidates are rated as highly familiar. Familiarityratings were also strongly associated with P(e/c) but not P(e/-c) ratings,suggesting that individuals perceive familiar candidate causes to be moreoften associated with the effect in question.
Taken together, these data highlight the multidimensional nature ofcausal knowledge whereby people’s representations of causation include, butare not limited to, the probability that the cause and effect co-occur, and thefamiliarity and the imageability of cause and effect relationships. Future
18 FUGELSANG, THOMPSON, DUNBAR

research should examine alternative modalities of causal beliefs beyondthose used in the current series of experiments. In so doing, one may gatherfurther insight into the ways in which beliefs about the causal mechanism ofan object may influence the degree to which people use and evaluatealternative cues to causality, such as covariation-based evidence (e.g.,Fugelsang & Thompson, 2003), temporal contiguity (e.g., Buehner & May,2002), and category membership (e.g., Waldmann, Holyoak, & Fratianne,1995). In addition, more in-depth analyses of graphical representations ofcausal models using verbal protocols may prove especially fruitful. Furtherstudies examining the representation and application of causal beliefs froman individual differences perspective may provide a means for examining themultiple facets of causal beliefs to which traditional group analyses may notbe sensitive.
Manuscript received 16 January 2004
Revised manuscript received 14 March 2005
REFERENCES
Ahn, W., Kalish, C. W., Medin, D. L., & Gelman, S. A. (1995). The role of covariation versus
mechanism information in causal attribution. Cognition, 54, 299 – 352.
Anderson, J. R., & Sheu, C. F. (1995). Causal inferences as perceptual judgements. Memory &
Cognition, 23, 510 – 524.
Baird, A. A., & Fugelsang, J. A. (2004). The emergence of consequential thought: Evidence
from neuroscience. Philosophical Transactions of The Royal Society of London: Series B, 359,
1797 – 1804.
Buehner, M. J., & May, J. (2002). Knowledge mediates the timeframe of covariation assessment
in human causal induction. Thinking & Reasoning, 8, 269 – 295.
Cheng, P. W. (1997). From covariation to causation: A causal power theory. Psychological
Review, 104, 367 – 405.
Cheng, P. W., & Lien, Y. (1995). The role of coherence in distinguishing between genuine and
spurious causes. In D. Sperber, D. Premack, & A. J. Premack (Eds.), Causal cognition: A
multidisciplinary debate (pp. 463 – 494). Oxford: Oxford University Press.
Cheng, P. W., & Novick, L. R. (1990). A probabilistic contrast model of causal induction.
Journal of Personality and Social Psychology, 58, 545 – 567.
Cheng, P. W., & Novick, L. R. (1992). Covariation in natural causal induction. Psychological
Review, 99, 365 – 382.
Choi, I., Nisbett, R. E., & Smith, E. E. (1997). Culture, category salience, and inductive
reasoning. Cognition, 65, 15 – 32.
Clement, C. A., & Falmagne, R. J. (1986). Logical reasoning, world knowledge, and mental
imagery: Interconnections in cognitive processes. Memory & Cognition, 14, 299 – 307.
De Soto, L. B., London, M., & Handel, M. S. (1965). Social reasoning and spatial paralogic.
Journal of Personality & Social Psychology, 2, 513 – 521.
de Vega, M., Intons-Peterson, M., Johnson-Laird, P. N., Denis, M., & Marschark, M. (1996).
Models of visuospatial cognition. London: Oxford University Press.
Downing, C. J., Sternberg, R. J., & Ross, B. H. (1985). Multicausal inference: Evaluation of
evidence in causally complex situations. Journal of Experiment Psychology: General, 114,
239 – 263.
CAUSAL KNOWLEDGE 19

Dunbar, K., & Fugelsang, J. (2005). Causal thinking in science: How scientists and students
interpret the unexpected. In M. E. Gorman, R. D. Tweney, D. Gooding, & A. Kincannon
(Eds.), Scientific and technical thinking (pp. 57 – 79). Mahwah, NJ: Lawrence Erlbaum
Associates Inc.
Einhorn, H. J., & Hogarth, R. M. (1986). Judging probable cause. Psychological Bulletin, 99,
3 – 19.
Evans, J. St. B. T. (2003). In two minds: Dual-process accounts of reasoning. Trends in
Cognitive Sciences, 7, 454 – 459.
Feeney, A., Evans, J. St. B. T., & Clibbens, J. (2000). Background beliefs and evidence
interpretation. Thinking & Reasoning, 6, 97 – 124.
Fugelsang, J. A., & Dunbar, K. N. (2005). Brain-based mechanisms underlying complex causal
thinking. Neuropsychologia, 48, 1204 – 1213.
Fugelsang, J. A., Roser, M., Corballis, P., Gazzaniga, M., & Dunbar, K. (2005). Brain
mechanisms underlying perceptual causality. Cognitive Brain Research, 24, 41 – 47.
Fugelsang, J. A., Stein, C., Green, A., & Dunbar, K. (2004). Theory and data interactions
of the scientific mind: Evidence from the molecular and the cognitive laboratory. Canadian
Journal of Experimental Psychology, 58, 86 – 95.
Fugelsang, J. A., & Thompson, V. A. (2003). A dual-process model of belief and evidence
interactions in causal reasoning. Memory & Cognition, 31, 800 – 815.
Gentner, D., & Stevens, A. L. (1983). Mental models. Hillsdale, NJ: Lawrence Erlbaum
Associates Inc.
Glymour, C. (2001). The mind’s arrows: Bayes nets and graphical causal models in psychology.
Cambridge, MA: The MIT Press.
Green, D. W., & McManus, I. C. (1995). Cognitive structural models: The perception
of risk and prevention of coronary heart disease. British Journal of Psychology, 86, 321 –
336.
Green, D. W., McManus, I. C., & Derrick, B. J. (1998). Cognitive structural models of
unemployment and employment. British Journal of Social Psychology, 37, 415 – 438.
Green, D. W., & Over, D. E. (2000). Decision theoretic effects in testing a causal conditional.
Current Psychology of Cognition, 19, 51 – 68.
Harre, R., & Madden, E. H. (1975). Causal powers: A theory of natural necessity. Oxford: Basil
Blackwell.
Hilton, D., & Slugoski, B. (1986). Knowledge-based causal attribution: The abnormal
conditions focus model. Psychological Review, 93, 75 – 88.
Hume, D. (1978). A treatise of human nature. Oxford: Oxford University Press. [Original work
published 1739.]
Johnson-Laird, P. N. (1983). Mental models. Cambridge: Cambridge University Press.
Johnson-Laird, P. N. (2001). Mental models and deduction. Trends in Cognitive Sciences, 5,
434 – 442.
Kahneman, D., & Tversky, A. (1982). The simulation heuristic. In D. Kahneman, P. Slovic, &
A. Tversky (Eds.), Judgement under uncertainty: Heuristics and biases (pp. 201 – 210).
Cambridge: Cambridge University Press.
Kahneman, D., & Tversky, A. (1996). On the reality of cognitive illusions. Psychological
Review, 103, 582 – 591.
Keil, F. C. (2003). Folkscience: Coarse interpretations of a complex reality. Trends in Cognitive
Sciences, 7, 368 – 373.
Kelley, H. (1973). The process of causal attribution. American Psychologist, 28, 107 – 128.
Klayman, J., & Ha, Y. (1987). Confirmation, disconfirmation, and information in hypothesis
testing. Psychological Review, 94, 211 – 228.
Kosslyn, S. M. (1994). Image and brain: The resolution of the imagery debate. Cambridge, MA:
MIT Press.
20 FUGELSANG, THOMPSON, DUNBAR

Kosslyn, S. M., Ganis, G., & Thompson, W. L. (2001). Neural foundations of imagery. Nature
Reviews Neuroscience, 2, 635 – 642.
Kosslyn, S. M., Ganis, G., & Thompson, W. L. (2003). Mental imagery: Against the nihilistic
hypothesis. Trends in Cognitive Sciences, 7, 109 – 111.
Kosslyn, S. M., Thompson, W. L., Kim, I. J., & Alpert, N. M. (1995). Topographical
representations of mental images in primary visual cortex. Nature, 278, 496 – 498.
Knauff, M., Fangmeier, T., Ruff, C. C., & Johnson-Laird, P. N. (2003). Reasoning, models, and
images: Behavioral measures and cortical activity. Journal of Cognitive Neuroscience, 15,
559 – 573.
Lien, Y., & Cheng, P. (2000). Distinguishing genuine from spurious causes: A coherence
hypothesis. Cognitive Psychology, 40, 87 – 137.
Mandel, D. R., & Lehman, D. R. (1998). Integration of contingency information in judgements
of cause, covariation, and probability. Journal of Experimental Psychology, 27, 269 – 285.
Medin, D. L., Lynch, E. B., & Solomon, K. O. (2000). Are there different kinds of concepts?
Annual Review of Psychology, 51, 121 – 147.
Mills, C., & Keil, F. C. (2004). Knowing the limits of one’s understanding: The development of
an awareness of an illusion of explanatory depth. Journal of Experimental Child Psychology,
87, 1 – 32.
Novick, L. R., & Cheng, P. W. (2004). Assessing interactive causal inference. Psychological
Review, 111, 455 – 485.
Over, D. E., & Green, D. W. (2001). Contingency, causation, and adaptive inference.
Psychological Review, 108, 682 – 684.
Pearson, D. G., Logie, R. H., & Gilhooly, K. J. (1999). Verbal representation and spatial
manipulation during mental synthesis. European Journal of Experimental Psychology, 11,
295 – 314.
Ram, A. (1993). Indexing, elaborating and refinement: Incremental learning of explanatory
cases. Machine Learning [Special Issue: Case-Based Reasoning], 10, 201 – 248.
Roser, M., Fugelsang, J., Dunbar, K., Corballis, P., & Gazzaniga, M. (in press). Dissociating
processes supporting causal perception and causal inference in the brain. Neuropsychology.
Rozenblit, L. R., & Keil, F. C. (2002). The misunderstood limits of folk science: An illusion of
explanatory depth. Cognitive Science, 26, 521 – 562.
Schustack, M. W., & Sternberg, R. J. (1981). Evaluation of evidence in causal inference. Journal
of Experimental Psychology: General, 110, 101 – 120.
Shafir, E. B., Smith, E. E., & Osherson, D. N. (1990). Typicality and reasoning fallacies.
Memory & Cognition, 18, 229 – 239.
Shultz, T. R. (1982). Rules of causal attribution. Monographs of the Society for Research in
Child Development, 47, 1 – 51.
Shultz, T. R., Fisher, G. W., Pratt, C. C., & Rulf, S. (1986). Selection of causal rules. Child
Development, 57, 143 – 152.
Waldmann, M. R., Holyoak, K. J., & Fratianne, A. (1995). Causal models and the acquisition
of category structure. Journal of Experimental Psychology: General, 124, 181 – 206.
Wasserman, E. A., Dorner, W. W., & Kao, S. F. (1990). Contributions of specific cell
information to judgements of interevent contingency. Journal of Experimental Psychology:
Learning, Memory, and Cognition, 16, 509 – 521.
White, P. A. (1989). A theory of causal processing. British Journal of Psychology, 80, 431 –
454.
White, P. A. (1995). Use of prior beliefs in the assignment of causal roles: Causal powers
versus covariation-based accounts. Memory & Cognition, 23, 243 – 254.
White, P. A. (2002a). Causal judgement from contingency information: Judging interactions
between two causal candidates. Quarterly Journal of Experimental Psychology, 55A, 819 –
838.
CAUSAL KNOWLEDGE 21

White, P. A. (2002b). Perceiving a strong causal relation in a weak contingency: Further
investigation of the evidential evaluation model of causal judgement. The Quarterly Journal
of Experimental Psychology, 55A, 97 – 114.
Young, M. E. (1995). On the origin of personal causal theories. Psychonomic Bulletin and
Review, 2, 83 – 104.
APPENDIX A
Causal scenarios used in Experiment 1
Note: The 40 scenarios used in Experiment 1 are presented on the followingpages. Each scenario is preceded by a code (e.g., 11), which denotes the levelof the BELIEF and COVARIATION manipulation (1¼ high and 0¼ low),for each scenario (e.g., Fever, Exam Success, Cancer, etc.). This coding isalso used in Appendices B –E.
Fever
11 Imagine you are a school nurse who is trying to determine the cause ofa recent outbreak of fevers in children. You have a hypothesis that thefevers may be due contracting the flu virus.
01 Imagine you are a school nurse who is trying to determine the cause ofa recent outbreak of fevers in children. You have a hypothesis that thefevers may be due to having chills.
10 Imagine you are a school nurse who is trying to determine the cause ofa recent outbreak of fevers in children. You have a hypothesis that thefevers may be due to coming in contact with someone with a cold.
00 Imagine you are a school nurse who is trying to determine the cause ofa recent outbreak of fevers in children. You have a hypothesis that thefevers may be due to eating apples.
Exam Success
11 Imagine you are a professor who is trying to determine the cause ofstudents’ success in exams. You have a hypothesis that exam successmay be due to studying.
01 Imagine you are a professor who is trying to determine the cause ofstudents’ success in exams. You have a hypothesis that exam successmay be due to success in writing papers.
22 FUGELSANG, THOMPSON, DUNBAR

10 Imagine you are a professor who is trying to determine the cause ofstudents’ success in exams. You have a hypothesis that exam successmay be due to having a good sleep the night before.
00 Imagine you are a professor who is trying to determine the cause ofstudents’ success in exams. You have a hypothesis that exam successmay be due to eating cornflakes for breakfast.
Cancer
11 Imagine you are a researcher who is trying to determine the cause oflung cancer in a group of patients. You have a hypothesis that the lungcancer may be due to exposure to high doses of radiation.
01 Imagine you are a researcher who is trying to determine the cause oflung cancer in a group of patients. You have a hypothesis that the lungcancer may be due to coughing.
10 Imagine you are a researcher who is trying to determine the cause oflung cancer in a group of patients. You have a hypothesis that the lungcancer may be due to smoking.
00 Imagine you are a researcher who is trying to determine the cause oflung cancer in a group of patients. You have a hypothesis that the lungcancer may be due to taking vitamin C supplements.
Drowsiness
11 Imagine you are a counsellor at the University who is trying todetermine the cause of drowsiness in a group of students. You have ahypothesis that the drowsiness may be due to taking valium.
01 Imagine you are a counsellor at the University who is trying todetermine the cause of drowsiness in a group of students. You have ahypothesis that the drowsiness may be due to having reduced attention.
10 Imagine you are a counsellor at the University who is trying todetermine the cause of drowsiness in a group of students. You have ahypothesis that the drowsiness may be due to taking cold medication.
00 Imagine you are a counsellor at the University who is trying todetermine the cause of drowsiness in a group of students. You have ahypothesis that the drowsiness may be due to listening to loud music.
CAUSAL KNOWLEDGE 23

Plane Crashes
11 Imagine you are an investigator for the FAA trying to determine thecause of a recent surge of airplane crashes. You have a hypothesis thatthe airplane crashes may be due to malfunctioning fuel lines.
01 Imagine you are an investigator for the FAA trying to determinethe cause of a recent surge of airplane crashes. You have a hypo-thesis that the airplane crashes may be due to the activation of the blackbox.
10 Imagine you are an investigator for the FAA trying to determine thecause of a recent surge of airplane crashes. You have a hypothesis thatthe airplane crashes may be due to pilot illness.
00 Imagine you are an investigator for the FAA trying to determine thecause of a recent surge of airplane crashes. You have a hypothesis thatthe airplane crashes may be due to the introduction of a new pilotuniform.
Fatigue
11 Imagine you are a doctor who is trying to determine the cause of fatiguein a group of patients. You have a hypothesis that the fatigue may bedue to having insomnia.
01 Imagine you are a doctor who is trying to determine the cause of fatiguein a group of patients. You have a hypothesis that the fatigue may bedue to anxiety.
10 Imagine you are a doctor who is trying to determine the cause of fatiguein a group of patients. You have a hypothesis that the fatigue may bedue to feelings of irritability.
00 Imagine you are a doctor who is trying to determine the cause of fatiguein a group of patients. You have a hypothesis that the fatigue may bedue to drinking orange juice.
Red Swollen Eyes
11 Imagine you are an allergist who is trying to determine the cause of redswollen eyes in a group of patients. You have a hypothesis that the redswollen eyes may be due to exposure to tree pollen.
24 FUGELSANG, THOMPSON, DUNBAR

01 Imagine you are an allergist who is trying to determine the cause of redswollen eyes in a group of patients. You have a hypothesis that the redswollen eyes may be due to having a runny nose.
10 Imagine you are an allergist who is trying to determine the cause of redswollen eyes in a group of patients. You have a hypothesis that the redswollen eyes may be due to exposure to smog pollution.
00 Imagine you are an allergist who is trying to determine the cause of redswollen eyes in a group of patients. You have a hypothesis that the redswollen eyes may be due to drinking Evian water.
Slippery Roads
11 Imagine you are researcher for the ministry of transportation who istrying to determine the cause of slippery roads in townships. You havea hypothesis that the slippery roads may be due to ice storms.
01 Imagine you are researcher for the ministry of transportation who istrying to determine the cause of slippery roads in townships. You havea hypothesis that the slippery roads may be due to slippery sidewalks.
10 Imagine you are researcher for the ministry of transportation who istrying to determine the cause of slippery roads in townships. You havea hypothesis that the slippery roads may be due to rainfall.
00 Imagine you are researcher for the ministry of transportation who istrying to determine the cause of slippery roads in townships. You havea hypothesis that the slippery roads may be due to excessive traffic.
Thunderstorms
11 Imagine you are a meteorologist who is trying to determine the cause ofthunderstorms. You have a hypothesis that the thunderstorms may bedue to a sudden drop in atmospheric pressure.
01 Imagine you are a meteorologist who is trying to determine the cause ofthunderstorms. You have a hypothesis that the thunderstorms may bedue to a drop in barometer readings.
10 Imagine you are a meteorologist who is trying to determine the cause ofthunderstorms. You have a hypothesis that the thunderstorms may bedue to dense cloud cover.
CAUSAL KNOWLEDGE 25
00 Imagine you are a meteorologist who is trying to determine the cause ofthunderstorms. You have a hypothesis that the thunderstorms may bedue to Chinook winds.
Flowers Blooming
11 Imagine you are a horticulturist who is trying to determine the cause offlowers blooming. You have a hypothesis that the flowers bloomingmay be due the presence of sunlight.
01 Imagine you are a horticulturist who is trying to determine the cause offlowers blooming. You have a hypothesis that the flowers bloomingmay be due to the presence of bees.
10 Imagine you are a horticulturist who is trying to determine the cause offlowers blooming. You have a hypothesis that the flowers bloomingmay be due to the presence of fertiliser.
00 Imagine you are a horticulturist who is trying to determine the cause offlowers blooming. You have a hypothesis that the flowers bloomingmay be due to the plants being planted in red pots.
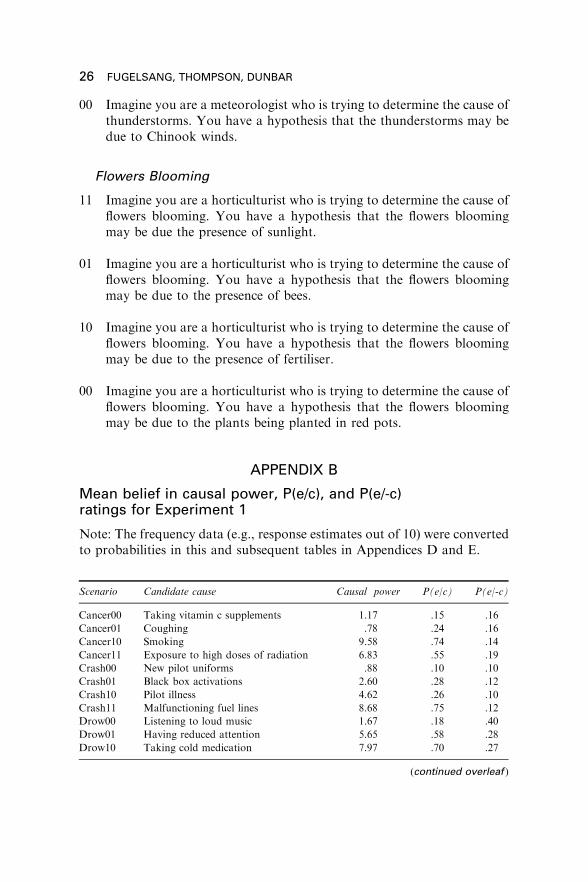
APPENDIX B
Mean belief in causal power, P(e/c), and P(e/-c)ratings for Experiment 1
Note: The frequency data (e.g., response estimates out of 10) were convertedto probabilities in this and subsequent tables in Appendices D and E.
Scenario Candidate cause Causal power P(e/c) P(e/-c)
Cancer00 Taking vitamin c supplements 1.17 .15 .16
Cancer01 Coughing .78 .24 .16
Cancer10 Smoking 9.58 .74 .14
Cancer11 Exposure to high doses of radiation 6.83 .55 .19
Crash00 New pilot uniforms .88 .10 .10
Crash01 Black box activations 2.60 .28 .12
Crash10 Pilot illness 4.62 .26 .10
Crash11 Malfunctioning fuel lines 8.68 .75 .12
Drow00 Listening to loud music 1.67 .18 .40
Drow01 Having reduced attention 5.65 .58 .28
Drow10 Taking cold medication 7.97 .70 .27
(continued overleaf )
26 FUGELSANG, THOMPSON, DUNBAR
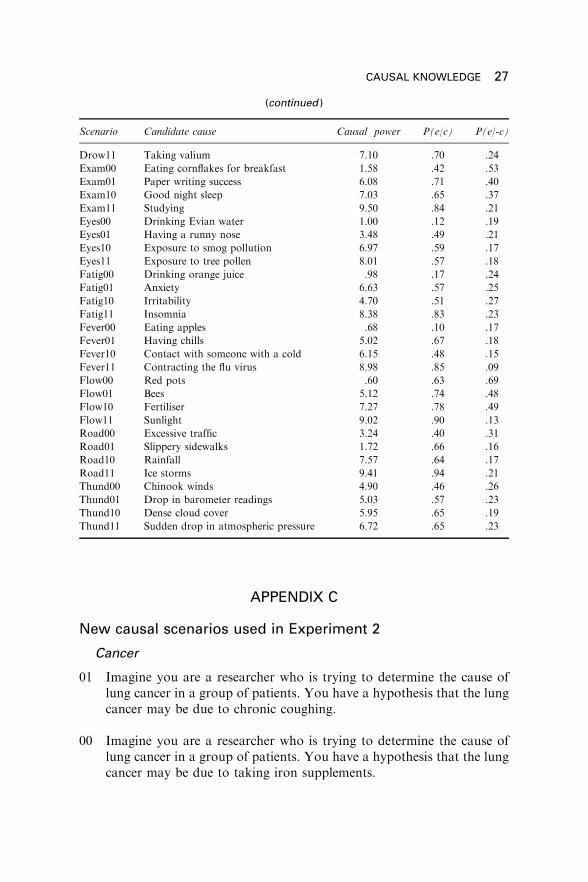
APPENDIX C
New causal scenarios used in Experiment 2
Cancer
01 Imagine you are a researcher who is trying to determine the cause oflung cancer in a group of patients. You have a hypothesis that the lungcancer may be due to chronic coughing.
00 Imagine you are a researcher who is trying to determine the cause oflung cancer in a group of patients. You have a hypothesis that the lungcancer may be due to taking iron supplements.
(continued )
Scenario Candidate cause Causal power P(e/c) P(e/-c)
Drow11 Taking valium 7.10 .70 .24
Exam00 Eating cornflakes for breakfast 1.58 .42 .53
Exam01 Paper writing success 6.08 .71 .40
Exam10 Good night sleep 7.03 .65 .37
Exam11 Studying 9.50 .84 .21
Eyes00 Drinking Evian water 1.00 .12 .19
Eyes01 Having a runny nose 3.48 .49 .21
Eyes10 Exposure to smog pollution 6.97 .59 .17
Eyes11 Exposure to tree pollen 8.01 .57 .18
Fatig00 Drinking orange juice .98 .17 .24
Fatig01 Anxiety 6.63 .57 .25
Fatig10 Irritability 4.70 .51 .27
Fatig11 Insomnia 8.38 .83 .23
Fever00 Eating apples .68 .10 .17
Fever01 Having chills 5.02 .67 .18
Fever10 Contact with someone with a cold 6.15 .48 .15
Fever11 Contracting the flu virus 8.98 .85 .09
Flow00 Red pots .60 .63 .69
Flow01 Bees 5.12 .74 .48
Flow10 Fertiliser 7.27 .78 .49
Flow11 Sunlight 9.02 .90 .13
Road00 Excessive traffic 3.24 .40 .31
Road01 Slippery sidewalks 1.72 .66 .16
Road10 Rainfall 7.57 .64 .17
Road11 Ice storms 9.41 .94 .21
Thund00 Chinook winds 4.90 .46 .26
Thund01 Drop in barometer readings 5.03 .57 .23
Thund10 Dense cloud cover 5.95 .65 .19
Thund11 Sudden drop in atmospheric pressure 6.72 .65 .23
CAUSAL KNOWLEDGE 27
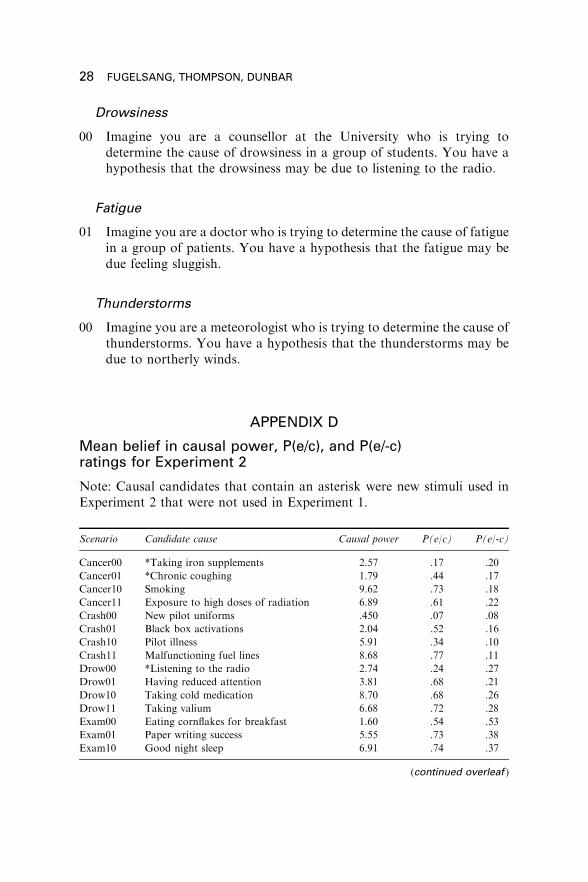
Drowsiness
00 Imagine you are a counsellor at the University who is trying todetermine the cause of drowsiness in a group of students. You have ahypothesis that the drowsiness may be due to listening to the radio.
Fatigue
01 Imagine you are a doctor who is trying to determine the cause of fatiguein a group of patients. You have a hypothesis that the fatigue may bedue feeling sluggish.
Thunderstorms
00 Imagine you are a meteorologist who is trying to determine the cause ofthunderstorms. You have a hypothesis that the thunderstorms may bedue to northerly winds.
APPENDIX D
Mean belief in causal power, P(e/c), and P(e/-c)ratings for Experiment 2
Note: Causal candidates that contain an asterisk were new stimuli used inExperiment 2 that were not used in Experiment 1.
Scenario Candidate cause Causal power P(e/c) P(e/-c)
Cancer00 *Taking iron supplements 2.57 .17 .20
Cancer01 *Chronic coughing 1.79 .44 .17
Cancer10 Smoking 9.62 .73 .18
Cancer11 Exposure to high doses of radiation 6.89 .61 .22
Crash00 New pilot uniforms .450 .07 .08
Crash01 Black box activations 2.04 .52 .16
Crash10 Pilot illness 5.91 .34 .10
Crash11 Malfunctioning fuel lines 8.68 .77 .11
Drow00 *Listening to the radio 2.74 .24 .27
Drow01 Having reduced attention 3.81 .68 .21
Drow10 Taking cold medication 8.70 .68 .26
Drow11 Taking valium 6.68 .72 .28
Exam00 Eating cornflakes for breakfast 1.60 .54 .53
Exam01 Paper writing success 5.55 .73 .38
Exam10 Good night sleep 6.91 .74 .37
(continued overleaf )
28 FUGELSANG, THOMPSON, DUNBAR

(continued )
Scenario Candidate cause Causal power P(e/c) P(e/-c)
Exam11 Studying 9.55 .86 .24
Eyes00 Drinking Evian water .74 .08 .10
Eyes01 Having a runny nose 2.38 .59 .17
Eyes10 Exposure to smog pollution 7.98 .56 .18
Eyes11 Exposure to tree pollen 8.19 .56 .16
Fatig00 Drinking orange juice .66 .14 .24
Fatig01 *Feeling sluggish 4.13 .86 .18
Fatig10 Irritability 4.04 .60 .27
Fatig11 Insomnia 7.96 .85 .22
Fever00 Eating apples .66 .07 .10
Fever01 Having chills 3.60 .66 .17
Fever10 Contact with someone with a cold 5.70 .45 .15
Fever11 Contracting the flu virus 8.91 .83 .12
Flow00 Red pots .23 .75 .72
Flow01 Bees 4.32 .79 .40
Flow10 Fertiliser 7.30 .84 .43
Flow11 Sunlight 8.53 .90 .14
Road00 Excessive traffic 2.66 .29 .39
Road01 Slippery sidewalks 1.15 .91 .18
Road10 Rainfall 8.17 .73 .10
Road11 Ice storms 9.28 .96 .19
Thund00 *Northerly winds 4.43 .43 .26
Thund01 Drop in barometer readings 3.79 .69 .16
Thund10 Dense cloud cover 5.51 .61 .17
Thund11 Sudden drop in atmospheric pressure 6.85 .68 .16
CAUSAL KNOWLEDGE 29

Scenario
Candidate
cause
CP
P(e/c)
P(e/-c)
Fam
Image
Detail
Cancer00
Takingironsupplements
2.70
.19
.15
2.40
2.25
3.53
Cancer01
Chronic
coughing
2.20
.33
.14
3.25
2.60
3.71
Cancer10
Smoking
6.67
.66
.11
5.30
6.65
3.97
Cancer11
Exposure
tohighdosesofradiation
5.40
.53
.13
3.82
4.97
3.37
Exam00
Eatingcornflakes
forbreakfast
2.62
.57
.50
4.32
3.55
3.92
Exam01
Paper
writingsuccess
4.65
.73
.43
5.25
4.45
3.85
Exam10
Goodnightsleep
5.45
.69
.43
5.80
5.80
3.87
Exam11
Studying
6.62
.84
.26
6.37
6.65
3.85
Fever00
Eatingapples
1.71
.15
.13
4.00
2.51
4.07
Fever01
Havingchills
2.67
.65
.11
3.87
2.90
3.79
Fever10
Contact
withsomeonewithacold
5.57
.51
.14
4.67
5.45
4.12
Fever11
Contractingthefluvirus
6.60
.85
.11
4.95
6.22
3.65
Flow00
Red
pots
1.37
.67
.66
3.47
2.12
3.52
Flow01
Bees
4.85
.82
.46
4.10
4.77
3.42
Flow10
Fertiliser
5.55
.81
.53
4.32
5.50
3.75
Flow11
Sunlight
6.07
.82
.11
4.40
6.15
3.85
Road00
Excessivetraffic
2.60
.32
.24
3.60
3.00
3.43
Road01
Slipperysidew
alks
1.52
.57
.18
3.80
1.60
3.41
Road10
Rainfall
6.45
.82
.14
5.32
6.45
3.55
Road11
Icestorm
s6.75
.93
.18
5.05
6.80
3.45
Note:CP¼causalpower
rating,Fam¼familiarity,Im
age¼im
ageability,Detail¼meannumber
offactors
indiagram.
AP
PE
ND
IXE
Me
an
be
lie
fin
cau
sal
po
we
r,P
(e/c
),P
(e/-
c),
fam
ilia
rity
,im
ag
ea
bilit
y,
an
dd
eta
ile
dn
ess
rati
ng
sfo
rE
xp
eri
me
nt
3
30