examining the understanding of inquiry-based learning and
TRANSCRIPT
East Tennessee State UniversityDigital Commons @ East
Tennessee State University
Electronic Theses and Dissertations Student Works
12-2017
Examining the Understanding of Inquiry-BasedLearning and Teaching Among UndergraduateTeachers and StudentsMaren HudsonEast Tennessee State University
Follow this and additional works at: https://dc.etsu.edu/etd
Part of the Biology Commons, Higher Education and Teaching Commons, and the Science andMathematics Education Commons
This Dissertation - Open Access is brought to you for free and open access by the Student Works at Digital Commons @ East Tennessee StateUniversity. It has been accepted for inclusion in Electronic Theses and Dissertations by an authorized administrator of Digital Commons @ EastTennessee State University. For more information, please contact [email protected].
Recommended CitationHudson, Maren, "Examining the Understanding of Inquiry-Based Learning and Teaching Among Undergraduate Teachers andStudents" (2017). Electronic Theses and Dissertations. Paper 3338. https://dc.etsu.edu/etd/3338

Examining the Understanding of Inquiry-Based Learning and Teaching Among
Undergraduate Teachers and Students
_____________________
A thesis
presented to
the faculty of the Department of Biological Sciences
East Tennessee State University
In partial fulfillment
of the requirements for the degree
Master of Science in Biology
_____________________
by
Maren Hudson
December 2017
_____________________
Anna C. Hiatt, Ph.D., Chair
Thomas C. Jones, Ph.D.
Laura Robertson, Ph.D.
Keywords: inquiry, active learning, learning, teaching, undergraduate education, post-
secondary education, Q methodology, POGILS, CURE, REU, Vision and Change,
Framework for K-12
2
ABSTRACT
Examining the Understanding of Inquiry-Based Learning and Teaching Among
Undergraduate Teachers and Students
by
Maren Hudson
One of the main aims of inquiry is to engage students as active, not passive,
participants in science. The purpose of this study is to describe science educators’ and
students’ views about inquiry-based instruction in order to better understand and
improve implementation of evidence-based teaching strategies. Inquiry-based
techniques have been shown to improve student understanding of scientific concepts,
yet, there continue to be challenges in implementing these techniques. This research
project utilizes Q Methodology, a research method that captures both common and
disparate measures of subjectivity, to identify commonalities and defining viewpoints
about inquiry-based teaching and learning. Three significantly different viewpoints were
identified and each viewpoint represents differences in teaching styles and classroom
environments. Additionally, consensus items reveal students and instructors highly
value relating science to everyday life; however, a lack of importance is placed upon
peer learning and use of open-ended questions.
3
ACKNOWLEDGEMENTS
I would like to thank my supervisor, Dr. Hiatt, for her constant support and
encouraging attitude throughout this study.
To members of my committee, Dr. Jones and Dr. Robertson, thank you for your
support and feedback throughout this research.
To my husband, Mr. C. E. Hudson, without whose support my dream of returning
to school would have never been possible.
To my mom, Ms. S. Y. Blevins, for believing in my potential even when I was
unable.
4
TABLE OF CONTENTS
Page
ABSTRACT ................................................................................................................... 2
ACKNOWLEDGEMENTS ............................................................................................... 3
TABLE OF CONTENTS .................................................................................................. 4
LIST OF TABLES ............................................................................................................ 7
Chapter
1. INTRODUCTION ......................................................................................................... 8
Inquiry-Based Instruction ...................................................................................... 8
Science Process Skills ....................................................................................... 11
Crosscutting Concepts ....................................................................................... 12
Previous Results ................................................................................................. 14
Literature Review ................................................................................................ 17
Statement of Problem .............................................................................. 19
Objectives ................................................................................................ 19
Hypotheses .............................................................................................. 20
2. THEORETICAL FRAMEWORK................................................................................. 21
Influential Investigators ....................................................................................... 21
Zone of Proximal Development ................................................................ 23

5
Scaffolding ............................................................................................... 24
Post-Positivism ................................................................................................... 24
Interpretivism ...................................................................................................... 25
Situated Cognition and Cognitive Apprenticeship ............................................... 26
3. METHODS ................................................................................................................ 27
Participants ......................................................................................................... 27
Q Method ............................................................................................................ 28
Designing the Q Set ................................................................................. 30
Delivering the Q Sort................................................................................ 30
Analysis with PQ Method ......................................................................... 31
Follow-Up Interviews................................................................................ 32
4. RESULTS .................................................................................................................. 33
Identifying Factors and Significant Loadings ...................................................... 33
Post Sort Interview ............................................................................................. 41
5. DISCUSSION ............................................................................................................ 42
Viewpoints .......................................................................................................... 42
Inquiry in the Classroom ..................................................................................... 44
Implementation Fidelity ............................................................................ 46

6
Advancing Inquiry ............................................................................................... 47
Assessments ........................................................................................... 50
Professional Development Implications ................................................... 53
Future Directions ................................................................................................ 55
REFERENCES .............................................................................................................. 57
APPENDICES ............................................................................................................... 68
Appendix A: Q Statements ................................................................................. 68
Appendix B: Q Sort Instructions .......................................................................... 70
Appendix C: Records Sheet ............................................................................... 72
Appendix D: Follow-up Script ............................................................................. 74
VITA .............................................................................................................................. 77

7
LIST OF TABLES
Table Page
1. Factor Loadings .................................................................................................. 33
2. Q-sort Values for Each Statement ...................................................................... 36
3. Defining Statements for Each Factor .................................................................. 39
4. Consensus Statements (p<0.05) ........................................................................ 40
5. Demographics Summary for Participants with Significant Loadings ................... 40
8
CHAPTER 1
INTRODUCTION
Inquiry-Based Instruction
Inquiry-based instruction relies on students’ use of scientific knowledge to ask
questions, collect data, analyze evidence, and develop explanations and then
communicate that information to peers (National Research Council 1996). Depending
on classroom dynamics or students’ background an instructor may employ structured,
open, or guided inquiry.
When using structured inquiry, educators provide students with broad research
questions with examples of methods that can be used to answer these questions.
Students are not informed of expected outcome, but instead expected to answer the
research questions and analyze and evaluate the results (Colburn 2000). Structured
inquiry can be used in introductory level courses where students have not yet
developed the necessary skill to work more independently.
Inquiry can also be guided in which the educator provides students with the initial
research question, but allows the students to define their own methods. The educator’s
purpose is to be a facilitator for the students when they have questions, but it is not to
be the primary source of information. In this type of inquiry, students are also required to
analyze and evaluate their own results (Kuhthau et al. 2015). Guided inquiry is
frequently used within laboratory courses where students are given a common problem,
but must create their own hypotheses and experimental design.

9
Authentic inquiry instruction relies heavily on the student and places them in total
charge of the learning process. Students will establish their own research question,
define methods to answer that question, and analyze and evaluate data gathered
through their methods (Colburn 2000). Individuals will create their own projects based
upon independent research and carry out experiments. Many third and fourth year
students who participate in undergraduate independent research with a faculty member
are engaged in authentic inquiry.
Some examples of large-scale inquiry-based techniques used in the class room
today include Process Oriented Guided Inquiry Learning (POGIL), Course-based
Undergraduate Research Experience (CURE), and Research Experience for
Undergraduates (REU). POGIL originated in college chemistry departments in 1994, but
now has more than 1,000 implementers in a wide range of disciplines in high school and
colleges around the country (Moog et al. 2006). POGIL is a classroom and lab
technique that seeks to teach content and key process skills such as the ability to think
analytically and work effectively as part of a team. Implementation of POGIL consists of
any number of students working in small groups on specially designed guided inquiry
materials. These materials supply students with data or information followed by leading
questions designed to guide them toward formulating their own valid conclusions. The
instructor serves as a facilitator, observing and periodically addressing individual and
classroom-wide needs (Moog et al. 2006).
Course-based Undergraduate Research Experiences (CUREs) are another
implementation of inquiry learning (CUREnet 2017). CURES are becoming more wide-

10
spread among biology departments and courses as a means of helping students
understand core concepts in biology, develop core scientific competencies, and become
active, contributing members of the scientific community. CUREnet is a web-based
program that organizes in-person meetings to establish these projects. Individuals are
assembled with diverse expertise (instructors, researchers, information technology
specialists) who represent diverse institutions and a variety of projects in terms of data
(genomic, phenotypic, ecological). Through this web portal, students can browse current
projects or propose their own. The Science Education Alliance (SEA) is currently
offering a program in which students identify and characterize bacteriophages from their
local surroundings, annotate the phage genomes, and submit the annotated sequences
to the National Center for Biotechnology Information GenBank database (SEA 2017).
This program, SEA-PHAGES, is a national research-based lab course targeting early
education science students. During the 2016-17 year “more than 4,100 mostly first-year
students from 100 different colleges and universities took part in [SEA-PHAGES],
generating more than 20 peer-reviewed publications” (SEA 2017).
Research Experience for Undergraduates (REU) is another inquiry-based
program sponsored by the National Science Foundation that supports active research
participation by undergraduate students in any of the areas of research funded by the
National Science Foundation (NSF 2017). The areas of research funded by the NSF are
quite vast, literally ranging from A to Z with every science in between. This program
gives students an opportunity to engage in inquiry based upon their own proposals.

11
Inquiry instructions comes in many different forms, but always relies on students’
ability to ask questions, gather data, analyze evidence, develop explanations, and then
explain this information to others.
Science Process Skills
Science process skills are defined by a set of broadly transferable abilities that
are used in several science occupations and indicative of real scientists’ behavior
(Padilla 1990). Science process skills include more basic skill sets which provide a
foundation to understanding science as an investigative process and include more
complex skill sets in which basic science processes are applied to synthesize new
knowledge and formulate new questions.
Basic processing skills include observing, inferring, measuring, communicating,
classifying, and predicting. More complex skills are controlling variables, defining
operationally, formulating hypotheses, interpreting data, experimenting, and formulating
models (Padilla 1990). Knowledge of basic science processing skills will be essential to
reach more complex skills which define actual scientific research. These skills are
necessary to succeed in not only scientific occupations, but also other disciplines such
as technology, engineering, and mathematics. These areas will require the use of
scientific analyses, argumentation, engineering design, and communication (National
Research Council 2012).
There is a need for broad reforms across K-16 science education in order to
develop a growing STEM workforce and inquiry-based instruction provides a means to

12
help students develop necessary problem-solving and critical thinking skills. In several
classrooms, science education practices do not give students the skills needed for
developing scientists (Drake and Long 2009). Many science courses focus on
memorizing facts and increasing content knowledge, but do little to promote and
develop problem-solving skills (Furtado 2010). For students to excel in science
courses, science processing skills need to be emphasized over memorization of facts
(Aydeniz et al. 2012). When students can examine, reason, and unify information
through inquiry learning, they are better able to gain new knowledge (Minner et al. 2010;
Graham and Retinger 2012).
If the United States is to continue to be economically competitive then the nation
must create a strong STEM-capable workforce (National Science Foundation 2015).
One report has found that if sub-baccalaureate STEM workers are included, then there
may be as many as 26 million jobs in the U.S. that require significant STEM skills,
representing 20% of all U.S. jobs (National Science Foundation 2015). The U.S.,
however, has one of the lowest ratios of STEM to non-STEM bachelor’s degrees among
developed nations (National Science Board 2014). This study aims to better understand
how instructors utilize inquiry-based strategies in hopes of improving the opportunities
that students have to develop essential STEM skills.
Crosscutting Concepts
Framework for K-12 Science Educators (2012), was published to help address
the problems of defining inquiry. They argue that science education is not organized
systematically across multiple years of school, emphasizes discrete facts with focus on
13
breadth over depth, and does not provide students with engaging opportunities to
experience how science is done. The Framework is designed to directly address and
overcome these weaknesses. Students cannot comprehend scientific practices, nor
fully appreciate the nature of scientific knowledge itself, without directly experiencing
those practices for themselves. Actively participating and performing work as a scientist
or engineer can engage students’ curiosity, capture their interest, and motivate their
continued study.
The Framework addresses three major dimensions in which students need to be
actively engaged. The first dimension is Core Ideas. These Core Ideas should come
from physical science, life science, earth and space science, as well as engineering and
technology (National Research Council 2012). The second of these dimensions is
Scientific and Engineering Practices. Within this dimension; students need to be asking
questions and defining problems, using models, planning and carrying out
investigations, and analyzing and interpreting data. This dimension focuses on science
processing skills discussed in the previous section. The third dimension is Crosscutting
Concepts which focuses on concepts learned that unify the study of science and
engineering through their common application across fields.
Crosscutting concepts integrate both content and skills which provides a
knowledge-based context in which students can apply scientific skill sets. These
concepts include patterns, cause and effect, systems and system models, energy and
matter, structure and function, stability and change, and scale, proportion, and quantity.
These concepts allow for students to have “an organizational framework for connecting
knowledge from various disciplines into a coherent and scientifically based view of the

14
word” (National Research Council 2012). By capturing the viewpoints of educators and
students, we can better determine how well these kinds of polices translate into
classroom practices and affect change in K-12 and undergraduate education.
Previous Results
The following study builds on a previously unpublished study conducted at a
large research-intensive state university that used Q methodology to “uncover the
viewpoints science educators at all levels of instruction have today and examine the
types of inquiry activities incorporated in their courses” (Hiatt 2011). Within this
previous work, three distinctive perspectives were found within the population of
interest. Given the introduction of new science education policies and the rise in
implementation of more contemporary teaching practices since the previous study, this
study aims to better understand how viewpoints about inquiry-based strategies may
have changed and seeks to tackle new and interesting information that undergraduate
students may provide.
In the 2011 study, the first of the three viewpoints was defined as a “naïve
teacher”. These educators do not fully comprehend the nature of inquiry-based
teaching and learning. They do not differentiate between active learning and inquiry.
Most of the educators in this viewpoint are undergraduate pre-service teachers with
very little experience teaching. When completing the Q sort, they usually chose
‘buzzwords’ such as engagement and active learning. When discussing hands-on
activities within the classroom, they typically prefer ready-made kits as opposed to
problem-based activities.
15
The second viewpoint was defined as “active learning, student-centered teacher”.
These educators focus on student-centered activities such as individualized learning
and improving critical thinking skills. They are similar to the naïve teachers in that they
utilize active learning strategies more than authentic inquiry-based strategies. A
common characteristic was that creativity is encouraged within the classroom. All
educators within this viewpoint were found to have between 0 and 5 years of teaching
experience and included K-12 and college instructors.
The final viewpoint described was the “experienced, problem-based teacher”.
These educators typically use authentic scientific examples and problem-based
teaching methods. Current research and literature are used to direct their teaching as
well as understanding misconceptions students may have about their subject of interest.
All educators within this viewpoint have some teaching experience, ranging from 2 to 21
years and included both K-12 and college instructors. Many of these educators also
conducted scientific research.
Within these three factors there were also consensus statements, or statements
upon which all participants agreed/disagreed. All participants agree that teaching
science should focus on improving critical thinking skills. All participants neither agreed
nor disagreed (remained neutral) when asked if their students were guided towards
investigations and asked to provide explanations. All participants disagreed with
statements regarding teaching inquiry using peer-mediated learning and discovery-
based learning
16
This study was conducted in 2011 in response to the goals outlined in the
National Science Education Standards (1996) as well as Vision and Change in
Undergraduate Biology Education: A Call to Action (American Association for the
Advancement of Science 2009). Within these documents, a need for teaching science
to reflect the nature of scientific exploration was addressed by asking educators to
incorporate inquiry into teaching and learning science. The results of this study provide
a snapshot into the use of inquiry within the classroom.
Since this study, more documents and related polices have emerged supporting
the use of inquiry-based teaching within the classroom (Minner et al. 2010; Freeman et
al. 2014; Beck et al. 2014). Shortly after Vision and Change (American Association for
the Advancement of Science 2009) another report, Framework for K-12 Science
Educators (National Research Council 2012), was published to help address the
problems of defining inquiry. They argue that science education is not organized
systematically across multiple years of school, that it emphasizes discrete facts with
focus on breadth over depth, and does not provide students with engaging opportunities
to experience how science is executed. The framework is designed to directly address
and overcome these weaknesses. Students cannot comprehend scientific practices,
nor fully appreciate the nature of scientific knowledge itself, without directly experiencing
those practices for themselves. The actual doing of science or engineering can engage
students’ curiosity, capture their interest, and motivate their continued study.
Today an increasing number of important professions, including the fields of
science, technology, engineering, and mathematics, will require applicants to use
scientific analyses, argumentation, communication, and engineering design (National
17
Research Council 2012). Introducing science processes skills such as these is critical
in educating a new generation to be competent employees in the 21st century workforce.
This current study is necessary to determine what changes have emerged in the
past 6 years as momentum has increased in implementing evidence-based approaches
to teaching and learning, particularly the use of inquiry teaching and learning within the
classroom. Some changes have been made in relation to the population from which the
original study was drawn. Within the current study, participants came from
undergraduate educational fields. The current study also sampled both educators and
students to determine if teaching instruction is perceived similarly between both groups.
Literature Review
In 2011, the Vision and Change (American Association for the Advancement of
Science) report placed an emphasis on inquiry based teaching and learning. Inquiry
based science needs to introduce scientific process early in education and integrate it
into all undergraduate biology. Learning goals need to be clear and associated with core
concepts. Some of these core concepts include: the ability to apply the process of
science and quantitative reasoning, ability to use modeling and simulations, ability to tap
into interdisciplinary nature of science, ability to communicate and collaborate with other
disciplines, and the ability to understand the relationships between science and society.
Students need to relate abstract concepts to real-world application on a regular basis.
Educators are encouraged to cover fewer concepts with greater detail (American
Association for the Advancement of Science 2011). Evidence-based approaches, such
18
as active learning and inquiry, have been shown to be effective in science courses
(Minner et al. 2010; Beck et al. 2014; Freeman et al. 2014).
Inquiry-based instruction has been studied on a large scale and found to have
positive outcomes. The Inquiry Synthesis Project synthesized findings from research
conducted between 1984-2002 to investigate what exactly is inquiry science instruction
in k-12 in relation to student outcomes. Analysis of 138 studies indicate a clear, positive
trend favoring inquiry-based instructional practices (Minner et al. 2010). Inquiry in K-12
education has been found to have positive effects in not only assessment scores, but
also a student’s comfort with the material. These effects, however, are not limited to k-
12 education but can also be used in higher education.
Another review of 142 papers from 2005-2012 also indicated a positive effect of
inquiry based teaching reforms on students learning of science (Beck et al. 2014). Most
of the studies within this review were subdisciplines of life sciences where guided
inquiry was used within the course. These studies were focused on undergraduate
biology laboratory courses, supporting the use of inquiry through postsecondary
schooling.
Freeman et al. (2014) conducted a meta-analysis of 225 studies comparing
traditional lecturing versus active learning. From this analysis, they found that
classrooms that implement active learning have higher student performance on
examinations and concept inventories compared to traditional lecturing. This is one of
the largest and most comprehensive meta-analysis of undergraduate STEM education
published to date (Freeman et al. 2014). Undergraduate science, technology,

19
engineering, and mathematics courses were examined within this study. Inquiry-based
instruction has application in not only science courses, as the previous studies have
examined, but also other STEM disciplines. These analyses raise questions about the
continued use of traditional lecturing as a control in research studies and supports
inquiry and active learning as the preferred, empirically validated teaching practice in
the typical classroom.
Statement of Problem
Inquiry-based instruction has been shown to improve academic success and
learning in STEM disciplines. In the past 15 years, many reports have asked STEM
educators to integrate inquiry-teaching into their classrooms (National Research Council
1996, 2000, 2003, 2005, 2012; American Association for the Advancement of Science
2011). Education researchers have shown the value of inquiry-based instruction within
the classroom, but it is unclear if this is the main form of teaching methodology within
the current STEM classroom.
Objectives
The purpose of this study is to describe science educators and students’ views
about inquiry-based teaching and learning. Inquiry-based techniques have been shown
to improve student understanding of scientific concepts, however, there are
discrepancies in how educators define and implement these techniques in their
classroom. The objectives of the current study are as follows:
• To determine the views of life-science faculty in regards to their use of inquiry-
based teaching within the classroom

20
• To determine the views of science major students on the use of inquiry-based
activities within the classroom.
• To determine the understood application and definition of inquiry based teaching
in both educators and students.
Hypotheses
1. Trends will be observed in faculty as well as students that indicate multiple
distinct viewpoints on the definition and implementation of inquiry-based learning
within the classroom. If this is true, then analysis will reveal multiple factors of
differing viewpoints related to inquiry and traditional teaching methods that
students and faculty will be organized into.
2. Alternatively, if there is no trend in faculty or student experience on the
viewpoints of the definition and implementation of inquiry-based learning then a
one solution factor will be seen. This would indicate that there is no discernable
difference between educators that use inquiry-based learning versus traditional
lecture. This would also indicate that students are unable to detect the
differences in teaching and learning experiences within the classroom.
21
CHAPTER 2
THEORETICAL FRAMEWORK
Influential Investigators
Learning has been a subject of investigation for as long as humans have been
investigating themselves. In his works dating back to 400BC, the philosopher Socrates
often used questions to guide his discussions. The Socratic Method, which is still in use
today, is a form of classroom experience in which there is shared conversations
between the learners and educators which are both in charge of maintaining the
dialogue through further questioning. In this inquiry process the teacher is just as much
a participant within the discussion as they are a guide (Reich 2003).
In the late 1600s John Locke’s philosophy saw that the mind is a tabula rasa, or
blank slate. He thought that at birth, the mind was a blank slate containing no pre-
existing concepts. We are not born with knowledge, but instead it is only created by
experience with the world through the senses (Locke 1689). In this viewpoint, the world
must be experienced to attain knowledge and continue growth and learning. This idea
of knowledge being gained through sense-experience gave rise to the philosophy of
empiricism, from which the empirical method was later derived. This methodology is
standardly used in the scientific method today.
The philosopher Jean Jacques Rousseu later built on the work of John Locke,
and shared some of his ideas based on learning. He believed that education should be
focused on experiences within the world, especially in relation to developing the senses,
as opposed to being solely a consequence of lectures and reading (Rousseau 1979).

22
By learning from actual experience within the world, the child should be able to make
inferences about situations they have not encountered from past situations in which
they succeeded.
The commonality between Socrates, Locke, and Rousseau is the idea that
learning and education should be student-centered. Learning does not usually take
place in a silent space in which questions and discussions are absent. Knowledge is
also not innate and must be gained by experiences with the world. Through these
experiences, knowledge can be attained and later used to make inferences about future
decisions. From these philosophers and their ideas of learning, more researchers
began to investigate what can be defined as a student-centered learning approach.
John Dewey (1859-1952) was an American philosopher and educational
reformer (Martin 2002). He was one of the founders of the philosophical tradition of
pragmatism, a philosophy that emphasizes the practical application of ideas by testing
those ideas in human experiences (Friesen 2014). In this view, to understand the world
around the learner, the reality must be experienced. Children will have the highest
amount of learning when they are interacting with their surroundings and are actively
involved with the learning process.
In Dewey’s view of a classroom, there is an equal voice between the educator
and the students. The educator should not be seen as an instructor, but instead a
facilitator of learning. Students need to be active partners in learning and should be
able to link content to previous learning and experience. This does not just hold for one
area of the curriculum, but instead encompasses a view that education should be
23
interdisciplinary (Dewey 1916). Dewey’s ideas of student-centered learning can still be
found today in methods of inquiry-based learning.
Zone of Proximal Development
Vygotsky was the founder of the cultural-historical theory of cognitive
development. Though incomplete, the theory emphasized the large impact that an
individual’s culture plays in the development of higher mental processes. For children,
cognitive development occurs through social interaction. In this view, interactions that
children have with parents or educators guide the child in their learning. With the
guidance of someone knowledgeable, the child will be able to perform much more
complicated tasks than he or she would be able to alone. This knowledgeable
individual is not always an educator, however, and can often be a parent, peer, coach,
or relative.
A task that the child can do, but not without guidance from a more experienced
individual, is said to lie in the zone of proximal development (ZPD). This area involves
the skills that are too advanced for the learner to gain on their own, but can be attained
with appropriate guidance.
The ZPD is the area in between what a learner can do with help and what a learner
cannot do at all. This is an area in which a learner can do task, but requires guidance to
do so. Vygotsky defined this as “the distance between the actual developmental level
as determined by independent problem solving and the level of potential development
as determined through problem solving under adult guidance or in collaboration with
more capable peer” (Vygotsky 1978). Individuals learn best when working together. By

24
working with an individual with a larger skill set, learners gain new concepts,
psychological tools, and skills (Shabani et al. 2010). Effective instruction needs to be
aimed at a learner’s proximal zone of development, or as Moll (1992) called it “upper
threshold of instruction”. What a learner performs with guidance, the individual will later
be able to do alone (Moll 1992).
Scaffolding
Though Vygotsky did not coin the term scaffolding, the concept of ZPD helps to form
the basis of it (Daniels 2001). Bruner (1976) developed a theory of scaffolding in which
learners need active support from more skilled individuals to learn new concepts. Early
on, leaners are dependent on support, but as they acquire new skills and knowledge,
the support can be decreased (Wheeler 2014). A teacher or knowledgeable student
would help peers to organize and structure learning tasks for the new learner to
complete the task effectively. This is the use of scaffolding within Vygotsky’s ZPD. As
students gain more knowledge and can perform more tasks alone, support can be
gradually lessened throughout the course. This allows for students to be more involved
with their own learning and to be able to think independently.
Post-Positivism
Post-Positivism is based upon empirical objectivity and mathematical certainty
similar to positivism, however, it does not attempt to show causation and instead
focuses on correlation (Lederman and Abell 2014). In a positivist perspective, research
should be firmly supported by logical reasoning and empirical data that are self-evident
25
and verifiable (Schwandt 2001). Post-positivism, however, admits that culture, personal
value systems, and surroundings influence our perception of the world in positive and
negative ways (Phillips and Burbules 2000). Rather than only relying on previous
experiences, researchers aim to collect empirical data methodically and compare data
objectively. Common methods of data collection would include comparative
experimental designs or surveys designed to find correlational explanation (Lederman
and Abell 2014). In this perspective, naturalistic settings are rarely used. To apply this
perspective to inquiry-based practices, a large-scale survey could be used to collect
data. Using a large-scale survey would allow a gain of perspective into the view on
many different educators and students across multiple geographic regions. After data
collection, commonalities and differences that exist within the population could be
examined.
Interpretivism
Interpretivist focus on the localized meanings of human experience (Lederman
and Abell 2014). An interpretivist perspective holds that people construct their
understanding based on their experience, culture, and context. They focus on cultures,
language use, classroom interactions, and actual experiences of individuals (Wong
2002). Because of this individualistic understanding, interpretivist do not expect that
their results can be generalized directly to educational policies or strategies (Becker et
al. 2012). In this perspective observations, interviews, and descriptive narratives could
be used to measure and define inquiry-based practices. Data is normally collected in
naturalistic environment, as opposed to experimental conditions. Using interpretivist
26
methods could give a better understanding of the individual experience of a student or
educator.
Situated Cognition and Cognitive Apprenticeship
The Situated Cognition Theory states that the attainment of knowledge cannot be
separated from the context where knowledge is gained (Brown et al. 1989). Information
that is acquired by the learner is situated in activities that are physically, socially, or
culturally-based. In a classroom, the use of case studies or lab simulations could be
used to have students apply knowledge within context.
The Cognitive Apprenticeship Model relies on students to work side by side with
an expert (educator) to gain the necessary skills that serve within the subject area
(Collins et al. 1989). This model relies on context as being key to learning, building
upon the Situated Cognition Theory. Collins et al. (1989), described six principles
between the educator and learner: modeling, coaching, scaffolding, articulation,
reflection, and exploration. Modeling allows students to build a concept map of a task
by having the educator demonstrate it. During coaching a student will attempt the task
and receive feedback from the educator. Scaffolding is done by the educator and
allows for creating strategies to improve the student’s education experience. Context
and skills are suited to students’ skill level and aimed to move them farther than they
can attain on their own. Once a student can perform task independently, support can
be lessened. Articulation allows for the student to give an in-depth discussion of
knowledge and skills learned. Reflection allows for both student and educator to
compare their own experiences with each other as well as peers. Exploration
encourages students to tackle concepts and skills learned in real world settings.
27
CHAPTER 3
METHODS
The purpose of this study is to investigate the opinions and beliefs of educators
and students in postsecondary educational institutions to better understand how
undergraduate biology experiences have changed since the emergence of the K-12
Framework. For this reason, Q method was recognized as the most appropriate way of
obtaining this information to allow for the participants’ viewpoints to remain the main
component of the analysis. When used appropriately “a well-delivered Q study reveals
the key viewpoints extant among a group of participants and allows those viewpoints to
be understood holistically and to a high level of qualitative detail” (Watts and Stenner
2012). This method is suitable for researching the range and diversity of subjective
perspectives, experiences, and beliefs. It can identify similarities, construct broad
categories of the subjectivities being investigated, and explore patterns and
relationships within and between these categories (Shinebourne 2009). This
methodology has been used in studies of health and illness (Stenner et al. 2000) as well
as examination of emotions (Watts and Stenner 2005).
Participants
When recruiting participants for use in a Q method study, a focused and
purposive sample of participants are needed to secure a variety of viewpoints among a
specific demographic (Gravley-Stack et al. 2016). The number of statements to be
sorted is typically larger than the number of participants within a Q study (Brouwer
1999), with results that are statistically significant with as little as twelve participants

28
(Barry and Proops 2000). The aim of this study was to gather 20-30 respondents for
each P-set, or group of interest: undergraduate students and educators.
A total of 53 participants were recruited for this study under the approval of ETSU
IRB#: c0217.9e. Most of the responses, 98%, were collected at a large southeastern
regional conference of biologists in Spring of 2017. The remaining responses were
collected from a regional southeastern university within the same time. Of these
participants, 23 were science educators teaching primarily at 2 or 4-year college
institutions. The experiences of these instructors ranged from 0 to 21 years. The
remaining 30 participants were college students at 2 and 4-year institutions with
experience in at least one introductory level science course. Students ranged in grade
from freshman to seniors.
Q Method
Data was collected using Q methodology (Brown 1993) to gain insight into how
science education is taught and experienced in the undergraduate classroom. Q
Methodology is used to identify a set of opinions that characterize individuals, then
compare individuals to a distribution of sets.
Participants received a set of statements, referred to as the Q set, which are
drawn from a larger set of ideas about the subject that is being researched (Brown
1993). The larger set, referred to as the concourse, is broken down to a number of
statements chosen by the researcher.
Educators were asked to sort these statements in relation to how they
conducted their introductory science courses. Students were asked to sort the
29
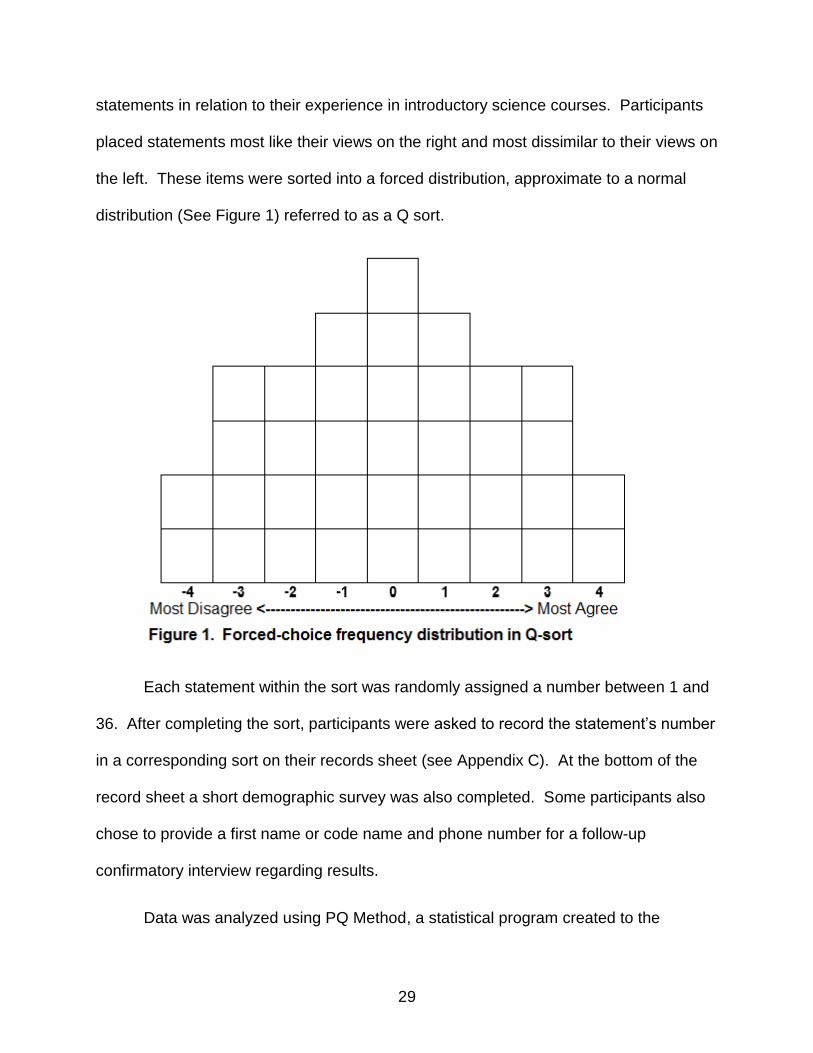
statements in relation to their experience in introductory science courses. Participants
placed statements most like their views on the right and most dissimilar to their views on
the left. These items were sorted into a forced distribution, approximate to a normal
distribution (See Figure 1) referred to as a Q sort.
Each statement within the sort was randomly assigned a number between 1 and
36. After completing the sort, participants were asked to record the statement’s number
in a corresponding sort on their records sheet (see Appendix C). At the bottom of the
record sheet a short demographic survey was also completed. Some participants also
chose to provide a first name or code name and phone number for a follow-up
confirmatory interview regarding results.
Data was analyzed using PQ Method, a statistical program created to the

30
requirements of Q studies (Schmolck 2014). It calculates intercorrelations among sorts,
which are then factor-analyzed with the Centroid or Principal Component method
(Schmolck 2014). The resulting analysis reports a variety of tables on factor loadings,
statement factor scores, discriminating statements within each factor, and consensus
statements across factors (Schmolck 2014).
Follow-up interviews are commonly used within this methodology from each
resulting factor. The interviews allow for a greater understanding of the subjective
views that arise from analysis and help to confirm the qualitative analyses conducted
(Watts and Stenner 2012).
Designing the Q Set
The Q set for this study was composed of 36 statements printed on 2 x 2 inch
laminated cards. Each card consisted of one statement, a randomly selected number
between 1 and 36, and a hook-and-latch backing. Cards could adhere to the
distribution board when being sorted. The Q set was created from a comprehensive
literature review of inquiry-based teaching, two prominent educational documents Vision
and Change and Framework for education, as well as statements created for use in
previous work with Q method on the study of inquiry within the classroom (Hiatt 2011).
These statements included information about different examples of classroom
environment, teaching methods, assessments types, and educational materials (see
Appendix A).
Delivering the Q Sort
Q sorts were conducted in face-to-face interviews with participants. Prior to

31
beginning data collection, participants were asked to read a consent form that gave a
brief description of the study and outlined the risks and benefits (IRB#: c0217.9e).
Participants were then given a written copy of instructions for the Q sort (see Appendix
B) as well as verbal instruction. Both students and educators were given the same
statements and sorting procedure, however, the prompt for each differed slightly. If
students were first or second year undergraduates, they were prompted with the
question of “how were you taught this past semester?”. Third and fourth year
undergraduate students were prompted with the question of “how were you taught
during your introductory level courses?”. Educators prompted with the question “how do
you teach introductory level courses?”.
Participants were then asked to sort the 36 statements into three piles based
upon the prompt question. The first pile consisted of statements that were most like
their views, the next pile was statements that were most unlike their views, and the third
pile consisted on any statements in which the participant did not have strong feelings
either way. After this initial short, participants placed the cards the Q sort board in the
order which best described their views. After completion of the Q sort, participants
recorded the statement number in the correspond box on the records sheet. Lastly, if
the participant chose to do so, they completed a short demographic survey and contact
information for the follow-up interview.
Analysis with PQ Method
All responses were analyzed using PQ Method (Schmolck 2014). A principal
components analysis was performed and a Varimax rotation was used to determine the
resulting factors. Factor analysis examines a correlation matrix to determine how many

32
factors, or viewpoints, were evident in the sample set (Brown 1993). Participants with
significant loadings in each factor were flagged. Loadings represented to what extent
participant’s Q sort correlated with each found factor. A loading score of +/- 0.50 is
considered significant.
Z-scores were calculated for each statement on each factor, and statements
were ordered in calculated array positions. Z-scores are the score for a statement
indicative of an average of the scores given to that statement by all the Q sorts within
that factor (Brown 1993). These are interpreted by the Q-sort value, which ranged
between -4 and +4. The higher the number indicated that the statement was descriptive
of the factor. The lower the number indicated that the statement did not describe the
factor. Based upon these distinguishing statements, viewpoints were assigned to each
factor.
Follow-Up Interviews
Follow-up interviews were conducted 3-4 weeks after the initial sort was
completed to confirm qualitative analysis. Participants who scored high and purely on a
single factor loading (r>0.50) were contacted for confirmatory interviews if they provided
a phone number on the records sheet. Each factor was summarized and this
information was presented to participants (see Appendix D). Participants were then
asked to confirm if the summary provided was an accurate representation of their
teaching style/classroom experience.

33
CHAPTER 4
RESULTS
Identifying Factors and Significant Loadings
Each respondents sort was entered into PQ method which performed a principal
components analysis and a Varimax rotation was used to determine the resulting
factors. Participants with significant and pure loadings in each factor were flagged.
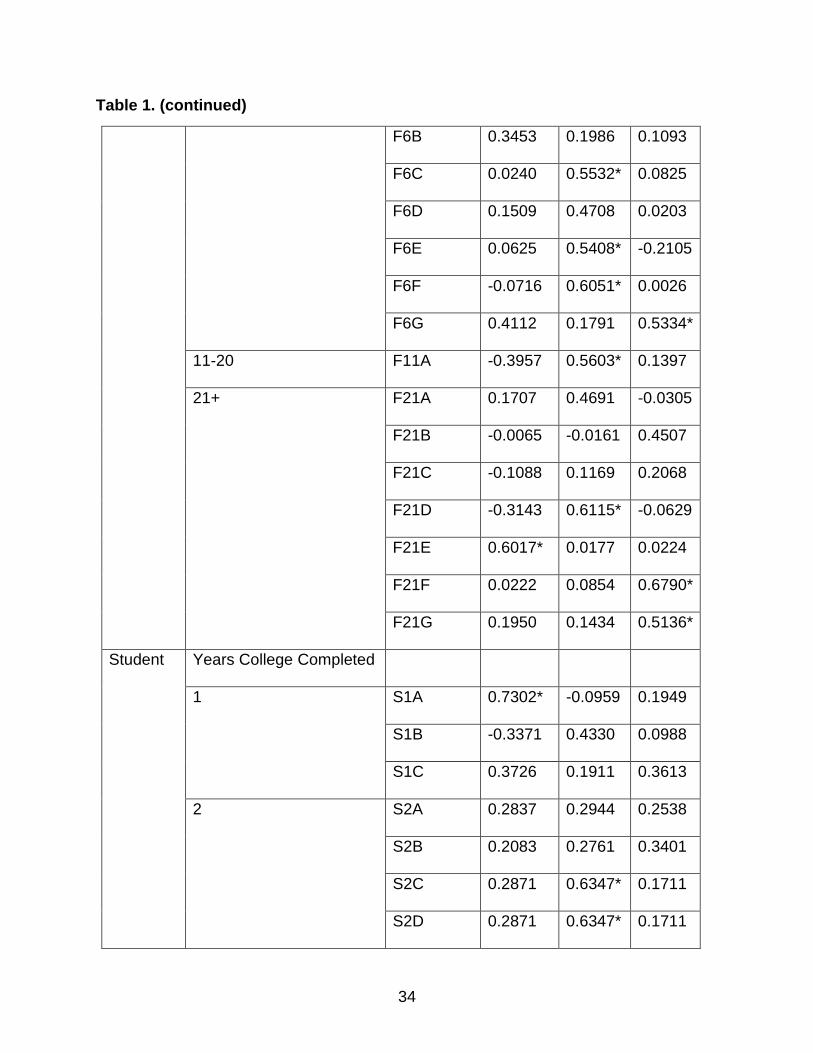
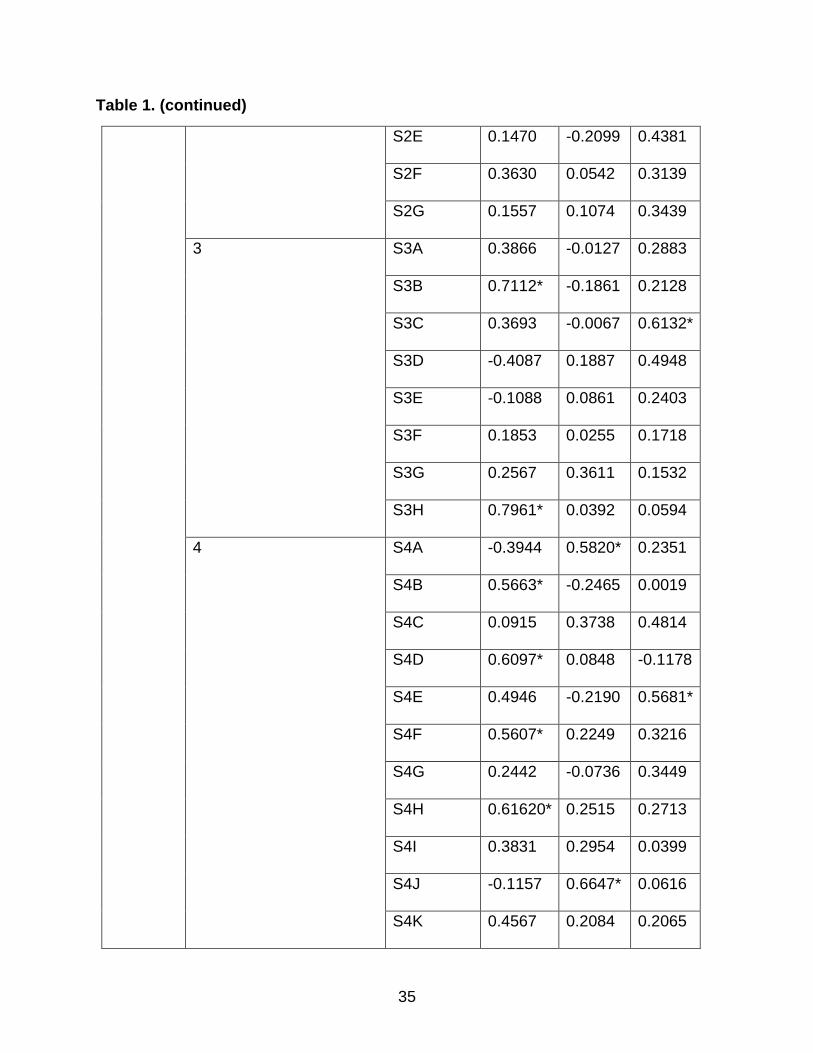
Participant information is provided in Table 1 about respondent occupation and
information about years teaching experience or years enrolled in postsecondary
education. Individual participant loading scores can be found underneath each factor.
Table 1. Factor Loadings
Participant Factor
Faculty Years Teaching
Experience
Participant
Number
A B C
0 F0A 0.4185 -0.0054 0.0754
1-2 F1A 0.3521* -0.0996 0.1316
F1B 0.3629 0.4146 0.1796
3-5 F3A 0.3688 0.3150 0.3674
F3B 0.5096 0.1079 0.5909*
F3C 0.2537 0.4818 0.1559
F3D -0.2163 0.5011* 0.4200
F3E 0.3588 0.4769 0.2460
6-10 F6A -0.0879 0.5883* 0.3529
34
Table 1. (continued)
F6B 0.3453 0.1986 0.1093
F6C 0.0240 0.5532* 0.0825
F6D 0.1509 0.4708 0.0203
F6E 0.0625 0.5408* -0.2105
F6F -0.0716 0.6051* 0.0026
F6G 0.4112 0.1791 0.5334*
11-20 F11A -0.3957 0.5603* 0.1397
21+ F21A 0.1707 0.4691 -0.0305
F21B -0.0065 -0.0161 0.4507
F21C -0.1088 0.1169 0.2068
F21D -0.3143 0.6115* -0.0629
F21E 0.6017* 0.0177 0.0224
F21F 0.0222 0.0854 0.6790*
F21G 0.1950 0.1434 0.5136*
Student Years College Completed
1 S1A 0.7302* -0.0959 0.1949
S1B -0.3371 0.4330 0.0988
S1C 0.3726 0.1911 0.3613
2 S2A 0.2837 0.2944 0.2538
S2B 0.2083 0.2761 0.3401
S2C 0.2871 0.6347* 0.1711
S2D 0.2871 0.6347* 0.1711
35
Table 1. (continued)
S2E 0.1470 -0.2099 0.4381
S2F 0.3630 0.0542 0.3139
S2G 0.1557 0.1074 0.3439
3 S3A 0.3866 -0.0127 0.2883
S3B 0.7112* -0.1861 0.2128
S3C 0.3693 -0.0067 0.6132*
S3D -0.4087 0.1887 0.4948
S3E -0.1088 0.0861 0.2403
S3F 0.1853 0.0255 0.1718
S3G 0.2567 0.3611 0.1532
S3H 0.7961* 0.0392 0.0594
4 S4A -0.3944 0.5820* 0.2351
S4B 0.5663* -0.2465 0.0019
S4C 0.0915 0.3738 0.4814
S4D 0.6097* 0.0848 -0.1178
S4E 0.4946 -0.2190 0.5681*
S4F 0.5607* 0.2249 0.3216
S4G 0.2442 -0.0736 0.3449
S4H 0.61620* 0.2515 0.2713
S4I 0.3831 0.2954 0.0399
S4J -0.1157 0.6647* 0.0616
S4K 0.4567 0.2084 0.2065

36
Table 1. (continued)
S4L 0.3925 0.1146 0.5458*
* Denotes a defining sort for the factor.
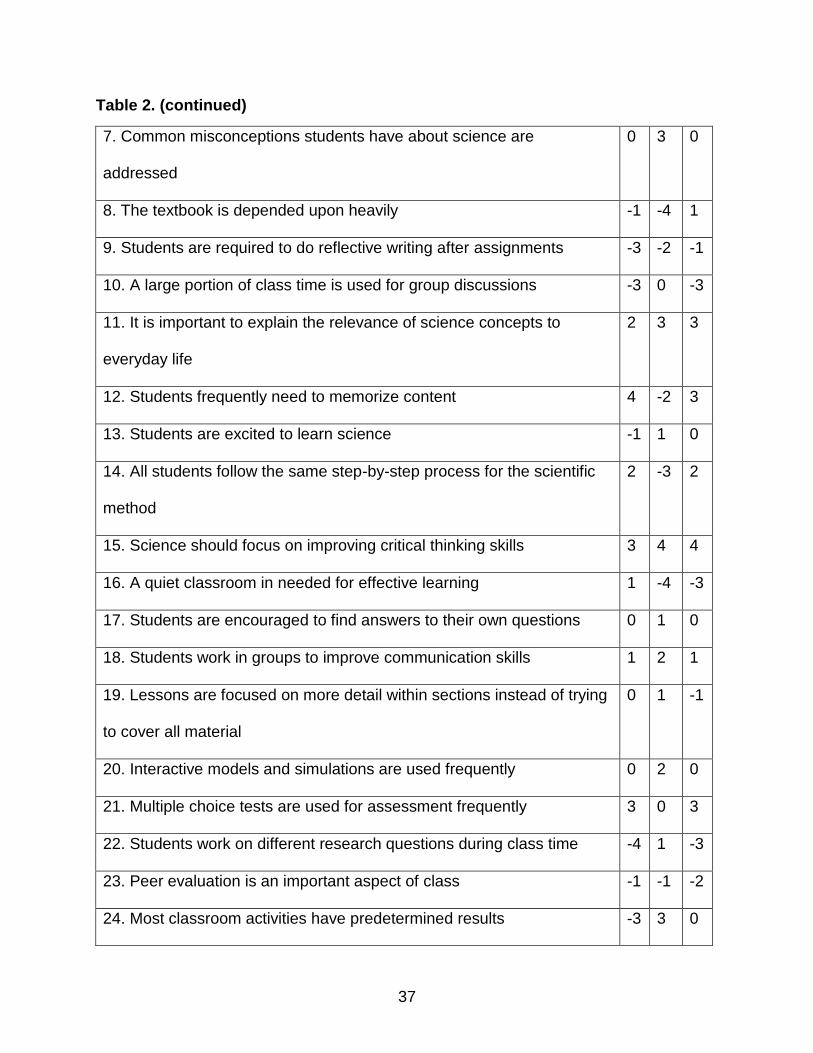
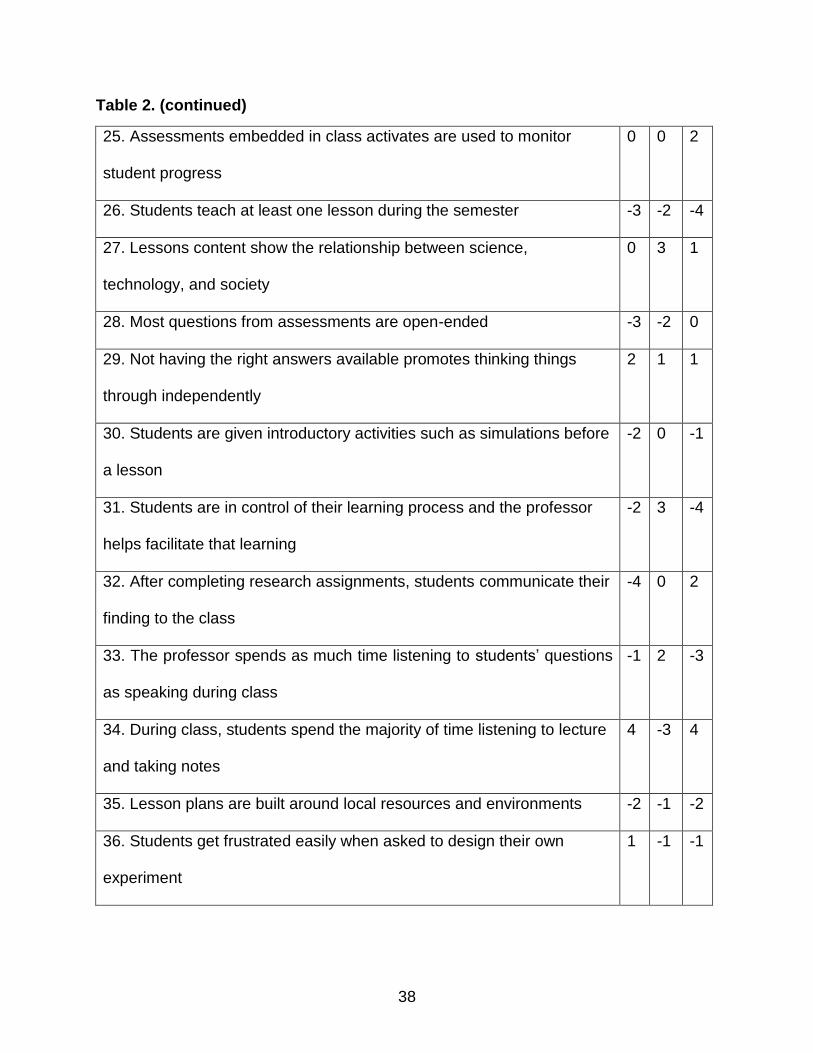
Z-scores were calculated for each statement in each factor and converted to Q-
sort values by weighted averages that created a factor array, a representative Q-sort for
each factor. These values ranged between -4 and +4 and were used to determine the
location of each statement within a representative factor array. The higher the number
indicated that the statement was descriptive of the factor. The lower the number
indicated that the statement did not describe the factor. Table 2 shows the average Q
sort value for each statement for each factor A, B, and C respectively.
Table 2. Q Sort Values for Each Statement
Statement Factor
A B C
1. Resources beyond the textbook are frequently used 1 4 2
2. Students are often afraid of investigating questions on their own 2 -1 -2
3. Lecturing is effective for preparing students for science proficiency
test
1 -3 1
4. Students develop hypotheses and design their own experiments -2 2 3
5. Students questions/interests are used to plan lessons -1 -1 -2
6. Pre-assessments are used to determine what students already know 3 0 -1
37
Table 2. (continued)
7. Common misconceptions students have about science are
addressed
0 3 0
8. The textbook is depended upon heavily -1 -4 1
9. Students are required to do reflective writing after assignments -3 -2 -1
10. A large portion of class time is used for group discussions -3 0 -3
11. It is important to explain the relevance of science concepts to
everyday life
2 3 3
12. Students frequently need to memorize content 4 -2 3
13. Students are excited to learn science -1 1 0
14. All students follow the same step-by-step process for the scientific
method
2 -3 2
15. Science should focus on improving critical thinking skills 3 4 4
16. A quiet classroom in needed for effective learning 1 -4 -3
17. Students are encouraged to find answers to their own questions 0 1 0
18. Students work in groups to improve communication skills 1 2 1
19. Lessons are focused on more detail within sections instead of trying
to cover all material
0 1 -1
20. Interactive models and simulations are used frequently 0 2 0
21. Multiple choice tests are used for assessment frequently 3 0 3
22. Students work on different research questions during class time -4 1 -3
23. Peer evaluation is an important aspect of class -1 -1 -2
24. Most classroom activities have predetermined results -3 3 0
38
Table 2. (continued)
25. Assessments embedded in class activates are used to monitor
student progress
0 0 2
26. Students teach at least one lesson during the semester -3 -2 -4
27. Lessons content show the relationship between science,
technology, and society
0 3 1
28. Most questions from assessments are open-ended -3 -2 0
29. Not having the right answers available promotes thinking things
through independently
2 1 1
30. Students are given introductory activities such as simulations before
a lesson
-2 0 -1
31. Students are in control of their learning process and the professor
helps facilitate that learning
-2 3 -4
32. After completing research assignments, students communicate their
finding to the class
-4 0 2
33. The professor spends as much time listening to students’ questions
as speaking during class
-1 2 -3
34. During class, students spend the majority of time listening to lecture
and taking notes
4 -3 4
35. Lesson plans are built around local resources and environments -2 -1 -2
36. Students get frustrated easily when asked to design their own
experiment
1 -1 -1

39
Positive extremes (3 and 4) and negative extremes (-3 and -4) represent
distinguishing statements for each factor and represent those that are most like
(positive) and least like (negative) the viewpoint each factor describes. A summary of
these statements and ranks for each factor can be found in Table 3.
Table 3. Defining Statements for Each Factor
Factor Distinguishing Statements (p<0.01) Rank
A
12. Students frequently need to memorize content 4
24. Most classroom activities have predetermined results 3
22. Students work on different research questions during class time -4
32. After completing research assignments, students communicate
their findings to the class
-4
B
1. Resources beyond the textbook are frequently used 4
7. Students are in control of their learning process and the professor
helps facilitate that learning
3
8. The textbook is depended upon heavily -4
34. During class, students spend the majority of time listening to
lecture and taking notes
-3
C
12. Students frequently need to memorize content 3
25. Assessments embedded in class activities are used to monitor
student progress
2
26. Students teach at least one lesson during the semester -4
33. The professor spends as much time listening to students’
questions as speaking during class
-3
40
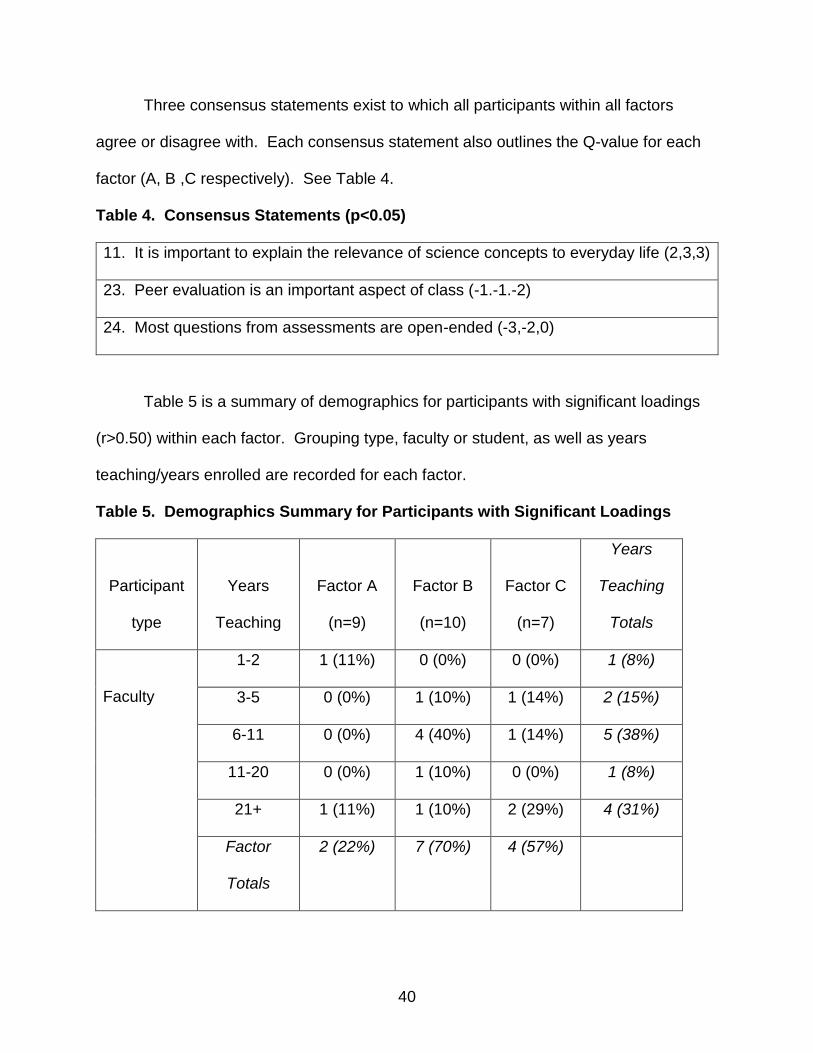
Three consensus statements exist to which all participants within all factors
agree or disagree with. Each consensus statement also outlines the Q-value for each
factor (A, B ,C respectively). See Table 4.
Table 4. Consensus Statements (p<0.05)
11. It is important to explain the relevance of science concepts to everyday life (2,3,3)
23. Peer evaluation is an important aspect of class (-1.-1.-2)
24. Most questions from assessments are open-ended (-3,-2,0)
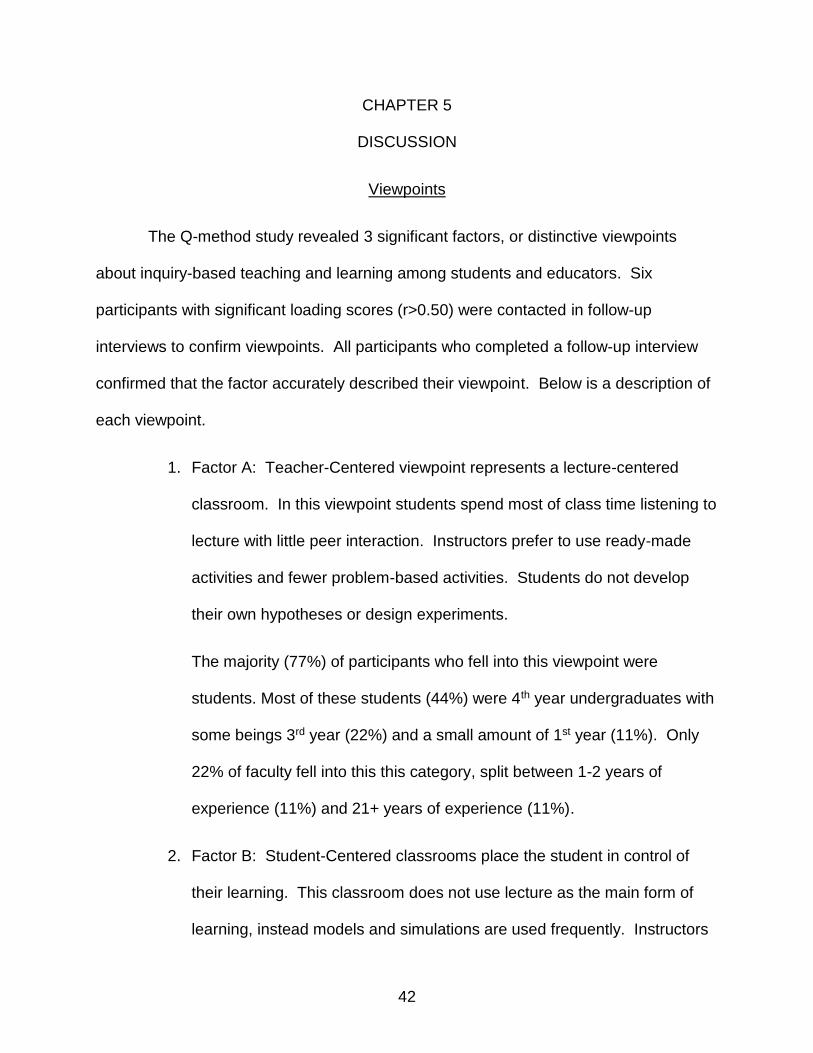
Table 5 is a summary of demographics for participants with significant loadings
(r>0.50) within each factor. Grouping type, faculty or student, as well as years
teaching/years enrolled are recorded for each factor.
Table 5. Demographics Summary for Participants with Significant Loadings
Participant
type
Years
Teaching
Factor A
(n=9)
Factor B
(n=10)
Factor C
(n=7)
Years
Teaching
Totals
Faculty
1-2 1 (11%) 0 (0%) 0 (0%) 1 (8%)
3-5 0 (0%) 1 (10%) 1 (14%) 2 (15%)
6-11 0 (0%) 4 (40%) 1 (14%) 5 (38%)
11-20 0 (0%) 1 (10%) 0 (0%) 1 (8%)
21+ 1 (11%) 1 (10%) 2 (29%) 4 (31%)
Factor
Totals
2 (22%) 7 (70%) 4 (57%)

41
Table 5. (continued)
Student Years Enrolled Years
Enrolled
Totals
1 1 (11%) 0 (0%) 0 (0%) 1 (8%)
2 0 (0%) 1 (10%) 0 (0%) 1 (8%)
3 2 (22%) 0 (0%) 1 (14%) 3 (23%)
4 4 (44%) 2 (20%) 2 (29%) 8 (62%)
Factor
Totals
7(77%) 3 (30%) 3 (43%)
Post Sort Interview
Following analysis, 21 of the 26 participants with significant loadings had given
contact information for a follow-up interview. Of the 21 contacted, a total of 6 follow-up
interviews were conducted with two participants per factor who loaded significantly. All
six interviewees confirmed that the summary of the teaching style/classroom experience
was an accurate representation of their views. Some faculty participants also included
specific teaching strategies used within their classrooms.
42
CHAPTER 5
DISCUSSION
Viewpoints
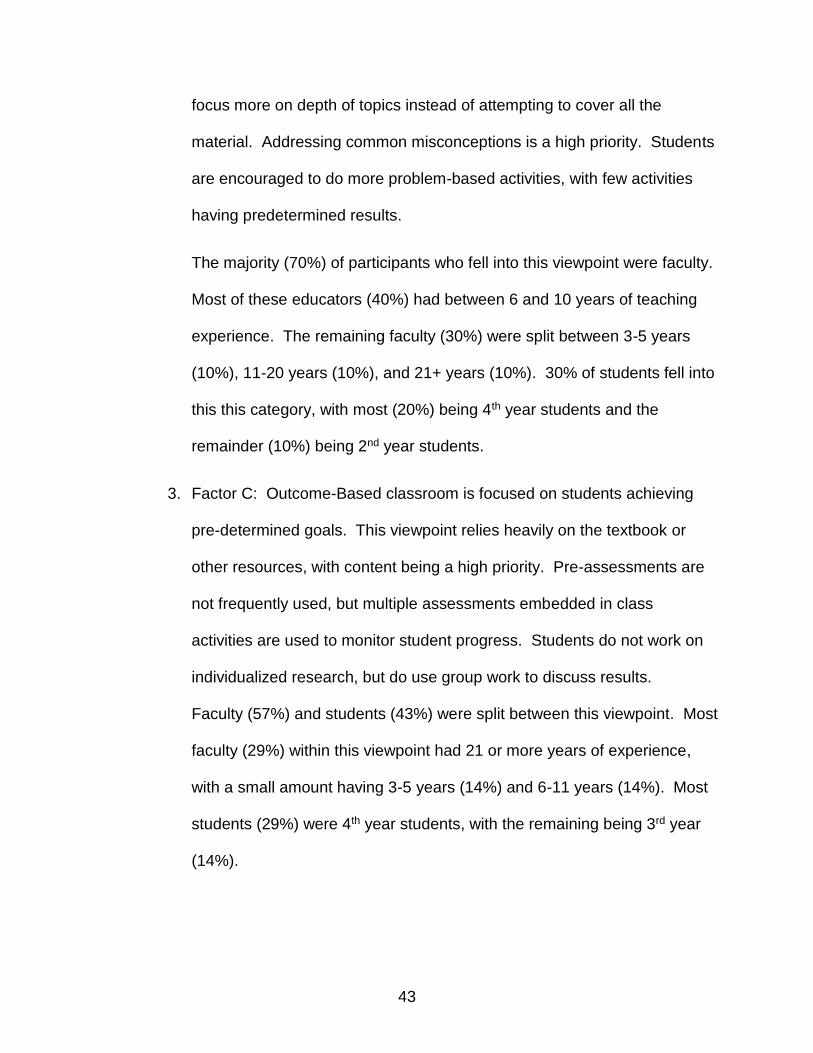
The Q-method study revealed 3 significant factors, or distinctive viewpoints
about inquiry-based teaching and learning among students and educators. Six
participants with significant loading scores (r>0.50) were contacted in follow-up
interviews to confirm viewpoints. All participants who completed a follow-up interview
confirmed that the factor accurately described their viewpoint. Below is a description of
each viewpoint.
1. Factor A: Teacher-Centered viewpoint represents a lecture-centered
classroom. In this viewpoint students spend most of class time listening to
lecture with little peer interaction. Instructors prefer to use ready-made
activities and fewer problem-based activities. Students do not develop
their own hypotheses or design experiments.
The majority (77%) of participants who fell into this viewpoint were
students. Most of these students (44%) were 4th year undergraduates with
some beings 3rd year (22%) and a small amount of 1st year (11%). Only
22% of faculty fell into this this category, split between 1-2 years of
experience (11%) and 21+ years of experience (11%).
2. Factor B: Student-Centered classrooms place the student in control of
their learning. This classroom does not use lecture as the main form of
learning, instead models and simulations are used frequently. Instructors
43
focus more on depth of topics instead of attempting to cover all the
material. Addressing common misconceptions is a high priority. Students
are encouraged to do more problem-based activities, with few activities
having predetermined results.
The majority (70%) of participants who fell into this viewpoint were faculty.
Most of these educators (40%) had between 6 and 10 years of teaching
experience. The remaining faculty (30%) were split between 3-5 years
(10%), 11-20 years (10%), and 21+ years (10%). 30% of students fell into
this this category, with most (20%) being 4th year students and the
remainder (10%) being 2nd year students.
3. Factor C: Outcome-Based classroom is focused on students achieving
pre-determined goals. This viewpoint relies heavily on the textbook or
other resources, with content being a high priority. Pre-assessments are
not frequently used, but multiple assessments embedded in class
activities are used to monitor student progress. Students do not work on
individualized research, but do use group work to discuss results.
Faculty (57%) and students (43%) were split between this viewpoint. Most
faculty (29%) within this viewpoint had 21 or more years of experience,
with a small amount having 3-5 years (14%) and 6-11 years (14%). Most
students (29%) were 4th year students, with the remaining being 3rd year
(14%).
44
There was high agreement among all participants that relating science to
everyday life is important; however, much less value is placed upon peer learning and
use of open-ended questions (see Table 4.).
Most educators view themselves as using some type of inquiry (factor B and C),
with the majority focused on student-centered classrooms (factor B) instead of outcome-
based classroom (factor C). Students, however, seem to perceive their introductory
level science courses as very teacher-centered (factor A) compared to educators’
views. In this study, there is a discrepancy between educators and students views of
their typical introductory level science courses. Educators appear to have confidence in
their use of inquiry techniques within the classroom but students’ perception of
introductory level classrooms are still very teacher-centered with little use of inquiry.
Inquiry in the Classroom
The purpose of this study was to describe science educators and students’ views
about inquiry-based teaching and learning. Trends were observed in faculty as well as
students that indicate multiple distinct viewpoints on the definition and implementation of
inquiry-based learning within the classroom.
Within this study, the teacher-centered classroom is most representative of a
traditional view of teaching in which the educator possesses all the knowledge and
passes it onto the students. Most of class time is spent lecturing, with content being a
high priority. Group work and peer discussion are minimal and testing consists of
multiple choice questions with little open-ended questions. The outcome-based
classroom uses some inquiry activities, such as developing hypothesis, designing
45
experiments, and group work, but still relies heavily on content and memorization.
Multiple choice tests are used frequently with little class time devoted to whole class
discussion. The student-centered classroom uses inquiry activities frequently, such as
external resources, real world applications, and connecting information across
disciplines. Most of class time is not spent on lecture, but instead group work or models
and simulations.
Though many faculty (85%) reported that they used some type of inquiry
(student-centered or outcome-based) within their classroom, the majority of students
(54%) perceived their introductory level courses as teacher-centered. The discrepancy
that exists could be due to the implementation of the inquiry activities within the
classroom.
Almost 40 years ago, some of the most common reasons educators were not using
inquiry within the classroom included: confusion about the actual meaning of inquiry,
the belief that the use of inquiry learning only works well with high-functioning students,
educators feel inadequately prepared to teach inquiry, or inquiry teaching is seen as
difficult to accomplish (Welch et al. 1981). More recently, we can still see that a lack of
understanding of inquiry and its implementation is a common problem within the
classroom due to instructional support (Grant and Hill 2006), student motivation
(Edelson, 1999), or educator motivation (Davis 2003; Loucks-Horsley et al. 2003).
Instructional support is key to implementing inquiry within the classroom. Within
institutions in which standardized test score are of high value, teachers of influenced by
this culture of factual memorization for students to pass the test (Dole 2016). For an
educator to move into inquiry based teaching, students must also be motivated to work
46
within this new classroom dynamic. When students are not motivated by their own
interest in the investigations, they may fail to participate or will participate in a
disengaged manner that is not conducive to learning (Edelson 1999). Some educators
may also find problems with their own motivations for practicing inquiry within the
classroom. Educators tend to teach by implementing the methods by which they were
taught, usually relying on lectures, textbooks, and demonstration labs rather than inquiry
based activities (Davis 2003; Loucks-Horsley 2003). Even those who are motivated
may become overwhelmed with the time that is necessary when preparing and
implementing inquiry activities. It takes time to learn new methods and apply them
within the classroom.
Implementation Fidelity
Implementation fidelity is the degree to which an intervention is delivered as
intended and is critical to successful translation of evidence-based interventions into
practice (Breitenstien et al. 2010). Kisa and Correnti (2015) studied 31 schools that
were a part of America’s Choice reform to assist low preforming schools. They found
that teachers only successfully changed their practice toward reform-aligned
instructional goals in schools demonstrating high growth in reform-aligned professional
development. The schools which spent more time on educating teachers on the new
reform content and professional development were more likely to succeed with the new
changes to the curriculum. A larger study examined implementation fidelity in a sample
of 454 teachers engaged in inquiry science programs (Penuel et al. 2007). This study
points to the importance of teachers’ perceptions about how coherent their professional
development experiences were for teaching learning and program implementation. The

47
authors also found that the time to plan for implementation and provision of technical
support were also significant for promoting program implementation (Penuel et al.
2007). Failure to establish implementation fidelity limits the outcome of educational
interventions. Though many studies do address this when introducing different teaching
strategies, they vary widely in how it is measured (Foster and Missett 2015). This
suggests a need for increased methodological rigor in education research to ensure that
teaching methodologies are correctly being implemented within the classroom.
Advancing Inquiry
Some of the most important elements necessary for faculty to translate
contemporary or transformative teaching practices into successful classroom
implementation includes a recognition and redefining of the instructor’s role (Walker and
Shore 2015), providing examples of use within the classroom (Twigg 2010; Pecore,
2012), redefinition of grading scales (Dana 2014; Li et al. 2017), and access to proper
resources and support (Kuhlthau 2015).
To effectively use inquiry-based methods, a redefinition of roles needs to be
assigned to the student as well as the educator. In a traditional classroom, students are
passive learners, interaction among peers is low and lecture is heavy. The educator’s
role is to give information to the student, typically dominating the conversation with
coverage of textbook and curriculum. Most of class time is not used for completion of
assignments or group discussions; instead whole-class instruction is common, with
mastery of facts and skills (out-of-context) becoming the focus of learning (Tomlinson
2005).
48
In an inquiry-based classroom, students need to become the main speakers during
class time. Students need to spend time solving problems, which will include making
mistakes and struggling. Group discussion is common, allowing students to use peers
to compare and generate ideas. The educator’s role will change significant as well, no
longer spending the class controlling the conversations. Educators need to facilitate
students during problem solving activities. This is not necessarily a switching of roles,
but more of a diversification of role for both students and educators. Both learner and
educators will need to switch from passive recipient to active collaborator continuously
(Walker and Shore 2015).
For teachers to begin to implement inquiry within the classroom, they need concrete
examples of how this can be achieved (Twigg 2010). During class time, students
should have multiple task to complete. This could be compromised of clicker questions,
case studies, reflective writings, brain storming sessions, model construction, and
presentations. The time spent gaining new concept information, such as readings from
textbook, should be done outside of class. Class time should be spent allowing student
to apply the knowledge they have gained to solve problems. Educators are responsible
for creating these activities and facilitating students to achieve their own
conclusions. These examples can be given during training sessions, which as
necessary when executing a new inquiry programs.
To have an effective transition to inquiry-based teaching, grading schematics must
also align with teaching methods (Li et al. 2017). Teacher evaluation also needs to
align with the teaching methods of the course (Dana 2014). In traditional classrooms,

49
exams and final papers are weighted heavily. This puts a large amount of stress on
students to achieve high scores on the tests. In inquiry-based teaching, critical thinking
and learning to learn are highly valued skills. Grades should be assigned in accordance
with what is expected from students in the day-to-day classroom. Exams are still used,
but do not hold the majority of the student’s grade. Homework, participation, and
presentations are instead the driving force. Students will have many assignments within
each class period, some as small as only a few clicker questions delivered at the
beginning of the course. This type of daily involvement can accumulate over the
semester. Participation is also of high value within an inquiry-based classroom. This
allows students to be consistently interacting with others to develop and define their
ideas and conclusions. Presentations are also frequently used. This assignment not
only allows students to have the opportunity to present information to a large group, but
also to communicate their individual findings and conclusions for public feedback.
Giving information about other useful resources is crucial in training faculty
(Kuhlthau 2015). Educators may feel as though they understand the material being
presented during training, but then are unable to properly implement them within the
classroom once training is completed. Providing additional resources, either in a
handout or online reference, would be extremely beneficial in dealing with difficulties of
implementation within the classroom. Giving educators external resources will also
significantly help in assignment and task development for the classroom.
If educators are to use their time and resources to move to a more inquiry-based
or active-learning classroom, then knowing how much change is necessary is of value.

50
Knight and Wood (2005) found that even devoting a small amount of time to more
student-centered activities could lead to learning gains. In this study, lecture accounted
for 60-70% of class time while the remaining 30-40% of time was spent on student
participation and cooperative problem solving. In-class assessments, pretest and
posttests, and homework problems were used to gage learning gains. Their results
indicated significantly higher learning gains and better conceptual understanding in the
course with more time devoted to student-centered instruction. Eddy and Hogan (2014)
found that adding a moderate level of active-learning within a course significantly
increased learning gains in all student populations, but worked disproportionately well
for African American students and first-generation students. Connell et al. (2016) found
that increasing student-centered activities within the classroom from moderate to high
produces even higher learning gains. In this study, high student-centered courses
consisted of many active-learning pedagogies, consistent formative assessment, and
cooperative groups. Moderate student-centered courses were defined as fewer active-
learning pedagogies, less formative assessment, and no group work. Students in the
high student-centered courses had significantly higher exam scores and self-reported
views about their learning and understanding of biology.
Assessments
It is important to engage students as active, not passive, participants in all
biology courses. Multiple modes of instruction can be used to continuously involve
students and differing forms as assessment can be used to improve and enhance
learning. (American Association for the Advancement of Science 2011).
51
What students know and what they can do will be determined by use of different
types of assessments. Student assessment data can be used in a continuous cycle
throughout the school year to improve the classroom. By using formative and
summative assessments through the course student progress can be monitored
continuously.
Formative assessments are used to monitor student learning and can be helpful
to both the instructor and student by identifying strengths and weaknesses of the target
areas (Carnegie Mellon University 2015). This type of assessment is usually low stakes.
One form of formative testing is diagnostic, or pre-assessments, given at the beginning
of the courses to identify what knowledge that student already possess about the topic
area. This diagnostic test can help in planning lessons throughout the semester by
focusing class time of subject areas where students have the least knowledge. This
type of assessment can also help in addressing misconceptions which students may
hold upon entering the classroom. Pre-assessments can also be used throughout the
course prior to each lesson for a more in-depth look at students’ knowledge base of the
lesson’s focus. Other forms of formative assessment that can be used throughout the
course are concept maps, journaling, quizzes, and group discussions just to name a
few. Concept maps can be used to understand how student organize and scaffold
knowledge. This type of activity can help relate the specified topic to the larger subject
area that is being addressed. Journaling is a useful way to allow the student to self-
reflect on what has been learned within the course. Burrows et al. (2001) found that
reflective journal essays on assigned reading enhanced performance on multiple-choice
quizzes compared to students who did not complete reflective essays. Quizzes can be a
52
useful tool to check student understanding of the current material presented. Questions
can come in many different forms such as multiple choice, true or false, open-ended,
matching, short answer, essay, or fill-in-the-blank. Questions should be varied
depending on what type of information the instructor would like to gain. Closed-ended
questions, such as multiple choice and true or false, are helpful in assessing content
knowledge. These questions do not always require students to think in depth about the
topic, but instead are helpful for understanding the content knowledge that exists. More
open-ended questions, such as essay or short-answer, are helpful in assessing the
student’s ability to think critically by requiring them to use content knowledge to analyze
and evaluate an issue. Group discussion can be used to allow for students to work with
peers. Allowing students to discuss the topic with peers will allow for verbalization of
their understanding as well as practice in efficiently communicating information to their
classmates. This type of assessment also allows for students to exchange ideas with
each other and examine their own understandings based upon peer feedback. This type
of activity is also very useful in fostering communication and teamwork skills for the
students.
Summative assessments should also be used within the classroom. These types
of assessments are used to evaluate student learning by comparisons against a
standard or benchmark (Carnegie Mellon University 2015). This type of assessment is
generally high stakes with examples such as an exam, research papers, or final
presentations. Summative assessments are useful for the institution where the course is
being taught. By examining the scores from summative assessments, institutions can
evaluate the learning goals of the course and see if students are consistently meeting

53
these goals and learning outcomes. This will allow for changes in the curriculum if there
are areas which students seem to be consistently not meeting expectations.
Student achievement data gained through the different forms of assessment
outlined above should be used when making instructional decisions for the classroom.
Data gained from formative assessments can be used throughout the course to monitor
student progress. Student scores of these assessments will allow the educator to
change the lessons as needed for more efficiency in addressing areas of knowledge
where students are lacking. Information from assessments such as journaling and
concept maps can be used to teach students to examine their own knowledge and set
learning goals. Summative assessment can be used for not only improving the lesson
plans for the course, but also the design and construction of the curriculum by the
institution.
Professional Development Implications
Educators can be hesitant to attempt inquiry-based instruction because they are
unfamiliar with the practices (Kazempour 2009). Many teachers were not taught with
inquiry-based instruction during their educational instruction. Increasing educators’
awareness of how to use inquiry within their classroom can be achieved through quality
professional development. Professional development can increase educators’
knowledge and change ideas relating to how students learn and how effective their
teaching is within the classroom (Kazempour 2009). It is imperative for educators to
obtain effective professional development if science instruction is to be improved in the
United States (Buxton et al. 2008). For inquiry-based instruction to be the main form of
54
instruction within the classroom, educators must model inquiry-based instruction, utilize
inquiry-based learning curricula and lessons, and guide other educators in using inquiry-
based learning in their classroom (Thoron and Myers 2011). The most common
reasons that faculty fail to implement contemporary teaching strategies successfully are
a small support system and lack of proper training.
If an educator is to succeed in transitioning to inquiry-based teaching, then a support
system that is continuous, multidimensional, and personalized to meet the changing
needs of educators must be in place. This support system is not just administrators and
teachers, but also involves student and parent involvement (National Research Council
2000). Some of the dimensions included in the support are professional development,
administrative assistance and support, providing instructional materials, kits and
equipment, communication with parents and public, student assessment procedures
aligned with the outcomes of inquiry, promoting inquiry and problem solving in others
subject areas, and teacher evaluation consistent with inquiry teaching (National
Research Council 2000). Though much of education literature is now pointing towards
a more inquiry-based classroom, there is little support for educators within the
institution. Educators needs to have opportunities in professional development to gain
new skills and training to properly use inquiry in the classroom. Administrative
assistance and support are also a key form of support for educators. Providing a
community of acceptance within the institution for contemporary teaching methods will
increase the likelihood of educators continued use of their new skills and training. This
environment will require a redefinition of teacher evaluation as well. If educators are to
change their teaching styles, then their evaluative processes also need to reflect this

55
change. Having an adequate budget for instructions materials, kits, and equipment will
also increase the likelihood of educators use of inquiry-based materials. Support comes
in many different forms, but regardless is an essential component for success is
implementing contemporary teaching strategies (Darling-Hammond 1995).
Future Directions
In conclusion, the analysis found that both educators and students of the life
sciences do possess distinctive viewpoints about their educational experience. Most of
the faculty within this study view that they are using some type of inquiry within their
classroom but most students perceive their introductory level courses with minimal
inquiry based instruction. In the previous study (Hiatt 2011), three distinctive
viewpoints were found among faculty. Of these, the naïve viewpoint is most like the
teacher-center viewpoint found within this study. The naïve viewpoint made up 70%
educators self-reported view in 2011, but only 15% of educators within this study have a
teacher-centered viewpoint. Reports such as Vision and Change (American
Association for the Advancement of Science 2009) and Framework for k-12 Science
Educators (National Research Council 2012) do seem to be influencing change within
the educator’s view of the classroom. Most students within this study, however, still
viewed their introductory level courses as teacher-centered. The discrepancy that
exists could be due to the implementation of the inquiry activities within the classroom.
By increasing support system, professional development, and comfort levels with inquiry
teaching educators will be able to use inquiry more effectively within the classroom.
56
Q methodology was used to gain insight into the current views of undergraduate
science educators and students in relation to the use of inquiry within their classroom.
This methodology could be extended to other institutions to gain insight into the current
views of inquiry in the classroom. This could be used as a tool to assess changes
within undergraduate education in response to increasingly recommended inquiry-
based policies and educational research.
By also gaining the student perspective within this study, it can be seen that even
if educators are attempting more innovative teaching methodologies, the
implementation of those methods may not be as effective. The majority of
undergraduate students within this study were 3rd and 4th year students. Future, more
controlled, studies could examine more 1st and 2nd year students to see if viewpoints
among students vary from those found here when enrolled in a heavily inquiry-based
course. More must be understood about the discrepancies between instructor and
students’ experiences. Pairing this type of analysis with a teaching observation
protocols such as the Reformed Teaching Observation Protocol (RTOP) (Piburn and
Sawada 2000) or Classroom Observation Protocol in Undergraduate STEM (COPUS)
(Smith et al. 2013) could also help gauge the efficacy of faculty development and
accuracy of self-reported data on the use of evidence-based approaches in teaching
and learning science. Better understanding the way in which faculty introduce new
teaching practices into their classrooms and evaluating the subsequent effect on
student perceptions can greatly influence faculty development strategies. Ultimately,
this would lead to the improvement of K-12 and undergraduate science education
practices that produces a more competent STEM-capable citizenry.
57
REFERENCES
American Association for the Advancement of Science. 2011. Vision and change in
undergraduate biology education: a call to action: a summary of
recommendations made at a national conference organized by the American
Association for the Advancement of Science, July 15–17, 2009 [Internet].
Washington (DC): AAAS; [cited 2017 Aug 25]. Available from
http://visionandchange.org/files/2011/03/Revised-Vision-and-Change-Final-
Report.pdf.
Andrews T, Leonard M, Colgrove C, Kalinowski S. 2011. Active learning not
associated with student learning in a random sample of college biology courses.
CBE Life Sci Educ. 10(4): 394-405.
Aydeniz M, Cihak D, Graham S, Retinger L. 2012. Using inquiry-based instruction for
teaching science to students with learning disabilities. Int J Spec Educ. 27(2):
189-206.
Barry J, Proops J. 1999. Seeking sustainability discourses with Q methodology. Ecol
Econ. 28(3): 337-345.
Beck C, Butler A, Da Silva K. 2014. Promoting inquiry-based teaching in laboratory
courses: are we meeting the grade? CBE Life Sci Educ. 13(3): 444-52.
Becker S, Bryman A, Ferguson H, editors. 2012. Understanding research for social
policy and social work: themes, methods and approaches. Policy Press.

58
Breitenstein SM, Gross D, Garvey C, Hill C, Fogg L, Resnick B. 2010. Implementation
fidelity in community-based interventions. Res Rev J Nurs Health Sci. 33(2):
164–173.
Brouwer M. 1999. Q is accounting for tastes. J Advert Res. 39(2): 35-39.
Brown JS, Collins A, Dugid P. 1989. Situated cognition and the culture of learning.
Educ Res. 18(1): 32-42.
Brown SR. 1993. A primer on Q methodology. Oper Sub. 16(4): 91-138.
Burrows VA, McNeill B, Hubele NF, Bellamy L. 2001. Statistical evidence for enhanced
learning of content through reflective journal writing. J Eng Educ. 90(4): 661–
667.
Buxton C, Lee O, Santau A. 2008. Promoting science among English language
learners: professional development for today’s culturally and linguistically diverse
classrooms. J Sci Teacher Educ. 19(5): 495-511.
Carnegie Mellon University. 2015. Formative vs summative assessment [Internet].
Pittsburgh (PA): Carnegie Mellon University; [cited 2017 Sep 12]. Available from
https://www.cmu.edu/teaching/assessment/basics/formative-summative.html.
Colburn A. 2000. An inquiry primer. Sci Scope. 23(6): 42-44.
Collins A, Brown JS, Newman S. 1989. Cognitive apprenticeship: teaching the crafts
of reading, writing and mathematics. In: Resnick LB, editor. Knowing, learning
59
and instruction: essays in honor of Robert Glaser. Hillsdale (NJ): Lawrence
Erlbaum Associates.
Connell GL, Donovan DA, Chambers TG. 2016. Increase the use of student-centered
pedagogies from moderate to high improves student learning and attitudes about
biology. CBE Life Sci Educ. 15(1): ar3.
CUREnet. 2017. CUREnet [Internet]. Austin (TX): College of Natural Science,
University of Texas at Austin; [cited 2017 Sep 1]. Available from
http://curenet.cns.utexas.edu/.
Dana NF, Yendol-Hoppey D. 2014. The reflective educator's guide to classroom
research: Learning to teach and teaching to learn through practitioner inquiry.
Thousand Oaks (CA): Corwin Press.
Daniels H. 2001. Vygotsky and Pedagogy. New York (NY): Routledge/Falmer.
Darling-Hammond L, McLaughlin MW. 1995. Policies that support professional
development in an era of reform. Phi Delta Kappan. 76(8): 597.
Davis KS. 2003. Change is hard: what science teachers are telling us about reform
and teacher learning of innovative practices. Sci Educ. 87(1): 3-30.
Dewey J. 1916. Democracy and education: An introduction to the philosophy of
education. New York (NY): Macmillan.
60
Dole S, Bloom L, Kowalske K. 2016. Transforming pedagogy: changing perspectives
from teacher-centered to learner-centered. Interdiscipl J P-Base Learn 10(1): 1.
Drake K, Long D. 2009. Rebecca’s in the dark: A comparative study of problem-based
learning and direct instruction/experiential learning in two 4th-grade classrooms.
J Elem Sci Educ. 21(1): 1-16.
Eddy SL, Hogan KA. 2014. Getting under the hood: how and for whom does
increasing course structure work. CBE Life Sci Educ. 13(3): 453-468.
Edelson DC, Gordon DN, Cabral C. 1999. Project-based learning: A strategy for
teaching and learning. Boston (MA): Center for Youth Development and
Education, Corporation for Business, Work, and Learning.
Freeman S, Eddy S, McDonough M, Smith M, Okoroafor N, Jordt H, Wenderoth M.
2014. Active learning increases student performance in science, engineering,
and mathematics. Proc Natl Acad Sci U S A. 111(23): 8410.
Friesen J, Gutek GL. 2014. Philosophical, ideological, and theoretical perspectives on
education. 2nd Ed. Boston (MA): Pearson.
Foster L, Missett TC. 2015. Searching for evidence-based practice: a survey of
empirical studies on curricular interventions measuring and reporting fidelity of
implementation. J Adv Acad. 26(2): 96-111.
61
Furtado L. 2010. Kindergarten teachers’ perceptions of an inquiry-based science
teaching and learning professional development intervention. New Hor Educ.
58(2): 104-120.
Grant MM, Hill JR. 2006. Weighing the risks with the rewards: implementing student
centered pedagogy within high-stakes testing. In: Lambert R, McCarthy C,
editors. Understanding teacher stress in an age of accountability. Greenwich,
(CT): Information Age Press.
Gravley-Stack K, Ray CM, Peterson CM. 2016. Understanding the subjective
experiences of the chief diversity officer: a q method study. J Divers High
Educ. 9(2): 95.
Hiatt A. 2011. It’s been fifteen years since the NSES: what are the viewpoints about
inquiry today? Poster session presented at Oklahoma State University.
Stillwater (OK).
Kazempour M. 2009. Impact of inquiry-based professional development on core
conceptions and teaching practices: a case study. Sci Educ. 18(2): 56-67.
Knight JK, Wood WB. 2005. Teaching more by lecturing less. Cel Biol Educ. 4(4):
298-310
Lederman NG, Abell SK, editors. 2014. Handbook of research on science education
vol. II. New York (NY): Routledge.
62
Li H, Gobert J, Dicker R. 2017. Dusting off the messy middle: assessing students’
inquiry skills through doing and writing. In: Andre E, Baker R, Hu X, Rodrigo M,
du Boulay B, editors. Artificial Intelligence in Education. Wuhan (CN): Springer
International Publishing.
Loucks-Horsley S, Love N, Stiles K, Hewson P, Mundry S. 2003. Designing
professional development for teachers of science and mathematics. 2nd ed.
Thousand Oaks (CA): Corwin Press.
Kisa Z, Correnti R. 2015. Examining implementation fidelity in America’s choice
schools: a longitudinal analysis of changes in professional development
associated with changes in teacher practice. Educ Eva Pol. 37(4): 437-457.
Kuhlthau CC, Maniotes LK, Caspari AK. 2015. Guided Inquiry: Learning in the 21st
Century: Learning in the 21st Century. 2nd ed. Santa Barbra (CA): ABC-CLIO.
Lederman NG, Abell SK, editors. 2014. Handbook of research on science education
volume II. New York (NY): Routledge Taylor & Francis Group.
Locke J, Laslett P. 1963. Two treatises of government. Cambridge: Cambridge
University Press.
Minner D, Levy A, Century J. 2010. Inquiry-based science instruction-what is it and
does it matter? results from a research synthesis years 1984 to 2002. J Res Sci
Teach. 47(4): 474-496.
63
Moll LC, editor. 1992. Vygotsky and education: instructional implications and
applications of sociohistorical psychology. Cambridge: Cambridge University
Press.
Moog RS, Creega FJ, Hanson DM, Spencer JN, Straumanis AR. 2006. POGIL:
Process Guided Inquiry Learning. New York (NY): Oxford University Press.
National Research Council. 1996. National science education standards. Washington,
(DC): The National Academies Press.
National Research Council. 2000. Inquiry and the national science education
standards: a guide for teaching and learning. Washington, (DC): The National
Academies Press.
National Research Council. 2003. Transforming undergraduate education for future
research biologists. Washington, (DC): The National Academies Press.
National Research Council. 2005. America's lab report: investigations in high school
science. Washington, (DC): The National Academies Press.
National Research Council. 2012. A framework for K-12 science education: practices,
crosscutting concepts, and core ideas. Washington, (DC): The National
Academies Press.
National Science Board. 2012. Science and engineering indicators 2012. Arlington
(VA): National Science Foundation.
64
National Science Foundation. 2015. Revisiting the stem workforce: a companion to
science and engineering indicators 2014. Arlington (VA): National Science
Foundation.
National Science Foundation. 2017. Research experience for undergraduates (REU)
[Internet]. Arlington (VA): National Science Foundation; [cited 2017 Aug 20].
Available from https://www.nsf.gov/crssprgm/reu/.
Padilla MJ. 1990. Science process skills. National Association of Research in Science
Teaching Publication: Research Matter – to the Science teacher (9004).
Pecore JL. 2012. Beyond beliefs: Teachers adapting problem-based learning to
preexisting systems of practice. Interdiscipl J P-Base Learn. 7(2): 1-27.
Penuel WR, Fishman BJ, Yamaguchi R, Gallagher LP. 2007. What makes professional
development effective? strategies that foster curriculum implementation. Am
Educ Res J. 44(4): 921-958.
Phillips DC, Burbules NC. 2000. Postpositivism and education research. Lanham
(MD): Rowman & Littefield Publishers.
Piburn M, Sawada D, Turley J, Falconer K, Benford R, Bloom I,Judson E. 2000.
Reformed teaching observations protocol (RTOP) reference manual (ACEPT
technical report no. IN00-3). Tempe (AZ): Arizona Collaborative for Excellence
in Preparation of Teachers.

65
Reich R. 2003. The Socratic method: what it is and how to use it in the classroom.
Speak Teach. 13(1): 1-4.
Rousseau JJ. 1979. Emile, or On Education. Bloom A, trans. New York (NY): Basic
Books.
Schmolck P, Atkinson J. 2014. PQMethod (Version 2.35). [Computer Software]
[Internet]. Munich (HR): University of the German Federal Armed Forces; [cited
2017 Sep 1]. Available from
http://schmolck.userweb.mwn.de/qmethod/downpqwin.htm.
Schwandt, TA. 2001. Dictionary of qualitative inquiry. 2nd ed. Thousand Oaks
(CA): Sage.
Science Education Alliance (SEA). 2017. Science Education Alliance [Internet]. Chevy
Chase (MD): Howard Hughes Medical Institute; [cited 2017 Sep 3]. Available
from https://www.hhmi.org/developing-scientists/science-education-alliance.
Shabani K, Khatib M, Ebadi S. 2010. Vygotsky's zone of proximal development:
Instructional implications and teachers' professional development. Eng Lang
Teach. 3(4): 237.
Shinebourne P. 2009. Using q methods in qualitative research. Ins J Qual Method.
8(1): 93-97.
66
Smith MK, Jones FH, Gilbert SL, Wieman CE. 2013. The classroom observation
protocol for undergraduate STEM (COPUS): a new instrument to characterize
university STEM classroom practices. CBE Life Sci Educ. 12(4): 618-627.
Stenner P, Dancey C, Watts S. 2000. The understanding of their illness amongst
people with irritable bowel syndrome: A q methodological study. Soc Sci Med.
51(3): 439-452.
Thoron A, Myers B. 2011. Effects of inquiry-based agriscience instruction on student
achievement. J Agric Educ. 52(4): 175-187.
Tomlinson CA. 2005. How to differentiate instruction in mixed-ability classrooms.
Upper Saddle River (NJ): Pearson/Merrill Prentice Hall.
Twigg VV. 2010. Teachers’ practices, values and beliefs for successful inquiry-based
teaching in the international baccalaureate primary years programme. J Res Int
Edu. 9(1): 40-65.
Watts S, Stennder P. 2005. The subjective experience of partnership love: A q-
methodology study. Brit J Soc Psy. 44(1): 85-107.
Watts S, Stenner P. 2012. Doing Q methodological research: Theory, method &
interpretation. London (ENG): Sage.
Walker CL, Shore BM. 2015. Understanding classroom roles in inquiry
education. Sage. 5(4): p.215824401560758.
67
Welch WW, LE Klopfer GE, Aikenhead GS, Robinson JT. 1981. The role of inquiry in
science education: analysis and recommendations. Sci Educ. 65(1): 33-50.
Wheeler S. 2014. Learning theories: Jerome Bruner on scaffolding of learning
[Internet]. Devon (UK): Plymouth Institute of Education; [cited 2017 Sep 5].
Available from http://www.teachthought.com/learning/learning-theories-jerome-
bruner-scaffolding-learning/.
Wong ED. 2002. To appreciate variation between scientists: a perspective for seeing
science's vitality. Sci Educ. 86(3): 386-400.
Wood DJ, Bruner JS, Ross G. 1976. The role of tutoring in problem solving. J Child
Psychiatr Psychol. 17(2): 89-100.
Vygotsky L. 1978. Mind in society: The development of higher psychological processes.
Cambridge (MA): Harvard University Press.

68
APPENDICES
Appendix A: Q Statements
1. Resources beyond the textbook are frequently used
2. Students are often afraid of investigating questions on their own
3. Lecturing is effective for preparing students for science proficiency test
4. Students develop hypotheses and design their own experiments
5. Students questions/interests are used to plan lessons
6. Pre-assessments are used to determine what students already know
7. Common misconceptions students have about science are addressed
8. The textbook is depended upon heavily
9. Students are required to do reflective writing after assignments
10. A large portion of class time is used for group discussions
11. It is important to explain the relevance of science concepts to everyday life
12. Students frequently need to memorize content
13. Students are excited to learn science
14. All students follow the same step-by-step process for the scientific method
15. Science should focus on improving critical thinking skills
16. A quiet classroom in needed for effective learning
17. Students are encouraged to find answers to their own questions
18. Students work in groups to improve communication skills
19. Lessons are focused on more detail within sections instead of trying to cover all
material
20. Interactive models and simulations are used frequently
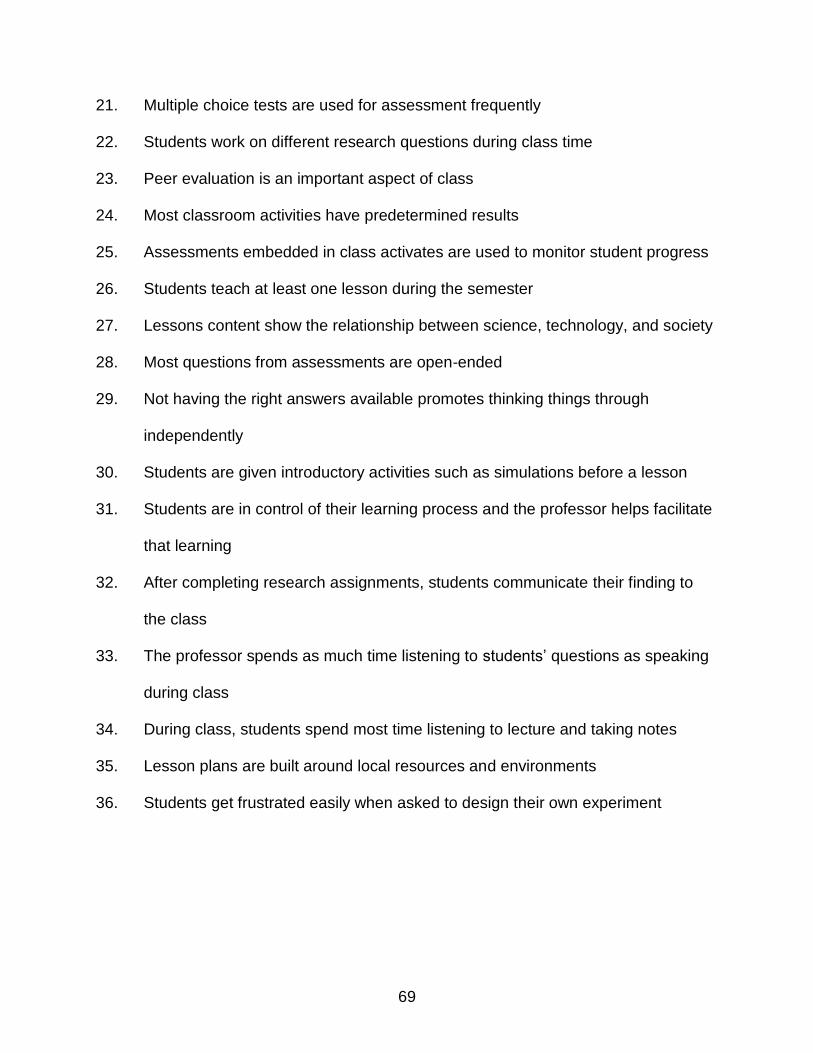
69
21. Multiple choice tests are used for assessment frequently
22. Students work on different research questions during class time
23. Peer evaluation is an important aspect of class
24. Most classroom activities have predetermined results
25. Assessments embedded in class activates are used to monitor student progress
26. Students teach at least one lesson during the semester
27. Lessons content show the relationship between science, technology, and society
28. Most questions from assessments are open-ended
29. Not having the right answers available promotes thinking things through
independently
30. Students are given introductory activities such as simulations before a lesson
31. Students are in control of their learning process and the professor helps facilitate
that learning
32. After completing research assignments, students communicate their finding to
the class
33. The professor spends as much time listening to students’ questions as speaking
during class
34. During class, students spend most time listening to lecture and taking notes
35. Lesson plans are built around local resources and environments
36. Students get frustrated easily when asked to design their own experiment

70
Appendix B: Q Sort Instructions
Directions for Sorting Q Statements
Thank you for agreeing to participate in this study. Please make sure you have the
materials in front of you. You should have a Form Board and an envelope containing 36
cards, each with a statement printed on it describing ideas about inquiry. You will need
a pencil later.
Step 1: Teachers: Please read through the statements and sort them into three (3)
piles according to the question: “How do you teach?” Students: Please read through
the statements and sort them into three (3) piles according to the question: “How were
you taught this past semester?”
The pile on your right are those statements that are most like what you think about the
question and the pile on your left are those statements that are most unlike what you
think about the question. Put any cards that you don’t have strong feelings about in a
middle pile.
Step 2: Now that you have three piles of cards, start with the pile to your right, the
“most like” pile and select the two (2) cards from this pile that are most like your
response to the question and place them in the two (2) spaces at the far right of the
Form Board in from of you in column 4. The order of the cards within the column-that is,
the vertical positioning of the cards-does not matter.
Step 3: Next, from the pile to your left, the “most unlike” pile, select the two (2) cards
that are most unlike your response to the question and place them in the two (2)
spaces at the far left of the Form Board in front of you in column -4.

71
Step 4: Now, go back to the “most like” pile on your right and select the four (4) cards
from those remaining in your most like pile and place them into the four (4) open
spaces in column 3.
Step 5: Now, go back to the “most unlike” pile on your right and select the four (4) cards
from those remaining in your most unlike pile and place them into the four (4) open
spaces in column -3.
Step 6: Working back and forth, continue placing cards onto the Form Board until all of
the cards have been placed into all of the spaces.
Step 7: Once you have placed all the cards on the Form Board, feel free to rearrange
the cards until the arrangement best represents your opinions.
Step 8: Record the number of the statement on the Record Sheet.
Finally, please complete the survey attached to the Record Sheet and add any
comments.
Thank you for your participation!

72
Appendix C: Records Sheet
Records Sheet
-4 -3 -2 -1 0 1 2 3 4
Demographic Survey
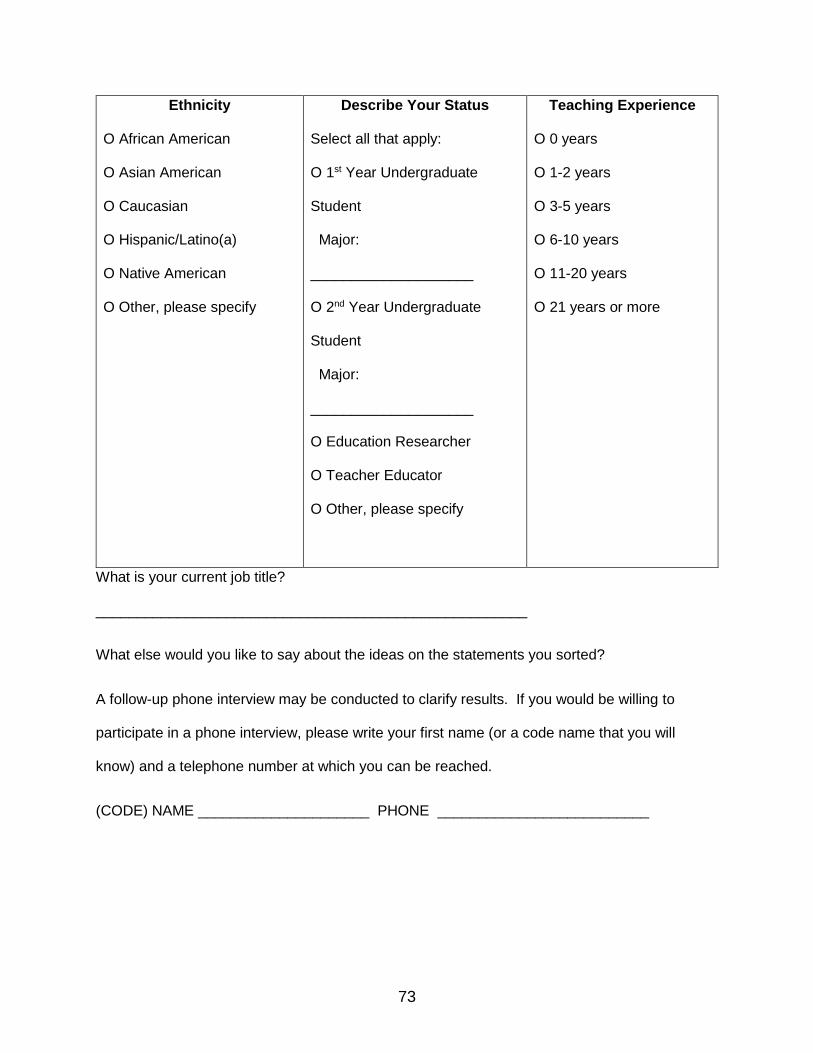
73
Ethnicity
O African American
O Asian American
O Caucasian
O Hispanic/Latino(a)
O Native American
O Other, please specify
Describe Your Status
Select all that apply:
O 1st Year Undergraduate
Student
Major:
____________________
O 2nd Year Undergraduate
Student
Major:
____________________
O Education Researcher
O Teacher Educator
O Other, please specify
Teaching Experience
O 0 years
O 1-2 years
O 3-5 years
O 6-10 years
O 11-20 years
O 21 years or more
What is your current job title?
_____________________________________________________
What else would you like to say about the ideas on the statements you sorted?
A follow-up phone interview may be conducted to clarify results. If you would be willing to
participate in a phone interview, please write your first name (or a code name that you will
know) and a telephone number at which you can be reached.
(CODE) NAME _____________________ PHONE __________________________

74
Appendix D: Follow-up Script
Post Sort Telephone Interview Script – Factor 1
Thank you for agreeing to participate in this research study and for consenting to a
follow up interview. This interview should only take about ten minutes, is this a good
time for you?
One of the things that the aggregate results of the research study has shown is that
people who sorted like you have a lecture-centered, guided classroom. The
distinguishing characteristics include a frequent need to memorize content, use of
classroom activities with predetermined results, students are often afraid of investigating
questions, and pre-assessments are used to determine what students already know.
What do you think of this?
What type of pre-assessments are frequently used?
The characteristics that are most unlike your classroom include students work of
different research questions during class time, students communicate research finding
to peers during class time, and students develop hypothesis and design their own
experiments.
What do you think of this?
What type of research activities are used within your classroom?
Thank you again for your participation!
Bye!

75
Post Sort Telephone Interview Script – Factor 2
Thank you for agreeing to participate in this research study and for consenting to a
follow up interview. This interview should only take about ten minutes, is this a good
time for you?
One of the things that the aggregate results of the research study has shown is that
people who sorted like you have a constructivist classroom, where students learn
through their experiences. Lecture is not used as the main means of communicating
information. The distinguishing characteristics include that resources beyond the
textbook are used frequently, common misconceptions students have about science are
addressed, and students are in control of their learning process and the professor helps
to facilitate that learning.
What do you think of this?
What type of resources are frequently used?
The characteristics that are most unlike your classroom include that the textbook is
heavily depended upon, most activities have pre-determined results, all students follow
the same step-by-step process for the scientific method, and during class spend the
majority of time listening to lecture and taking note.
What do you think of this?
During class, what do students spend the majority of time working on?
Thank you again for your participation!
Bye!

76
Post Sort Telephone Interview Script – Factor 3
Thank you for agreeing to participate in this research study and for consenting to a
follow up interview. This interview should only take about ten minutes, is this a good
time for you?
One of the things that the aggregate results of the research study has shown is that
people who sorted like you have an outcome-based classroom. The distinguishing
characteristics include students need to frequently memorize content, students
communicating finding from research to their class, and assessments are embedded in
class activities to monitor student progress.
What do you think of this?
What type of assessments are frequently used?
The characteristics that are most unlike your classroom include students work on
different research projects during class time, students teach at least one lesson during
the semester, and the professor spends as much time listening to students questions as
speaking during class.
What do you think of this?
During class, what do students spend the majority of time working on?
Thank you again for your participation!
Bye!

77
VITA
MAREN HUDSON
Education: East Tennessee State University, Johnson City, Tennessee, USA.
Master of Science, Biology, December 2017
Berea College, Berea, Kentucky, USA.
Bachelor of Art, Psychology, May 2010
Berea College, Berea, Kentucky, USA.
Bachelor of Art, Classical Civilization, May 2010
Experience: Graduate Teaching Assistant for Introductory Organismal Biology
Labs for Majors at East Tennessee State University
August 2015 - December 2017
Activity: Association of Southeastern Biologists (ASB)
March 2017 – present
National Association of Biology Teachers (NABT)
September 2017 – present
ETSU Graduate and Professional Student Association (GPSA)
August 2016 – present