examining the use of a contraflow evacuation method …
TRANSCRIPT

EXAMINING THE USE OF A CONTRAFLOW EVACUATION METHOD FOR
TROPICAL CYCLONE EVACUATIONS IN NUECES COUNTY, TEXAS
by
Adam Clark, B.A.
A thesis submitted to the Graduate Council of
Texas State University in partial fulfillment
of the requirements for the degree of
Master of Science with a Major in Geography
December 2016
Committee Members:
Dr. Richard Dixon, Chair
Dr. Yongmei Lu
Dr. Denise Blanchard

COPYRIGHT
by
Adam Clark
2016

FAIR USE AND AUTHOR’S PERMISSION STATEMENT
Fair Use
This work is protected by the Copyright Laws of the United States (Public Law 94-553,
section 107). Consistent with fair use as defined in the Copyright Laws, brief quotations
from this material are allowed with proper acknowledgment. Use of this material for
financial gain without the author’s express written permission is not allowed.
Duplication Permission
As the copyright holder of this work I, Adam Clark, authorize duplication of this work, in
whole or in part, for educational or scholarly purposes only.

iv
ACKNOWLEDGEMENTS
I must first thank my committee for their help and guidance throughout this
process. None of this would be possible without them, and I will be forever grateful for
the knowledge they have bestowed upon me. A special thanks to my advisor, Dr.
Richard Dixon, who has helped me achieve more than I ever imagined. Thanks also to
Dr. Ron Hagelman who taught me to build the brick and let the wall follow.
I must also thank all my friends who have been with me along the way. Your
distractions certainly slowed my progress, but they also kept me sane. I would not have
made it this far without the love and support of all you, and I am truly grateful for all the
times we have spent together. I must particularly thank Amelia Hessey and Felicia Wun
who kept me focused and motivated when needed it most, and were always there lend
hand. A very special thanks goes to Rachel Canfield who has been my voice of reason
throughout graduate school, whether I asked for it not. This thesis would not have been
possible without her help, and there is nothing I can say that could express how much I
truly cherish her friendship and guidance.
Finally, I must thank my mother, Sharon Clark. Nothing I have in life would be
possible without the sacrifices she has made and the unwavering love she has shown me.
She stood beside me through the darkest of times, picked me up when I failed, pushed me
when she knew I could do better, and never once ceased to believe in me. There are no
words to express how thankful I am for everything she has given me, and it is through her
continued love and support that I’m here today.

v
TABLE OF CONTENTS
Page
ACKNOWLEDGEMENTS .............................................................................................. IV
LIST OF TABLES .......................................................................................................... VIII
LIST OF FIGURES .......................................................................................................... IX
ABSTRACT ........................................................................................................................ X
CHAPTER
I. INTRODUCTION ................................................................................................1
II. BACKGROUND AND LITERATURE REVIEW .............................................4
Local Policies ...............................................................................................5
Tropical Cyclones ........................................................................................6
Contraflow .................................................................................................10
Contraflow History ....................................................................................13
Risk Perception Theory..............................................................................16
III. RESEARCH METHODS ................................................................................20
Site and Situation .......................................................................................20
Data ............................................................................................................26
GIS Setup ...................................................................................................28
Hot Spot Analysis ......................................................................................31
Road Networks...........................................................................................34
Setting Route Starting Points .....................................................................34
Network Analysis.......................................................................................36
Area Relief .................................................................................................38
Assumptions for Analysis ..........................................................................40
Calculation of Travel Speeds .....................................................................41
Calculation of Route Distances and Travel Times ....................................46
Calculation of Clearance Times .................................................................48

vi
Limitations of Proposed Methods ..............................................................51
IV. RESULTS ........................................................................................................53
V. DISCUSSION ...................................................................................................59
VI. CONCLUSION................................................................................................66
REFERENCES/LITERATURE CITED ............................................................................69

viii
LIST OF TABLES
Table Page
1. Saffir-Simpson hurricane wind scale ..............................................................................8
2. Population categories using Jenks Natural Breaks .......................................................30
3. Nueces County, Texas selected evacuation route names ..............................................36
4. Evacuation route speeds ................................................................................................45
5. Evacuation route distances ............................................................................................47
6. Approximate clearance times for each evacuation scenario .........................................50
7. “Optimal” evacuation scenario .....................................................................................56
8. “Worst Case” evacuation scenario ................................................................................57
9. “Expected” evacuation scenario ...................................................................................58

ix
LIST OF FIGURES
Figure Page
1. Location of Nueces County, Texas on the Gulf Coast....................................................3
2. Atlantic Basin tropical cyclone paths .............................................................................7
3. Tropical cyclones strikes on the Gulf Coast, 1900-2010 ................................................9
4. Three primary types of contraflow evacuation strategies .............................................12
5. Traffic congestion during the evacuation of Hurricane Rita ........................................15
6. Nueces County, Texas topography ...............................................................................22
7. Damage from Hurricane Celia ......................................................................................23
8. Junction of IH-37 and SH-77 and the start of the contraflow evacuation route ...........24
9. Corpus Christi contraflow evacuation map ...................................................................25
10. Nueces County, Texas population hot spots ...............................................................27
11. Nueces County, Texas topographic map with potential flood zones ..........................29
12. Nueces County, Texas population distribution ...........................................................31
13. Nueces County, Texas evacuation starting points ......................................................33
14. Nueces County, Texas contraflow evacuation route ...................................................35
15. Nueces County, Texas selected evacuation routes .....................................................37
16. Nueces County, Texas topographic map with evacuation route starting points .........39
17. John F. Kennedy Causeway traveling from Mustang Island to Corpus Christi..........62
18. Existing roadside infrastructure and construction along IH-37 in Corpus Christi ......63
19. Labonte Park bridge along IH-37 evacuation route in Corpus Christi .......................63
20. Conditions of evaculane in Live Oak County, Texas .................................................64

x
ABSTRACT
Millions of residents along the United States Gulf Coast live with the threat of
tropical cyclones. These potentially devastating storms, more commonly referred to as
hurricanes in the North Atlantic Ocean, Caribbean Sea, Gulf of Mexico, and in the
eastern or central North Pacific Ocean east of the International Dateline, bring damaging
winds, heavy rains, severe flooding, and powerful storm surges that can quickly devastate
any area in their path. Due to the dangers of these storms, coastal areas create evacuation
plans that allow area residents to safely leave the city before they are impacted. This
study examined a contraflow evacuation plan for Corpus Christi, Texas in an attempt to
model what a major tropical cyclone evacuation might look like for this region. Using
ArcGIS, several potential evacuation routes were created in Nueces County, Texas to
simulate an evacuation under “optimal,” “expected,” and “worst case” scenarios. Results
of this study show that while a contraflow evacuation plan has the potential to cause
severe traffic congestions and extremely long evacuation times, under both “optimal” and
“expected” conditions it serves as an effective evacuation method out of the city.

1
I. INTRODUCTION
The world has begun to see a change in climate that brings with it a need to
examine policies and procedures surrounding issues with coastal land use, resource
conservation, energy policy, and disaster management. Looking at disaster management,
and specifically evacuation policy along the United States Gulf Coast, current strategies
must be examined frequently to ensure that they are robust enough to deal with any mass
evacuation order that might be given in the future. Gulf Coast state officials also need to
be sure that their existing policies ensure the safety of their residents should a major
tropical cyclone strike. The scientific community now warns that a warming global
climate can bring rising sea levels, changes in storm frequency and intensity, and land
degradation, among others, to which the overpopulated coastal regions will be forced to
adapt (Frey et al., 2010; Mousavi et al., 2011; Warner and Tissot, 2012). With the
potential for storm frequency and intensity changes, city and county emergency managers
as well as local government leaders along the Gulf Coast are mandated to put in place
evacuation strategies.
In order to provide safe environments for their residents, emergency managers
and local government leaders in Gulf Coast cities must examine and evaluate their
current disaster policies, including those that focus on evacuation, specifically focusing
on evacuation times, potential for traffic congestion and overall effectiveness. If deemed
necessary, policy reviews should be conducted to determine the best practices for
conducting mass evacuations from natural disasters, particularly from tropical cyclones.
Additionally, these areas might benefit from examining evacuation experiences of other
coastal areas, to determine the best possible ways to evacuate a populated area.

2
Additionally, local officials might observe how information is disseminated to residents
to ensure that they are able to evacuate as quickly and safely as possible. The Gulf Coast
is an area that experiences landfall from several tropical cyclones each year. Should
these systems increase in intensity, the region needs to be as prepared as possible to
handle the mass evacuations that will occur (Fonseca et al., 2009; Dixit and Wolshon,
2014). By examining policies from other regions, policymakers can determine what may
or may not work in their area, in an effort to develop strategies more capable of dealing
with mass evacuations.
City planners, local government officials, and emergency managers are constantly
working to develop and implement the most effective evacuation strategies as possible
for their particular jurisdictions. It was the goal of this study to evaluate the contraflow
evacuation plans in Corpus Christi, Texas (Figure 1), looking specifically at its potential
implications including evacuation times, effects on traffic congestion, and overall plan
effectiveness.

3
Figure 1. Location of Nueces County, Texas on the Gulf Coast. (Google Maps – www.maps.google.com)
Gulf
of
Mexico

4
II. BACKGROUND AND LITERATURE REVIEW
It is generally agreed upon that the global climate is changing which will likely
alter the weather and storm patterns in several ways (Church and White, 2006; IPCC,
2015; Irish et al., 2010; Mousavi et al., 2011; Yang et al., 2014). Along the United States
Gulf Coast, sea level rise and a change in tropical cyclone frequency and intensity are
two of the major issues that the area may face in the future (Frey et al., 2010; Mousavi et
al., 2011; Warner and Tissot, 2012). A warming planet means warmer waters, which
many researchers believe will produce stronger storms (Mousavi et al., 2011). When
these storms combine with higher sea levels, the consequences are likely to be disastrous
(Mousavi et al., 2011).
Using prediction models such as the Model for the Assessment of Greenhouse-gas
Induced Climate Change/a regional climate SCENario GENerator
(MAGICC/SCENGEN), which measures and predicts air temperature at the sea surface,
researchers have predicted a steady rise in sea surface temperatures through 2080 (Frey et
al., 2010). The warmer temperatures are a problem for this area because as the water
warms it expands, and in turn increases sea level (Frey et al., 2010; Irish et al., 2010;
Mousavi et al., 2011). Using MAGICC/SCENGEN, Frey predicts an increase of 0.36-
1.38°C in sea surface temperature by the 2030s and 0.096-5.02°C by the 2080s, which
could translate into a 7.5-14.4 centimeters (cm) and 20.9-58.4 cm increase in Gulf Coast
sea levels respectively (Frey et al., 2010). This increased sea level would cause higher
storm surges and thus a need to evacuate even more people during tropical cyclones. It is
unclear how much sea levels will actually rise in the future, but coastal areas need to be
prepared for any changes that may occur.

5
Tropical cyclone strength is also closely tied to sea surface temperature, with
warmer waters tending to produce lower pressure storms meaning more powerful tropical
cyclones (Frey et al., 2010). Lower pressure in a storm will greatly increase its overall
intensity, with studies showing that a 10 to15 percent increase in storm surge is possible
for every 10 millibar (mb) drop in pressure (Mousavi et al., 2011). When stronger
tropical cyclones combine with potentially higher sea levels, there is a much greater
potential for damage, and an increased need for evacuations in Gulf Coastal areas.
Local Policies
Due to these predictions, it is generally agreed upon that existing disaster plans
must be regularly evaluated to ensure the safety of area residents (Warner and Tissot,
2012). These plans should consider possible future sea level rise and its implications for
coastal communities, the management of utilities and other emergency services, as well
as evacuation strategies for when major tropical cyclones do impact an area (Fonseca et
al., 2009; Warner and Tissot, 2012; Yang et al., 2014).
The U.S. Gulf Coast is an area of high vulnerability due to an increasing
population, which puts more people at risk from tropical cyclones and flooding (Chen et
al., 2007; Thatcher, Brock, and Pendleton, 2013). Additionally, rising sea levels
compound the impacts from tropical cyclone storm surges and land subsidence, putting
the population at an even greater risk for loss of life and land (Thatcher, Brock, and
Pendleton, 2013). Several plans are currently in place in Gulf Coast communities that
focus on the need to restore services such as electricity, phone, and wastewater as quickly

6
as possible, however, more work needs to be done to ensure the safety of citizens during
an emergency (Scharfenaker, 2006).
Over the last few years, existing policies have begun to shift away from focusing
on mitigation to those that look more at adapting to changes seen throughout the area
(Boswell, Deyle, and Smith, 1999; Cigler, 2009). As the focus of these new plans shift,
so must the plans themselves, in order to better provide protection for the local
population. Many cities such as Corpus Christi do currently have plans in place to assist
them during natural disasters. These plans consist of strategies for evacuation, utility
management, economic preparations, and sea level rise among others (Boswell, Deyle,
and Smith, 1999; Scharfenaker, 2006; Chen et al., 2007; Thatcher, Brock, and Pendleton,
2013). However, even their published plan states that it will not be sufficient to evacuate
all area residents, which will certainly be a problem when evacuation orders are issued
(Texas Department of Transportation, 2015).
Tropical Cyclones
Tropical cyclones are large, cyclonic storms that form over warm tropical and
subtropical waters (National Hurricane Center, 2016). This study focused on tropical
cyclones that form in the North Atlantic Ocean, as they are the storms that impact the
United States Gulf Coast. These storms tend to form between 5 and 30 degrees North
Latitude and can originate anywhere in the North Atlantic Ocean (National Hurricane
Center, 2016) (Figure 2). Tropical cyclones need warm most air in order to form, and
tend to occur from late Spring to early Fall, with the actual hurricane (tropical cyclones

7
are referred to as hurricanes in the Atlantic Basin) season spanning from June 1st through
November 30th (National Hurricane Center, 2016).
Storm intensity is classified on the Saffir-Simpson Hurricane Wind Scale, which
ranks storms based on sustained wind speeds. The scale categorizes storms using five
main categories and ranges from Category 1 which is the weakest with sustained winds of
119-153 kilometers per hour (kph), (74-95 miles per hour (mph), to Category 5 having
the strongest winds with sustained speeds of greater than 252 kph (greater than 157 mph)
(National Weather Service, 2012) (Table 1). A tropical cyclone receives a classification
of “major” when it reaches Category 3 status (178-208 kmh, 111-130 mph) because at
that point it has the potential to cause extreme structural damage, tree uprooting from
powerful winds, and flooding from heavy rains and storm surges that can be devastating
to coastal residents (Chen, 2007; Cigler, 2009; National Hurricane Center, 2016).
Figure 2. Atlantic Basin tropical cyclone paths. (National Hurricane Center - http://www.nhc.noaa.gov/climo/)

8
As stated above, the official hurricane season for the Atlantic Basin runs from
June 1st through November 30th, but storms can, and occasionally do occur outside of
these bounds. Peak storm activity is generally seen from mid to late August, extending
into October as water temperatures are warmest and will feed these massive storms
(National Hurricane Center, 2016).
Tropical cyclones are named to provide easy identification and reference based on
a list from the United Nations World Meteorological Organization. The naming lists are
set for six years at a time and repeat on the seventh. Names repeat unless there is a
particularly devastating tropical cyclone such as Andrew in 1992 or Katrina in 2005
(National Hurricane Center, 2015). When a devastating storm such as these strike, the
name is retired and not used again.
A typical season includes many storms of differing categories. Between 1968 and
2014 there has been an average of 11.8 named storms (including tropical depressions and
tropical storms) originating in the Atlantic Basin (NOAA, 2015). Of these, 6.2 are strong
enough to be classified as a Category 1 storm, and 2.4 reach Category 3, or “major”
storm level (NOAA, 2015). Storms originate in the Atlantic Basin, so they do not always
move into the Gulf or impact Texas, but a large portion do. From 1851 to 2014, the
Texas coast was struck directly by 63 tropical cyclones, 19 of which were classified as
Storm Category km/h mph
1 119-153 km/h 74-95 mph
2 154-177 km/h 96-110 mph
3 (major) 179-208 km/h 111-129 mph
4 (major) 209-251 km/h 130-156 mph
5 (major) > 252 km/h > 157 mph
Table 1. Saffir-Simpson hurricane wind scale

9
Category 3 or higher (NOAA, 2016). This is second only to Florida, which is impacted
by 40 percent of all Atlantic tropical cyclones (NOAA, 2016). Of the storms to strike
Texas since 1900, fourteen of them have directly impacted Nueces County and the
Corpus Christi area (National Hurricane Center, 2016) (Figure 3). With the potential of
storms to impact Texas, and particularly the Nueces County area, it is clear that these
areas need effective policies to protect the lives and properties of area residents during
the storms, and to manage their damaging effects in the aftermath.
Figure 3. Tropical cyclone strikes on the Gulf Coast, 1900-2010.
(National Hurricane Center - http://www.nhc.noaa.gov/climo/)

10
Contraflow
When looking at evacuation strategies, several regions have begun implementing
contraflow methods in their evacuation plans in an attempt to evacuate as many people as
possible from areas threatened by tropical cyclones (Fonseca et al., 2009; Dixit and
Wolshon, 2014). In most cases, contraflow is only implemented during large tropical
cyclones, Categories 4 or 5, because so much planning and labor is required to initiate it.
Because of this, only a few studies are available which have actual contraflow evacuation
data and do not use computer-generated models (Wolshon, 2007).
Contraflow evacuations employ methods to reverse the flow of traffic on major
roadways to move the maximum number of people out of an area in the shortest amount
of time (Fonseca et al., 2009; Dixit and Wolshon, 2014). While these plans do allow
more people to leave an area, one study has shown that they have the potential to
significantly decrease traffic flow, which could leave a larger number of people stranded
on the roadway as the storm approaches (Dixit and Wolshon, 2014). Contraflow plans
are clearly not perfect, but have been proven to be effective in the past when used for
evacuations (Wolshon, 2001; Dixit and Wolshon, 2014).
There are three primary types of contraflow plans that may be used for varying
degrees of evacuation needs. All plans typical focus on federal or state highways with
two or more adjacent lanes flowing towards an area (inbound) and two or more adjacent
lanes flowing away from an area (outbound). The first type of contraflow plan calls for
the reversal of one of the inbound lanes into an outbound lane, thus moving the traffic out
of an area (Wolshon, 2001) (Figure 4B-One Contraflow Lane). This plan increases
traffic flow by opening another lane to motorists, while still allowing inbound access to

11
the city or to the event that traffic is heading away from. The next method opens the
shoulder or shoulders of the existing outbound lane to use for evacuation (Wolshon,
2001) (Figure 1C – Shoulder Lane Evacuation). Depending on whether one or both
shoulders are opened, this method may add up to two additional lanes to the evacuation
route. However, shoulder lanes are not always constructed to the same standards as main
travel lanes and often will not allow for travel at the same speed as normal travel lanes
(Wolshon, 2001). The final method is a full reversal of all inbound lanes, sometimes
referred to as “One-Way-Out,” so that all lanes of traffic are moving in one direction
away from an area (Wolshon, 2001) (Figure 1D – Two Contraflow Lanes). This plan
allows for the maximum number of people to be evacuated from an area, generally in the
shortest amount of time. Despite being one of the most effective means of mass
evacuation, issues can and do arise when implementing this type of evacuation. These
issues will be discussed later in this section.
The main benefit of contraflow, and the reason it is often used for evacuations, is
that it increases the maximum traffic output from an area. Traffic flow is generally
reduced during an evacuation under normal conditions as motorists tend to drive slower
and face congestions from an excess of vehicles on the roadways (Wolshon, 2001). Each
lane that is opened for contraflow, however, increases this output and allows for more
people to leave an area. Contraflow lanes will not have the same capacity as the lanes
moving in the normal direction under non-evacuation conditions, but adding one
contraflow lane has shown to increase overall traffic flow by up to 30 percent, and up to
67 percent when adding two contraflow lanes (Wolshon, 2001; Wolshon, 2007; Fonseca
et al., 2009; Fries et al., 2011). This type of increase can make a tremendous difference

12
when an area is facing an approaching tropical cyclone or other disaster.
Despite the benefits of increased traffic flow, and the additional people who are
able to evacuate safely from an area, contraflow has several drawbacks to be considered.
One major problem with contraflow is signage and facility access for those using the
contraflow lanes. Entrance and exit ramps are designed to be used from one particular
direction making it very hard to find suitable exits for those using the reversed lanes.
This causes problems when people need to exit for food, gas, restroom facilities, or other
needs (Wolshon, 2001).
Another major issue with contraflow is motorist safety during the evacuation
itself. Traffic accidents tend to occur at higher rates on contraflow lanes due to a lack of
signage and safety measures designed for normal flowing traffic (Wolshon, 2001; Fries et
al., 2011). Local officials must ensure that all entrances are blocked and that all other
Figure 4. Three primary types of contraflow evacuation strategies.
C
A B
D

13
vehicles are removed from the lanes that are going to be reversed before implementing
contraflow or they face the dangers of head on collisions (Wolshon, 2001). Exits on the
contraflow lane itself must be closely monitored as well to ensure drivers do not exit an
incorrect place into oncoming traffic.
Access for emergency vehicles is another obstacle, particularly in situations
where all lanes are reversed. In these situations, there is no way for emergency personal
to get back into the city. If this happens, people may be left stranded in their homes or
vehicles, communications might be lost with no way to fix services, while crimes might
be committed with no police to assist (Wolshon, 2001).
Finally, cost and implementation must be considered with contraflow evacuations.
In most cases, a large force is required to get contraflow started, which may be extremely
expensive (Wolshon, 2001). Additionally, the creation of the plan itself as well as the
necessary infrastructure improvements are likely to be quite costly to local governments,
particularly for infrastructure that may never actually be put to use (Wolshon, 2001). To
have a truly effective plan, a great amount of research and testing must be done, which is
generally expensive to conduct. This is certainly not an exhaustive list of all problems
that can arise, but does highlight several major issues that communities need to consider
before designing or implementing contraflow plans.
Contraflow History
Contraflow is not a new concept in traffic management; it has been used for a
long time to alleviate congestion and control traffic flow. It has been successfully
implemented to manage commuter flow over bridges and arterial roads during rush hour

14
commutes, and to help clear venue parking lots during special events (Wolshon, 2001).
Washington, D.C., for example, has implemented contraflow on Connecticut Avenue
during rush hour periods to facilitate traffic flow and reduce local congestion (Wolshon,
2001). These instances, however, are conducted on a much smaller scale than interstate
contraflow is for evacuations. Because of this, contraflow for traffic control is often
easier to implement, manage, and are generally safer due to slower speeds and drivers
being familiar with the process (Wolshon, 2001). However, using contraflow on
interstate highways introduces numerous factors that can make the process much more
dangerous and difficult to implement (Wolshon, 2001).
Contraflow was first used for a tropical cyclone evacuation on Interstate Highway
(IH-16) near Savannah, Georgia, as well as Interstate Highway (IH-26) outside of
Charleston, South Carolina in 1999 during Hurricane Floyd (Wolshon, 2001). While it
did allow for more people to get out of the area quickly, due to the nearly 67 percent
increase in traffic flow, it also brought to light some of the potential problems that may
be caused by contraflow (Wolshon, 2001; Wolshon, 2007).
Contraflow was ordered by Texas Governor, Rick Perry for the evacuation of
Galveston County, Texas during Hurricane Rita in 2005, which led to one of the largest
evacuations in U.S. history (Chiu et al., 2008). This particular evacuation, while
ultimately effective, led to serious problems with traffic congestion and shed light on
some of the potential hazards of traffic congestion that may be experienced during a
contraflow evacuation (Chiu et al., 2008; Joh et al., 2014; Medium.com, 2016) (Figure 5).
Contraflow was also ordered in 2005 for the evacuation of the New Orleans,
Louisiana are during Hurricane Katrina. This evacuation posed the unique challenge of

15
being the first time the entirety of a major urban center needed to be completely
evacuated (Boyd, Wolshon, and Van Heerden, 2009). In addition to the massive scale of
the evacuation, it was also incredibly effective, nearly cutting the expected time predicted
by city officials in half, due in large part to excellent planning and the implementation of
both phased evacuations and contraflow operations (Wolshon, 2007; Boyd, Wolshon, and
Van Heerden, 2009).
Contraflow has been used for other evacuations as well, including Hurricane Ivan
in 2004 and Hurricane Gustav in 2008, both of which called for the evacuation of New
Orleans, and both conducted with varying degrees of success. The early stages of the
Hurricane Ivan evacuation saw reduced traffic flow for several hours with a steady climb
towards normal traffic flow (Dixit and Wolshon, 2014). During Hurricane Gustave,
however, the evacuation was ordered when traffic was already nearly at a standstill, but
greatly improved flow after roughly six hours (Dixit and Wolshon, 2014). Contraflow
plans have been established for many other areas aside New Orleans, however, these
Figure 5. Traffic congestion during the evacuation of Hurricane Rita.
(Medium.com - https://medium.com/the-weather-channel/evacuate-or-stay-1f1c87b1d62c#.55quovo0z)

16
incidents provide excellent examples of the variation that can be seen when using
contraflow, particularly when they are all being used in the same area. Multiple plans
have also been established in Georgia, Texas, Mississippi, South Carolina, and Florida
(Wolshon 2001). In addition to these cases, traffic models have been created to simulate
contraflow evacuations using various storm categories, and across multiples locations
along the Gulf Coast. Results show that contraflow proved to be more effective at
evacuating large numbers of people than standard methods (Fonseca et al., 2009; Fries et
al., 2011). This suggests that, despite the potential drawbacks of contraflow, it is clearly
a viable option when it comes to mass evacuation.
Risk Perception Theory
Risk perception theory was examined to understand the reasons that influence
individuals’ decisions to evacuate, and ultimately influence the efficiency of the
evacuation itself. This theory attempts to weigh the various factors that influence both
individual and group decisions to act during an event, in this case a tropical cyclone
evacuation. Several factors including demographics, age, number of dependents, income
level, physical condition, proximity to the storm, animal responsibility, and experience
with past storms influence decisions to evacuate or shelter in place (Stein, Dueñas-
Osorio, and Subramanian, 2010). It is often the case that those in the same area will not
perceive the dangers from an approaching storm in the same way as others, and thus,
behave differently towards the threat. When this happens, some residents may choose to
stay when they should be evacuating, or, they may evacuate when they should be staying
in place. Those that evacuate with no actual need to are sometimes referred to as

17
“shadow evacuees” because they follow those that are evacuating regardless of the need
(Stein, Dueñas-Osorio, and Subramanian, 2010). These individuals perceive the storm to
be a far greater threat than it might actually be, causing them to react in a way they feel is
going to keep them safe. Often, however, this results in additional people on the
roadways and further exacerbates the already heavy traffic congestion generally seen
during a mass evacuation (Stein, Dueñas-Osorio, and Subramanian, 2010).
Shadow evacuations and unnecessary high levels of risk perception occur in part
because of the way evacuation orders are issued. Evacuation orders are given to ensure
that those at the greatest risk from the storm are kept safe when the storm strikes. In the
case of tropical cyclones, evacuation orders are often given to those that are threatened by
storm surge because it is one of the most devastating aspects of a storm (Stein, Dueñas-
Osorio, and Subramanian, 2010). These orders, however, only look at the science of the
storm and do not account for the perceptions of those in the storm’s path. Some
individuals can feel more threatened due to the previously stated reasons and try to
escape to safety even though they may live in an area that is not technically in an
evacuation zone or in danger of flooding. The opposite can also be true. Residents who
have lived through storms in the past may believe they are not in danger despite the
evacuation orders and decide to shelter in place rather than evacuate. They perceive that
there is not enough danger to evacuate and choose to stay. Both decisions are likely to
prove to be dangerous, even deadly, not only to those making the decisions to stay or
leave, but to those that are either evacuating with the additional people, or to the
emergency responders who may have to rescue those who stay and become trapped.

18
Since everyone evaluates conditions based on their own experiences and perceptions, it
becomes impossible to know exactly how people will react during an evacuation.
Aside from personal perceptions, some people tend to look at their neighborhood
holistically when ultimately deciding to evacuate, particularly if they are not directly in
an evacuation zone. It is often the case that those who are unsure about evacuating will
look at those around them for guidance. If their close neighbors are deciding to leave,
they too may decide to do so. Alternately, if their neighbors are staying they may choose
to shelter in place as well (Stein, Dueñas-Osorio, and Subramanian, 2010). Along with
those around them, the media often plays a very large part in evacuation decisions (Stein,
Dueñas-Osorio, and Subramanian, 2010; Dow and Cutter, 1998). Individuals tend to
trust media sources more than they do their local government (Dow and Cutter, 1998).
For instance, if their local weather channel tells them to evacuate they are generally more
inclined to do so (Dow and Cutter, 1998).
It is clear then that the ultimate decision to evacuate is a very complex one.
Several different issues, ranging from age, health, family, storm trajectory, neighborhood
evacuations, and intensity of past experience factor in to a person’s decision to evacuate
(Stein, Dueñas-Osorio, and Subramanian, 2010; Dow and Cutter, 1998). Everyone will
handle these decisions differently, and what causes a resident or one area to feel the need
to evacuate may not cause others in the same situation to behave similarly (Stein,
Dueñas-Osorio, and Subramanian, 2010). It is impossible to know exactly how people
will behave during a crisis, which is why risk perception plays such an important role in
evacuation planning. Human behavior must be considered when planning a mass
evacuation, particularly one that requires as much planning as contraflow. The plans
19
must be adaptable to account for any extra evacuees who decide to leave their homes, but
must also allow for the reentry of emergency responders to rescue those who may decide
to stay. Thus, risk perception plays a very important role in disaster planning should be
considered before any evacuation plan is finalized.
Overall, existing disaster management strategies, specifically evacuation plans,
should be examined to ensure they are the most effective option for an area faced with an
emergency evacuation. It is clear that no single strategy will work for every scenario
during a tropical cyclone, but a plan with proven results and a good foundation has the
potential to be easily be adapted to fit other scenarios throughout the region. The best
plans must be adaptable to manage the unpredictability of storms, however, emergency
managers and local government leaders in coastal communities need to have a general
idea of what will or will not work when making initial plans.

20
III. RESEARCH METHODS
Site and Situation
This research was conducted along the United States Gulf Coast, focusing
particularly on Nueces County, Texas and the City of Corpus Christi. Corpus Christi is
located in Nueces County and situated on the western Gulf Coast, making it susceptible
to tropical cyclones from both direct strikes and effects of nearby storms. This area was
selected as it is located in an area that has in the past, and could again, face a direct hit
from a tropical cyclone, making it extremely important to have effective evacuation
policies. Based on historical accounts, this area has been impacted by numerous tropical
cyclones, making it safe to assume that it will be again in the future (Roth, 2010). Even
without a direct strike, Corpus Christi still faces dangers from tropical cyclones in the
area and must be prepared for the future.
Nueces County is a largely populated area, having an estimated population of
324,074 in 2015, with the majority of these residing in the City of Corpus Christi (U.S.
Census Bureau, 2016). As with many coastal areas, Corpus Christi continues to grow,
seeing roughly 6.2 percent increase in population from 2010-2015 (U.S. Census Bureau,
2015). Additionally, around 17 percent of the population was predicted to be living at or
under the poverty level in 2015, causing additional problems of inadequate shelter and/or
lack of access to reliable transportation should the need to evacuate arise (U.S. Census
Bureau, 2015). Having a large and diverse population located this close to the coast
makes the area extremely vulnerable to the effects of tropical cyclones.
The large population also means there are numerous vehicles on the road. As of
2014, there was an estimated 125,352 vehicles in the Corpus Christi area (City Data,

21
2016). This does not include tourists, individuals who may be in town for work, or
truckers passing through the area. This leaves the potential for increased numbers of
vehicles attempting to use the same evacuation routes and causing severe traffic
congestion.
The Corpus Christi area is a generally low lying area with most of the city
residing below 12 meters in elevation (USGS, 2016) (Figure 6). Most of the city is also
located on or near the Gulf Coast itself, or close to either Corpus Christi Bay, or Nueces
Bay. This puts most of the city’s population, particularly those living in proximity to
coastal and bay areas, at risk of flooding from tropical cyclone storm surges.
Since 1900, Nueces County has experienced fourteen direct impacts from tropical
cyclones (National Weather Service, 2010; National Hurricane Center, 2016). Tropical
cyclones forming in the North Atlantic Ocean tend to take a westward trajectory due to
the prevailing easterly winds throughout this region, and depending on their origin and
path through the Gulf, frequently steer towards the Texas coast (NOAA, 2014). While
the Texas coast is a very large area, and storms will not always strike the same place,
Nueces County is in an area that faces the potential of both direct and indirect impacts
from tropical cyclones.
The most recent and severe storm to impact the Corpus Christi area was
Hurricane Celia in 1970. Celia made landfall near Corpus Christi on August 3rd, 1970, as
a strong Category 3 storm with sustained winds of 201 kmh (125 mph), having gusts up
to 259 kmh (161 mph) (National Weather Service, 2010). Damage from Celia was severe
and up to 70 percent of Corpus Christi residents were affected in some way.

22
Fig
ure 6
. Nueces C
ou
nty
, Tex
as top
ograp
hy.

23
Celia caused fifteen deaths, destroyed 8,950 homes and damaged thousands more. The
storm destroyed 252 businesses, 331 boats, numerous mobile homes, and caused utility
shortages to much of the area (National Weather Service, 2010) (Figure 7). Along with
the severe winds, Celia brought a storm surge of nearly 1.5 meters (m)(approximately 4.5
feet) to Corpus Christi and around 2.7 m (approximately 8.3 feet) at Port Aransas Beach
to the northeast. At least eight tornadoes developed, and from five to seven inches of rain
fell over the affected area (National Weather Service, 2010). Storms like Celia are not
typical to the area, but it serves as a reminder that they can and do occur, emphasizing the
importance of proper planning to ensure the safety of area residents.
Although there is great potential for a major storm to strike this area, Corpus
Christi has never actually had to implement its contraflow plan this, it remains untested.
The current contraflow evacuation plan for Corpus Christi designates Interstate Highway
37 (IH-37) as the evacuation route for residents from the area. The southbound lanes of
IH-37 are planned to be reversed, forcing all traffic northbound towards San Antonio
(TxDOT, 2016) (Figure 8). Actual contraflow operations will begin at the junction of IH-
69E/US Highway 77 (IH-69E/US-77) and IH-37. At this juncture, motorists traveling
Figure 7. Damage from Hurricane Celia. (National Hurricane Center - http://www.weather.gov/crp/?n=celia1970)

24
along Interstate Highway 69E-US 77 will be forced onto the southbound lane of IH-37,
which will be reversed and flowing northward (TxDOT, 2016) (Figure 8). All traffic will
then flow north out of Corpus Christi until the termination of contraflow at the junction
of State Highway 97 (SH-97) and FM 3006 near Pleasanton (TxDOT, 2015; TxDOT,
2016). North of this junction, traffic on southbound IH-37 will resume its normal flow so
all vehicles heading north must exit. To alleviate the potential of traffic congestion at the
termination of contraflow, additional exits are located at the junctions of State Highway
359 (SH-359) near Mathis, and US Highway 59 (US-59) near George West (TxDOT,
2016) (Figure 9). These additional exits allow for the dispersion of motorists along the
route and help control traffic congestion along the route.
Figure 8. Junction of IH-37 and SH-77 and the start of the contraflow evacuation route.
(Google Maps – www.maps.google.com)

25
Corpus Christi also employs evacuation zones for phased evacuations, and has
additional evacuation routes for certain areas of the city. These routes, however, are not
part of their overall contraflow plan and are not set up to be reversed, and as such, are not
Figure 9. Corpus Christi contraflow evacuation map.
(TxDOT - http://ftp.dot.state.tx.us/pub/txdot-info/trv/hurricane/i37_contraflow.pdf)

26
examined in this study. The routes are planned to be used for smaller scale evacuations
from weaker tropical systems, or in the early of the evacuation process before contraflow
is enacted. It should be noted, however, that the combination of phased evacuations and
additional evacuation routes will greatly improve the overall effectiveness of an
evacuation from Corpus Christi should a major tropical cyclone impact the area.
Data
The officially published contraflow evacuation plan for Corpus Christi issued by
the Texas Department of Transportation (TxDOT) serves as a primary data source for this
research (TxDOT, 2016) (Figure 9). Available through the City of Corpus Christi
website, this plan lays out the evacuation routes for the area, including the origins,
termination, and additional exits along the route.
Texas Partnership Shapefiles were obtained from the United States Census
Bureau for the four counties where the full route passes though and includes, Nueces, San
Patricia, Live Oak, and Atascosa Counties (U.S. Census Bureau, 2016). These files
contained the necessary block level population data and road network data for the
analysis. The block level population data was used for Nueces County to create a
population density map using hot spot analysis (Figure 10). This map showed the zones
of dense population in Nueces County that will ultimately serve as the starting points for
the various evacuation routes.
Also contained in the Partnership Shape Files were the road network datasets needed to
create a functional road network that spanned the four counties along the evacuation
route (U.S. Census Bureau, 2016). Road networks for each of the four individual

27
Fig
ure 1
0. N
ueces C
oun
ty, T
exas p
op
ulatio
n h
ot sp
ots.

28
counties were combined in ArcGIS to create a master road network that allowed for a
network analysis to be performed along the entire evacuation route to determine total
distance for each of the selected routes.
Additionally, data was obtained from TxDOT containing average annual daily
traffic (AADT), hourly traffic volumes, average speeds, and both daily and hourly
vehicle counts along major roadways in Corpus Christi (TxDOT, 1/2016; TxDOT,
8/2016). This data allowed for a more accurate estimation of normal daily traffic flow,
including average speeds, and serves as a starting point for the examination into the
effects of contraflow on traffic during a major evacuation.
Further, a digital elevation model (DEM) of the Nueces County area was obtained
from the U.S. Geological Survey (USGS) to examine the local topography (USGS, 2016).
This DEM was used to examine the local area relief to gain an understanding of which
areas of Corpus Christi appear to be in the greatest danger of flooding from a tropical
cyclone (Figure 11).
GIS Setup
Analysis was performed using ESRI’s ArcGIS. To begin, block level population
data from Nueces County was used to create a population density map using the
“Optimized Hot Spot Analysis: function. Hot spot analysis was only done for Nueces
County because it is the starting point for all the evacuation routes. Population density is
not necessary for the other counties in this study because their evacuation plans are not
being examined. They are included in the overall analysis only because the evacuation
route for Corpus Christi passes through them.

29
Fig
ure 1
1. N
ueces C
oun
ty, T
exas to
po
grap
hic m
ap w
ith p
oten
tial floo
d zo
nes.

30
To begin the mapping process, the “Editor” function was used to remove the
water in Nueces Bay and along the shoreline. This ensured that any interior bodies of
water would not be displayed on the map to eliminate any confusion over which areas
needed to be evacuated. Some water areas around Mustang Island and Padre Island were
left so as not to remove any of the road networks associated with area bridges.
The various evacuation routes were selected based on block level population data
associated with Nueces County. This data, obtained from the Census Bureau, was the
foundation of the analysis. Nueces Country block level population data, was used to see
how the population was distributed around the city. The “POP 10” field in the attribute
table contained the populations for various census blocks, and thus used to determine the
starting locations (U.S. Census Bureau, 2016). The dataset was classified using Natural
Breaks (Jenks) and divided into seven categories so that it would have a similar
distribution to the population Hot Spot Analysis output. This returned groups ranging
from 0-25 to 1031-2135 (Table 2) (Figure 12).
Table 2. Population categories using Jenks Natural Breaks
Category Population Range
1 0-25
2 26-73
3 74-149
4 150-301
5 302-528
6 583-1030
7 1031-2135

31
Fig
ure 1
2. N
ueces C
oun
ty, T
exas p
op
ulatio
n d
istributio
n.

32
Hot Spot Analysis
To ensure that the areas of high population actually had significance across the
area, a hot spot analysis was performed using the “Optimized Hot Spot Analysis”
function in ArcGIS. The Nueces County Population layer was used as the input and the
hot spot analysis was run on the same “POP 10” field used for the previous population
map. This analysis displayed areas that had both a large population in relation to the rest
of the area, as well as where this large population was significant. This analysis returned
a large area with significant population in one central location of the city so further
analysis was necessary to ensure that the areas chosen for the start of evacuation had a
large population that was statically significant (Figure 10).
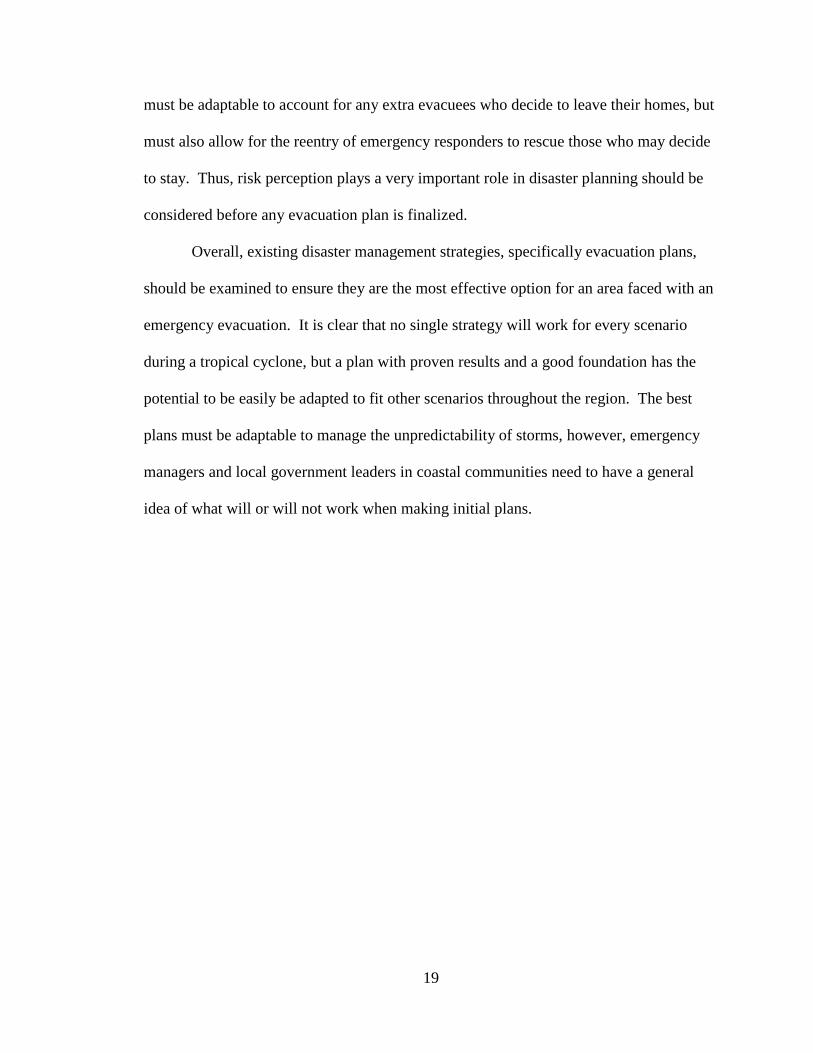
To determine what areas met the criteria for the route starting points, the “Select”
tool was used to pull the upper two categories of population from the original population
layer. These layers had populations of 583-1030 and 1031-2135. The upper two
population categories were used because employing only the top category returned very
few locations to serve as potential evacuation starting points. By using the top two it
ensured there were at least fifteen potential routes that could be analyzed. This same
process was used with the hot spot analysis layer to select only those areas with a 99
percent confidence of being a population hot spot. The two upper categories of
population were then overlaid on the hot spot layer using the Select function. This gave
an output map that shows only those locations with at least 583 residents that are also
statistically significant population hot spots. These areas would serve as the evacuation
route starting points because they indicate where people are concentrated in Nueces
County (Figure 13).
33
Fig
ure 1
3. N
ueces C
oun
ty, T
exas e
vacu
ation ro
ute startin
g p
oin
ts

34
Road Networks
Next the road network was established to begin routing. A road network layer
was obtained from each of the four counties, as well as, a county boundary layer to better
show the locations of the roads. These layers were merged using the “Merge” tool so
they would form one cohesive network allowing routes to cross county boundaries
(Figure 14)
To begin the process of creating the road network to run the network analysis, a
New Feature Dataset was established within the Corpus Christi Evacuation “CC_Evac”
geodatabase. The coordinate system was chosen to match all the previous layers included
in the map so that the layers would all work in conjunction with each other. The
coordinate system used for this analysis was GCS North American 1983. The XY, and Z
coordinate system were left as the default, NAD 1983, so that it, too, would match the
rest of the layers already include in the map.
Since no historical traffic data was available this was the only layer included in
the analysis. Elevation fields were used to model the elevation of network features and
units were set to miles (later converted to kilometers (km)). Once this road network was
created it was added to the map and the route starting points could be added.
Setting Route Starting Points
The ”Evac Route Start Points” layer was used to locate the starting location of
each of the routes. All routes needed to begin in one of the sections of this layer, and
preferably one that had both the highest population level, 1031-2135 and had a 99 percent

35
Figure 14. Nueces County, Texas contraflow evacuation route

36
confidence as a hot spot. To obtain at least fifteen route starting points, however, a few
locations were selected from the Category 6 population level, 538-1030.
Starting route locations were chosen by selecting a point within the “Evac Route
Start Point” boundary that also had a named road so that the “Find Address” tool could be
used. The route starting point was placed near the center of each area while still
maintaining access to the rest of the road network. Fifteen locations were ultimately
chosen to serve as route starting points for the analysis (Table 3) (Figure 15).
Network Analysis
Once these locations were chosen, the “New Route” function within the Network
Analysis tool was used to create each route. A centralized street was used to ensure that
it could be located with the ArcGIS database. If the road was detected, then a new route
start point could be added to the map. Each starting point was labeled in the following
manner “Route # Start, Street Name”. For example, the starting point of the first route
was
Route
NumberRoute Name
Route
NumberRoute Name
1 Mingo Cay CT 9 Chachalaca Dr.
2 Radial Ct. 10 Kay St.
3 Dunbarton Oak Dr. 11 Oregon Trl.
4 Freds Folly Dr. 12 Oakhurst Dr.
5 Townhouse Ln 13 Curtis Clark Dr.
6 Green Acre Dr. 14 Riverview Dr.
7 Devils Creek Dr. 15 Rock Island Dr. (Robstown, TX)
8 Amanda St. 16 Contraflow Route
Table 3. Nueces County, Texas selected evacuation route names

37
Fig
ure 1
5. N
ueces C
oun
ty, T
exas selec
ted ev
acuatio
n ro
utes

38
labeled “Route 1, Mingo Cay Ct”. Since there were two sections of the contraflow route
to analyze - the “to contraflow” section and the “through contraflow” section - these
routes all needed to terminate at the same location to serve as the start of the “through
contraflow” section. The contraflow plan for Corpus Christi begans at the junction of IH-
69/US-77 and IH-37, this a second marker was placed at this junction for each route and
named “Route # End”. Finally, once the route was calculated with the “Network
Analysis” tool, each route was labeled and color coded for easy analysis. This process
was repeated for all fifteen of the route starting points, enabling the calculation of all
distances from the evacuation route origins to the start of contraflow, including the
calculation of the effects traffic congestion would have on the route to determine the
overall speed of the evacuation under various traffic conditions.
Area Relief
To get a sense of area relief, an elevation map was created using a digital
elevation model (DEM) obtained from the USGS (USGS, 2016). The map was created
using ArcGIS, and set up using defined intervals of three meters. The resulting map
showed the elevation throughout the Nueces County area, and gave a sense of the
elevation for most of the population. When combined with the map displaying the
evacuation route starting points, it became evident that most of the population of Nueces
County resides at relatively low elevation. Most starting points originated between zero
to six meters above sea level, while some of the more western areas ranging from 12-21
meters above sea level. The highest origin was Route 7 with a starting point between 21-
24 m (Figure 16).

39
Fig
ure 1
6. N
ueces C
oun
ty, T
exas to
po
grap
hic m
ap w
ith e
vacu
ation ro
ute startin
g p
oin
ts.

40
Assumptions for Analysis
A historic traffic dataset was not used in this analysis because it would show
travel speeds based on actual speed limits not actual travel speeds. To account for this,
data showing actual average travel speeds of IH-37 and various other routes were
obtained from TXDOT. This gave a more accurate representation of how fast traffic
actually flows during normal conditions, and served as a better baseline for the analysis
of traffic congestion (TxDOT, 1/2016). This average traffic speed was not available for
every route in the study, however, so average travel times were assigned based on
estimated speed limits for the “to contraflow” route sections. In all, the analysis used
three assumptions to factor route speed and traffic congestion during a contraflow
evacuation.
The first assumption was that travel will be constant throughout the entire route.
This means that once a vehicle left the starting point they were in constant motion until
reaching the terminus of the route near Pleasanton, Texas. Stops for traffic signals,
accidents, facility use or other purposes were not be factored into the analysis.
The second assumption was that traffic will be traveling at a constant speed
during the evacuation. Travel speed were be split into two categories, speed “to
contraflow” and speed “through contraflow”. Since the entire section of contraflow is
contained on IH-37, the speed of the “through contraflow” section was held at a constant
125.4 kilometers per hour (kph) (77.9 mph). While this is faster than the posted speed
limit of 70 mph, this is the actual average speed of traffic on IH-37 as obtained from
TxDOT (TxDOT, 1/2016). The “to contraflow” sections consist of a combination of
residential areas, state highways, and access roads and was thus set at 80.5 kph (50 mph)

41
since no average speed from TxDOT could be obtained due to the wide variety of roads
included in this section. This speed was chosen to serve as an average speed that should
account for the slower residential areas and the faster highways and access roads.
The final assumption was used to account for a decrease in traffic flow, and in
turn traffic speed, caused by congestion and the other previously stated issues associated
with contraflow. Traffic speeds were decreased by 8.9 kph (5.5 mph) for an optimal
evacuation, 15 percent of non-evacuation free flow speed for a “worst case” scenario
evacuation, and the median of the two to model and expected evacuation. These numbers
were chosen based on research by Dixit and Wolshon (2014) showing how contraflow
impacted traffic flow during the evacuations of Hurricane Ivan in 2004, Katrina in 2005,
and Gustav in 2008 (Dixit and Wolshon, 2014). These three intervals will create
“optimal”, “expected”, and “worst case” scenarios for examining traffic congestion when
using a contraflow evacuation during a tropical cyclone.
Calculation of Travel Speeds
Based on research done by Dixit and Wolshon (2014), the denser traffic becomes
the slower traffic flows. The maximum flow rate of contraflow evacuation traffic was
found to be roughly 30 percent less than normal flowing traffic (Dixit and Wolshon,
2014). Additionally, free flow speeds during an evacuation were found to be roughly 8-
10 kph (5-6 mph) less than during normal commuter traffic. This means that fewer cars
will be able to traverse the same section of road as they would during non-evacuation
travel due to the decreased capacity, and that those cars will be traveling slower than
normal due to the 8-10 kph (5-6 mph) reduction in speed. This is all under maximum

42
flow conditions where each lane has not exceeded capacity and traffic can freely flow out
of the area. This of course does not happen through the duration of an evacuation,
particularly a contraflow evacuation, because of bottlenecks where lanes drop off,
slowdown for onramps to get on IH-37, accidents, stalled vehicles, and many other traffic
hinderances associated with heavy traffic flow. Based on data gathered during the
evacuation of Hurricane Katrina, there can be several hour periods, approximately six to
seven hours in this case, where traffic flows at less than 16 kph (10 mph) or completely
comes to a standstill (Dixit and Wolshon, 2014). The same can be said for the evacuation
of Hurricane Ivan. During the first twelve hours of contraflow, speeds ranged from
approximately 8-56 kph (5-35 mph), less than half of the normal flow speed at its highest
point (Dixit and Wolshon, 2014). The evacuation during Hurricane Gustav also has the
same results. The first several hours of contraflow saw traffic speeds of less than 32 kph
(20 mph) until vehicles began to clear out and traffic could return to normal flow speeds
during the latter stages of the evacuation (Dixit and Wolshon, 2014).
For this research, evacuation times were based on approximated travel speeds, not
relying strictly on traffic volumes as other studies have done in the past in the hopes of
determining how long a contraflow evacuation out of Corpus Christi may take under
“optimal”, “expected”, and “worst case” conditions. Since traffic flow is shown to
decrease by at least 8-10 kph (5-6 mph) during a contraflow evacuation, the speeds for
the “optimal” conditions will be set at 8.9 kph (5.5 mph) lower than the normal non-
evacuation free flow speeds. The free flow speed for non-evacuation interstate sections
will be set at 116.5 kph (72.4 mph) based on data collected by TxDOT, showing that the
average observed speed through sections of the IH-37 evacuation route is 125.4 kph (77.9

43
mph) (TxDOT, 1/2016). Average speed data was not available for the free flow speed of
the non-interstate sections so it was approximated. Since these sections of the route
consist of both interstate axis roads, as well as residential areas, it was assumed that the
average non-evacuation free flow speed of these sections is 80.5 kph (50 mph). This took
into account the higher speed limits on the axis roads as well as the much slower speed
limits leaving the various residential areas. These starting speeds equated to an
evacuation free flow speed of 116.5 kph (72.4 mph) on the sections of IH-37, and 71.6
kph (44.5 mph) on non-interstate sections of the route (Table 4).
It is clear from the work of Dixit and Wolshon (2014) that traffic does not always
flow at optimal levels during an evacuation so more than just the maximum free flow
speed must be examined to accurately predict evacuation times. It was observed in the
evacuations of Hurricanes, Ivan, Gustav, and Katrina that traffic flow slowed to less than
16 kph (10 mph) for several hours during and evacuation (Dixit and Wolshon, 2014).
With the normal free flow speed of each of those evacuations reaching roughly 112.7 kph
(70 mph), and using 16 kph (10 mph) minimum as a baseline, it can then be said that
traffic speeds slowed to approximately 15 percent of their normal free flow speed for
several hours during the contraflow evacuation (Dixit and Wolshon, 2014). This 15
percent decrease in traffic speed was then be applied to the non-evacuation free flow
speeds of 125.4 kph (77.9 mph) on IH-37 and the assumed 80.5 kph (50 mph) for the
residential sections, making the worst case evacuation speeds 18.8 kph (11.7 mph) and 12
kph (7.5 mph) respectively (Table 4).
Based again on the evacuation during Hurricane Ivan, Gustav, and Katrina it is
clear that no evacuation remains at the optimal or worst case scenario through the

44
duration of the evacuation (Dixit and Wolshon, 2014). In the case of Hurricane Katrina,
traffic speeds were at near optimal conditions for the first several hours of contraflow
then dropped to nearly a standstill during the late stages (Dixit and Wolshon, 2014).
Hurricane Gustav saw the exact opposite, where contraflow was initiated when traffic
was at a standstill then reach optimal conditions during the late stages of the evacuation
(Dixit and Wolshon, 2014). In the case of Hurricane Ivan, travel speeds remained steady
at a speed between the optimal and worst case for the first several hours before picking
up and eventually reaching optimal conditions through the latter parts of the evacuation
(Dixit and Wolshon, 2014). A scenario was then needed that would factor in both the
optimal and worst case conditions and give more of an expected scenario for the
evacuation. This scenario takes into account periods of free flowing traffic, as well as
periods of extreme congestion where vehicles may be moving along at the worst case
speeds for a time. The median speed from the already calculated “optimal” and “worst
case” scenarios was used as the travel speed for this “expected” evacuation scenario,
making the travel speed for the interstate sections 67.6 kph (42 mph) and the travel speed
for the non-interstate sections 41.8 kph (26 mph) respectively (Table 4).

45
Ta
ble 4
. Evacu
ation ro
ute sp
eeds
Optim
al C
onditio
ns
Ro
ute
sB
ase
Speed k
ph
Ba
se S
peed m
ph
Speed R
eductio
nS
tudy
Speed in
km
hS
tudy
Speed in
mph
IH 3
7125.4
77
.9 m
ph
5.5
mp
h116.5
72.4
No
n-Highw
ays80.5
50
mp
h5
.5m
ph
71.6
44.5
Ex
pecte
d C
onditio
ns
Ro
ute
sB
ase
Speed k
ph
Ba
se S
peed m
ph
Speed R
eductio
nS
tudy
Speed in
km
hS
tudy
Speed in
mph
IH 3
7125.4
77
.9 m
ph
Med
ian Sp
eed67.6
42
No
n-Highw
ays80.5
50
mp
hM
edian S
peed
41.8
26
Wo
rst Ca
se C
onditio
ns
Ro
ute
sB
ase
Speed k
ph
Ba
se S
peed m
ph
Speed R
eductio
nS
tudy
Speed in
km
hS
tudy
Speed in
mph
IH 3
7125.4
77
.9 m
ph
15
% o
f max
18.8
11.7
No
n-Highw
ays80.5
50
mp
h1
5%
of m
ax12
7.5

46
Calculation of Route Distances and Travel Times
Several steps were taken to determine the total distance, total travel time and
average speed for each route at each of the three traffic flow reduction intervals. The
total distance for each route was determined by adding various “to contraflow” distances
to the “through contraflow” section, a constant 152.4 kilometer (km) (94.7 miles).
Distances of the “to contraflow” sections ranged from 5 – 54 km (3.1 – 33.5 miles),
making the total evacuation routes 157.4 – 206.4 km (97.8 – 128.2 miles), with an
average distance of 180.2 km (111.96 miles) (Table 5).
Total travel time for each route was found by calculating the travel time from the
route origin to the beginning of contraflow and combining it with the travel time through
contraflow. Travel time to the contraflow section varied depending on how long the
route was, whereas the travel time through contraflow was held constant for each route
based on the reduction in traffic flow being applied. Travel speeds for the through
contraflow section were 116.5, 67.6, 18.8 kph (72.4, 42, and 11.7 mph) based on their
respective speed reductions off the 125.4kph (77.9 mph) baseline speed on I-37 (Table 4).
Travel times for the “to contraflow” sections will be discussed along with the results for
the corresponding traffic flow reduction intervals. Finally, the average speed for each
route was calculated by taking the total travel time in minutes and dividing by the total
distance of the route. This gave an approximate speed per mile which was then divided
by 60 to determine the average speed for the route. As with total travel time, the average
speed was dependent on the total length of the route, the percentage of traffic flow
reduction, and the use of the previously stated assumptions.

47
Ta
ble 5
. Evacu
ation ro
ute d
istances
Route N
umber
Route N
ame
Route D
istance to
Contraflow
in Kilom
eters
(km
)
Route D
istance
to Contraflow
in
Miles
Distance through
Contraflow
in Kilom
eters
(km
)
Distance through
Contraflow
in
Miles
Total R
oute
Distance in
Kilom
eters (km
)
Total R
oute
Distance in
Miles
1M
ingo Cay C
T54
33.5152.4
94.7206.4
128.2
2R
adial Ct.
38.223.7
152.494.7
190.6118.4
3D
unbarton Oak D
r.34.6
21.5152.4
94.7187
116.2
4F
reds Folly D
r.38.8
24.1152.4
94.7191.2
118.8
5T
ownhouse L
n35.7
22.2152.4
94.7188.1
116.9
6G
reen Acre D
r. 21.9
13.6152.4
94.7174.3
108.3
7D
evils Creek D
r. 5
3.1152.4
94.7157.4
97.8
8A
manda S
t. 35.6
22.1152.4
94.7188
116.8
9C
hachalaca Dr.
37.723.4
152.494.7
190.1118.1
10K
ay St.
28.517.7
152.494.7
180.9112.4
11O
regon Trl.
9.86.1
152.494.7
162.2100.8
12O
akhurst Dr.
29.518.3
152.494.7
181.9113
13C
urtis Clark D
r. 32.8
20.4152.4
94.7185.2
115.1
14R
iverview D
r. 5.5
3.4152.4
94.7157.9
98.1
15R
ock Island Dr. (R
obstown, T
X)
9.35.8
152.494.7
161.7100.5

48
Calculation of Clearance Times
Once individual route evacuation times were calculated, it was then possible to
approximate the time it will take to fully evacuate all vehicles from the city. In order to
calculate this, it was first necessary to find out how many vehicles could be on the road
simultaneously during an evacuation. According to the Texas Transportation Institute
(TTI), there is a maximum theoretical capacity of 1,400 vehicles per hour (vph) on IH-37
in Corpus Christi during an evacuation (Ballard, et at., 2008). Using this number as a
starting point, it was possible to determine a theoretical lane capacity for each of the
possible scenarios in the study. The vehicle capacities were determined in a way that
mirrored the speeds of each route. The “optimal” scenario uses the 1,400 vph figure
found by the TTI, since under this scenario traffic will be moving at free flow evacuation
speed. When taking into account all four available lanes, two in each direction, along the
contraflow route, it can then be assumed that about 5,600 total vehicles will be able to
traverse a given section of road in an hour (Table 6). Using data from 2014, there are
125,352 vehicles registered in Nueces Country meaning that 22.38 groups of 5,600
vehicles would be needed to clear the city (City Data, 2016). This same process was then
used to determine the number of evacuation groups for the other two scenarios.
Mirroring the traffic speed calculation method, the approximate vehicle flow rate
of the “worst case” scenario was 15 percent of the theoretical maximum flow rate of
1,400 vph, or 210 vph. That means 840 total vehicles per hour could evacuate a section
of the county, which would require 149.23 groups to fully evacuate the 125,352 cars in
the county (Table65). Finally, the “expected” evacuation scenario again used the median
of the two figures and found that 805 vph could be evacuated, or 3220 total vehicles

49
across all four lanes. This evacuation would then require 38.93 groups to clear all the
vehicles in the area (Table 6).

50
Ta
ble 6
. Ap
pro
xim
ate clearan
ce rimes fo
r each e
vacu
ation scen
ario.
Op
timal C
ond
itions
Vehicles p
er lane per
hour
Num
ber o
f Vehicles
evacuated p
er hour
Average R
oute T
ravel
Tim
e (minutes)
Num
ber o
f
Gro
ups
Ap
pro
ximate T
otal
Evacuatio
n Tim
e
1400
5600
101.8
22.3
82
3 H
ours 2
0 M
inutes
Exp
ected C
ond
itions
Vehicles p
er lane per
hour
Num
ber o
f Vehicles
evacuated p
er hour
Average R
oute T
ravel
Tim
e (minutes)
Num
ber o
f
Gro
ups
Ap
pro
ximate T
otal
Evacuatio
n Tim
e
805
3220
175.1
38.9
34
1 H
ours 2
2 M
inutes
Wo
rst Case C
ond
itions
Vehicles p
er lane per
hour
Num
ber o
f Vehicles
evacuated p
er hour
Average R
oute T
ravel
Tim
e (minutes)
Num
ber o
f
Gro
ups
Ap
pro
ximate T
otal
Evacuatio
n Tim
e
210
840
624.6
149.2
31
58 H
ours 4
3 M
inutes

51
Limitations of Proposed Methods
While data containing average travel speed was obtained for IH-37, it was not
available for every road in the county. This made it impossible to tell the actual average
travel speeds for all parts of each route. This was easily mitigated using averaged speed
limits, but having this actual data would have made the rout times more accurate. Results
would have also be more accurate if stops for traffic signals, accidents, rest stops, and
other factors could have be calculated. This could have been accomplished using more
sophisticated traffic modeling software such as the Traffic Software Integrated System -
Corridor Simulation (CORSIM), but this software package was not available due to
financial constraints.
The assumptions behind modeling were also a potential limitation to the study.
All figures were based on assumptions and approximations, not actual collected data
along points of the route. To accurately predict how long a real evacuation would take,
monitoring stations would need to be set up along the entire route to collect speed and
flow data. This data could then predict peak traffic times and how fast travel actually
moved during those periods. If observed speeds and traffic volumes were used, the actual
route durations could be more accurately predicted. These results will give a general
approximation of how long an evacuation would take per person per hour, and for the
whole city, but they are ultimately assumptions and could vary widely under an actual
tropical cyclone evacuation scenario.
Even with accurate traffic data, route modeling, and effective evacuation routes,
there is no way to predict exactly how a storm will behave. Storm trajectories can change
quickly and even the best planning cannot predict exactly how strong a tropical cyclone
52
will be or what sort of damage it will inflict. That makes research such as this critically
important. There is no way to know exactly what may happen, so it is essential to have
the best possible plans to ensure the safety of coastal residents. Additionally, simply
giving evacuation orders does mean they will be followed or executed as intended.
People introduce a level of uncertainty in evacuation situations. Even the most
comprehensive plans can break down if they are not followed appropriately. Emphasis
must be placed on public education so local populations know and understand these
emergency plans before a disaster is upon them.

53
IV. RESULTS
As expected, the results showed a wide range of evacuation times and speeds
depending the level of traffic congestion and the ultimate speed of traffic flow. Since the
duration and speed of each evacuation route ultimately depended on the proximity to the
start of contraflow, those routes closest to its origin always had shorter times and faster
speeds, while those furthest away always had longer times and slower speeds. Results for
average evacuation times and speeds will be given for each evacuation scenario,
“optimal”, “worst case”, and “expected”. Minimum and maximum evacuation times and
speeds will also be given for each of the different scenarios to show variation from
different sections of the city. Since the same routes were used for each scenario, results
from the same two routes will be used throughout this section to represent the minimum
and maximum evacuation times and speeds. Times and speeds will vary depending on
the scenario, but distances will be held constant. They will be given here to avoid
unnecessary repetition. The route closet to the start of contraflow, and thus having the
shortest time and fastest overall speed was the route Devils Creek Dr. (route 7). This
route was located 5 km (3.1 miles) southeast of the start of contraflow and has a total
distance of 157.4 km (97.8 miles) (Table 5). The longest overall route, Mingo Cay Ct.
(route 1), was located on Mustang Island, 54 km (33.5 miles) from the start of
contraflow, making the total route distance 206.4 km (128.2 miles) (Table 5). Finally,
the average distance of all routes to the start of contraflow is 27.8 km (17.26 miles), and
the distance through the contraflow section was held at a constant 156.8 km (97.4 miles)
(Table 5).

54
Under “optimal” conditions with free flowing traffic along the entire route, the
average evacuation time per vehicle was 101.8 minutes or roughly 1 hour and 32 minutes,
with an average travel speed of 106.7 kph (66.3 mph) (Table 7). At these speeds, an
evacuation at optimal conditions should be able to fully evacuate the city in
approximately 23 hours and 20 minutes (Table 6). Actual evacuation times and speeds
will vary depending on the starting point of the evacuation route. Times ranged from a
minimum evacuation time of 82.7 minutes, just under 1.5 hours, at a speed of 101.2 kph
(71 mph) for individuals evacuating from the Devils Creek Dr. area, to a maximum of
123.7 minutes, roughly 2 hours and 4 minutes, at 101.2 kph (62.2 mph) from the south
eastern portion of the county near Mingo Cay Ct. on Mustang Island (Table 7).
Looking next to the “worst case” scenario with heavy traffic congestion and
speeds at 15% of free flowing traffic, it is clear that having only one contraflow route
may not be enough to safely evacuate everyone from the area. Under worst case
conditions, it would take an average of roughly 624.6 minutes or about 10 hours and 24
minutes per vehicle at an average speed of 17.4 kph (10.8 mph) to evacuate the area
(Table 6). This would translate into roughly 158 hours and 43 minutes, or about six days,
to evacuate the entire area (Table 6). Again, this figure is with constant traffic congestion
and speeds of around 16 kph (10 mph) for the entire evacuation route, making it
extremely unlikely that it would ever resemble an actual evacuation. As with all
evacuation routes, the routes closest to the start of contraflow had faster evacuation times
than those furthest away. This means that the shortest evacuation time under “worst
case” conditions was again those evacuating from the Devils Creek Dr. area. Motorists
leaving from this area can expect an overall evacuation time of 511.3 minutes, about 8
55
hours and 31 minutes, at an average speed of 18.5 kph (11.5 mph) (Table 8). For
evacuees leaving the Mingo Cay Ct. area on Mustang Island, they can expect an
evacuation time of approximately 754.5 minutes, or 12 hours 34 minutes, at an average
speed of 16.4 kph (10.2 mph) under worst case conditions (Table 8).
Finally, data gathered from previous evacuations has shown that an evacuation is
unlikely to fully occur at either “optimal” or “worst cases” levels, an “expected”
evacuation scenario was calculated. The median evacuation speed from the other two
scenarios was used to determine the speed for the “expected” scenario. Under expected
conditions, a contraflow evacuation should take an average of 175 minutes (2 hours and
55 minutes), at an average speed of 62 kph (35.7 mph) for the duration of the route
(Table 9). These times will took into account periods of travel at free flow speeds seen in
the “optimal” scenario, as well as periods of traffic congestion seen in the “worst case”
scenario, and represented a good estimate of the total time it would take an individual to
evacuate from the Corpus Christi area. Under these conditions, a total evacuation of the
area should take approximately 41 hours and 22 minutes (Table 6). Those leaving from
the Devils Creek Dr. had shorter times of 156.3 minutes (2 hour and 36 minutes) at an
average speed of 60.4 kph (37.5 mph), where those evacuating from the Mingo Cay Ct.
area had longer times of 226.5 minutes (3 hours and 46 minutes) at an average speed of
54.7 kph (34 mph) (Table 9).

56
Ta
ble 7
. “Op
timal” ev
acuatio
n sce
nario
.
Ro
ute
Num
ber
Ro
ute Nam
eD
istance to C
ontraflo
w
(km
/ miles)
Average S
peed
to
Co
ntraflow
(kp
h /
mp
h)
Distance T
hrough
Co
ntraflow
(km
/ miles)
Average S
peed
Thro
ugh Co
ntraflow
(kp
h / mp
h)
To
tal Ro
ute Distance
(km
/ miles)
To
tal Travel T
ime
(minutes)
Average T
otal
Ro
ute Sp
eed
(kp
h / mp
h)
1M
ingo C
ay CT
54
/ 33
.55
6.3
/ 44
.51
52.4
/ 94
.71
03.8
/ 72
.42
06.4
/ 12
8.2
123.6
10
0.2
/ 62
.2
2R
adial C
t. 3
8.2
/ 23
.75
6.3
/ 44
.51
52.4
/ 94
.71
03.8
/ 72
.41
90.6
/ 11
8.4
110.4
10
3.6
/ 64
.3
3D
unbarto
n Oak
Dr.
34
.6 / 2
1.5
56
.3 / 4
4.5
15
2.4
/ 94
.71
03.8
/ 72
.41
87.0
/ 11
6.2
107.5
10
4.4
/ 64
.9
4F
reds F
olly D
r.3
8.8
/ 24
.15
6.3
/ 44
.51
52.4
/ 94
.71
03.8
/ 72
.41
91.2
/ 11
8.8
111
10
3.4
/ 64
.2
5T
ow
nhouse L
n3
5.7
/ 22
.25
6.3
/ 44
.51
52.4
/ 94
.71
03.8
/ 72
.41
88.1
/ 11
6.9
108.4
10
4.1
/ 64
.7
6G
reen Acre D
r. 2
1.9
/ 13
.65
6.3
/ 44
.51
52.4
/ 94
.71
03.8
/ 72
.41
74.3
/ 10
8.3
96.8
10
8.0
/ 67
.1
7D
evils Creek
Dr.
5 / 3
.15
6.3
/ 44
.51
52.4
/ 94
.71
03.8
/ 72
.41
57.4
/ 97
.882.7
11
4.3
/ 71
8A
mand
a St.
35
.6 / 2
2.1
56
.3 / 4
4.5
15
2.4
/ 94
.71
03.8
/ 72
.41
88.0
/ 11
6.8
108.3
10
4.2
/ 64
.7
9C
hachalaca Dr.
37
.7 / 2
3.4
56
.3 / 4
4.5
15
2.4
/ 94
.71
03.8
/ 72
.41
90.1
/ 11
8.1
110
10
3.7
/ 64
.4
10
Kay S
t. 2
5.8
/ 17
.75
6.3
/ 44
.51
52.4
/ 94
.71
03.8
/ 72
.41
80.9
/ 11
2.4
102.3
10
6.1
/ 65
.9
11
Orego
n Trl.
9.8
/ 6.1
5
6.3
/ 44
.51
52.4
/ 94
.71
03.8
/ 72
.41
62.2
/ 10
0.8
86.7
11
2.2
/ 69
.8
12
Oak
hurst Dr.
29
.5 / 1
8.3
5
6.3
/ 44
.51
52.4
/ 94
.71
03.8
/ 72
.41
81.9
/ 11
3103.2
10
5.8
/ 65
.7
13
Curtis C
lark D
r. 3
2.8
/ 20
.45
6.3
/ 44
.51
52.4
/ 94
.71
03.8
/ 72
.41
85.2
/ 11
5.1
106
10
4.8
/ 65
.2
14
Riverview
Dr.
5.5
/ 3.4
56
.3 / 4
4.5
15
2.4
/ 94
.71
03.8
/ 72
.41
57.9
/ 98
.183.1
11
4.1
/ 70
.9
15
Ro
ck Island
Dr. (R
ob
stow
n, TX
)9
.3 / 5
.85
6.3
/ 44
.51
52.4
/ 94
.71
03.8
/ 72
.41
61.7
/ 10
0.5
86.3
11
2.4
/ 69
.9
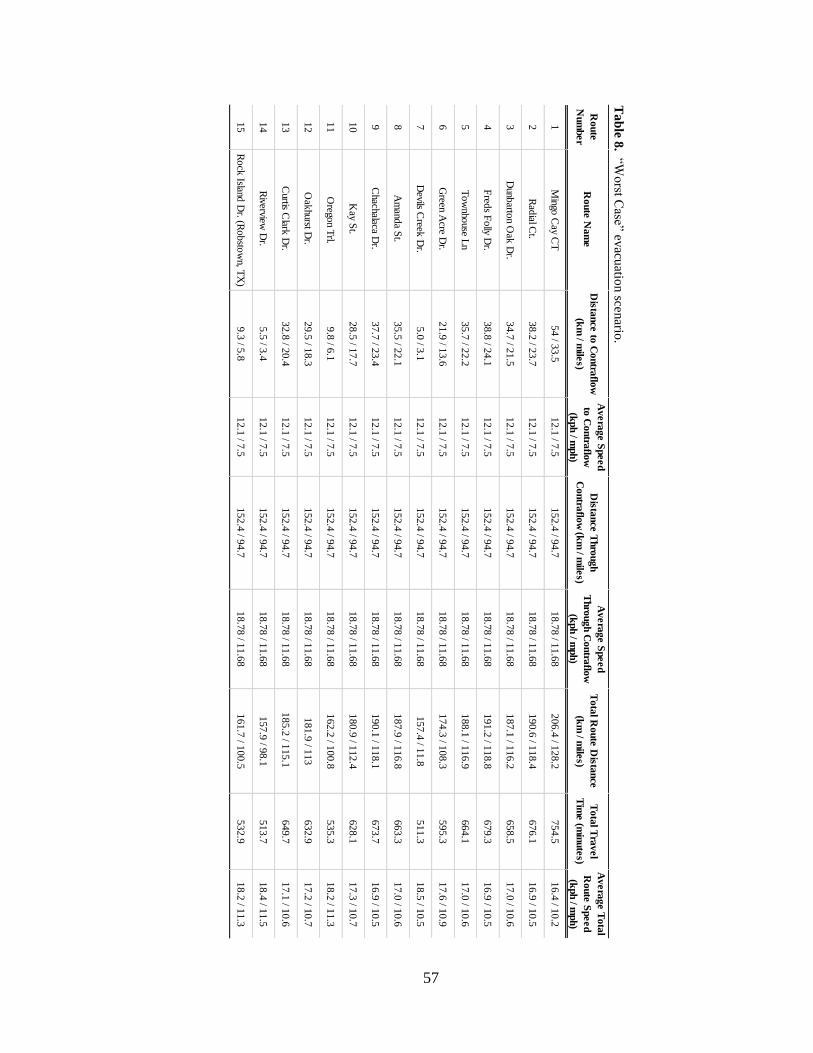
57
Ta
ble 8
. “Wo
rst Case” e
vacu
ation sce
nario
.
Ro
ute
Num
ber
Ro
ute
Na
me
Dista
nce
to C
ontra
flow
(km
/ mile
s)
Av
era
ge S
peed
to C
ontra
flow
(kph / m
ph)
Dista
nce
Thro
ug
h
Co
ntra
flow
(km
/ mile
s)
Av
era
ge S
peed
Thro
ug
h C
ontra
flow
(kph / m
ph)
To
tal R
oute
Dista
nce
(km
/ mile
s)
To
tal T
rav
el
Tim
e (m
inute
s)
Av
era
ge T
ota
l
Ro
ute
Speed
(kph / m
ph)
1M
ingo C
ay CT
54
/ 33
.51
2.1
/ 7.5
15
2.4
/ 94
.71
8.7
8 / 1
1.6
82
06.4
/ 12
8.2
754.5
16
.4 / 1
0.2
2R
adial C
t. 3
8.2
/ 23
.71
2.1
/ 7.5
15
2.4
/ 94
.71
8.7
8 / 1
1.6
81
90.6
/ 11
8.4
676.1
16
.9 / 1
0.5
3D
unbarto
n Oak
Dr.
34
.7 / 2
1.5
12
.1 / 7
.51
52.4
/ 94
.71
8.7
8 / 1
1.6
81
87.1
/ 11
6.2
658.5
17
.0 / 1
0.6
4F
reds F
olly D
r.3
8.8
/ 24
.11
2.1
/ 7.5
15
2.4
/ 94
.71
8.7
8 / 1
1.6
81
91.2
/ 11
8.8
679.3
16
.9 / 1
0.5
5T
ow
nhouse L
n3
5.7
/ 22
.21
2.1
/ 7.5
15
2.4
/ 94
.71
8.7
8 / 1
1.6
81
88.1
/ 11
6.9
664.1
17
.0 / 1
0.6
6G
reen Acre D
r. 2
1.9
/ 13
.61
2.1
/ 7.5
15
2.4
/ 94
.71
8.7
8 / 1
1.6
81
74.3
/ 10
8.3
595.3
17
.6 / 1
0.9
7D
evils Creek
Dr.
5.0
/ 3.1
12
.1 / 7
.51
52.4
/ 94
.71
8.7
8 / 1
1.6
81
57.4
/ 11
.8511.3
18
.5 / 1
0.5
8A
mand
a St.
35
.5 / 2
2.1
12
.1 / 7
.51
52.4
/ 94
.71
8.7
8 / 1
1.6
81
87.9
/ 11
6.8
663.3
17
.0 / 1
0.6
9C
hachalaca Dr.
37
.7 / 2
3.4
12
.1 / 7
.51
52.4
/ 94
.71
8.7
8 / 1
1.6
81
90.1
/ 11
8.1
673.7
16
.9 / 1
0.5
10
Kay S
t. 2
8.5
/ 17
.71
2.1
/ 7.5
15
2.4
/ 94
.71
8.7
8 / 1
1.6
81
80.9
/ 11
2.4
628.1
17
.3 / 1
0.7
11
Orego
n Trl.
9.8
/ 6.1
12
.1 / 7
.51
52.4
/ 94
.71
8.7
8 / 1
1.6
81
62.2
/ 10
0.8
535.3
18
.2 / 1
1.3
12
Oak
hurst Dr.
29
.5 / 1
8.3
12
.1 / 7
.51
52.4
/ 94
.71
8.7
8 / 1
1.6
81
81.9
/ 11
3632.9
17
.2 / 1
0.7
13
Curtis C
lark D
r. 3
2.8
/ 20
.41
2.1
/ 7.5
15
2.4
/ 94
.71
8.7
8 / 1
1.6
81
85.2
/ 11
5.1
649.7
17
.1 / 1
0.6
14
Riverview
Dr.
5.5
/ 3.4
12
.1 / 7
.51
52.4
/ 94
.71
8.7
8 / 1
1.6
81
57.9
/ 98
.1513.7
18
.4 / 1
1.5
15
Ro
ck Island
Dr. (R
ob
stow
n, TX
)9
.3 / 5
.81
2.1
/ 7.5
15
2.4
/ 94
.71
8.7
8 / 1
1.6
81
61.7
/ 10
0.5
532.9
18
.2 / 1
1.3

58
Ta
ble 9
. “Exp
ected” ev
acuatio
n scen
ario.
Ro
ute
Num
ber
Ro
ute
Na
me
Dista
nce
to C
ontra
flow
(km
/ mile
s)
Av
era
ge S
peed
to C
ontra
flow
(kph / m
ph)
Dista
nce
Thro
ug
h
Co
ntra
flow
(km
/ mile
s)
Av
era
ge S
peed
Thro
ug
h C
ontra
flow
(kph / m
ph)
To
tal R
oute
Dista
nce
(km
/ mile
s)
To
tal T
rav
el
Tim
e (m
inute
s)
Av
era
ge T
ota
l
Ro
ute
Speed
(kph / m
ph)
1M
ingo C
ay CT
54
/ 33
.54
1.8
/ 26
15
2.4
/ 94
.76
1.3
/ 38
.12
06.4
/ 12
8.2
226.5
54
.7 / 3
4
2R
adial C
t. 3
8.2
/ 23
.74
1.8
/ 26
15
2.4
/ 94
.76
1.3
/ 38
.11
90.6
/ 11
8.4
203.9
56
.1 / 3
4.8
3D
unbarto
n Oak
Dr.
34
.7 / 2
1.5
41
.8 / 2
61
52.4
/ 94
.76
1.3
/ 38
.11
87.1
/ 11
6.2
198.8
56
.5 / 3
5.1
4F
reds F
olly D
r.3
8.8
/ 24
.14
1.8
/ 26
15
2.4
/ 94
.76
1.3
/ 38
.11
91.2
/ 11
8.8
204.8
56
/ 34
.8
5T
ow
nhouse L
n3
5.7
/ 22
.24
1.8
/ 26
15
2.4
/ 94
.76
1.3
/ 38
.11
88.1
/ 11
6.9
200.4
56
.3 / 3
5
6G
reen Acre D
r. 2
1.9
/ 13
.64
1.8
/ 26
15
2.4
/ 94
.76
1.3
/ 38
.11
74.3
/ 10
8.3
180.6
57
.9 / 3
6
7D
evils Creek
Dr.
5.0
/ 3.1
41
.8 / 2
61
52.4
/ 94
.76
1.3
/ 38
.11
57.4
/ 11
.8156.3
60
.4 / 3
7.5
8A
mand
a St.
35
.5 / 2
2.1
41
.8 / 2
61
52.4
/ 94
.76
1.3
/ 38
.11
87.9
/ 11
6.8
200.2
56
.3 / 3
5
9C
hachalaca Dr.
37
.7 / 2
3.4
41
.8 / 2
61
52.4
/ 94
.76
1.3
/ 38
.11
90.1
/ 11
8.1
203.2
56
.1 / 3
4.9
10
Kay S
t. 2
8.5
/ 17
.74
1.8
/ 26
15
2.4
/ 94
.76
1.3
/ 38
.11
80.9
/ 11
2.4
190.0
57
.1 / 3
5.5
11
Orego
n Trl.
9.8
/ 6.1
41
.8 / 2
61
52.4
/ 94
.76
1.3
/ 38
.11
62.2
/ 10
0.8
163.2
59
.6 / 3
7
12
Oak
hurst Dr.
29
.5 / 1
8.3
41
.8 / 2
61
52.4
/ 94
.76
1.3
/ 38
.11
81.9
/ 11
3191.4
57
/ 35
.4
13
Curtis C
lark D
r. 3
2.8
/ 20
.44
1.8
/ 26
15
2.4
/ 94
.76
1.3
/ 38
.11
85.2
/ 11
5.1
196.2
56
.6 / 3
5.2
14
Riverview
Dr.
5.5
/ 3.4
41
.8 / 2
61
52.4
/ 94
.76
1.3
/ 38
.11
57.9
/ 98
.1157.0
60
.3 / 3
7.5
15
Ro
ck Island
Dr. (R
ob
stow
n, TX
)9
.3 / 5
.84
1.8
/ 26
15
2.4
/ 94
.76
1.3
/ 38
.11
61.7
/ 10
0.5
162.6
59
.7 / 3
7.1

59
V. DISCUSSION
The results of this study show the wide range of possible evacuation times when
using the contraflow evacuation plan for the Nueces County, Texas area. This study
focused only on the contraflow plan itself, and did not take into account any alternative
evacuation routes that motorists may use. However, this route is the main method
prescribed by Nueces County and the City of Corpus Christi, so it will likely be the most
used by evacuees.
Beginning with the “optimal” scenario, it was clear how effective a contraflow
evacuation plan could be for Nueces County. A method to fully evacuate the area in just
over 23 hours would be an incredible lifesaving tool in the event of a major tropical
cyclone. Being able to move that many people out of an area in such a short time would
ensure that most everyone who tried to evacuate would be able to safely get out of the
storm’s path before they were in any major danger. A plan this effective would also
allow the city to delay issuing evacuation orders and ensure that the storm was in fact
going to directly strike the area before even attempting to evacuate. Generally speaking,
the sooner an evacuation can be started the better, however, if a county knows that it will
take under 24 hours to evacuate the entire area they have the luxury of waiting to ensure
the evacuation is actually needed. Storms can change paths which can lead to
unnecessary evacuation orders, costing the city a great deal of money, along with
frustration and mistrust of the government from area residents (Dow and Cutter, 1998).
While this scenario would accurately represent some phases of the evacuation,
particularly the late stages of the evacuation as vehicles approach the route terminus at
Pleasanton, it is not a fully accurate representation of what would actually occur during

60
an evacuation. In the early parts of the route, vehicles are going to be backed up due to
bottlenecks created by onramps to IH-37, traffic congestion along the residential areas
near the route starting points, accidents along the route, or any number of the previously
stated issues that often accompany a contraflow evacuation. Examining day-to-day
vehicle counts makes it is clear that traffic will never be able to fully flow at the
maximum flow rate during an entire evacuation. Under normal rush hour conditions,
traffic volumes can reach greater than 3000 vph across sections of IH-37 (TxDOT,
8/2016). This means that normal evening traffic can surpass the maximum theoretical
lane capacity of 1400 vehicles per lane per hour. It is true that density of traffic only
occurs for an hour or two then tapers off, but there is a large difference from normal
commuter traffic to mass evacuation traffic. It is clear then that under evacuation
circumstances, traffic will never be able to flow at the maximum velocity for the duration
of the route. This “optimal” scenario is a great goal to strive for, but a very difficult one
to achieve.
To help with this however, the City of Corpus Christi does employ phased
evacuations and other, more limited evacuation routes that were not part of this study
(City of Corpus Christi, 2016). These additional evacuation strategies could greatly help
reduce the overall traffic volume during an evacuation and help ensure that traffic can
flow near its maximum flow rate through as much of the evacuation as possible. It will
never be perfect, but when combining proper planning, infrastructure, warning systems,
and evacuation education, an evacuation that approaches this level of effectiveness could
likely be achieved.

61
If the potential is there through phased evacuation and alternate routes to
approach the times seen under the “optimal” scenario, then the “expected” scenario
should be a fairly accurate representation of what an actual evacuation of Nueces County
would be. This plan combined aspects of both the “optimal” and “worst case” scenarios,
and provided a more realistic view of an evacuation than either of the other two scenarios
can. This scenario took into account the free flowing traffic that would occur near the
terminus of the evacuation route as vehicles started to exit enabling more space on the
road for higher speeds. It also took into account the extremely slow conditions that
would be seen near the start of the routes as evacuees attempt to begin their evacuation
that would move very slowly due to heavy traffic congestion. As previously stated,
individual evacuation times for this scenario were just over three hours, making the total
clearance time of the city about 41 hours. While still a significant amount of time, as
long as timely evacuation orders were given, it would still plenty of time to safely
evacuate the area. This sort of a clearance time would ensure that everyone who chose to
evacuate should be able to do so safely and in a reasonable amount of time.
As previously stated, the “worst case” scenario is very unlikely to every occur
during an actual evacuation. There is no doubt that traffic will flow at speeds of 16 kph
(10 mph) or slower during many sections of the evacuation route, but highly unlikely that
it would ever occur for the full 156 km (97 miles) from Corpus Christi to Pleasanton.
Bottlenecks within the city itself will be the locations most susceptible to heavy
congestion, and are thus the areas that city planners should focus more attention on in an
effort to ensure that these kinds of slowdowns are avoided during an actual evacuation.
Under these sorts of conditions, motorists would be trapped in their vehicles as the storm

62
passed through the city potentially stranding and or injuring thousands of evacuees. A
situation like this would be an absolute disaster and exactly the sort of thing that
evacuation plans hope to avoid. Methods such as phased evacuations, alternate routes,
proper traffic controls, sufficient warning and education, and emergency management
services are a just a few of the methods in place to ensure a situation like this would
never occur during an actual evacuation.
Despite the unlikelihood of this scenario ever materializing, it gives a glimpse
into the sobering reality of just how bad things could potentially go for the city should
their evacuation plan fail. Many parts of Corpus Christi’s highway infrastructure are
located very close to the water, and should those roads become inundated with rain or
storm surge, the exit points from the city could actually be shut down, trapping everyone
inside the city. Sections of the highway leaving Mustang Island reside nearly at sea level,
and would flood very easily should a storm pass through the area (Figure 17). Other
Figure 17. John F. Kennedy Causeway traveling from Mustang Island to Corpus Christi.
(Photo by Adam Clark)

63
areas along IH-37 on the Northwestern section of Corpus Christi are dotted with
industrial facilities that could become flooded or damaged in a storm and again have the
potential to shut down section of the only major route out of the area (Figure 18). Low
bridges along the evacuation route could also become inundated or completely washed
away if enough water were to pass through the area, effectively shutting down the
evacuation route and stranding everyone on IH-37 (Figure 19). Other problems could
Figure 18. Existing roadside infrastructure and construction along IH-37 in Corpus Christi.
(Photos by Adam Clark)
Figure 19. Labonte Park bridge along IH-37 evacuation route in Corpus Christi. (Photos by Adam Clark)

64
arise from the poor road quality along the evacuation route, particularly if a shoulder lane
were opened up along the way (Figure 20). Vehicles cannot safely travel at higher speeds
with poor road conditions, forcing traffic to slow down, and ultimately hindering the
evacuation efforts. So, while a worst case scenario situation is unlikely to ever actually
occur for the duration of an evacuation, if a powerful enough storm hit the area, the
evacuation infrastructure could potential fail with disastrous consequences.
When examined together, these results certainly show that contraflow is not a
perfect solution, but it is still a feasible evacuation method and should certainly be
employed during a major tropical cyclone that calls for the evacuation of Nueces County.
No evacuation is ever going to function perfectly or fully as planned, but with plans such
as this in place, evacuations can be very effective and ensure the safety of thousands of
Figure 20. Conditions of evaculane in Live Oak County, Texas. (Photo by Adam Clark)

65
people. Problems will arise with traffic congestion, the evacuation will slow to a
standstill at times, but overall, everyone should be able to get to safety in a reasonable
amount of time. When used in conjunction with other methods such as phased
evacuations, and alternative evacuation routes, there should be no problem fully and
safely evacuating the City of Corpus Christi and the larger Nueces County area if the
need arose.

66
VI. CONCLUSION
Evacuation plans are a tool. They are not perfect, they will never be followed
exactly as written, they will never be obeyed by everyone, and they can have potentially
disastrous consequences if they fail. Despite all of this, they are the best defense coastal
residents have against the devastating power of tropical cyclones. There is nothing that
can be done to prevent an area from being struck by a one of these storms. Little can be
done to prevent the damage that will be caused by the rains, winds, and storm surge, and
there is no way to tell when the next storm will strike. All coastal communities, local
governments, and city managers can do is be as prepared as possible so when the next
storm does strike, and when evacuation orders are given, they know what to do, where to
go, and have a cohesive and adaptable plan to follow.
Residents of Nueces County, Texas have not been struck by a major tropical
storm in many years. Nonetheless, city planners and engineers have developed plans to
ensure that when the time comes, they will be able to protect their local residents and get
everyone to safety. This research examined one of those plans and attempted to
determine what an evacuation of Nueces County would look like under the currently
established contraflow evacuation plan. After determining the areas of the county with
the potential to have the greatest number evacuees, evacuation routes were plotted using
ArcGIS to determine the approximate length and speed of an evacuation from various
areas of the city. The results of this study show that, in a “worst case” scenario, a
contraflow evacuation has the potential to take several days to fully evacuate the area,
under an ‘expected’ scenario with normal conditions, it will be a successful means of
safely evacuating the area. By using individual evacuation times, along with the

67
theoretical vehicular flow during an evacuation, it has been predicted that a full
evacuation of Nueces County would take approximately 41 hours to conduct (Table 6).
While this is still nearly two days of evacuation, when coupled with advanced warning
and timely orders to evacuate, this should be plenty of time to safely evacuate all who
choose to do so.
In any disaster situation there will always be variables that are impossible to
account for. Storms may change paths, evacuation routes may flood, individuals may
unnecessarily decide to leave their homes, while some may choose to remain despite
being told to flee the area. It is because of these unknown variables that thorough and
adaptable plans must be put in place well in advance of the need to implement them.
Government officials must collect all the data they can regarding the dangers their
particular communities face from all sorts of natural and manmade disasters, and have
plans in place to ensure the safety of their residents. Future studies must continue
examining the dangers coastal locations face from sea level rise, changing storm patterns,
coastal degradation, and rising local populations. These studies will becomes extremely
important in the future as these areas continue seeing incredible amounts of growth year
after year. Since tropical cyclones do not generally strike the same area on a yearly basis,
it is easy for area residents to gain a false sense of security which can lead to disastrous
consequences if the areas themselves are not prepared to manage a hazardous situation.
Work must continue being done on infrastructure improvements, utilities management,
emergency services, and evacuation plans, to ensure that people are safe when a crisis
strikes.

68
Until the day comes when people stop living along the coast, we will never truly
be safe from the dangers of tropical cyclones. Since that is unlikely to ever happen, it is
up to us to be prepared for whatever the future may bring. This research, as well as
research like it, has laid a foundation for future studies on the subject in the hopes of
ensuring the continued safety of everyone along the coast. No plan will ever be perfect,
but through continued work and dedication, plans can be established to help those in need
when disaster does strike.

69
REFERENCES/LITERATURE CITED
Ballard, Andrew J., et al. Hurricane Evacuation Traffic Operations. Texas Transportation
Institute. Austin: Texas Department of Transportation, 2008.
Boswell, Michael R, Robert E Deyle, and Richard A. Smith. 1999. A Quantitative
Method for Estimating Probable Public Costs of Hurricanes. Environmental Management
23 (3): 359-372.
Boyd, Ezra, Brian wolshon and Ivor Van Heerden. "Risk communication and public
response during Evacuations: The New Orleans experience of Hurricane Katrina." Public
Performance & Management Review 32.3 (2009): 437-462.
City-Data. 2016. Nueces County, Texas (TX). Retrieved from City-Data.com:
http://www.city-data.com/county/Nueces_County-TX.html
Chen, Qin, Lixia Wang, Haihong Zhao, and Scott L Douglass. 2007. Prediction of Storm
Surges and Wind Waves on Coastal Highways in Hurricane-Prone Areas. Journal of
Coastal Research 23 (5): 1304-1317.
Chiu, Yi-Chang, et al. "Evaluating Regional Contra-Flow and Phased Evacuation
Strategies for Texas Using a Large-Scale Dynamic Traffic Simulation and Assignment
Approach." Journal of Homeland Security and Emergency Management 5.1 (2008): 30.
Church, John A., and Neil J. White. 2006. A 20th century acceleration in global sea-level
rise. Geophysical Research Letters 33: 4 pages.
Cigler, Beverly A. 2009. Post-Katrina Hazard Mitigation on the Gulf Coast. Public
Organization Review 9: 325-341.
Dixit, Vinayak, and Brian Wolshon. 2014. "Evacuation Traffic Dynamics.
Transportation Research Part C (49): 114-125.
Dow, K., and Susan L. Cutter,. 1998. Crying wolf: Repeat responses to hurricane
evacuation orders. Coastal Management, 26(4), 237-252.
Fonseca, Daniel J., Gary P. Moynihan, Jordan Johnston, and Jordan Jennings. 2009. A
Simulation Tool for Hurricane Evacuation Planning. Modelling and Simulation in
Engineering 2009: 10 Pages.
Frey, Ashley E., Francisco Olivera, Jennifer L. Irish, Lauren M. Dunkin, James M.
Kaihatu, Celos M. Ferrieira, and Billy L. Edge. 2010. Potential Impact of Climate
Change on Hurricane Flooding Inundation, Population Affected and Property Damages in
Corpus Christi. Journal of the American Water Resources Association 46 (5): 1049-1059.

70
Fries, R., Chowdhury, M., Ma, Y., and Stephen, L. 2011. Evaluation of Different
Contraflow Strategies for Hurricane Evacuation in Charleston, South Carolina.
Transportation Planning and Technology (34:2), 139-154.
Intergovernmental Panel on Climate Change 2015. AR5 Synthesis Report. Climate
Change 2014: Synthesis Report: 169 pages.
Irish, Jennifer L, Ashley E Frey, Julie D Rosati, Francisco Olivera, Lauren M Dunkin,
James M Kaihatu, Celso M Ferreira, and Billy L Edge. 2010. Potential implications of
global warming and barrier island degradation on future hurricane inundation, property
damages, and population impacted. Ocean & Coastal Management (Elsevier) 53 (10):
645-657.
Joh, K., Normal, A., and Bame, S. I. 2014. A spatial and longitudinal analysis of unmet
transportation needs during hurricanes Katrina and Rita. Journal of Homeland Security
and Emergency Management, 387-406.
Medium.com. "Evacuate or Stay? How the mostimportant question ahead of a hurricane
is killing us." July 2016. Medium.com. <https://medium.com/the-weather-
channel/evacuate-or-stay-1f1c87b1d62c#.1scetklh5>.
Mousavi, Mir Emad, Jennifer L Irish, Ashley E Frey, Francisco Olivera, and Billy L
Edge. 2011. Global warming and hurricanes: the potential impact of hurricane
intensification and seal level rise on coastal flooding. Climactic Change 104: 574-597.
National Hurricane Center. 2015. Tropical Cyclone Naming History and Retired Names.
Retrieved from http://www.nhc.noaa.gov/aboutnames_history.shtml
National Hurricane Center. 2016. Total number of hurricane strikes by
county/parishes/boroughs, 1900-2010. Retrieved from Tropical Cyclone Climatology:
http://www.nhc.noaa.gov/climo/images/strikes_wgulf_mjr.jpg
National Hurricane Center. 2016. Tropical Cyclone Climatology. Retrieved 2016, from
National Hurricane Center: http://www.nhc.noaa.gov/climo/
National Oceanic and Atmospheric Administration. 2015. How many tropical have there
been each year in the Atlantic basin? Retrieved from Hurricane Research Division:
http://www.aoml.noaa.gov/hrd/tcfaq/E11.html
National Oceanic and Atmospheric Administration. 2016. How many direct hits by
hurricanes of various categories have affected each state? Retrieved from Hurricane
Research Division: http://www.aoml.noaa.gov/hrd/tcfaq/E19.html
National Weather Service. 2010. Hurricane Celia. Retrieved from Corpus Christi, TX:
http://www.srh.noaa.gov/crp/?n=celia1970
71
National Weather Service. 2012. Minor Modification to Saffir-Simpson Hurricane Wind
Scale For the 2012 Hurricane Season. Retrieved from National Weather Service:
http://www.nhc.noaa.gov/pdf/sshws_2012rev.pdf
Scharfenaker, Mark. 2006. Katrina stories highlight new realities of disaster planning.
American Water Works Association Journal 98 (6): 16, 18, 20-22, 24, 26, 28-30.
Stein, R. M., Dueñas-Osorio, L., and Subramanian, D. 2010. Who evacuates when
hurricnaes approach? The role of risk, information, and location. Social Science
Quarterly, 91(3), 816-8.4.
Texas Department of Transportation 2015. Corpus Christi to San Antonio, Hurricane
Shoulder Evaculane. http://ftp.dot.state.tx.us/pub/txdot-
info/trv/hurricane/i37_evaculane.pdf
Texas Department of Transportation. 2016. Hurricane Evacuation Contraflow Route.
Retrieved from http://ftp.dot.state.tx.us/pub/txdot-info/trv/hurricane/i37_contraflow.pdf
Texas Department of Transportation 8/2016. Average Hourly Traffic by Day of Week for
1/1/2014-12/31/2014. Transportation Planning and Programming Division’s Statewide
Traffic Analysis and Reporting System II.
Texas Department of Transportation 1/2016. 50th/85th Percentile AM/PM by Month for
1/1/2014-12/31/2014. Transportation Planning and Programming Division’s Statewide
Traffic Analysis and Reporting System II.
Thatcher, Cindy A., John C. Brock, and Elizabeth A. Pendleton. 2013. Economic
Vulnerability to Sea-Level Rise along the Northern U.S. Gulf Coast. Journal of Coastal
Research 63: 234-243.
United States Census Bureau. 2015. Corpus Christi city, Texas. Retrieved 2016, from
Quick Facts: http://www.census.gov/quickfacts/table/PST045215/4817000
United States Census Bureau. 2016. Annual Estimates of the Residential Population for
Counties: April 1, 2010 to July 1, 2015. Retrieved from American Fact Finder:
http://factfinder.census.gov/faces/tableservices/jsf/pages/productview.xhtml?src=CF
United States Census Bureau. 2016. Texas Partnership Shapefile Batch Download.
Retrieved from
http://www.census.gov/geo/partnerships/pvs/partnership15v1/st48_tx.html
United States Geological Survey. 2016. TNM Download. Retrieved from The National
Map:
http://viewer.nationalmap.gov/basic/?basemap=b1&category=ned,nedsrc&title=3DEP%2
0View

72
Warner, Natalya N, and Philippe E Tissot. 2012. Storm flooding sensitivity to sea level
rise for Galveston Bay, Texas. Edited by A I Inceck. Ocean Engineering (Elsevier) 44:
23-32.
Wolshon, Brian. 2001. "One-Way-Out": Contraflow Freeway Operation for Hurricane
Evacuation. Natural Hazards Review, 2(3), 105-112.
Wolshon, Brian. 2007. Empirical Characterization of Mass Evacuation Traffic Flow.
Transportation Research Record: Journal of the Transportation Research Board, 38-48.
Yang, Zhaoquing, Taiping Wang, Ruby Leung, Kathy Hibbard, Tony Janetos, Ian
Kraucunas, Jennie Rice, Benjamin Preston, and Tom Wilbanks. 2014. A modeling study
of coastal inundation induced by storm surge, sea-level rise and subsidence in the Gulf of
Mexico. Natural Hazards 71: 1771-1794.