example listed public financial statements · the form and content of australian general purpose...
TRANSCRIPT

Example listed public financial statements Grant Thornton CLEARR Example Ltd For the year ended 31 December 2014

Example listed public financial statements 2 For the year ended 31 December 2014
© 2014 Grant Thornton Australia Limited. All rights reserved.
Foreword
Welcome to the December 2014 edition of Example Financial Statements.
The preparation of financial statements in accordance with Australian Accounting Standards
(AASBs) and International Financial Reporting Standards (IFRSs) is challenging. Each year new
standards and amendments are published by the Australian Accounting Standards Board and the
International Accounting Standards Board with the potential to significantly impact both the
presentation of the primary financial statements and the accompanying disclosures.
While the annual (and interim) period ending 31 December 2014 represents relatively little change
for for-profit entities, this is not the case for not-for-profit entities as it is the first annual reporting
period to which the new requirements in AASB 10 Consolidated Financial Statements, AASB 11 Joint
Arrangements and AASB 12 Disclosure of Interests in Other Entities apply to not-for-profit entities.
Accordingly, this reporting season is likely to pose significant challenges to preparers and auditors in
the not-for-profit sector. On a positive note, there are no major IFRSs / AASBs due for
implementation over the next couple of years, however entities should start their impact assessment
of recently issued IFRS 15 Revenue from Contracts with Customers and IFRS 9 Financial Instruments (2014)
sooner rather than later so as to prepare themselves properly for the changes that may be required
when adopting these standards on 1 January 2017 and 1 January 2018 (respectively).
Should preparers like to discuss these financial reporting changes or recent developments and how
these may impact upon your business, please contact your local Grant Thornton Australia contact,
or the National Audit Support (NAS) Team on [email protected]. There are also
various publications (Technical Accounting Alerts [TA Alerts] and IFRS Quarterly Newsletters
[IFRS News]) on our website www.grantthornton.com.au which provide an overview of these
developments.
The December 2014 edition of Example Financial Statements is based on the recent Grant Thornton
International publication, however has been tailored to suit the Australian financial reporting and
regulatory environment. This publication is intended to illustrate the ‘look and feel’ of Australian
general purpose financial statements and to provide a realistic example of their presentation.
This publication is based on the activities and results of Grant Thornton CLEARR Example Ltd
and Subsidiaries (“the Group”) – a fictional ASX listed public IT entity that has been preparing
Australian general purpose financial statements for several years. The form and content of
Australian general purpose financial statements depend of course on the activities and transactions
of each reporting entity.

Example listed public financial statements 3 For the year ended 31 December 2014
© 2014 Grant Thornton Australia Limited. All rights reserved.
Our objective in preparing the Example Financial Statements was to illustrate one possible approach to
financial reporting by an entity engaging in transactions that are ‘typical’ across a range of non-
specialist sectors. However, as with any example, this illustration does not envisage every possible
transaction and cannot therefore be regarded as comprehensive. Management is responsible for the
fair presentation of financial statements and therefore may find other approaches more appropriate
in their specific circumstances.
These Example Financial Statements have been reviewed and updated to reflect changes in Australian
Accounting Standards that are effective for the year ending 31 December 2014. However, no
account has been taken of any new developments published after 27 November 2014. The Grant
Thornton website contains any updates that are relevant for 31 December 2014 financial statements,
including our December 2014 Accounting Standards issued by the AASB / IASB but not yet
effective.
Significant changes in this edition
This publication has been updated to reflect all the new and revised financial reporting requirements
applicable for the first time to financial year ending 31 December 2014. The table below lists the
significant changes incorporated in this year’s publication and specific areas of the financial report
impacted by these changes.
Amendment Impact Sections affected
AASB 2011-4 Amendments to Australian Accounting Standards to Remove Individual Key Management Personnel Disclosure Requirements
Corporations and Related Legislation Amendment Regulations 2013
Corporations and Australian Securities and Investments Commission Amendment Regulation 2013 (No.1)
Relocation of individual key management personnel disclosures relating to options / rights holdings, equity holdings, loans and other transactions from the financial report to the remuneration report
Note 28 Remuneration Report (section (f))
Using this publication
In some areas alternative presentation and disclosure approaches are also illustrated in the
Appendices.
For further guidance on the Standards and Interpretations applied, reference is made to Australian
Accounting Standards and Interpretations sources throughout the document on the left hand side of
each page.
The use of this publication is not a substitute for the use of a comprehensive and up to date
disclosure checklist to ensure completeness of the disclosures in Australian general purpose financial
statements.
Andrew Archer
National Audit Leader
Grant Thornton Australia Limited
November 2014

Example listed public financial statements 4 For the year ended 31 December 2014
© 2014 Grant Thornton Australia Limited. All rights reserved.
Contents
Page
Directors’ Report 7
Auditor’s Independence Declaration 24
Corporate Governance Statement 25
Consolidated Statement of Profit or Loss and Other Comprehensive Income 39
Consolidated Statement of Cash Flows 49
Notes to the Consolidated Financial Statements 50
1 Nature of operations 50
2 General information and statement of compliance 50
3 Changes in accounting policies 51
4 Summary of accounting policies 53
5 Segment reporting 71
6 Finance costs and finance income 75
7 Other financial items 75
8 Income tax expense 76
9 Assets and disposal groups classified as held for sale and discontinued operations 76
10 Cash and cash equivalents 78
11 Trade and other receivables 78
12 Financial assets and liabilities 79
13 Inventories 84
14 Investments accounted for using the equity method 85
15 Property, plant and equipment 86
16 Investment property 87
17 Deferred tax assets and liabilities 88
18 Goodwill 89
19 Other intangible assets 91
20 Trade and other payables 92
21 Provisions 92
22 Employee remuneration 93
23 Other liabilities 100
24 Equity 101

Example listed public financial statements 5 For the year ended 31 December 2014
© 2014 Grant Thornton Australia Limited. All rights reserved.
Page
25 Earnings per share and dividends 102
26 Reconciliation of cash flows from operating activities 104
27 Auditor remuneration 104
28 Related party transactions 105
29 Contingent liabilities 106
30 Capital commitments 106
31 Acquisitions and disposals 107
32 Interests in subsidiaries 110
33 Leases 112
34 Financial instrument risk 113
35 Fair value measurement 119
36 Capital management policies and procedures 124
37 Parent Entity information 125
38 Post-reporting date events 125
Directors’ Declaration 126
Independent Auditor’s Report 127
ASX Additional Information 128
Appendix A: Organising the Statement of Profit or Loss by Function of Expenses 130
Appendix B: Statement of Profit or Loss and Other Comprehensive Income Presented in Two Statements 132
Appendix C: Statement of Cash Flows Presented Using the Indirect Method 135
Appendix D: Additional Disclosures for Mining Exploration Companies 137
Appendix E: Summary of Directors’ Report Requirements 146

Example listed public financial statements 6 For the year ended 31 December 2014
© 2014 Grant Thornton Australia Limited. All rights reserved.
Page intentionally left blank.

Example listed public financial statements 7 For the year ended 31 December 2014
© 2014 Grant Thornton Australia Limited. All rights reserved.
Directors’ Report
The Directors of Grant Thornton CLEARR Example Ltd (‘Grant Thornton CLEARR’) present
their Report1 together with the financial statements of the consolidated entity, being Grant
Thornton CLEARR (‘the Company’) and its Controlled Entities (‘the Group’) for the year ended 31
December 2014.
Director details
The following persons were Directors of Grant Thornton CLEARR during or since the end of the
financial year. Copious
Mr Blake Smith
B. Eng
Managing Director
Director since 2007
Mr Smith has substantial knowledge of
manufacturing processes and retail through
executive roles in Australia, New Zealand and the
United Kingdom where he has been responsible
for implementing best practice systems across a
range of industries.
Other current Directorships:
None
Previous Directorships (last 3 years):
Phoenix Limited (Appointed 8 August 2011;
Resigned 30 November 2012)
Interests in shares:
403,565 shares
Interest in options:
None
Ms Beth King
CA, MBA
Independent Non-Executive Director
Audit and Risk Committee Chair and Member of
the Nomination and Remuneration Committee
Director since 2005
Beth is a Chartered Accountant and brings more
than twenty (20) years broad financial and
commercial experience, both local and
international to Grant Thornton CLEARR.
Other current Directorships:
Sapphire Mine Limited (Appointed 15 July 2011)
Previous Directorships (last 3 years):
Balcombe Holdings Limited (Appointed 1 March
2009; resigned 17 September 2012)
Interests in shares:
21,203 shares
Interest in options:
None
1 For a summary of Directors’ Report requirements relating to each type of entity, refer to Appendix E: Summary of Directors’ Report
Requirements.
CA 300(1)(c)
CA 300(10)(a) CA 300 (11)(a),(c),(e)

Example listed public financial statements 8 For the year ended 31 December 2014
© 2014 Grant Thornton Australia Limited. All rights reserved.
Mr Simon Murphy
LLB (Hons)
Independent Non-Executive Director Independent Chairman / Nomination and Remuneration Committee Chair and Member of Audit and Risk Committee
Director since 2010
Simon has broad international corporate
experience as Chief Executive Officer (CEO)
of an ASX Top 100 Company with extensive
operations in North America and Europe and
diverse trading relationships in Asia. Simon is
a qualified lawyer in Australia.
Other current Directorships:
Holden Limited (Appointed 21 March 2009)
Fremont Trading Limited (Appointed 10
November 2010)
Previous Directorships (last 3 years):
None
Interests in shares:
None
Interest in options:
None
Mrs Alison French
BA (Hons)
Chief Executive Officer
Director since 2009
Alison has significant international experience
over 25 years in the information technology
sector, including senior executive positions
based in Australia, New Zealand and Asia
plus regional responsibilities over many years
throughout Africa and the Middle East.
Other current Directorships:
None
Previous Directorships (last 3 years):
None
Interests in shares:
215,123 shares
Interest in options:
41,082
Mr William Middleton
BEc, FCA
Appointed 28 November 2014 Independent Non-Executive Director
Member of the Nomination and
Remuneration Committee and member of
Audit and Risk Committee
William is the Principal of WM Associations,
a financial consulting and advisory firm with a
range of clients operating in the fast moving
consumer goods industries.
Other current Directorships:
Fisher Group Limited
(Appointed 23 October 2007)
Luxor Resources Limited
(Appointed 30 March 2009)
Leyton Supplies Limited
(Appointed 18 February 2010)
Previous Directorships (last 3 years):
Sketches Group Limited
(Appointed 15 March 2011;
resigned 17 August 2013)
Interests in shares:
10,000 shares
Interest in options:
None

Example listed public financial statements 9 For the year ended 31 December 2014
© 2014 Grant Thornton Australia Limited. All rights reserved.
Company Secretary
Nick Morgan is a Chartered Accountant and the Group Chief Financial Officer. Nick has held
senior positions with a number of professional accounting firms and has a degree in Commerce.
Nick has been the Company Secretary of Grant Thornton CLEARR for four (4) years.
Principal activities
During the year, the principal activities of entities within the Group were:
sale, customisation and integration of IT and telecommunications systems
maintenance of IT and telecommunications systems; and
internet based selling of hardware and software products.
There have been no significant changes in the nature of these activities during the year.
Review of operations and financial results2
The Group is a key participant in the IT and telecommunications services market, holding a market
share of approximately 35%. While the Group’s Services and Retail segments have a diverse
customer base, 12% of the Consulting segment’s revenues depended on a single customer (2013:
11%).
In October 2014, the Group announced that it had been the target of an unsolicited takeover offer.
The Directors believed that this offer significantly undervalued the Group. The offer caused some
disruption, diverting management time from daily operations, and the Group incurred one-off costs
of approximately $0.2m in relation to the offer. The offer has since been withdrawn.
As part of our cost reduction program, it was necessary to reduce our service staff numbers this year
from 75 to 60. Redundancy payments totalling $1.8m explain the higher employee benefit expenses
this year.
The operating result of the Group has increased to $15.4m (2013: $13.2m); this is mainly due to the
cost control measures implemented during the year which have allowed increased revenue with a
lower proportionate cost base.
Revenue from Retail operations was up on last year (by 17%), which is very encouraging and higher
than anticipated last year (our expectation was (12%). The key reason for this increase was the
expansion of our distribution networks and upgrading of our online sales portal. Revenue growth in
our Consulting and Service businesses was steady, which was in line with our expectations last year.
This steady growth reflects the current global economic uncertainty and the cost reduction measures
undertaken by businesses in the market place.
Earnings per share have increased during the year to $1.22 (2013: $1.11) which has allowed both an
interim and final dividend to be declared.
2 On 27 March 2013, the Australian Securities and Investments Commission (ASIC) issued Regulatory Guide RG 247 Effective disclosure in an
operating and financial review which sets out ASIC’s expectation regarding the level of disclosures that listed entities will need to provide in an operating and financial review in order to comply with section 299A(1) of Corporations Act 2001. For further information, refer to our TA Alert 2013-4 ASIC Regulatory Guide 247: Effective disclosure in an operating and financial review which is available on our website.
CA 300(10)(d)
CA 299(1)(c)
CA 299(1)(a) CA 299A(1)(a) & (b)
Example listed public financial statements 10 For the year ended 31 December 2014
© 2014 Grant Thornton Australia Limited. All rights reserved.
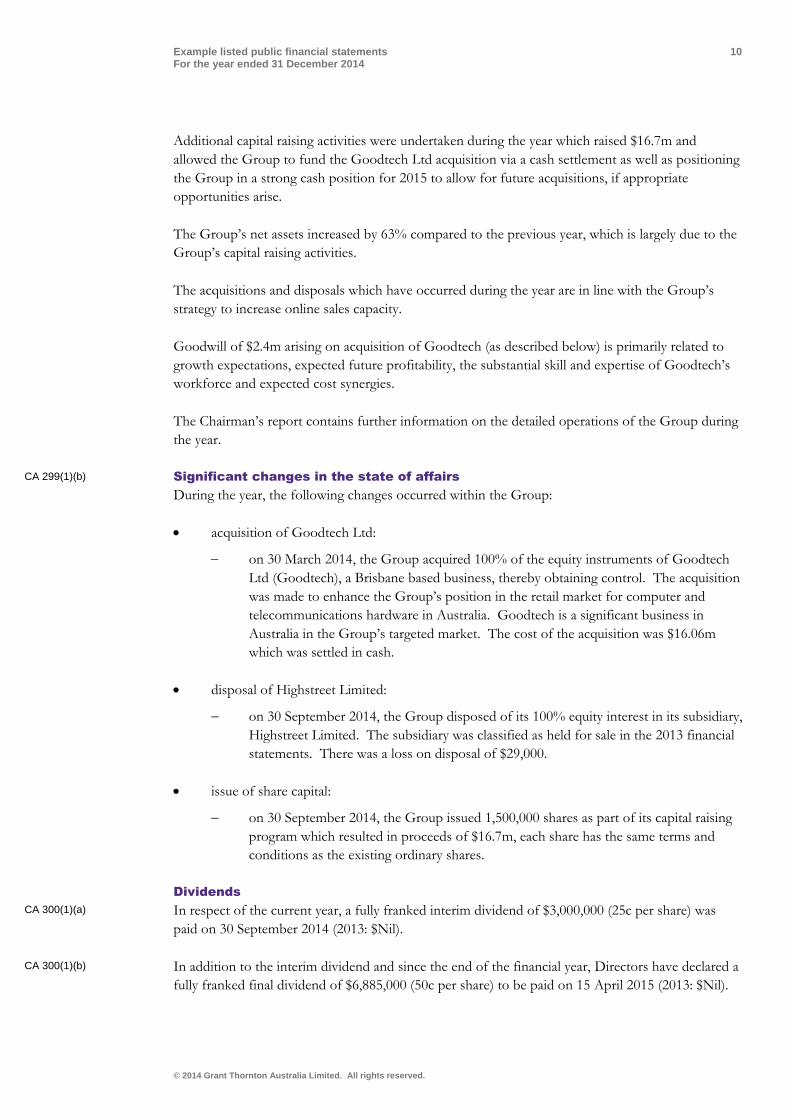
Additional capital raising activities were undertaken during the year which raised $16.7m and
allowed the Group to fund the Goodtech Ltd acquisition via a cash settlement as well as positioning
the Group in a strong cash position for 2015 to allow for future acquisitions, if appropriate
opportunities arise.
The Group’s net assets increased by 63% compared to the previous year, which is largely due to the
Group’s capital raising activities.
The acquisitions and disposals which have occurred during the year are in line with the Group’s
strategy to increase online sales capacity.
Goodwill of $2.4m arising on acquisition of Goodtech (as described below) is primarily related to
growth expectations, expected future profitability, the substantial skill and expertise of Goodtech’s
workforce and expected cost synergies.
The Chairman’s report contains further information on the detailed operations of the Group during
the year.
Significant changes in the state of affairs
During the year, the following changes occurred within the Group:
acquisition of Goodtech Ltd:
on 30 March 2014, the Group acquired 100% of the equity instruments of Goodtech
Ltd (Goodtech), a Brisbane based business, thereby obtaining control. The acquisition
was made to enhance the Group’s position in the retail market for computer and
telecommunications hardware in Australia. Goodtech is a significant business in
Australia in the Group’s targeted market. The cost of the acquisition was $16.06m
which was settled in cash.
disposal of Highstreet Limited:
on 30 September 2014, the Group disposed of its 100% equity interest in its subsidiary,
Highstreet Limited. The subsidiary was classified as held for sale in the 2013 financial
statements. There was a loss on disposal of $29,000.
issue of share capital:
on 30 September 2014, the Group issued 1,500,000 shares as part of its capital raising
program which resulted in proceeds of $16.7m, each share has the same terms and
conditions as the existing ordinary shares.
Dividends
In respect of the current year, a fully franked interim dividend of $3,000,000 (25c per share) was
paid on 30 September 2014 (2013: $Nil).
In addition to the interim dividend and since the end of the financial year, Directors have declared a
fully franked final dividend of $6,885,000 (50c per share) to be paid on 15 April 2015 (2013: $Nil).
CA 299(1)(b)
CA 300(1)(a)
CA 300(1)(b)

Example listed public financial statements 11 For the year ended 31 December 2014
© 2014 Grant Thornton Australia Limited. All rights reserved.
Events arising since the end of the reporting period
Apart from the final dividend declared, there are no other matters or circumstances that have arisen
since the end of the year that have significantly affected or may significantly affect either:
the entity’s operations in future financial years
the results of those operations in future financial years; or
the entity’s state of affairs in future financial years.
Likely developments, business strategies and prospects
Based on the expected growth in online sales, as predicted by a number of prominent economic
commentators, and the demand from customers for the latest technology, we expect significant
increase in online sales for next few years. We have a number of strategies to benefit from this
growth, including:
upgrading our online sales portal
further expanding our distribution networks
further reducing manufacturing costs; and
a strong marketing campaign.
We have instigated an urgent upgrade of the Group’s website and online sales portal. We have
allocated $3.8m for this upgrade, which will mostly be funded from retained earnings. We expect
the upgrade to be completed in the next twelve (12) months, to be followed by a strong marketing
campaign.
We are continually considering ways of reducing the Group’s cost of manufacturing. The Directors
are giving consideration to a major upgrade of production-line technology to improve efficiency.
The Directors expect to receive the results of a feasibility study within the next six (6) months, and
the various options will be considered at that time.
Looking ahead, the Group is currently engaged in a competitive tender process to supply the
Australian government $100m IT and telecommunication systems and offer integration and
maintenance services over the next ten (10) years. If successful, manufacture and supply are
expected to commence next year, significantly affecting future revenues. Given both the
competitive nature of the tender, and the fact that the process is ongoing, we have utilised the
exemption in s299A(3) and have not disclosed further details about the possible impact of the
potential contract on the Group’s business strategy and future prospects. We are relying on the
exemption on the basis that disclosure of the potential financial impact on the Group arising from
the outcome of the tender process is premature, and would be likely to result in other tender
competitors gaining a commercial advantage, which would jeopardise the Group’s prospects.
CA 299(1)(d)
CA 299(1)(e), CA 299A(1)(c)

Example listed public financial statements 12 For the year ended 31 December 2014
© 2014 Grant Thornton Australia Limited. All rights reserved.
The material business risks faced by the Group that are likely to have an effect on the financial
prospects of the Group, and how the Group manages these risks include:
1 Reduction in demand from overseas markets - given our reliance on the United Kingdom, USA and other overseas markets, this could have a significant impact on our financial results. Based on the views of prominent economic commentators, we do not anticipate any significant slowdown in these overseas economies for the next few years, but are currently investigating the option of expanding our sales into other emerging economies, such as China and India; and
2 Technological obsolescence - given the rapidly changing environment in which the Group operates, this could have a very significant impact on our financial results. We address this risk through investment in research and development and by constantly monitoring the market. With competitors constantly seeking to enter our market with improved designs, we see this risk increasing in the future.
Directors’ Meetings
The number of Directors Meetings (including meetings of Committees of Directors) held during the
year, and the number of meetings attended by each Director is as follows:
Directors’ Name Board Meetings Audit and Risk Committee Nomination and Remuneration
Committee
A B A B A B
Blake Smith 12 12 - - - -
Beth King 12 12 4 4 1 1
Simon Murphy 12 11 4 4 1 1
Alison French 12 12 - - - -
William Middleton 2 2 1 1 -* -
* There have been no meetings of the Nomination and Remuneration Committee since the date of William Middleton’s appointment to the
Committee.
Where:
Column A is the number of meetings the Director was entitled to attend
Column B is the number of meetings the Director attended.
Unissued shares under option
Unissued ordinary shares of Grant Thornton CLEARR under option at the date of this report are:
Date Options Granted Expiry Date Exercise Price of Shares ($) Number under Option
5 January 2010 4 January 2015 5.74 90,749
1 January 2011 31 December 2015 6.24 29,175
1 February 2014 31 December 2018 7.61 100,000
219,924
All options expire on the earlier of their expiry date or termination of the employee’s employment.
These options were issued under either the Star or Stay programme (described in Note 22.2 to the
financial statements) and have been allotted to individuals on condition that they serve specified
time periods as an employee of the Group before becoming entitled to exercise the options. These
options do not entitle the holder to participate in any share issue of the Company.
CA 300(10)(b) CA 300(10)(c)
CA 300(1)(d) CA 300(1)(e)

Example listed public financial statements 13 For the year ended 31 December 2014
© 2014 Grant Thornton Australia Limited. All rights reserved.
Shares issued during or since the end of the year as a result of exercise
During or since the end of the financial year, the Company issued ordinary shares as a result of the
exercise of options as follows (there were no amounts unpaid on the shares issued):
Date Options Granted Issue Price of Shares ($) Number of Shares Issued
1 January 2011 6.24 270,000
Remuneration Report (audited)
The Directors of Grant Thornton CLEARR Example Ltd (‘the Group’) present the Remuneration
Report for Non-Executive Directors, Executive Directors and other Key Management Personnel,
prepared in accordance with the Corporations Act 2001 and the Corporations Regulations 2001.
The Remuneration Report is set out under the following main headings:
a principles used to determine the nature and amount of remuneration b details of remuneration c service agreements d share-based remuneration; and e other information.
a Principles used to determine the nature and amount of remuneration
The principles of the Group’s executive strategy and supporting incentive programs and frameworks
are:
to align rewards to business outcomes that deliver value to shareholders
to drive a high performance culture by setting challenging objectives and rewarding high
performing individuals; and
to ensure remuneration is competitive in the relevant employment market place to support
the attraction, motivation and retention of executive talent.
Grant Thornton CLEARR has structured a remuneration framework that is market competitive and
complementary to the reward strategy of the Group.
The Board has established a Nomination and Remuneration Committee which operates in
accordance with its charter as approved by the Board and is responsible for determining and
reviewing compensation arrangements for the Directors and the Executive Team.
The Committee has engaged independent remuneration consultants to provide any necessary
information to assist in the discharge of its responsibilities (refer to the disclosures below).
The remuneration structure that has been adopted by the Group consists of the following
components:
fixed remuneration being annual salary; and
short term incentives, being employee share schemes and bonuses.
CA 300(1)(f)
CA 300A(1)
CA 300A(1)(a)

Example listed public financial statements 14 For the year ended 31 December 2014
© 2014 Grant Thornton Australia Limited. All rights reserved.
The Nomination and Remuneration Committee assess the appropriateness of the nature and
amount of remuneration on a periodic basis by reference to recent employment market conditions
with the overall objective of ensuring maximum stakeholder benefit from the retention of a high
quality Board and Executive Team.
The payment of bonuses, share options and other incentive payments are reviewed by the
Nomination and Remuneration Committee annually as part of the review of executive remuneration
and a recommendation is put to the Board for approval. All bonuses, options and incentives must
be linked to pre-determined performance criteria.
Short Term Incentive (STI)
Grant Thornton CLEARR performance measures involve the use of annual performance objectives,
metrics, performance appraisals and continuing emphasis on living the Company values.
The performance measures are set annually after consultation with the Directors and executives and
are specifically tailored to the areas where each executive has a level of control. The measures target
areas the Board believes hold the greatest potential for expansion and profit and cover financial and
non-financial measures.
The Key Performance Indicators (‘KPI’s’) for the Executive Team are summarised as follows:
Performance area:
financial – operating profit and earnings per share; and
non-financial – strategic goals set by each individual business unit based on job descriptions.
The STI Program incorporates both cash and share-based components for the Executive Team and
other employees.
The Board may, at its discretion, award bonuses for exceptional performance in relation to each
person’s pre-agreed KPIs.
Use of Remuneration Consultants
Grant Thornton CLEARR Example Ltd Nomination and Remuneration Committee employed the
services of ABC Remuneration Consulting Pty Ltd to review and to provide recommendations in
respect of the amount and elements of executive remuneration, including short-term and long-term
incentive plan design.
Under the terms of the engagement, ABC Remuneration Consulting Pty Ltd provided remuneration recommendations as defined in section 9B of the Corporations Act 2001 and was paid $43,400 for these services.
ABC Remuneration Consulting Pty Ltd has confirmed that the above recommendations have been made free from undue influence by members of the Group’s Key Management Personnel.
ABC Remuneration Consulting Pty Ltd was engaged by, and reported directly to, the Chair of the Nomination and Remuneration Committee. The agreement for the provision of remuneration consulting services was executed by the Chair of the Nomination and Remuneration Committee under delegated authority on behalf of the Board.
CA 300A(1)(ba) Corp Regs 2M 3.03(1)(Item 12(c))
CA 300A(1)(h)

Example listed public financial statements 15 For the year ended 31 December 2014
© 2014 Grant Thornton Australia Limited. All rights reserved.
The report containing the remuneration recommendations was provided by ABC Remuneration Consulting Pty Ltd directly to the chair of the Nomination and Remuneration Committee.
ABC Remuneration Consulting Pty Ltd was permitted to speak to management throughout the engagement to understand Company processes, practices and other business issues and obtain management perspectives. However, ABC Remuneration Consulting Pty Ltd was not permitted to provide any advice or recommendations to members of management before advice or recommendations was given to members of the Nomination and Remuneration Committee and not unless ABC Remuneration Consulting Pty Ltd had approval to do so from members of the Nomination and Remuneration Committee.
As a consequence, the Board is satisfied that the recommendations were made free from undue
influence from any members of the Key Management Personnel.
In addition to providing remuneration recommendations, ABC Remuneration Consulting Pty Ltd
also provided advice on other aspects of the remuneration of the Group’s employees. For these
services ABC Remuneration Consulting Pty Ltd was paid a total of $26,200.
Voting and comments made at the Company’s last Annual General Meeting
Grant Thornton CLEARR Example Ltd received 92% of ‘yes’ votes on its Remuneration Report
for the financial year ending 31 December 2013. The Company received no specific feedback on its
Remuneration Report at the Annual General Meeting.
Consequences of performance on shareholder wealth
In considering the Group’s performance and benefits for shareholder wealth, the Board have regard
to the following indices in respect of the current financial year and the previous four financial years:
Item 2014 2013 2012 2011 2010
EPS (cents) 1.22 1.11 1.10 1.12 1.02
Dividends (cents per share) 75 - 35 10 5
Net profit / loss ($’000) 15,447 13,452 10,368 8,941 6,739
Share price ($) 11.36 8.52 7.83 6.00 5.75
CA 300A(1)(g)
CA 300A(1)(b)

Example listed public financial statements 16 For the year ended 31 December 2014
© 2014 Grant Thornton Australia Ltd. All rights reserved.
b Details of remuneration
Details of the nature and amount of each element of the remuneration of each Key Management Personnel (‘KMP’) of Grant Thornton CLEARR are shown
in the table below:
Director and other Key Management Personnel Remuneration
Employee Year
Short Term Employee Benefits Post-Employment Benefits
Long-Term Benefits
Termination Benefits
Share-Based Payments
Total
Performance Based
Percentage of Remuneration
Cash Salary & Fees Cash Bonus
Non-Monetary Benefits Superannuation
Long Service Leave
Termination Payments Options
Executive Directors
Blake Smith Managing Director
2014 $459,000 $60,000 $70,000 $75,000 21,000 - - $685,000 8.8%
2013 $435,000 $15,000 $60,000 $70,000 20,000 - - $600,000 2.5%
Alison French Director & CEO
2014 $381,000 $70,000 $75,000 $58,000 19,000 - $8,000 $611,000 12.8%
2013 $363,000 $15,000 $65,000 $53,000 17,000 - $50,000 $563,000 11.5%
Non-Executive Directors
Beth King Independent
2014 $60,000 - - $10,000 - - - $70,000 0.0%
2013 $55,000 - - $10,000 - - - $65,000 0.0%
Simon Murphy Independent
2014 $80,000 - - $10,000 - - - $90,000 0.0%
2013 $75,000 - - $10,000 - - - $85,000 0.0%
William Middleton
Independent3
2014 $15,000 - - $1,350 - - - $16,350 0.0%
Other Key Management Personnel
Louise Johnston General Manager, Sales
2014 $169,000 $40,000 $45,000 $31,000 10,000 - $20,000 $336,000 17.9%
2013 $181,000 $30,000 $35,000 $31,000 9,000 - $23,000 $309,000 17.2%
Nick Morgan - CFO / Company Secretary
2014 $266,000 $20,000 - $30,000 14,000 - $25,000 $355,000 12.7%
2013 $266,000 - - $30,000 14,000 - $27,000 $337,000 8.0%
John Harbour - General
Manager, Manufacturing4
2014 $162,000 - - $23,500 8,000 $100,000 - $293,500 -
2013 $195,000 $20,000 - $23,500 10,000 - $25,000 $273,500 16.5%
Andrew West - General
Manager, Manufacturing5
2014 $33,000 - - $3,150 2,000 - - $38,150 -
Eric Stevens Chief Operating Officer
2014 $266,000 $25,000 $30,000 $55,000 14,000 - $25,000 $415,000 12.0%
2013 $257,000 $10,000 $30,000 $45,000 13,000 - $25,000 $380,000 9.2%
Kendra Thompson Chief Information Officer
2014 $242,000 $20,000 - $40,000 13,000 - $25,000 $340,000 13.2%
2013 $223,000 $10,000 - $38,500 11,000 - $25,000 $307,500 11.4%
2014 Total 2014 2,155,000 235,000 220,000 337,000 100,000 100,000 103,000 3,250,000 -
2013 Total 2013 2,049,000 100,000 190,000 311,000 95,000 - 175,000 2,920,000 -
3 William Middleton - Appointed 28 November 2014 4 John Harbour - Resigned 31 October 2014 5 Andrew West - Appointed 1 November 2014

Example listed public financial statements 17 For the year ended 31 December 2014
© 2014 Grant Thornton Australia Ltd. All rights reserved.
The relative proportions of remuneration that are linked to performance and those that are fixed are
as follows:
Name Fixed remuneration At risk - STI At risk - options
Executive Directors
Blake Smith 91% 9% -
Alison French 88% 11% 1%
Other Key Management Personnel
Louise Johnston 82% 12% 6%
Nick Morgan 83% 10% 7%
John Harbour 100% - -
Andrew West 100% - -
Eric Stevens 88% 6% 6%
Kendra Thompson 87% 6% 7%
Since the long-term incentives are provided exclusively by way of options, the percentages disclosed
also reflect the value of remuneration consisting of options, based on the value of options expensed
during the year.
c Service agreements
Remuneration and other terms of employment for the Executive Directors and other Key
Management Personnel are formalised in a Service Agreement. The major provisions of the
agreements relating to remuneration are set out below:
Name Base Salary Term of Agreement Notice Period
Blake Smith $480,000 Unspecified Six months
Alison French $400,000 Unspecified Six months
Louise Johnston $200,000 Unspecified Three months
Andrew West $210,000 Unspecified Three months
Eric Stevens $280,000 Unspecified Three months
Kendra Thompson $255,000 Unspecified Two months
Nick Morgan $280,000 Unspecified Two months
d Share-based remuneration
All options refer to options over ordinary shares of the Company, which are exercisable on a one-
for-one basis under the terms of the agreements.
Options granted to the Executive Team are under the Star Program. Options will vest subject to
the achievement of the following total shareholder return performance condition.
If the Company’s total shareholder return (representing dividend per share plus increase in the share
price) is in the top quartile of companies in the ASX 200 Index (‘the Index’) over the vesting period,
the full number of options will vest.
For performance between median and upper quartile, vesting will occur on a straight line basis so
that 25% of the options vest for median performance and full vesting occurs for top quartile
performance.
CA 300A(1)(e)(i),(vi)
CA 300(11d) / Corp Regs 2M 3.03(1) CA 300A(1e(vii))
CA 300A(1ba) Corp Regs 2M 3.03(1)(item 12(c))

Example listed public financial statements 18 For the year ended 31 December 2014
© 2014 Grant Thornton Australia Ltd. All rights reserved.
No options will vest if the total shareholder return is below the median in the Index. In addition,
persons eligible to participate in this programme have to be employed until the end of the arranged
vesting period.
Upon vesting, each option allows the holder to purchase one ordinary share at a discount of 20-25%
of the market price determined at grant date.
Options granted under the Star Program carry no dividends or voting rights and when exercisable,
each option is convertible into one ordinary share.
Details of options over ordinary shares in the Company that were granted as remuneration to each
Key Management Personnel are set out in the following page.
Non-Executive Directors are not entitled to participate in the Star Program.
CA 300(1d) / CA 300(5)

Example listed public financial statements 19 For the year ended 31 December 2014
© 2014 Grant Thornton Australia Ltd. All rights reserved.
Employee Number Granted
Grant Date
Value per Option at
Grant Date ($)
Value of Options at
Grant Date ($)
Number Vested
Number Forfeited
Exercise Price ($)
Vesting and First Exercise
Date
Last Exercise Date
Percentage (%) Remuneration that
are Options
Blake Smith - - - - - - - - - -
Alison French 3,582 1-Aug-14 6.70 23,999 - - 7.61 1-Feb-17 31-Jul-17 1.3
Louise Johnston 8,955 1-Aug-14 6.70 59,999 - - 7.61 1-Feb-17 31-Jul-17 6.0
Andrew West - - - - - - - - - -
Eric Stevens 11,194 1-Aug-14 6.70 75,000 - - 7.61 1-Feb-17 31-Jul-17 6.0
Kendra Thompson 11,194 1-Aug-14 6.70 75,000 - - 7.61 1-Feb-17 31-Jul-17 7.4
Nick Morgan 11,194 1-Aug-14 6.70 75,000 - - 7.61 1-Feb-17 31-Jul-17 7.0
The options were provided at no cost to the recipients. All options expire on the earlier of their expiry date or termination of the individual’s employment.
Employee Date of Exercise of Options
Number of Ordinary Shares Issued on Exercise of Options
Value of Options at Exercise Date ($)*
Alison French 21-Sep-14 37,500 262,500
Louise Johnston 21-Sep-14 10,000 70,000
Nick Morgan 21-Sep-14 20,250 141,750
John Harbour 21-Sep-14 18,750 131,250
Eric Stevens 21-Sep-14 12,750 89,250
Kendra Thompson 21-Sep-14 18,750 131,250
* The value at the date of exercise of options that were granted as part of remuneration and exercised during the year has been determined as the intrinsic value of the options at the exercise date.
Corp Regs 2M 3.03(1) (Item 15) / CA 300A (1e(ii),(iv),(v),(vi))
CA 300A (1e(iii))

Example listed public financial statements 20 For the year ended 31 December 2014
© 2014 Grant Thornton Australia Ltd. All rights reserved.
e Bonuses included in remuneration
Details of the short-term incentive cash bonuses awarded as remuneration to each Key Management
Personnel, the percentage of the available bonus that was paid in the financial year, and the
percentage that was forfeited because the person did not meet the service and performance criteria
is set out below. No part of the bonus is payable in future years.
Included in Remuneration ($)
Percentage Vested During the Year
Percentage Forfeited During the Year
Executive Directors
Blake Smith 60,000 75% 25%
Alison French 70,000 100% -
Other Key Management Personnel
Louise Johnston 40,000 80% 20%
Nick Morgan 20,000 80% 20%
Eric Stevens 25,000 83% 17%
Kendra Thompson 20,000 67% 33%
f Other information
Options held by Key Management Personnel
The number of options to acquire shares in the Company held during the 2014 reporting period by
each of the Key Management Personnel of the Group; including their related parties are set out
below. No options are held by directors, except for Alison French.
Year Ended 31 December 2014
Personnel Balance at
Start of Year Granted as
Remuneration Exercised Other
Changes
Vested & Exercisable at the End of the
Reporting Period
Vested & Un-Exercisable at the End of the
Reporting Period
A French 37,500 3,582 (37,500) - - 3,582
L Johnston 17,250 8,955 (10,000) - 7,250 8,955
N Morgan 20,250 11,194 (20,250) - - 11,194
J Harbour* 18,750 - (18,750) - - -
E Stevens 18,750 11,194 (12,750) - 6,000 11,194
K Thompson 18,750 11,194 (18,750) - - 11,194
131,250 46,119 (118,000) - 13,250 46,119
* J Harbour resigned 31 October 2014.
Shares held by Key Management Personnel
The number of ordinary shares in the Company during the 2014 reporting period held by each of
the Group’s Key Management Personnel, including their related parties, is set out below:
Year Ended 31 December 2014
Personnel Balance at Start
of Year Granted as
Remuneration Received on
Exercise Other Changes Held at the End of Reporting Period
B Smith 403,565 - - - 403,565
B King 21,203 - - - 21,203
A French 177,623 - 37,500 - 215,123
W Middleton - - - 10,000 10,000
N Morgan 24,000 - 10,000 - 34,000
J Harbour * 41,000 - 20,250 - 61,250
E Stevens 15,851 - 18,750 - 34,601
K Thompson 12,554 - 12,750 - 25,304
695,796 - 99,250 10,000 805,046
* J Harbour resigned 31 October 2014.
Corp Regs 2M 3.03(1) (Item 12(e)-(g))
Corp Regs 2M 3.03(1) (Item 17(a)-(h))
Corp Regs 2M 3.03(1) (Item 18(a)-(e))

Example listed public financial statements 21 For the year ended 31 December 2014
© 2014 Grant Thornton Australia Ltd. All rights reserved.
None of the shares included in the table above are held nominally by Key Management Personnel.
Loans to Key Management Personnel
The Group allows its employees to take up limited short-term loans to fund merchandise and other
purchases through the Group’s business contacts. This facility is also available to the Group’s Key
Management Personnel. The table below provides aggregate information relating to Group’s loans
to Key Management Personnel during the year:
2014
$
Balance at the start of the year 1,000
Interest paid and payable for the year -
Interest not charged 3,200
Balance at the end of the year 1,000
The number of Key Management Personnel included in the Group aggregate at year end is five (5).
The Group does not have an allowance account for receivables relating to outstanding loans and has
not recognised any expense for impaired receivables during reporting period.
The loans to Key Management Personnel are generally for a period of two (2) years and are
repayable on quarterly instalments. These loans are unsecured and interest free. The amounts of
interest not charged in the table above represents the amount of interest that would have been
charged on an arm’s length basis.
There were no individuals with loans above $100,000 during the financial year.
Other transactions with Key Management Personnel
During 2014, the Group used the legal services of one Company Director (Mr William Middleton)
and the law firm over which he exercises significant influence. The amounts billed related to this
legal service amounted to $21,000 (2013: $Nil), based on normal market rates and was fully paid as
of the reporting date.
End of audited Remuneration Report.
Environmental legislation
Grant Thornton CLEARR operations are not subject to any particular or significant environmental
regulation under a law of the Commonwealth or of a State or Territory in Australia.
Indemnities given to, and insurance premiums paid for, auditors and officers
During the year, Grant Thornton CLEARR paid a premium to insure officers of the Group. The
officers of the Group covered by the insurance policy include all Directors.
The liabilities insured are legal costs that may be incurred in defending civil or criminal proceedings
that may be brought against the officers in their capacity as officers of the Group, and any other
payments arising from liabilities incurred by the officers in connection with such proceedings, other
than where such liabilities arise out of conduct involving a wilful breach of duty by the officers or
the improper use by the officers of their position or of information to gain advantage for themselves
or someone else to cause detriment to the Group.
Corp Regs 2M 3.03(1) (Item 18(f))
Corp Regs 2M 3.03(1) (Item 20(a),(b),(c),(e),(f))
Corp Regs 2M 3.03(1) (Item 20(d))
Corp Regs 2M 3.03(1) (Item 20(g))
Corp Regs 2M 3.03(1) (Item 21)
Corp Regs 2M 3.03(1) (Item 22)
CA 299(1f)
CA 300(1g)

Example listed public financial statements 22 For the year ended 31 December 2014
© 2014 Grant Thornton Australia Ltd. All rights reserved.
Details of the amount of the premium paid in respect of insurance policies are not disclosed as such
disclosure is prohibited under the terms of the contract.
The Group has not otherwise, during or since the end of the financial year, except to the extent
permitted by law, indemnified or agreed to indemnify any current or former officer or auditor of the
Group against a liability incurred as such by an officer or auditor.
Non-audit services
During the year, Grant Thornton, the Company’s auditors, performed certain other services in
addition to their statutory audit duties.
The Board has considered the non-audit services provided during the year by the auditor and, in
accordance with written advice provided by resolution of the Audit and Risk Committee, is satisfied
that the provision of those non-audit services during the year is compatible with, and did not
compromise, the auditor independence requirements of the Corporations Act 2001 for the following
reasons:
all non-audit services were subject to the corporate governance procedures adopted by the
Company and have been reviewed by the Audit and Risk Committee to ensure they do not
impact upon the impartiality and objectivity of the auditor; and
the non-audit services do not undermine the general principles relating to auditor
independence as set out in APES 110 Code of Ethics for Professional Accountants, as they did not
involve reviewing or auditing the auditor’s own work, acting in a management or decision-
making capacity for the Company, acting as an advocate for the Company or jointly sharing
risks and rewards.
Details of the amounts paid to the auditors of the Company, Grant Thornton, and its related
practices for audit and non-audit services provided during the year are set out in Note 28 to the
Financial Statements.
A copy of the Auditor’s Independence Declaration as required under s307C of the Corporations Act
2001 is included on page 24 of this financial report and forms part of this Directors’ Report.
Proceedings of behalf of the Company
No person has applied to the Court under section 237 of the Corporations Act 2001 for leave to bring
proceedings on behalf of the Company, or to intervene in any proceedings to which the Company is
a party, for the purpose of taking responsibility on behalf of the Company for all or part of those
proceedings.
Rounding of amounts
Grant Thornton CLEARR is a type of Company referred to in ASIC Class Order 98/100 and
therefore the amounts contained in this report and in the financial report have been rounded to the
nearest $1,000 (where rounding is applicable), or in certain cases, to the nearest dollar under the
option permitted in the Class Order.
CA 300(11B)/(11C)
CA 307C
CA 300(14)/(15)
ASIC CO 98/100

Example listed public financial statements 23 For the year ended 31 December 2014
© 2014 Grant Thornton Australia Ltd. All rights reserved.
Signed in accordance with a resolution of the Directors.
Blake Smith
Director
28 February 2015
CA 298(2a)
CA 298(2c)
CA 298(2b)

Example listed public financial statements 24 For the year ended 31 December 2014
© 2014 Grant Thornton Australia Ltd. All rights reserved.
Auditor’s Independence Declaration
Auditor's Independence Declaration
To the Directors of Grant Thornton CLEARR Example Ltd
In accordance with the requirements of section 307C of the Corporations Act 2001, as lead auditor for
the audit of Grant Thornton CLEARR Example Ltd for the year ended 31 December 2014, I
declare that, to the best of my knowledge and belief, there have been:
a No contraventions of the auditor independence requirements of the Corporations Act 2001 in
relation to the audit; and
b No contraventions of any applicable code of professional conduct in relation to the audit.
GRANT THORNTON AUDIT PTY LTD
Chartered Accountants
A B Partner
Partner – Audit & Assurance
Sydney
28 February 2015
Grant Thornton Audit Pty Ltd ACN 130 913 594 Level 17, 383 Kent Street Sydney NSW 2000 Locked Bag Q800 QVB Post Office Sydney NSW 1230 T +61 2 8297 2400 F +61 2 9299 4445 E [email protected] W www.grantthornton.com.au

Example listed public financial statements 25 For the year ended 31 December 2014
© 2014 Grant Thornton Australia Ltd. All rights reserved.
Corporate Governance Statement
The Board is committed to achieving and demonstrating the highest standards of corporate
governance. As such, Grant Thornton CLEARR Example Ltd and its Controlled Entities (‘the
Group’) have adopted a corporate governance framework and practices to ensure they meet the
interests of shareholders.
The Group complies with the Australian Securities Exchange Corporate Governance Council’s
Corporate Governance Principles and Recommendations with 2010 Amendments (‘the ASX
Principles’). This statement incorporates the disclosures required by the ASX Principles under the
headings of the eight (8) core principles. All of these practices, unless otherwise stated, were in
place for the full reporting period.
Further information on the Group’s corporate governance policies and practices can be found on
Grant Thornton CLEARR’s website at www.gthl.com.au/corporategovernance.
Principle 1: Lay solid foundations for management and oversight
Functions of the Board and Management
The Board of Directors is responsible for the corporate governance of the Group and operates in
accordance with the principles set out in its Charter, which is available in the corporate governance
section of Grant Thornton CLEARR’s website. To ensure that the Board is well equipped to
discharge its responsibilities it has established guidelines for the nomination and selection of
Directors and for the operation of the Board. These responsibilities include:
setting the strategy for the Group, including operational and financial objectives and ensuring
that there are sufficient resources for this strategy to be achieved
appointing and, where appropriate, removing the Chief Executive Officer (‘CEO’), approving
other key executive appointments and planning for executive succession
overseeing and evaluating the performance of the CEO and the Executive Team through a
formal performance appraisal process having regard to the Group’s business strategies and
objectives
monitoring compliance with legal, regulatory and occupational health and safety requirements
and standards
overseeing the identification of key risks faced by the Group and the implementation of an
appropriate internal control framework to ensure those risks are managed to an acceptable
level
approving the Group’s budgets, including operational and capital budgets, and the approval
of significant acquisitions, expenditures or divestitures
Example listed public financial statements 26 For the year ended 31 December 2014
© 2014 Grant Thornton Australia Ltd. All rights reserved.
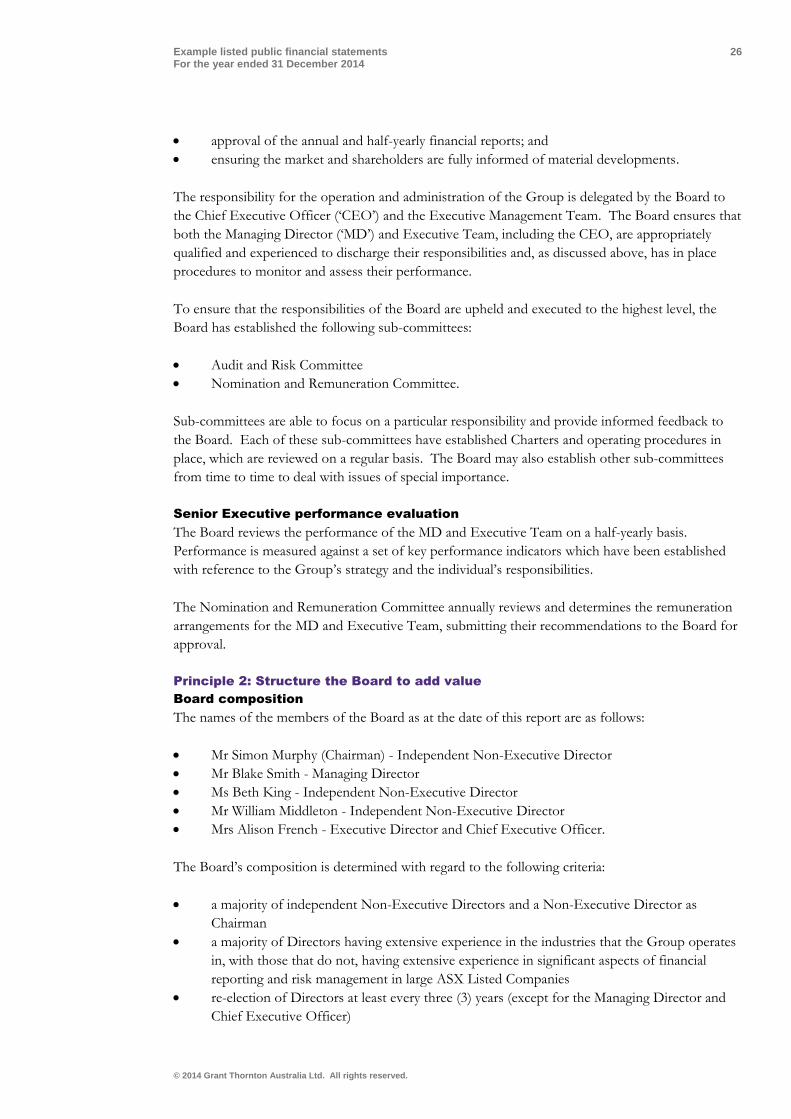
approval of the annual and half-yearly financial reports; and
ensuring the market and shareholders are fully informed of material developments.
The responsibility for the operation and administration of the Group is delegated by the Board to
the Chief Executive Officer (‘CEO’) and the Executive Management Team. The Board ensures that
both the Managing Director (‘MD’) and Executive Team, including the CEO, are appropriately
qualified and experienced to discharge their responsibilities and, as discussed above, has in place
procedures to monitor and assess their performance.
To ensure that the responsibilities of the Board are upheld and executed to the highest level, the
Board has established the following sub-committees:
Audit and Risk Committee
Nomination and Remuneration Committee.
Sub-committees are able to focus on a particular responsibility and provide informed feedback to
the Board. Each of these sub-committees have established Charters and operating procedures in
place, which are reviewed on a regular basis. The Board may also establish other sub-committees
from time to time to deal with issues of special importance.
Senior Executive performance evaluation
The Board reviews the performance of the MD and Executive Team on a half-yearly basis.
Performance is measured against a set of key performance indicators which have been established
with reference to the Group’s strategy and the individual’s responsibilities.
The Nomination and Remuneration Committee annually reviews and determines the remuneration
arrangements for the MD and Executive Team, submitting their recommendations to the Board for
approval.
Principle 2: Structure the Board to add value
Board composition
The names of the members of the Board as at the date of this report are as follows:
Mr Simon Murphy (Chairman) - Independent Non-Executive Director
Mr Blake Smith - Managing Director
Ms Beth King - Independent Non-Executive Director
Mr William Middleton - Independent Non-Executive Director
Mrs Alison French - Executive Director and Chief Executive Officer.
The Board’s composition is determined with regard to the following criteria:
a majority of independent Non-Executive Directors and a Non-Executive Director as
Chairman
a majority of Directors having extensive experience in the industries that the Group operates
in, with those that do not, having extensive experience in significant aspects of financial
reporting and risk management in large ASX Listed Companies
re-election of Directors at least every three (3) years (except for the Managing Director and
Chief Executive Officer)

Example listed public financial statements 27 For the year ended 31 December 2014
© 2014 Grant Thornton Australia Ltd. All rights reserved.
the size of the Board is appropriate to facilitate effective discussion and efficient decision
making
there are a sufficient number of Directors to serve on Board sub-committees without
overburdening the Directors of making it difficult for the Directors to effectively discharge
their responsibilities.
With regards to Director Independence, the Board has adopted specific principles which state that
an Independent Director must not be a member of management and must comply with the
following criteria:
not, within the last three (3) years, have been employed in an executive capacity by Grant
Thornton CLEARR or any other member of the Group
not be a substantial shareholder or be associated either directly or indirectly with a substantial
shareholder
not, within the last three (3) years, have been a professional advisor to the Group either as a
principal, or material consultant, or an employee materially associated with the service
provided
are not a material supplier or customer of the Group or associated either directly or indirectly
with a material supplier or customer of the Group; and
have no material contractual relationship with any Entity within the Group other than in the
capacity as a Director.
At the commencement of this reporting period the Board comprised of four Directors, two (2) of
whom were independent Non-Executive Directors. As the casting vote belonged to the Chairman,
who is independent, the majority of the Board could be considered to be independent.
However, to avoid the perception that the majority of the Board was not independent, Mr William
Middleton was appointed to the Board on 28 November 2014. Mr Middleton is an independent
Non-Executive Director as he satisfies the criteria set out above and therefore increases the number
of Independent Non-Executive Directors on the Board to three out of a total of five (5) Directors.
The Board undertakes an annual review of the extent to which each Non-Executive Director is
independent, having regard to the criteria set out in its Charter. As part of this review, each
Director is required to make an annual declaration stating their compliance with the independence
criteria to the Board. As at the date of this report, the three (3) Non-Executive Directors have
submitted their annual declaration to the Board, and the Board is satisfied that they have retained
their independence throughout the reporting period.
Individual details of the Directors, including period in office, Board committee memberships,
qualifications, experience and skills are set out in the information on Directors section of the
Directors’ Report.

Example listed public financial statements 28 For the year ended 31 December 2014
© 2014 Grant Thornton Australia Ltd. All rights reserved.
Role of the Chairman
The Board Charter provides that the Chairman should be an Independent Non-Executive Director.
The Chairman is responsible for the leadership of the Board. This includes taking responsibility for
ensuring that the Board functions effectively and that they comply with the continuous disclosure
requirements of the ASX with regard to communicating the operations and activities of the Group
to shareholders. The Chairman’s responsibilities are set out in the Board Charter and include:
setting the agenda for Board meetings
managing the conduct, frequency and length of Board meetings to ensure that all Directors
have had the opportunity to establish a detailed understanding of the issues affecting the
Group
facilitating the Board meetings to ensure effective communication between the Directors and
that all Directors have contributed to the decision making process thereby leading to a
considered decision being made in the best interest of the Group and its shareholders.
Nomination and Remuneration Committee
The Nomination and Remuneration Committee oversees the appointment and induction process
for Directors and the selection, appointment and succession planning process of the Group’s
Managing Director and Chief Executive Officer. A copy of the Committee’s Charter is available on
Grant Thornton CLEARR’s website at www.gthl.com.au/corporategovernance.
When a vacancy exists or there is a need for a particular skill, the Committee, in consultation with
the Board, determines the selection criteria that will be applied. The Committee will then identify
suitable candidates, with assistance from an external consultant if required, and will assist the Board
in interviewing and assessing the selected candidates.
Directors are initially appointed to office by the Board and must stand for re-election at the Group’s
next annual general meeting of shareholders. Directors must then retire from office and nominate
for re-election at least once every three years with the exception of the Managing Director and Chief
Executive Officer.
The Nomination and Remuneration Committee comprises of Mr S Murphy (Chairman), Ms B King
and Mr W Middleton, being a majority of Independent Non-Executive Directors. Mr W Middleton
was appointed as a Committee member on 28 November 2014. Details of attendance at
Nomination and Remuneration Committee meetings are set out in the Meetings of Directors
section of the Directors’ Report.
Directors’ performance evaluation
The Board undertakes an assessment of its collective performance, the performance of the Board
committees and the Chairman on an annual basis.
The Chairman meets each Director on an individual basis to discuss their performance and to
provide feedback. The results of this discussion including any key areas for development are
formally documented.
Each Board Committee annually reviews the fulfilment of its responsibilities as set out in its Charter
and provides a report with a summary of issues and recommendations for the Board’s review.
Upon review the Board will then provide their feedback to the Committee including an
endorsement of the recommendations made.

Example listed public financial statements 29 For the year ended 31 December 2014
© 2014 Grant Thornton Australia Ltd. All rights reserved.
These performance evaluations were carried out in December 2013 and were compliant with the
Group’s established practices.
Independent professional advice and access to information
Each Director has the right of access to all relevant information in the Group in addition to access
to the Group’s executives. Each Director also has the right to seek independent professional advice
subject to prior consultation with, and approval from, the Chairman. This advice will be provided at
the Group’s expense and will be made available to all members of the Board.
Insurance
The Group has in place, a Directors and Officers liability insurance policy providing a specified level
of cover for current and former Directors and Executive Officers of the Group against liabilities
incurred whilst acting in their respective capacity.
Principle 3: Promote ethical and responsible decision making
Code of Conduct
The Group recognises the importance of establishing and maintaining high ethical standards and
decision making in conducting its business and is committed to increasing shareholder value in
conjunction with fulfilling its responsibilities as a good corporate citizen. All Directors, managers
and employees are expected to act with the utmost integrity, honesty and objectivity, striving at all
times to enhance the reputation and performance of the Group.
The Group has established a Code of Conduct and a Directors and Officers Code of Conduct,
copies of which are available on Grant Thornton CLEARR’s website under the corporate
governance section. New employees are introduced to the Code of Conduct as part of their
induction training. Employees sign a declaration confirming receipt of the Code of Conduct and
their compliance with it. Periodical training is then provided throughout the course of their
employment.
Unethical practices, including fraud, legal and regulatory breaches, and policy breaches are required
to be reported on a timely basis to management. Reporting parties are able to do so without fear of
reprisal or retribution as their identity and report are kept in the strictest confidence. External third
party reporting procedures are available to employees to provide them with the assurance that their
identity will be kept confidential at all times.
Whistle-blower Policy
The Code of Conduct includes a Whistle-blower Policy and the Group operates a Whistle-blower
Service through an independent third party to facilitate reporting of potential misconduct within the
Group.
Employees are therefore provided with a secure service through which they can report potential
misconduct such as illegal activity, fraudulent activity, corrupt practices, harassment or
discrimination, misleading or deceptive conduct of any kind, unethical behaviour and health, safety
or environmental hazards.
Matters raised under the Whistle-blower service are reported to the Board through the Audit and
Risk Committee and the policy and service are reviewed periodically for their effectiveness.

Example listed public financial statements 30 For the year ended 31 December 2014
© 2014 Grant Thornton Australia Ltd. All rights reserved.
Share Trading Policy
The Group has established a share trading policy which governs the trading in the Group’s shares
and applies to all Directors and employees of the Group. A copy of this policy is available on Grant
Thornton CLEARR’s website under www.gthl.com.au/corporategovernance.
Under this share trading policy, an employee, Executive or Director must not trade in any securities
of the Group at any time when they are in possession of unpublished, price sensitive information in
relation to those securities.
Before commencing to trade, an Executive or employee must first obtain the permission of the
Company Secretary to do so, and a Director must obtain the permission of the Chairman. The
trading windows are four weeks after the release of the half year results, full year results and the
holding of the Annual General Meeting. Trading of securities outside the trading windows can only
occur in exceptional circumstances and with the approval of the Company Secretary.
As required by the ASX listing rules, the Group notifies the ASX of any transaction conducted by
Directors in the securities of the Group.
Diversity Policy
Diversity includes, but is not limited to, gender, age, ethnicity and cultural background. The
Company is committed to diversity and recognises the benefits arising from employee and Board
diversity and the importance of benefiting from all available talent. A copy of the Company’s
Diversity Policy is available on Grant Thornton CLEARR’s website at
www.gthl.com.au/corporategovernance. This Diversity Policy outlines the requirements for the
Board to develop measurable objectives for achieving diversity, and annually assess both the
objectives and the progress in achieving those objectives. Accordingly, the Board has developed the
following objectives regarding gender diversity and aims to achieve these objectives over the next
few years as Director and Senior Executive positions become vacant and appropriately qualified
candidates become available:
Gender Diversity Objective 2014 2015-2016
No. % No. %
Women on the Board 2 40 3 60
Women in Senior Management roles 5 28 10 50
Women employees in the Company 120 34 200 40
Principle 4: Safeguard integrity in financial reporting
Audit and Risk Committee
An Audit and Risk Committee has been established by the Board. The Committee’s role and
operations are documented in a Charter which is approved by the Board. This Charter is available
on Grant Thornton CLEARR’s website under www.gthl.com.au/corporategovernance.
The Committee’s Charter provides that all members of the Audit and Risk Committee must be
Independent Non-Executive Directors and that the Chair cannot be the Chairman of the Board.
Members of the Committee throughout the period and at the date of this report are Ms B King
(Chair), Mr S Murphy and Mr W Middleton, all of whom are Independent Non-Executive Directors
of the Group.

Example listed public financial statements 31 For the year ended 31 December 2014
© 2014 Grant Thornton Australia Ltd. All rights reserved.
The purpose of the Committee is to:
ensure the integrity of the Group’s internal and external financial reporting including
compliance with applicable laws and regulations
ensure that financial information provided to the Board is of a sufficiently high quality to
allow the Board to make informed decisions
ensure that appropriate and effective internal systems and controls are in place to manage the
Group’s exposure to risk
oversee the appointment, compensation, retention and oversight of the external auditor, and
review of any non-audit services provided by the external auditor; and
regularly review the performance of the external auditor regarding quality, costs and
independence.
The Audit and Risk Committee is required under the Charter to meet at least quarterly and
otherwise as necessary. The Committee met four times during the year and Committee members’
attendance records are disclosed in the Directors’ Meetings section of the Directors’ Report.
The Managing Director, Chief Financial Officer and external auditor also regularly attend the
Committee meetings by standing invitation. Other Directors and management are invited to attend
Committee meetings and participate in discussion relating to specific issues that they have an
interest in.
The Committee is authorised to obtain independent legal advice at the Group’s expense if it
considers it necessary in fulfilling its duties.
Principle 5: Make timely and balanced disclosure
Grant Thornton CLEARR has established policies and procedures to ensure timely and balanced
disclosure of all material matters concerning the Group, and ensure that all investors have access to
information on the Group’s financial performance. This ensures that the Group is compliant with
the information disclosure requirements under the ASX Listing Rules.
These policies and procedures include a comprehensive Disclosure Policy that includes
identification of matters that may have a material impact on the price of Grant Thornton
CLEARR’s securities, notifying them to the ASX, posting relevant information on the Group’s
website and issuing media releases. These policies are available on Grant Thornton CLEARR’s
website under www.gthl.com.au/corporategovernance.
Matters involving potential market sensitive information must first be reported to the Managing
Director either directly or via the Company Secretary. The Managing Director will advise the other
Directors if the issue is important enough to warrant the consideration of the full Board. In all
cases the appropriate action must be determined and carried out in a timely manner in order for the
Group to comply with the Information Disclosure requirements of the ASX.

Example listed public financial statements 32 For the year ended 31 December 2014
© 2014 Grant Thornton Australia Ltd. All rights reserved.
Once the appropriate course of action has been agreed upon, either the Managing Director or
Company Secretary, being the only authorised officers of the Group who are able to disclose such
information, will disclose the information to the relevant authorities. Board approval is required for
market sensitive information such as financial results, material transactions or upgrading /
downgrading financial forecasts. This approval is minuted in the meetings of the Board of
Directors.
Principle 6: Respect the rights of shareholders
Grant Thornton CLEARR has established a Shareholder Communication Policy which describes
the Group’s approach to promoting effective communication with shareholders which includes:
the Annual Report, including relevant information about the operations of the Group during
the year, key financial information, changes in the state of affairs and indications of future
developments. The Annual Report can be accessed either through the ASX website or Grant
Thornton CLEARR’s website under www.gthl.com.au/financialinformation
the half year and full year financial results are announced to the ASX and are available to
shareholders via the Grant Thornton CLEARR and ASX websites
All announcements made to the market and related information (including presentations to
investors and information provided to analysts or the media during briefings), are made
available to all shareholders under the investor information section of Grant Thornton
CLEARR’s website after they have been released to the ASX
detailed notices of shareholder meetings are sent to all shareholders in advance of the
meeting; and
shareholding and dividend payment details are available through the Group’s share register,
Computershare Investor Services Pty Ltd.
The Board encourages full participation by shareholders at the Annual General Meeting to ensure a
high level of Director accountability to shareholders and shareholder identification with the Group’s
strategy and goals. Important issues are presented to the shareholders as single resolutions. The
shareholders are requested to vote on matters such as the adoption of the Group’s remuneration
report, the granting of options and shares to Directors and changes to the Constitution.
The external auditor attends the Annual General Meeting to answer any questions concerning the
audit of the Group and the contents of the Auditor’s Report.
Principle 7: Recognise and manage risk
Risk management framework
Grant Thornton CLEARR recognises that a robust risk management framework is essential for
corporate stability, protecting the interests of its stakeholders and for sustaining its competitive
market position and long term performance.
The following objectives drive the Group’s approach to risk management:
having a culture that is risk aware and supported by high standards of accountability at all
levels
promoting and achieving an integrated risk management approach whereby risk management
forms a part of all key organisational processes
supporting more effective decision making through better understanding and consideration
of risk exposures

Example listed public financial statements 33 For the year ended 31 December 2014
© 2014 Grant Thornton Australia Ltd. All rights reserved.
increasing shareholder value by protecting and improving share price and earnings per share
in the short to medium term while building a sustainable business in the longer term;
safeguarding the Group’s assets
enabling the Board to fulfil its governance and compliance requirements; and
supporting the sign off for ASX Principles four and seven by the Chief Executive Officer and
Chief Financial Officer.
In achieving effective risk management, Grant Thornton CLEARR recognises the importance of
leadership. As such, the Board and executive management have responsibility for driving and
supporting risk management across the Group. Each subsidiary then has responsibility for
implementing this approach and adapting it, as appropriate, to its own circumstances.
Audit and Risk Committee
Under its Charter, the Audit and Risk Committee has been delegated responsibility by the Board to
oversee the implementation and review of risk management and related internal compliance and
control systems throughout the Group.
The Committee reviews the appropriateness and adequacy of internal processes for determining,
assessing and monitoring risk areas including the assessment of the effectiveness of the Group’s
internal compliance and controls including:
the existence and adequacy of key policies and procedures
the adequacy of disclosures and processes for regular reporting of information to the
appropriate parties, including the Board.
The Committee is also responsible for monitoring the Group’s compliance with applicable laws and
regulations including:
ensuring that management is reviewing developments and changes in applicable laws and
regulations relating to the Group’s responsibilities
reviewing management’s actions and responses to ensure that the Group’s practices are
compliant with all new developments
reviewing material actual and suspected breaches of applicable laws and regulations, and any
breaches of Group policies
reviewing material litigation, legal claims, contingencies or significant risks relating to the
Group; and
reviewing Director and executive management related party transactions.
Major issues and findings that are presented and discussed at the Committee meetings are reported
to the Board by the Audit and Risk Committee.
Corporate reporting
The Board has required management to design and implement a risk management and internal
control system to manage the Group’s material business risks and to report on whether those risks
are being effectively managed.

Example listed public financial statements 34 For the year ended 31 December 2014
© 2014 Grant Thornton Australia Ltd. All rights reserved.
The Managing Director, Chief Executive Officer and Chief Financial Officer have reported and
declared in writing to the Board as to the effectiveness of the Group’s management of its material
business risks, in accordance with Recommendation 7.2 of the ASX Corporate Governance
Principles.
The Board has received the relevant declarations from the Managing Director, Chief Executive
Officer and Chief Financial Officer in accordance with s295A of the Corporations Act 2001 and the
relevant assurances required under Recommendation 7.3 of the ASX Corporate Governance
Principles.
Principle 8: Remunerate fairly and responsibly
Nomination and Remuneration Committee
As previously stated in Principle 2, the Board has established a Nomination and Remuneration
Committee whose role is documented in a Charter which is approved by the Board.
The objective of the Committee with respect to its remuneration function is to assist the Board in
determining appropriate remuneration arrangements for the Directors and Executive management.
These objectives include:
reviewing the adequacy and form of remuneration of Independent Non-Executive Directors
ensuring that the remuneration of the Independent Non-Executive Directors is reflective of
the responsibilities and the risks of being a Director of the Group
reviewing the contractual arrangements of the Managing Director and the executive
management team including their remuneration
comparing the remuneration of the Managing Director and executive management to
comparable groups within similar industries to ensure that the remuneration on offer can
attract, retain and properly reward performance which will translate into long term growth in
shareholder value
annually review key performance indicators of the Managing Director and Executive Team to
ensure that they remain congruent with the Group’s strategies and objectives
reviewing the basis for remuneration of other Executive Directors of the Group for their
services as Directors
reviewing incentive performance arrangements when instructed by the Board; and
reviewing proposed remuneration arrangements for new Director or Executive
appointments.
The Committee will submit their recommendations to the Board regarding the remuneration
arrangements and performance incentives for the Managing Director and Executive Team. The
Board will review these recommendations before providing their approval.
Details of the Group’s remuneration structure and details of Senior Executives’ remuneration and
incentives are set out in the Remuneration Report contained within the Directors’ Report. The
Remuneration Report also contains details on the structure of Non-Executive Director
Remuneration.

Example listed public financial statements 35 For the year ended 31 December 2014
© 2014 Grant Thornton Australia Ltd. All rights reserved.
Checklist of Corporate Governance Principles and Recommendations
Principles and Recommendations Compliance
Principle 1: Lay solid foundations for management and oversight
1.1 Establish the functions reserved to the Board and those delegated to Senior Executives and disclose those functions.
1.2 Disclose the process for evaluating the performance of Senior Executives.
1.3 Provide the information indicated in Guide to reporting on Principle 1.
Principle 2: Structure the Board to add value
2.1 A majority of the Board should be Independent Directors.
2.2 The Chair should be an Independent Director.
2.3 The roles of the Chair and Chief Executive Officer should not be exercised by the same individual.
2.4 The Board should establish a Nomination Committee.
2.5 Disclose the process for evaluating the performance of the Board, its Committees, and individual Directors.
2.6 Provide the information indicated in Guide to reporting on Principle 2.
Principle 3: Promote ethical and responsible decision-making
3.1 Establish a code of conduct and disclose the code or a summary of the code as to:
• the practices necessary to maintain confidence in Company ’s integrity
• the practice necessary to take into account their legal obligations and the reasonable expectations of stakeholders; and
• the responsibility and accountability of individuals for reporting and investigating reports of unethical practices
3.2 Companies should establish a policy concerning diversity and disclose the policy or a summary of that policy. The policy should include requirements for the Board to establish measurable objectives for achieving gender diversity for the Board to assess annually both the objectives and the progress in achieving them.
3.3 Companies should disclose in each Annual Report the measurable objectives for achieving gender diversity set by the Board in accordance with the diversity policy and progress towards achieving them.
3.4 Companies should disclose in each Annual Report the proportion of women employees in the whole organisation, women in senior executive positions and women on the Board.
3.5 Provide the information indicated in Guide to reporting on Principle 3.
Principle 4: Safeguard integrity in financial reporting
4.1 The Board should establish an Audit Committee.
4.2 Structure the Audit Committee so that it:
• consists only of Non-Executive Directors
• consists of a majority of Independent Directors
• is chaired by an Independent Chair, who is not the Chair of the Board; and
• has at least three (3) members
4.3 The Audit Committee should have a formal charter.
4.4 Provide the information indicated in Guide to Reporting on Principle 4.
Principle 5: Make timely and balanced disclosure
5.1 Establish written policies and procedures designed to ensure compliance with ASX Listing Rule disclosure requirements and to ensure accountability at a Senior Executive level for that compliance and disclose those policies or a summary of those policies.
5.2 Provide the information indicated in Guide to Reporting on Principle 5.
Principle 6: Respect the rights of shareholders
6.1 Design a Communications Policy for promoting effective communication with shareholders and encouraging their participation at General Meetings and disclose the policy or a summary of the policy.
6.2 Provide the information indicated in Guide to reporting on Principle 6.
Principle 7: Recognise and manage risk
7.1 Establish policies for the oversight and management of material business risks and disclose a summary of those policies.
7.2 The Board should require management to design and implement the risk management and internal control system to manage the Company’s material business risks and report to it on whether those risks are being managed effectively. The Board should disclose that management has reported to it as to the effectiveness of the Company’s management of its material business risks.

Example listed public financial statements 36 For the year ended 31 December 2014
© 2014 Grant Thornton Australia Ltd. All rights reserved.
Principles and Recommendations Compliance
7.3 The Board should disclose whether it has received assurance from the Chief Executive Officer (or equivalent) and the Chief Financial Officer (or equivalent) that the declaration provided in accordance with section 295A of the Corporations Act is founded on a sound system of risk management and internal control and that the system is operating effectively in all material respects in relation to financial reporting risks.
7.4 Provide the information indicated in Guide to Reporting on Principle 7.
Principle 8: Remunerate fairly and responsibly
8.1 The Board should establish a remuneration committee.
8.2 The remuneration committee should be structured so that it:
consists of a majority of Independent Directors
is chaired by an Independent Chair
has at least three (3) members
8.3 Clearly distinguish the structure of Non-Executive Directors’ remuneration from that of Executive Directors and Senior Executives.
8.4 Provide the information indicated in Guide to Reporting on Principle 8.

Example listed public financial statements 37 For the year ended 31 December 2014
© 2014 Grant Thornton Australia Limited. All rights reserved.
Page intentionally left blank.
Example listed public financial statements 38 For the year ended 31 December 2014
© 2014 Grant Thornton Australia Limited. All rights reserved.
Guidance Note: Consolidated Statement of Profit or Loss and Other Comprehensive Income
AASB 101 Presentation of Financial Statements permits the statement of profit or loss and other comprehensive income to be presented:
in a single statement of profit or loss and other comprehensive income, or
in two statements: a statement of profit or loss and a statement of comprehensive income
The example financial statements illustrate a statement of profit or loss and other comprehensive
(ie a single statement). A two statement presentation is shown in Appendix B.
This statement of profit or loss and other comprehensive income format illustrates an example of the
‘nature of expense method’. See Appendix A for a format illustrating the ‘function of expense’ or
‘cost of sales’ method.
This statement of profit or loss and other comprehensive income presents an ‘operating profit’
subtotal, which is commonly seen but is not required or defined in AASB’s. Where this subtotal is
provided, the figure disclosed should include items that would normally be considered to be
operating. It is inappropriate to exclude items clearly related to operations (eg inventory write-downs
and restructuring and relocation expenses) on the basis that they do not occur regularly or are
unusual in amount (see AASB 101 Basis for Conclusions, paragraph 56).
This statement of profit or loss and other comprehensive income includes an amount representing
the entity’s share of profit from equity accounted investments. This amount represents profit after
tax and non-controlling interest in those investments (as indicated in the Illustrative Financial
Statement Structure in AASB 101).
AASB 101 requires the entity to disclose reclassification adjustments and related tax effects relating to
components of other comprehensive income either on the face of the statement or in the notes.
In this example, the entity presents reclassification adjustments and current year gains and losses
relating to other comprehensive income on the face of the statement of profit or loss and other
comprehensive income (AASB 101.92). An entity may instead present reclassification adjustments in
the notes, in which case the components of other comprehensive income are presented after any
related reclassification adjustments (AASB 101.94).
According to AASB 101.90, an entity shall disclose the amount of income tax relating to each
component of other comprehensive income either on the face of the statement of profit or loss and
other comprehensive income or in the notes. In this example, the entity presents components of
other comprehensive income before tax, with one amount shown for the aggregate amount of
income tax relating to all components of other comprehensive income (AASB 101.91(b)).
Alternatively, the entity may present each component of other comprehensive income net of related
tax effects (AASB 101.91(a)). If the tax effects of each component of other comprehensive income
are not presented on the face of the statement, this information shall be presented in the notes (see
Note 20.2).

Example listed public financial statements 39 For the year ended 31 December 2014
© 2014 Grant Thornton Australia Limited. All rights reserved.
Consolidated Statement of Profit or Loss and
Other Comprehensive Income
For the year ended 31 December 2014
Notes 2014 2013
AASB 101.51(c) $’000 $’000
AASB 101.51(d-e) Revenue 5 205,793 191,228
AASB 101.85 Other income 427 641
AASB 101.85 Changes in inventories (7,923) (5,623)
AASB 101.85 Costs of materials (42,434) (40,485)
AASB 101.85 Employee benefits expense 22 (113,809) (109,515)
AASB 101.85 Change in fair value of investment property 16 310 175
AASB 101.85 Depreciation of property, plant and equipment 15 (2,735) (3,575)
AASB 101.85 Amortisation of intangible assets 19 (3,528) (3,501)
AASB 101.85 Impairment of goodwill 18 (799) (190)
AASB 101.85 Impairment of other intangible assets 19 (870) -
AASB 101.85 Other expenses (12,878) (10,061)
21,554 19,094
AASB 101.82(c) Share of net profit from associates and joint ventures accounted for using the equity method 14 391 141
AASB 101.82(b) Finance costs 6 (1,490) (1,876)
AASB 101.85 Finance income 6 994 793
AASB 101.85 Other financial items 7 943 1,182
Profit before income tax 22,392 19,334
AASB 101.82(d) Income tax expense 8 (6,910) (5,763)
Profit for the year from continuing operations 15,482 13,571
AASB 101.82(ea) Loss for the year from discontinued operations 9 (9) (325)
AASB.101.82(f) Profit for the year 15,473 13,246
AASB.101.82(g) Other comprehensive income:
AASB 101.82A Items that will not be reclassified subsequently to profit or loss:
AASB.116.77(f) Revaluation of land 15 303 -
AASB 119.120(c) Re-measurement of net defined benefit liability 22 3,830 (3,541)
AASB 101.91 Income tax on items that will not be reclassified to profit or loss 24 (1,240) 1,062
AASB 101.82A Items that may be reclassified subsequently to profit or loss
Cash flow hedging: 12
AASB 7.23(c-d) Current year gains / (losses) 367 (47)
AASB 101.92 Reclassification to profit or loss 260 (425)
Available-for-sale financial assets: 12
AASB 7.20(a)(ii) Current year gains / (losses) 113 35
AASB 101.92 Reclassification to profit or loss (50) -
AASB 121.52(b) Exchange differences on translating foreign operations (664) (341)
AASB 101.82(h) Share of other comprehensive income of equity accounted investments 2 -
AASB 101.91 Income tax on items that may be reclassified to profit or loss 24 176 95
Other comprehensive income for the period, net of tax 3,097 (3,162)
AASB 101.82(i) Total comprehensive income for the period 18,570 10,084
Note: This statement should be read in conjunction with the notes to the financial statements.

Example listed public financial statements 40 For the year ended 31 December 2014
© 2014 Grant Thornton Australia Limited. All rights reserved.
Consolidated Statement of Profit or Loss and
Other Comprehensive Income
For the year ended 31 December 2014
Notes 2014 2013
$’000 $’000
Profit for the year attributable to:
AASB 101.83(a)(i) non-controlling interest 121 116
AASB 101.83(a)(ii) owners of the Parent 15,352 13,130
15,473 13,246
Total comprehensive income attributable to:
AASB 101.83(b)(i) non-controlling interest 121 116
AASB 101.83(b)(ii) owners of the Parent 18,449 9,968
18,570 10,084
AASB 5.33(d) Total comprehensive income attributable to owners of the Parent:
continuing operations 18,458 10,293
discontinued operations (9) (325)
18,449 9,968
Notes 2014 2013
$ $
Earnings per share 25
AASB 133.67A Basic earnings per share:
AASB 133.66 earnings from continuing operations 1.22 1.14
AASB 133.68 loss from discontinued operations (0.00) (0.03)
AASB 133.66 Total 1.22 1.11
AASB 133.67A Diluted earnings per share:
AASB 133.66 earnings from continuing operations 1.22 1.14
AASB 133.68 loss from discontinued operations (0.00) (0.03)
AASB 133.66 Total 1.22 1.11
Note: This statement should be read in conjunction with the notes to the financial statements.
Example listed public financial statements 41 For the year ended 31 December 2014
© 2014 Grant Thornton Australia Limited. All rights reserved.
Guidance Note: Consolidated Statement of Financial Position
The statement of financial position complies with AASB 101 Presentation of Financial Statements.
If the entity:
i applies an accounting policy retrospectively
ii makes a retrospective restatement of items in its financial statements for correction of material
errors; or
iii reclassifies items in the financial statements;
the entity shall present a statement of financial position as at the beginning of the earliest comparative
period, ie an extra comparative statement of financial position at, for example, 1 January 2013
(AASB 101.10(f) and AASB 101.39).
Grant Thornton CLEARR Example Ltd has included a third Statement of Financial Position to
reflect the Group’s correction of a prior period error.
The statement of financial position includes a current / non-current distinction. When presentation
based on liquidity is reliable and more relevant, the entity can choose to present the statement of
financial position in order of liquidity (AASB 101.60). The entity will then not present a current /
non-current distinction in the statement of financial position. However the disclosure requirements
for amounts expected to be recovered or settled before or after twelve (12) months must still be
applied (AASB 101.61).
These Example Consolidated Financial Statements use the terminology in AASB 101; however an entity
may use other titles (eg balance sheet) for the primary financial statements (AASB 101.10).

Example listed public financial statements 42 For the year ended 31 December 2014
© 2014 Grant Thornton Australia Limited. All rights reserved.
Consolidated Statement of Financial Position
As at 31 December 2014
Note 2014 2013 1-Jan-13
$'000 $'000 $'000
AASB 101.51(c) Assets
AASB 101.60, AASB 101.66 Current
AASB 101.54(i) Cash and cash equivalents 10 34,729 11,197 9,987
AASB 101.54(h) Trade and other receivables 11 33,629 25,406 20,719
AASB 101.54(d) Other short-term financial assets 12 655 649 631
AASB 101.54(g) Inventories 13 18,298 17,226 18,571
AASB 101.55 Derivative financial instruments 12 582 212 490
AASB 101.54(n) Current tax assets - 337 -
87,893 55,027 50,398
AASB 101.54(j) Assets and disposal group classified as held for sale 9 103 3,908 -
AASB 101.60 Total Current Assets 87,996 58,935 50,398
AASB 101.60, AASB 101.66 Non-Current
AASB 101.54(e), AASB 128.38 Investments accounted for using the equity method 14 860 467 104
AASB 101.54(a) Property, plant and equipment 15 22,199 20,397 20,746
AASB 101.54(b) Investment property 16 12,662 12,277 12,102
AASB 101.54(d) Other long-term financial assets 12 3,765 3,880 4,327
AASB 101.54(o), AASB 101.56 Deferred tax assets 17 - 901 852
AASB 101.57 Goodwill 18 5,041 3,537 1,234
AASB 101.54(c) Other intangible assets 19 17,424 13,841 10,664
AASB 101.60 Total Non-Current Assets 61,951 55,300 50,029
AASB 101.55 Total Assets 149,947 114,235 100,427
Note: This statement should be read in conjunction with the notes to the financial statements.

Example listed public financial statements 43 For the year ended 31 December 2014
© 2014 Grant Thornton Australia Limited. All rights reserved.
Consolidated Statement of Financial Position
As at 31 December 2014
Note 2014 2013 1-Jan-13
AASB 101.57 $'000 $'000 $'000
AASB 101.51(c-e) Liabilities
AASB 101.60, AASB 101.69 Current
AASB 101.54(k) Trade and other payables 20 8,497 6,550 7,672
AASB 101.54(m) Borrowings 12 5,327 3,885 3,818
AASB 101.54(m) Derivative financial instruments 12 - 160 -
AASB 101.54(l) Provisions 21 1,215 3,345 4,400
AASB 101.55 Employee benefits 22 1,467 1,496 1,336
AASB 101.54(n) Current tax liabilities 3,068 - 208
AASB 101.55 Other liabilities 23 2,758 3,475 2,832
22,332 18,911 20,266
AASB 101.54(p) Liabilities included in disposal group held for sale 9 - 449 -
AASB 101.55 Current Liabilities 22,332 19,360 20,266
AASB 101.60, AASB 101.69 Non-Current
AASB 101.54(k) Trade and other payables 20 - - 4,765
AASB 101.54(m) Borrowings 12 25,060 25,724 21,405
AASB 101.55 Employee benefits 22 10,386 13,642 8,932
AASB 101.54(o), AASB 101.56 Deferred tax liabilities 17 1,907 - -
AASB 101.55 Other liabilities 23 2,020 1,500 1,600
AASB 101.55 Total Non-Current Liabilities 39,373 40,866 36,702
AASB 101.55 Total Liabilities 61,705 60,226 56,968
AASB 101.55 Net Assets 88,242 54,009 43,459
Note: This statement should be read in conjunction with the notes to the financial statements.

Example listed public financial statements 44 For the year ended 31 December 2014
© 2014 Grant Thornton Australia Limited. All rights reserved.
Consolidated Statement of Financial Position
As at 31 December 2014
Note 2014 2013 1-Jan-13
$'000 $'000 $'000
Equity
Equity attributable to owners of the Parent:
AASB 101.54(r) share capital 33,415 15,050 15,050
AASB 101.54(r) share option reserve 764 466 -
AASB 101.55 other components of equity 24 2,440 (657) 2,505
AASB 101.54(r) retained earnings 50,910 35,558 25,428
87,529 50,417 42,983
AASB 101.54(q) Non-controlling interest 713 592 476
AASB 101.55 Total Equity 88,242 51,009 43,459
Note: This statement should be read in conjunction with the notes to the financial statements.

Example listed public financial statements 45 For the year ended 31 December 2014
© 2014 Grant Thornton Australia Limited. All rights reserved.
Guidance Note: Consolidated Statement of Changes in Equity
Entities may present the required reconciliations for each component of other comprehensive
income either in the statement of changes in equity or in the notes to the financial statements
(AASB 101.106(d)(ii)and AASB 101.106A). These example financial statements present the
reconciliations for each component of other comprehensive income in the notes to the financial
statements (see Note 19.2). This reduces duplicated disclosures and presents a clearer picture of
the overall changes in equity.
AASB 2 Share-based Payment requires an entity to recognise equity-settled share-based payment
transactions as changes in equity but does not specify how this is presented, e.g. in a separate
reserve within equity or within retained earnings. In our view, either approach would be allowed
under Australian Accounting Standards. Share option reserve has been credited with an increase in
equity in this example (see also Note 4.24).

Example listed public financial statements 46 For the year ended 31 December 2014
© 2014 Grant Thornton Australia Limited. All rights reserved.
Statement of Changes in Equity
For the year ended 31 December 2014
Notes Share
Capital Share Option
Reserve
Other Components
of Equity Retained Earnings
Total Attributable to
Owners of Parent Non-Controlling
Interest Total Equity
AASB 101.51(d-e) $’000 $’000 $’000 $’000 $’000 $’000 $’000
AASB 101.106(d) Balance at 1 January 2013 15,050 - 2,505 25,363 42,918 476 43,394
AASB 101.106(b) Adjustment on error correction 3.1 - - - 65 65 - 65
AASB 101.106(d) Balance at 1 January 2013 (restated) 15,050 - 2,505 25,428 42,983 476 43,459
Employee share-based payment options 22 - 466 - - 466 - 466
AASB 101.106(d)(iii) Total Transactions with owners - 466 - - 466 - 466
Reported profit for the year - - - 13,115 13,115 116 13,231
Adjustment on error correction 3.1 - - - 15 15 - 15
AASB 101.106(d)(i) Restated profit for the year - - - 13,130 13,130 116 13,246
AASB 101.106A Other comprehensive income 24 - - (3,162) - (3,162) - (3,162)
Total comprehensive income - - (3,162) 13,130 9,968 116 10,084
AASB 101.106(d) Balance at 31 December 2013 (restated) 15,050 466 (657) 38,558 53,417 592 54,009
AASB 101.106(d) Balance at 1 January 2014 15,050 466 (657) 38,558 53,417 592 54,009
Dividends 25 - - - (3,000) (3,000) - (3,000)
Issue of share capital under share-based payment 24 1,685 - - - 1,685 - 1,685

Example listed public financial statements 47 For the year ended 31 December 2014
© 2014 Grant Thornton Australia Ltd. All rights reserved.
Notes Share
Capital Share Option
Reserve
Other Components
of Equity Retained Earnings
Total Attributable to
Owners of Parent Non-Controlling
Interest Total Equity
AASB 101.51(d-e) $’000 $’000 $’000 $’000 $’000 $’000 $’000
Employee share-based payment options 22 - 298 - - 298 - 298
Issue of share capital 24 16,680 - - - 16,680 - 16,680
AASB 101.106(d)(iii) Total transactions with owners 18,365 298 - (3,000) 15,663 - 15,663
AASB 101.106(d)(i) Profit for the year - - - 15,352 15,352 121 15,473
AASB 101.106(d)(ii) Other comprehensive income 24 - - 3,097 - 3,097 - 3,097
Total comprehensive income - - 3,097 15,352 18,449 121 18,570
AASB 101.106(d) Balance at 31 December 2014 33,415 764 2,440 50,910 87,529 713 88,242
Note: This statement should be read in conjunction with the notes to the financial statements.

Example listed public financial statements 48 For the year ended 31 December 2014
© 2014 Grant Thornton Australia Limited. All rights reserved.
Guidance Note: Consolidated Statement of Cash Flows
This format illustrates the direct method of determining operating cash flows (AASB 107.18(a)).
An entity may also determine the operating cash flows using the indirect method (AASB 107.18(b)).

Example listed public financial statements 49 For the year ended 31 December 2014
© 2014 Grant Thornton Australia Limited. All rights reserved.
Consolidated Statement of Cash Flows
For the year ended 31 December 2014
Notes 2014 2013
AASB 101.51(c-e) $’000 $’000
AASB 107.10 Operating activities
Receipts from customers 205,909 191,751
Payments to suppliers and employees (177,972) (166,020)
Income taxes paid (1,948) (5,588)
Net cash from continuing operations 25,989 20,143
Net cash (used in) / from discontinued operations 9 (22) 811
Net cash from operating activities 26 25,967 20,954
AASB 107.10 Investing activities
Purchase of property, plant and equipment (76) (3,281)
Proceeds from disposals of property, plant and equipment 86 -
Purchase of other intangible assets (3,666) (3,235)
Proceeds from disposals of other intangible assets 924 -
AASB 107.39 Acquisition of subsidiaries, net of cash 31 (15,491) (12,075)
AASB 107.39 Proceeds from sale of subsidiaries, net of cash 31 3,117 -
Proceeds from disposals and redemptions of non-derivative financial assets 228 132
AASB 107.31 Interest received 6 752 447
AASB 107.31 Dividends received 6 62 21
AASB 107.35 Taxes paid (467) (140)
Net cash used in investing activities (14,531) (18,131)
AASB 107.10 Financing activities
Proceeds from bank loans 1,441 -
Repayment of bank loans (3,778) (649)
Proceeds from issue of share capital 18,365 -
AASB 107.31 Interest paid 6 (1,015) (985)
AASB 107.31 Dividends paid 25 (3,000) -
Net cash from / (used in) financing activities 12,013 (1,634)
AASB 107.45 Net change in cash and cash equivalents 23,449 1,189
Cash and cash equivalents, beginning of year 11,219 9,987
AASB 107.28 Exchange differences on cash and cash equivalents 61 43
34,729 11,219
Included in disposal group 9 - (22)
AASB 107.45 Cash and cash equivalents, end of year 10 34,729 11,197
Note: This statement should be read in conjunction with the notes to the financial statements.
Example listed public financial statements 50 For the year ended 31 December 2014
© 2014 Grant Thornton Australia Limited. All rights reserved.
Notes to the Consolidated Financial
Statements6
1 Nature of operations
Grant Thornton CLEARR Example Ltd and subsidiaries’ (the Group) principal activities include
the development, consulting, sale and service of customised IT and telecommunication systems.
These activities are grouped into the following service lines:
consulting - focused on the design and sale of phone and intranet based in-house
applications; customisation and integration of IT and telecommunications systems
service - provides after-sale service and maintenance of IT and telecommunication systems;
and
retail - involved in the online sales of hardware and software products of the Group’s
business partners.
2 General information and statement of compliance
The consolidated general purpose financial statements of the Group have been prepared in
accordance with the requirements of the Corporations Act 2001, Australian Accounting Standards and
other authoritative pronouncements of the Australian Accounting Standards Board (‘AASB’).
Compliance with Australian Accounting Standards results in full compliance with the International
Financial Reporting Standards (‘IFRS’) as issued by the International Accounting Standards Board
(‘IASB’). Grant Thornton CLEARR Example Ltd is a for-profit entity for the purpose of preparing
the financial statements.
Grant Thornton CLEARR Example Ltd is the Group’s Ultimate Parent Company. Grant Thornton
CLEARR Example Ltd is a Public Company incorporated and domiciled in Australia. The address
of its registered office and its principal place of business is 149a Great Place, 40237 Greatville,
Australia.
The consolidated financial statements for the year ended 31 December 2014 were approved and
authorised for issue by the Board of Directors on 28 February 2015.
6 The example notes to the financial statements only include disclosures that are relevant to the fictitious entity, being Grant Thornton CLEARR
Example Ltd. Australian Accounting Standards may require additional disclosures in other circumstances. The disclosures should be tailored in all cases to reflect the entity’s specific facts and circumstances, based on a comprehensive and up to date disclosure checklist.
AASB 101.51(a) AASB 101.51(b)
AASB 101.138(b)
AAASB 1054.7-9 AAASB 101.16 AAASB 1054.8(b)
AASB 101.138(a) AASB 101.138(c)
AASB 101.51(c) AASB 110.17
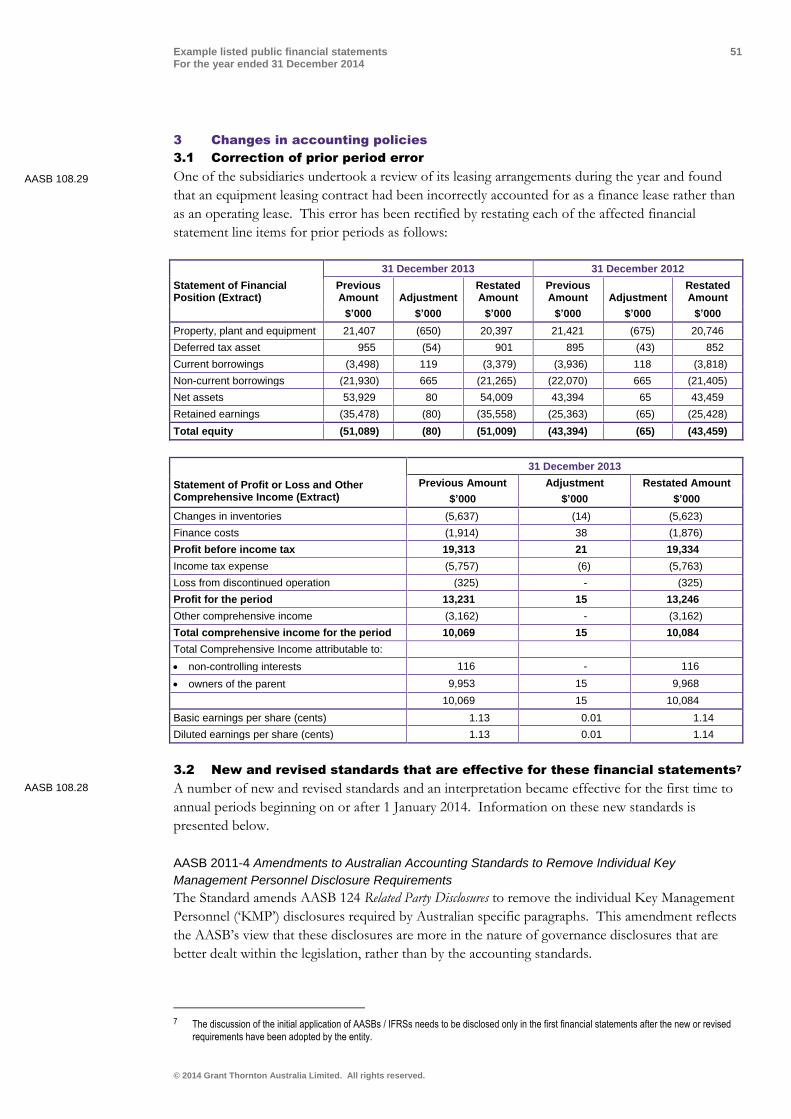
Example listed public financial statements 51 For the year ended 31 December 2014
© 2014 Grant Thornton Australia Limited. All rights reserved.
3 Changes in accounting policies
3.1 Correction of prior period error
One of the subsidiaries undertook a review of its leasing arrangements during the year and found
that an equipment leasing contract had been incorrectly accounted for as a finance lease rather than
as an operating lease. This error has been rectified by restating each of the affected financial
statement line items for prior periods as follows:
31 December 2013 31 December 2012
Statement of Financial Position (Extract)
Previous Amount Adjustment
Restated Amount
Previous Amount Adjustment
Restated Amount
$’000 $’000 $’000 $’000 $’000 $’000
Property, plant and equipment 21,407 (650) 20,397 21,421 (675) 20,746
Deferred tax asset 955 (54) 901 895 (43) 852
Current borrowings (3,498) 119 (3,379) (3,936) 118 (3,818)
Non-current borrowings (21,930) 665 (21,265) (22,070) 665 (21,405)
Net assets 53,929 80 54,009 43,394 65 43,459
Retained earnings (35,478) (80) (35,558) (25,363) (65) (25,428)
Total equity (51,089) (80) (51,009) (43,394) (65) (43,459)
31 December 2013
Statement of Profit or Loss and Other Comprehensive Income (Extract)
Previous Amount Adjustment Restated Amount
$’000 $’000 $’000
Changes in inventories (5,637) (14) (5,623)
Finance costs (1,914) 38 (1,876)
Profit before income tax 19,313 21 19,334
Income tax expense (5,757) (6) (5,763)
Loss from discontinued operation (325) - (325)
Profit for the period 13,231 15 13,246
Other comprehensive income (3,162) - (3,162)
Total comprehensive income for the period 10,069 15 10,084
Total Comprehensive Income attributable to:
non-controlling interests 116 - 116
owners of the parent 9,953 15 9,968
10,069 15 10,084
Basic earnings per share (cents) 1.13 0.01 1.14
Diluted earnings per share (cents) 1.13 0.01 1.14
3.2 New and revised standards that are effective for these financial statements7
A number of new and revised standards and an interpretation became effective for the first time to
annual periods beginning on or after 1 January 2014. Information on these new standards is
presented below.
AASB 2011-4 Amendments to Australian Accounting Standards to Remove Individual Key
Management Personnel Disclosure Requirements
The Standard amends AASB 124 Related Party Disclosures to remove the individual Key Management
Personnel (‘KMP’) disclosures required by Australian specific paragraphs. This amendment reflects
the AASB’s view that these disclosures are more in the nature of governance disclosures that are
better dealt within the legislation, rather than by the accounting standards.
7 The discussion of the initial application of AASBs / IFRSs needs to be disclosed only in the first financial statements after the new or revised
requirements have been adopted by the entity.
AASB 108.29
AASB 108.28

Example listed public financial statements 52 For the year ended 31 December 2014
© 2014 Grant Thornton Australia Ltd. All rights reserved.
In mid-2013, the Australian government passed Corporations and Related Legislation Amendment
Regulation 2013 (No.1) and Corporations and Australian Securities and Investments Commission Amendment
Regulation 2013 (No. 1) to insert these disclosures, with minor changes, into Corporations
Regulations 2001. These disclosures are required to be included in remuneration reports for
financial years commencing on or after 1 July 2013.
As a result of these amendments, the Group has transferred certain individual Key Management
Personnel disclosures relating to shareholdings, options / rights holdings, loans and other
transactions from the notes to the financial statements to the remuneration report.
AASB 2012-3 Amendments to Australian Accounting Standards – Offsetting Financial Assets and
Financial Liabilities
AASB 2012-3 adds application guidance to AASB 132 to address inconsistencies identified in
applying some of the offsetting criteria of AASB 132, including clarifying the meaning of “currently
has a legally enforceable right of set-off” and that some gross settlement systems may be considered
equivalent to net settlement.
AASB 2012-3 is applicable to annual reporting periods beginning on or after 1 January 2014.
The adoption of these amendments has not had a material impact on the Group as the amendments
merely clarify the existing requirements in AASB 132.
AASB 2013-3 Amendments to AASB 136 – Recoverable Amount Disclosures for Non-Financial
Assets
These narrow-scope amendments address disclosure of information about the recoverable amount
of impaired assets if that amount is based on fair value less costs of disposal.
When developing IFRS 13 Fair Value Measurement, the IASB decided to amend IAS 36 Impairment of
Assets to require disclosures about the recoverable amount of impaired assets. The IASB noticed
however that some of the amendments made in introducing those requirements resulted in the
requirement being more broadly applicable than the IASB had intended. These amendments to
IAS 36 therefore clarify the IASB’s original intention that the scope of those disclosures is limited to
the recoverable amount of impaired assets that is based on fair value less costs of disposal.
AASB 2013-3 makes the equivalent amendments to AASB 136 Impairment of Assets and is applicable
to annual reporting periods beginning on or after 1 January 2014.
The adoption of these amendments has not had a material impact on the Group as they are largely
of the nature of clarification of existing requirements.
AASB 2013-5 Amendments to Australian Accounting Standards – Investment Entities
The amendments in AASB 2013-5 provide an exception to consolidation to investment entities and
require them to measure unconsolidated subsidiaries at fair value through profit or loss in
accordance with AASB 9 Financial Instruments (or AASB 139 Financial Instruments: Recognition and
Measurement where AASB 9 has not yet been adopted). The amendments also introduce new
disclosure requirements for investment entities that have subsidiaries.

Example listed public financial statements 53 For the year ended 31 December 2014
© 2014 Grant Thornton Australia Ltd. All rights reserved.
These amendments apply to investment entities, whose business purpose is to invest funds solely
for returns from capital appreciation, investment income or both. Examples of entities which might
qualify as investment entities would include Australian superannuation entities, listed investment
companies, pooled investment trusts and Federal, State and Territory fund management authorities.
AASB 2013-5 is applicable to annual reporting periods beginning on or after 1 January 2014.
This Standard has not had any impact on the Group as it does not meet the definition of an
‘investment entity’ in order to apply this consolidation exception.
AASB Interpretation 21 Levies
Interpretation 21 addresses how an entity should account for liabilities to pay levies imposed by
governments, other than income taxes, in its financial statements (in particular, when the entity
should recognise a liability to pay a levy).
Interpretation 21 is an interpretation of AASB 137 Provisions, Contingent Liabilities and Contingent Assets.
AASB 137 sets out criteria for the recognition of a liability, one of which is the requirement for the
entity to have a present obligation as a result of a past event (known as an obligating event). The
Interpretation clarifies that the obligating event that gives rise to a liability to pay a levy is the activity
described in the relevant legislation that triggers the payment of the levy. For example, if the activity
that triggers the payment of the levy is the generation of revenue in the current period, and the
calculation of that levy is based on the revenue that was generated in a previous period, the
obligating event for that levy is the generation of revenue in the current period. The generation of
revenue in the previous period is necessary, but not sufficient, to create a present obligation.
The Interpretation is applicable to annual reporting periods beginning on or after 1 January 2014.
The adoption of this interpretation has not had any impact on the Group as it is not subject to any
such levies addressed by the interpretation.
3.3 Accounting Standards issued but not yet effective and not been adopted
early by the Group
Refer to the latest Grant Thornton TA Alert on accounting standards issued but not yet effective,
available on our website: http://www.grantthornton.com.au/Publications/Tools-and-
resources/Technical-publications/Local_Alerts.asp).
4 Summary of accounting policies
4.1 Overall considerations
The consolidated financial statements have been prepared using the significant accounting policies
and measurement bases summarised below.
AASB 108.30, 31
AASB 101.114(b) AASB 101.117(b)

Example listed public financial statements 54 For the year ended 31 December 2014
© 2014 Grant Thornton Australia Limited. All rights reserved.
4.2 Basis of consolidation
The Group financial statements consolidate those of the Parent Company and all of its subsidiaries
as of 31 December 2014. The Parent controls a subsidiary if it is exposed, or has rights, to variable
returns from its involvement with the subsidiary and has the ability to affect those returns through
its power over the subsidiary. All subsidiaries have a reporting date of 31 December.
All transactions and balances between Group companies are eliminated on consolidation, including
unrealised gains and losses on transactions between Group companies. Where unrealised losses on
intra-group asset sales are reversed on consolidation, the underlying asset is also tested for
impairment from a group perspective. Amounts reported in the financial statements of subsidiaries
have been adjusted where necessary to ensure consistency with the accounting policies adopted by
the Group.
Profit or loss and other comprehensive income of subsidiaries acquired or disposed of during the
year are recognised from the effective date of acquisition, or up to the effective date of disposal, as
applicable.
Non-controlling interests, presented as part of equity, represent the portion of a subsidiary’s profit
or loss and net assets that is not held by the Group. The Group attributes total comprehensive
income or loss of subsidiaries between the owners of the parent and the non-controlling interests
based on their respective ownership interests.
4.3 Business combination
The Group applies the acquisition method in accounting for business combinations. The
consideration transferred by the Group to obtain control of a subsidiary is calculated as the sum of
the acquisition-date fair values of assets transferred, liabilities incurred and the equity interests issued
by the Group, which includes the fair value of any asset or liability arising from a contingent
consideration arrangement. Acquisition costs are expensed as incurred.
The Group recognises identifiable assets acquired and liabilities assumed in a business combination
regardless of whether they have been previously recognised in the acquiree’s financial statements
prior to the acquisition. Assets acquired and liabilities assumed are generally measured at their
acquisition-date fair values.
Goodwill is stated after separate recognition of identifiable intangible assets. It is calculated as the
excess of the sum of: (a) fair value of consideration transferred, (b) the recognised amount of any
non-controlling interest in the acquire, and (c) acquisition-date fair value of any existing equity
interest in the acquiree, over the acquisition-date fair values of identifiable net assets. If the fair
values of identifiable net assets exceed the sum calculated above, the excess amount (ie gain on a
bargain purchase) is recognised in profit or loss immediately.
4.4 Investments in associates and joint arrangements
Associates are those entities over which the Group is able to exert significant influence but which
are not subsidiaries.
AASB 101.117 AASB 10.6 AASB 10.B92 AASB 101.51(b),(c) AASB 10.B86(c)
AASB 10.B88
AASB 10.22 AASB 10.B94
AASB 101.117(a) AASB 101.117(b)
AASB 128.3

Example listed public financial statements 55 For the year ended 31 December 2014
© 2014 Grant Thornton Australia Limited. All rights reserved.
A joint venture is an arrangement that the Group controls jointly with one or more other investors,
and over which the Group has rights to a share of the arrangement’s net assets rather than direct
rights to underlying assets and obligations for underlying liabilities. A joint arrangement in which
the Group has direct rights to underlying assets and obligations for underlying liabilities is classified
as a joint operation.
Investments in associates and joint ventures are accounted for using the equity method. Interests in
joint operations are accounted for by recognising the Group’s assets (including its share of any
assets held jointly), its liabilities (including its share of any liabilities incurred jointly), its revenue
from the sale of its share of the output arising from the joint operation, its share of the revenue
from the sale of the output by the joint operation and its expenses (including its share of any
expenses incurred jointly).
Any goodwill or fair value adjustment attributable to the Group’s share in the associate or joint
venture is not recognised separately and is included in the amount recognised as investment.
The carrying amount of the investment in associates and joint ventures is increased or decreased to
recognise the Group’s share of the profit or loss and other comprehensive income of the associate
and joint venture, adjusted where necessary to ensure consistency with the accounting policies of the
Group.
Unrealised gains and losses on transactions between the Group and its associates and joint ventures
are eliminated to the extent of the Group’s interest in those entities. Where unrealised losses are
eliminated, the underlying asset is also tested for impairment.
4.5 Foreign currency translation
Functional and presentation currency
The consolidated financial statements are presented in Australian dollars (‘$AUD’), which is also the
functional currency of the Parent Company.
Foreign currency transactions and balances
Foreign currency transactions are translated into the functional currency of the respective Group
entity, using the exchange rates prevailing at the dates of the transactions (spot exchange rate).
Foreign exchange gains and losses resulting from the settlement of such transactions and from the
re-measurement of monetary items at year end exchange rates are recognised in profit or loss.
Non-monetary items are not retranslated at year-end and are measured at historical cost (translated
using the exchange rates at the date of the transaction), except for non-monetary items measured at
fair value which are translated using the exchange rates at the date when fair value was determined.
Foreign operations
In the Group’s financial statements, all assets, liabilities and transactions of Group entities with a
functional currency other than the $AUD are translated into $AUD upon consolidation. The
functional currency of the entities in the Group has remained unchanged during the reporting
period.
AASB 11.15-16
AASB 128.10
AASB 11.24
AASB 121.53 AASB 101.51(d)
AASB 101.117(a) AASB 101.117(b)
Example listed public financial statements 56 For the year ended 31 December 2014
© 2014 Grant Thornton Australia Limited. All rights reserved.
On consolidation, assets and liabilities have been translated into $AUD at the closing rate at the
reporting date. Goodwill and fair value adjustments arising on the acquisition of a foreign entity
have been treated as assets and liabilities of the foreign entity and translated into $AUD at the
closing rate. Income and expenses have been translated into AUD at the average rate8 over the
reporting period. Exchange differences are charged or credited to other comprehensive income and
recognised in the currency translation reserve in equity. On disposal of a foreign operation the
cumulative translation differences recognised in equity are reclassified to profit or loss and
recognised as part of the gain or loss on disposal.
4.6 Segment reporting
The Group has three operating segments: consulting, service and retain segments. In identifying its
operating segments, management generally follows the Group’s service lines, which represent the
main products and services provided by the Group (see Note 1).
The activities undertaken by the consulting segment includes the sale, customisation and integration
of IT and telecommunication systems. Maintenance of these systems is undertaken by the service
segment. The retail segment includes the entire Group’s internet-based selling activities of hardware
and software products.
Each of these operating segments is managed separately as each of these service lines requires
different technologies and other resources as well as marketing approaches. All inter-segment
transfers are carried out at arm's length prices.
The measurement policies the Group uses for segment reporting under AASB 8 are the same as
those used in its financial statements, except that:
post-employment benefit expenses
expenses relating to share-based payments
research costs relating to new business activities; and
revenue, costs and fair value gains from investment property.
are not included in arriving at the operating profit of the operating segments. In addition, corporate
assets which are not directly attributable to the business activities of any operating segment are not
allocated to a segment. In the financial periods under review, this primarily applies to the Group’s
headquarters and the Illustrative Research Lab in Greatville.
There have been no changes from prior periods in the measurement methods used to determine
reported segment profit or loss.
4.7 Revenue
Revenue arises from the sale of goods and the rendering of services plus the Group’s share of
revenue of its joint ventures. It is measured by reference to the fair value of consideration received
or receivable, excluding sales taxes, rebates, and trade discounts.
8 Note that the use of average rates is appropriate only if rates do not fluctuate significantly (AASB 121.40).
AASB 121.47,48
AASB 8.22(a)
AASB 8.22(b)
AASB 8.27(a)
AASB 8.27(b-d)
AASB 8.27(e)

Example listed public financial statements 57 For the year ended 31 December 2014
© 2014 Grant Thornton Australia Ltd. All rights reserved.
The Group often enters into sales transactions involving a range of the Group’s products and
services, for example for the delivery of hardware, software and related after-sales service. The
Group applies the revenue recognition criteria set out below to each separately identifiable
component of the sales transaction in order to reflect the substance of the transaction. The
consideration received from these multiple-component transactions are allocated to the separately
identifiable component in proportion to its relative fair value.
Sale of goods (hardware or software)
Sale of goods is recognised when the Group has transferred to the buyer the significant risks and
rewards of ownership, generally when the customer has taken undisputed delivery of the goods.
Revenue from the sale of goods with no significant service obligation is recognised on delivery.
Where significant tailoring, modification or integration is required, revenue is recognised in the same
way as construction contracts for telecommunication systems described below.
When goods are sold together with customer loyalty incentives, the consideration receivable is
allocated between the sale of goods and sale of incentives based on their fair values. Revenue from
sales of incentives is recognised when incentives are redeemed by customers in exchange for
products supplied by the Group.
Rendering of services
The Group generates revenues from after-sales service and maintenance, consulting, and
construction contracts for telecommunication solutions. Consideration received for those services
is initially deferred, included in other liabilities and is recognised as revenue in the period when the
service is performed.
In recognising after-sales service and maintenance revenues, the Group considers the nature of the
services and the customer’s use of the related products, based on historical experience. Revenue
from consulting services is recognised when the services are provided by reference to the contract’s
stage of completion at the reporting date in the same way as construction contracts for
telecommunication systems described below.
The Group also earns rental income from operating leases of its investment properties (see
Note 16). Rental income is recognised on a straight-line basis over the term of the lease.
Construction contracts for telecommunication solutions
Construction contracts for telecommunication systems specify a fixed price for the development
and installation of IT and telecommunication systems.
When the outcome can be assessed reliably, contract revenue and associated costs are recognised by
reference to the stage of completion of the contract activity at the reporting date. Revenue is
measured at the fair value of consideration received or receivable in relation to that activity.
When the Group cannot measure the outcome of a contract reliably, revenue is recognised only to
the extent of contract costs that have been incurred and are recoverable. Contract costs are
recognised in the period in which they are incurred.
In either situation, when it is probable that total contract costs will exceed total contract revenue,
the expected loss is recognised immediately in profit or loss.
AASB 101.117(b)
AASB 101.117(b)
AASB 101.117(b)
AASB 111.39(b) AASB 118.35(a)

Example listed public financial statements 58 For the year ended 31 December 2014
© 2014 Grant Thornton Australia Ltd. All rights reserved.
A construction contract’s stage of completion is assessed by management based on milestones
(usually defined in the contract) for the activities to be carried out under the contract and other
available relevant information at the reporting date. The maximum amount of revenue to be
recognised for each milestone is determined by estimating relative contract fair values of each
project phase (ie by comparing the Group’s overall contract revenue with the expected profit for
each corresponding milestone). Progress and related contract revenue in-between milestones is
determined by comparing costs incurred to date with the total estimated costs for that particular
milestone (a procedure sometimes referred to as the cost-to-cost method).
The gross amount due from customers for contract work is presented within trade and other
receivables for all contracts in progress for which costs incurred plus recognised profits (less
recognised losses) exceed progress billings. The gross amount due to customers for contract work
is presented within other liabilities for all contracts in progress for which progress billings exceed
costs incurred plus recognised profits (less recognised losses).
Interest and dividend income
Interest income and expenses are reported on an accrual basis using the effective interest method.
Dividends, other than those from investments in associates, are recognised at the time the right to
receive payment is established.
4.8 Operating expenses
Operating expenses are recognised in profit or loss upon utilisation of the service or at the date of
their origin. Expenditure for warranties is recognised and charged against the associated provision
when the related revenue is recognised.
4.9 Borrowing costs
Borrowing costs directly attributable to the acquisition, construction or production of a qualifying
asset are capitalised during the period of time that is necessary to complete and prepare the asset for
its intended use or sale. Other borrowing costs are expensed in the period in which they are
incurred and reported in finance costs (see Note 6).
4.10 Profit or loss from discontinued operations
A discontinued operation is a component of the entity that either has been disposed of, or is
classified as held for sale, and:
represents a separate major line of business or geographical area of operations
is part of a single co-ordinated plan to dispose of a separate major line of business or
geographical area of operations; or
is a subsidiary acquired exclusively with a view to re-sale.
Profit or loss from discontinued operations, including prior year components of profit or loss, are
presented in a single amount in the statement of profit or loss and other comprehensive income.
This amount, which comprises the post-tax profit or loss of discontinued operations and the post-
tax gain or loss resulting from the measurement and disposal of assets classified as held for sale (see
also Note 4.21), is further analysed in Note 9.
The disclosures for discontinued operations in the prior year relate to all operations that have been
discontinued by the reporting date for the latest period presented.
AASB 101.117(a) AASB 111.39(c) AASB 101.122
AASB 118.30
AASB 101.117(b)
AASB 101.117(b)
AASB 101.117(b) AASB 5.32
AASB 5.33
AASB 5.34

Example listed public financial statements 59 For the year ended 31 December 2014
© 2014 Grant Thornton Australia Ltd. All rights reserved.
4.11 Goodwill
Goodwill represents the future economic benefits arising from a business combination that are not
individually identified and separately recognised. See Note 4.3 for information on how goodwill is
initially determined. Goodwill is carried at cost less accumulated impairment losses. Refer to
Note 4.15 for a description of impairment testing procedures.
4.12 Other intangible assets
Recognition of other intangible assets
Acquired intangible assets
Acquired computer software licences are capitalised on the basis of the costs incurred to acquire and
install the specific software. Brand names and customer lists acquired in a business combination
that qualify for separate recognition are recognised as intangible assets at their fair values (see
Note 4.3).
Internally developed software
Expenditure on the research phase of projects to develop new customised software for IT and
telecommunication systems is recognised as an expense as incurred.
Costs that are directly attributable to a project’s development phase are recognised as intangible
assets, provided they meet the following recognition requirements:
the development costs can be measured reliably
the project is technically and commercially feasible
the Group intends to and has sufficient resources to complete the project
the Group has the ability to use or sell the software; and
the software will generate probable future economic benefits.
Development costs not meeting these criteria for capitalisation are expensed as incurred.
Directly attributable costs include employee (other than Directors) costs incurred on software
development along with an appropriate portion of relevant overheads and borrowing costs.
Subsequent measurement
All intangible assets, including capitalised internally developed software, are accounted for using the
cost model whereby capitalised costs are amortised on a straight-line basis over their estimated
useful lives, as these assets are considered finite. Residual values and useful lives are reviewed at
each reporting date. In addition, they are subject to impairment testing as described in Note 4.15.
The following useful lives are applied:
software: 3-5 years
brand names: 15-20 years
customer lists: 4-6 years.
Any capitalised internally developed software that is not yet complete is not amortised but is subject
to impairment testing as described in Note 4.15.
Amortisation has been included within depreciation, amortisation and impairment of non-financial
assets.
AASB 138.118(a) AASB 138.118(b) AASB 101.117(b)
AASB 138.57 AASB 101.117(b)
AASB 138.118(a) AASB 138.118(b)
AASB 138.118(d)
Example listed public financial statements 60 For the year ended 31 December 2014
© 2014 Grant Thornton Australia Ltd. All rights reserved.
Subsequent expenditures on the maintenance of computer software and brand names are expensed
as incurred.
When an intangible asset is disposed of, the gain or loss on disposal is determined as the difference
between the proceeds and the carrying amount of the asset, and is recognised in profit or loss within
other income or other expenses.
4.13 Property, plant and equipment
Land
Land held for use in production or administration is stated at re-valued amounts. Re-valued
amounts are fair market values based on appraisals prepared by external professional valuers once
every two years or more frequently if market factors indicate a material change in fair value. Any
revaluation surplus arising upon appraisal of land is recognised in other comprehensive income and
credited to the revaluation reserve in equity. To the extent that any revaluation decrease or
impairment loss (see Note 4.15) has previously been recognised in profit or loss, a revaluation
increase is credited to profit or loss with the remaining part of the increase recognised in other
comprehensive income. Downward revaluations of land are recognised upon appraisal or
impairment testing, with the decrease being charged to other comprehensive income to the extent of
any revaluation surplus in equity relating to this asset and any remaining decrease recognised in
profit or loss. Any revaluation surplus remaining in equity on disposal of the asset is transferred to
retained earnings.
As no finite useful life for land can be determined, related carrying amounts are not depreciated.
Buildings, IT equipment and other equipment
Buildings, IT equipment and other equipment (comprising fittings and furniture) are initially
recognised at acquisition cost or manufacturing cost, including any costs directly attributable to
bringing the assets to the location and condition necessary for it to be capable of operating in the
manner intended by the Group’s management. Buildings and IT equipment also include leasehold
property held under a finance lease (see Note 4.14). Buildings, IT equipment and other equipment
are subsequently measured using the cost model, cost less subsequent depreciation and impairment
losses.
Depreciation is recognised on a straight-line basis to write down the cost less estimated residual
value of buildings, IT equipment and other equipment. The following useful lives are applied:
buildings: 25-50 years
IT equipment: 2-5 years
other equipment: 3-12 years.
In the case of leasehold property, expected useful lives are determined by reference to comparable
owned assets or over the term of the lease, if shorter.
Material residual value estimates and estimates of useful life are updated as required, but at least
annually.
Gains or losses arising on the disposal of property, plant and equipment are determined as the
difference between the disposal proceeds and the carrying amount of the assets and are recognised
in profit or loss within other income or other expenses.
AASB 101.117(b)
AASB 116.73(a) AASB 116.73(c) AASB 101.117
AASB 116.73(b)
AASB 116.73(a) AASB 101.117(a)
AASB 116.73(b) AASB 116.73(c)

Example listed public financial statements 61 For the year ended 31 December 2014
© 2014 Grant Thornton Australia Ltd. All rights reserved.
4.14 Leased assets
Finance leases
The economic ownership of a leased asset is transferred to the lessee if the lessee bears substantially
all the risks and rewards of ownership of the leased asset. Where the Group is a lessee in this type
of arrangement, the related asset is recognised at the inception of the lease at the fair value of the
leased asset or, if lower, the present value of the lease payments plus incidental payments, if any. A
corresponding amount is recognised as a finance lease liability. Leases of land and buildings are
classified separately and are split into a land and a building element, in accordance with the relative
fair values of the leasehold interests at the date the asset is recognised initially.
See Note 4.13 for the depreciation methods and useful lives for assets held under finance lease. The
corresponding finance lease liability is reduced by lease payments net of finance charges. The
interest element of lease payments represents a constant proportion of the outstanding capital
balance and is charged to profit or loss, as finance costs over the period of the lease.
Operating leases
All other leases are treated as operating leases. Where the Group is a lessee, payments on operating
lease agreements are recognised as an expense on a straight-line basis over the lease term.
Associated costs, such as maintenance and insurance, are expensed as incurred.
4.15 Impairment testing of goodwill, other intangible assets and property, plant
and equipment
For impairment assessment purposes, assets are grouped at the lowest levels for which there are
largely independent cash inflows (cash-generating units). As a result, some assets are tested
individually for impairment and some are tested at cash-generating unit level. Goodwill is allocated
to those cash-generating units that are expected to benefit from synergies of the related business
combination and represent the lowest level within the Group at which management monitors
goodwill.
Cash-generating units to which goodwill has been allocated (determined by the Group’s
management as equivalent to its operating segments) are tested for impairment at least annually. All
other individual assets or cash-generating units are tested for impairment whenever events or
changes in circumstances indicate that the carrying amount may not be recoverable.
An impairment loss is recognised for the amount by which the asset’s or cash-generating unit’s
carrying amount exceeds its recoverable amount, which is the higher of fair value less costs to sell
and value-in-use. To determine the value-in-use, management estimates expected future cash flows
from each cash-generating unit and determines a suitable interest rate in order to calculate the
present value of those cash flows. The data used for impairment testing procedures are directly
linked to the Group’s latest approved budget, adjusted as necessary to exclude the effects of future
reorganisations and asset enhancements. Discount factors are determined individually for each
cash-generating unit and reflect management’s assessment of respective risk profiles, such as market
and asset-specific risks factors.
AASB 101.117(a) AASB 101.117(b)
AASB 101.117(b)
AASB 101.122 AASB 101.117(a)

Example listed public financial statements 62 For the year ended 31 December 2014
© 2014 Grant Thornton Australia Ltd. All rights reserved.
Impairment losses for cash-generating units reduce first the carrying amount of any goodwill
allocated to that cash-generating unit. Any remaining impairment loss is charged pro rata to the
other assets in the cash-generating unit. With the exception of goodwill, all assets are subsequently
reassessed for indications that an impairment loss previously recognised may no longer exist. An
impairment charge is reversed if the cash-generating unit’s recoverable amount exceeds its carrying
amount.
4.16 Investment property
Investment properties are properties held to earn rentals and/or for capital appreciation, and are
accounted for using the fair value model.
Investment properties are re-valued annually and are included in the statement of financial position
at their open market value. These values are supported by market evidence and are determined by
external professional valuers with sufficient experience with respect to both the location and the
nature of the investment property.
Any gain or loss resulting from either a change in the fair value or the sale of an investment property
is immediately recognised in profit or loss within change in fair value of investment property.
Rental income and operating expenses from investment property are reported within revenue and
other expenses respectively, and are recognised as described in Notes 4.7 and 4.8.
4.17 Financial instruments
Recognition, Initial Measurement and Derecognition
Financial assets and financial liabilities are recognised when the Group becomes a party to the
contractual provisions of the financial instrument, and are measured initially at fair value adjusted by
transactions costs, except for those carried at fair value through profit or loss, which are measured
initially at fair value. Subsequent measurement of financial assets and financial liabilities are
described below.
Financial assets are derecognised when the contractual rights to the cash flows from the financial
asset expire, or when the financial asset and all substantial risks and rewards are transferred. A
financial liability is derecognised when it is extinguished, discharged, cancelled or expires.
Classification and Subsequent Measurement of Financial Assets
For the purpose of subsequent measurement, financial assets other than those designated and
effective as hedging instruments are classified into the following categories upon initial recognition:
loans and receivables
financial assets at Fair Value Through Profit or Loss (‘FVTPL’)
Held-To-Maturity (‘HTM’) investments; or
Available-For-Sale (‘AFS’) financial assets.
All financial assets except for those at FVTPL are subject to review for impairment at least at each
reporting date to identify whether there is any objective evidence that a financial asset or a group of
financial assets is impaired. Different criteria to determine impairment are applied for each category
of financial assets, which are described below.
AASB 140.75(a)
AASB 140.75(a) AASB 140.75(d) AASB 140.75(e)
AASB 101.117(b)
AASB 7.21 AASB 101.117(b)
AASB 101.117(b)
AASB 101.117(a)
AASB 7.B5(f)

Example listed public financial statements 63 For the year ended 31 December 2014
© 2014 Grant Thornton Australia Ltd. All rights reserved.
All income and expenses relating to financial assets that are recognised in profit or loss are
presented within finance costs, finance income or other financial items, except for impairment of
trade receivables which is presented within other expenses.
Loans and receivables
Loans and receivables are non-derivative financial assets with fixed or determinable payments that
are not quoted in an active market. After initial recognition, these are measured at amortised cost
using the effective interest method, less provision for impairment. Discounting is omitted where
the effect of discounting is immaterial. The Group's cash and cash equivalents, trade and most
other receivables fall into this category of financial instruments.
Individually significant receivables are considered for impairment when they are past due or when
other objective evidence is received that a specific counterparty will default. Receivables that are not
considered to be individually impaired are reviewed for impairment in groups, which are determined
by reference to the industry and region of a counterparty and other shared credit risk characteristics.
The impairment loss estimate is then based on recent historical counterparty default rates for each
identified group.
Financial assets at FVTPL
Financial assets at FVTPL include financial assets that are either classified as held for trading or that
meet certain conditions and are designated at FVTPL upon initial recognition. All derivative
financial instruments fall into this category, except for those designated and effective as hedging
instruments, for which the hedge accounting requirements apply (see below).
Assets in this category are measured at fair value with gains or losses recognised in profit or loss.
The fair values of financial assets in this category are determined by reference to active market
transactions or using a valuation technique where no active market exists.
HTM investments
HTM investments are non-derivative financial assets with fixed or determinable payments and fixed
maturity other than loans and receivables. Investments are classified as HTM if the Group has the
intention and ability to hold them until maturity. The Group currently holds listed bonds
designated into this category.
HTM investments are measured subsequently at amortised cost using the effective interest method.
If there is objective evidence that the investment is impaired, determined by reference to external
credit ratings, the financial asset is measured at the present value of estimated future cash flows.
Any changes to the carrying amount of the investment, including impairment losses, are recognised
in profit or loss.
AFS financial assets
AFS financial assets are non-derivative financial assets that are either designated to this category or
do not qualify for inclusion in any of the other categories of financial assets. The Group’s AFS
financial assets include listed securities and debentures, and the equity investment in XY Ltd.
The equity investment in XY Ltd is measured at cost less any impairment charges, as its fair value
cannot currently be estimated reliably. Impairment charges are recognised in profit or loss.
AASB 101.117(a) AASB 101.117(b)
AASB 7.B5(f)
AASB 101.117(a) AASB 101.117(b) Also: AASB 7.B5(a)
AASB 7.B5(e)
AASB 101.117(a) AASB 101.117(b)
AASB 7.B5(f)
AASB 101.117(a) AASB 101.117(b) AASB 7.B5(b)

Example listed public financial statements 64 For the year ended 31 December 2014
© 2014 Grant Thornton Australia Ltd. All rights reserved.
All other AFS financial assets are measured at fair value. Gains and losses are recognised in other
comprehensive income and reported within the AFS reserve within equity, except for impairment
losses and foreign exchange differences on monetary assets, which are recognised in profit or loss.
When the asset is disposed of or is determined to be impaired the cumulative gain or loss recognised
in other comprehensive income is reclassified from the equity reserve to profit or loss and presented
as a reclassification adjustment within other comprehensive income. Interest calculated using the
effective interest method and dividends are recognised in profit or loss within ‘finance income’ (see
Note 4.7).
Reversals of impairment losses for AFS debt securities are recognised in profit or loss if the reversal
can be objectively related to an event occurring after the impairment loss was recognised. For AFS
equity investments impairment reversals are not recognised in profit loss and any subsequent
increase in fair value is recognised in other comprehensive income.
Classification and subsequent measurement of financial liabilities
The Group’s financial liabilities include borrowings, trade and other payables and derivative financial
instruments.
Financial liabilities are measured subsequently at amortised cost using the effective interest method,
except for financial liabilities held for trading or designated at FVTPL, that are carried subsequently
at fair value with gains or losses recognised in profit or loss. All derivative financial instruments that
are not designated and effective as hedging instruments are accounted for at FVTPL.
The Group has designated some financial liabilities at FVTPL to reduce significant measurement
inconsistencies between investment properties in the United States and related US-dollar bank loans
with fixed interest rates. These investment properties are measured using the fair value model (see
Note 4.16), where changes in fair value of these assets are recognised in profit or loss. The fair
value of loans used to finance these assets correlates significantly with the valuation of the
investment properties held by the Group, because both measures are highly reactive to the market
interest rate for thirty-year government bonds. The loans are managed and evaluated on a fair value
basis through a quarterly management review in comparison with the property valuations.
Therefore, the Group designates such fixed interest rate loans as at FVTPL if they are secured by
specific investment property assets that are held by the Group. This accounting policy reduces
significantly what would otherwise be an accounting mismatch.
All interest-related charges and, if applicable, changes in an instrument’s fair value that are reported
in profit or loss are included within finance costs or finance income.
Derivative financial instruments and hedge accounting
Derivative financial instruments are accounted for at FVTPL except for derivatives designated as
hedging instruments in cash flow hedge relationships, which requires a specific accounting
treatment. To qualify for hedge accounting, the hedging relationship must meet several strict
conditions with respect to documentation, probability of occurrence of the hedged transaction and
hedge effectiveness.
For the reporting periods under review, the Group has designated certain forward currency
contracts as hedging instruments in cash flow hedge relationships. These arrangements have been
entered into to mitigate currency exchange risk arising from certain legally binding sales and
purchase orders denominated in foreign currency.
AASB 101.117(a) AASB 101.117(b)
AASB 101.117(b)
AASB 101.117(a)
AASB 101.117(a) AASB 7.B5(a)
AASB 101.117(b)
AASB 101.117(b)
AASB 7.22(a) AASB 7.22(c)

Example listed public financial statements 65 For the year ended 31 December 2014
© 2014 Grant Thornton Australia Ltd. All rights reserved.
All derivative financial instruments used for hedge accounting are recognised initially at fair value
and reported subsequently at fair value in the statement of financial position.
To the extent that the hedge is effective, changes in the fair value of derivatives designated as
hedging instruments in cash flow hedges are recognised in other comprehensive income and
included within the cash flow hedge reserve in equity. Any ineffectiveness in the hedge relationship
is recognised immediately in profit or loss.
At the time the hedged item affects profit or loss, any gain or loss previously recognised in other
comprehensive income is reclassified from equity to profit or loss and presented as a reclassification
adjustment within other comprehensive income. However, if a non-financial asset or liability is
recognised as a result of the hedged transaction, the gains and losses previously recognised in other
comprehensive income are included in the initial measurement of the hedged item.
If a forecast transaction is no longer expected to occur any related gain or loss recognised in other
comprehensive income is transferred immediately to profit or loss. If the hedging relationship
ceases to meet the effectiveness conditions, hedge accounting is discontinued and the related gain or
loss is held in the equity reserve until the forecast transaction occurs.
4.18 Inventories
Inventories are stated at the lower of cost and net realisable value. Cost includes all expenses
directly attributable to the manufacturing process as well as suitable portions of related production
overheads, based on normal operating capacity. Costs of ordinarily interchangeable items are
assigned using the first in, first out cost formula. Net realisable value is the estimated selling price in
the ordinary course of business less any applicable selling expenses.
4.19 Income taxes
Tax expense recognised in profit or loss comprises the sum of deferred tax and current tax not
recognised in other comprehensive income or directly in equity.
Current income tax assets and / or liabilities comprise those obligations to, or claims from, the
Australian Taxation Office (‘ATO’) and other fiscal authorities relating to the current or prior
reporting periods that are unpaid at the reporting date. Current tax is payable on taxable profit,
which differs from profit or loss in the financial statements. Calculation of current tax is based on
tax rates and tax laws that have been enacted or substantively enacted by the end of the reporting
period.
Deferred income taxes are calculated using the liability method on temporary differences between
the carrying amounts of assets and liabilities and their tax bases. However, deferred tax is not
provided on the initial recognition of goodwill or on the initial recognition of an asset or liability
unless the related transaction is a business combination or affects tax or accounting profit. Deferred
tax on temporary differences associated with investments in subsidiaries and joint ventures is not
provided if reversal of these temporary differences can be controlled by the Group and it is
probable that reversal will not occur in the foreseeable future.
Deferred tax assets and liabilities are calculated, without discounting, at tax rates that are expected to
apply to their respective period of realisation, provided they are enacted or substantively enacted by
the end of the reporting period.
AASB 101.117(a)
AASB 101.117(b)
AASB 102.36(a) AASB 101.117(a)
AASB 101.117(a) AASB 101.117(b)
AASB 101.117(a)

Example listed public financial statements 66 For the year ended 31 December 2014
© 2014 Grant Thornton Australia Ltd. All rights reserved.
Deferred tax assets are recognised to the extent that it is probable that they will be able to be utilised
against future taxable income, based on the Group’s forecast of future operating results which is
adjusted for significant non-taxable income and expenses and specific limits to the use of any
unused tax loss or credit. Deferred tax liabilities are always provided for in full.
Deferred tax assets and liabilities are offset only when the Group has a right and intention to set off
current tax assets and liabilities from the same taxation authority.
Changes in deferred tax assets or liabilities are recognised as a component of tax income or expense
in profit or loss, except where they relate to items that are recognised in other comprehensive
income (such as the revaluation of land) or directly in equity, in which case the related deferred tax
is also recognised in other comprehensive income or equity, respectively.
Grant Thornton CLEARR Example Ltd and its wholly-owned Australian controlled entities have
implemented the tax consolidation legislation. As a consequence, these entities are taxed as a single
entity and the deferred tax assets and liabilities of these entities are set off in the consolidated
financial statements.
4.20 Cash and cash equivalents
Cash and cash equivalents comprise cash on hand and demand deposits, together with other short-
term, highly liquid investments that are readily convertible into known amounts of cash and which
are subject to an insignificant risk of changes in value.
4.21 Non-current assets and liabilities classified as held for sale and
discontinued operations
When the Group intends to sell a non-current asset or a group of assets (a disposal group), and if
sale within twelve (12) months is highly probable, the asset or disposal group is classified as ‘held for
sale’ and presented separately in the statement of financial position. Liabilities are classified as ‘held
for sale’ and presented as such in the statement of financial position if they are directly associated
with a disposal group.
Assets classified as ‘held for sale’ are measured at the lower of their carrying amounts immediately
prior to their classification as held for sale and their fair value less costs to sell. However, some
‘held for sale’ assets such as financial assets or deferred tax assets, continue to be measured in
accordance with the Group's accounting policy for those assets. Once classified as ‘held for sale’,
the assets are not subject to depreciation or amortisation.
Any profit or loss arising from the sale or re-measurement of discontinued operations is presented
as part of a single line item, profit or loss from discontinued operations (see Note 4.10).
4.22 Equity, reserves and dividend payments
Share capital represents the fair value of shares that have been issued. Any transaction costs
associated with the issuing of shares are deducted from share capital, net of any related income tax
benefits.
AASB 101.122
AASB 101.117(b)
UIG1052(16)(a)
AASB 107.46
AASB 101.117(a)
AASB 101.117(b)
AASB 101.79(b)

Example listed public financial statements 67 For the year ended 31 December 2014
© 2014 Grant Thornton Australia Ltd. All rights reserved.
Other components of equity include the following:
revaluation reserve – comprises gains and losses from the revaluation of land (see Note 4.13)
net defined benefit liability – comprises the actuarial losses from changed in demographic and financial assumptions and the return on plan assets (see Note 4.23)
foreign currency translation reserve – comprises foreign currency translation differences arising on the translation of financial statements of the Group’s foreign entities into AUD (see Note 4.5)
AFS financial assets and cash-flow hedge reserves – comprises gains and losses relating to these types of financial instruments (see Note 4.17).
Retained earnings include all current and prior period retained profits.
Dividend distributions payable to equity shareholders are included in other liabilities when the
dividends have been approved in a general meeting prior to the reporting date.
All transactions with owners of the parent are recorded separately within equity.
4.23 Employee benefits
Short-term employee benefits
Short-term employee benefits are benefits, other than termination benefits, that are expected to be
settled wholly within twelve (12) months after the end of the period in which the employees render
the related service. Examples of such benefits include wages and salaries, non-monetary benefits
and accumulating sick leave. Short-term employee benefits are measured at the undiscounted
amounts expected to be paid when the liabilities are settled.
Other long-term employee benefits
The Group’s liabilities for annual leave and long service leave are included in other long term
benefits as they are not expected to be settled wholly within twelve (12) months after the end of the
period in which the employees render the related service. They are measured at the present value of
the expected future payments to be made to employees. The expected future payments incorporate
anticipated future wage and salary levels, experience of employee departures and periods of service,
and are discounted at rates determined by reference to market yields at the end of the reporting
period on government bonds that have maturity dates that approximate the timing of the estimated
future cash outflows. Any re-measurements arising from experience adjustments and changes in
assumptions are recognised in profit or loss in the periods in which the changes occur.
The Group presents employee benefit obligations as current liabilities in the statement of financial
position if the Group does not have an unconditional right to defer settlement for at least twelve
(12) months after the reporting period, irrespective of when the actual settlement is expected to take
place.
Post-employment Benefit Plans
The Group provides post-employment benefits through various defined contribution and defined
benefit plans.
AASB 119.11
AASB 119.8, 155, 156
AASB 101.69(d)

Example listed public financial statements 68 For the year ended 31 December 2014
© 2014 Grant Thornton Australia Ltd. All rights reserved.
Defined Contribution Plans
The Group pays fixed contributions into independent entities in relation to several state plans and
insurance for individual employees. The Group has no legal or constructive obligations to pay
contributions in addition to its fixed contributions, which are recognised as an expense in the period
that relevant employee services are received.
Defined Benefit Plans
Under the Group’s Defined Benefit Plans, the amount of pension benefit that an employee will
receive on retirement is defined by reference to the employee’s length of service and final salary.
The legal obligation for any benefits remains with the Group, even if plan assets for funding the
Defined Benefit Plan have been set aside. Plan assets may include assets specifically designated to a
long-term benefit fund as well as qualifying insurance policies.
The liability recognised in the statement of financial position for Defined Benefit Plans is the
present value of the Defined Benefit Obligation (‘DBO’) at the reporting date less the fair value of
plan assets.
Management estimates the DBO annually with the assistance of independent actuaries. This is
based on standard rates of inflation, salary growth and mortality. Discount rates are determined by
reference to market yields at the end of the reporting periods on government bonds that have terms
to maturity approximating to the terms of the related pension liability.
Re-measurement gains and losses arising from experience adjustments and changes in actuarial
assumptions are recognised directly in other comprehensive income. They are included as a
separate component of equity in the statement of financial position and in the statement of changes
in equity.
Service cost on the net defined benefit liability is included in employee benefits expense. Net
interest expense on the net defined benefit liability is included in finance costs.
4.24 Share-based employee remuneration
The Group operates equity-settled share-based remuneration plans for its employees. None of the
Group’s plans feature any options for a cash settlement.
All goods and services received in exchange for the grant of any share-based payment are measured
at their fair values. Where employees are rewarded using share-based payments, the fair values of
employees’ services are determined indirectly by reference to the fair value of the equity instruments
granted. This fair value is appraised at the grant date and excludes the impact of non-market vesting
conditions (for example profitability and sales growth targets and performance conditions).
All share-based remuneration is ultimately recognised as an expense in profit or loss with a
corresponding credit to share option reserve. If vesting periods or other vesting conditions apply,
the expense is allocated over the vesting period, based on the best available estimate of the number
of share options expected to vest.
AASB 101.117(a)
AASB 119.57(d)
AASB 119.103
AASB 101.117(b)
AASB 101.117(a)
Example listed public financial statements 69 For the year ended 31 December 2014
© 2014 Grant Thornton Australia Ltd. All rights reserved.
Non-market vesting conditions are included in assumptions about the number of options that are
expected to become exercisable. Estimates are subsequently revised if there is any indication that
the number of share options expected to vest differs from previous estimates. Any cumulative
adjustment prior to vesting is recognised in the current period. No adjustment is made to any
expense recognised in prior periods if share options ultimately exercised are different to that
estimated on vesting.
Upon exercise of share options, the proceeds received net of any directly attributable transaction
costs are allocated to share capital.
4.25 Provisions, contingent liabilities and contingent assets
Provisions for product warranties, legal disputes, onerous contracts or other claims are recognised
when the Group has a present legal or constructive obligation as a result of a past event, it is
probable that an outflow of economic resources will be required from the Group and amounts can
be estimated reliably. Timing or amount of the outflow may still be uncertain.
Restructuring provisions are recognised only if a detailed formal plan for the restructuring has been
developed and implemented, or management has at least announced the plan’s main features to
those affected by it. Provisions are not recognised for future operating losses.
Provisions are measured at the estimated expenditure required to settle the present obligation, based
on the most reliable evidence available at the reporting date, including the risks and uncertainties
associated with the present obligation. Where there are a number of similar obligations, the
likelihood that an outflow will be required in settlement is determined by considering the class of
obligations as a whole. Provisions are discounted to their present values, where the time value of
money is material.
Any reimbursement that the Group can be virtually certain to collect from a third party with respect
to the obligation is recognised as a separate asset. However, this asset may not exceed the amount
of the related provision.
No liability is recognised if an outflow of economic resources as a result of present obligation is not
probable. Such situations are disclosed as contingent liabilities, unless the outflow of resources is
remote in which case no liability is recognised.
4.26 Goods and Services Tax (GST)
Revenues, expenses and assets are recognised net of the amount of GST, except where the amount
of GST incurred is not recoverable from the Tax Office. In these circumstances the GST is
recognised as part of the cost of acquisition of the asset or as part of an item of the expense.
Receivables and payables in the statement of financial position are shown inclusive of GST.
Cash flows are presented in the statement of cash flows on a gross basis, except for the GST
components of investing and financing activities, which are disclosed as operating cash flows.
4.27 Rounding of amounts
The Parent Entity has applied the relief available to it under ASIC Class Order 98/100 and
accordingly, amounts in the financial statements and directors’ report have been rounded off to the
nearest $1,000, or in certain cases, the nearest dollar.
AASB 101.117(b)
AASB 101.117(a)
AASB 101.117(a)
Interpretation 1031
ASIC Class Order 98/100 AASB 101.51(e)

Example listed public financial statements 70 For the year ended 31 December 2014
© 2014 Grant Thornton Australia Ltd. All rights reserved.
4.28 Significant management judgement in applying accounting policies
When preparing the financial statements, management undertakes a number of judgements,
estimates and assumptions about the recognition and measurement of assets, liabilities, income and
expenses.
Significant management judgement
The following are significant management judgements in applying the accounting policies of the
Group that have the most significant effect on the financial statements.
Recognition of service and construction contract revenue
Determining when to recognise revenues from after-sales services requires an understanding of the
customer’s use of the related products, historical experience and knowledge of the market.
Recognising construction contract revenue also requires significant judgment in determining
milestones, actual work performed and the estimated costs to complete the work (see Note 4.7).
Capitalisation of internally developed software
Distinguishing the research and development phases of a new customised software project and
determining whether the recognition requirements for the capitalisation of development costs are
met requires judgement. After capitalisation, management monitors whether the recognition
requirements continue to be met and whether there are any indicators that capitalised costs may be
impaired (see Note 4.12).
Recognition of deferred tax assets
The extent to which deferred tax assets can be recognised is based on an assessment of the
probability of the Group’s future taxable income against which the deferred tax assets can be
utilised. In addition, significant judgement is required in assessing the impact of any legal or
economic limits or uncertainties in various tax jurisdictions (see Note 4.19).
Control assessment
See Note 32.1.
Estimation uncertainty
Information about estimates and assumptions that have the most significant effect on recognition
and measurement of assets, liabilities, income and expenses is provided below. Actual results may
be substantially different.
Impairment
In assessing impairment, management estimates the recoverable amount of each asset or cash-
generating unit based on expected future cash flows and uses an interest rate to discount them.
Estimation uncertainty relates to assumptions about future operating results and the determination
of a suitable discount rate (see Note 4.15). In 2014, the Group recognised an impairment loss on
goodwill (see Note 18) and internally generated software (see Note 19).
Useful lives of depreciable assets
Management reviews its estimate of the useful lives of depreciable assets at each reporting date,
based on the expected utility of the assets. Uncertainties in these estimates relate to technical
obsolescence that may change the utility of certain software and IT equipment.
AASB 101.122
AASB 101.125

Example listed public financial statements 71 For the year ended 31 December 2014
© 2014 Grant Thornton Australia Ltd. All rights reserved.
Inventories
Management estimates the net realisable values of inventories, taking into account the most reliable
evidence available at each reporting date. The future realisation of these inventories may be affected
by future technology or other market-driven changes that may reduce future selling prices.
Business combinations
Management uses valuation techniques in determining the fair values of the various elements of a
business combination (see Note 4.3). Particularly, the fair value of contingent consideration is
dependent on the outcome of many variables that affect future profitability (see Note 31.1).
Construction contract revenue
Recognised amounts of construction contract revenues and related receivables reflect management’s
best estimate of each contract’s outcome and stage of completion. This includes the assessment of
the profitability of on-going construction contracts and the order backlog. For more complex
contracts in particular, costs to complete and contract profitability are subject to significant
estimation uncertainty (see Note 4.7).
Defined Benefit Liability (DBO)
Management’s estimate of the DBO is based on a number of critical underlying assumptions such as
standard rates of inflation, medical cost trends, mortality, discount rate and anticipation of future
salary increases. Estimation uncertainties exist particularly with regard to the assumed medical cost
trends. Variation in these assumptions may significantly impact the DBO amount and the annual
defined benefit expenses (as analysed in Note 22.3).
Fair value of financial instruments
Management uses valuation techniques to determine the fair value of financial instruments (where
active market quotes are not available) and non-financial assets. This involves developing estimates
and assumptions consistent with how market participants would price the instrument. Management
bases its assumptions on observable data as far as possible but this is not always available. In that
case management uses the best information available. Estimated fair values may vary from the
actual prices that would be achieved in an arm’s length transaction at the reporting date (see
Note 35).
5 Segment reporting
Management currently identifies the Group’s three (3) service lines as its operating segments (see
Note 4.6). These operating segments are monitored by the Group’s chief operating decision maker
and strategic decisions are made on the basis of adjusted segment operating results9.
In addition, two (2) minor operating segments are combined into a segment called ‘other’. The
main source of revenue for other segment is the sale and disposal of used IT equipment that the
Group collects from its customers.
9 AASB 8 requires the amount of each operating segment item to be disclosed using the measures reported to the chief operating decision
maker (ie based on internal management information). The disclosures in the example financial statements are therefore based on substantial assumptions (eg there is no measure of segment liabilities regularly reported to the chief operating decision maker), and so cannot be viewed as the only acceptable way of providing segment disclosures. It is therefore important to emphasise that segment reporting should be tailored on the basis of the entity’s internal management reporting.
AASB 8.22(a)
AASB 8.16

Example listed public financial statements 72 For the year ended 31 December 2014
© 2014 Grant Thornton Australia Ltd. All rights reserved.
Segment information for the reporting period is as follows:
Consulting Service Retail Other Total
2014 2014 2014 2014 2014
$’000 $’000 $’000 $’000 $’000
Revenue
AASB 8.23(a) From external customers 110,810 18,140 72,098 4,079 205,127
Discontinued operations - - 9,803 - 9,803
AASB 8.23(b) From other segments 231 - - - 231
Segment revenues 111,041 18,140 81,901 4,079 215,161
Changes in inventories (4,694) - (3,129) - (7,823)
AASB 8.23(f) Costs of material (17,468) (5,442) (22,040) (1,397) (46,347)
Employee benefits expense (54,224) (10,863) (46,359) (2,447) (113,893)
AASB 8.23(e) Depreciation and amortisation of non-financial assets (3,388) (555) (2,205) (125) (6,273)
AASB 136.129(a) Impairment of non-financial assets (1,669) - - - (1,669)
Other expenses (9,446) (30) (1,333) (10) (10,819)
AASB 8.23 Segment operating profit 20,152 1,250 6,835 100 28,337
AASB 8.23 Segment assets 2013 68,103 11,149 44,311 2,507 126,070
Consulting Service Retail Other Total
2013 2013 2013 2013 2013
$’000 $’000 $’000 $’000 $’000
Revenue
From external customers 109,302 17,832 59,310 4,121 190,565
Discontinued operations - - 11,015 - 11,015
From other segments 110 - - - 110
Segment revenues 109,412 17,832 70,325 4,121 201,690
Changes in inventories (3,344) - (2,229) - (5,573)
Costs of materials (18,516) (5,350) (19,197) (1,319) (44,383)
Employee benefits expense (56,277) (10,498) (38,997) (2,473) (108,245)
Depreciation and amortisation of non-financial assets (3,585) (587) (2,332) (132) (6,636)
Impairment of non-financial assets (190) - - - (190)
Other expenses (9,203) (100) (1,761) (20) (11,084)
Segment operating profit 18,297 1,297 5,809 177 25,580
Segment assets 2013 51,615 8,450 33,583 1,900 95,458
No segment liabilities are disclosed because there is no measure of segment liabilities regularly
reported to the chief operating decision maker.

Example listed public financial statements 73 For the year ended 31 December 2014
© 2014 Grant Thornton Australia Ltd. All rights reserved.
The total presented for the Group’s operating segments reconcile to the key financial figures as
presented in its financial statements as follows:
2014 2013
$’000 $’000
AASB 8.28(a) Revenues
Total reportable segment revenues 211,082 197,569
Other segment revenues 3,679 3,756
Rental income from investment property 1,066 1,028
Discontinued operations (9,803) (11,015)
Elimination of intersegment revenues (231) (110)
Group revenues 205,793 191,228
AASB 8.28(b) Profit or loss
Total reportable segment operating profit 28,237 25,403
Other segment profit 100 177
Rental income from investment property 1,066 1,028
Change in fair value of investment property 310 175
Share-based payment expenses (298) (466)
Post-employment benefit expenses (6,099) (6,373)
Research and development costs (1,690) (1,015)
Other income not allocated 427 483
Other expenses not allocated (368) (185)
Operating profit of discontinued operations (73) (106)
Elimination of intersegment profits (58) (27)
Group operating profit 21,554 19,094
Share of profits from equity accounted investments 391 141
Finance costs (1,490) (1,876)
Finance income 994 793
Other financial items 943 1,182
Group profit before tax 22,392 19,334
AASB 8.28(c) Assets
Total reportable segment assets 123,563 93,648
Other segment assets 2,507 1,900
Group headquarters 3,967 2,073
Investment property 12,662 12,277
Illustrative Research Lab 5,101 2,665
Other assets 3,281 2,264
Consolidation (1,134) (592)
Group assets 149,947 114,235
Unallocated operating income and expense mainly consist of research expenditure as well as post-
employment benefits expenses. The Group’s corporate assets, consisting of its headquarters,
investment properties and research facility, are not allocated to any segment’s assets.
AASB 8.28

Example listed public financial statements 74 For the year ended 31 December 2014
© 2014 Grant Thornton Australia Ltd. All rights reserved.
The Group’s revenues from external customers and its non-current assets (other than financial
instruments, investments accounted for using the equity method, deferred tax assets and post-
employment benefit assets) are divided into the following geographical areas:
Revenue Non-Current Assets Revenue Non-Current Assets
2014 2014 2013 2013
AASB 8.33(a) $’000 $’000 $’000 $’000
AASB 8.33(b) Australia (Domicile) 164,102 46,053 152,452 40,242
United Kingdom 20,513 5,757 19,057 5,030
USA 18,461 5,181 17,151 4,527
Other countries 1,651 575 1,540 503
Total 204,727 57,566 190,200 50,302
Revenues from external customers in the Group’s domicile, Australia, as well as its major markets,
the United Kingdom and the USA, have been identified on the basis of the customer’s geographical
location. Non-current assets are allocated based on their physical location. The above table does
not include discontinued operations (disposal groups), for which revenue and assets can be
attributed to Australia.
During 2014, $24,744,000 or 12% (2013: $21,076,000 or 11%) of the Group’s revenues depended
on a single customer in the consulting segment.
An analysis of the Group’s revenue for each major product and service category (excluding revenue
from discontinued operations) is as follows:
2014 2013
$’000 $’000
AASB 8.32 Sale of hardware 47,585 39,145
Sale of software 24,513 20,165
Other 3,679 3,756
AASB 118.35(b)(i) Sale of goods 75,777 63,066
After-sales service and maintenance 18,140 17,832
Consulting 59,837 60,116
AASB 111.39(a) Construction contracts for telecommunications solutions 50,973 49,186
AASB 140.75(f) Rental income 1,066 1,028
AASB 118.35(b)(ii) Rendering of services 130,016 128,162
Group revenue 205,793 191,228
AASB 8.33(a)
AASB 8.34
AASB 8.32 AASB118.35(b)

Example listed public financial statements 75 For the year ended 31 December 2014
© 2014 Grant Thornton Australia Ltd. All rights reserved.
6 Finance costs and finance income
Finance costs for the reporting periods consist of the following:
2014 2013
$’000 $’000
AASB 720(b) Interest expenses for borrowings at amortised cost:
Subordinated shareholder loan 200 200
Other borrowings at amortised cost 595 555
795 755
Interest expenses for finance lease arrangements 220 230
AASB 7.20(b) Total interest expenses for financial liabilities not at FVTPL 1,015 985
AASB 123.26(a) Less: interest expenses capitalised into intangible assets (80) (78)
935 907
AASB 119.141(b) Defined Benefit Obligation interest expenses 505 549
Unwinding of discount relating to contingent consideration liability 20 -
AASB 7.20(a)(i) Loss on foreign currency financial liabilities designated at fair value through profit or loss 30 70
AASB 7.20(a) Impairment of investment in XY Ltd (AFS) - 350
1,490 1,876
Interest expenses capitalised into intangible assets were capitalised at a rate of 4.4% per annum
(2013: 4.5%).
The loss on foreign currency financial liabilities designated at FVTPL takes account of interest
payments on these loans.
An impairment loss was recognised in 2013 for the investment in XY Ltd, which is carried at cost
less impairment charges as its fair value cannot be measured reliably (see Note 12.3).
Finance income for the reporting periods consists of the following:
2014 2013
$’000 $’000
Interest income from cash and cash equivalents 583 266
AASB 7.20(b) Interest income on financial assets carried at amortised cost and AFS financial assets 169 181
AASB 7.20(b) Total interest income for financial assets not at FVTPL 752 447
AASB 118.35(b)(v) Dividend income from XY Ltd (AFS) 40 -
AASB 118.35(b)(v) Dividend income from AFS listed securities 22 21
AASB 7.20(a)(i) Fair value gains on forward exchange contracts held for trading 130 325
AASB 7.20 (a)(ii) Gains on AFS financial asses reclassified from other comprehensive income 50 -
994 793
7 Other financial items
Other financial items consist of the following:
2014 2013
$’000 $’000
AASB 7.20(a)(i) AASB 121.52(a)
Gain / (loss) from financial assets at fair value through profit and loss - classified as held-for-trading 6 18
AASB 7.20(a)(iv) Gain / (loss) from exchange differences on loans and receivables 937 1,164
943 1,182
AASB 123.26(b)
AASB 7.B5(e)
AASB 7.20(e)

Example listed public financial statements 76 For the year ended 31 December 2014
© 2014 Grant Thornton Australia Ltd. All rights reserved.
8 Income tax expense
The major components of tax expense and the reconciliation of the expected tax expense based on
the domestic effective tax rate of Grant Thornton CLEARR at 30% (2013: 30%) and the reported
tax expense in profit or loss are as follows:
2014 2013
AASB 112.81(c)(i) $’000 $’000
Profit before tax 22,392 19,334
AASB 112.85 Domestic tax rate for Grant Thornton CLEARR Example Ltd 30% 30%
Expected tax expense 6,718 5,900
AASB 112.84 Adjustment for tax-rate differences in foreign jurisdictions 16 18
AASB 112.84 Adjustment for tax-exempt income:
relating to equity accounted investments (18) (4)
other tax-exempt income (63) (117)
AASB 112.84 Adjustment for non-deductible expenses:
relating to goodwill impairment 240 57
Other non-deductible expenses 17 9
Actual tax expense / (income) 6,910 5,763
AASB 112.79, AASB 112.80 Tax expense comprises:
AASB 112.80(a) current tax expense 5,798 5,164
Deferred tax expense / (income):
AASB 112.80(c) origination and reversal of temporary differences 1,037 374
AASB 112.80 utilisation of unused tax losses 75 225
Tax expense 6,910 5,763
AASB 112.81(ab) Deferred tax expense / (income), recognised directly in other comprehensive income (1,064) (1,157)
Note 17 provides information on deferred tax assets and liabilities. Note 24.2 provides information
on deferred income tax recognised directly in each component of other comprehensive income.
9 Assets and disposal groups classified as held for sale and discontinued
operations
In the middle of 2014, management decided to discontinue in-store sale of IT and
telecommunications hardware. This decision was taken in line with the Group’s strategy to focus on
its online retail business. Consequently, assets and liabilities allocable to Highstreet Ltd and
subsidiaries (included in the retail segment) were classified as a disposal group. Revenue and
expenses, gains and losses relating to the discontinuation of this subgroup have been eliminated
from profit or loss from the Group’s continuing operations and are shown as a single line item on
the face of the statement of profit or loss and other comprehensive income (see loss for the year
from discontinued operations).
On 30 September 2014, Highstreet Ltd and subsidiaries were sold for a total of $3,117,000 in cash
resulting in a loss of $29,000 before tax primarily due to related selling costs (see Note 31.3).
AASB 5.41(a)-(d)
AASB 107.40(a)

Example listed public financial statements 77 For the year ended 31 December 2014
© 2014 Grant Thornton Australia Ltd. All rights reserved.
Operating profit of Highstreet Ltd and subsidiaries’ until the date of disposal and the profit or loss
from re-measurement and disposal of assets and liabilities classified as held for sale is summarised as
follows:
2014 2013
$’000 $’000
AASB 5.33(b)(i) Revenue 9,803 11,015
Costs of material (3,540) (3,633)
Employee benefits expense (6,100) (6,411)
Depreciation and amortisation - (765)
Other expenses (90) (100)
Operating profit 73 106
Finance costs (56) (60)
AASB 5.33(b)(ii), also Profit from discontinued operations before tax 17 46
AASB 112.81(h) Tax expense (5) (14)
Profit for year 12 32
Gain / (loss) on re-measurement and disposal
AASB 5.33(b)(iii) loss before tax on measurement to fair value less cost to sell - (510)
loss before tax on disposal (29) -
AASB 5.33(b)(iv), tax income / (expense) 8 153
AASB 112.81(h) Total gain / (loss) (21) (357)
Loss for the year from discontinued operations (9) (325)
Most of the assets and all of the liabilities have been disposed of in this transaction however the
Group continues to own some former Highstreet storage facilities. Management expects to sell
these remaining assets during 2015.
The carrying amounts of assets and liabilities in this disposal group are summarised as follows:
2014 2013
$’000 $’000
Non-current assets:
property, plant and equipment 103 2,578
deferred tax - 227
Current assets:
inventories - 1,081
cash and cash equivalents - 22
Assets classified as held for sale 103 3,908
Current liabilities:
provisions - (245)
trade and other payables - (190)
current tax liabilities - (14)
Liabilities classified as held for sale - (449)
Cash flows generated by Highstreet Ltd and subsidiaries for the reporting periods under review until
the disposal are as follows:
2014 2013
$’000 $’000
Operating activities (22) (811)
Investing activities 3,117 -
Cash flows from discontinued operations 3,095 811
AASB 5.41(b)-(d)
AASB 5.38
AASB 5.33(c)

Example listed public financial statements 78 For the year ended 31 December 2014
© 2014 Grant Thornton Australia Ltd. All rights reserved.
Cash flows from investing activities relate solely to the proceeds from the sale of Highstreet Ltd.
10 Cash and cash equivalents
Cash and cash equivalents include the following components:
Finance Lease Liabilities 2014 2013
$’000 $’000
Cash at bank and in hand:
$AUD 24,292 7,827
£GBP 2,087 674
$USD 1,392 449
Short term deposits ($AUD) 6,958 2,247
Cash and cash equivalents 34,729 11,197
Following the acquisition of Goodtech some bank deposits of the acquiree were temporarily not
available for general use by the Group because of legal restrictions. The amount of cash and cash
equivalents inaccessible to the Group as at 31 December 2014 amounts to $500,000 (2013: $Nil).
All restrictions on bank deposits were removed prior to approval of these consolidated financial
statements on 28 February 2015.
11 Trade and other receivables
Trade and other receivables consist of the following:
2014 2013
AASB 101.77 $’000 $’000
AASB 101.78(b) Trade receivables, gross 31,265 23,889
Allowance credit losses (432) (560)
Trade receivables 30,833 23,329
Receivables due from ABC Ltd 112 112
Financial assets 30,945 23,441
Social security and other taxes 1,012 676
Construction contracts for telecommunication solutions 1,374 974
Prepayments 298 315
AASB102.36(b) Non-financial assets 2,684 2,965
33,629 25,406
All amounts are short-term. The net carrying value of trade receivables is considered a reasonable
approximation of fair value.
The receivable due from ABC associates relates to the remaining consideration due on the sale of a
former subsidiary in 2012. The carrying amount of the receivable is considered a reasonable
approximation of fair value as this financial asset (which is measured at amortised cost) is expected
to be paid within six months, such that the time value of money is not significant.
All of the Group’s trade and other receivables have been reviewed for indicators of impairment.
Certain trade receivables were found to be impaired and an allowance for credit losses of $72,000
(2013: $514,000) has been recorded accordingly within other expenses. The impaired trade
receivables are mostly due from customers in the business-to-business market that are experiencing
financial difficulties.
AASB 107.45
AASB 107.48 AASB 110.19
AASB 7.25 AASB 7.29
AASB 101.60
AASB 7.37(b)

Example listed public financial statements 79 For the year ended 31 December 2014
© 2014 Grant Thornton Australia Ltd. All rights reserved.
The movement in the allowance for credit losses can be reconciled as follows:
Reconciliation of Allowance Credit Losses 2014 2013
$’000 $’000
AASB 7.16 Balance at 1 January 560 112
Amounts written off (uncollectable) (200) (66)
Impairment loss 72 514
Impairment loss reversed - -
Balance 31 December 432 560
An analysis of unimpaired trade receivables that are past due is given in Note 34.3.
11.1 Construction contracts
Revenue of $50,973,000 (2013: $49,186,000) relating to construction contract for
telecommunications solutions has been included in revenue for the current reporting period.
The amounts recognised in the statement of financial position relate to construction contracts in
progress at the end of the reporting period. The amounts are calculated as the net amounts of costs
incurred plus recognised profits, less recognised losses and progress billings. The carrying amounts
of assets and liabilities are analysed as follows:
Reconciliation of Allowance Credit Losses 2014 2013
$’000 $’000
AASB 111.40(a) Aggregate amounts of costs incurred and recognised profits and losses for all contracts in progress 3,421 3,121
Less: Progress billing (2,335) (2,354)
1,086 767
Recognised as:
AASB 111.42(a) due from customers for construction contract work, recognised in trade
and other receivables 1,374 974
AASB 111.42(b) Due to customers for construction contract work, recognised in other liabilities 288 207
Advances paid from customers for construction contracts related to work not yet performed have
been recognised in other liabilities (see Note 23) and amount to $225,000 (2013: $220,000).
Retentions on construction contracts included within trade and other receivables amount to $10,000
(2013: $Nil). Retentions will be received upon acceptance by the customer of the work performed.
12 Financial assets and liabilities
12.1 Categories of financial assets and liabilities
Note 4.17 provides a description of each category of financial assets and financial liabilities and the
related accounting policies.
AASB 7.16
AASB 111.39(a)
AASB 111.43 AASB 111.44
AASB 111.40(b)
AASB 111.40(c)
AASB 7.25

Example listed public financial statements 80 For the year ended 31 December 2014
© 2014 Grant Thornton Australia Ltd. All rights reserved.
The carrying amounts of financial assets and financial liabilities in each category are as follows:
Note AFS
Held for Trading (FVTPL)
Derivatives used for Hedging HTM
Loans and Receivables Total
$’000 $’000 $’000 $’000 $’000 $’000
(Carried at fair value) (Carried at amortised cost)
31 December 2014
Financial assets
AASB 7.8(b) Bonds 14.2 - - - 2,814 - 2,814
AASB 7.8(d) Other investments (a)
14.3 951 - - - - 951
Other long-term financial assets 951 - - 2,814 - 3,765
AASB 7.8(a)(ii) Other short-term financial assets 14.4 - 655 - - - 655
AASB 7.8(a)(ii) Derivative financial instruments 14.5 - 115 467 - - 582
AASB 7.8(c) Trade and other receivables (b)
17 - - - - 30,945 30,945
AASB 7.8(c) Cash and cash equivalents 18 - - - - 34,729 34,729
951 770 467 2,814 65,674 70,676
Note
Derivatives used for Hedging
Designated at FVTPL
Other Liabilities at FVTPL
Other Liabilities Total
$’000 $’000 $’000 $’000 $’000
(Carried at fair value) (Carried at
amortised cost)
31 December 2014
Financial liabilities
AASB 7.8(e)(i) Non-current borrowings 14.6 - 7,700 - 17,360 25,060
AASB 7.8(e)(i), AASB 7.8(f) Current borrowings 14.6 - 250 - 5,077 5,327
AASB 7.8(f) Trade and other payables 23 - - - 8,497 8,497
AASB 7.7 Derivative financial instruments 14.5 - - - - -
AASB 7.8(e)(ii) Contingent consideration 24 - - 620 - -
- 7,950 620 30,934 39,504
Note AFS
Held for Trading (FVTPL)
Derivatives used for Hedging HTM
Loans and Receivables Total
$’000 $’000 $’000 $’000 $’000 $’000
(Carried at fair value) (Carried at amortised cost)
(Restated)
31 December 2013
Financial assets AASB 7.8(b) Bonds 14.2 - - - 2,992 - 2,992
AASB 7.8(d) Other investments (a)
14.3 888 - - - - 888
Other long-term financial assets 888 - - 2,992 - 3,880
AASB 7.8(a)(ii) Other short-term financial assets 14.4 - 649 - - - 649
AASB 7.8(a)(ii) Derivative financial instruments 14.5 - 212 - - - 212
AASB 7.8(c) Trade and other receivables (b)
17 - - - - 23,441 23,441
AASB 7.8(c) Cash and cash equivalents 18 - - - - 11,197 11,197
888 861 - 2,992 34,638 39,379
(a) Includes an equity investment carried at cost less impairment charges because fair value cannot be determined reliably. See Note 12.3. (b) These amounts only represent trade receivables that are financial assets. See Note 11.
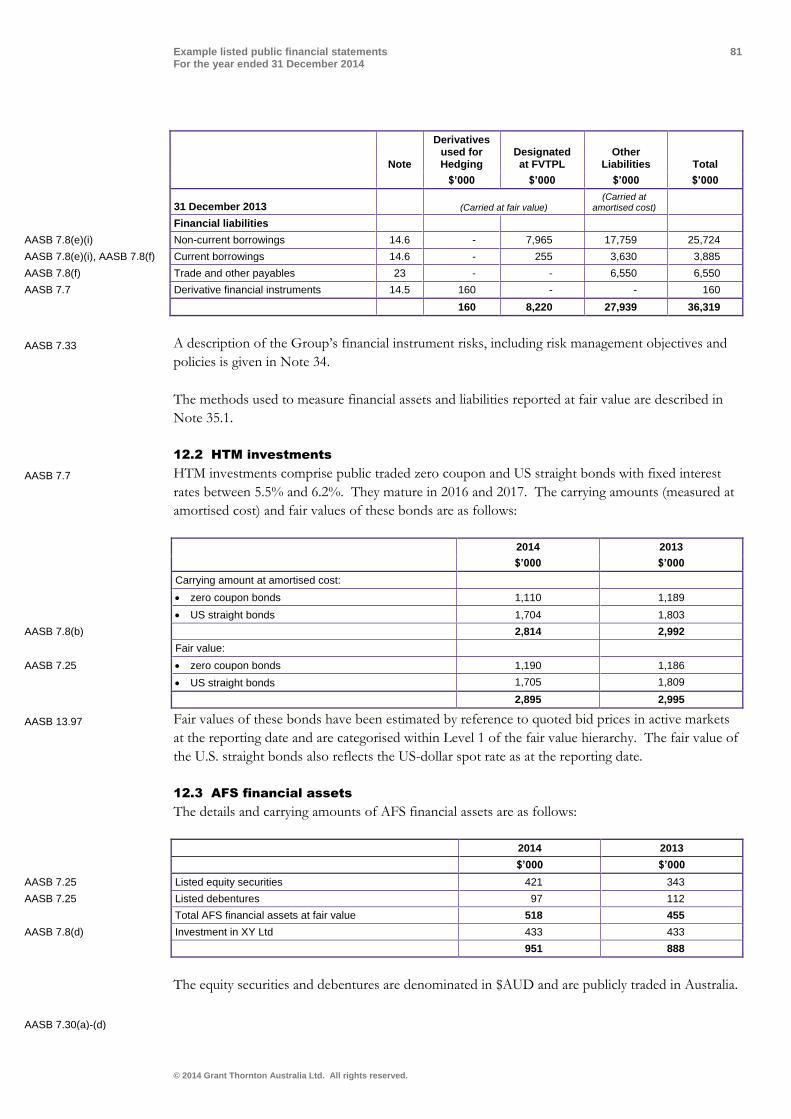
Example listed public financial statements 81 For the year ended 31 December 2014
© 2014 Grant Thornton Australia Ltd. All rights reserved.
Note
Derivatives used for Hedging
Designated at FVTPL
Other Liabilities Total
$’000 $’000 $’000 $’000
31 December 2013 (Carried at fair value) (Carried at
amortised cost)
Financial liabilities AASB 7.8(e)(i) Non-current borrowings 14.6 - 7,965 17,759 25,724
AASB 7.8(e)(i), AASB 7.8(f) Current borrowings 14.6 - 255 3,630 3,885
AASB 7.8(f) Trade and other payables 23 - - 6,550 6,550
AASB 7.7 Derivative financial instruments 14.5 160 - - 160
160 8,220 27,939 36,319
A description of the Group’s financial instrument risks, including risk management objectives and
policies is given in Note 34.
The methods used to measure financial assets and liabilities reported at fair value are described in
Note 35.1.
12.2 HTM investments
HTM investments comprise public traded zero coupon and US straight bonds with fixed interest
rates between 5.5% and 6.2%. They mature in 2016 and 2017. The carrying amounts (measured at
amortised cost) and fair values of these bonds are as follows:
2014 2013
$’000 $’000
Carrying amount at amortised cost:
zero coupon bonds 1,110 1,189
US straight bonds 1,704 1,803
AASB 7.8(b) 2,814 2,992
Fair value:
AASB 7.25 zero coupon bonds 1,190 1,186
US straight bonds 1,705 1,809
2,895 2,995
Fair values of these bonds have been estimated by reference to quoted bid prices in active markets
at the reporting date and are categorised within Level 1 of the fair value hierarchy. The fair value of
the U.S. straight bonds also reflects the US-dollar spot rate as at the reporting date.
12.3 AFS financial assets
The details and carrying amounts of AFS financial assets are as follows:
2014 2013
$’000 $’000
AASB 7.25 Listed equity securities 421 343
AASB 7.25 Listed debentures 97 112
Total AFS financial assets at fair value 518 455
AASB 7.8(d) Investment in XY Ltd 433 433
951 888
The equity securities and debentures are denominated in $AUD and are publicly traded in Australia.
AASB 7.33
AASB 7.7
AASB 13.97
AASB 7.30(a)-(d)

Example listed public financial statements 82 For the year ended 31 December 2014
© 2014 Grant Thornton Australia Ltd. All rights reserved.
The investment in XY Ltd represents a 15% equity interest in an unlisted Company, one of the
Group’s suppliers. XY Ltd has been undertaking a major restructuring process since 2013, which
has triggered possible litigation by third parties. Due to these uncertainties, the fair value of the
Group’s investment in this entity cannot be reliably measured. Therefore, it has been stated at cost
less impairment charges. In 2013, an impairment charge of $350,000 was recognised within finance
cost. The Group plans to continue to hold its investment in XY Ltd while it secures other supply
lines.
12.4 Financial assets held for trading
Financial assets held for trading consists of various investments in money market funds (presented
as other short-term financial assets) that are held by the Group for short-term trading and certain
derivative financial investments (see Note 12.5). All of these money market funds are publicly
traded on stock exchanges in Australia.
12.5 Derivative financial instruments
The Group’s derivative financial instruments are measured at fair value and are summarised below:
2014 2013
$’000 $’000
AASB 7.22(b) US-Dollar forward contracts - cash flow hedge 467 -
Other forward exchange contracts - held-for-trading 115 212
Derivative financial assets 582 212
AASB 7.22(b) US-Dollar forward contracts - cash flow hedge - (160)
Derivative financial liabilities - (160)
582 52
The Group uses forward foreign exchange contracts to mitigate exchange rate exposure arising from
forecast sales in US Dollars and other currencies. All US-Dollar forward exchange contracts have
been designated as hedging instruments in cash flow hedges in accordance with AASB 139.
Other forward exchange contracts are considered by management to be part of economic hedge
arrangements but have not been formally designated.
The Group’s US-Dollar forward contracts relate to cash flows that have been forecasted for
September – December 2015. All forecast transactions for which hedge accounting has been used
are expected to occur.
During 2014 a gain of $367,000 (2013: loss of $47,000) was recognised in other comprehensive
income. The cumulative gain recorded in equity is $467,000 (2013: cumulative loss of $160,000).
During 2014 a loss of $260,000 (2013: net gain of $425,000) was reclassified from equity into profit
or loss within revenue.
AASB 7.B5(a)(i)
AASB 7.22(a) AASB 7.22(b) AASB 7.55(c)
AASB 7.23(a) AASB 7.23(b)
AASB 7.23(c)
AASB 7.23(d) AASB 7.23(e)

Example listed public financial statements 83 For the year ended 31 December 2014
© 2014 Grant Thornton Australia Ltd. All rights reserved.
12.6 Borrowings
Borrowings include the following financial liabilities:
Financial Liabilities Current Non-Current
2014 $’000
2013 $’000
2014 $’000
2013 $’000
AASB 7.8(e)(i) Designated at FVTPL:
US-Dollar loans 250 255 7,700 7,965
AASB 7.8(f) Carrying amount at amortised cost:
other bank borrowings 4,565 3,124 - -
non-convertible bond - - 8,300 8,300
subordinated shareholder loan - - 5,000 5,000
finance lease liabilities (Note 33) 512 506 4,060 4,459
5,077 3,630 17,360 17,759
AASB 7.8(f) Fair value:
other bank borrowings 4,565 3,124 - -
non-convertible bond - - 8,259 8,383
subordinated shareholder loan - - 4,975 5,050
finance lease liabilities 512 506 4,608 5,114
5,077 3,630 17,842 18,547
Other than the US-Dollar loans, all borrowings are denominated in $AUD.
US-Dollar loans at FVTPL
US-Dollar loans are designated at FVTPL to significantly reduce measurement inconsistencies (see
Note 4.17). The interest rate is fixed at 4%. Movements in the carrying amount of these US-Dollar
loans are presented below:
2014 2013
$’000 $’000
Carrying amount 1 January 8,220 8,380
Repayments (300) (230)
Change in fair values: 582 212
AASB 7.10(a) changes in credit risk - -
other market factors 30 70
AASB 7.25 Carrying amount 31 December 7,950 8,220
The cumulative changes since the designation of these borrowings at FVTPL attributable to changes
in credit risk are $Nil (2013: $Nil). The Group estimates the credit-risk related change in fair value
on a residual basis, as the difference between fair value changes specifically attributable to the
appropriate benchmark interest rates and the total change in fair value. At year-end the estimate
shows an insignificant change attributable to credit risk.
The total undiscounted amount repayable at maturity in respect of the loan, converted at year-end
exchange rates is $7,755,000 (2013: $8,055,000), equivalent to a difference between the carrying
amount and the amount repayable of $195,000 (2013: $165,000).
The fair value of the loans is measured as described in Note 35.1.
AASB 7.25
AASB 7.10(a) AASB 7.11(a)
AASB 7.10(b)

Example listed public financial statements 84 For the year ended 31 December 2014
© 2014 Grant Thornton Australia Ltd. All rights reserved.
Borrowings at amortised cost
Other bank borrowings are secured by land and buildings owned by the Group (see Note 15).
Current interest rates are variable and average 4.0 % (2012: 4.1%). The carrying amount of the
other bank borrowings is considered to be a reasonable approximation of the fair value.
The Group’s non-convertible bond with a fixed interest rate of 5.0% matures on 20 May 2017 and is
therefore classified as non-current. The estimated fair value of the non-convertible bond is
categorised within Level 2 of the fair value hierarchy. The fair value estimate has been determined
from the perspective of a market participant that holds these non-convertible bonds as assets at 31
December 2014. The $8,259 is estimated using a present value technique, by discounting the
contractual cash flows using implied yields of non-convertible bonds of pan entity with a similar
standing and marketability.
The most significant input being the discount rate that reflects the credit risk of counterparties.
The subordinated shareholder loan was provided by Grant Thornton CLEARR’s main shareholder,
LOM Investment Trust, in 2011. It is perpetual and carries a fixed coupon of 4.0%. It is repayable
only upon liquidation of Grant Thornton CLEARR. The estimated fair value of the subordinated
shareholder loan is categorised within Level 3 of the fair value hierarchy. The fair value estimate has
been determined using a present value technique. The $4,975 is estimated by discounting the
contractual cash flows at 4.1%. The discount rate has been determined using the interest rate that
the entity would pay to unrelated party, at the reporting date, adjusted to reflect the subordination
feature.
The most significant input is the discount rate of 4.1%.
12.7 Other financial instruments
The carrying amount of the following financial assets and liabilities is considered a reasonable
approximation of fair value:
trade and other receivables
cash and cash equivalents; and
trade and other payables.
13 Inventories
Inventories consist of the following:
2014 2013
AASB 101.77 $’000 $’000
AASB 101.78(c) Raw materials and consumables 7,737 7,907
AASB102.36(b) Merchandise 10,651 9,319
18,298 17,226
In 2014, a total of $35,265,000 of inventories was included in profit and loss as an expense (2013:
$32,907,000). This includes an amount of $361,000 (2013: $389,000) resulting from write down of
inventories.
AASB 116.74(a) AASB 7.29 AASB 7.31 AASB 13.93(d) AASB 13.97
AASB 124.17 AASB 13.93(d) AASB 13.97
AASB 7.29
AASB 102.36(d) AASB 102.36(e)

Example listed public financial statements 85 For the year ended 31 December 2014
© 2014 Grant Thornton Australia Ltd. All rights reserved.
14 Investments accounted for using the equity method
2014 2013
$000 $000
Investment in joint venture 483 222
Investment in associate 377 245
860 467
14.1 Investment in joint venture
The Group has one material joint venture, Halftime Ltd (Halftime):
Name of the Joint Venture
Country of Incorporation & Principal Place of Business Principal Activity
Proportion of Ownership Interests Held by the Group
31-Dec-14 31-Dec-13
Halftime Ltd United Kingdom Online sales of hardware and software products
50% 50%
The investment in Halftime is accounted for using the equity method in accordance with AASB 128.
Summarised financial information for Halftime is set out below:
2014 2013
$000 $000
Current assets (a) 528 380
Non-current assets 838 500
Total assets 1,366 880
Current liabilities (b) (160) (138)
Non-current liabilities (c) (240) (298)
Total liabilities (400) (436)
a. Includes cash and cash equivalents 60 80
b. Includes financial liabilities (excluding trade and other payables and provisions) (80) -
c. Includes financial liabilities (excluding trade and other payables and provisions) (100) -
2014 2013
$000 $000
Revenue 1,200 730
Profit for the year 522 258
Other comprehensive income for the year - -
Total comprehensive income for the year 522 258
Depreciation and amortisation 30 20
Interest income 1 -
Interest expenses 4 -
Tax expense 68 58
A reconciliation of the above summarised financial information to the carrying amount of the
investment in Halftime is set out below:
2014 2013
$000 $000
Total net assets of Halftime 966 444
Proportion of ownership interests held by the Group 50% 50%
Carrying amount of the investment in Halftime 483 222
AASB 12.21(a)
AASB 12.21(b)(i)
AASB 12.21(b)(ii) AASB 12.B12-B13
AASB 12.B14
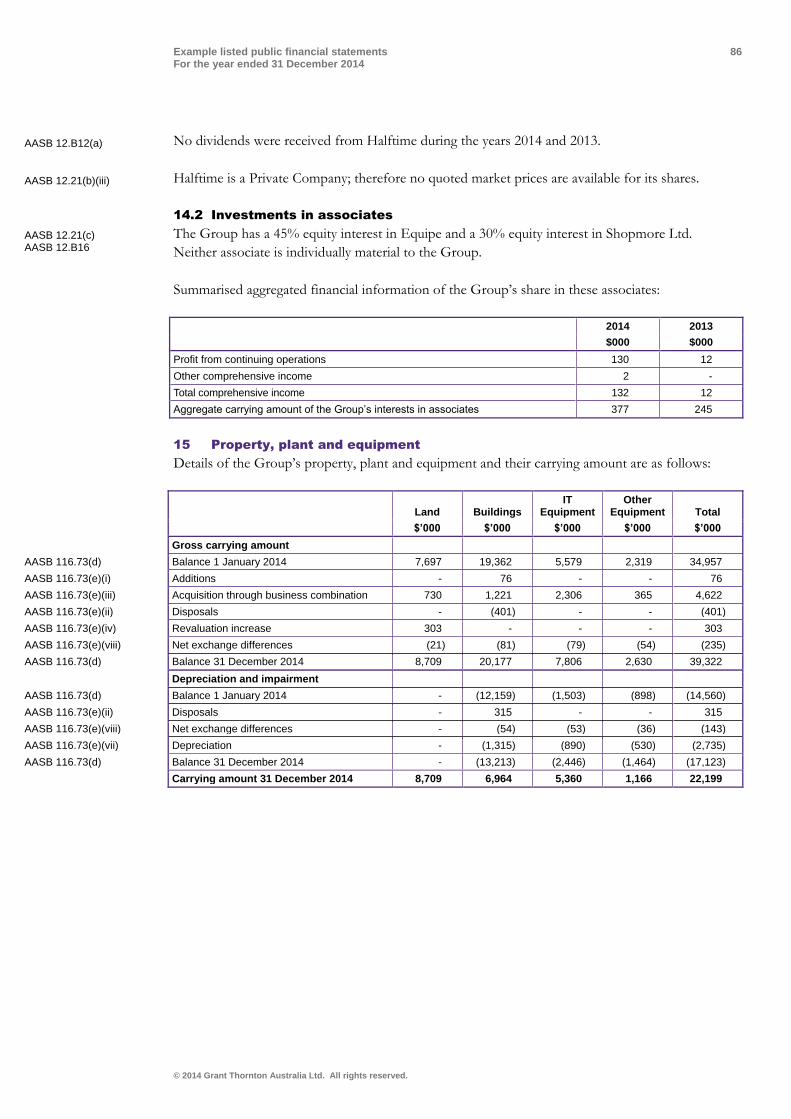
Example listed public financial statements 86 For the year ended 31 December 2014
© 2014 Grant Thornton Australia Ltd. All rights reserved.
No dividends were received from Halftime during the years 2014 and 2013.
Halftime is a Private Company; therefore no quoted market prices are available for its shares.
14.2 Investments in associates
The Group has a 45% equity interest in Equipe and a 30% equity interest in Shopmore Ltd.
Neither associate is individually material to the Group.
Summarised aggregated financial information of the Group’s share in these associates:
2014 2013
$000 $000
Profit from continuing operations 130 12
Other comprehensive income 2 -
Total comprehensive income 132 12
Aggregate carrying amount of the Group’s interests in associates 377 245
15 Property, plant and equipment
Details of the Group’s property, plant and equipment and their carrying amount are as follows:
Land Buildings
IT Equipment
Other Equipment Total
$’000 $’000 $’000 $’000 $’000
Gross carrying amount
AASB 116.73(d) Balance 1 January 2014 7,697 19,362 5,579 2,319 34,957
AASB 116.73(e)(i) Additions - 76 - - 76
AASB 116.73(e)(iii) Acquisition through business combination 730 1,221 2,306 365 4,622
AASB 116.73(e)(ii) Disposals - (401) - - (401)
AASB 116.73(e)(iv) Revaluation increase 303 - - - 303
AASB 116.73(e)(viii) Net exchange differences (21) (81) (79) (54) (235)
AASB 116.73(d) Balance 31 December 2014 8,709 20,177 7,806 2,630 39,322
Depreciation and impairment
AASB 116.73(d) Balance 1 January 2014 - (12,159) (1,503) (898) (14,560)
AASB 116.73(e)(ii) Disposals - 315 - - 315
AASB 116.73(e)(viii) Net exchange differences - (54) (53) (36) (143)
AASB 116.73(e)(vii) Depreciation - (1,315) (890) (530) (2,735)
AASB 116.73(d) Balance 31 December 2014 - (13,213) (2,446) (1,464) (17,123)
Carrying amount 31 December 2014 8,709 6,964 5,360 1,166 22,199
AASB 12.B12(a)
AASB 12.21(b)(iii)
AASB 12.21(c) AASB 12.B16

Example listed public financial statements 87 For the year ended 31 December 2014
© 2014 Grant Thornton Australia Ltd. All rights reserved.
Land Buildings IT
Equipment Other
Equipment Total
$’000 $’000 $’000 $’000 $’000
Gross carrying amount
AASB 116.73(d) Balance 1 January 2013 7,697 23,067 4,316 966 36,046
AASB 116.73(e)(i) Additions - 1,001 1,390 890 3,281
AASB 116.73(e)(iii) Acquisition through business combination - - 2,310 838 3,148
AASB 116.73(e)(ii) Held for sale or included in disposal group - (4,598) (2,422) (348) (7,368)
AASB 116.73(e)(viii) Net exchange differences - (108) (15) (12) (135)
AASB 116.73(d) Balance 31 December 2013 7,697 19,362 5,579 2,334 34,972
Depreciation and impairment
AASB 116.73(d) Balance 1 January 2013 - (12,944) (1,805) (551) (15,300)
AASB 116.73(e)(viii) Net exchange differences - (72) (10) (8) (90)
AASB 116.73(e)(ii) Held for sale or included in disposal group - 3,200 990 200 4,390
AASB 116.73(e)(vii) Depreciation - (2,343) (678) (554) (3,575)
AASB 116.73(d) Balance 31 December 2013 - (12,159) (1,503) (913) (14,575)
Carrying amount 31 December 2013 7,697 7,203 4,076 1,421 20,397
All depreciation and impairment charges are included within depreciation, amortisation and
impairment of non-financial assets.
Land and buildings have been pledged as security for the Group’s other bank borrowings (see Note
12.6).
The Group has a contractual commitment to acquire IT equipment of $1,304,000 payable in 2015.
There were no other material contractual commitments to acquire property, plant and equipment at
31 December 2014 (2013: None).
If the cost model had been used, the carrying amounts of the re-valued land, including the fair value
adjustment upon acquisition of Goodtech, would be $7,421,000 (2013: $6,712,000). The re-valued
amounts include a revaluation surplus of $1,288,000 before tax (2013: $985,000).
16 Investment property
Investment property includes real estate properties in Australia and in the United States, which are
owned to earn rentals and capital appreciation.
The fair values of investment properties were estimated using observable data on recent transactions
and rental yields for similar properties. Changes to the carrying amounts are as follows:
$’000
AASB 140.76 Carrying amount 1 January 2013 12,102
AASB 140.76(e) Net exchange differences 25
AASB 140.76(d) Net gain / (loss) from fair value adjustments 150
AASB 140.76 Carrying amount 31 December 2013 12,277
AASB 140.76(b) Additions through business combinations 75
AASB 140.76(e) Net exchange differences 22
AASB 140.76(d) Net gain / (loss) from fair value adjustments 288
AASB 140.76 Carrying amount 31 December 2014 12,662
AASB 136.126(a) AASB 136.126(b)
AASB 116.74(a)
AASB 116.74(c)
AASB 116.77(e) AASB 116.77(f)
AASB 140.75(d)
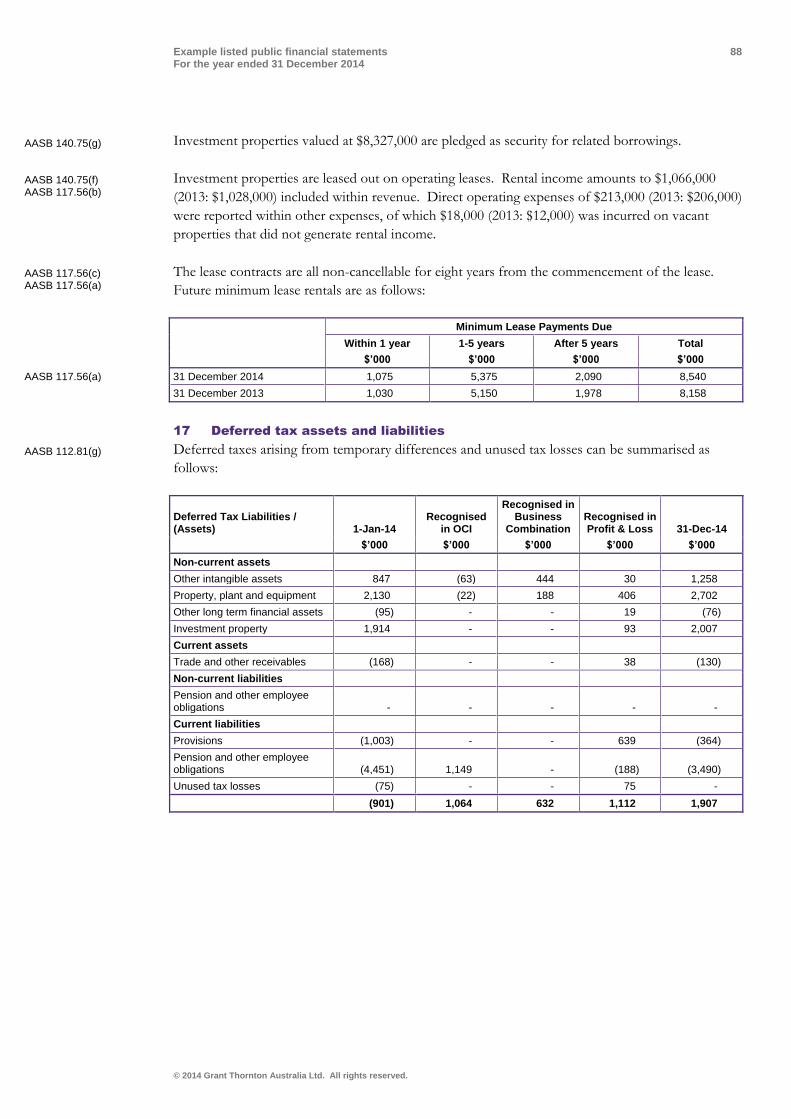
Example listed public financial statements 88 For the year ended 31 December 2014
© 2014 Grant Thornton Australia Ltd. All rights reserved.
Investment properties valued at $8,327,000 are pledged as security for related borrowings.
Investment properties are leased out on operating leases. Rental income amounts to $1,066,000
(2013: $1,028,000) included within revenue. Direct operating expenses of $213,000 (2013: $206,000)
were reported within other expenses, of which $18,000 (2013: $12,000) was incurred on vacant
properties that did not generate rental income.
The lease contracts are all non-cancellable for eight years from the commencement of the lease.
Future minimum lease rentals are as follows:
Minimum Lease Payments Due
Within 1 year 1-5 years After 5 years Total
$’000 $’000 $’000 $’000
AASB 117.56(a) 31 December 2014 1,075 5,375 2,090 8,540
31 December 2013 1,030 5,150 1,978 8,158
17 Deferred tax assets and liabilities
Deferred taxes arising from temporary differences and unused tax losses can be summarised as
follows:
Deferred Tax Liabilities / (Assets) 1-Jan-14
Recognised in OCI
Recognised in Business
Combination Recognised in Profit & Loss 31-Dec-14
$’000 $’000 $’000 $’000 $’000
Non-current assets
Other intangible assets 847 (63) 444 30 1,258
Property, plant and equipment 2,130 (22) 188 406 2,702
Other long term financial assets (95) - - 19 (76)
Investment property 1,914 - - 93 2,007
Current assets
Trade and other receivables (168) - - 38 (130)
Non-current liabilities
Pension and other employee obligations - - - - -
Current liabilities
Provisions (1,003) - - 639 (364)
Pension and other employee obligations (4,451) 1,149 - (188) (3,490)
Unused tax losses (75) - - 75 -
(901) 1,064 632 1,112 1,907
AASB 140.75(g)
AASB 140.75(f) AASB 117.56(b)
AASB 117.56(c) AASB 117.56(a)
AASB 112.81(g)

Example listed public financial statements 89 For the year ended 31 December 2014
© 2014 Grant Thornton Australia Ltd. All rights reserved.
Deferred Tax Liabilities / (Assets) 1-Jan-13
Recognised in OCI
Included in Disposal
Group
Recognised in Business Combination
Recognised in Profit & Loss 31-Dec-13
$’000 $’000 $’000 $’000 $’000 $’000
Non-current assets
Other intangible assets 409 (27) - 210 255 847
Property, plant and equipment 1,528 (68) - 225 445 2,130
Other long term financial assets - - - - (95) (95)
Investment property 1,861 - - - 53 1,914
Current assets
Trade and other receivables (34) - - - (134) (168)
Non-current liabilities
Pension and other employee obligations - - - - - -
Current liabilities
Provisions (1,320) - 74 - 243 (1,003)
Pension and other employee obligations (2,996) (1,062) - - (393) (4,451)
Unused tax losses (300) - - - 225 (75)
(852) (1,157) 74 435 599 (901)
The amounts recognised in other comprehensive income relate to revaluation of land, exchange
differences on translating foreign operations and the re-measurement of net defined benefit liability.
See Note 24.2 for the amount of the income tax relating to these components of other
comprehensive income.
A deferred tax liability of $1,000 (2013: $2,000) associated with an investment in a domestic
subsidiary has not been recognised, as the Group controls the timing of the reversal and it is
probable that the temporary difference will not reverse in the foreseeable future. The tax value is
equivalent to a temporary difference of $3,000 (2013: $7,000).
All deferred tax assets (including tax losses and other tax credits) have been recognised in the
statement of financial position.
18 Goodwill
The movements in the net carrying amount of goodwill are as follows:
2014 2013
$’000 $’000
AASB 3.B67(d) Gross carrying amount
AASB 3.B67(d)(i) Balance 1 January 3,727 1,234
AASB 3.B67(d)(ii) Acquired through business combination 2,438 2,569
AASB 3.B67(d)(vi) Net exchange difference (135) (76)
AASB 3.B67(d)(viii) Balance 31 December 6,030 3,727
Accumulated impairment
AASB 3.B67(d)(i) Balance 1 January (190) -
AASB 3.B67(d)(v) Impairment loss recognised (799) (190)
AASB 3.B67(d)(vi) Net exchange difference - -
AASB 3.B67(d)(viii) Balance 31 December (989) (190)
Carrying amount at 31 December 5,041 3,537
AASB 112.81(f)
AASB 112.81(e)
AASB 3.B67(d)

Example listed public financial statements 90 For the year ended 31 December 2014
© 2014 Grant Thornton Australia Ltd. All rights reserved.
18.1 Impairment testing
For the purpose of annual impairment testing goodwill is allocated to the following cash-generating
units, which are the units expected to benefit from the synergies of the business combinations in
which the goodwill arises.
2014 2013
$’000 $’000
AASB 136.134(a) Retail 4,796 2,493
Consulting 245 1,044
Goodwill allocation at 31 December 5,041 3,537
The recoverable amounts of the cash-generating units were determined based on value-in-use
calculations, covering a detailed three-year forecast, followed by an extrapolation of expected cash
flows for the units' remaining useful lives using the growth rates determined by management. The
present value of the expected cash flows of each segment is determined by applying a suitable
discount rate.
Growth Rates Discount Rates
AASB 136.134(d)(iv) 2014 2013 2014 2013
AASB 136.134(d)(v) Retail 3.0% 3.0% 9.3% 9.5%
Consulting 0.1% 0.5% 10.9% 10.1%
18.2 Growth rates
The growth rates reflect the long-term average growth rates for the product lines and industries of
the segments (all publicly available). The growth rate for online retailing exceeds the overall long-
term average growth rates for Australia because this sector is expected to continue to grow at above-
average rates for the foreseeable future.
18.3 Discount rates
The discount rates reflect appropriate adjustments relating to market risk and specific risk factors of
each unit.
18.4 Cash flow assumptions
Retail segment
Management’s key assumptions include stable profit margins, based on past experience in this
market. The Group’s management believes that this is the best available input for forecasting this
mature market. Cash flow projections reflect stable profit margins achieved immediately before the
budget period. No expected efficiency improvements have been taken into account and prices and
wages reflect publicly available forecasts of inflation for the industry.
Consulting
The forecast was adjusted in 2013 for the decline in consulting services related to conventional
telecommunication solutions. The market shifted considerably towards internet and intranet based
solutions during 2013 and continued in 2014. As a result, management expects lower growth and
moderately declining profit margins for this segment.
Impairment testing, taking into account these latest developments, resulted in the further reduction
of goodwill in 2014 to its recoverable amount. See Note 19 for the related impairment of other
intangible assets.
AASB 136.134
AASB 136.134(c) AASB 136.134(d)
AASB 136.134(d)(i) AASB136.134(d)(ii)
AASB 136.130(a) AASB 136.130(d) AASB 136.134(d)(i) AASB 136.134(d)(ii)
AASB 136.126(a) AASB136.129(a) AASB 136.130(b) and (d)(i)

Example listed public financial statements 91 For the year ended 31 December 2014
© 2014 Grant Thornton Australia Ltd. All rights reserved.
The related goodwill impairment loss of $799,000 in 2014 (2013: $190,000) was included within
impairment of non-financial assets
Apart from the considerations described in determining the value-in-use of the cash-generating units
described above, management is not currently aware of any other probable changes that would
necessitate changes in its key estimates. However, the estimate of recoverable amount for the
consulting unit is particularly sensitive to the discount rate. If the discount rate used is increased by
1%, a further impairment loss of $300,000 would have to be recognised, of which $245,000 would
be written off against goodwill and $55,000 against property, plant and equipment.
19 Other intangible assets
Details of the Group’s other intangible assets and their carrying amounts are as follows:
Acquired Software Licenses
Internally Developed Software
Brand Names
Customer Lists Total
$’000 $’000 $’000 $’000 $’000
AASB 138.118 Gross carrying amount
Balance at 1 January 2014 13,608 14,794 760 374 29,536
AASB 138.118(e)(i) Addition, separately acquired 440 - - - 440
Addition, internally developed - 3,306 - - 3,306
Acquisition through business combination 3,653 - 215 1,387 5,255
AASB 138.118(e)(ii) Disposals (1,159) - - - (1,159)
AASB 138.118(e)(vii) Net exchange differences (73) (54) - - (127)
Balance at 31 December 2014 16,469 18,046 975 1,761 37,251
Amortisation and impairment
Balance at 1 January 2014 (6.063) (9,381) (162) (89) (15,695)
AASB 138.118(e)(vi) Amortisation (1,978) (1,315) (125) (110) (3,528)
AASB 138.118(e)(iv) Impairment losses - (870) - - (870)
AASB 138.118(e)(ii) Disposals 350 - - - 350
AASB 138.118(e)(vii) Net exchange differences (48) (36) - - (84)
Balance at 31 December 2014 (7,739) (11,602) (287) (199) (19,827)
Carrying amount 31 December 2014 8,730 6,444 688 1,562 17,424
Acquired Software Licenses
Internally Developed Software
Brand Names
Customer Lists Total
$’000 $’000 $’000 $’000 $’000
AASB 138.118 Gross carrying amount
Balance at 1 January 2013 8,672 14,600 - - 23,272
AASB 138.118(e)(i) Addition, separately acquired 3,097 - - - 3,097
Addition, internally developed - 216 - - 216
Acquisition through business combination 1,859 - 768 378 3,005
AASB 138.118(e)(vii) Net exchange differences (20) (22) (8) (4) (54)
Balance at 31 December 2013 13,608 14,794 760 374 29,536
Amortisation and impairment
Balance at 1 January 2013 (4,442) (8,166) - - (12,608)
AASB 138.118(e)(vi) Amortisation (1,607) (1,201) (156) (87) (3,051)
AASB 138.118(e)(vii) Net exchange differences (14) (14) (6) (2) (36)
Balance at 31 December 2013 (6,063) (9,381) (162) (89) (15,695)
Carrying amount 31 December 2013 7,545 5,413 598 285 13,841
AASB 3.B64(m)

Example listed public financial statements 92 For the year ended 31 December 2014
© 2014 Grant Thornton Australia Ltd. All rights reserved.
Additions to internally developed software include capitalised borrowing costs of $80,000
(2013: $78,000). In addition, research and development costs of $1,690,000 (2013: $1,015,000) were
recognised as other expenses.
An impairment loss of $870,000 (2013: $Nil) was recognised for internally developed software used
to provide certain after-sales and maintenance services within the consulting unit. The recoverable
amount of the asset is its value-in-use, determined based on management’s expectation that the
market will shift considerably towards other alternative software products and will significantly
reduce future revenues and profits in the next two to three years (see Note 18 for the growth and
discount rates used). Should the shift in the market to other software products occur more rapidly,
the carrying amount of the software of $100,000 (2013: $970,000) would be reduced to $Nil.
During the year, the Group entered into an agreement to acquire enterprise resource planning
software, to support the planning and administration of the Group’s operations. Minimum
contractual commitments resulting from this agreement are $97,000 payable during 2015. No other
material contractual commitments at 31 December 2014 (2013: None).
20 Trade and other payables
Trade and other payables consist of the following:
Trade and Other Payables 2014 2013
$’000 $’000
Current:
trade payables 7,843 6,472
other payables 654 78
Total Trade and Other Payables 8,497 6,550
All amounts are short-term. The carrying values of trade payables and other payables are considered
to be a reasonable approximation of fair value.
21 Provisions
All provisions are considered current. The carrying amounts and movements in the provisions
account are as follows:
Restructuring Other Total
$’000 $’000 $’000
AASB 137.84(a) Carrying amount 1 January 2014 2,110 1,235 3,345
AASB 137.84(b) Additional provisions - 1,570 1,570
AASB 137.84(c) Amount utilised (876) (2,211) (3,087)
AASB 137.84(d) Reversals (510) (103) (613)
AASB 137.84(a) Carrying amount 31 December 2014 724 491 1,215
Provisions recognised at acquisition date in a business combination are included in additions (see
Note 31.1). Provisions classified as held for sale are included within amount utilised (see Note 9).
The provision for restructuring relates to the Phoenix program, which was initiated in early 2012
and carried out predominantly in 2013 and 2014. The Group’s management expects to settle the
remaining termination remuneration for former employees and legal fees relating to the
restructuring program in 2015. The Group is not eligible for any reimbursement by third parties in
this regard.
AASB 138.126
AASB 136.130(b)
AASB 136.130(c)(i)
AASB 136.130(c)(ii)
AASB 136.130(a)
AASB 136.130(e)
AASB 136.130(g)
AASB 138.122(e)
AASB 7.25 AASB 7.27(a) AASB 7.27(b) AASB 7.29
AASB 101.69
AASB 137.85(a) AASB 137.85(b) AASB 137.85(c) AASB 101.60

Example listed public financial statements 93 For the year ended 31 December 2014
© 2014 Grant Thornton Australia Ltd. All rights reserved.
The restructuring provision as at 31 December 2014 was reduced due to the outcome of several
lawsuits brought against the Group during 2014 by former employees. Out of court settlements
based on the outcome of earlier settlements are expected for most of the remaining claims.
Other provisions relate to various legal and other claims by customers, such as for example
warranties for which customers are covered for the cost of repairs.
Usually, these claims are settled between three and eighteen months from initiation, depending on
the procedures used for negotiating the claims. As the timing of settlement of these claims is to a
large extent dependent on the pace of negotiation with various counterparties and legal authorities,
the Group cannot reliably estimate the amounts that will eventually be paid in settlement after more
than 12 months from the reporting date. Therefore, the amount is classified as current.
The majority of the other provisions recognised at 31 December 2014 related to claims initiated in
2013 that were settled during 2014. Management, on the advice of counsel, does not expect the
outcome of any of the remaining cases will give rise to any significant loss beyond the amounts
recognised at 31 December 2014. None of the provisions will be discussed here in further detail so
as to not seriously prejudice the Group’s position in the related disputes.
22 Employee remuneration
22.1 Employee benefits expense
Expenses recognised for employee benefits are analysed below:
Employee Benefits – Expense 2014 2013
$’000 $’000
AASB 119.142 Wages, salaries 96,483 91,168
Social security costs 11,229 10,608
AASB 2.51(a) Share-based payments 298 466
Pensions - Defined Benefit Plans 1,308 3,030
AASB 119.46 Pensions - Defined Contribution Plans 4,491 4,243
Employee benefits expense 113,809 109,515
22.2 Share-based employee remuneration
As at 31 December 2014 the Group maintained two share-based payment schemes for employee
remuneration, the Star Program and the Stay Program. Both programs will be settled in equity.
The Star Program is part of the remuneration package of the Group’s Senior Management. Options
under this programme will vest if certain conditions, as defined in the program, are met. It is based
on the performance of Grant Thornton CLEARR’s shares compared to other companies in the
Australian Securities Exchange within a specified period.
In addition, participants in this program have to be employed until the end of the agreed vesting
period. Upon vesting, each option allows the holder to purchase one ordinary share at a discount of
20-25% of the market price determined at grant date.
AASB 101.125(a) AASB 101.125(b)
AASB 137.85(a) AASB 137.85(b) AASB 137.85(c)
AASB 101.61
AASB 101.125 AASB 137.92
AASB 2.45(a)

Example listed public financial statements 94 For the year ended 31 December 2014
© 2014 Grant Thornton Australia Ltd. All rights reserved.
The Stay Program is part of the remuneration package of the Group’s research and development
and sales personnel. Options under this program will vest if the participant remains employed for
the agreed vesting period. The maximum term of the options granted under the Stay Program ends
on 4 January 2017. Upon vesting, each option allows the holder to purchase one ordinary share at a
discount of 15-20% of the market price determined at grant date.
Share options and weighted average exercise prices are as follows for the reporting periods
presented:
Star Program Stay Program
Number of Shares
Weighted Average Exercise Price ($)
Number of Shares
Weighted Average Exercise Price ($)
Outstanding at 1 January 2013 300,000 6.24 95,250 5.81
Granted - - - -
Forfeited (513) 6.24 (1,012) 5.81
Exercised - - - -
Expired - - - -
Outstanding at 31 December 2013 299,487 6.24 94,238 5.81
Granted 100,000 7.81 - -
Forfeited (312) 6.24 (3,489) 5.81
Exercised (270,000) 6.24 - -
Outstanding at 31 December 2014 129,175 7.45 90,749 5.81
Exercisable at 31 December 2013 - - - -
Exercisable at 31 December 2014 29,175 6.24 - -
The weighted average share price at the date of exercise was $11.19 (no options were exercised in
2013).
The fair values of options granted were determined using a variation of the binomial option pricing
model that takes into account factors specific to the share incentive plans, such as the vesting
period. The performance condition related to the Star Program, being a market condition, has been
incorporated into the measurement by means of actuarial modelling.
The following principal assumptions were used in the valuation:
Valuation Assumptions Star Program Stay Program
AASB 2.47 Grant date 1 Jan 2011 1 Feb 2014 5 Jan 2010
Vesting period ends 31 Dec 2013 31 Jan 2017 31 Jan 2015
Share price at date of grant 8.00 10.01 7.00
Volatility 50% 50% 50%
Option life 5 years 5 years 7 years
Dividend yield 1% 1% 1%
Risk free investment rate 4% 4% 4%
Fair value at grant date 4.00 6.70 5.30
Exercise price at date of grant 6.24 7.81 5.81
Exercisable from 1 Jan 2014 1 Feb 2017 1 Feb 2015
Exercisable to 31 Dec 2015 31 Dec 2018 4 Jan 2017
AASB 2.45(d) Weighted average remaining contractual life 1.0 years 4.0 years 2.0 years
AASB 2.45(a)
AASB 2.45 (b)
AASB 2.45(c)
AASB 2.47(a)(i)

Example listed public financial statements 95 For the year ended 31 December 2014
© 2014 Grant Thornton Australia Limited. All rights reserved.
The underlying expected volatility was determined by reference to historical data of the Company’s
shares over a period of time. No special features inherent to the options granted were incorporated
into measurement of fair value.
In total, $298,000 (2013: $466,000) of employee remuneration expense (all of which related to
equity-settled share-based payment transactions) has been included in profit or loss and credited to
share option reserve.
22.3 Employee benefits
The liabilities recognised for employee benefits consist of the following amounts:10
Employee Benefits - Liabilities 2014 2013
$’000 $’000
Non-current
defined Benefit Plans (net) 10,386 13,642
Current:
defined Benefit Plans 1,246 1,193
Accrued annual leave 221 303
Current pension and other employee obligations 1,467 1,496
The current portion of these liabilities represents the Group’s obligations to its current and former
employees that are expected to be settled during 2015.
Defined Benefit Plan
The Group has set up a partly funded pension scheme for mid to senior management, mainly in
Australia, the UK and the US. The scheme is available to certain senior workers after completing
five years’ service.
According to the plan, a certain percentage of the current salary is converted into a pension
component each year until retirement. Pensions under this scheme are paid out when a beneficiary
has reached the age of 65. The pensionable salary is limited to $100,000 for a year. Eligible
employees are required to contribute a stated percentage of pensionable salary.
In Australia and the UK, the pension payments are linked to the Consumer Price Index (‘CPI’),
although certain limitations apply.
The plan assets are managed by a pension fund that is legally separated from the Group. The Board
of Trustees of the pension fund is required by its articles of association to act in the best interest of
the fund and it is responsible for setting the investment policies. The Group has no representation
on the Board of the fund.
The plan exposes the Group to actuarial risks such as interest rate risk, investment risk, longevity
risk and inflation risk.
10 In the Statement of Financial Position the current and non-current portion of the Defined Benefit Obligation are presented separately to comply
with AASB 101.60. However, paragraph 118 of AASB 119 Employee Benefits does not specify whether this disaggregation is needed. Therefore, an entity is also allowed to present the obligation as non-current in its entirety.
AASB 2.47(a)(ii) AASB 2.47(a)(iii)
AASB 2.51
AASB 101.69
AASB 119.139(a)
AASB 119.139(a)

Example listed public financial statements 96 For the year ended 31 December 2014
© 2014 Grant Thornton Australia Ltd. All rights reserved.
Interest rate risk
The present value of the defined benefit liability is calculated using a discount rate determined by
reference to market yields of government bonds. The estimated term of the bonds is consistent
with the estimated term of the Defined Benefit Obligation and it is denominated in $AUD. A
decrease in market yield on government bonds will increase the Group’s defined benefit liability,
although it is expected that this would be offset partially by an increase in the fair value of certain of
the plan assets.
Investment risk
The plan assets at 31 December 2014 are predominantly real estate, equity and debt instruments.
The fair value of the plan assets is exposed to the real estate market (in Australia and the US). The
equity instruments are significantly weighted towards the finance and pharmaceuticals sectors in
Australia.
Longevity risk
The Group is required to provide benefits for life for the members of the defined benefit liability.
Increase in the life expectancy of the members, particularly in Australia and in the UK where the
pension payments are linked to CPI, will increase the defined benefit liability.
Inflation risk
A significant proportion of the defined benefit liability is linked to inflation. An increase in the
inflation rate will increase the Group’s liability. A portion of the plan assets are inflation-linked debt
securities which will mitigate some of the effects of inflation.
A reconciliation of the Group’s Defined Benefit Obligation (‘DBO’) and plan assets to the amounts
presented in the statement of financial position for each of the reporting periods is presented below:
2014 2013
$’000 $’000
AASB 119.140 Defined Benefit Obligations 53,874 47,410
Fair value of planned assets (42,242) (32,575)
11,632 14,835
Classified as:
current liability 1,246 1,193
non-current liability 10,386 13,642

Example listed public financial statements 97 For the year ended 31 December 2014
© 2014 Grant Thornton Australia Ltd. All rights reserved.
Defined Benefit Obligation (‘DBO’)
The details of the Group’s DBO are as follows:
2014 2013
$’000 $’000
AASB 119.140(a)(ii) Defined Benefit Obligation 1 January 47,410 38,889
AASB 119.141(a) Current service cost 1,308 1,530
AASB 119.141(b) Interest cost 2,488 2,267
AASB 119.141(f) Contributions by plan participants 658 650
AASB 119.141(c)(ii) Re-measurement - actuarial losses from changes in demographic assumptions 916 1,091
AASB 119.141(c)(iii) Re-measurement - actuarial losses from changes in financial assumptions 2,345 2,670
AASB 119.141(g) Benefits paid (1,251) (1,187)
AASB 119.141(d) Past service costs - 1,500
AASB 119.141(a)(ii) Defined Benefit Obligation 31 December 53,874 47,410
AASB 119.138(e) Thereof:
unfunded - -
partly or wholly funded 53,874 47,410
Plan assets
The reconciliation of the balance of the assets held for the Group’s Defined Benefit Plan is
presented below:
2014 2013
$’000 $’000
AASB 119.140(a)(i) Fair value of plan assets 1 January 32,575 29,901
AASB 119.141(b) Interest income 1,983 1,718
AASB 119.141(c)(i) Return on plan assets (excluding amounts included in net interest) 7,091 220
AASB 119.141(f) Contributions by the Group 1,186 1,273
AASB 119.141(f) Contributions by beneficiaries 658 650
AASB 119.141(g) Benefits paid (1,251) (1,187)
AASB 119.140(a)(i) Fair value of plan assets 31 December 42,242 32,575
The actual return on plan assets was $9,074 in 2014 (2013: $1,938).
Plan assets do not comprise any of the Group’s own financial instruments or any assets used by
Group companies. Plan assets can be broken down into the following major categories of
investments:
Total Plan Assets
2014 2013
$’000 $’000
AASB 119.142(a) Cash and cash equivalents 3,442 2,075
AASB 119.142(b) Equity instruments:
financial institutions 9,800 7,600
pharmaceuticals 8,100 4,300
oil and gas industry 1,600 1,700
manufacturing industry 1,500 1,200
Equity Instruments Total 21,000 14,800
AASB 119.142(c) Debt instruments:
Australian government bonds 4,800 5,800
corporate bonds (rated AA and above) 3,100 5,600
Debt Instruments Total 7,900 11,400

Example listed public financial statements 98 For the year ended 31 December 2014
© 2014 Grant Thornton Australia Ltd. All rights reserved.
Total Plan Assets
2014 2013
$’000 $’000
Real estate:
Australia 6,700 2,500
United States 3,200 1,800
Real Estate Total 9,900 4,300
Total 42,242 32,575
All equity and debt instruments have quoted prices in active markets (Level 1). Fair values of real
estate investments do not have quoted prices and have been determined based on professional
appraisals that would be classified as Level 3 of the fair value hierarchy as defined in AASB 13 Fair
Value Measurement.
The Defined Benefit Obligation and plan assets are composed by geographical locations as follows:
Australia UK US Others Total
2014 2014 2014 2014 2014
$’000 $’000 $’000 $’000 $’000
Defined Benefit Obligation 24,482 17,321 11,529 542 53,874
Fair value of plan assets (18,586) (13,057) (10,427) (172) (42,242)
5,896 4,264 1,102 370 11,632
Australia UK US Others Total
2013 2013 2013 2013 2013
$’000 $’000 $’000 $’000 $’000
Defined Benefit Obligation 21,594 15,063 10,256 497 47,410
Fair value of plan assets (14,123) (9,748) (8,553) (151) (32,575)
7,471 5,315 1,703 346 14,835
The significant actuarial assumptions used for the valuation are as follows:11
2014 2013
Discount rate at 31 December 5.3% 5.5%
Salary growth rate 3.0% 3.2%
Average life expectancies:
male, 45 years of age at reporting date 84.5 84.5
female, 45 years of age at reporting date 87.5 87.5
male, 65 years of age at reporting date 82.5 82.5
female, 65 years of age at reporting date 84.5 84.5
These assumptions were developed by management with the assistance of independent actuarial
appraisers. Discount factors are determined close to each year-end by reference to government
bonds that are denominated in the currency in which the benefits will be paid and that have terms to
maturity approximating to the terms of the related pension obligation. Other assumptions are based
on management’s historical experience.
The present value of the DBO was measured using the projected unit credit method.
11 For the purposes of these Example Financial Statements, it is assumed that the significant actuarial assumptions for the different geographical
locations are the same. In practice, it is likely that there will be differences in the significant actuarial assumptions in different geographical locations, which will require their disclosure.
AASB 119.142
AASB 119.138(a)
AASB 101.125(a) AASB 101.125(b)
AASB 119.67

Example listed public financial statements 99 For the year ended 31 December 2014
© 2014 Grant Thornton Australia Ltd. All rights reserved.
Defined Benefit Plan expenses
Amounts recognised in profit or loss related to the Group's Defined Benefit Plans are as follows:
2014 2013
$’000 $’000
AASB 119.120(a) Current service cost 1,308 1,530
AASB 119.120(a) Past service cost - 1,500
AASB 119.120(b) Net interest expense 505 549
Total expenses recognised in profit or loss 1,813 3,579
The current service cost and the past service cost are included in employee benefits expense. The
net interest expense is included in finance costs.
Amounts recognised in other comprehensive income related to the Group’s defined benefit plans
are as follows:
2014 2013
$’000 $’000
AASB 119.127(a) Actuarial losses from changes in demographic assumptions (916) (1,091)
AASB 119.127(a) Actuarial losses from changes in financial assumptions (2,345) (2,670)
AASB 119.127(b) Return on plan assets (excluding amounts included in net interest) 7,091 220
Total income / (expenses) recognised in other comprehensive income 3,830 (3,541)
All the expenses summarised above were included within items that will not be reclassified
subsequently to profit or loss in the statement of other comprehensive income.
Other Defined Benefit Plan information
Employees of the Group are required to contribute a fixed 5% of the pensionable salary. The
remaining contribution is partly funded by the Group’s subsidiaries. The funding requirements are
based on the pension fund's actuarial measurement framework as set out in the funding policies.
Based on historical data, the Group expects contributions of $2,500,000 to be paid for 2015.
The weighted average duration of the defined benefit obligation at 31 December 2014 is 23.3 years
(2013: 23.2 years).
The significant actuarial assumptions for the determination of the defined benefit obligation are the
discount rate, the salary growth rate and the average life expectancy. The calculation of the net
defined benefit liability is sensitive to these assumptions. The following table summarises the effects
of changes in these actuarial assumptions on the defined benefit liability at 31 December 2014.
Changes in the Significant Actuarial Assumptions
Discount rate Increase to 6.3% Decrease to 4.3%
Increase / (decrease) in the defined benefit liability (2,000) 2,100
Salary growth rate Increase to 4.0% Decrease to 2%
Increase / (decrease) in the defined benefit liability 950 (780)
Average life expectancies of males Increase of one year Decrease of one year
Increase / (decrease) in the defined benefit liability 1,140 (930)
Average life expectancies of females Increase of one year Decrease of one year
Increase / (decrease) in the defined benefit liability 1,280 (1,090)
AASB 119.120
AASB 119.134
AASB 119.120
AASB 119.122
AASB 117.147(a)
AASB 119.147(b)
AASB 119.147(c)
AASB 119.144 AASB 119.173(b) AASB 119.145(a)

Example listed public financial statements 100 For the year ended 31 December 2014
© 2014 Grant Thornton Australia Ltd. All rights reserved.
The present value of the defined benefit obligation calculated with the same method (project unit
credit) as the defined benefit obligation recognised in the statement of financial position. The
sensitivity analyses are based on a change in one assumption while not changing all other
assumptions. This analysis may not be representative of the actual change in the defined benefit
obligation as it is unlikely that the change in the assumptions would occur in isolation of one
another as some of the assumptions may be correlated.
23 Other liabilities
Other liabilities consist of the following:
Other Liabilities 2014 2013
$’000 $’000
Due to customers for construction contract work 288 207
Advances received for construction contract work 225 220
Deferred service income 2,123 2,291
Other 22 657
Deferred gain 100 100
Other Liabilities - Current 2,758 3,475
Contingent consideration for the acquisition of Goodtech 620 -
Deferred gain 1,400 1,500
Other Liabilities - Non-Current 2,020 1,500
The deferred gain relates to a sale and leaseback of an office and production building in 2005. The
excess of proceeds received over fair value was deferred and is being amortised over the lease term
of fifteen (15) years. In 2014, deferred income of $100,000 (2013: $100,000) was recognised in
profit or loss relating to this transaction. The subsequent leasing agreement is treated as an
operating lease (see Note 33.2). The non-current part of the deferred gain will be amortised
between 2015 and the end of the lease term.
All amounts recognised relating to deferred service income are considered current as the timing of
service commitments is not at the discretion of the Group. Assuming an average remaining term of
service on service contracts at 31 December 2014 of 32 months (2013: 38 months) and constant
service activity over the remaining term, the Group expects to amortise $796,000 of deferred service
income during 2014 (2013: $723,000), and $1,327,000 after that time (2013: $1,568,000).
The amounts recognised in respect of construction contracts will generally be utilised within the
next reporting period (see Note 11.1).
AASB 119.145(b)
AASB 101.69 AASB 101.61
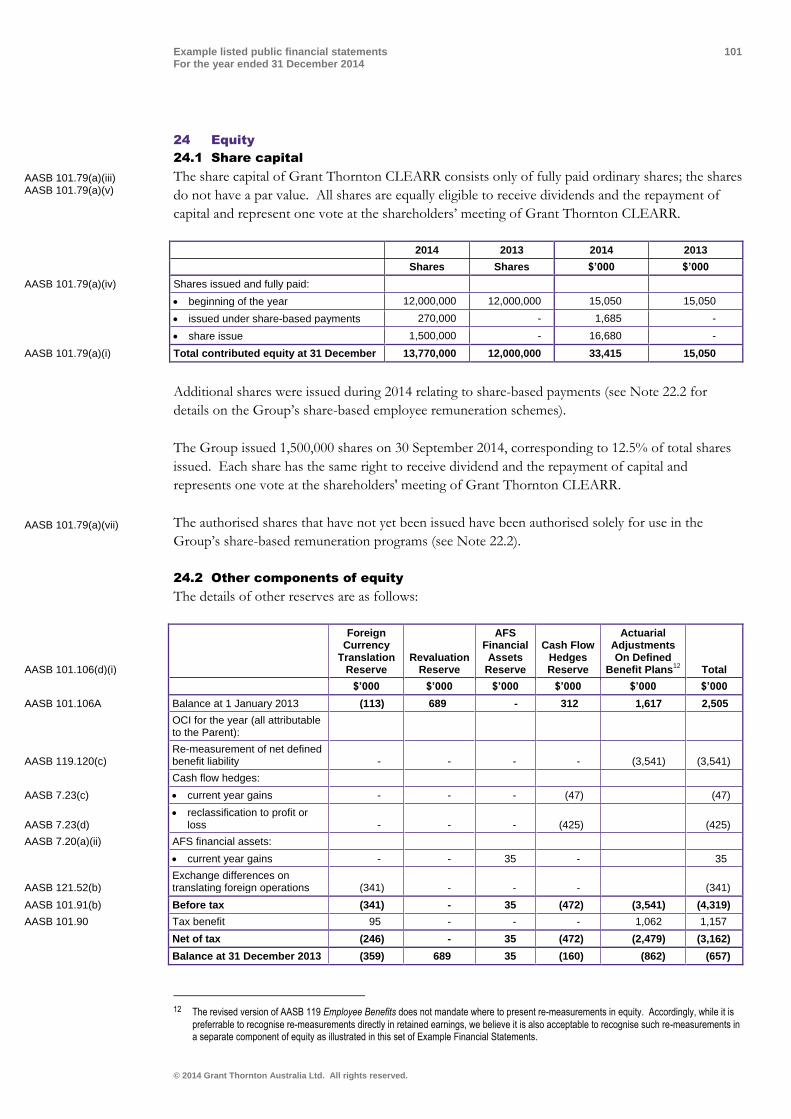
Example listed public financial statements 101 For the year ended 31 December 2014
© 2014 Grant Thornton Australia Ltd. All rights reserved.
24 Equity
24.1 Share capital
The share capital of Grant Thornton CLEARR consists only of fully paid ordinary shares; the shares
do not have a par value. All shares are equally eligible to receive dividends and the repayment of
capital and represent one vote at the shareholders’ meeting of Grant Thornton CLEARR.
2014 2013 2014 2013
Shares Shares $’000 $’000
AASB 101.79(a)(iv) Shares issued and fully paid:
beginning of the year 12,000,000 12,000,000 15,050 15,050
issued under share-based payments 270,000 - 1,685 -
share issue 1,500,000 - 16,680 -
AASB 101.79(a)(i) Total contributed equity at 31 December 13,770,000 12,000,000 33,415 15,050
Additional shares were issued during 2014 relating to share-based payments (see Note 22.2 for
details on the Group’s share-based employee remuneration schemes).
The Group issued 1,500,000 shares on 30 September 2014, corresponding to 12.5% of total shares
issued. Each share has the same right to receive dividend and the repayment of capital and
represents one vote at the shareholders' meeting of Grant Thornton CLEARR.
The authorised shares that have not yet been issued have been authorised solely for use in the
Group’s share-based remuneration programs (see Note 22.2).
24.2 Other components of equity
The details of other reserves are as follows:
AASB 101.106(d)(i)
Foreign Currency
Translation Reserve
Revaluation Reserve
AFS Financial Assets
Reserve
Cash Flow Hedges Reserve
Actuarial Adjustments On Defined
Benefit Plans12
Total
$’000 $’000 $’000 $’000 $’000 $’000
AASB 101.106A Balance at 1 January 2013 (113) 689 - 312 1,617 2,505
OCI for the year (all attributable to the Parent):
AASB 119.120(c) Re-measurement of net defined benefit liability - - - - (3,541) (3,541)
Cash flow hedges:
AASB 7.23(c) current year gains - - - (47) (47)
AASB 7.23(d) reclassification to profit or
loss - - - (425) (425)
AASB 7.20(a)(ii) AFS financial assets:
current year gains - - 35 - 35
AASB 121.52(b) Exchange differences on translating foreign operations (341) - - - (341)
AASB 101.91(b) Before tax (341) - 35 (472) (3,541) (4,319)
AASB 101.90 Tax benefit 95 - - - 1,062 1,157
Net of tax (246) - 35 (472) (2,479) (3,162)
Balance at 31 December 2013 (359) 689 35 (160) (862) (657)
12 The revised version of AASB 119 Employee Benefits does not mandate where to present re-measurements in equity. Accordingly, while it is
preferrable to recognise re-measurements directly in retained earnings, we believe it is also acceptable to recognise such re-measurements in a separate component of equity as illustrated in this set of Example Financial Statements.
AASB 101.79(a)(iii) AASB 101.79(a)(v)
AASB 101.79(a)(vii)

Example listed public financial statements 102 For the year ended 31 December 2014
© 2014 Grant Thornton Australia Limited. All rights reserved.
AASB 101.106(d)(i)
Foreign Currency
Translation Reserve
Revaluation Reserve
AFS Financial Assets
Reserve
Cash Flow Hedges Reserve
Actuarial Adjustments on Defined
Benefit Plans13
Total
$’000 $’000 $’000 $’000 $’000 $’000
AASB 101.106A Balance at 1 January 2014 (359) 689 35 (160) (862) (657)
OCI for the year (all attributable to the Parent):
AASB 119.120(c) Re-measurement of net defined benefit liability - - - - 3,830 3,830
Cash flow hedges:
AASB 7.23(c) current year gains - - - 367 - 367
AASB 7.23(d) reclassification to profit or
loss - - - 260 - 260
AASB 7.20(a)(ii) AFS financial assets: -
current year gains - - 113 - - 113
reclassification to profit or
loss - - (50) - - (50)
Revaluation of land - 303 - - - 303
AASB 121.52(b) Exchange differences on translating foreign operations (664) - - - - (664)
Equity accounted investments - - - 5 - 5
reclassification to profit or
loss - - - (3) - (3)
AASB 101.91(b) Before tax (664) 303 63 629 3,830 4,161
AASB 101.90 Tax benefit / (expense) 176 (91) - - (1,149) (1,064)
Net of tax (488) 212 63 629 2,681 3,097
Balance at 31 December 2014 (847) 901 98 469 1,819 2,440
25 Earnings per share and dividends
25.1 Earnings per share
Both the basic and diluted earnings per share have been calculated using the profit attributable to
shareholders of the Parent Company (Grant Thornton CLEARR) as the numerator (i.e. no
adjustments to profit were necessary in 2013 or 2014).
The reconciliation of the weighted average number of shares for the purposes of diluted earnings
per share to the weighted average number of ordinary shares used in the calculation of basic
earnings per share is as follows:
2014 2013
Amounts in thousand shares:
weighted average number of shares used in basic earnings per share 12,520 12,000
AASB 133.70(b) shares deemed to be issued for no consideration in respect of share
based payments 17 21
Weighted average number of shares used in diluted earnings per share 12,537 12,021
13 The revised version of AASB 119 Employee Benefits does not mandate where to present re-measurements in equity. Accordingly, while it is
preferrable to recognise re-measurements directly in retained earnings, we believe it is also acceptable to recognise such re-measurements in a separate component of equity as illustrated in this set of Example Financial Statements.
AASB 133.70(a)
AASB 133.70(b)

Example listed public financial statements 103 For the year ended 31 December 2014
© 2014 Grant Thornton Australia Ltd. All rights reserved.
25.2 Dividends
Dividends Paid and Proposed
2014 2013
$’000 $’000
AASB 101.107 Dividends declared during the year
Fully franked interim dividend ($0.25 per share) 3,000 -
Remuneration for audit and review of financial statements 3,000 -
The tax rates applicable to the franking credits attached to the interim dividend and to be attached
to the final dividend is 30% (2013: 30%).
Also during 2014, the Directors proposed the payment of a dividend of $6,885,000 ($0.50 per
share). As the distribution of dividends by Grant Thornton CLEARR requires approval at the
shareholders’ meeting, no liability in this respect is recognised in the 2014 consolidated financial
statements. No income tax consequences are expected to arise as a result of this transaction at the
level of Grant Thornton CLEARR.
25.3 Franking credits
Parent
2014 2013
$’000 $’000
AASB 1054.13 The amount of the franking credits available for subsequent reporting periods are:
balance at the end of the reporting period 2,450 3,523
franking credits that will arise from the payment of the amount of
provision for income tax 408 294
franking debits that will arise from the payment of dividends recognised
as a liability at the end of the reporting period - -
franking credits that will arise from the receipt of dividends recognised as
receivables at the end of reporting period
- -
2,858 3,817
AASB 101.137(a) AASB 112.81(i)

Example listed public financial statements 104 For the year ended 31 December 2014
© 2014 Grant Thornton Australia Ltd. All rights reserved.
26 Reconciliation of cash flows from operating activities
Reconciliation of Cash Flows From Operating Activities 2014 2013
$’000 $’000
Cash flows from operating activities
Profit for the period 15,473 13,246
Adjustments for:
Depreciation, amortisation and impairment 7,942 6,826
FV gains on financial assets / derivatives (219) 373
Defined benefits plan adjustment 465 707
Changes in fair value of investment property (310) (175)
Share of profit of equity accounted investments (60) (12)
Bad debt expense 72 864
Foreign exchange differences (937) (1,164)
Acquisition costs included in investing 223 76
Return on plan assets (2,445) (2,417)
Net interest and dividends received included in investing and financing 221 439
Tax expense included in investing 244 140
Net changes in working capital:
Change in inventories 7,823 6,764
Change in trade and other receivables (281) (573)
Change in other assets (496) 547
Change in trade and other payables (2,841) (2,856)
Change in other employee obligations (82) 23
Change in deferred tax 1,215 971
Change in provisions (40) (2,825)
Net cash from operating activities 25,967 20,954
In 2014, the Group acquired Goodtech (see Note 31.1). The consideration transferred included a
contingent payment arrangement amounting to $600,000 as of the acquisition date. The initial
recognition of this liability and the subsequent unwinding of the discount of $20,000 (2014: $Nil)
are non-cash transactions excluded from the statement of cash flows.
27 Auditor remuneration
2014 2013
CA 300(11Ba) / (11Ca) $ $
AASB 1054.10a Audit and review of financial statements
AASB 112.85 Auditors of Grant Thornton CLEARR - Grant Thornton Australia 220,000 196,000
overseas Grant Thornton network firms 95,000 78,000
Remuneration for audit and review of financial statements 315,000 274,000
AASB 1054.10b Other services
Auditors of Grant Thornton CLEARR - Grant Thornton Australia:
taxation compliance 25,700 24,900
Overseas Grant Thornton network firms:
due diligence services 73,590 85,450
Total other service remuneration 99,290 110,350
Total auditor’s remuneration 414,290 384,350
AASB 1054.16
AASB 107.43

Example listed public financial statements 105 For the year ended 31 December 2014
© 2014 Grant Thornton Australia Ltd. All rights reserved.
28 Related party transactions
The Group's related parties include its associates and joint venture, key management, post-
employment benefit plans for the Group’s employees and others as described below. In addition,
Grant Thornton CLEARR has a subordinated loan from its main shareholder, the LOM Investment
Trust (see Note 12.6 for information on terms and conditions), on which interest of $200,000 (2013:
$200,000) is paid.
Unless otherwise stated, none of the transactions incorporate special terms and conditions and no
guarantees were given or received. Outstanding balances are usually settled in cash.
28.1 Transactions with associates
In order to meet peak demands by its customers, the Group has some of its consulting services
carried out by professionals of its associate, Equipe Consultants S.A. During 2014, Equipe
Consultants S.A. provided services valued at $568,000 (2013: $590,000). The outstanding balance of
$20,000 (2013: $22,000) due to Equipe Consultants S.A. is included in trade payables.
28.2 Transactions with joint ventures
During 2014, Halftime Ltd provided services valued at $10,000 (2013: $3,000). There is no
outstanding balance as at 31 December 2014 (2013: Nil).
28.3 Transactions with key management personnel
Key management of the Group are the executive members of Grant Thornton CLEARR’s Board of
Directors and members of the Executive Council. Key Management Personnel remuneration
includes the following expenses:
2014 2013
$ $
AASB 124.17(a) Short term employee benefits:
salaries including bonuses 2,320,000 2,115,000
social security costs 70,000 34,000
company car allowance 220,000 190,000
Total short term employee benefits 2,610,000 2,339,000
AASB 124.17(c) Long service leave 100,000 95,000
Total other long-term benefits 100,000 95,000
AASB 124.17(b) Post-employment benefits:
defined benefit pension plans 312,000 299,000
defined contribution pension plans 25,000 12,000
Total post-employment benefits 337,000 311,000
AASB 124.17(d) Termination benefits 100,000 -
AASB 124.17(e) Share-based payments 103,000 175,000
Total remuneration 3,250,000 2,920,000
During 2014, certain Key Management Personnel exercised share options with total exercise price of
$1,685,000 (2013: $Nil) granted in the Group’s Star Program.
AASB 124.18(g)
AASB 124.17(b)(i) AASB 124.17(b)(ii)
AASB 124.16(d) AASB 124.17 AASB 124.17(a) AASB 124.17(b)
AASB 124.18(e) AASB 124.17(a)
AASB 124.18(f)
AASB 124.17

Example listed public financial statements 106 For the year ended 31 December 2014
© 2014 Grant Thornton Australia Ltd. All rights reserved.
The Group allows its employees to take up limited short-term loans to fund merchandise and other
purchases through the Group’s business contacts. This facility is also available to the Group’s Key
Management Personnel. The table below explains the Group’s loans to Key Management Personnel
during 2014 and 2013 financial years:
2014 2013
$ $
Beginning of the year 1,000 3,000
Loans advanced 40,000 38,000
Loan repayment received 40,000 40,000
Interest charged - -
Interest received - -
End of year 1,000 1,000
The Group does not have an allowance account for receivables relating to outstanding loans and has
not recognised any expense for impaired receivables during 2014 or 2013 financial years.
The loans to key management personnel are generally for a period of two years and are repayable on
quarterly instalments. These loans are unsecured and interest free.
During 2014, the Group used the legal services of one Company Director and the law firm over
which he exercises significant influence. The amounts billed related to this legal service amounted
to $21,000 (2013: $Nil), based on normal market rates and was fully paid as of the reporting date.
28.4 Transactions with defined benefit plan
The defined benefit plan is a related party. The defined benefit plan does not hold shares in Grant
Thornton CLEARR. The Group’s only transaction with the defined benefit plan relates to
contributions paid to the plan (see Note 22.3).
29 Contingent liabilities
Various warranty and legal claims were brought against the Group during the year. Unless
recognised as a provision (see Note 21), management considers these claims to be unjustified and
the probability that they will require settlement at the Group’s expense to be remote. This
evaluation is consistent with external independent legal advice.
Further information on these contingencies is omitted so as not to seriously prejudice the Group’s
position in the related disputes.
30 Capital commitments
2014 2013
$’000 $’000
Property, plant and equipment 1,304 190
Investment property - -
Intangible assets 97 -
1,401 190
Capital commitments relate to items of plant and IT equipment where funds have been committed
but the assets not yet received.
AASB 124.17(a) & (b) AASB 124.18(a) & (b)
AASB 124.18(c) AASB 124.18(d)
AASB 124.18(b)(i)
AASB 124.18
AASB 124.9(g)
AASB 101.14(d)(i) AASB 137.89
AASB 137.92
AASB 116.74c AASB 140.75h AASB 138.122e
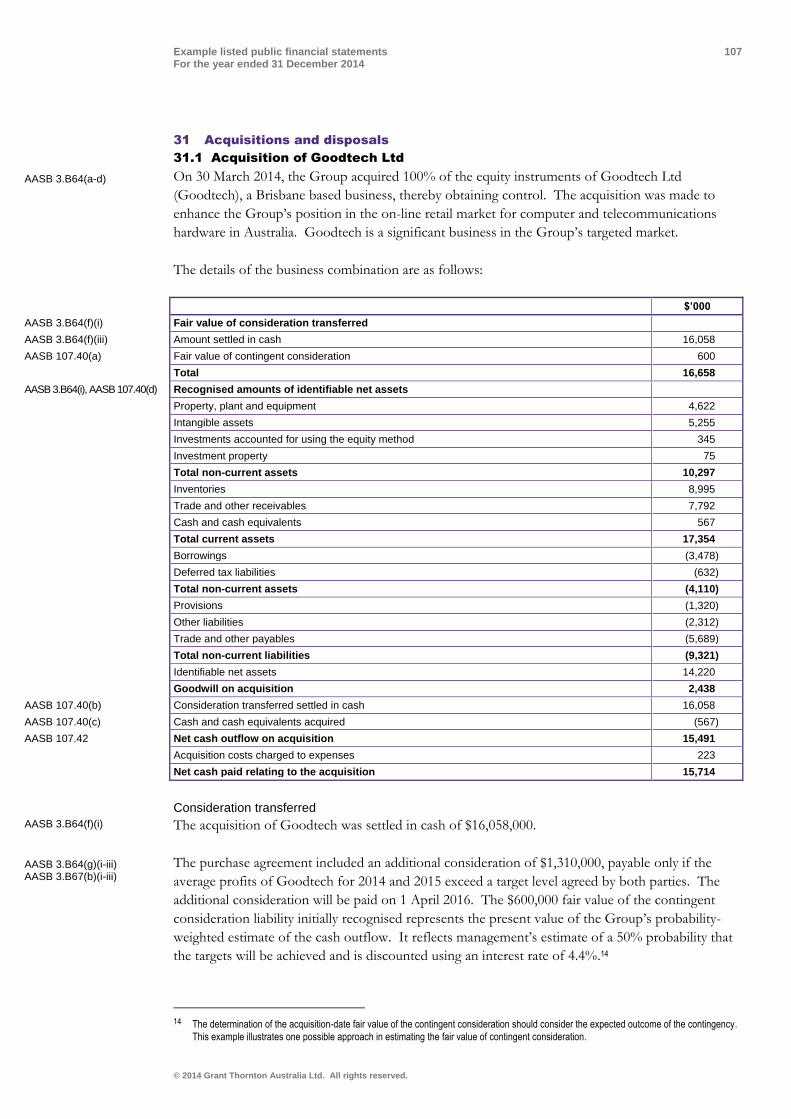
Example listed public financial statements 107 For the year ended 31 December 2014
© 2014 Grant Thornton Australia Ltd. All rights reserved.
31 Acquisitions and disposals
31.1 Acquisition of Goodtech Ltd
On 30 March 2014, the Group acquired 100% of the equity instruments of Goodtech Ltd
(Goodtech), a Brisbane based business, thereby obtaining control. The acquisition was made to
enhance the Group’s position in the on-line retail market for computer and telecommunications
hardware in Australia. Goodtech is a significant business in the Group’s targeted market.
The details of the business combination are as follows:
$’000
AASB 3.B64(f)(i) Fair value of consideration transferred
AASB 3.B64(f)(iii) Amount settled in cash 16,058
AASB 107.40(a) Fair value of contingent consideration 600
Total 16,658
AASB 3.B64(i), AASB 107.40(d) Recognised amounts of identifiable net assets
Property, plant and equipment 4,622
Intangible assets 5,255
Investments accounted for using the equity method 345
Investment property 75
Total non-current assets 10,297
Inventories 8,995
Trade and other receivables 7,792
Cash and cash equivalents 567
Total current assets 17,354
Borrowings (3,478)
Deferred tax liabilities (632)
Total non-current assets (4,110)
Provisions (1,320)
Other liabilities (2,312)
Trade and other payables (5,689)
Total non-current liabilities (9,321)
Identifiable net assets 14,220
Goodwill on acquisition 2,438
AASB 107.40(b) Consideration transferred settled in cash 16,058
AASB 107.40(c) Cash and cash equivalents acquired (567)
AASB 107.42 Net cash outflow on acquisition 15,491
Acquisition costs charged to expenses 223
Net cash paid relating to the acquisition 15,714
Consideration transferred
The acquisition of Goodtech was settled in cash of $16,058,000.
The purchase agreement included an additional consideration of $1,310,000, payable only if the
average profits of Goodtech for 2014 and 2015 exceed a target level agreed by both parties. The
additional consideration will be paid on 1 April 2016. The $600,000 fair value of the contingent
consideration liability initially recognised represents the present value of the Group’s probability-
weighted estimate of the cash outflow. It reflects management’s estimate of a 50% probability that
the targets will be achieved and is discounted using an interest rate of 4.4%.14
14 The determination of the acquisition-date fair value of the contingent consideration should consider the expected outcome of the contingency.
This example illustrates one possible approach in estimating the fair value of contingent consideration.
AASB 3.B64(a-d)
AASB 3.B64(f)(i)
AASB 3.B64(g)(i-iii) AASB 3.B67(b)(i-iii)

Example listed public financial statements 108 For the year ended 31 December 2014
© 2014 Grant Thornton Australia Ltd. All rights reserved.
As at 31 December 2014, there have been no changes in the estimate of the probable cash outflow
but the liability has increased to $620,000 due to the unwinding of the discount.
Acquisition-related costs amounting to $223,000 are not included as part of consideration
transferred and have been recognised as an expense in the consolidated statement of profit or loss
and other comprehensive income, as part of other expenses
Identifiable net assets
The fair value of the trade and other receivables acquired as part of the business combination
amounted to $7,792,000, with a gross contractual amount of $7,867,000. As of the acquisition date,
the Group’s best estimate of the contractual cash flow not expected to be collected amounted to
$75,000.
Goodwill
Goodwill of $2,438,000 is primarily related to growth expectations, expected future profitability, the
substantial skill and expertise of Goodtech’s workforce and expected cost synergies. Goodwill has
been allocated to cash-generating units at 31 December 2014. The goodwill that arose from this
business combination is not expected to be deductible for tax purposes.
Goodtech's contribution to the group results
Goodtech incurred a loss of $20,000 for the nine months from 30 March 2014 to the reporting date,
primarily due to integration costs. If Goodtech had been acquired on 1 January 2014, revenue of
the Group for 2014 would have been $212 million, and profit for the year would have increased by
$350,000.
31.2 Acquisition of Good Buy Inc.
On 30 June 2013, the Group acquired 100% of the equity instruments of Good Buy Inc. (Good
Buy), a Delaware (USA) based business, thereby obtaining control. The acquisition of Good Buy
was made to enhance the Group’s position as an on-line retailer for computer and
telecommunication hardware in the US market.
AASB 3.B64(m)
AASB 3.B64(h)(i-iii)
AASB 3.67(e) AASB 136.133 AASB 3.B64(k)
AASB 3.B64 (q)(i-iii)
AASB 3.B64(i)

Example listed public financial statements 109 For the year ended 31 December 2014
© 2014 Grant Thornton Australia Ltd. All rights reserved.
The details of the business combination are as follows:
$’000
AASB 3.B64(f) Fair value of consideration transferred
AASB 3.B64(f)(i) Amount settled in cash 12,420
AASB 107.40(a/d) Recognised amounts of identifiable net assets:
AASB 3.B64(i) property, plant and equipment 3,148
AASB 107.40(d) intangible assets 3,005
Total non-current assets 6,153
Inventories 5,469
Trade and other receivables 5,200
AASB 107.40(c) Cash and cash equivalents 345
Total current assets 11,014
Deferred tax liabilities (435)
Non-current liabilities (435)
Provisions and contingent liabilities (1,234)
Other liabilities (657)
Trade and other payables (4,990)
Total current liabilities (6,881)
Net identifiable assets and liabilities 9,851
Goodwill on acquisition 2,569
AASB 107.40(d) Consideration transferred settled in cash 12,420
AASB 107.40(c) Cash and cash equivalents acquired (345)
AASB 107.42 Net cash outflow on acquisition 12,075
Acquisition costs charged to expenses 76
Net cash paid relating to the acquisition 12,151
Consideration transferred
The acquisition of Good Buy was settled in cash amounting to $12,420,000.
Acquisition related costs amounting to $76,000 are not included as part of consideration transferred
and have been recognised as an expense in the consolidated statement of profit or loss and other
comprehensive income, as part of ‘other expenses’.
Identifiable net assets
The fair value of the trade and other receivables acquired as part of the business combination
amounted to $5,200,000, with a gross contractual amount of $5,350,000. As of the acquisition date,
the Group’s best estimate of the contractual cash flow not expected to be collected amounted to
$150,000.
Goodwill
Goodwill of $2,569,000 is primarily related to the sales force and the sales know-how of key
personnel of Good Buy. Goodwill has been allocated to the retail segment and is not expected to
be deductible for tax purposes.
Good Buy’s contribution to the Group results
Good Buy contributed $400,000 to the consolidated profit for the 6 months from 30 June 2013 to
31 December 2013. If Good Buy had been acquired on 1 January 2013, revenue of the Group for
2013 would have been $196 million. However, due to a lack of IFRS-specific data prior to the
acquisition of Good Buy, pro-forma profit or loss of the combined entity for the complete 2013
reporting period cannot be determined reliably.
AASB 3.B64(m)
AASB 3.B64(f)(i)
AASB 3.B64(h)(i-iii)
AASB 3.67 AASB 136.133 AASB 3.B64(e)
AASB 3.B64(q(ii))
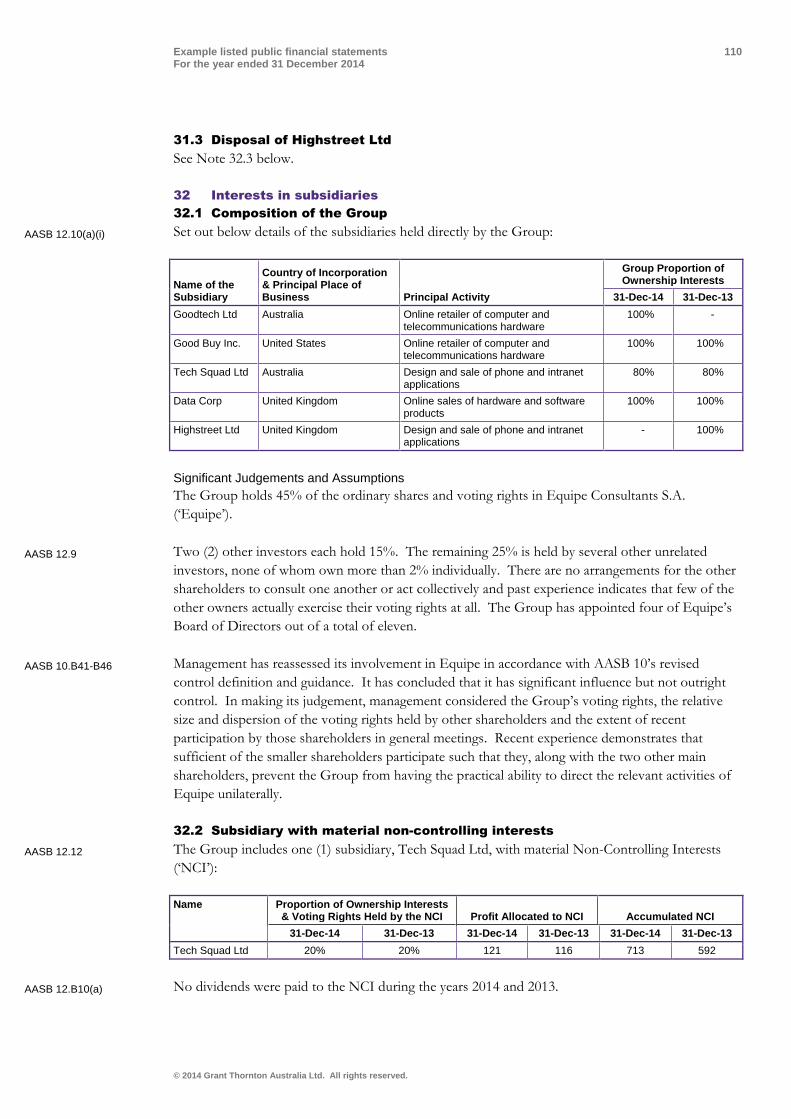
Example listed public financial statements 110 For the year ended 31 December 2014
© 2014 Grant Thornton Australia Ltd. All rights reserved.
31.3 Disposal of Highstreet Ltd
See Note 32.3 below.
32 Interests in subsidiaries
32.1 Composition of the Group
Set out below details of the subsidiaries held directly by the Group:
Name of the Subsidiary
Country of Incorporation & Principal Place of Business Principal Activity
Group Proportion of Ownership Interests
31-Dec-14 31-Dec-13
Goodtech Ltd Australia Online retailer of computer and telecommunications hardware
100% -
Good Buy Inc. United States Online retailer of computer and telecommunications hardware
100% 100%
Tech Squad Ltd Australia Design and sale of phone and intranet applications
80% 80%
Data Corp United Kingdom Online sales of hardware and software products
100% 100%
Highstreet Ltd United Kingdom Design and sale of phone and intranet applications
- 100%
Significant Judgements and Assumptions
The Group holds 45% of the ordinary shares and voting rights in Equipe Consultants S.A.
(‘Equipe’).
Two (2) other investors each hold 15%. The remaining 25% is held by several other unrelated
investors, none of whom own more than 2% individually. There are no arrangements for the other
shareholders to consult one another or act collectively and past experience indicates that few of the
other owners actually exercise their voting rights at all. The Group has appointed four of Equipe’s
Board of Directors out of a total of eleven.
Management has reassessed its involvement in Equipe in accordance with AASB 10’s revised
control definition and guidance. It has concluded that it has significant influence but not outright
control. In making its judgement, management considered the Group’s voting rights, the relative
size and dispersion of the voting rights held by other shareholders and the extent of recent
participation by those shareholders in general meetings. Recent experience demonstrates that
sufficient of the smaller shareholders participate such that they, along with the two other main
shareholders, prevent the Group from having the practical ability to direct the relevant activities of
Equipe unilaterally.
32.2 Subsidiary with material non-controlling interests
The Group includes one (1) subsidiary, Tech Squad Ltd, with material Non-Controlling Interests
(‘NCI’):
Name Proportion of Ownership Interests & Voting Rights Held by the NCI Profit Allocated to NCI Accumulated NCI
31-Dec-14 31-Dec-13 31-Dec-14 31-Dec-13 31-Dec-14 31-Dec-13
Tech Squad Ltd 20% 20% 121 116 713 592
No dividends were paid to the NCI during the years 2014 and 2013.
AASB 12.10(a)(i)
AASB 12.9
AASB 10.B41-B46
AASB 12.12
AASB 12.B10(a)

Example listed public financial statements 111 For the year ended 31 December 2014
© 2014 Grant Thornton Australia Ltd. All rights reserved.
Summarised financial information for Tech Squad Ltd, before intragroup eliminations, is set out
below:
2014 2013
$000 $000
Current assets 3,924 3,452
Non-current assets 5,019 5,182
Total assets 8,943 8,634
Current liabilities (1,561) (2,268)
Non-current liabilities (3,806) (3,402)
Total liabilities (5,367) (5,670)
Equity attributable to owners of the Parent 2,863 2,372
Non-controlling interests 713 592
2014 2013
$000 $000
Revenue 7,658 7,116
Profit for the year attributable to owners of the Parent 479 464
Profit for the year attributable to NCI 121 116
Profit for the year 600 580
Other Comprehensive Income for the year (All attributable to owners of the Parent) 6 4
Total comprehensive income for the year attributable to owners of the Parent 485 468
Total comprehensive income for the year attributable to NCI 121 116
Total comprehensive income for the year 606 584
2014 2013
$000 $000
Net cash from operating activities 957 779
Net cash used in investing activities (531) (673)
Net cash from / (used in) financing activities 446 (61)
Net cash inflow 872 45
32.3 Losing control over a subsidiary during the reporting period
On 30 September 2014, the Group disposed of its 100% equity interest in its subsidiary, Highstreet
Ltd (Highstreet). The subsidiary was classified as held for sale in the 2013 financial statements (see
Note 9).
AASB 12.12(g) AASB 12.B10(b)
AASB 107.40(b) AASB 107.40(d)

Example listed public financial statements 112 For the year ended 31 December 2014
© 2014 Grant Thornton Australia Ltd. All rights reserved.
The consideration was received in 2014. At the date of disposal, the carrying amounts of
Highstreet’s net assets were as follows:
$’000
Property, plant and equipment 2,475
Total non-current assets 2,475
Inventories 1,121
AASB 107.40(c) Cash and cash equivalents -
Total current assets 1,121
Provisions (232)
Borrowings (8)
Trade and other payables (210)
Total current liabilities (450)
Total net assets 3,146
AASB 107.40(a) Total consideration received in cash 3,117
Cash and cash equivalents disposed of -
AASB 107.42 Net cash received 3,117
AASB 10.25 Loss on disposal (29)
The loss on disposal is included in the loss for the year from discontinued operations in the
consolidated statement of profit or loss. See Note 9.
32.4 Interests in unconsolidated structured entities
The Group has no interests in unconsolidated structured entities.
33 Leases
33.1 Finance leases as lessee
The Group’s main warehouse and related facilities and certain IT equipment are held under finance
lease arrangements. As of 31 December 2014, the net carrying amount of the warehouse and related
facilities held under finance lease arrangements (included as part of buildings) is $3,362,000 (2013:
$3,723,000); and the net carrying amount of the IT equipment held under finance lease
arrangements (included as part of IT equipment) is $231,000 (2013: $480,000) (see Note 15).
The Group’s finance lease liabilities, which are secured by the related assets held under finance
leases, are classified as follows:
Finance Lease Liabilities 2014 2013
$’000 $’000
Current:
finance lease liabilities 512 506
Non-current:
finance lease liabilities 4,060 4,459
AASB 12.19(b)
AASB 12.24
AASB 117.31(a)

Example listed public financial statements 113 For the year ended 31 December 2014
© 2014 Grant Thornton Australia Ltd. All rights reserved.
Future minimum finance lease payments at the end of each reporting period under review were as
follows:
Minimum Lease Payments Due
Within 1 year 1-5 years After 5 years Total
$’000 $’000 $’000 $’000
31 December 2014
AASB 117.31(b) Lease payments 727 1,415 3,539 5,681
Finance charges (215) (330) (528) (1,073)
Net present values 512 1,085 3,011 4,608
31 December 2013
AASB 117.31(b) Lease payments 726 1,432 4,072 6,230
Finance charges (220) (336) (560) (1,116)
Net present values 506 1,096 3,512 5,114
The lease agreement for the main warehouse includes fixed lease payments and a purchase option at
the end of the ten (10) year lease term. The agreement is non-cancellable but does not contain any
further restrictions.
33.2 Operating leases as lessee
The Group leases an office and production building under an operating lease. The future minimum
lease payments are as follows:
Minimum Lease Payments Due
Within 1 year 1-5 years After 5 years Total
$’000 $’000 $’000 $’000
AASB 117.35(a) 31 December 2014 4,211 12,567 25,678 42,456
31 December 2013 3,431 12,100 24,342 39,873
Lease expense during the period amounted to $3,568,000 (2013: $3,398,000) representing the
minimum lease payments.
The rental contract has a non-cancellable term of 15 years. The building was subject to a sale and
lease back transaction in 2005. A related gain was included in other liabilities (see Note 23) and is
being amortised over the remaining lease term.
33.3 Operating leases as lessor
The Group leases out investment properties on operating leases (see Note 16).
34 Financial instrument risk
34.1 Risk management objectives and policies
The Group is exposed to various risks in relation to financial instruments. The Group’s financial
assets and liabilities by category are summarised in Note 12.1. The main types of risks are market
risk, credit risk and liquidity risk.
The Group’s risk management is coordinated at its headquarters, in close cooperation with the
Board of Directors, and focuses on actively securing the Group's short to medium-term cash flows
by minimising the exposure to financial markets. Long-term financial investments are managed to
generate lasting returns.
AASB 117.31(e)
AASB 117.35(c) AASB 117.35(b)
AASB 117.35(d)
AASB 101.114(d)(ii) AASB 7.33
AASB 7.IG15

Example listed public financial statements 114 For the year ended 31 December 2014
© 2014 Grant Thornton Australia Ltd. All rights reserved.
The Group does not actively engage in the trading of financial assets for speculative purposes nor
does it write options. The most significant financial risks to which the Group is exposed are
described below.
34.2 Market risk analysis
The Group is exposed to market risk through its use of financial instruments and specifically to
currency risk, interest rate risk and certain other price risks, which result from both its operating and
investing activities.
Foreign Currency Sensitivity
Most of the Group’s transactions are carried out in AUD. Exposures to currency exchange rates
arise from the Group’s overseas sales and purchases, which are primarily denominated in US dollars
(USD) and Pound Sterling (GBP). The Group also holds an investment in a USD bond. Further,
the Group has a USD loan designated at fair value through profit or loss, which has been used to
fund the purchase of investment property in the United States.
To mitigate the Group’s exposure to foreign currency risk, non-AUD cash flows are monitored and
forward exchange contracts are entered into in accordance with the Group’s risk management
policies. Generally, the Group’s risk management procedures distinguish short-term foreign
currency cash flows (due within six months) from longer-term cash flows (due after six months).
Where the amounts to be paid and received in a specific currency are expected to largely offset one
another, no further hedging activity is undertaken. Forward exchange contracts are mainly entered
into for significant long-term foreign currency exposures that are not expected to be offset by other
currency transactions.
The Group does not enter into forward exchange contracts to mitigate the exposure to foreign
currency risk on the Group’s $USD loan used to fund the purchase of US investment property. The
loan is designated at fair value through profit and loss to significantly reduce measurement
inconsistencies between investment properties and the related loan. The $USD fair value of the
loan and the related properties are both translated into $AUD at the prevailing spot exchange rate.
Accordingly foreign currency fluctuations on the investment property are largely mitigated by
offsetting movements on the related loan.
Foreign currency denominated financial assets and liabilities which expose the Group to currency
risk are disclosed below. The amounts shown are those reported to key management translated into
$AUD at the closing rate:
Short Term Exposure Long Term Exposure
AASB 7.34(a) USD GBP Other USD GBP Other
AASB 7.34(c) $’000 $’000 $’000 $’000 $’000 $’000
31 December 2014:
financial assets 4,518 3,629 308 1,363 - -
financial liabilities 710 1,658 - - - -
Total Exposure 3,808 1,971 308 1,363 - -
31 December 2013:
financial assets 2,920 1,840 233 1,442 - -
financial liabilities 586 1,368 - - - -
Total Exposure 2,334 472 233 1,442 - -
AASB 7.33(a)
AASB 7.33(b) AASB 7.IG15 AASB 7.33(c)

Example listed public financial statements 115 For the year ended 31 December 2014
© 2014 Grant Thornton Australia Ltd. All rights reserved.
The following table illustrates the sensitivity of profit and equity in regards to the Group’s financial
assets and financial liabilities and the $USD / $AUD exchange rate and £GBP / $AUD exchange
rate ‘all other things being equal’. It assumes a +/- 10% change of the $AUD / $USD exchange
rate for the year ended at 31 December 2014 (2013: 10%). A +/- 5% change is considered for the
$AUD/£GBP exchange rate (2013: 5%). Both of these percentages have been determined based on
the average market volatility in exchange rates in the previous twelve (12) months. The sensitivity
analysis is based on the Group’s foreign currency financial instruments held at each reporting date
and also takes into account forward exchange contracts that offset effects from changes in currency
exchange rates.
If the $AUD had strengthened against the $USD by 10% (2013: 10%) and £GBP by 5% (2013: 5%)
respectively then this would have had the following impact:
Profit for the Year Equity
USD GBP Total USD GBP Total
$’000 £’000 $’000 $’000 £’000 $’000
31 December 2014 (97) (99) (196) (47) (99) (146)
31 December 2013 (53) (24) (77) (3) (24) (27)
If the AUD had weakened against the USD by 10% (2013: 10%) and GBP by 5% (2013: 5%)
respectively then this would have had the following impact:
Profit for the Year Equity
USD GBP Total USD GBP Total
$’000 £’000 $’000 $’000 £’000 $’000
31 December 2014 97 97 194 37 97 134
31 December 2013 53 20 73 13 20 33
Exposures to foreign exchange rates vary during the year depending on the volume of overseas
transactions. Nonetheless, the analysis above is considered to be representative of the Group’s
exposure to currency risk.
Interest rate sensitivity
The Group’s policy is to minimise interest rate cash flow risk exposures on long-term financing.
Longer-term borrowings are therefore usually at fixed rates. At 31 December 2014, the Group is
exposed to changes in market interest rates through bank borrowings at variable interest rates.
Other borrowings are at fixed interest rates. The Group’s investments in bonds all pay fixed interest
rates. The exposure to interest rates for the Group's money market funds is considered immaterial.
The following table illustrates the sensitivity of profit and equity to a reasonably possible change in
interest rates of +/- 1% (2013: +/- 1%). These changes are considered to be reasonably possible
based on observation of current market conditions. The calculations are based on a change in the
average market interest rate for each period, and the financial instruments held at each reporting
date that are sensitive to changes in interest rates. All other variables are held constant.
Profit for the Year Equity
$’000 $’000
+1% -1% +1% -1%
31 December 2014 36 (36) 26 (16)
31 December 2013 32 (32) 23 (14)
AASB 7.40(a) AASB 7.40(b) AASB 7.IG36
AASB 7.42
AASB 7.33(a) AASB 7.33(b)
AASB 7.40(b) AASB 7.IG36
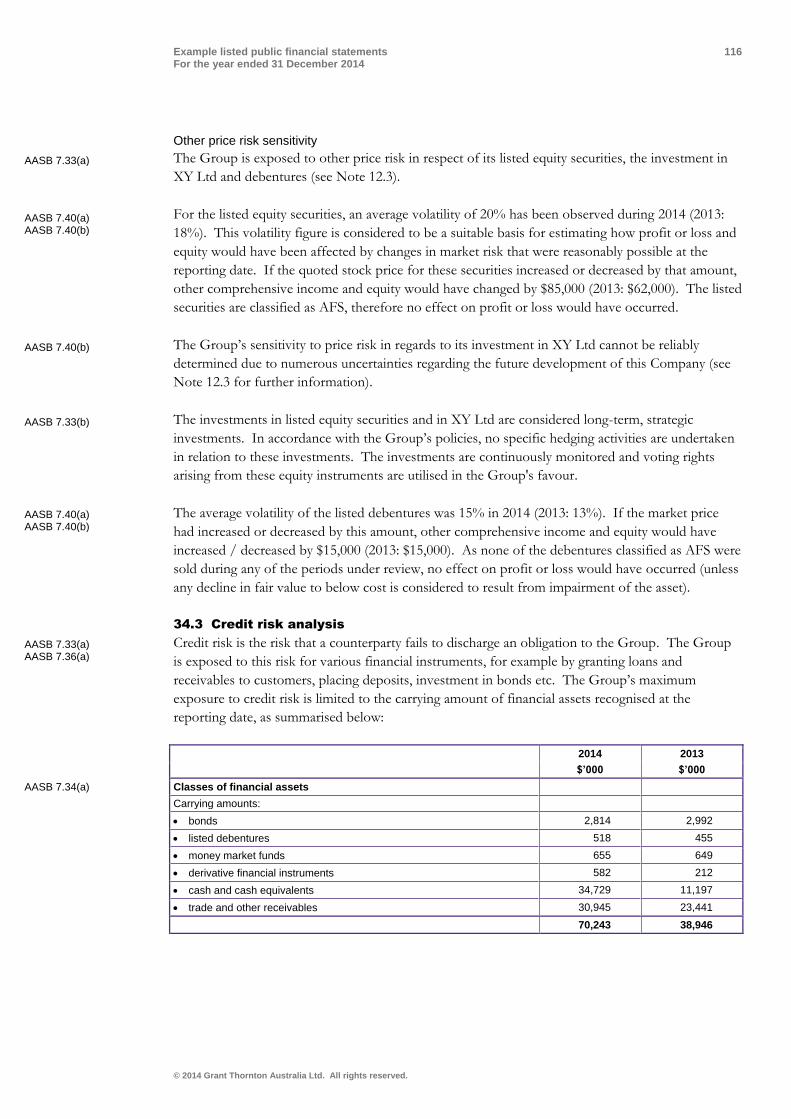
Example listed public financial statements 116 For the year ended 31 December 2014
© 2014 Grant Thornton Australia Ltd. All rights reserved.
Other price risk sensitivity
The Group is exposed to other price risk in respect of its listed equity securities, the investment in
XY Ltd and debentures (see Note 12.3).
For the listed equity securities, an average volatility of 20% has been observed during 2014 (2013:
18%). This volatility figure is considered to be a suitable basis for estimating how profit or loss and
equity would have been affected by changes in market risk that were reasonably possible at the
reporting date. If the quoted stock price for these securities increased or decreased by that amount,
other comprehensive income and equity would have changed by $85,000 (2013: $62,000). The listed
securities are classified as AFS, therefore no effect on profit or loss would have occurred.
The Group’s sensitivity to price risk in regards to its investment in XY Ltd cannot be reliably
determined due to numerous uncertainties regarding the future development of this Company (see
Note 12.3 for further information).
The investments in listed equity securities and in XY Ltd are considered long-term, strategic
investments. In accordance with the Group’s policies, no specific hedging activities are undertaken
in relation to these investments. The investments are continuously monitored and voting rights
arising from these equity instruments are utilised in the Group's favour.
The average volatility of the listed debentures was 15% in 2014 (2013: 13%). If the market price
had increased or decreased by this amount, other comprehensive income and equity would have
increased / decreased by $15,000 (2013: $15,000). As none of the debentures classified as AFS were
sold during any of the periods under review, no effect on profit or loss would have occurred (unless
any decline in fair value to below cost is considered to result from impairment of the asset).
34.3 Credit risk analysis
Credit risk is the risk that a counterparty fails to discharge an obligation to the Group. The Group
is exposed to this risk for various financial instruments, for example by granting loans and
receivables to customers, placing deposits, investment in bonds etc. The Group’s maximum
exposure to credit risk is limited to the carrying amount of financial assets recognised at the
reporting date, as summarised below:
2014 2013
$’000 $’000
AASB 7.34(a) Classes of financial assets
Carrying amounts:
bonds 2,814 2,992
listed debentures 518 455
money market funds 655 649
derivative financial instruments 582 212
cash and cash equivalents 34,729 11,197
trade and other receivables 30,945 23,441
70,243 38,946
AASB 7.33(a)
AASB 7.40(a) AASB 7.40(b)
AASB 7.40(b)
AASB 7.33(b)
AASB 7.40(a) AASB 7.40(b)
AASB 7.33(a) AASB 7.36(a)

Example listed public financial statements 117 For the year ended 31 December 2014
© 2014 Grant Thornton Australia Ltd. All rights reserved.
The Group continuously monitors defaults of customers and other counterparties, identified either
individually or by group and incorporates this information into its credit risk controls. Where
available at reasonable cost, external credit ratings and/or reports on customers and other
counterparties are obtained and used. The Group’s policy is to deal only with creditworthy
counterparties.
The Group’s management considers that all of the above financial assets that are not impaired or
past due for each of the 31 December reporting dates under review are of good credit quality.
At 31 December, the Group has certain trade receivables that have not been settled by the
contractual due date but are not considered to be impaired. The amounts at 31 December analysed
by the length of time past due, are:
2014 2013
$’000 $’000
Not more three (3) months 671 602
More than three (3) months but not more than six (6) months 90 88
More than six (6) months but not more than one (1) year 55 15
More than one (1) year 2 1
Total 818 706
In respect of trade and other receivables, the Group is not exposed to any significant credit risk
exposure to any single counterparty or any group of counterparties having similar characteristics.
Trade receivables consist of a large number of customers in various industries and geographical
areas. Based on historical information about customer default rates management consider the credit
quality of trade receivables that are not past due or impaired to be good.
The credit risk for cash and cash equivalents, money market funds, debentures and derivate financial
instruments is considered negligible, since the counterparties are reputable banks with high quality
external credit ratings.
No impairment loss has been recorded in relation to the bonds (HTM investments, see Note 12.2)
which have been graded AA by Standard & Poors and bonds are not past due. The carrying
amounts disclosed above are the Group’s maximum possible credit risk exposure in relation to these
instruments.
34.4 Liquidity risk analysis
Liquidity risk is the risk that the Group might be unable to meet its obligations. The Group
manages its liquidity needs by monitoring scheduled debt servicing payments for long-term financial
liabilities as well as forecast cash inflows and outflows due in day-to-day business. The data used for
analysing these cash flows is consistent with that used in the contractual maturity analysis below.
Liquidity needs are monitored in various time bands, on a day-to-day and week-to-week basis, as
well as on the basis of a rolling 30-day projection. Long-term liquidity needs for a 180-day and a
360-day lookout period are identified monthly. Net cash requirements are compared to available
borrowing facilities in order to determine headroom or any shortfalls. This analysis shows that
available borrowing facilities are expected to be sufficient over the lookout period.
AASB 7.33(b)
AASB 7.36(c)
AASB 7.37(a) AASB 7.IG28
AASB 7.36(c) AASB 7.IG23
AASB 7.36(c)
AASB 7.36(a) AASB 7.36(c) AASB 7.IG23(a) AASB 7.20(e)
AASB 7.33(a) AASB 7.33(b) AASB 7.39(c)

Example listed public financial statements 118 For the year ended 31 December 2014
© 2014 Grant Thornton Australia Ltd. All rights reserved.
The Group’s objective is to maintain cash and marketable securities to meet its liquidity
requirements for 30-day periods at a minimum. This objective was met for the reporting periods.
Funding for long-term liquidity needs is additionally secured by an adequate amount of committed
credit facilities and the ability to sell long-term financial assets.
The Group considers expected cash flows from financial assets in assessing and managing liquidity
risk, in particular its cash resources and trade receivables. The Group’s existing cash resources and
trade receivables (see Note 12) significantly exceed the current cash outflow requirements. Cash
flows from trade and other receivables are all contractually due within six (6) months.
As at 31 December 2014, the Group’s non-derivative financial liabilities have contractual maturities
(including interest payments where applicable) as summarised below:
Current Non-Current
AASB 7.39(a) Within 6 months 6 - 12 months 1 - 5 years 5+ years
AASB 7.B11 $’000 $’000 $’000 $’000
31 December 2014
US-Dollar loans 280 280 1,761 8,215
Other bank borrowings 4,565 - - -
Non-convertible bond 208 208 8,888 -
Finance lease obligations 364 364 1,415 3,539
Trade and other payables 8,547 - - -
Total 13,964 852 12,064 11,754
This compares to the maturity of the Group’s non-derivative financial liabilities in the previous
reporting periods as follows:
Current Non-Current
AASB 7.39(a) Within 6 months 6 - 12 months 1 - 5 years 5+ years
AASB 7.B11 $’000 $’000 $’000 $’000
31 December 2013
US-Dollar loans 289 289 1,781 8,508
Other bank borrowings 3,124 - - -
Non-convertible bond 208 208 9,303 -
Finance lease obligations 363 363 1,432 4,072
Trade and other payables 6,590 - - -
Total 10,574 860 12,516 12,580
The above amounts reflect the contractual undiscounted cash flows, which may differ to the
carrying values of the liabilities at the reporting date. The subordinated shareholder loan amounting
to $5,000,000 throughout all reporting periods is not included as this is only repayable upon
liquidation of Grant Thornton CLEARR. Annual interest payments amount to $200,000.
AASB 7.39(c) AASB 7.B11F
AASB 7.B11E

Example listed public financial statements 119 For the year ended 31 December 2014
© 2014 Grant Thornton Australia Ltd. All rights reserved.
In assessing and managing liquidity risks of its derivative financial instruments, the Group considers
both contractual inflows and outflows. As at 31 December 2014, the contractual cash flows of the
Group’s derivative financial assets and liabilities are as follows:
Current
AASB 7.39(b) Within 6 months 6 - 12 months
AASB 7.B11 31 December 2014 $’000 $’000
Gross settled forward contracts:
cash outflow (212) (6,978)
cash inflow 300 7,509
Total 88 531
This compares to the contractual cash flows of the Group’s derivative financial assets and liabilities
in the previous reporting periods as follows:
Current
AASB 7.39(b) Within 6 months 6 - 12 months
AASB 7.B11 31 December 2013 $’000 $’000
Gross settled forward contracts:
cash outflow (190) (7,100)
cash inflow 203 7,050
Total 13 (50)
Derivative financial instruments reflect forward exchange contracts (see Note 12.4) that will be
settled on a gross basis.
35 Fair value measurement
35.1 Fair value measurement of financial instruments
Financial assets and financial liabilities measured at fair value in the statement of financial position
are grouped into three levels of a fair value hierarchy. The three levels are defined based on the
observability of significant inputs to the measurement, as follows:
level 1: quoted prices (unadjusted) in active markets for identical assets or liabilities
level 2: inputs other than quoted prices included within level 1 that are observable for the asset or liability, either directly or indirectly
level 3: unobservable inputs for the asset or liability
AASB 7.34(a)
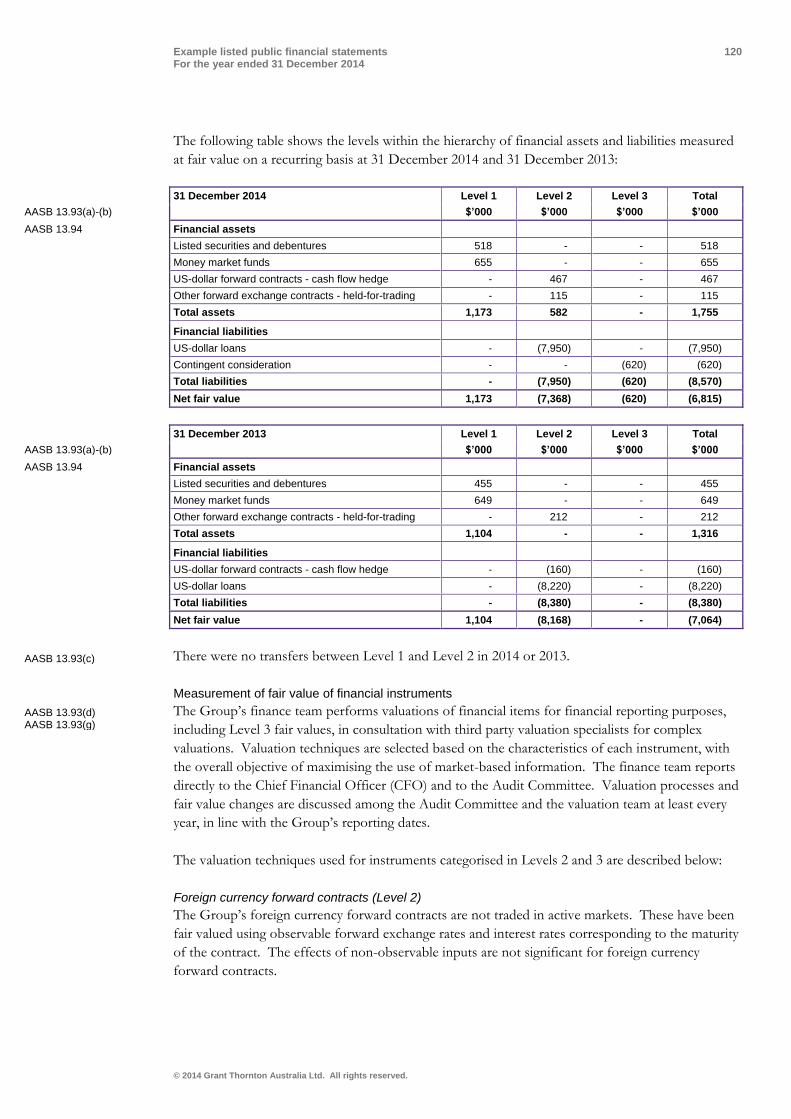
Example listed public financial statements 120 For the year ended 31 December 2014
© 2014 Grant Thornton Australia Ltd. All rights reserved.
The following table shows the levels within the hierarchy of financial assets and liabilities measured
at fair value on a recurring basis at 31 December 2014 and 31 December 2013:
31 December 2014 Level 1 Level 2 Level 3 Total
AASB 13.93(a)-(b) $’000 $’000 $’000 $’000
AASB 13.94 Financial assets
Listed securities and debentures 518 - - 518
Money market funds 655 - - 655
US-dollar forward contracts - cash flow hedge - 467 - 467
Other forward exchange contracts - held-for-trading - 115 - 115
Total assets 1,173 582 - 1,755
Financial liabilities
US-dollar loans - (7,950) - (7,950)
Contingent consideration - - (620) (620)
Total liabilities - (7,950) (620) (8,570)
Net fair value 1,173 (7,368) (620) (6,815)
31 December 2013 Level 1 Level 2 Level 3 Total
AASB 13.93(a)-(b) $’000 $’000 $’000 $’000
AASB 13.94 Financial assets
Listed securities and debentures 455 - - 455
Money market funds 649 - - 649
Other forward exchange contracts - held-for-trading - 212 - 212
Total assets 1,104 - - 1,316
Financial liabilities
US-dollar forward contracts - cash flow hedge - (160) - (160)
US-dollar loans - (8,220) - (8,220)
Total liabilities - (8,380) - (8,380)
Net fair value 1,104 (8,168) - (7,064)
There were no transfers between Level 1 and Level 2 in 2014 or 2013.
Measurement of fair value of financial instruments
The Group’s finance team performs valuations of financial items for financial reporting purposes,
including Level 3 fair values, in consultation with third party valuation specialists for complex
valuations. Valuation techniques are selected based on the characteristics of each instrument, with
the overall objective of maximising the use of market-based information. The finance team reports
directly to the Chief Financial Officer (CFO) and to the Audit Committee. Valuation processes and
fair value changes are discussed among the Audit Committee and the valuation team at least every
year, in line with the Group’s reporting dates.
The valuation techniques used for instruments categorised in Levels 2 and 3 are described below:
Foreign currency forward contracts (Level 2)
The Group’s foreign currency forward contracts are not traded in active markets. These have been
fair valued using observable forward exchange rates and interest rates corresponding to the maturity
of the contract. The effects of non-observable inputs are not significant for foreign currency
forward contracts.
AASB 13.93(c)
AASB 13.93(d) AASB 13.93(g)

Example listed public financial statements 121 For the year ended 31 December 2014
© 2014 Grant Thornton Australia Ltd. All rights reserved.
US-Dollar loans (Level 2)
The fair values of the US-dollar loans are estimated using a discounted cash flow approach, which
discounts the contractual cash flows using discount rates derived from observable market interest
rates of similar loans with similar risk. The interest rate used for this calculation is 3.9%.
Contingent consideration (Level 3)
The fair value of contingent consideration related to the acquisition of Goodtech (see Note 31.1) is
estimated using a present value technique. The $620,000 fair value is estimated by probability-
weighting the estimated future cash outflows, adjusting for risk and discounting at 4.4%. The
probability-weighted cash outflows before discounting are $655,000 and reflect the management’s
estimate of a 50% probability that the contract’s target level will be achieved. The discount rate
used is 4.4%, based on the Group’s estimated incremental borrowing rate for unsecured liabilities at
the reporting date, and therefore reflects the Group’s credit position. The effects on the fair value
of risk and uncertainty in the future cash flows are dealt with by adjusting the estimated cash flows
rather than adjusting the discount rate.
The following table provides information about the sensitivity of the fair value measurement to
changes in the most significant inputs:
Significant Unobservable Input Estimate of the Input Sensitivity of the Fair Value Measurement to Input
Probability of meeting target 50% An increase to 60% (decrease to 40%) would increase (decrease) fair value by $125,000.
Level 3 Fair Value Measurements
The reconciliation of the carrying amounts of financial instruments classified within Level 3 is as
follows:
Contingent Consideration
2014 2013
$’000 $’000
AASB 13.93(e) Balance at 1 January 2014 - -
AASB 13.93(e)(iii) Acquired through business combination (600) -
Losses recognised in profit or loss under:
AASB 13.93(e)(i) finance costs (20) -
Balance at 31 December 2014 (620) -
AASB 13.93(f) Total amount included in profit or loss for unrealised losses on Level 3 instruments under finance costs (20) -
Financial instruments measured at amortised cost for which the fair value is disclosed
See Notes 12.2 and 12.6.
AASB 13.93(d) AASB 13.93(h)
AASB 13.97
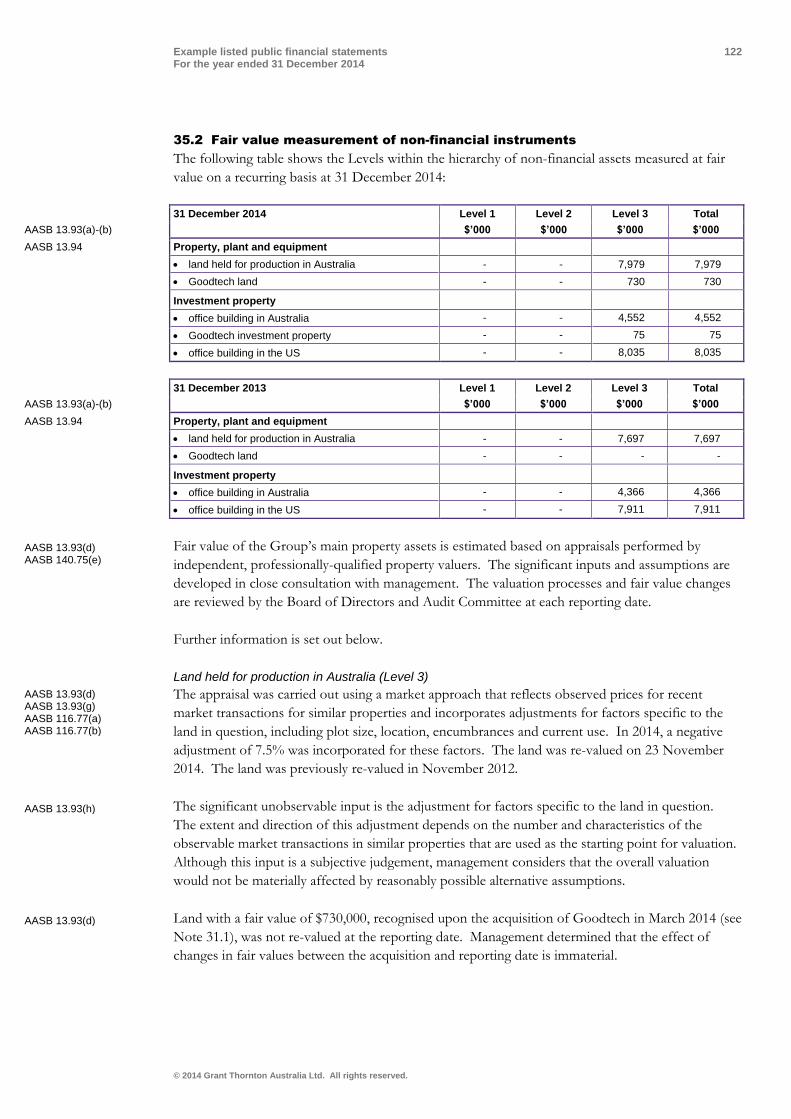
Example listed public financial statements 122 For the year ended 31 December 2014
© 2014 Grant Thornton Australia Ltd. All rights reserved.
35.2 Fair value measurement of non-financial instruments
The following table shows the Levels within the hierarchy of non-financial assets measured at fair
value on a recurring basis at 31 December 2014:
31 December 2014 Level 1 Level 2 Level 3 Total
AASB 13.93(a)-(b) $’000 $’000 $’000 $’000
AASB 13.94 Property, plant and equipment
land held for production in Australia - - 7,979 7,979
Goodtech land - - 730 730
Investment property
office building in Australia - - 4,552 4,552
Goodtech investment property - - 75 75
office building in the US - - 8,035 8,035
31 December 2013 Level 1 Level 2 Level 3 Total
AASB 13.93(a)-(b) $’000 $’000 $’000 $’000
AASB 13.94 Property, plant and equipment
land held for production in Australia - - 7,697 7,697
Goodtech land - - - -
Investment property
office building in Australia - - 4,366 4,366
office building in the US - - 7,911 7,911
Fair value of the Group’s main property assets is estimated based on appraisals performed by
independent, professionally-qualified property valuers. The significant inputs and assumptions are
developed in close consultation with management. The valuation processes and fair value changes
are reviewed by the Board of Directors and Audit Committee at each reporting date.
Further information is set out below.
Land held for production in Australia (Level 3)
The appraisal was carried out using a market approach that reflects observed prices for recent
market transactions for similar properties and incorporates adjustments for factors specific to the
land in question, including plot size, location, encumbrances and current use. In 2014, a negative
adjustment of 7.5% was incorporated for these factors. The land was re-valued on 23 November
2014. The land was previously re-valued in November 2012.
The significant unobservable input is the adjustment for factors specific to the land in question.
The extent and direction of this adjustment depends on the number and characteristics of the
observable market transactions in similar properties that are used as the starting point for valuation.
Although this input is a subjective judgement, management considers that the overall valuation
would not be materially affected by reasonably possible alternative assumptions.
Land with a fair value of $730,000, recognised upon the acquisition of Goodtech in March 2014 (see
Note 31.1), was not re-valued at the reporting date. Management determined that the effect of
changes in fair values between the acquisition and reporting date is immaterial.
AASB 13.93(d) AASB 140.75(e)
AASB 13.93(d) AASB 13.93(g) AASB 116.77(a) AASB 116.77(b)
AASB 13.93(h)
AASB 13.93(d)

Example listed public financial statements 123 For the year ended 31 December 2014
© 2014 Grant Thornton Australia Ltd. All rights reserved.
Office buildings in Australia and the US (Level 3)
The fair values of the office buildings are estimated using an income approach which capitalises the
estimated rental income stream, net of projected operating costs, using a discount rate derived from
market yields implied by recent transactions in similar properties. When actual rent differs
materially from the estimated rents, adjustments have been made to the estimated rental value. The
estimated rental stream takes into account current occupancy level, estimates of future vacancy
levels, the terms of in-place leases and expectations for rentals from future leases over the remaining
economic life of the buildings. The office buildings are re-valued annually on 31 December.
The most significant inputs, all of which are unobservable, are the estimated rental value,
assumptions about vacancy levels, and the discount rate. The estimated fair value increases if the
estimated rental increases, vacancy levels decline or if discount rate (market yields) decline. The
overall valuations are sensitive to all three assumptions. Management considers the range of
reasonably possible alternative assumptions is greatest for rental values and vacancy levels and that
there is also an interrelationship between these inputs. The inputs used in the valuations at 31
December 2014 were:
Australia US
Rental value AUD $108/sqm USD $65/sqm
Vacancy levels 9.0% 11.0%
Discount rate (market yield) 4.4% 3.7%
An investment property with a fair value of $75,000, recognised upon the acquisition of Goodtech
(see Note 31.1) in March 2014, was not re-valued at the reporting date. Management determined
that the effect of changes in fair values between the acquisition and reporting date is immaterial.
The reconciliation of the carrying amounts of non-financial assets classified within Level 3 is as
follows:
PP&E Investment Properties
AASB 7.39(a) AASB 7.B11
Land Held for Production Australia US
$’000 $’000 $’000
AASB 13.93(e) 1 January 2014 7,697 4,366 7,911
AASB 13.93(e)(i) Gains recognised in profit or loss:
increase in fair value of investment property - 186 124
AASB 13.93(e)(ii) Gains recognised in other comprehensive income:
revaluation of land 303 - -
exchange differences on translating foreign operations (21) - -
AASB 13.93(e)(iii) Acquired in business combination 730 75 -
Balance at 31 December 2014 8,709 4,627 8,035
AASB 13.93(f) Total amount included in profit or loss for unrealised gains on Level 3 assets - 186 124
AASB 13.93(d)
AASB 13.93(h)
AASB 13.93(h)

Example listed public financial statements 124 For the year ended 31 December 2014
© 2014 Grant Thornton Australia Ltd. All rights reserved.
PP&E Investment Properties
AASB 7.39(a) AASB 7.B11
Land Held for Production Australia US
$’000 $’000 $’000
AASB 13.93(e) 1 January 2013 7,697 4,293 7,809
AASB 13.93(e)(i) Gains recognised in profit or loss:
increase in fair value of investment property - 73 102
AASB 13.93(e)(ii) Gains recognised in other comprehensive income:
revaluation of land - - -
exchange differences on translating foreign operations - - -
Balance at 31 December 2013 7,697 4,366 7,911
AASB 13.93(f) Total amount included in profit or loss for unrealised gains on Level 3 assets - 73 102
36 Capital management policies and procedures
The Group’s capital management objectives are:
to ensure the Group’s ability to continue as a going concern; and
to provide an adequate return to shareholders
by pricing products and services commensurately with the level of risk.
The Group monitors capital on the basis of the carrying amount of equity plus its subordinated
loan, less cash and cash equivalents as presented on the face of the statement of financial position
and cash flow hedges recognised in other comprehensive income.
The Group’s goal in capital management is to maintain a capital-to-overall financing ratio of 1:6 to
1:4. This is in line with the Group’s covenants resulting from the subordinated loan it has taken out
from its main shareholder in 2011.
Management assesses the Group’s capital requirements in order to maintain an efficient overall
financing structure while avoiding excessive leverage. This takes into account the subordination
levels of the Group’s various classes of debt. The Group manages the capital structure and makes
adjustments to it in the light of changes in economic conditions and the risk characteristics of the
underlying assets. In order to maintain or adjust the capital structure, the Group may adjust the
amount of dividends paid to shareholders, return capital to shareholders, issue new shares, or sell
assets to reduce debt.
AASB 101.134
AASB 101.135(a)(i)
AASB 101.135(a)(ii)
AASB 101.135(a)(iii)

Example listed public financial statements 125 For the year ended 31 December 2014
© 2014 Grant Thornton Australia Ltd. All rights reserved.
The amounts managed as capital by the Group for the reporting periods under review are summarised as follows:
2014 2013
$’000 $’000
AASB 101.135(b) Total equity 88,242 54,009
Subordinated loan 5,000 5,000
Cash flow hedges (469) 160
Cash and cash equivalents (34,729) (11,197)
Capital 58,004 47,972
Total equity 88,242 54,009
Borrowings 25,815 24,644
Overall financing 114,057 78,653
Capital-to-overall financing ratio 0.51 0.61
The Group has honoured its covenant obligations, including maintaining capital ratios, since the subordinated loan was taken out in 2011. The ratio reduction during 2014 is primarily a result of financing the acquisition of Goodtech (see Note 31.1).
37 Parent Entity information
Information relating to Grant Thornton CLEARR (‘the Parent Entity’):
2014 2013
$’000 $’000
Statement of financial position
Current assets 56,816 40,220
Total assets 96,751 96,153
Current liabilities 5,942 11,784
Total liabilities 41,355 54,015
Net assets 55,396 42,138
Issued capital 13,770 12,000
Retained earnings 40,480 29,314
Asset revaluation reserve 800 689
Available for sale reserve 98 35
Cash flow hedge reserve 248 100
Total equity 55,396 42,138
Statement of profit or loss and other comprehensive income
Profit for the year 11,166 9,457
Other comprehensive income 322 258
Total comprehensive income 11,488 9,715
The Parent Entity has capital commitments of $1.1m to purchase plant and IT equipment (2013: $Nil). Refer Note 30 for further details of the commitment.
The Parent Entity has not entered into a deed of cross guarantee nor are there any contingent liabilities at the year end.
38 Post-reporting date events
No adjusting or significant non-adjusting events have occurred between the reporting date and the date of authorisation.
AASB 101.135(d)

Example listed public financial statements 126 For the year ended 31 December 2014
© 2014 Grant Thornton Australia Limited. All rights reserved.
Directors’ Declaration
1 In the opinion of the Directors of Grant Thornton CLEARR Example Ltd:
a The consolidated financial statements and notes of Grant Thornton CLEARR Example Ltd are in accordance with the Corporations Act 2001, including
i Giving a true and fair view of its financial position as at 31 December 2014 and of its performance for the financial year ended on that date; and
ii Complying with Australian Accounting Standards (including the Australian Accounting Interpretations) and the Corporations Regulations 2001; and
b There are reasonable grounds to believe that Grant Thornton CLEARR Example Ltd will be able to pay its debts as and when they become due and payable.
2 The Directors have been given the declarations required by Section 295A of the Corporations Act 2001 from the chief executive officer and chief financial officer for the financial year ended 31 December 2014.
3 Note 2 confirms that the consolidated financial statements also comply with International Financial Reporting Standards.
Signed in accordance with a resolution of the Directors:
____________________________________________
Director
Blake Smith
Dated the 28th day of February 2015
CA 295(4)
CA 295(4)(d)(ii)
CA 295(4)(d)(i)
CA 295(4)(c)
CA 295(4)(e)) ASIC PN22
CA 295(4)(ca)
CA 295(5)(a)
CA 295(5)(c)
CA 295(5)(b)

Example listed public financial statements 127 For the year ended 31 December 2014
© 2014 Grant Thornton Australia Limited. All rights reserved.
Independent Auditor’s Report
An independent auditor’s report will be prepared by the entity’s auditor in accordance with Australian Auditing
Standards. This publication does not include an illustrative report as the wording of the report may differ between
entities.

Example listed public financial statements 128 For the year ended 31 December 2014
© 2014 Grant Thornton Australia Limited. All rights reserved.
ASX Additional Information
Additional information required by the ASX Limited Listing Rules and not disclosed elsewhere in
this report is set out below. The information is effective as at 28 February 2015.
Substantial Shareholders
The number of substantial shareholders and their associates are set out below:
Shareholder Number of Shares
AB Limited: 3,128,000
CD Limited: 2,500,000
EF Limited: 1,670,000
Voting Rights
Ordinary Shares: On a show of hands, every member present at a meeting in person or
by proxy shall have one vote and upon a poll each share shall have
one vote.
Options: No voting rights.
Distribution of Equity Security Holders
Ordinary Shares
Holding Shares Options
1 - 1,000 100 -
1,001 - 5,000 62 18
5,001 - 10,000 25 20
10,001 - 100,000 14 1
1000,000 and over 9 -
210 39
There were seventeen (17) holders of less than a marketable parcel of ordinary shares.

Example listed public financial statements 129 For the year ended 31 December 2014
© 2014 Grant Thornton Australia Ltd. All rights reserved.
Ordinary Shares
Twenty (20) Largest Shareholders Number of Shares Held Percentage (%) of Issued Shares
AB Limited 3,128,000 22.72
CD Limited 2,500,000 18.16
EF Limited 1,670,000 12.13
GH Limited 575,000 4.18
IJ Limited 450,000 3.27
KL Limited 395,000 2.87
M Limited 257,000 1.87
N Limited 214,600 1.56
O Limited 197,700 1.44
P Limited 76,500 0.56
Q Limited 73,000 0.53
R Limited 70,540 0.51
S Limited 62,000 0.45
T Limited 60,500 0.44
U Limited 54,000 0.39
V Limited 52,100 0.38
W Limited 49,800 0.36
X Limited 43,150 0.31
Y Limited 25,400 0.18
Z Limited 18,700 0.14
9,972,990 72.43
Unissued equity securities
Number of Options issued under the Star or Stay Program: 219,924.
Securities Exchange
The Company is listed on the Australian Securities Exchange.

Example listed public financial statements 130 For the year ended 31 December 2014
© 2014 Grant Thornton Australia Limited. All rights reserved.
Appendix A: Organising the Statement of
Profit or Loss by Function of Expenses
AASB 101.99 allows a ‘statement of profit or loss’ format analysing expenses using a classification
based on either the Nature of Expenses (‘NOE’) or based on the Function of Expenses (‘FOE’)
within the entity. This depends on management’s assessment of which format provides information
that is reliable and more relevant.
The NOE format is illustrated in the main body of the example consolidated financial statements.
The FOE format is illustrated in this appendix. The example shows the ‘Statement of Profit or
Loss’ separately, i.e. other comprehensive income shall be shown in addition to the statement of
profit or loss in a statement of comprehensive income (see the example in Appendix B).
If the entity shows the statement of profit or loss and other comprehensive income in one
statement (see the main body of the Example Financial Statements), the FOE format included in
this Appendix may replace the NOE format that is part of the Statement of Profit or Loss and
Other Comprehensive Income.
The FOE or NOE formats do not affect the presentation requirements for other comprehensive
income, only the ‘Statement of Profit or Loss’ is affected.
Presenting the Statement of Profit or Loss in the FOE format requires additional considerations:
additional disclosures on the nature of certain expenses are required, including employee
benefit expenses and depreciation, amortisation and impairment of non-financial assets
the disclosures of the specific line items in the Statement of Profit or Loss where certain
transactions or amounts are recognised (for example, see Note 18, note 19 and note 22 of the
Example Financial Statements) should reflect the actual line items presented in the FOE
Statement of Profit or Loss
In addition, when an entity includes the analysis of profit or loss from discontinued operation in the
Notes to the Financial Statements (see Note 9); such information should be presented in the same
format as the main Statement of Profit or Loss. This will facilitate a better understanding of the
financial effects of the discontinued operations.
AASB 101.99
AASB 101.104
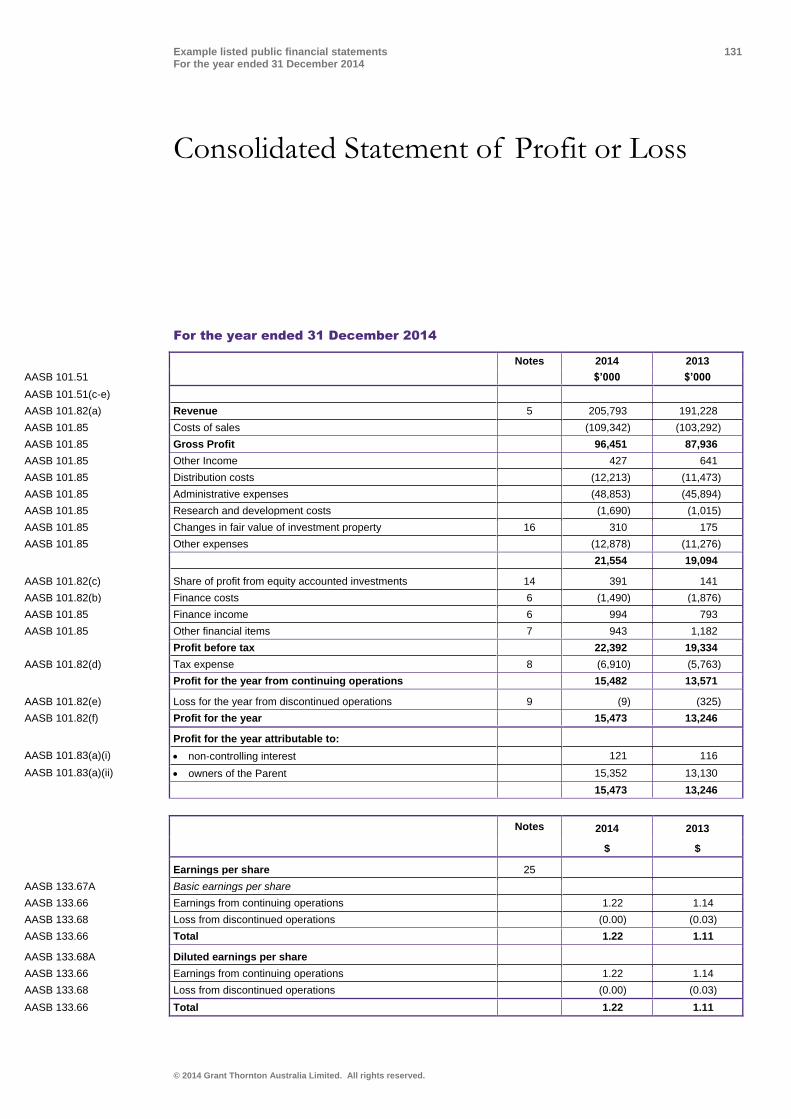
Example listed public financial statements 131 For the year ended 31 December 2014
© 2014 Grant Thornton Australia Limited. All rights reserved.
Consolidated Statement of Profit or Loss
For the year ended 31 December 2014
Notes 2014 2013
AASB 101.51 $’000 $’000
AASB 101.51(c-e)
AASB 101.82(a) Revenue 5 205,793 191,228
AASB 101.85 Costs of sales (109,342) (103,292)
AASB 101.85 Gross Profit 96,451 87,936
AASB 101.85 Other Income 427 641
AASB 101.85 Distribution costs (12,213) (11,473)
AASB 101.85 Administrative expenses (48,853) (45,894)
AASB 101.85 Research and development costs (1,690) (1,015)
AASB 101.85 Changes in fair value of investment property 16 310 175
AASB 101.85 Other expenses (12,878) (11,276)
21,554 19,094
AASB 101.82(c) Share of profit from equity accounted investments 14 391 141
AASB 101.82(b) Finance costs 6 (1,490) (1,876)
AASB 101.85 Finance income 6 994 793
AASB 101.85 Other financial items 7 943 1,182
Profit before tax 22,392 19,334
AASB 101.82(d) Tax expense 8 (6,910) (5,763)
Profit for the year from continuing operations 15,482 13,571
AASB 101.82(e) Loss for the year from discontinued operations 9 (9) (325)
AASB 101.82(f) Profit for the year 15,473 13,246
Profit for the year attributable to:
AASB 101.83(a)(i) non-controlling interest 121 116
AASB 101.83(a)(ii) owners of the Parent 15,352 13,130
15,473 13,246
Notes 2014 2013
$ $
Earnings per share 25
AASB 133.67A Basic earnings per share
AASB 133.66 Earnings from continuing operations 1.22 1.14
AASB 133.68 Loss from discontinued operations (0.00) (0.03)
AASB 133.66 Total 1.22 1.11
AASB 133.68A Diluted earnings per share
AASB 133.66 Earnings from continuing operations 1.22 1.14
AASB 133.68 Loss from discontinued operations (0.00) (0.03)
AASB 133.66 Total 1.22 1.11

Example listed public financial statements 132 For the year ended 31 December 2014
© 2014 Grant Thornton Australia Limited. All rights reserved.
Appendix B: Statement of Profit or Loss and
Other Comprehensive Income Presented in
Two Statements
The main body in these example consolidated financial statements presents the statement of profit
or loss and other comprehensive income of one statement (see guidance note to the consolidated
statement of profit or loss and other comprehensive income).
In this appendix, the alternative of presenting the ‘statement of profit or loss and other
comprehensive income’ as two statements is presented (using the nature of expense method).
Disclosure requirements, however, remain unchanged (see guidance note to the consolidated
statement of profit or loss and other comprehensive income).
In general, the notes to the financial statements will need to be tailored so that they refer to the
statement of profit or loss and other comprehensive income and not the statement of profit or loss,
where appropriate. For example, tailoring is necessary to reflect that discontinued operations are
shown as a separate line item in the statement of profit or loss and other comprehensive income
(see Note 4.10). However, it should be noted that the term profit or loss continues to apply.
The illustrative two statements of profit or loss and other comprehensive income are shown on the
next two pages.

Example listed public financial statements 133 For the year ended 31 December 2014
© 2014 Grant Thornton Australia Limited. All rights reserved.
Consolidated Statement of Profit or Loss
For the year ended 31 December 2014
Notes 2014 2013
AASB 101.51, AASB 101.51(c-e) $’000 $’000
AASB 101.82(a) Revenue 5 205,793 191,228
AASB 101.85 Other income 427 641
AASB 101.85 Changes in inventories (7,923) (5,623)
AASB 101.85 Costs of material (42,434) (40,485)
AASB 101.85 Employee benefits expense 22 (113,809) (108,515)
AASB 101.85 Change in fair value of investment property 16 310 175
AASB 101.85 Depreciation, amortisation and impairment of non-financial assets (7,932) (6,051)
AASB 101.85 Other expenses (12,878) (11,276)
21,554 19,094
AASB 101.82(c) Share of profit from equity accounted investments 14 391 141
AASB 101.82(b) Finance costs 6 (1,490) (1,876)
AASB 101.85 Finance income 6 994 793
AASB 101.85 Other financial items 7 943 1,182
Profit before tax 22,392 19,334
AASB 101.82(d) Tax expense 8 (6,910) (5,763)
Profit for the year from continuing operations 15,482 13,571
AASB 101.82(e) Loss for the year from discontinued operations 9 (9) (325)
AASB 101.82(f) Profit for the year 15,473 13,246
Profit for the year attributable to:
AASB 101.83(a)(i) Non-controlling interest 121 116
AASB 101.83(a)(ii) Owners of the parent 15,352 13,130
15,473 13,246
Notes 2014 2013
$ $
Earnings per share 25
AASB 133.67A Basic earnings per share
AASB 133.66 Earnings from continuing operations 1.22 1.14
AASB 133.68 Loss from discontinued operations (0.00) (0.03)
AASB 133.66 Total 1.22 1.11
AASB 133.68A Diluted earnings per share
AASB 133.66 Earnings from continuing operations 1.22 1.14
AASB 133.68 Loss from discontinued operations (0.00) (0.03)
AASB 133.66 Total 1.22 1.11

Example listed public financial statements 134 For the year ended 31 December 2014
© 2014 Grant Thornton Australia Limited. All rights reserved.
Consolidated Statement of Comprehensive Income
For the year ended 31 December 2014
Notes 2014 2013
$’000 $’000
AASB 101.82(f) Profit for the year 15,473 13,246
AASB 101.82(g) Other Comprehensive Income:
AASB 101.82A Items that will not be reclassified subsequently to profit or loss:
AASB 116.77(f) revaluation of land 15 303 -
AASB 119.120(c) re-measurement of net defined benefit liability 22 3,830 (3,541)
AASB 101.91 tax on items that will not be reclassified to profit or loss 24 (1,240) 1,062
AASB 101.82A Items that may be reclassified subsequently to profit or loss
Cash flow hedging: 12
AASB 7.23(c-d) current year gains / (losses) 367 (47)
AASB 101.92 reclassification to profit or loss 260 (425)
Available-for-sale financial assets: 12
AASB 7.20(a)(iii) current year gains / (losses) 113 35
AASB 101.92 reclassification to profit or loss (50) -
AASB 121.52(b) Exchange differences on translating foreign operations (664) (341)
AASB 101.82(h) Share of other comprehensive income of equity accounted investments 5 -
AASB 101.92 reclassification to profit or loss (3) -
AASB 101.91 Tax on items that may be reclassified to profit or loss 24 176 95
Other comprehensive income for the tax year, net of tax 3,097 (3,162)
AASB 101.82(i) Total comprehensive income for the year 18,570 10,084
Total comprehensive income for the year attributable to:
AASB 101.83(b)(i) non-controlling interest 121 116
AASB 101.83(b)(ii) owners of the Parent 18,449 9,968
18,570 10,084
AASB 5.33(d) Total comprehensive income attributable to owners of the Parent:
continuing operations 18,458 10,293
discontinued operations (9) (325)
18,449 9,968

Example listed public financial statements 135 For the year ended 31 December 2014
© 2014 Grant Thornton Australia Limited. All rights reserved.
Appendix C: Statement of Cash Flows
Presented Using the Indirect Method
As permitted by AASB 107 Statement of Cash Flows paragraph 18, an entity may report cash flows
from operating activities using either:
a the direct method, whereby major classes of gross cash receipts and gross cash payments are
disclosed; or
b the indirect method, whereby profit or loss is adjusted for the effects of transactions of a
non-cash nature, any deferrals or accruals of past or future operating cash receipts or
payments, and items of income or expense associated with investing or financing cash flows.
Entities are encouraged to report cash flows from operating activities using the direct method. The
direct method provides information which may be useful in estimating future cash flows and which
is not available under the indirect method.
The main body in these example consolidated financial statements presents the Statement of Cash
Flows using the direct method.
In this Appendix, the alternative of using the indirect method is presented.
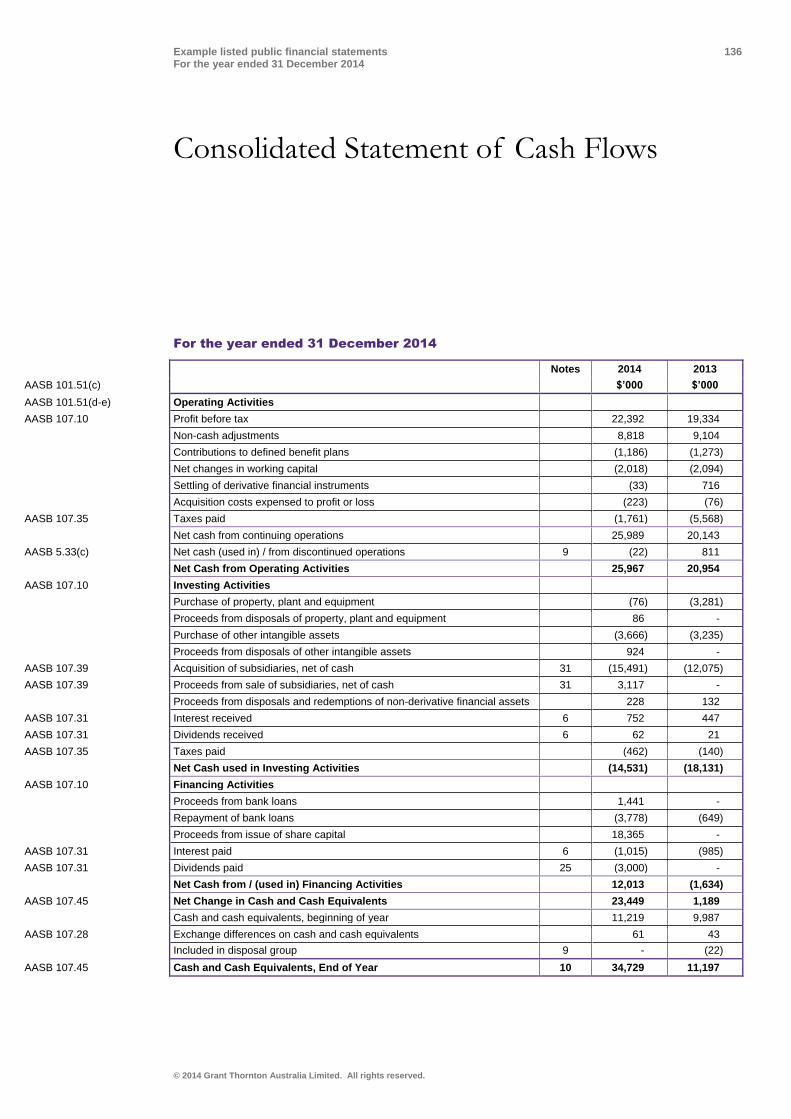
Example listed public financial statements 136 For the year ended 31 December 2014
© 2014 Grant Thornton Australia Limited. All rights reserved.
Consolidated Statement of Cash Flows
For the year ended 31 December 2014
Notes 2014 2013
AASB 101.51(c) $’000 $’000
AASB 101.51(d-e) Operating Activities
AASB 107.10 Profit before tax 22,392 19,334
Non-cash adjustments 8,818 9,104
Contributions to defined benefit plans (1,186) (1,273)
Net changes in working capital (2,018) (2,094)
Settling of derivative financial instruments (33) 716
Acquisition costs expensed to profit or loss (223) (76)
AASB 107.35 Taxes paid (1,761) (5,568)
Net cash from continuing operations 25,989 20,143
AASB 5.33(c) Net cash (used in) / from discontinued operations 9 (22) 811
Net Cash from Operating Activities 25,967 20,954
AASB 107.10 Investing Activities
Purchase of property, plant and equipment (76) (3,281)
Proceeds from disposals of property, plant and equipment 86 -
Purchase of other intangible assets (3,666) (3,235)
Proceeds from disposals of other intangible assets 924 -
AASB 107.39 Acquisition of subsidiaries, net of cash 31 (15,491) (12,075)
AASB 107.39 Proceeds from sale of subsidiaries, net of cash 31 3,117 -
Proceeds from disposals and redemptions of non-derivative financial assets 228 132
AASB 107.31 Interest received 6 752 447
AASB 107.31 Dividends received 6 62 21
AASB 107.35 Taxes paid (462) (140)
Net Cash used in Investing Activities (14,531) (18,131)
AASB 107.10 Financing Activities
Proceeds from bank loans 1,441 -
Repayment of bank loans (3,778) (649)
Proceeds from issue of share capital 18,365 -
AASB 107.31 Interest paid 6 (1,015) (985)
AASB 107.31 Dividends paid 25 (3,000) -
Net Cash from / (used in) Financing Activities 12,013 (1,634)
AASB 107.45 Net Change in Cash and Cash Equivalents 23,449 1,189
Cash and cash equivalents, beginning of year 11,219 9,987
AASB 107.28 Exchange differences on cash and cash equivalents 61 43
Included in disposal group 9 - (22)
AASB 107.45 Cash and Cash Equivalents, End of Year 10 34,729 11,197

Example listed public financial statements 137 For the year ended 31 December 2014
© 2014 Grant Thornton Australia Limited. All rights reserved.
Appendix D: Additional Disclosures for
Mining Exploration Companies
The Example Consolidated Financial Statements for Grant Thornton CLEARR Example Ltd is
based upon an IT entity and therefore does not include specific disclosures relating to companies
within the resource mining industry. As resource mining is widespread within Australia, we thought
that providing the additional disclosures specific to companies within this industry would be useful
for financial preparers.
We have identified common areas in the following pages that we consider our clients would be
concerned with.

Example listed public financial statements 138 For the year ended 31 December 2014
© 2014 Grant Thornton Australia Limited. All rights reserved.
Interests in joint arrangements
Joint operation
A joint operation is a joint arrangement whereby the parties that have joint control of the
arrangement have rights to the assets, and obligations for the liabilities, relating to the arrangement.
Where the Group’s activities are conducted through joint operations, the Group recognises its assets
(including its share of any assets held jointly), its liabilities (including its share of any liabilities
incurred jointly), its share of the revenue from the sale of the output by the joint operation and its
expenses (including its share of any expenses incurred jointly).
Joint venture
A joint venture is a joint arrangement whereby the parties that have joint control of the arrangement
have rights to the net assets of the arrangement.
Where the Group’s activities are conducted through a joint venture, the Group recognises its
interests in the joint venture using the equity method.
Under the equity method, the investment in the joint venture is carried in the statement of financial
position at cost plus post acquisition changes in the Group’s share of net assets of the joint venture.
Goodwill relating to the joint venture is included in the carrying amount of the investment and is
neither amortised nor individually tested for impairment.
The profit or loss reflects the Group’s share of the results of operations of the joint venture. Where
there has been a change recognised directly in other comprehensive income or equity of the joint
venture, the Group recognises its share of any changes and discloses this, when applicable, in the
statement of profit or loss and other comprehensive income or the statement of changes in equity,
as appropriate. Unrealised gains and losses resulting from transactions between the Group and the
joint venture are eliminated to the extent of the interest in the joint venture.
The share of the joint venture’s net profit / (loss) is shown on the face of profit or loss. This is the
profit / (loss) attributable to venturers in the joint venture.
The financial statements of the joint venture are prepared for the same reporting period as the
venturer. Where necessary, adjustments are made to bring the accounting policies in line with those
of the Group.
Mineral exploration, evaluation and development expenditure
Exploration and evaluation costs
Exploration and evaluation expenditure incurred is accumulated in respect of each identifiable area
of interest. These costs are only carried forward to the extent that they are expected to be recouped
through the successful development of the area or where activities in the area have not yet reached a
stage that permits reasonable assessment of the existence of economically recoverable reserves.
Accumulated costs in relation to an abandoned area are written off in full against profit or loss in
the year in which the decision to abandon the area is made.
When production commences, the accumulated costs for the relevant area of interest are transferred
to mine properties and amortised over the life of the area according to the rate of depletion of the
economically recoverable reserves (refer to ‘mine properties’ below).
Example listed public financial statements 139 For the year ended 31 December 2014
© 2014 Grant Thornton Australia Ltd. All rights reserved.
A regular review for impairment is undertaken of each area of interest to determine the
appropriateness of continuing to carry forward costs in relation to that area of interest.
Costs of site restoration are provided over the life of the facility from when exploration commences
and are included in the costs of that stage. Site restoration costs include the dismantling and
removal of mining plant, equipment and building structures, waste removal, and rehabilitation of the
site in accordance with clauses of the mining permits. Such costs have been determined using
estimates of future costs, current legal requirements and technology on a discounted basis.
Any changes in the estimates for the costs are accounted on a prospective basis. In determining the
costs of site restoration, there is uncertainty regarding the nature and extent of the restoration due
to community expectations and future legislation. Accordingly the costs have been determined on
the basis that the restoration will be completed within one year of abandoning the site.
Mine properties
Mine properties represent the accumulation of all exploration, evaluation and development
expenditure incurred in respect of areas of interest in which mining has commenced or in the
process of commencing. When further development expenditure is incurred in respect of mine
property after the commencement of production, such expenditure is carried forward as part of the
mine property only when substantial future economic benefits are thereby established, otherwise
such expenditure is classified as part of the cost of production.
Amortisation is provided on a unit of production basis (other than restoration and rehabilitation
expenditure detailed below) which results in a write off of the cost proportional to the depletion of
the proven and probable mineral reserves.
The net carrying value of each area of interest is reviewed regularly and to the extent to which this
value exceeds its recoverable amount, the excess is either fully provided against or written off in the
financial year in which this is determined.
The Group provides for environmental restoration and rehabilitation at site which includes any
costs to dismantle and remove certain items of plant and equipment. The cost of an item includes
the initial estimate of the costs of dismantling and removing the item and restoring the site on which
it is located, the obligation for which an entity incurs when an item is acquired or as a consequence
of having used the item during that period. This asset is depreciated on the basis of the current
estimate of the useful life of the asset.
In accordance with AASB 137 Provisions, Contingent Liabilities and Contingent Assets an entity is also
required to recognise as a provision the best estimate of the present value of expenditure required to
settle the obligation. The present value of estimated future cash flows is measured using a current
market discount rate.
Inventories
Gold bullion, base metal concentrate, metal in circuit and ore stockpiles are physically measured or
estimated and valued at the lower of cost or net realisable value. Net realisable value is the
estimated selling price (in the ordinary course of business), less estimated costs of completion and
costs of selling final product.

Example listed public financial statements 140 For the year ended 31 December 2014
© 2014 Grant Thornton Australia Ltd. All rights reserved.
Cost is determined using the weighted average method and comprises direct purchase costs and an
appropriate portion of fixed and variable overhead costs, including depreciation and amortisation,
incurred in converting materials into finished goods. The cost of production is allocated to joint
products using a ratio of spot prices by volume at each month end. Separately identifiable costs of
conversion of each metal are specifically allocated.
Materials and supplies are valued at the lower of cost or net realisable value. Any provision for
obsolescence is determined by reference to specific items of stock. A regular review is undertaken
to determine the extent of any provision for obsolescence.
Rehabilitation provision
In accordance with the Group’s environmental policy and applicable legal requirements, a provision
for site restoration in respect of contaminated land, is recognised when the land is contaminated.
The provision represents the best estimate of the present value of the expenditure required to settle
the restoration obligation at the reporting date, based on current legal requirements and technology.
Future restoration costs are reviewed annually and any changes are reflected in the present value of
the restoration provision at the end of the reporting period.
The amount of the provision for future restoration costs is capitalised and is depreciated in
accordance with the policy set out in Note X. The unwinding of the effect of discounting on the
provision is recognised as a finance cost.
Revenue recognition
The following criteria are also applicable to other specific revenue transactions:
Gold bullion sales
Revenue from gold bullion sales is brought to account when the significant risks and rewards of
ownership have transferred to the buyer and selling prices are known or can be reasonably
estimated.
Base metal concentrate sales
Contract terms for the Group’s sale of base metal concentrate (metal in concentrate) allow for a
price adjustment based on final assay results of the metal in concentrate by the customer to
determine the final content. Recognition of sales revenue for these commodities is based on the
most recently determined estimate of metal in concentrate (based on initial assay results) and the
spot price at the date of shipment, with a subsequent adjustment made upon final determination and
presented as part of “Other Income”.
The terms of metal in concentrate sales contracts with third parties contain provisional pricing
arrangements whereby the selling price for metal in concentrate is based on prevailing spot prices on
a specified future date after shipment to the customer (the “quotation period”). Adjustments to the
sales price occur, based on movements in quoted market prices up to the date of final settlement.
The period between provisional invoicing and final settlement can be between one (1) and six (6)
months.
Example listed public financial statements 141 For the year ended 31 December 2014
© 2014 Grant Thornton Australia Ltd. All rights reserved.
The provisionally priced sales of metal in concentrate contain an embedded derivative, which is
required to be separated from the host contract for accounting purposes. The host contract is the
sale of metals in concentrate and the embedded derivative is the forward contract for which the
provisional sale is subsequently adjusted.
Accordingly the embedded derivative, which does not qualify for hedge accounting, is recognised at
fair value, with subsequent changes in the fair value recognised in profit or loss each period until
final settlement, and presented as “Other Income”. Changes in fair value over the quotation period
and up until final settlement are estimated by reference to forward market prices for gold and
copper.
Stripping costs
Costs associated with stripping activity, which is the process of removing mine waste materials to
gain access to the mineral deposits underneath, during the production phase of surface mining are
accounted for as either inventory or a non-current asset (non-current asset is also referred to as a
‘stripping activity asset’).
To the extent that the benefit from the stripping activity is realised in the form of inventory
produced, the Group accounts for the costs of that stripping activity in accordance with the
principles of AASB 102 Inventories. To the extent the benefit is improved access to ore, the Group
recognises these costs as a non-current asset provided that:
it is probable that the future economic benefit (improved access to the ore body) associated
with the stripping activity will flow to the Group
the Group can identify the component of the ore body for which access has been improved;
and
the costs relating to the stripping activity associated with that component can be measured
reliably
Stripping activity assets are initially measured at cost, being the accumulation of costs directly
incurred to perform the stripping activity that improves access to the identified component of ore
plus an allocation of directly attributable overhead costs. In addition, stripping activity assets are
accounted for as an addition to, or as an enhancement to, an existing asset. Accordingly, the nature
of the existing asset determines:
whether the Group classifies the stripping activity asset as tangible or intangible; and
the basis on which the stripping activity asset is measured subsequent to initial recognition
In circumstances where the costs of the stripping activity asset and the inventory produced are not
separately identifiable, the Group allocates the production stripping costs between the inventory
produced and the stripping activity asset by using an allocation basis that is based on volume of
waste extracted compared with expected volume, for a given volume of ore production.

Example listed public financial statements 142 For the year ended 31 December 2014
© 2014 Grant Thornton Australia Ltd. All rights reserved.
Significant management judgements in applying Accounting Policies
Estimation uncertainty
Additional example disclosures relating specifically to the mining industry that you may consider
including within these notes are as follows:
Mine rehabilitation provision
The Group’s mining and exploration activities are subject to various laws and regulations governing
the protection of the environment. The Group recognises management’s best estimate for asset
retirement obligations in the period in which they are incurred. Actual costs incurred in the future
periods could differ materially from the estimates. Additionally, future changes to environmental
laws and regulations, life of mine estimates and discount rates could affect the carrying amount of
this provision.
Ore reserve and resource estimates
The Group estimates its ore reserves and mineral resources based on information compiled by
Competent Persons (as defined in the 2004 Edition of The Australasian Code for Reporting of Exploration
Results, Mineral Resources and Ore Resources (the JORC Code)). Reserves determined in this way are
taken into account in the calculation of depreciation, amortisation, impairment, deferred mining
costs, rehabilitation and environmental expenditure.
In estimating the remaining life of the mine for the purposes of amortisation and depreciation
calculations, due regard is given, not only to remaining recoverable metals contained in proved and
probable ore reserves, but also to limitations which could arise from the potential for changes in
technology, demand, and other issues which are inherently difficult to estimate over a lengthy time
frame.
Where a change in estimated recoverable metals contained in proved and probable ore reserves is
made, depreciation and amortisation is accounted for prospectively.
The determination of ore reserves and remaining mine life affects the carrying value of a number of
the Group’s assets and liabilities including deferred mining costs and the provision for rehabilitation.
Units-of-production depreciation
Estimated recoverable reserves are used in determining the depreciation and / or amortisation of
mine specific assets. This results in a depreciation / amortisation charge proportional to the
depletion of the anticipated remaining life of mine production. Each item’s life, which is assessed
annually, has regard to both its physical life limitations and to present assessments of economically
recoverable reserves of the mine property at which the asset is located. These calculations require
the use of estimates and assumptions, including the amount of recoverable reserves and estimates of
future capital expenditure.
Exploration and evaluation expenditure
The application of the Group’s accounting policy for exploration and evaluation expenditure
requires judgment in determining whether it is likely that future economic benefits are likely either
from future exploitation or sale or where activities have not reached a stage which permits a
reasonable assessment of the existence of reserves. The determination of a Joint Ore Reserves
Committee (JORC) resource is itself an estimation process that requires varying degrees of
uncertainty depending on sub-classification and these estimates directly impact the point of deferral
of exploration and evaluation expenditure.
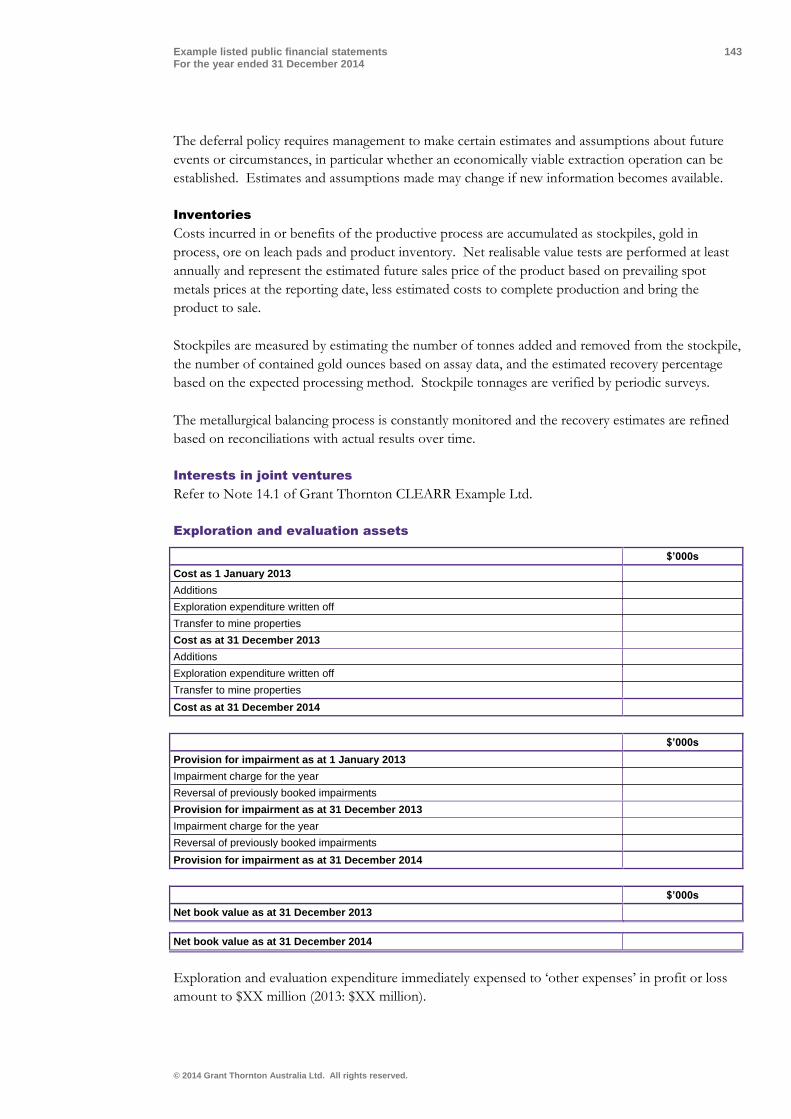
Example listed public financial statements 143 For the year ended 31 December 2014
© 2014 Grant Thornton Australia Ltd. All rights reserved.
The deferral policy requires management to make certain estimates and assumptions about future
events or circumstances, in particular whether an economically viable extraction operation can be
established. Estimates and assumptions made may change if new information becomes available.
Inventories
Costs incurred in or benefits of the productive process are accumulated as stockpiles, gold in
process, ore on leach pads and product inventory. Net realisable value tests are performed at least
annually and represent the estimated future sales price of the product based on prevailing spot
metals prices at the reporting date, less estimated costs to complete production and bring the
product to sale.
Stockpiles are measured by estimating the number of tonnes added and removed from the stockpile,
the number of contained gold ounces based on assay data, and the estimated recovery percentage
based on the expected processing method. Stockpile tonnages are verified by periodic surveys.
The metallurgical balancing process is constantly monitored and the recovery estimates are refined
based on reconciliations with actual results over time.
Interests in joint ventures
Refer to Note 14.1 of Grant Thornton CLEARR Example Ltd.
Exploration and evaluation assets
$’000s
Cost as 1 January 2013
Additions
Exploration expenditure written off
Transfer to mine properties
Cost as at 31 December 2013
Additions
Exploration expenditure written off
Transfer to mine properties
Cost as at 31 December 2014
$’000s
Provision for impairment as at 1 January 2013
Impairment charge for the year
Reversal of previously booked impairments
Provision for impairment as at 31 December 2013
Impairment charge for the year
Reversal of previously booked impairments
Provision for impairment as at 31 December 2014
$’000s
Net book value as at 31 December 2013
Net book value as at 31 December 2014
Exploration and evaluation expenditure immediately expensed to ‘other expenses’ in profit or loss
amount to $XX million (2013: $XX million).

Example listed public financial statements 144 For the year ended 31 December 2014
© 2014 Grant Thornton Australia Ltd. All rights reserved.
Mine properties
Mines Deferred Stripping Total
$’000s $’000s $’000s
Cost as at 1 January 2013
Additions
Transferred from exploration and evaluation assets
Change in rehabilitation provision
Disposals
Cost as at 31 December 2013
Additions
Transferred from exploration and evaluation assets
Change in rehabilitation provision
Disposals
Cost as at 31 December 2014
Mines Deferred Stripping Total
$’000s $’000s $’000s
Depletion and impairment as at 1 January 2014
Charge for the year
Provision for impairment
Disposals
Depletion and impairment as at 31 December 2013
Charge for the year
Provision for impairment
Disposals
Depletion and impairment as at 31 December 2014
Mines Deferred Stripping Total
$’000s $’000s $’000s
Net book value as at 31 December 2013
Net book value as at 31 December 2014
Inventories
2014 2013
$’000s $’000s
At cost:
gold bullion
base metals concentrate
metal in circuit
ore stockpiles
materials and supplies
Total inventories

Example listed public financial statements 145 For the year ended 31 December 2014
© 2014 Grant Thornton Australia Ltd. All rights reserved.
Provisions
Rehabilitation Other Total
$’000s $’000s $’000s
At 1 January 2014
Arising during the year
Write-back of unused provisions
Disposals
Unwinding of discount
Utilisation
At 31 December 2014
Comprising:
Rehabilitation Other Total
$’000s $’000s $’000s
Current 2014
Non-Current 2014
Rehabilitation Other Total
$’000s $’000s $’000s
Current 2013
Non-Current 2013
Rehabilitation provision
The Group makes full provision for the future cost of rehabilitating mine sites and related
production facilities on a discounted basis at the time of developing the mines and installing and
using those facilities.
Example listed public financial statements 146 For the year ended 31 December 2014
© 2014 Grant Thornton Australia Limited. All rights reserved.
Appendix E: Summary of Directors’ Report
Requirements
The content of a Directors’ Report is dictated by the requirements in Corporations Act 2001 (and
Corporations Regulations 2001) and may vary depending on the type of each entity.
We have summarised these requirements for most common types of entities in the following pages.

Example listed public financial statements 147 For the year ended 31 December 2014
© 2014 Grant Thornton Australia Limited. All rights reserved.
Description
Listed Public
Companies
Listed Registered Schemes
Unlisted Registered Schemes
Companies Limited By Guarantee
Unlisted Public Companies
(Other than Limited by Guarantee)
Other Disclosing
Entities Proprietary
Companies15
CA 298(1AA)(c) Copy of the Auditor’s Independence Declaration under section 307C
CA 298(1AB)(b) CA 298(1A)
Details regarding additional information to give a true and fair view under section 295(3)(c)
CA 299(1)(a) Review of operations and results of those operations
CA 299(1)(b) Details of any significant changes in the state of affairs
CA 299(1)(c) Details of principal activities and any significant changes in those activities
CA 299(1)(d) Details of events after the end of financial year
CA 299(1)(e) Likely developments in future financial years and expected results
CA 299(1)(f) Details of performance in relation to environmental regulation
CA 299(3) Exclusion of prejudicial information on future developments and results
CA 299A(1) Information on the operations, financial position and business strategies and prospects
CA 299A(3) Exclusion of prejudicial information on likely future developments and expected results
CA 300(1)(a) Dividends or distributions paid
CA 300(1)(b) Dividends or distributions recommended or declared but not paid
CA 300(1)(c), CA 300B(3)(a) Names of Directors and periods of Directorship
CA 300(1)(ca) Details of officers who are former Audit Partners or Directors
CA 300(1)(d),(3),(5) Options granted over unissued shares or interests to any Director or any of the five (5) most highly remunerated officers
CA 300(1)(e),(3),(6) Details of unissued shares or interests under option at the day of the report
CA 300(1)(f),(3),(7) Details of shares or interests issued as a result of the exercise of options
CA 300(1)(g),(8),(9) Details of indemnity given, or insurance premium paid or agreed to be paid, for officers or auditors
CA 300(10)(a), CA 300B(3)(b) Details of Directors, including qualifications, experience and responsibilities
16
CA 300(10)(b),(c), CA 300B(3)(c) Details of Directors’ meeting attendance
CA 300(10)(d) Details of Company Secretary’s qualifications and experience
15 Directors’ report is not required for a small proprietary company where it prepares financial statements to satisfy a shareholder direction (section 293) and that direction specifies that a Directors’ Report is not required. 16 The requirements in section 300(10) of Corporations Act 2001 do not apply to wholly-owned subsidiaries of Australian companies.

Example listed public financial statements 148 For the year ended 31 December 2014
© 2014 Grant Thornton Australia Ltd. All rights reserved.
Description
Listed Public
Companies
Listed Registered Schemes
Unlisted Registered Schemes
Companies Limited By Guarantee
Unlisted Public Companies
(Other than Limited by Guarantee)
Other Disclosing
Entities Proprietary
Companies15
CA 300(11)(a)-(d) Details of Directors’ interests in shares, debentures and registered schemes, including options and rights
CA 300(12) Details of Directors’ interests in a registered scheme, including options and rights
CA 300(11)(e) Details of Directorships of other listed companies held by the Directors at any time in the last three (3) years
CA 300(11A) Details of any ASIC declaration under section 324DAA
CA 300(2A),(11B),(11C),(11D) Details of any non-audit services and related statements by Directors
CA 300A, Reg 2M.3.03 Remuneration report17
CA 300(13)(a) Details of any fees paid to the responsible entity and associates out of scheme property
CA 300(13)(b) Number of interests in the scheme held by responsible entity and associates
CA 300(13)(c) Interests in the scheme issued during the financial year
CA 300(13)(d) Withdrawals from the scheme during the financial year
CA 300(13)(e) Value of the scheme’s assets and the basis for the valuation
CA 300(13)(f) Number of interests in scheme at the end of the financial year
CA 300(14),(15) Details of any application for leave of court to bring proceedings on behalf of Company
CA 300B(1)(a) A description of the short-term and long-term objectives
CA 300B(1)(b) Details of the entity’s strategy for achieving short-term and long-term objectives
CA 300B(1)(c),(d) Details of principal activities during the year and how such activities assisted in achieving the entity’s objectives
CA 300B(1)(e) Details of how the entity measures its performance, including any key performance indicators
CA 300B(3)(d) For each class of membership, the amount which a member of that class is liable to contribute on winding up
CA 300B(3)(e) Total amount that members are liable to contribute on winding up
ASIC Class Order 98/0100 Statement regarding rounding of amounts in the Directors’ report and financial report
17 Other disclosing entities need to include the Remuneration Report related disclosures only if such entities are companies.

www.grantthornton.com.au The information contained herein is of a general nature and is not intended to address the circumstances of any particular individual or entity. Although we endeavour to provide accurate and timely information, there can be no guarantee that such information is accurate as of the date it is received or that it will continue to be accurate in the future. No one is entitled to rely on this information and no one should act on such information without appropriate professional advice obtained after a thorough examination of the particular situation.
‘Grant Thornton’ refers to the brand under which the Grant Thornton member firms provide assurance, tax and advisory services to their clients and/or refers to one or more member firms, as the context requires. Grant Thornton Australia Ltd is a member firm of Grant Thornton International Ltd (GTIL). GTIL and the member firms are not a worldwide partnership. GTIL and each member firm is a separate legal entity. Services are delivered by the member firms. GTIL does not provide services to clients. GTIL and its member firms are not agents of, and do not obligate one another and are not liable for one another’s acts or omissions. In the Australian context only, the use of the term ‘Grant Thornton’ may refer to Grant Thornton Australia Limited ABN 41 127 556 389 and its Australian subsidiaries and related entities. GTIL is not an Australian related entity to Grant Thornton Australia Limited.
Liability limited by a scheme approved under Professional Standards Legislation. Liability is limited in those States where a current scheme applies.