exchange of information and bank deposits in …in 2009, the g20 declared that ‘the era of bank...
TRANSCRIPT

EXCHANGE OF INFORMATION AND BANK DEPOSITS IN INTERNATIONAL
FINANCIAL CENTRES
Kevin Parra-Ramirez
Banque de France
Pierce O’Reilly & Michael A. Stemmer
Centre for Tax Policy and Administration, OECD
Presentation to the 4th BIS-CGFS Workshop on “Research on global financial stability: the use of BIS international banking and financial
statistics”
Basel, 12 December 2019

2
1. Motivation and Literature
2. Data
3. Analysis and Research
4. Conclusion and ongoing work

3
1. MOTIVATION & LITERATURE

MOTIVATION FOR EXCHANGE OF INFORMATION (EOI) IMPACT ASSESSMENT
4
In 2009, the G20 declared that ‘the era of bank secrecy is over’ (G20 Leaders Statement)
To increase global tax transparency, the OECD implemented exchange of information mechanisms:
– Exchange of Information on Request (EOIR)
– Automatic Exchange of Information (AEOI)
This ongoing exchange of information requires an assessment of its effectiveness to ensure continued
momentum behind global efforts in increasing tax transparency
Importance for financial stability: impact on jurisdiction business models; disclosure of illegal activities
affecting individual banks (e.g. Danske Bank scandal)
Key policy issue: tax evasion generates revenue losses

WHAT IS EOI?
5
What is EOI?
To increase global tax transparency, the OECD implemented two important exchange of information
mechanisms:
– Exchange of Information on Request (EOIR) since 2009; information exchanged if “foreseeably relevant”
– Automatic Exchange of Information (AEOI), with commitments by Global Forum member countries in 2014 to engage
in automatic exchange of information under the Common Reporting Standards (CRS); first exchanges started in 2017
Information covered consists of different kinds of investment income (such as interest and dividends), sales
proceeds of assets or information on account balances
To date, more than 4500 information agreements are in force with 90 jurisdictions implementing the CRS
47 million offshore accounts with a total value of EUR 4.9 trillion have been exchanged for the first time,
resulting in over EUR 95 billion in additional revenue (tax, interest, penalties)

The network of EOI agreements has steadily expanded since 2012
A broad EOI network means fewer places to hide assets
A key means of EOI expansion has been MAC signature
MAC-based EOI is a large share of all EOI relationships since 2012, especially for IFCs
As far as we are aware, no existing study has included EOI based on MAC into analysis of bank deposits
6
EOI EXPANSION

EXISTING RESEARCH ON EOI AND KEY CONTRIBUTIONS
7
Existing research:
1. Bank liabilities (Johannesen & Zucman, 2014; Casi et al., 2018; Menkhoff & Miethe, 2019; Beer et. al.,
forthcoming)
2. Portfolio investment (Zucman, 2013; Hanlon et. al. 2015; Pellegrini et al., 2017; Heckemeyer &
Hemmerich, 2018)
3. FDI (Blonigen et al., 2013)
Key contributions: high quality and unique data, sophisticated analysis
1. Expands the work of Johannesen and Zucman (2014) by employing a larger sample in terms of time
coverage (more years, more EOI – fewer places for money to hide)
2. Uses a unique restricted database allowing to increase country coverage. Access to more bilateral
relationships than before in the literature.
3. Adds sophistication to the previous literature by distinguishing the impacts of announcements, EOI
signatures and EOI commencement of the exchanges. Also accounts for the impact of the rapid
expansion in EOI networks.

Several studies have examined the impact of EOI on bank deposits in IFCs using BIS data:
• Johannesen & Zucman (2014):
• Sample length: 2003:IV – 2011:II
• IFCs: Austria, Belgium, Cayman Islands, Chile, Cyprus, Guernsey, Isle of Man, Jersey, Luxembourg, Macao, Malaysia, Panama, Switzerland
• Casi, Spengel & Stage (2018):
• Sample length: 2014:IV – 2017:III
• IFCs: Guernsey, Hong Kong, Isle of Man, Jersey, Macao, (USA)
• Ahrends & Bothner (2019):
• Sample length: 2009:I – 2017:IV
• IFCs: Austria, Belgium, Chile, Guernsey, Hong Kong, Isle of Man, Jersey, Luxembourg, Macao, Switzerland
• Menkhoff & Miethe (2019):
• Sample length: 2003:I – 2017:IV
• IFCs: Belgium, Chile, Guernsey, Ireland, Isle of Man, Jersey, Luxembourg, Switzerland
• Beer, Coelho & Leduc (forthcoming):
• Sample length: 1995:I – 2018:II
• IFCs: Austria, Bahamas, Bahrain, Belgium, Bermuda, Chile, Curacao, Cyprus, Guernsey, Hong Kong, Isle of Man, Jersey, Luxembourg, Macao, Panama, Singapore, Switzerland
8
EXISTING RESEARCH ON BANK DEPOSITS AND EXCHANGE OF INFORMATION
-35%-30%-25%-20%-15%-10%-5%0%
EOIR
AEOI
EOIR
AEOI
EOIR
AEOI
EOIR
AEOI
EOIR
AEOI
EOIR
AEOI
Joh
ann
ese
n &
Zucm
an (
20
14)
Cas
i, Sp
enge
l &St
age
(201
8)
Ah
ren
s &
Bo
thn
er (
201
9)
Men
kho
ff &
Mie
the
(20
19)
Bee
r, C
oel
ho
&Le
du
c(f
ort
hco
min
g)
O'R
eilly
, Par
ra-
Ram
irez
&St
emm
er(f
ort
hco
min
g)
not estimated
not estimated
Percentage decline bank deposits in IFCs upon EOI introduction
Let’s find out!
not significant
not estimated
9
2. DATA
HIGH QUALITY AND UNIQUE DATA ON BANK DEPOSITS
10
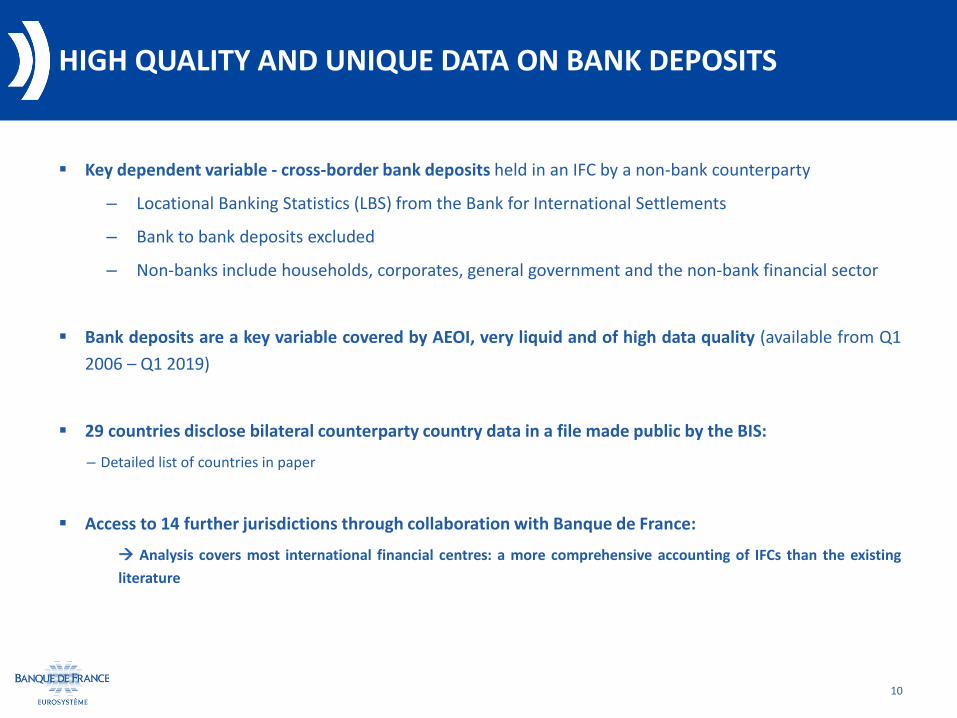
Key dependent variable - cross-border bank deposits held in an IFC by a non-bank counterparty
– Locational Banking Statistics (LBS) from the Bank for International Settlements
– Bank to bank deposits excluded
– Non-banks include households, corporates, general government and the non-bank financial sector
Bank deposits are a key variable covered by AEOI, very liquid and of high data quality (available from Q1
2006 – Q1 2019)
29 countries disclose bilateral counterparty country data in a file made public by the BIS:
– Detailed list of countries in paper
Access to 14 further jurisdictions through collaboration with Banque de France:
Analysis covers most international financial centres: a more comprehensive accounting of IFCs than the existing
literature

Without Cayman Islands:
Deposits in IFCs peaked at USD 1.7 trillion in Q1 of 2008
Substantial fall since then by USD 410 billion or 24% by Q1 2019
Strong reduction came in the immediate aftermath of the financial crisis with an 13% fall between Q2 2008 and Q2 2011
Decrease has continued since then by a further 11%
11
ANALYSIS OF GLOBAL BANK DEPOSITS
Evolution of bank deposits in IFCs and Non-IFCs

12
3. ANALYSIS & RESULTS

REGRESSION SPECIFICATION
13
Similar approach to Johannesen & Zucman (2014). Regress EOI signatures on an unbalanced panel of cross-border bank deposits to test the key hypothesis:
An EOI agreement between a given IFC and a given non-IFC should be associated with a reduction in bank deposits held in that IFC by residents of the non-IFC.
This hypothesis could be tested using the following regression equation
𝑙𝑜𝑔 𝐷𝑒𝑝𝑜𝑠𝑖𝑡𝑠𝑖𝑗𝑞 = 𝛼 + 𝛽 𝐸𝑂𝐼𝑖𝑗𝑞 + 𝛾𝑖𝑗 + 𝜃𝑞 + 𝜖𝑖𝑗𝑞
EOIijq: Existence of an EOI agreement between countries i and j in quarter q
– EOIR signature (incl. MAC),
– Announcement to AEOI commitment,
– AEOI commencement (with or without FATCA)
Country-pair and year-quarter fixed effects included, with standard errors robust to linear correlation at the country-pair level

MAIN REGRESSION RESULTS
14
EOIR onlyEOIR and AEOI Announcement
EOIR and AEOI (incl. FATCA)
Commencement
EOIR and AEOI (incl. FATCA)
Announcement and Commencement
EOIR and AEOI Announcement and
Commencement
EOIR Signature -0.024 -0.028 -0.041 -0.042 -0.043
(0.044) (0.044) (0.045) (0.045) (0.044)
AEOI Announcement -0.074 -0.041 -0.033
(0.066) (0.064) (0.064)
AEOI Commencement -0.249***
(0.062)
AEOI (incl. FATCA) Commencement -0.199*** -0.185***
(0.068) (0.062)
Observations 29.461 29.461 29.461 29.461 29.461
R2 0.0001 0.0005 0.002 0.002 0.003
Jurisdiction-Pair Fixed Effects Yes Yes Yes Yes Yes
Year-Quarter Fixed Effects Yes Yes Yes Yes Yes
Impact of EOI variables on bank deposits in 16 IFCs owned by Non-IFCs
* Note: R2 does not include the explanatory power of the country-pair or time fixed effects, which drive much of the variation in the data

• Johannesen & Zucman (2014) find significant reductions in IFC deposits of 11% upon EOIR signature in a pre-2012 sample
• Our results do not find significant effect of EOIR – how to explain discrepancy? Test using differing sample lengths
• Result show decreasing effects of EOIR, suggesting that either the EOIR effect weakens over time
• MAC expansion potentially resulted in “less relevant” new EOIR relationships with the passing of time – reducing impact of additional relationships
15
CHANGING IMPACT OF EOIR OVER TIME
EOIR only
Johannesen & Zucman (2014)
sample time: 2003 Q4 – 2012 Q4
Johannesen & Zucman (2014)
sample time: 2003 Q4 – 2013 Q4
Johannesen & Zucman (2014)
sample time: 2003 Q4 – 2014 Q4
EOIR Signature -0.024 -0.106* -0.095* -0.093*
(0.044) (0.055) (0.051) (0.049)
Observations 29.461 18.585 21.065 23.834
R2 0.0001 0.002 0.001 0.001
Jurisdiction-Pair Fixed Effects Yes Yes Yes Yes
Year-Quarter Fixed Effects Yes Yes Yes Yes
Impact of the EOIR signature variable for different sub-sample lengths
* Note: R2 does not include the explanatory power of the country-pair or time fixed effects, which drive much of the variation in the data

Brief summary of regression results:
• AEOI commencement is associated with a 22% decrease in foreign-owned IFC deposits, ranging in the middle of estimates in the literature
• EOIR signatures show a muted significant impact until Q2 2014 and effects weaken over time – perhaps due to “less relevant” new bilateral EOIR relationships with expanded MAC network
16
RESULTS COMPARED TO EOIR & AEOI EFFECTS IN THE LITERATURE
-35%-25%-15%-5%
EOIR
AEOI
EOIR
AEOI
EOIR
AEOI
EOIR
AEOI
EOIR
AEOI
EOIR
AEOI
Joh
ann
ese
n &
Zucm
an (
20
14)
Cas
i, Sp
enge
l &St
age
(201
8)
Ah
ren
s &
Bo
thn
er(2
01
9)M
enkh
off
&M
ieth
e (2
01
9)
Bee
r, C
oel
ho
&Le
du
c(f
ort
hco
min
g)
O'R
eilly
, Par
ra-
Ram
irez
&St
emm
er(f
ort
hco
min
g)
not estimated
not estimated
not estimated
Percentage decline bank deposits in IFCs upon EOI
not significant
not significant
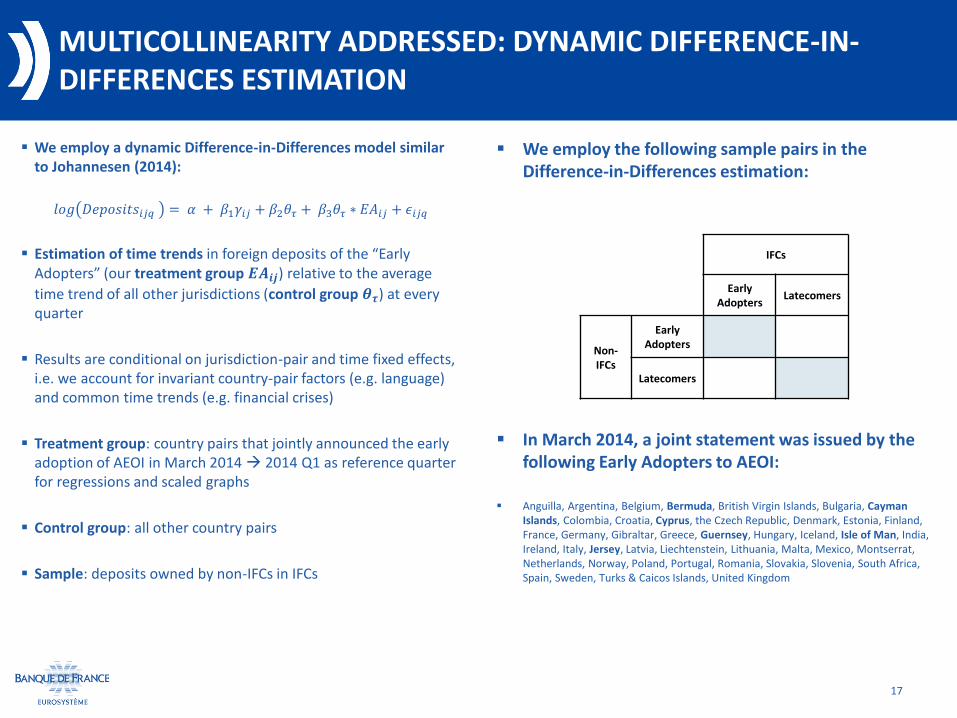
We employ a dynamic Difference-in-Differences model similar to Johannesen (2014):
𝑙𝑜𝑔 𝐷𝑒𝑝𝑜𝑠𝑖𝑡𝑠𝑖𝑗𝑞 = 𝛼 + 𝛽1𝛾𝑖𝑗 + 𝛽2𝜃𝜏 + 𝛽3𝜃𝜏 ∗ 𝐸𝐴𝑖𝑗 + 𝜖𝑖𝑗𝑞
Estimation of time trends in foreign deposits of the “Early Adopters” (our treatment group 𝑬𝑨𝒊𝒋) relative to the average
time trend of all other jurisdictions (control group 𝜽𝝉) at every quarter
Results are conditional on jurisdiction-pair and time fixed effects, i.e. we account for invariant country-pair factors (e.g. language) and common time trends (e.g. financial crises)
Treatment group: country pairs that jointly announced the early adoption of AEOI in March 2014 2014 Q1 as reference quarter for regressions and scaled graphs
Control group: all other country pairs
Sample: deposits owned by non-IFCs in IFCs
We employ the following sample pairs in the Difference-in-Differences estimation:
In March 2014, a joint statement was issued by the following Early Adopters to AEOI:
Anguilla, Argentina, Belgium, Bermuda, British Virgin Islands, Bulgaria, Cayman Islands, Colombia, Croatia, Cyprus, the Czech Republic, Denmark, Estonia, Finland, France, Germany, Gibraltar, Greece, Guernsey, Hungary, Iceland, Isle of Man, India, Ireland, Italy, Jersey, Latvia, Liechtenstein, Lithuania, Malta, Mexico, Montserrat, Netherlands, Norway, Poland, Portugal, Romania, Slovakia, Slovenia, South Africa, Spain, Sweden, Turks & Caicos Islands, United Kingdom
17
MULTICOLLINEARITY ADDRESSED: DYNAMIC DIFFERENCE-IN-DIFFERENCES ESTIMATION
IFCs
Early Adopters
Latecomers
Non-IFCs
Early Adopters
Latecomers

• Results are based on the strict assumption that the treatment group only encounters deposit withdrawals upon early announcement pre-treatment trend differentials should be rather small and insignificant
• Results show diverging trends between foreign-owned deposits in early-adopting country pairs and latecomers after the reference period 2014 Q1
• This is confirmed by the bars at the bottom, depicting statistical significance for the trend divergence of Early Adopters at the 5% levels
• Trends significantly diverge with a slight lag after 2014 Q3
• Statistical significant difference confirms Early Adopters faced deposit reductions post- AEOI announcement not faced by non-early-adopting IFCs
• The estimated treatment effect on foreign deposits in the Early Adopters due to AEOI commitment amounts to about -11% on average between 2014 Q1 and 2015 Q1
18
MULTICOLLINEARITY ADDRESSED: DYNAMIC DIFFERENCE-IN-DIFFERENCES ESTIMATION
Note: Lines indicate trends in deposits as captured by coefficients on time dummies 𝜽𝝉 and the interaction terms 𝜽𝝉 ∗𝑬𝑨𝒊𝒋, that is exp(𝜷𝟐) for non-Early Adopters and exp(𝜷𝟐+ 𝜷𝟑) for Early Adopters.
Columns indicate statistical significance levels of interaction terms 𝜽𝝉 ∗ 𝑬𝑨𝒊𝒋.

19
ROBUSTNESS CHECK #1: EFFECT ACROSS JURISDICTIONS PAIRS
Negative impact of EOI changes on cross-border deposits appears confined to deposits from non-IFCs into IFCs
Deposits between IFCs not affected
Positive impact on deposits between non-IFCs
Increasing shift in cross-border banking activity away from IFCs

20
ROBUSTNESS CHECK #2: EFFECT OF VOLUNTARY DISCLOSURE PROGRAMS
The inclusion of a variable accounting for voluntary disclosure programmes validates the impact of AEOI on IFC deposits
Sign of VDP:
– Endogeneity?
– Langenmayr (2017): effect on low risk-averse taxpayers
– Johannesen et al. (2019): most disclosures happened outside of VDPs

Excluding one-by-one the IFCs that are BIS reporters to see if the impact of AEOI commencement is homogeneous across different samples
The definition of IFCs affects the impact of AEOI commencement marginally
21
ROBUSTNESS CHECK #3: TESTING DIFFERENT DEFINITIONS OF IFCS

22
4. CONCLUSION & ONGOING WORK

CONCLUSION AND ONGOING WORK
23
Summary of main results:
Overall bank deposits in IFCs decreased by 24% since their peak in the second quarter of 2018, amounting to an equivalent of USD 410 billion
– Finding validated through several new robustness checks
AEOI commencement is associated with between 17-22% decrease in IFC deposits owned by non-IFC holders
EOIR signatures only show a modestly significant impact (9 to 10%) under a reduced sample length, hinting at a weakening effect over time post-2012. This may be due to an increasingly global approach to tax transparency with an expanding MAC network.
Ongoing work:
Using new and unique level of disaggregation that allows to distinguish non-bank counterparty sectors, iehouseholds, corporates and general government.

24
Thank you!
Questions?