exchange of reactive nitrogen compounds - uni … · exchange of reactive nitrogen compounds v....
TRANSCRIPT

BGD6, 10663–10706, 2009
Exchange of reactivenitrogen compounds
V. Wolff et al.
Title Page
Abstract Introduction
Conclusions References
Tables Figures
J I
J I
Back Close
Full Screen / Esc
Printer-friendly Version
Interactive Discussion
Biogeosciences Discuss., 6, 10663–10706, 2009www.biogeosciences-discuss.net/6/10663/2009/© Author(s) 2009. This work is distributed underthe Creative Commons Attribution 3.0 License.
BiogeosciencesDiscussions
This discussion paper is/has been under review for the journal Biogeosciences (BG).Please refer to the corresponding final paper in BG if available.
Exchange of reactive nitrogencompounds: concentrations and fluxes oftotal ammonium and total nitrate above aspruce forest canopyV. Wolff1, I. Trebs1, T. Foken2, and F. X. Meixner1,3
1Max Planck Institute for Chemistry, Biogeochemistry Department, P.O. Box 3060, 55020Mainz, Germany2University of Bayreuth, Department of Micrometeorology, 95440 Bayreuth, Germany3University of Zimbabwe, Department of Physics, P.O. Box MP 167, Harare, Zimbabwe
Received: 4 November 2009 – Accepted: 8 November 2009 – Published: 16 November 2009
Correspondence to: V. Wolff ([email protected])
Published by Copernicus Publications on behalf of the European Geosciences Union.
10663

BGD6, 10663–10706, 2009
Exchange of reactivenitrogen compounds
V. Wolff et al.
Title Page
Abstract Introduction
Conclusions References
Tables Figures
J I
J I
Back Close
Full Screen / Esc
Printer-friendly Version
Interactive Discussion
Abstract
Total ammonium (tot-NH+4 ) and total nitrate (tot-NO−3 ) provide a chemically conservative
quantity in the measurement of exchange processes of reactive nitrogen compoundsammonia (NH3), particulate ammonium (NH+
4 ), nitric acid (HNO3), and particulate ni-trate (NO−3 ), using the aerodynamic gradient method. Total fluxes were derived from5
concentration differences of total ammonium (NH3 and NH+4 ) and total nitrate (HNO3
and NO−3 ) measured at two levels. Gaseous species and related particulate com-pounds were measured selectively, simultaneously and continuously above a spruceforest canopy in south-eastern Germany in summer 2007. Measurements were per-formed using a wet-chemical two-point gradient instrument, the GRAEGOR. Median10
concentrations of NH3, HNO3, NH+4 , and NO−3 were 0.57, 0.12, 0.76, and 0.48µg m−3,
respectively. Total ammonium and total nitrate fluxes showed large variations depend-ing on meteorological conditions, with concentrations close to zero under humid andcool conditions and higher concentrations under dry conditions. Mean fluxes of to-tal ammonium and total nitrate in September 2007 were directed towards the forest15
canopy and were −65.77ngm−2s−1 and −41.02ngm−2s−1 (in terms of nitrogen), re-spectively. Their deposition was controlled by aerodynamic resistances only, with verylittle influence of surface resistances. Including measurements of wet deposition andfindings of former studies at the study site on occult deposition (fog water interception),the total N deposition in September 2007 was estimated to 5.86 kg ha−1.20
1 Introduction
Reactive nitrogen (Nr) compounds, comprising inorganic reduced forms of N (e.g., am-monia (NH3) and ammonium (NH+
4 )), inorganic oxidized forms (e.g., nitrogen oxide(NOx), nitric acid (HNO3), nitrate (NO−3 ) and nitrous oxide (N2O)) as well as organiccompounds (e.g., urea, amines, proteins, and nucleic acids), play important roles in25
atmospheric chemistry and in ecosystem functioning. Since the 1960s Nr is accumu-
10664

BGD6, 10663–10706, 2009
Exchange of reactivenitrogen compounds
V. Wolff et al.
Title Page
Abstract Introduction
Conclusions References
Tables Figures
J I
J I
Back Close
Full Screen / Esc
Printer-friendly Version
Interactive Discussion
lating in the environment due to (a) widespread cultivation of crops that are able toconvert atmospheric nitrogen (N2) into Nr, (b) combustion of fossil fuels and thereforeconversion of fossil N and atmospheric N2 into Nr and (c) the Haber-Bosch process,which enables humans to produce NH3 from N2 for food production (Galloway et al.,2003). Increased Nr deposition rates result in several negative effects, like a decrease5
in productivity, degradation of ecosystems, loss of biodiversity and leaching of nutrientsinto the groundwater (Gruber and Galloway, 2008).
Atmospheric wet and dry deposition is a major removal pathway of Nr from the at-mosphere and constitutes a major input path into ecosystems. Wet deposition encom-passes the processes which transfer airborne species to the Earth’s surface in aqueous10
form, while dry deposition is the transport of gaseous and particulate species towardsthe surface in the absence of precipitation. Wet deposition estimates are derived frommeasurements of the amount of precipitation combined with the concentration analysisof dissolved substances in the rain water. A special component of wet deposition, whichmight be important in specific areas, is the occult deposition through the interception of15
fog water. Although the hydrological input may not be important in comparison to rain,the concentration of dissolved compounds may be significantly higher, thus being animportant pollutant and nutrient input (Eugster, 2008; Klemm and Wrzesinsky, 2007;Zimmermann and Zimmermann, 2002). The measurement of deposition through fogis still challenging and rarely performed (Klemm and Wrzesinsky, 2007). The relative20
importance of the different deposition processes for a given chemical compound de-pends on whether the substance is present in gaseous or particulate form, its solubilityin water, the amount of precipitation in the region and the terrain and land surface covertype (Seinfeld and Pandis, 1998; Erisman et al., 2005b; Foken, 2008).
Several methods exist to estimate bulk and dry Nr deposition loads. These are25
throughfall methods and micrometeorological methods to determine exchange fluxesof single Nr compounds or sums of those. Throughfall, often used in forestry studies(Lovett and Lindberg, 1984; Berger et al., 2008; Hovmand and Andersen, 1995), maybe regarded as the sum of wet and dry deposition and canopy exchange, as through-
10665

BGD6, 10663–10706, 2009
Exchange of reactivenitrogen compounds
V. Wolff et al.
Title Page
Abstract Introduction
Conclusions References
Tables Figures
J I
J I
Back Close
Full Screen / Esc
Printer-friendly Version
Interactive Discussion
fall is the sum of direct precipitation, wash off of formerly dry deposited material andexchange processes within the canopy (Lovett and Lindberg, 1984). Dry depositionestimates from throughfall measurements are very controversial, particularly for thosespecies that potentially interact with the canopy (NH+
4 and NO−3 ) (Lovett et al., 1996;Berger et al., 2009), but they are still often used as reasonable estimates (van Breemen5
and van Dijk, 1988). Micrometeorological methods, like the eddy covariance methodhave advantages such as the capability to directly measure the dry deposition flux,spatial representativeness and high temporal resolution. They do, however, have highdemands to the study site, such as horizontal homogeneity and atmospheric station-arity. Moreover, eddy covariance measurements require fast sensors for the detection10
of chemical species (∼10Hz). If such instruments are not available (e.g., for HNO3),the aerodynamic gradient method is often applied, based on the flux-gradient-similaritytheory (see below). Both, the eddy covariance as well as the aerodynamic gradientmethod demand high logistical and financial effort as well as sophisticated measure-ment techniques for the chemical species of interest (cf. Thomas et al., 2009). Since15
these prerequisites are often not available, dry deposition is frequently modelled usingthe inferential method, which is based on the “big leaf multiple resistance approach”(Hertel et al., 2006; Andersen and Hovmand, 1999; Wesely and Hicks, 2000). Typically,the concentration of the chemical specie is measured at a single level above the sur-face and the deposition process is described by resistances, i.e., the aerodynamic re-20
sistance (Ra) derived from micrometeorological quantities, the laminar boundary layerresistance (Rb), dependent on the individual species of interest, and the surface re-sistance (Rc) (or its concentration analogue the canopy compensation point (C0), forexample for NH3; Farquhar et al., 1980). The surface resistance is often described byseveral resistances in series and in parallel, e.g. the cuticular, stomata and soil surface25
resistances. While Ra and Rb can be calculated from measured micrometeorologicalquantities, surface related parameters like Rc or C0 are derived using empirical param-eterizations or are deduced from other studies (cf. Nemitz et al., 2004a; Trebs et al.,2006; Sutton et al., 2000). However, parameterisations of the individual resistances
10666

BGD6, 10663–10706, 2009
Exchange of reactivenitrogen compounds
V. Wolff et al.
Title Page
Abstract Introduction
Conclusions References
Tables Figures
J I
J I
Back Close
Full Screen / Esc
Printer-friendly Version
Interactive Discussion
are mostly derived for flat homogeneous terrain and low vegetation and may not beadequate for complex sites, like highly structured, hilly, or forested sites (Hertel et al.,2006; Wesely and Hicks, 2000; Andersen and Hovmand, 1999). Additionally, param-eterizations of surface related parameters are only valid for certain temperature andhumidity ranges, fertilisation state and vegetation types (cf. Farquhar et al., 1980) and5
may not always be applied for other ecosystems. The dry deposition of particles, suchas particulate NH+
4 and NO−3 is typically very different to the dry deposition of gaseousspecies (Nemitz et al., 2004a). Generally, deposition velocities depend on aerosol par-ticle size and roughness of the underlying surface and they are about one order ofmagnitude smaller than those of gaseous compounds (Gallagher et al., 1997, 2002).10
From all Nr compounds, NH3 and HNO3 and their particulate counterparts NH+4 and
NO−3 are regarded as in the main contributors to atmospheric Nr deposition (Ander-sen and Hovmand, 1999). NH3 is emitted primarily by agricultural activities, such asvolatilization from animal waste and synthetic fertilizers, but also from biomass burn-ing, losses from soils, and fossil fuel combustion (Krupa, 2003). It is an important base15
constituent in the atmosphere, and neutralises acids, such as sulphuric and nitric acid(HNO3) and hydrochloric acid, forming ammonium (NH+
4 ) salts, whose major portion ispresent in the fine particle fraction (Finlayson-Pitts and Pitts, 1999). High concentra-tions of NH3 are usually found close to sources since it is either effectively dry depositedclose to its source and/or rapidly converted to NH+
4 (Ferm, 1998). Particulate NH+420
is deposited less quickly and may thus be transported over larger distances. HNO3is produced from the oxidation of nitrogen oxides (NOx), which are emitted primarilyby anthropogenic activities, such as fossil fuel burning. Natural sources are biogenicemissions of nitric oxide (NO) from soils and lightning. The polar and very water solu-ble HNO3 is removed quickly from the atmosphere, either by dry and wet deposition or25
by gas-to-particle conversion. This leads to comparatively short atmospheric lifetimesof about 1 day (Huebert and Robert, 1985). Particulate NO−3 is formed by the reactionof HNO3 with atmospheric base compounds, such as NH3 and also crustal materialsuch as sodium and calcium, and is found in different size ranges of particles, in the
10667

BGD6, 10663–10706, 2009
Exchange of reactivenitrogen compounds
V. Wolff et al.
Title Page
Abstract Introduction
Conclusions References
Tables Figures
J I
J I
Back Close
Full Screen / Esc
Printer-friendly Version
Interactive Discussion
accommodation and in the coarse mode (Seinfeld and Pandis, 1998). Particulate NH+4
and NO−3 form the majority of the long-range transported Nr in the atmosphere (Hertelet al., 2006).
NH3, HNO3 and NH4NO3 form a thermodynamic equilibrium between the gaseousspecies (NH3, HNO3) and particulate NH4NO3 (in solid or in aqueous form), which is5
a function of temperature (T ) and relative humidity (RH) (Mozurkewich, 1993; Stelsonand Seinfeld, 1982):
NH3(gaseous)+HNO3(gaseous)T,RH←→NH4NO3(solid/aqueous) (R1)
Additionally, the equilibrium of React. (R1) depends on the chemical composition ofaerosol particles, especially on concentrations of those ions that are competing with10
NO−3 for the NH+4 , such as SO2−
4 and Cl− (Wexler and Seinfeld, 1990).The application of the flux-gradient-similarity theory (see below) presumes that verti-
cal fluxes of the measured compounds are constant with height within the atmosphericsurface layer (Dyer and Hicks, 1970), which implies that they are considered chem-ically non-reactive tracers (e.g., Trebs et al., 2006). Phase changes due to shifts of15
the thermodynamic equilibrium between gaseous and particulate species (as a resultof fluctuations in T and RH) may, however, induce a chemical flux divergence of NH3,HNO3, NH+
4 and/or NO−3 . Without correcting for these effects, dry deposition estimatesderived from gradient measurements may substantially under- or overestimate the ac-tual turbulent flux (Nemitz and Sutton, 2004; Nemitz et al., 2004a). The sum of both20
phases, total ammonium (tot-NH+4 ) and total nitrate (tot-NO−3 ), are, however, conserva-
tive quantities in this respect (Kramm and Dlugi, 1994; Brost et al., 1988). While, for thequantification of the Nr input in an ecosystem like in this study, the partitioning amonggas and particulate phase is of minor importance, measurements of exchange fluxes ofindividual compounds (NH3, HNO3, NH+
4 and NO−3 ) are a prerequisite for investigating25
near-surface mechanistic processes required for atmospheric chemistry and transportmodels.
In this paper we will present measurements of concentrations of ammonia (NH3),
10668
BGD6, 10663–10706, 2009
Exchange of reactivenitrogen compounds
V. Wolff et al.
Title Page
Abstract Introduction
Conclusions References
Tables Figures
J I
J I
Back Close
Full Screen / Esc
Printer-friendly Version
Interactive Discussion
nitric acid (HNO3), particulate ammonium (NH+4 ) and nitrate (NO−3 ), and their sums to-
tal ammonium (tot-NH+4 ) and total nitrate (tot-NO−3 ) above a spruce forest canopy in
southeast Germany in summer 2007. We focus on flux determinations of the con-servative quantities (tot-NH+
4 and tot-NO−3 ), thereby avoiding the potential impact ofgas-particle interactions and chemical flux divergences. Using measurements of wet5
deposition and estimations on occult deposition, we estimate a total Nr deposition ratefor September 2007. In a subsequent paper, we will investigate chemical gas-particleconversion processes and the corresponding potential influence on fluxes of individualNr compounds.
2 Experimental10
2.1 Weidenbrunnen research site
The experiment was conducted in summer/autumn 2007 (25 August–03 October)within the framework of the project EGER (ExchanGE processes in mountainous Re-gions) at the research site “Weidenbrunnen” (50◦08′N, 11◦52′ E; 774 m a.s.l.), a Nor-way spruce forest site located in a mountainous region in south east Germany (Fichtel-15
gebirge). The surrounding mountainous area extends approx. 1000 km2 and is coveredmainly with forest, but also some agricultural land, meadows and lakes. Continuous airquality measurements indicate that the site is characterized as a rural site of CentralEurope (Klemm and Lange, 1999). It is located in the transition zone from maritime tocontinental climates with annual average temperatures of 5.0◦C (1971–2000; Foken,20
2003) and average annual precipitation sum of 1162.5 mm (1971–2000; Foken, 2003).The study site is maintained for more than 10 years by the University of Bayreuth anda variety of studies have been conducted there (Falge et al., 2005; Held and Klemm,2006; Klemm et al., 2006; Rebmann et al., 2005; Thomas and Foken, 2007; Wichuraet al., 2004). The stand age of the Norway spruce (Picea abies) was approx. 5425
years (according to Alsheimer, 1997), the mean canopy height was estimated to be
10669
BGD6, 10663–10706, 2009
Exchange of reactivenitrogen compounds
V. Wolff et al.
Title Page
Abstract Introduction
Conclusions References
Tables Figures
J I
J I
Back Close
Full Screen / Esc
Printer-friendly Version
Interactive Discussion
23 m (Staudt, 2007), and the single sided leaf area index during the measurementcampaign was approximately 5.3. Measurements were performed on a 31 m walk-uptower. For the Weidenbrunnen site, Thomas and Foken (2007) determined the rough-ness parameters displacement height (d ) and roughness length (z0) as 14 m and 2 m,respectively.5
2.2 Aerodynamic gradient method
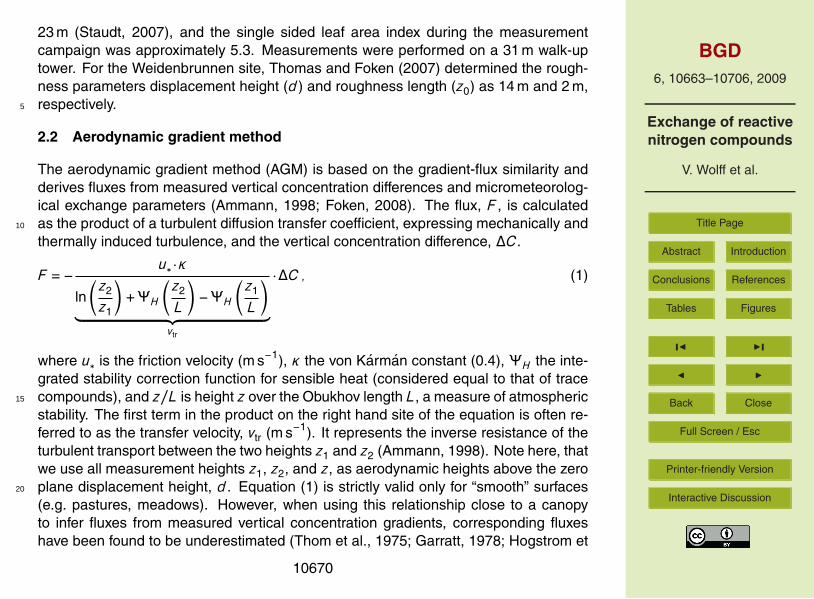
The aerodynamic gradient method (AGM) is based on the gradient-flux similarity andderives fluxes from measured vertical concentration differences and micrometeorolog-ical exchange parameters (Ammann, 1998; Foken, 2008). The flux, F , is calculatedas the product of a turbulent diffusion transfer coefficient, expressing mechanically and10
thermally induced turbulence, and the vertical concentration difference, ∆C.
F =−u∗ ·κ
ln(z2
z1
)+ΨH
(z2
L
)−ΨH
(z1
L
)︸ ︷︷ ︸
vtr
·∆C, (1)
where u∗ is the friction velocity (m s−1), κ the von Karman constant (0.4), ΨH the inte-grated stability correction function for sensible heat (considered equal to that of tracecompounds), and z/L is height z over the Obukhov length L, a measure of atmospheric15
stability. The first term in the product on the right hand site of the equation is often re-ferred to as the transfer velocity, vtr (m s−1). It represents the inverse resistance of theturbulent transport between the two heights z1 and z2 (Ammann, 1998). Note here, thatwe use all measurement heights z1, z2, and z, as aerodynamic heights above the zeroplane displacement height, d . Equation (1) is strictly valid only for “smooth” surfaces20
(e.g. pastures, meadows). However, when using this relationship close to a canopyto infer fluxes from measured vertical concentration gradients, corresponding fluxeshave been found to be underestimated (Thom et al., 1975; Garratt, 1978; Hogstrom et
10670
BGD6, 10663–10706, 2009
Exchange of reactivenitrogen compounds
V. Wolff et al.
Title Page
Abstract Introduction
Conclusions References
Tables Figures
J I
J I
Back Close
Full Screen / Esc
Printer-friendly Version
Interactive Discussion
al., 1989). Nevertheless, the flux-gradient relationship was found to hold above forestcanopies, introducing a so-called enhancement factor into the left hand term of theright hand side of Eq. (1) (e.g., Simpson et al., 1998). However, as we have made useof directly measured u∗, measured by an eddy covariance system (at 31 m height), it isnot necessary to consider roughness sublayer enhancement factors in our evaluations5
(Garratt, 1992).An underlying assumption of the AGM is that the flux to or away from the reference
surface (e.g., canopy top) is identical to the vertical flux measured at a reference levelin some distance above the surface (see above). This assumption may not hold due tochemical reactions occurring within the air layer between the surface and the reference10
height (Fowler and Duyzer, 1989; Meixner, 1993). For the determination of total am-monium and total nitrate this is not of relevance, but does affect flux determination ofindividual gaseous and/or particulate compounds (NH3, HNO3, NH+
4 , NO−3 ) as phasechanges may lead to flux divergence (e.g., Nemitz et al., 2004a; Brost et al., 1988;Huebert et al., 1988). However, as long as the characteristic time scale of chemical15
transformation is large in comparison to the turbulent timescale, fluxes of compoundsthat underlie rapid chemical transformation may be determined with sufficient accuracy(De Arellano and Duynkerke, 1992; Nemitz et al., 2004b). Photochemical reactions in-volving NH3 and HNO3 are slow compared to turbulence; however, timescales of phasechanges within the NH3-HNO3-NH4NO3 triad (see React. R1), may be comparable to20
characteristic times of turbulent transport (Trebs et al., 2006). The turbulent timescalesare estimated according to Mayer (2008). The timescales to achieve thermodynamicequilibrium between gas and aerosol phase of the NH3-HNO3-NH4NO3 triad can beapproximated as a function of the aerosol particle surface available for the equilibriumreaction (Wexler and Seinfeld, 1990, 1992).25
2.3 The GRadient of AErosol and Gases Online Registrator (GRAEGOR)
The GRAEGOR is a wet chemical instrument for semi-continuous two-point gradientmeasurements of water-soluble reactive trace gas species (NH3, HNO3, HONO, HCl,
10671

BGD6, 10663–10706, 2009
Exchange of reactivenitrogen compounds
V. Wolff et al.
Title Page
Abstract Introduction
Conclusions References
Tables Figures
J I
J I
Back Close
Full Screen / Esc
Printer-friendly Version
Interactive Discussion
and SO2) and their related particulate compounds (NH+4 , NO−3 , Cl−, SO2−
4 ) (Thomas etal., 2009). GRAEGOR collects the gas and particulate samples simultaneously at twoheights (for EGER: 24.4 m and 30.9 m) using horizontally aligned wet-annular rotatingdenuders and steam-jet aerosol collectors (SJAC), respectively. Air is simultaneouslydrawn through GRAEGOR’s sample boxes, passing first the wet-annular rotating de-5
nuders, where water-soluble gases diffuse from a laminar air stream into the sampleliquid. In both SJACs, the sample air (now containing only the aerosol particles) is thenmixed with water vapour from double-deionized water and the supersaturation causesparticles to grow rapidly (within 0.1 s) into droplets of at least 2 µm diameter. Thesedroplets, containing the dissolved particulate species are then collected in a cyclone10
(cf. Slanina et al., 2001). The airflow through the two sample boxes is ∼14Lmin−1
(at STP=0◦C and 1013.25 hPa) per box and is kept constant through a critical ori-fice downstream of the SJAC. The inlets of the sample boxes, directly connected tothe wet-annular rotating denuders, consisted of PFA (perflouroalkoxy) Teflon tubing(I.D.=0.8cm, length=20cm), ended upstream in a home-made PFA Teflon rain protec-15
tion, and were covered by a PFA gauze. Liquid samples (from both denuders andSJACs) are analyzed online using ion chromatography for anions and by flow injectionanalysis for NH+
4 . GRAEGOR provides one half-hourly averaged gas and particulateconcentrations for each height for each species within each hour (cf. Thomas et al.,2009). The analytical performance of the instrument is continuously checked using20
an internal bromide standard that is added to each sample. Calibrations of the ion
chromatograph using Merck certiPUR® standard solutions were performed twice, 6–7September and 26 September. The FIA detector was calibrated weekly. The limit ofdetection (LOD) for the individual species was determined from in-field blanks oncea week (for details see Wolff et al., 2009). The errors of the air concentrations of NH3,25
HNO3, particulate NH+4 , and particulate NO−3 were calculated according to Trebs et
al. (2004) and Thomas et al. (2009) using Gaussian error propagation. The precisionof the measured concentration differences (σ∆C/C) was investigated by extended side-by-side measurements in the beginning and at the end of the experiment (Wolff et al.,
10672
BGD6, 10663–10706, 2009
Exchange of reactivenitrogen compounds
V. Wolff et al.
Title Page
Abstract Introduction
Conclusions References
Tables Figures
J I
J I
Back Close
Full Screen / Esc
Printer-friendly Version
Interactive Discussion
2009).
2.4 Supporting measurements
Vertical profiles of meteorological parameters, such as ambient temperature (T ), rela-tive humidity (RH), and wind speed were measured at the tower (31 m high) at threeheights above the canopy (at z=24.4, 26.6, and 30.9 m (T , RH, using psychrometers5
(fine-wire thermocouples, custom build)) and z=24.3, 26.2 and, 31.2 m (wind speed, 3cup anemometer (A100ML, Vector Instruments, UK))). On top of the tower (z=32m),an eddy covariance system (Gill R2 sonic anemometer in combination with a LI-COR-7000) measured three-dimensional wind speed, wind direction, friction velocity, stabil-ity, latent, sensible heat and CO2 fluxes. Atmospheric visibility using a present weather10
detector (PWD 11, Vaisala), global irradiance (pyranometer CM14, Kipp & Zonen B.V.)and wind direction (potentiometric wind vane, Vector Instruments) were also measuredon top of the tower at 32 m height. Aerosol number size distributions were measuredat 28 m height at the tower using a SMPS (Scanning Mobility Particle Sizer, Grimm).
At a nearby clearing (distance to tower ∼250m), a wet-only rainwater collector (NSA15
181/KHS Eigenbrodt, 2007) was operated. During the field study, samples were col-lected event-based and stored cool until analysis (Bayerische Landesamt fur Umwelt,Augsburg, ion chromatography). In September a total of six rain samples were anal-ysed for chloride, nitrite, nitrate, phosphate, sulphate, sodium, ammonium, potassium,magnesium, and calcium.20
3 Results
3.1 Meteorological conditions
Meteorological quantities, such as RH, T , wind speed (m s−1), wind direction (◦), rain(mm), visibility (m) and global radiation (W m−2) for the month of September in 2007
10673

BGD6, 10663–10706, 2009
Exchange of reactivenitrogen compounds
V. Wolff et al.
Title Page
Abstract Introduction
Conclusions References
Tables Figures
J I
J I
Back Close
Full Screen / Esc
Printer-friendly Version
Interactive Discussion
are summarized in Fig. 1. Two episodes with several consecutive sunny days are incontrast to prevailing humid, foggy conditions with frequent rain and reduced visibility.During fog and rain, the temperature amplitude was reduced and temperatures rangedbetween below 5 and 15◦C, while RH almost always remained above 70–80%. Dur-ing the sunny episodes (12–17 September and 19–24 September) temperatures show5
a diel variation with increasing temperatures from day to day (up to more than 20◦C).During these days, RH dropped to below 70% during daytime. The wind speed wasgenerally quite high with a median of 2.8 m s−1, ranging between 2 and 4 m s−1 (interquartile range). During the first half of September (foggy conditions), the wind blew fre-quently from northerly directions, turning towards south westerly directions afterwards.10
3.2 Detection limits, precision and mean concentrations
To facilitate comparison between the concentrations and fluxes of the different nitrogencontaining compounds all numbers are given in terms of nitrogen1. In this paper wefocus on the measurements made in September 2007. Until the 26 September wemeasured concentrations at two levels, and after that concentration measurements at15
one level are available (side-by-side measurements, see Wolff et al., 2009). Deter-mined LOD values (3σ-definition) were 0.017 µgm3 for NH3 and particulate NH+
4 , and0.029µg m−3 for HNO3 and particulate NO−3 , respectively (see Wolff et al., 2009). Lessthan 1% of the total NH3 concentrations were below the detection limit, less than 2%of the total particulate NH+
4 concentrations, but 30% of the HNO3 concentrations and20
8% of the particulate NO−3 concentrations were below corresponding detection limits.Below LOD concentrations were predominantly measured during rainy periods. Fortot-NH+
4 and for tot-NO−3 the precision was found to be 5.3% and 4.8%, respectively.The median error of the concentration difference (σ∆C/∆C) was found to be 52.1% and
1All concentrations and fluxes are given in µg m−3 in terms of N. To convert these to µg m−3
they must be multiplied with the ratio of the molar masses, i.e. for NH3:1.216, for NH+4 (and tot-
NH+4 ):1.288, for HNO3:4.499 and NO−3 (and tot-NO−3 ):4.427.
10674
BGD6, 10663–10706, 2009
Exchange of reactivenitrogen compounds
V. Wolff et al.
Title Page
Abstract Introduction
Conclusions References
Tables Figures
J I
J I
Back Close
Full Screen / Esc
Printer-friendly Version
Interactive Discussion
37.9%. Measured concentration differences larger than the precision were consideredto be significant and subsequently used for flux calculations, while those below theprecision were determined to be insignificantly different from zero. For tot-NH+
4 , 55% ofthe 443 total measured concentration differences were found to be significant, for tot-NO−3 , 77% of the 373 total concentration differences were significant. From the error of5
the concentration difference, the flux error is derived in combination with an estimatederror of vtr of around 10% (see Wolff et al., 2009). For the period 1–30 September2007 the concentration data coverage was around 75%. Data gaps are due to in-field blank determination, calibration, instrument failure, bad or noisy chromatograms;poor de-ionized water quality as well as air and liquid flow instability (cf. Wolff et al.,10
2009). Statistical distributions of NH3 and particulate NH+4 concentrations as well as
of HNO3 and particulate NO−3 concentrations are presented in Table 1. NH3 concen-
trations ranged between 0.25 and 1.00µg m−3 (inter quartile range), with the median(0.57 µgm−3) being only slightly smaller than the one of particulate NH+
4 of 0.76µg m−3
(inter quartile range between 0.32 and 1.39 µgm−3). HNO3 varied between 0.05 and15
0.28µg m−3 (median: 0.12µg m−3), while the particulate counterpart, NO−3 was three
to six times larger, varying between 0.18 and 0.80µg m−3 (inter quartile range; me-dian: 0.48µg m−3). Concentrations varied with meteorological conditions and weregenerally higher during periods with higher temperatures and lower RH and reachedtheir minimum in rainy periods. During the sunny and drier days (Fig. 1, white bars)20
the overall data coverage and the percentage of significant concentration differenceswere higher. High RHs, rain and fog droplets may cause problems with losses in theinlet lines (Wolff et al., 2009). Thus, our investigation of dry deposition and exchangeprocesses of tot-NH+
4 and tot-NO−3 will focus on the two sunny and dry episodes.
3.3 Diel variations25
The diel variations of gaseous NH3 and HNO3 and their particulate counterparts NH+4
and NO−3 are determined by production and loss (e.g., chemical production, dry de-
10675

BGD6, 10663–10706, 2009
Exchange of reactivenitrogen compounds
V. Wolff et al.
Title Page
Abstract Introduction
Conclusions References
Tables Figures
J I
J I
Back Close
Full Screen / Esc
Printer-friendly Version
Interactive Discussion
position and phase partitioning), as well as horizontal and vertical transport within theplanetary boundary layer. NH3 and particulate NH+
4 share the same concentrationrange during the study and reveal a regular pattern of higher particle concentrations atnight and higher gas phase concentrations during daytime, especially during the drierand sunnier episodes (cf. Fig. 2a, especially 22–25 September). HNO3 and particulate5
NO−3 concentrations are very different, with particle concentrations of up to four timeshigher than gas phase concentrations (note different scales of the y-axes in Fig. 2b).Generally, HNO3 and particulate NO−3 concentrations also follow the pattern of highnighttime particle concentrations and high daytime gas phase concentrations. In thetime series of tot-NH+
4 and tot-NO−3 (Fig. 2c) the effect of gas-particle interactions is10
removed. Their concentrations, however, still vary with time, reflecting meteorologicalconditions, with low values during rainy and foggy conditions and higher concentrationsduring the sunnier episodes (cf. Fig. 1). This difference between fair weather conditionsand rainy/foggy episodes is more pronounced for tot-NO−3 , reflecting to some extent thefact that production is linked with photochemical processes (oxidation of NO2 with OH15
to HNO3). Tot-NH+4 shows a regular pattern of higher concentrations towards the after-
noons, while in the time series of tot-NO−3 such a pattern can not be identified.
3.4 Timescale analysis
The diel variations of NH3, HNO3, NH+4 and NO−3 were most likely influenced by
changes of T and RH (see Figs. 1 and 2) and subsequent changes of the thermo-20
dynamic equilibrium (React. R1) between gaseous and particulate phase. To estimatethe effect of the system striving towards equilibrium on the determination of exchangefluxes, we performed a timescale analysis for the time of available aerosol particlesize distribution measurements (Wexler and Seinfeld, 1990, 1992). The Damkohlerratio (Fig. 3), the ratio of characteristic turbulent timescales to equilibration timescales25
(Da=τturb/τequi), is a measure of the degree to which chemical conversion may affectthe determination of exchange fluxes by micrometeorological methods (Foken et al.,1995). Assuming that all surfaces of the particles take part in the equilibrium reaction
10676

BGD6, 10663–10706, 2009
Exchange of reactivenitrogen compounds
V. Wolff et al.
Title Page
Abstract Introduction
Conclusions References
Tables Figures
J I
J I
Back Close
Full Screen / Esc
Printer-friendly Version
Interactive Discussion
(black line in Fig. 3), Da often approaches and exceeds unity (100), especially duringnighttime. For a smaller fraction of the aerosol particle surface taking part (e.g., 10%red line in Fig. 3), turbulent transport would be fast enough to exclude the influenceof chemical divergence affecting the concentration gradients, at least during daytime(Da<0.1). Consequently, for flux measurements of individual Nr compounds of the5
NH3-HNO3-NH4NO3 triad, the gas-particle partitioning processes need to be consid-ered. In this paper, focusing on the total dry deposition of ammonium and nitrate, weconfine ourselves to the derivation of fluxes of the conservative sums of gaseous andparticulate phase, tot-NH+
4 and tot-NO−3 . As stated above, chemical divergences andsingle compound fluxes will be investigated in a subsequent publication.10
3.5 Fluxes and deposition velocities
Due to the high roughness of the forest, the transfer velocity was quite large with0.45±0.25ms−1. Maximum transfer velocities of 0.70±0.18ms−1 were found at noon,while during nighttime minimum values were 0.25±0.22ms−1. From the measuredconcentrations at two levels above the forest canopy, we calculated the fluxes for total15
ammonium and total nitrate. In September, concentration measurements at two levelswere available until the morning of the 26th. Fluxes varied significantly according tothe prevailing meteorological conditions (see Fig. 4). Fluxes of tot-NH+
4 were generallysmaller during fog and humid conditions and showed emission events from wet or dry-ing surfaces and large deposition fluxes during the sunny days. Fluxes of tot-NO−3 were20
always directed downward, but were significantly larger during the sunny episodes,while being almost zero under cooler and foggy conditions. Maximum daytime depo-sition fluxes of tot-NH+
4 ranged between −200 and −500ngm−2s−1. Deposition fluxesof tot-NO−3 were about half of those of tot-NH+
4 , with the midday maximum ranging be-
tween −100 and −260ngm−2s−1. Median flux errors for tot-NH+4 and tot-NO−3 fluxes25
were 50% and 44%, respectively (see Wolff et al., 2009). Median deposition veloci-
10677

BGD6, 10663–10706, 2009
Exchange of reactivenitrogen compounds
V. Wolff et al.
Title Page
Abstract Introduction
Conclusions References
Tables Figures
J I
J I
Back Close
Full Screen / Esc
Printer-friendly Version
Interactive Discussion
ties2 (or normalised fluxes; vd=flux/concentration) calculated for the geometric meanof the measurement heights (13.3 m above displacement height) were 3.4 cms−1 fortot-NH+
4 and 4.2 cms−1 for tot-NO−3 . Especially during the sunny episodes, both vd , oftot-NH+
4 and tot-NO−3 , follow closely the inverse of the aerodynamic resistance (1/Ra),which provides a measure of the maximum possible vd . The median diel variations of5
vd with inter quartile ranges for tot-NH+4 and tot-NO−3 in September 2007 are shown in
Fig. 5. Nighttime median vd values are in the range of 0.6 to 1.4 cms−1 for tot-NH+4 and
0.7 and 2.4 cms−1 for tot-NO−3 . At around 08:00 h vd increases rapidly to maxima of
around 10–12 cms−1 for tot-NH+4 and to 8–12 cms−1 for tot-NO−3 . The diel course of vd
is skewed somewhat towards the early afternoon; the maximum is reached at around10
14:00 LT (tot-NH+4 ) and 15:00 LT (tot-NO−3 ). Afterwards, vd drops again, reaching the
lower nighttime values at around 18:00h/19:00 LT. Median vd values for both, tot-NH+4
and tot-NO−3 , remain below the aerodynamically maximum possible value, indicated as1/Ra.
3.6 Total N deposition in September 200715
Major constituents of dry Nr deposition are particulate NH+4 and NO−3 and gaseous
compounds NH3, HNO3 and to a minor extent also nitrogen dioxide (NO2), nitrous acid(HONO), peroxyacetyl nitrate (PAN), and nitric oxide (NO) (Andersen and Hovmand,1999). Surface-atmosphere exchange fluxes of NO and NO2 measured by eddy co-variance at our site were found to be one order of magnitude lower than the fluxes of20
tot-NH+4 and tot-NO−3 (Tsokankunku et al., 2009). The daytime NO flux was directed
downward to the forest canopy with −5 to −7ngm−2s−2 (in terms of N, inter quartile
2Note here that the use of the term “deposition velocity” may be a controversial issue forspecies that feature bi-directional exchange such as NH3 and thus also tot-NH+
4 . However, theuse of a normalised flux, termed as “deposition velocity”, may be useful for comparison withthe aerodynamic upper limit of transport, the inverse of the aerodynamic resistance.
10678

BGD6, 10663–10706, 2009
Exchange of reactivenitrogen compounds
V. Wolff et al.
Title Page
Abstract Introduction
Conclusions References
Tables Figures
J I
J I
Back Close
Full Screen / Esc
Printer-friendly Version
Interactive Discussion
range) and the daytime NO2 flux was directed upward with about 14 to 28 ngm−2s−2
(inter quartile range). The directions of NO and NO2 fluxes are in contrast to whatwould be expected for low vegetation (Delany and Lenschow, 1987), however they aremainly due to chemically induced flux divergence (Meixner, 1993). Concentrations ofHONO were in the order of 0.03 to 0.09 µgm−3 (inter quartile range), and concentra-5
tions of PAN were not measured at the site. Hence, the high importance of tot-NH+4 and
tot-NO−3 in Nr deposition generally recognized (Erisman and Draaijers, 2003; Erismanet al., 2003, 2005a, 2007; Andersen and Hovmand, 1999; Asman et al., 1998; Gal-loway et al., 2008; Sutton et al., 2007) is confirmed by our study. Median diel tot-NH+
4and tot-NO−3 dry deposition fluxes for September 2007 are presented in Fig. 6. Fluxes10
were larger during daytime, median tot-NH+4 fluxes reached −197ngm−2s−1, while me-
dian tot-NO−3 fluxes reached −134ngm−2s−1. Median nighttime values were around
zero to −40ngm−2s−1 for tot-NH+4 and −7 to −20ngm−2s−1 for tot-NO−3 . The dry de-
position for the whole month of September was estimated from the median diel depo-sition (tot-NH+
4 :5.68mgm−2d−1 and tot-NO−3 :3.54mgm−2d−1) multiplied by the number15
of days in September (30). This method was used because we do not have unin-terrupted flux measurements, especially under foggy and rainy conditions, when theinstrument worked less reliable (see above and Wolff et al., 2009). Flux values derivedfrom non-significant concentration differences were also included in the calculation, asthese were usually close to zero and had thus a significant influence on the median.20
Estimated dry deposition of tot-NH+4 and tot-NO−3 were 1.70 kg ha−1 and 1.06 kg ha−1,
respectively. If we excluded the insignificant flux values, the deposition for the monthof September would be overestimated by 38% in the case of tot-NH+
4 and by 28% inthe case of tot-NO−3 .
Wet deposition was calculated from analysed samples taken at the nearby clearing25
from six rain events in September 2007 (cf. Fig. 1). In most of the rain samples NH+4
was dominating over NO−3 (Fig. 7), with concentrations being about one third larger. Inthe rain storm after the six days of sun (19–25 September), NO−3 concentrations were
10679

BGD6, 10663–10706, 2009
Exchange of reactivenitrogen compounds
V. Wolff et al.
Title Page
Abstract Introduction
Conclusions References
Tables Figures
J I
J I
Back Close
Full Screen / Esc
Printer-friendly Version
Interactive Discussion
higher, which was also the case in the end of September. In September 2007 wet NH+4
deposition was 0.88 kg ha−1 and NO−3 to 0.67 kg ha−1, their sum yielding 1.55 kg ha−1.In both, wet and dry deposition, NH+
4 dominated over NO−3 , NO−3 deposition beingroughly two thirds of the NH+
4 deposition. The dry deposition was almost twice theamount of the wet deposition. The total N deposition due to dry and wet deposition5
of tot-NH+4 and tot-NO−3 yielded 4.31 kg ha−1 (with 64% due to dry deposition and 36%
due to wet deposition) in September 2007.
4 Discussion
4.1 Fluxes and deposition velocities
Concentrations levels of gaseous NH3 and HNO3 and particulate NH+4 and NO−3 , ob-10
served in our study (Fig. 2) are comparable to previous observations at the Weiden-brunnen site (Held et al., 2002). Also the dominance of the particulate phase over therespective gas phase was observed by Held et al. (2002).
Flux values and values of vd derived in this study are relatively large. There are in-dications that the exchange of reactive species at our site is not limited by any surface15
resistance. In summer 2001 exchange fluxes of hydrogen peroxide (H2O2) were de-termined at our site using a relaxed eddy accumulation technique (Valverde-Canossaet al., 2006). The characteristics of H2O2 are comparable to HNO3, as it is producedabove the canopy in the gas phase (mainly by recombination of two HO2 radicals) withsinks in the particulate phase and efficient dry deposition to surfaces due to its high sol-20
ubility and reactivity (Hall et al., 1999; Walcek, 1987). A modelling analysis indicatedthat H2O2 exchange was largely controlled by turbulent transport to and into the canopy,and also by the supply from above where chemical production occurs (Ganzeveld etal., 2006). Measured daytime vd of H2O2 were 5±2cms−1 (Valverde-Canossa et al.,2006).25
10680

BGD6, 10663–10706, 2009
Exchange of reactivenitrogen compounds
V. Wolff et al.
Title Page
Abstract Introduction
Conclusions References
Tables Figures
J I
J I
Back Close
Full Screen / Esc
Printer-friendly Version
Interactive Discussion
Most previous studies derived fluxes of individual Nr compounds only or derived totalfluxes using the inferential method that is constrained by required parameterizations ofsurface related exchange parameters (see Sect. 1).We found only one study (Siever-ing et al., 1994) that reported directly measured tot-NO−3 fluxes (using the AGM) andvd above the forest. They found evidence for large deposition rates of tot-NO−3 above5
a predominately spruce forest (Bayrischer Wald) in Germany (approx. 250 km SE fromour site). They measured concentrations of particulate NH+
4 , NO−3 and gaseous NH3
and HNO3 at two levels, using filter packs. Tot-NO−3 concentrations were about half
of our observed values, ranging between 0.34 and 0.68µg m−3. Particulate NO−3contributed 15–20% to the tot-NO−3 . The found diel tot-NO−3 flux ranged from 0.7 to10
5.2 mgm−2s−1, which is very similar to what we found. The observed geometric me-dian mass diameters of NO−3 and NH+
4 were 2.24±0.85µm and <0.9µm, respectively.
For these particle diameters, Peters and Eiden (1992) modelled possible vd 2–8 cms−1
for the particulate NO−3 dry deposition at the Bayrische Wald site. Values of tot-NO−3 vdderived by Sievering et al. (1994) were in the range of 2–9 cms−1, being approximately15
equal for HNO3 and NO−3 . Due to large uncertainties in particulate NH+4 measurement,
they could not determine exchange fluxes and/or vd for tot-NH+4 . Since the particulate
phase dominated our measured concentrations (see Sect. 3.2) we presume that theyalso dominate the deposition fluxes, at least in tot-NO−3 . Aerosol particle fluxes andvd depend on particle diameter, atmospheric conditions (friction velocity and stability)20
and surface conditions, such as roughness and canopy morphology (Erisman et al.,1997; Gallagher et al., 1997; Peters and Eiden, 1992; Fowler et al., 2009). Reportedvd range from some mms−1 for small particles (<1µm) and for low wind speeds tomore than 10 cms−1 for larger particles (>10µm) and high wind speeds. The highroughness and the large surface of the needles of the spruce forest at our site com-25
bined with the aerodynamic regime of high friction velocities (inter quartile range 0.32–0.63 m s−1) partly explain the finding of large aerosol particle vd (Fowler et al., 2009).Furthermore, the 50% theoretical particle cut-off diameters of the GRAEGOR due to
10681

BGD6, 10663–10706, 2009
Exchange of reactivenitrogen compounds
V. Wolff et al.
Title Page
Abstract Introduction
Conclusions References
Tables Figures
J I
J I
Back Close
Full Screen / Esc
Printer-friendly Version
Interactive Discussion
inlet design and denuder airflow regime is 0.2 nm and 18 µm (Thomas et al., 2009).According to Peters and Eiden (1992) vd for aerosol particles captured by the GRAE-GOR at typical wind speeds at our site (2–4 m s−1) may have varied between 0.08 andmore than 10 cms−1. Measurements at the Weidenbrunnen site by Held et al. (2002)revealed consistent patterns in the size distributions of particulate NH+
4 and NO−3 , with5
the former one dominating the fine particle concentrations (mean particle diameter of0.25 and 0.71 µm), and the latter dominating the coarse particles ranges (mean parti-cle diameter of 0.71 and 2 µm). For particles with mean diameters of 0.25, 0.71 and2 µm, vd at the encountered wind speeds would theoretically range between 0.01–0.6,0.01–1.08, and 0.06–3.5 cms−1, respectively (Peters and Eiden, 1992). According to10
Gallagher et al. (1997) these values would be 0.05–1, 0.03–2, and 0.11–0.8 cms−1.Thus, another possible explanation for the large vd found in our study (Sect. 3.5 andFig. 5), could be the presence of large (≥10µm) NH+
4 and NO−3 containing particles.Deposition velocities of NH+
4 and NO−3 (derived from eddy covariance measure-
ments) larger than those of SO2−4 and those derived from particle number flux mea-15
surements have been reported (Nemitz et al., 2004b; Thomas, 2007). These wereexplained by changes in the thermodynamic equilibrium towards the more rapidly de-positing gaseous species between the measurement height and the vegetated surface(Fowler et al., 2009). The quick removal processes of NH3 and HNO3 just aboveand within the canopy together with warm surface temperatures would favour aerosol20
evaporation, consequently enhancing total deposition of both, particulate and gaseousphase. We observed highest vd during daytime of the sunny episodes during ourmeasurement period. During these times, temperature was highest at the canopy top.Although using the chemically conservative quantities of tot-NH+
4 and tot-NO−3 , the de-rived total deposition fluxes were probably influenced by this additional sink, resembling25
thus more vd of gaseous species than those of particles. Assuming such a mechanismwe can follow up reports which claimed the importance of particulate N species inN deposition estimates and the use of effective deposition velocity parameterisationsfor highly volatile aerosol compounds rather than using parameterisations regardless
10682

BGD6, 10663–10706, 2009
Exchange of reactivenitrogen compounds
V. Wolff et al.
Title Page
Abstract Introduction
Conclusions References
Tables Figures
J I
J I
Back Close
Full Screen / Esc
Printer-friendly Version
Interactive Discussion
of the particulates’ chemical composition (Erisman et al., 1995, 1997; Fowler et al.,2009).
4.2 Deposition of reactive nitrogen
Wet deposition rates of NH+4 and NO−3 measured previously in summer 2001 at the Wei-
denbrunnen site were very similar to ours, with September sums being 0.906 kg ha−15
NH+4 and 0.835 kg ha−1 NO−3 (see Klemm and Wrzesinsky, 2007). In order to deter-
mine the total nitrogen deposition at our site we also have to take into account theoccult deposition through the interception of fog water. The Weidenbrunnen researchsite shows a high frequency of fog events throughout the year and throughout ourmeasurement campaign (see meteorological conditions, Fig. 1). Several studies on10
fog meteorology and chemistry have been conducted at that site (Klemm and Wrzesin-sky, 2007; Wrzesinsky and Klemm, 2000), in which the importance of the so calledoccult deposition was stressed. For a study between April 2001 and March 2002,most fog events were found to be associated with clouds being advected from westerlydirections, intercepting with the forest vegetation of the site as it is located on a moun-15
tain range of about 1000 ma.s.l. (Klemm and Wrzesinsky, 2007). The most importantionic constituents of fog water were found to be NH+
4 , NO−3 and SO2−4 . These three
ions were significantly enriched in the fog water compared to the rain water samples(ratios fog/rain concentrations 18.1, 12.7 and 11.8, respectively), which led to the con-clusion that during the study of April 2001 and March 2002 the occult deposition of20
NH+4 , NO−3 and SO2−
4 in fog water was similar and often larger than the wet deposition,although more liquid water was deposited through rain than through fog. Accountingthese findings, we estimate the occult deposition in September 2007 as equal to thewet deposition. Consequently, the total Nr deposition in September 2007 sums up to5.86 kg ha−1.25
To compare our measurement results with results from other deposition studies ofreactive nitrogen (Nr), we derive estimates on potential annual deposition sums. Held
10683
BGD6, 10663–10706, 2009
Exchange of reactivenitrogen compounds
V. Wolff et al.
Title Page
Abstract Introduction
Conclusions References
Tables Figures
J I
J I
Back Close
Full Screen / Esc
Printer-friendly Version
Interactive Discussion
et al. (2002) found substantial differences in concentrations of Nr species in winteras compared to summer values at the Weidenbrunnen site, with winter values beingless than half of the summer values. Concentrations of NH3 were below the detectionlimit during the winter 2001 measurements. Obviously, the total Nr deposition variesthroughout the year. If we would consider that six month of a year the wet, dry and5
occult deposition was the same as in September 2007 and that the other six monthdeposition for all three pathways was half of the values in September 2007, we obtaina total annual Nr (lower) deposition estimate of 52.74 kgha−1yr−1. The total estimatedNr input based on dry and wet deposition alone yields 38.79 kgha−1yr−1. Assuming thatthe differences in concentrations and deposition fluxes balance each other in the run of10
a year, and thus estimating the annual deposition by multiplying the September valuesby twelve yields 70.32 kgha−1yr−1 (upper estimate) including fog/cloud water deposi-tion, of which are 51.72 kgha−1yr−1 due to dry and wet deposition. Both values exceedthe critical load threshold (12.5–15 kgha−1yr−1) for the area (Nagel et al., 2004). Fig-ure 8 gives an overview of results from different Nr deposition studies to spruce forest15
ecosystems compared to our site. Some of the estimates rely on throughfall mea-surements; some are combinations of direct measurements and inferential modelling.The comparison between our short-term measurements based on the AGM methodwith the long-term monitoring data is not straight forward. Firstly, the estimation of an-nual deposition from measurements during one month only is very rough, especially20
in comparison with long-term observations. The throughfall approach is very differentto a micrometeorological approach. It is an integrated, straight forward and relativelycheap approach for deposition monitoring, but drawbacks comprise spatial represen-tativeness and the missing knowledge on canopy exchange, especially of Nr species.The canopy exchange includes both leaching and consequently efflux from the canopy25
as well as uptake or retention and therefore influx to the canopy. Throughfall methodsmay therefore easily either over- or underestimate total deposition fluxes.
Although Klemm and Wrzesinsky (2007) found similar wet deposition values inSeptember 2001 compared to our September measurements, the annual wet depo-
10684

BGD6, 10663–10706, 2009
Exchange of reactivenitrogen compounds
V. Wolff et al.
Title Page
Abstract Introduction
Conclusions References
Tables Figures
J I
J I
Back Close
Full Screen / Esc
Printer-friendly Version
Interactive Discussion
sition for April 2001 to March 2002 was much higher. 2001 was a comparatively wetyear with high fog occurrence (on 233 days compared to an annual mean (1997–2007) of 200 days). The estimate we made using similar deposition rates throughrain and fog/cloud water interception is, however, also valid for the annual budget.For the “Fichtelgebirge” mountains, Matzner et al. (2001) reported average through-5
fall fluxes of mineral N of 21 kgha−1yr−1, pointing out that this value underestimatesthe actual atmospheric deposition due to the canopy uptake, which they estimate ashigh as 28 kgha−1yr−1. Our two estimates of the annual Nr deposition flux are bothlarger than their throughfall flux data but the lower estimate is within the range of esti-mated throughfall plus canopy uptake. Zimmermann et al. (2006) measured deposition10
of NH+4 and NO−3 in the Erzgebirge in south east Germany for several years (2001–
2004). He used both micrometeorological and throughfall methods and measured dry,wet, and occult deposition. The wet deposition is comparable to our results, beingmore important than dry deposition. Differences between the dry deposition estimateof Zimmermann et al. (2006) and our study could be due to the use of the inferential15
model by Zimmermann et al. (2006) and, of course, to our very rough estimation of theannual deposition on only one month measurements. The fog/cloud water depositionwas not very significant in the study of Zimmermann et al. (2006), but it is pointed outthat it is important for the forest at higher altitudes of the Erzgebirge (Zimmermann andZimmermann, 2002). Throughfall fluxes were roughly two thirds of the sum of dry, wet,20
and occult deposition, suggesting possible canopy uptake of NH+4 and NO−3 . Rothe
et al. (2002) reported Nr bulk deposition fluxes of 10.7 kgha−1yr−1 and Nr throughfallfluxes of 29.6 kgha−1yr−1 to a spruce forest in south west Bavaria, Germany, about190 km south southwest of our site. Their study includes Nr deposition loads of 15 Eu-ropean spruce stands (all determined using throughfall methods) ranging from 11.2 to25
56 kgha−1yr−1. Sievering et al. (1994) reported a range of diel deposition fluxes of tot-NO−3 and annual wet deposition of total inorganic Nr from which we derived an annualdeposition range (cf. Fig. 8). The upper end of this range would yield a similar annualdeposition load like our lower estimate (based on dry and wet deposition only), not yet
10685
BGD6, 10663–10706, 2009
Exchange of reactivenitrogen compounds
V. Wolff et al.
Title Page
Abstract Introduction
Conclusions References
Tables Figures
J I
J I
Back Close
Full Screen / Esc
Printer-friendly Version
Interactive Discussion
including dry deposited NH+4 . Sievering et al. (1994) point out that their results indi-
cate an exceedance of the critical N loads. Berger et al. (2009) measured throughfallfluxes in a nutrient poor spruce forest in northern Austria and found relatively small val-ues, slightly less than deposition values estimated by Matzner et al. (2001) for our site.Berger et al. (2009) used a canopy exchange model to estimate total deposition fluxes5
and modelled the canopy to be a source for NO−3 and a sink for NH+4 . Direct deposition
estimates (AGM) of different Nr species for the year 1995 at the Speuld forest in TheNetherlands were reported by Erisman et al. (1996). Dry deposition rates of tot-NH+
4
and tot-NO−3 were 22.60 kgha−1yr−1 and 4.67 kgha−1yr−1, respectively. Reported wet
deposition rates were 11.3 kgha−1yr−1 for NH+4 and 5.2 kgha−1yr−1 for NO−3 . Total N10
deposition (the sum of dry and wet deposition) yielded 43.77 kgha−1yr−1, which is verysimilar to our estimates (when looking at dry and wet deposition). Andersen and Hov-mand (1999) report dry deposition estimates derived using the AGM (NH3) and inferen-tial modelling (HNO3, NO−3 , NH+
4 ) for one year (July 1995–June 1996) of 9.2 kgha−1yr−1
of tot-NH+4 and 2.2 kgha−1yr−1 of tot-NO−3 for a Norway spruce forest site in west Den-15
mark. In Denmark the dry deposition of Nr compounds to forest ecosystems contributeswith 50–67% to the total composition (Andersen and Hovmand, 1999). Thus, the totaldeposition would yield an annual N deposition flux of 17.1 to 22.8 kgha−1yr−1.
Although we estimated the annual dry deposition to our site from one month mea-surements only, the comparison to long term direct measurements in The Netherlands20
(Erisman et al., 1996) and Denmark (Andersen and Hovmand, 1999) is remarkablegood. Additionally the ratio of dry to wet deposition compares very well with thesestudies. Occult deposition was only measured in two studies and the importance ofthis deposition pathway at our site was stressed (Zimmermann et al., 2006; Klemmand Wrzesinsky, 2007). All of the studies listed in Fig. 8 were conducted above/in25
spruce forest. Rothe et al. (2002) and Berger et al. (2008, 2009) compared depositionloads between beech, mixed and spruce forests and found enhanced acid deposition inthe spruce forests due to more efficiently scavenging of the coniferous canopies, which
10686

BGD6, 10663–10706, 2009
Exchange of reactivenitrogen compounds
V. Wolff et al.
Title Page
Abstract Introduction
Conclusions References
Tables Figures
J I
J I
Back Close
Full Screen / Esc
Printer-friendly Version
Interactive Discussion
is also reflected in higher seepage rates of NO3. The high surface to volume ratio ofthe canopy may thus also enhance dry deposition. The deposition load also largelydepends on the pollution levels of the surrounding air masses, i.e. the proximity of agri-culture, industry and traffic. The effect of this becomes evident when comparing thestudies by Andersen and Hovmand (1999) and Erisman et al. (1996) in Denmark (west5
of Denmark, close to the sea, few sources nearby) and The Netherlands (surroundedby intensive agriculture), respectively.
5 Conclusions
An intensive field campaign with hourly resolved two-level measurements of ammonia(NH3), nitric acid (HNO3), particulate ammonium (NH+
4 ) and nitrate (NO−3 ) were con-10
ducted above a spruce forest in southeast Germany. For the first time, the completeNH3-HNO3-NH4NO3 triad was measured continuously and simultaneously at two lev-els above a forest canopy, allowing for the calculation of surface-atmosphere exchangefluxes using the aerodynamic gradient method. However, indications for rapid phasechanges in the NH3-HNO3-NH4NO3 triad required the calculation of exchange fluxes15
of the chemically conservative quantities tot-NH+4 and tot-NO−3 (sums of gaseous and
particulate compounds). In September 2007 exchange fluxes were comparatively largeand median diel dry deposition velocities were 3.4 cms−1 for tot-NH+
4 and 4.2 cms−1 fortot-NO−3 . Large deposition velocities of tot-NH+
4 and tot-NO−3 were most likely the resultof a combination of several effects, such as:20
(a) high roughness of the forest canopy, large receptor surfaces (needles) of conifer-ous trees, and surface resistances of tot-NH+
4 and tot-NO−3 close to zero
(b) partly presence of particulate NO−3 in large aerosol particles (i.e. ≥10µm, typicallyfeaturing large deposition velocities due to the influence of gravitational settling)
(c) potential strong chemical sink below our measurement height due to phase25
10687

BGD6, 10663–10706, 2009
Exchange of reactivenitrogen compounds
V. Wolff et al.
Title Page
Abstract Introduction
Conclusions References
Tables Figures
J I
J I
Back Close
Full Screen / Esc
Printer-friendly Version
Interactive Discussion
changes between NH3, HNO3 and NH4NO3 towards the more efficiently de-posited gases
Consequently, we like to state, that the measurement of concentrations of only onesingle compound at one single level above forest using the inferential model to calculatefluxes (deriving Rc values) may lead to underestimation of the actual deposition load,5
especially in the case of aerosol particles. In our study, tot-NH+4 dry and wet deposition
was larger than the respective tot-NO−3 deposition. An estimated annual total nitrogendeposition load, approximated from dry, wet, and occult (fog interception) depositionis at the upper end of the range reported in literature. Thus, our site is a significantreceptor region for reactive nitrogen.10
Acknowledgements. The authors gratefully acknowledge financial support by the GermanScience foundation (DFG project EGER, ME 2100/4-1) and by the Max Planck Society. Theauthors wish to thank the University of Bayreuth (Micrometeorology Department) for hostingand supporting us during the EGER study. We thank the Bayerische Landesamt fur Umweltfor the analysis of the rain water samples. For very valuable support in the field measurements15
we would like to express our gratitude to the whole EGER IOP1 crew, especially to D. Plakeand J. Sintermann.
The service charges for this open access publicationhave been covered by the Max Planck Society.20
References
Alsheimer, M.: Charakterisierung raumlicher und zeitlicher Heterogenitaten der Transpirationunterschiedlicher montaner Fichtenbestande durch Xylemflussmessungen, Bayreuther Fo-rum Okologie, 1–143, 1997.
Ammann, C.: On the Applicability of Relaxed Eddy Accumulation and Common Methods for25
Measuring for Measuring Trace Gas Fluxes, Ph.D., Geographisches Institut, ETH, Zurich,229 pp., 1998.
10688
BGD6, 10663–10706, 2009
Exchange of reactivenitrogen compounds
V. Wolff et al.
Title Page
Abstract Introduction
Conclusions References
Tables Figures
J I
J I
Back Close
Full Screen / Esc
Printer-friendly Version
Interactive Discussion
Andersen, H. V. and Hovmand, M. F.: Review of dry deposition measurements of ammonia andnitric acid to forest, Forest Ecol. Manag., 114, 5–18, 1999.
Asman, W. A. H., Sutton, M. A., and Schjorring, J. K.: Ammonia: emission, atmospheric trans-port and deposition, New Phytol., 139, 27–48, 1998.
Berger, T. W., Untersteiner, H., Schume, H., and Jost, G.: Throughfall fluxes in a secondary5
spruce (Picea abies), a beech (Fagus sylvatica) and a mixed spruce-beech stand, ForestEcol. Manag., 255, 605–618, 2008.
Berger, T. W., Untersteiner, H., Toplitzer, M., and Neubauer, C.: Nutrient fluxes in pure andmixed stands of spruce (Picea abies) and beech (Fagus sylvatica), Plant Soil, 322, 317–342,2009.10
Brost, R. A., Delany, A. C., and Huebert, B. J.: Numerical modeling of concentrations andfluxes of HNO3, NH3, and NH4NO3 near the surface, J. Geophys. Res.-Atmos., 93, 7137–7152, 1988.
De Arellano, J. V. and Duynkerke, P. G.: Influence of chemistry on the flux-gradient relationshipsfor the NO-O3-NO2 system, Bound.-Lay. Meteorol., 61, 375–387, 1992.15
Delany, A. C. and Lenschow, D. H.: Measurement of NO and NO2 soil crop level fluxes witha micrometeorological technique, Abstr. Pap. Am. Chem. Soc., 193, 174-ENVR, 1987.
Eigenbrodt: Betriebs- und Wartungsanleitung Automatischer Niederschlagssammler NSA181/KHS, Eigenbrodt GmbH & Co. KG., 2007.
Erisman, J. W., Draaijers, G., Duyzer, J., Hofschreuder, P., Vanleeuwen, N., Romer, F., Ruijgrok,20
W., and Wyers, P.: Particle deposition to forests, Stud. Environ. Sci., 64, 115–126, 1995.Erisman, J. W., Draaijers, G. P. J., Mennen, M. G., Hogenkamp, J. E. M., van Putten, E.,
Uiterwijk, W., Kemkers, E., Wiese, H., Duyzer, J. H., Otjes, R., and Wyers, G. P.: TowardsDevelopment of a Deposition Monitoring Network for Air Pollution of Europe, RIVM, Bilthoven,The Netherlands, 1996.25
Erisman, J. W., Draaijers, G., Duyzer, J., Hofschreuder, P., VanLeeuwen, N., Romer, F., Ruij-grok, W., Wyers, P., and Gallagher, M.: Particle deposition to forests – Summary of resultsand application, Atmos. Environ., 31, 321–332, 1997.
Erisman, J. W. and Draaijers, G.: Deposition to forests in Europe: most important factorsinfluencing dry deposition and models used for generalisation, Environ. Pollut., 124, 379–30
388, 2003.Erisman, J. W., Grennfelt, P., and Sutton, M.: The European perspective on nitrogen emission
and deposition, Environ. Int., 29, 311–325, 2003.
10689

BGD6, 10663–10706, 2009
Exchange of reactivenitrogen compounds
V. Wolff et al.
Title Page
Abstract Introduction
Conclusions References
Tables Figures
J I
J I
Back Close
Full Screen / Esc
Printer-friendly Version
Interactive Discussion
Erisman, J. W., Hensen, A., Mosquera, J., Sutton, M., and Fowler, D.: Deposition mon-itoring networks: what monitoring is required to give reasonable estimates of ammo-nia/ammonium?, Environ. Pollut., 135, 419–431, 2005a.
Erisman, J. W., Vermeulen, A., Hensen, A., Flechard, C., Dammgen, U., Fowler, D., Sutton,M., Grunhage, L., and Tuovinen, J. P.: Monitoring and modelling of biosphere/atmosphere5
exchange of gases and aerosols in Europe, Environ. Pollut., 133, 403–413, 2005b.Erisman, J. W., Bleeker, A., Galloway, J., and Sutton, M. S.: Reduced nitrogen in ecology and
the environment, Environ. Pollut., 150, 140–149, 2007.Eugster, W.: Fog research, Erde, 139, 1–10, 2008.Falge, E., Reth, S., Bruggemann, N., Butterbach-Bahl, K., Goldberg, V., Oltchev, A., Schaaf,10
S., Spindler, G., Stiller, B., Queck, R., Kostner, B., and Bernhofer, C.: Comparison of surfaceenergy exchange models with eddy flux data in forest and grassland ecosystems of Germany,Ecol. Model., 188, 174–216, 2005.
Farquhar, G. D., Firth, P. M., Wetselaar, R., and Weir, B.: On the gaseous exchange of ammoniabetween leaves and the environment – Determination of the ammonia compensation point,15
Plant Physiol., 66, 710–714, 1980.Ferm, M.: Atmospheric ammonia and ammonium transport in Europe and critical loads: a re-
view, Nutr. Cycl. Agroecosyst., 51, 5–17, 1998.Finlayson-Pitts, B. J. and Pitts, J. N.: Chemistry of the Upper and Lower Atmosphere, Academic
Press, New York, 1999.20
Foken, T., Dlugi, R., and Kramm, G.: On the determination of dry deposition and emission ofgaseous compounds at the biosphere-atmosphere interface, Meteorol. Z., 4, 91–118, 1995.
Foken, T.: Lufthygienisch-bioklimatische Kennzeichnung des oberen Egertales (Fichtelgebirgebis Karlovy Vary), Bayreuther Forum Okologie, 1–70, 2003.
Foken, T.: Micrometeorology, 2nd ed., Springer, Berlin, 290 pp., 2008.25
Fowler, D. and Duyzer, J. H.: Micrometeorological Techniques for the Measurement of TraceGas Exchange, in: Exchange of Trace Gases between Terrestrial Ecosystems and the At-mosphere, edited by: Andreae, M. O., and Schimel, D. S., John Wiley & Sons Ltd., 189–207,1989.
Fowler, D., Pilegaard, K., Sutton, M. A., Ambus, P., Raivonen, M., Duyzer, J., Simpson, D.,30
Fagerli, H., Fuzzi, S., Schjoerring, J. K., Granier, C., Neftel, A., Isaksen, I. S. A., Laj, P.,Maione, M., Monks, P. S., Burkhardt, J., Daemmgen, U., Neirynck, J., Personne, E., Wichink-Kruit, R., Butterbach-Bahl, K., Flechard, C., Tuovinen, J. P., Coyle, M., Gerosa, G., Loubet,
10690

BGD6, 10663–10706, 2009
Exchange of reactivenitrogen compounds
V. Wolff et al.
Title Page
Abstract Introduction
Conclusions References
Tables Figures
J I
J I
Back Close
Full Screen / Esc
Printer-friendly Version
Interactive Discussion
B., Altimir, N., Gruenhage, L., Ammann, C., Cieslik, S., Paoletti, E., Mikkelsen, T. N., Ro-Poulsen, H., Cellier, P., Cape, J. N., Horvath, L., Loreto, F., Niinemets, U., Palmer, P. I.,Rinne, J., Misztal, P., Nemitz, E., Nilsson, D., Pryor, S., Gallagher, M. W., Vesala, T., Skiba,U., Bruggemann, N., Zechmeister-Boltenstern, S., Williams, J., O’Dowd, C., Facchini, M. C.,de Leeuw, G., Flossman, A., Chaumerliac, N., and Erisman, J. W.: Atmospheric composition5
change: Ecosystems-Atmosphere interactions, Atmos. Environ., 43, 5193–5267, 2009.Gallagher, M. W., Beswick, K. M., Duyzer, J., Westrate, H., Choularton, T. W., and Hummelshoj,
P.: Measurements of aerosol fluxes to Speulder forest using a micrometeorological tech-nique, Atmos. Environ., 31, 359–373, 1997.
Gallagher, M. W., Nemitz, E., Dorsey, J. R., Fowler, D., Sutton, M. A., Flynn, M., and Duyzer,10
J.: Measurements and parameterizations of small aerosol deposition velocities to grassland,arable crops, and forest: influence of surface roughness length on deposition, J. Geophys.Res.-Atmos., 107, 2002.
Galloway, J. N., Aber, J. D., Erisman, J. W., Seitzinger, S. P., Howarth, R. W., Cowling, E. B.,and Cosby, B. J.: The nitrogen cascade, Bioscience, 53, 341–356, 2003.15
Galloway, J. N., Townsend, A. R., Erisman, J. W., Bekunda, M., Cai, Z. C., Freney, J. R.,Martinelli, L. A., Seitzinger, S. P., and Sutton, M. A.: Transformation of the nitrogen cycle:recent trends, questions, and potential solutions, Science, 320, 889–892, 2008.
Ganzeveld, L., Valverde-Canossa, J., Moortgat, G. K., and Steinbrecher, R.: Evaluation ofperoxide exchanges over a coniferous forest in a single-column chemistry-climate model,20
Atmos. Environ., 40, S68–S80, 2006.Garratt, J. R.: Flux profile relations above tall vegetation, Q. J. Roy. Meteor. Soc., 104, 199–211,
1978.Garratt, J. R.: The Atmospheric Boundary Layer, Cambridge University Press, 1992.Gruber, N. and Galloway, J. N.: An Earth-system perspective of the global nitrogen cycle,25
Nature, 451, 293–296, 2008.Hall, B., Claiborn, C., and Baldocchi, D.: Measurement and modeling of the dry deposition of
peroxides, Atmos. Environ., 33, 577–589, 1999.Held, A., Wrzesinsky, T., Mangold, A., Gerchau, J., and Klemm, O.: Atmospheric phase distri-
bution of oxidized and reduced nitrogen at a forest ecosystem research site, Chemosphere,30
48, 697–706, 2002.Held, A. and Klemm, O.: Direct measurement of turbulent particle exchange with a twin CPC
eddy covariance system, Atmos. Environ., 40, S92–S102, 2006.
10691

BGD6, 10663–10706, 2009
Exchange of reactivenitrogen compounds
V. Wolff et al.
Title Page
Abstract Introduction
Conclusions References
Tables Figures
J I
J I
Back Close
Full Screen / Esc
Printer-friendly Version
Interactive Discussion
Hertel, O., Skjoth, C. A., Lofstrom, P., Geels, C., Frohn, L. M., Ellermann, T., and Madsen,P. V.: Modelling nitrogen deposition on a local scale – A review of the current state of the art,Environ. Chem., 3, 317–337, 2006.
Hogstrom, U., Bergstrom, H., Smedman, A. S., Halldin, S., and Lindroth, A.: Turbulent ex-change above a pine forest. 1. Fluxes and gradients, Bound.-Lay. Meteorol., 49, 197–217,5
1989.Hovmand, M. F. and Andersen, H. V.: Nine years of measurements of atmospheric nitrogen
and sulphur deposition to Danish forest, Water Air Soil Poll., 85, 2205–2210, 1995.Huebert, B. J. and Robert, C. H.: The Dry Deposition of Nitric-Acid to Grass, J. Geophys.
Res.-Atmos., 90, 2085–2090, 1985.10
Huebert, B. J., Luke, W. T., Delany, A. C., and Brost, R. A.: Measurements of concentrationsand dry surface fluxes of atmospheric nitrates in the presence of ammonia, J. Geophys.Res.-Atmos., 93, 7127–7136, 1988.
Klemm, O. and Lange, H.: Trends of air pollution in the Fichtelgebirge mountains, Bavaria,Environ. Sci. Pollut. R., 6, 193–199, 1999.15
Klemm, O., Held, A., Forkel, R., Gasche, R., Kanter, H. J., Rappengluck, B., Steinbrecher, R.,Muller, K., Plewka, A., Cojocariu, C., Kreuzwieser, J., Valverde-Canossa, J., Schuster, G.,Moortgat, G. K., Graus, M., and Hansel, A.: Experiments on forest/atmosphere exchange:climatology and fluxes during two summer campaigns in NE Bavaria, Atmos. Environ., 40,S3–S20, 2006.20
Klemm, O. and Wrzesinsky, T.: Fog deposition fluxes of water and ions to a mountainous sitein Central Europe, Tellus B, 59, 705–714, 2007.
Kramm, G. and Dlugi, R.: Modeling of the vertical fluxes of nitric-acid, ammonia, andammonium-nitrate, J. Atmos. Chem., 18, 319–357, 1994.
Krupa, S. V.: Effects of atmospheric ammonia (NH3) on terrestrial vegetation: a review, Environ.25
Pollut., 124, 179–221, 2003.Lovett, G. M. and Lindberg, S. E.: Dry deposition and canopy exchange in a mixed oak forest
as determined by analysis of throughfall, J. Appl. Ecol., 21, 1013–1027, 1984.Lovett, G. M., Nolan, S. S., Driscoll, C. T., and Fahey, T. J.: Factors regulating throughfall flux in
a new New-Hampshire forested landscape, Can. J. Forest Res., 26, 2134–2144, 1996.30
Matzner, E., Alewell, C., Bittersohl, J., Lischeid, G., Kammerer, G., Manderscheid, B.,Matschonat, G., Moritz, K., Tenhunen, J. D., and Totsche, K.: Biogeochemistry of a SpruceForest Catchment of the Fichtelgebirge in Response to Changing Atmospheric Deposition,
10692

BGD6, 10663–10706, 2009
Exchange of reactivenitrogen compounds
V. Wolff et al.
Title Page
Abstract Introduction
Conclusions References
Tables Figures
J I
J I
Back Close
Full Screen / Esc
Printer-friendly Version
Interactive Discussion
in: Ecosystem Approaches to Landscape Management in Central Europe, Ecological Stud-ies: Analysis and Synthesis, Springer-Verlag Berlin, Berlin, 463–503, 2001.
Mayer, J. C.: Transport Processes of Reactive Trace Gases in the Atmospheric Boundary Layer,Ph.D., Faculty of Biology, Chemistry and Geosciences, University of Bayreuth, Bayreuth, 119pp., 2008.5
Mozurkewich, M.: The dissociation constant of ammonium nitrate and its dependence on tem-perature, relative humidity and particle size, Atmos. Environ. A-Gen., 27, 261–270, 1993.
Nagel, H. D., Becker, R., Eitner, H., Hubener, P., Kunze, F., Schlutow, A., Schutze,G., and Weigelt-Kirchner, R.: Critical Loads fur Saure und eutrophierenden Stickstoff,Umweltbundesamt, 172 pp., 2004.10
Nemitz, E. and Sutton, M. A.: Gas-particle interactions above a Dutch heathland: III. Modellingthe influence of the NH3-HNO3-NH4NO3 equilibrium on size-segregated particle fluxes, At-mos. Chem. Phys., 4, 1025–1045, 2004,http://www.atmos-chem-phys.net/4/1025/2004/.
Nemitz, E., Sutton, M. A., Wyers, G. P., and Jongejan, P. A. C.: Gas-particle interactions above15
a Dutch heathland: I. Surface exchange fluxes of NH3, SO2, HNO3 and HCl, Atmos. Chem.Phys., 4, 989–1005, 2004,http://www.atmos-chem-phys.net/4/989/2004/.
Nemitz, E., Sutton, M. A., Wyers, G. P., Otjes, R. P., Mennen, M. G., van Putten, E. M., andGallagher, M. W.: Gas-particle interactions above a Dutch heathland: II. Concentrations and20
surface exchange fluxes of atmospheric particles, Atmos. Chem. Phys., 4, 1007–1024, 2004,http://www.atmos-chem-phys.net/4/1007/2004/.
Peters, K. and Eiden, R.: Modelling the dry deposition velocity of aerosol particles to a spruceforest, Atmos. Environ. A-Gen., 26, 2555–2564, 1992.
Rebmann, C., Gockede, M., Foken, T., Aubinet, M., Aurela, M., Berbigier, P., Bernhofer, C.,25
Buchmann, N., Carrara, A., Cescatti, A., Ceulemans, R., Clement, R., Elbers, J. A., Granier,A., Grunwald, T., Guyon, D., Havrankova, K., Heinesch, B., Knohl, A., Laurila, T., Long-doz, B., Marcolla, B., Markkanen, T., Miglietta, F., Moncrieff, J., Montagnani, L., Moors, E.,Nardino, M., Ourcival, J. M., Rambal, S., Rannik, U., Rotenberg, E., Sedlak, P., Unterhuber,G., Vesala, T., and Yakir, D.: Quality analysis applied on eddy covariance measurements at30
complex forest sites using footprint modelling, Theor. Appl. Climatol., 80, 121–141, 2005.Rothe, A., Huber, C., Kreutzer, K., and Weis, W.: Deposition and soil leaching in stands of
Norway spruce and European Beech: Results from the Hoglwald research in comparison
10693

BGD6, 10663–10706, 2009
Exchange of reactivenitrogen compounds
V. Wolff et al.
Title Page
Abstract Introduction
Conclusions References
Tables Figures
J I
J I
Back Close
Full Screen / Esc
Printer-friendly Version
Interactive Discussion
with other European case studies, Plant Soil, 240, 33–45, 2002.Seinfeld, J. H. and Pandis, S. N.: Atmospheric Chemistry and Physics: From Air Pollution to
Climate Change, Wiley, New York, 1998.Sievering, H., Enders, G., Kins, L., Kramm, G., Ruoss, K., Roider, G., Zelger, M., Anderson,
L., and Dlugi, R.: Nitric-acid, particulate nitrate and ammonium profiles at the Bayerischer-5
Wald – Evidence for large deposition rates of total nitrate, Atmos. Environ., 28, 311–315,1994.
Simpson, I. J., Thurtell, G. W., Neumann, H. H., Den Hartog, G., and Edwards, G. C.: Thevalidity of similarity theory in the roughness sublayer above forests, Bound.-Lay. Meteorol.,87, 69–99, 1998.10
Staudt, K. and Foken, T.: Documentation of Reference Data for the Experimental Areas of theBayreuth Center for Ecology and Environmental Research (BayCEER) at the Waldstein Site,Dep. Micromet., University of Bayreuth, 2007.
Stelson, A. W. and Seinfeld, J. H.: Relative-humidity and temperature-dependence of theammonium-nitrate dissociation-constant, Atmos. Environ., 16, 983–992, 1982.15
Sutton, M. A., Nemitz, E., Milford, C., Fowler, D., Moreno, J., San Jose, R., Wyers, G. P., Otjes,R. P., Harrison, R., Husted, S., and Schjoerring, J. K.: Micrometeorological measurements ofnet ammonia fluxes over oilseed rape during two vegetation periods, Agr. Forest Meteorol.,105, 351–369, 2000.
Sutton, M. A., Nemitz, E., Erisman, J. W., Beier, C., Bahl, K. B., Cellier, P., de Vries, W.,20
Cotrufo, F., Skiba, U., Di Marco, C., Jones, S., Laville, P., Soussana, J. F., Loubet, B., Twigg,M., Famulari, D., Whitehead, J., Gallagher, M. W., Neftel, A., Flechard, C. R., Herrmann,B., Calanca, P. L., Schjoerring, J. K., Daemmgen, U., Horvath, L., Tang, Y. S., Emmett,B. A., Tietema, A., Penuelas, J., Kesik, M., Brueggemann, N., Pilegaard, K., Vesala, T.,Campbell, C. L., Olesen, J. E., Dragosits, U., Theobald, M. R., Levy, P., Mobbs, D. C., Milne,25
R., Viovy, N., Vuichard, N., Smith, J. U., Smith, P., Bergamaschi, P., Fowler, D., and Reis,S.: Challenges in quantifying biosphere-atmosphere exchange of nitrogen species, Environ.Pollut., 150, 125–139, 2007.
Thom, A. S., Stewart, J. B., Oliver, H. R., and Gash, J. H. C.: Comparison of aerodynamic andenergy budget estimates of fluxes over a pine forest, Q. J. Roy. Meteor. Soc., 101, 93–105,30
1975.Thomas, C. and Foken, T.: Flux contribution of coherent structures and its implications for the
exchange of energy and matter in a tall spruce canopy, Bound.-Lay. Meteorol., 123, 317–337,
10694

BGD6, 10663–10706, 2009
Exchange of reactivenitrogen compounds
V. Wolff et al.
Title Page
Abstract Introduction
Conclusions References
Tables Figures
J I
J I
Back Close
Full Screen / Esc
Printer-friendly Version
Interactive Discussion
2007.Thomas, R.: Measurement of Speciated Aerosol Fluxes, Ph.D., Faculty of Engineering and
Physical Science, University of Manchester, Manchester, 296 pp., 2007.Thomas, R. M., Trebs, I., Otjes, R., Jongejan, P. A. C., Brink, H. T., Phillips, G., Kortner, M.,
Meixner, F. X., and Nemitz, E.: An automated analyzer to measure surface-atmosphere5
exchange fluxes of water soluble inorganic aerosol compounds and reactive trace gases,Environ. Sci. Technol., 43, 1412–1418, doi:10.1021/es8019403, 2009.
Trebs, I., Meixner, F. X., Slanina, J., Otjes, R., Jongejan, P., and Andreae, M. O.: Real-timemeasurements of ammonia, acidic trace gases and water-soluble inorganic aerosol speciesat a rural site in the Amazon Basin, Atmos. Chem. Phys., 4, 967–987, 2004,10
http://www.atmos-chem-phys.net/4/967/2004/.Trebs, I., Lara, L. L., Zeri, L. M. M., Gatti, L. V., Artaxo, P., Dlugi, R., Slanina, J., Andreae, M. O.,
and Meixner, F. X.: Dry and wet deposition of inorganic nitrogen compounds to a tropicalpasture site (Rondonia, Brazil), Atmos. Chem. Phys., 6, 447–469, 2006,http://www.atmos-chem-phys.net/6/447/2006/.15
Tsokankunku, A., Zhu, Z., Meixner, F. X., Foken, T., and Andreae, M. O.: Eddy covariancefluxes of the NO-NO2-O3 triad above a spruce forest canopy in south-eastern Germany,EGU General Assembly, Vienna, 19–24 Apr 2009, 2009.
Valverde-Canossa, J., Ganzeveld, L., Rappengluck, B., Steinbrecher, R., Klemm, O., Schuster,G., and Moortgat, G. K.: First measurements of H2O2 and organic peroxides surface fluxes20
by the relaxed eddy-accumulation technique, Atmos. Environ., 40, S55–S67, 2006.van Breemen, N. and van Dijk, H. F. G.: Ecosystem effects of atmospheric deposition ofnitrogen in The Netherlands, Environ. Pollut., 54, 249–274, 1988.
Walcek, C. J.: A Theoretical estimate of O3 and H2O2 dry deposition over the Northeast United-States, Atmos. Environ., 21, 2649–2659, 1987.25
Wesely, M. L. and Hicks, B. B.: A review of the current status of knowledge on dry deposition,Atmos. Environ., 34, 2261–2282, 2000.
Wexler, A. S. and Seinfeld, J. H.: The distribution of ammonium-salts among a size and com-position dispersed aerosol, Atmos. Environ. A-Gen., 24, 1231–1246, 1990.
Wexler, A. S. and Seinfeld, J. H.: Analysis of aerosol ammonium-nitrate – Departures from30
equilibrium during scaqs, Atmos. Environ. A-Gen., 26, 579–591, 1992.Wichura, B., Ruppert, J., Delany, A. C., Buchmann, N., and Foken, T.: Structure of Carbon Diox-
ide Exchange Processes above a Spruce Forest, in: Biogeochemistry of Forested Catch-
10695

BGD6, 10663–10706, 2009
Exchange of reactivenitrogen compounds
V. Wolff et al.
Title Page
Abstract Introduction
Conclusions References
Tables Figures
J I
J I
Back Close
Full Screen / Esc
Printer-friendly Version
Interactive Discussion
ments in a Changing Environment: An German Case Study, Ecological Studies: Analysisand Synthesis, Springer-Verlag, Berlin, 161–176, 2004.
Wolff, V., Trebs, I., Ammann, C., and Meixner, F. X.: Aerodynamic gradient measurementsof the NH3-HNO3-NH4NO3 triad using a wet chemical instrument: an analysis of precisionrequirements and flux errors, Atmos. Meas. Tech. Discuss., 2, 2423–2482, 2009,5
http://www.atmos-meas-tech-discuss.net/2/2423/2009/.Wrzesinsky, T. and Klemm, O.: Summertime fog chemistry at a mountainous site in central
Europe, Atmos. Environ., 34, 1487–1496, 2000.Zimmermann, F., Plessow, K., Queck, R., Bernhofer, C., and Matschullat, J.: Atmospheric N-
and S-fluxes to a spruce forest – Comparison of inferential modelling and the throughfall10
method, Atmos. Environ., 40, 4782–4796, 2006.Zimmermann, L. and Zimmermann, F.: Fog deposition to Norway spruce stands at high-
elevation sites in the eastern Erzgebirge (Germany), J. Hydrol., 256, 166–175, 2002.
10696

BGD6, 10663–10706, 2009
Exchange of reactivenitrogen compounds
V. Wolff et al.
Title Page
Abstract Introduction
Conclusions References
Tables Figures
J I
J I
Back Close
Full Screen / Esc
Printer-friendly Version
Interactive Discussion
Table 1. Statistical distribution of concentrations of NH3, NH+4 , HNO3, and NO−3 , in µg m−3 (in
terms of N) measured from 31 August to 25 September 2007 at 30.9 ma.g.l. at the Weiden-brunnen site.
NH3 NH+4 HNO3 NO−3 Tot-NH+
4 Tot-NO−3µg m−3 µg m−3 µg m−3 µg m−3 µg m−3 µg m−3
min <LOD <LOD <LOD <LOD <LOD <LODmean 0.67 0.94 0.19 0.65 1.73 0.84max 2.39 4.95 0.97 4.23 5.42 4.59
25% 0.25 0.32 0.05 0.18 0.88 0.29median 0.57 0.76 0.12 0.48 1.63 0.7075% 1.00 1.39 0.28 0.80 2.37 1.08
10697

BGD6, 10663–10706, 2009
Exchange of reactivenitrogen compounds
V. Wolff et al.
Title Page
Abstract Introduction
Conclusions References
Tables Figures
J I
J I
Back Close
Full Screen / Esc
Printer-friendly Version
Interactive Discussion
Fig. 1. (a) T (red line) and RH (blue circles), (b) wind speed (black line) and wind direction (blackcircles) and (c) rain (blue bars), visibility (grey shaded areas) and global radiation (yellow line)during EGER experiment (September 2007). Times and dates refer to Central European Time(major ticks indicate midnight).
10698

BGD6, 10663–10706, 2009
Exchange of reactivenitrogen compounds
V. Wolff et al.
Title Page
Abstract Introduction
Conclusions References
Tables Figures
J I
J I
Back Close
Full Screen / Esc
Printer-friendly Version
Interactive Discussion
Fig. 2. Diel variations of (a) NH3 and particulate NH+4 and (b) HNO3 and particulate NO−3 , and
(c) tot-NH+4 and tot-NO−3 , in µg m−3 (in terms of N) measured in September 2007 at 30.9 m a.g.l.
at the Weidenbrunnen site. Indicated by the black and white bar are episodes of rain and fogand dry periods, respectively (cf. Fig. 1).
10699

BGD6, 10663–10706, 2009
Exchange of reactivenitrogen compounds
V. Wolff et al.
Title Page
Abstract Introduction
Conclusions References
Tables Figures
J I
J I
Back Close
Full Screen / Esc
Printer-friendly Version
Interactive Discussion
Fig. 3. Characteristic timescale analysis: Damkohler ratio (τturb/τequi) during the EGER cam-paign (15–27 September 2007). Damkohler ratios for different fractions of the particle surfaceavailable for the equilibrium reaction are presented (red line: 10% and black line: 100% of theaerosol surface takes part in the equilibrium reaction).
10700

BGD6, 10663–10706, 2009
Exchange of reactivenitrogen compounds
V. Wolff et al.
Title Page
Abstract Introduction
Conclusions References
Tables Figures
J I
J I
Back Close
Full Screen / Esc
Printer-friendly Version
Interactive Discussion
Fig. 4. Time series of tot-NH+4 and tot-NO−3 fluxes in ng m−2 s−1 (in terms of N) calculated
using the AGM at the Weidenbrunnen site. In (a) an overview about the entire flux data set isgiven, (b and c) show contrasting episodes: (b) fluxes under cooler and foggy conditions and(c) fluxes during warmer and sunny conditions. Shown are all flux data in green and magentadots, separated as insignificant flux values (black triangles) and as significant flux values (fromconditions without rain, RH<95%, and high visibility, green and magenta circles). Additionally,a 3 h running mean through the significant flux values is shown.
10701

BGD6, 10663–10706, 2009
Exchange of reactivenitrogen compounds
V. Wolff et al.
Title Page
Abstract Introduction
Conclusions References
Tables Figures
J I
J I
Back Close
Full Screen / Esc
Printer-friendly Version
Interactive Discussion
Fig. 5. Median diel variation of the vd for tot-NH+4 (left panel) and tot-NO−3 (right panel) with
inter quartile ranges, in cms−1, September 2007 at the Weidenbrunnen site. Only data fromfavourable conditions (no rain, RH<95%, high visibility) are considered. Values of 1/Ra (includ-ing inter-quartile ranges) are shown as a proxy for the maximum possible vd . The number ofdata points used for every hour to calculate medians and inter quartile ranges (0.25 and 0.75)are given on top of each graph (blue bars).
10702

BGD6, 10663–10706, 2009
Exchange of reactivenitrogen compounds
V. Wolff et al.
Title Page
Abstract Introduction
Conclusions References
Tables Figures
J I
J I
Back Close
Full Screen / Esc
Printer-friendly Version
Interactive Discussion
Fig. 6. Median diel variation of (a) tot-NH+4 flux and (b) tot-NO−3 flux, ng m−2 s−1 (in terms of
N), from 1 to 30 September 2007 at the Weidenbrunnen site. Only flux data measured underfavourable conditions (no rain, RH<95%, high visibility) were used. Shown are the mediansand inter quartile ranges (0.25 and 0.75), and the 0.1 and 0.9 percentiles. The number of datapoints used for every hour to calculate medians and percentiles are given on top of each graph(blue bars).
10703

BGD6, 10663–10706, 2009
Exchange of reactivenitrogen compounds
V. Wolff et al.
Title Page
Abstract Introduction
Conclusions References
Tables Figures
J I
J I
Back Close
Full Screen / Esc
Printer-friendly Version
Interactive Discussion
Fig. 7. Wet deposition of NH+4 and NO−3 in September 2007 at the Weidenbrunnen site. Indi-
cated are wet deposition amounts per event (in kg ha−1 in terms of N, left scale) and cumulative(cum) values for the entire month September 2007 (right scale).
10704

BGD6, 10663–10706, 2009
Exchange of reactivenitrogen compounds
V. Wolff et al.
Title Page
Abstract Introduction
Conclusions References
Tables Figures
J I
J I
Back Close
Full Screen / Esc
Printer-friendly Version
Interactive DiscussionFig. 8.
10705

BGD6, 10663–10706, 2009
Exchange of reactivenitrogen compounds
V. Wolff et al.
Title Page
Abstract Introduction
Conclusions References
Tables Figures
J I
J I
Back Close
Full Screen / Esc
Printer-friendly Version
Interactive Discussion
Fig. 8. Annual Nr deposition loads for spruce forests (in kgha−1yr−1 in terms of N), separatedin NH+
4 (green) and NO−3 (magenta) as well as in different deposition pathways (dry (red), wet(blue), occult (grey)) and measurement methods (direct (AGM, inferential model), throughfall(light green)). On the left hand site the locations of the studies are given and on the right handsite the references.Annotations:
a estimated as 12 times the measured fluxes during September 2007b estimated as 6 times the measured fluxes during September 2007 and as 6 times half of
the measured fluxes during September 2007c direct fog water flux and wet deposition measurements (2001–2002)d throughfall measurements and estimated maximum canopy uptake (1988–1996)e concentration measurements and inferential modelling (2001–2004)f throughfall measurements from 2001 to 2004
g throughfall measurements from 1994 to 1997h upper range of the annual deposition estimated from diel deposition estimates bases on
deposition measurements of tot-NO−3 using the AGM as well as wet deposition
i lower range of the annual deposition estimated from diel deposition estimates bases ondeposition measurements of tot-NO−3 using the AGM as well as wet deposition
j throughfall fluxes measured during 2003–2004 and modelled total deposition fluxes, usinga canopy exchange model
k partly measured, partly inferentially modelled with site-specific parameterizations, 1995l partly measured, partly inferentially modelled with site-specific parameterizations, 1995–
1996m range of inorganic N throughfall input for 15 European spruce forests
10706