exchange rate economics: a carry on in france michael metcalfe head of global macro strategy june...
TRANSCRIPT
Exchange rate economics: A carry on in France
Michael MetcalfeHead of Global Macro StrategyJune 2007
Exchange rate economics: A carry on in France
Michael MetcalfeHead of Global Macro StrategyJune 2007

2
Puzzles from the world’s largest financial market
> Globalisation … but of what?
> More floating, but less volatility and more reserves
> The great moderation in global economic volatility
> Exchange rates and fair value
> Why carry is robust and when it will end

3
Globalisation … of capital> Average daily volume in foreign exchange markets is approx. USD2.2trn
> That’s roughly the size of the French economy and it is growing 10% pa
> Driven by internationalization of portfolio flows
0
500
1000
1500
2000
2500
1977 1982 1987 1992 1997 2002 2007
US bn
0%
50%
100%
150%
200%
250%
300%
350%
400%
450%
%
Av. Daily turnover in FX markets, USD bn (Constant '04 exchange rates)
Gross US trade flows (%GDP) rhs
Gross US portfolio flows (% GDP) rhs

4
Portfolio theory not comparative advantage.. > Pension funds have historically invested in local markets
> This is the financial equivalent of sticking all your eggs in one basket
> Global equities/bonds offer diversification and higher returns
Breakdown of US mutual fund assets 2001-2003
0%
25%
50%
75%
100%
Equities Bonds
Home weightMarket Weight
Source: ECB
Risk reward of US and global equities past 5-years
US
World
10%
15%
20%
10% 11% 12% 13% 14%
Risk (annualised volatility)
Ret
urn
(an
nu
alsi
ed r
etu
rn)
`
5
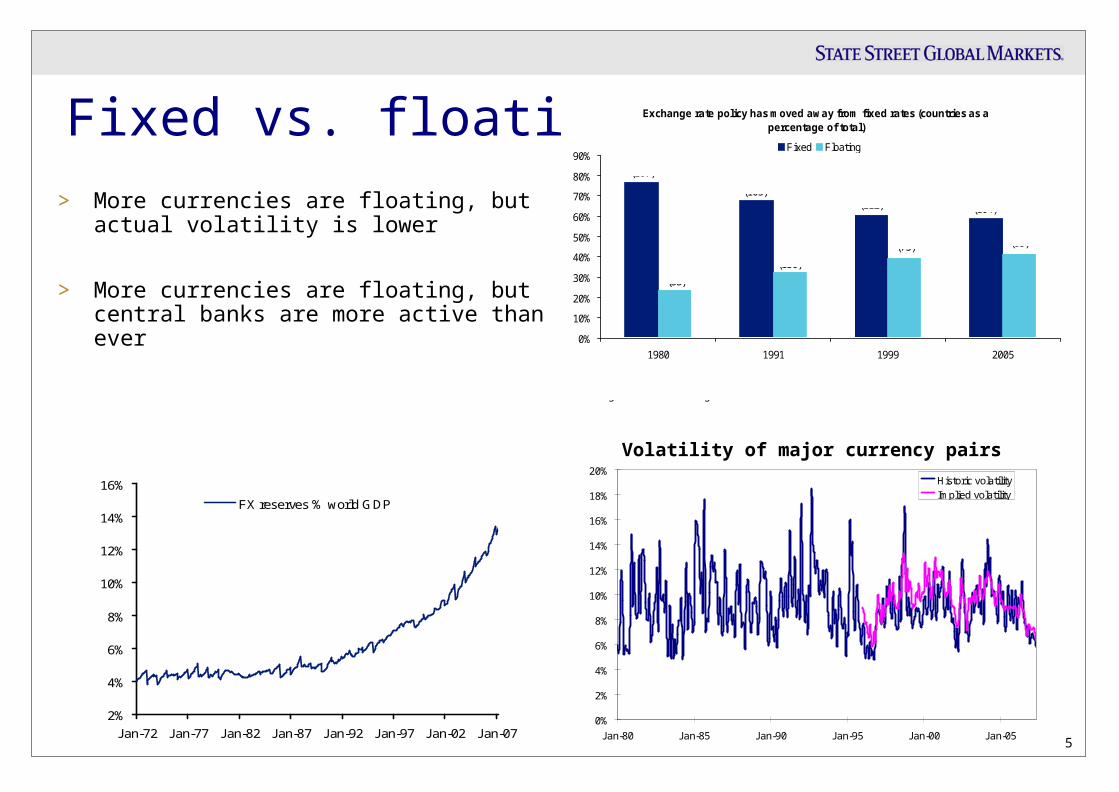
Fixed vs. floating… > More currencies are floating, but actual
volatility is lower
> More currencies are floating, but central banks are more active than ever
Exchange rate policy has moved away from fixed rates (countries as a percentage of total)
0%
10%
20%
30%
40%
50%
60%
70%
80%
90%
1980 1991 1999 2005
Fixed Floating76.4%(107)
44.4%(83)
55.6%(104)
39.4%(73)
60.5%(112)
32.3%(150)
67.7%(105)
23.6%(33)
Note: The number of countries is listed in parenthesisSource: International Monetary Fund, International Financial Statistics, Annual report on Exchange Arrangements and Exchange Restrictions.
0%
2%
4%
6%
8%
10%
12%
14%
16%
18%
20%
Jan-80 Jan-85 Jan-90 Jan-95 Jan-00 Jan-05
Historic volatilityImplied volatility
Volatility of major currency pairs
2%
4%
6%
8%
10%
12%
14%
16%
Jan-72 Jan-77 Jan-82 Jan-87 Jan-92 Jan-97 Jan-02 Jan-07
FX reserves % world GDP

6
The great moderation …. > Some macro trends are converging such as inflation, growth & interest rates
> PPP, uncovered interest rate parity suggest inflation and rates are the main determinants of currency trends
Dispersion across 20 countries
0
2
4
6
8
10
12
14
Jan-96 Jul-97 Jan-99 Jul-00 Jan-02 Jul-03 Jan-05 Jul-06
3-mo interest rates Annual inflation rates

7
Losing value
Dispersion across 20 countries
1.20
1.30
1.40
1.50
1.60
1.70
1.80
1.90
2.00
Jan-96 Jul-97 Jan-99 Jul-00 Jan-02 Jul-03 Jan-05 Jul-06
4%
5%
6%
7%
8%
9%
10%
Competitiveness proxy (z-score) lhs
Current account (%GDP) rhs
> But external balances have never been more dispersed
> Measures of competitiveness are increasingly stretched
> Currency is a major policy issue once again

8
How much for your Big Mac?
100
200
300
400
500
600
700
800
1975 1980 1985 1990 1995 2000 2005
Yen per pound
GBP per JPY PPP rate (OECD)
-50%
-25%
0%
25%
50%
1975 1980 1985 1990 1995 2000 2005
Deviation from PPP (%)
Sterling overvalued
Sterling undervalued
> Big Mac costs Y300 in Japan £1.99 in the UK US$3.22 in US EUR2.94
> One £ should purchase Y151 US$1.61 EUR1.47
> At present one £ will buy you Y240 (58%) US$2.00 (24%) EUR1.49 (1%)

9
UIP & the balance of payments model versus carry
> High interest rates or current account deficits should lead to currency depreciation> But the carry trade is now a celebrity …> And a successful one at that
0
50
100
150
200
250
300
350
400
450
Jan-98 Jan-00 Jan-02 Jan-04 Jan-06
Carry trade mentions in the FT and WSJ Rolling annual returns of various FX investment styles
-10%
-5%
0%
5%
10%
15%
20%
Dec-99 Dec-00 Dec-01 Dec-02 Dec-03 Dec-04 Dec-05 Dec-06
Yield Current account

10
Why carry is robust > Covered interest rate parity dictates the forward rate must equal today’s rate adjusted by the interest rate differential
Example today’s rate is JPY240 per £ 1-year UK interest rates are 6%, Japanese rates are 1% Today’s forward rate sets the price of GBP in JPY 1 year from now This must be JPY228 otherwise a risk free arbitrage exists
– If the forward rate is JPY240, I would borrow JPY10mn, exchange it into GBP at today’s exchange rate (JPY240), and deposit £41,667 with a UK bank
– In one year’s time I would have £44,167 thanks to the 6% interest, I convert this back to JPY at the pre-agreed JPY240 rate and get Y10.6mn
– Y10.1mn repays my loan and interest, JPY0.5mn (£2,083) is my risk free profit
> But what is the best prediction of the spot rate in 12-months time ?
Uncovered interest rate parity suggests that the forward rate is an unbiased predictor of the future spot rate

11
Forecast rate bias > In past 10-years Japan has always had a lower interest rate so the forward rate predicts
JPY appreciation
> The forward has consistently over predicted the ability of the yen to appreciate (so have forecasters)
> If the spot is better “forecast” of where we will be in a year’s time carry is perfectly rational
Too optimistic on the yen
50%
55%
60%
65%
70%
75%
80%
Fwd Spot F'cast*
Proportion ofpositiveforecast errorsby quartersince 1996
* 3-mo consensus forecast from Reuters
0.0%
0.2%
0.4%
0.6%
0.8%
1.0%
1.2%
1.4%
180 195 210 225 240 255 270 285 300
Spot is the unbiased predictor
Forward is unbiased predictor
Spot1-yr forward

12
When does value bite? > If PPP holds the real exchange rate should be constant in the long-run
> Real exchange rate fluctuations are large and persistent
> Expectations of “value” are not well defined and macro adjustments are slow, which leads to both trends & overshooting
TWI # standard errors from 1970-1990 average
-4
-3
-2
-1
0
1
2
3
4
Jan-90 Jan-93 Jan-96 Jan-99 Jan-02 Jan-05
EUR JPY USD GBP
Intervention Intervention?

13
FX market puzzles> Globalisation … but of what?
Internationalisation of portfolios is main driver of growth in FX market
> More floating, but less volatility and higher reserves There are fewer pegs Current account imbalances are leading to a surge in CB reserves
> The great moderation in economic volatility Interest and inflation rates are converging
> Exchange rates and fair value Value and external balances are diverging rapidly
> Why carry is robust and when it will end Uncovered Interest Rate Parity fails in a world of mobile capital flows
At some point high (low) yielding currencies will become so over (under) valued that it will impact monetary policy leading to lower (higher) interest rates and possibly FX intervention