exchange rate pass-through into import prices: a macro or
TRANSCRIPT
1
Exchange Rate Pass-Through into Import Prices:
A Macro or Micro Phenomenon?
Abstract
Exchange rate regime optimality, as well as monetary policy effectiveness, depend on
the tightness of the link between exchange rate movements and import prices. Recent
debates hinge on the issue of the prevalence of producer-currency-pricing (PCP)
versus local currency price (LCP) stability of imports, and on whether exchange rate
pass-through rates are endogenous to a country’s inflation performance. We provide
cross-country and time series evidence on both of these issues for the imports of 25
OECD countries. Across the OECD and especially within manufacturing industries,
there is compelling evidence of partial pass through – rejecting both PCP and LCP as
a short-run phenomenon. Over the long run, PCP is more prevalent for many types of
import goods. Higher inflation and exchange rate volatility are associated with higher
pass-through of exchange rates into import prices. However, for OECD countries the
most important determinants of changes in pass-through are microeconomic and
related to the industry composition of a country’s import bundle.
Revision: March 5, 2002
(first version: January 2001)
José Manuel Campa Linda S. Goldberg IESE Business School Federal Reserve Bank of New York
and N.B.E.R. and N.B.E.R.
JEL codes: F3, F4
The views expressed in this paper are those of the individual authors and do not necessarilyreflect the position of the Federal Reserve Bank of New York or the Federal Reserve System.We thank Rudiger Dornbush, Richard Marston, Andrew Rose and Alwyn Young for helpfulcomments, as well as the seminar participants at the 2001 ASSA, NBER Summer Institute2001, BIS, 2002 ASSA, Federal Reserve Bank of New York and University of Chicago. Wealso thank Leticia Alvarez and Glenda Oskar for their research assistance. Addresscorrespondences to Linda S. Goldberg, Federal Reserve Bank of NY, Research Department,33 Liberty St, New York, N.Y. 10045. Tel: 212-720-2836; fax: 212-720-6831; email:[email protected].
2
1. Introduction
While exchange rate pass-through has long been of interest, the focus of this interest
has evolved considerably over time. After a long period of debate over the law of one price
and convergence across countries, beginning in the late 1980s exchange rate pass through
studies emphasized industrial organization and the role of segmentation and price
discrimination across geographically distinct product markets. More recently pass-through
issues play a central role in heated debates over appropriate monetary policies and exchange
rate regime optimality.1 These debates hinge on the issue of the prevalence of producer-
currency-pricing (PCP) versus local currency pricing (LCP) of imports, and on whether
exchange rate pass-through rates are endogenous to a country’s inflation performance. Low
import price pass-through means that nominal exchange rate fluctuations may lead to higher
expenditure switching effects of domestic monetary policy, thereby leaving monetary policy
more effective for dealing with real shocks. If pass-through rates are endogenous to a
country’s relative monetary stability, the extent of this monetary policy effectiveness may be
fragile and regime-specific.2
The first goal of our paper is to provide extensive cross-country and time-series
evidence on pass-through performance into the import prices of 25 OECD countries. Using
quarterly data from 1975 through 1999, we document the prevalence of PCP and LCP in
short-run and long-run pass through elasticities. We use an economically meaningful
estimation approach, meaning that we estimate pass-through rates after controlling for
exporter marginal cost shifters.
At the level of an aggregated import bundle, the evidence across countries is strongly
supportive of partial exchange rate pass through in the short run (defined as one quarter). The
average pass through elasticities across the OECD countries are about 60 percent over one
quarter, and about 75 percent over the longer term. The United States has among the lowest
pass-through rates in the OECD, at about 25 percent in the short run and 40 percent over the
longer run. Corresponding rates of pass through into German import prices are approximately
60 percent in the short run and 80 percent in the long run. We find that rankings of elasticities
1 The implications of pass-through performance for optimal monetary policy also is explored in Corsetti andPesenti (2001), Obstfeld (2000), Devereux (2000), and Devereux and Engel (2000), among others.2 See Taylor (2001). The role of the invoicing decisions of producers in influencing pass-through rates isexplored in recent work by Devereux and Engel (2001) and Bacchetta and vanWincoop (2001).

3
are not tightly correlated with country size, especially when the composition of country
import bundles differs substantially.
At a more disaggregated industry level, similar results on partial pass-through arise.
There is strong evidence against both PCP and LCP as short-run descriptions of pass-through
into Manufacturing and Food import prices, driving the partial pass-through observed in
almost all countries. Non-manufacturing and Raw Material imports generally reject LCP, and
are mixed on rejections of PCP.
The second goal of our paper is to provide insights into the forces underlying cross-
country differences in pass-through rates and changes in pass-through elasticities over time
but within countries. An intriguing hypothesis posed by John Taylor (2001) is that pass-
through of costs into markups is endogenous to a country’s inflation performance. The
important implication is that there is a virtuous – but fragile -- circle wherein low inflation
(variability) leads to reduced markups, less inflationary implications of monetary expansions,
and continued low markups. Taylor argues that if declines in pass-through are a product of
the low inflation environment of recent years (which in turn is associated with less persistent
inflation), recent gains in price stability can be fragile and potentially eliminated by adverse
price shocks. As an alternative to this view, if pass-through rates decline due to more
structural reasons such as declining pricing power of firms, the recent regime of price
stability may be more robust. Similarly, even without changes in the competitive structures of
industries, the pass-through elasticities on import baskets can change purely in line with
changes in the composition of the import basket if the component products have distinct
pass-through elasticities.
Ultimately, we conclude that while the Taylor argument has some statistical merit
when properly tested, it is not of first order importance for the low and medium inflation
countries of the OECD. First, it is not appropriate to argue that declining exchange rate pass-
through into import prices is a general feature of the countries within the OECD. Levels of
pass-through by country are significantly higher in countries with higher nominal exchange
rate variability – consistent with recent theoretical advances on the optimal choice of
invoiving currency -- but largely uncorrelated with levels of inflation, money growth rates, or
aggregate country size. Although changes in some of these macro series are weakly correlated
with changes in pass through, these macro variables are not of first order importance in
explaining pass-through evolution within the OECD over the past 25 years. Far more
4
important for overall pass-through rates are changes in the composition of industries in a
country’s import basket. In particular, the move away from energy as a high proportion of
the import bundles, to a much higher share for manufactured products, has been the primary
driver behind recent pass-through into import prices among numerous OECD countries.3
The industry composition of trade is more structural than is inflation performance.
Consequently, those OECD countries that have brought down their pass-through elasticities
through changes in trade composition have pass-through gains (and consequent implications
for monetary policy) that are more robust to the inflation regime. Some of the increased
reliance on manufacturing imports occurred because of increased globalization of production
input markets,4 thereby changing exchange rate pass-through without requiring industry-
specific changes in price-over-cost markups. Monetary policy transmission therefore is
expected to be robust to the extent that industry pass-through rates remain stable, mainly
evolving with the product mix of each country’s trade.
2. Exchange Rates and Prices: Similar Equations, Different Interpretations
Analyses of exchange rates and price linkages have followed numerous paths, ranging from
early macroeconomic debate on exchange rates and monetarism, to studies of market
integration or segmentation associated with the law of one price, to studies of the role of
market microstructure in the ability and desire of producers to price discriminate.5 Empirical
tests of associated hypotheses revolve around the familiar equation:
*t t tP E P= (1)
where tP is the domestic price index, tE is the nominal exchange rate (defined as domestic
currency per unit of foreign), and *tP represents foreign prices. (Relative) purchasing power
parity tests use price indices across countries to test whether this relationship holds. Law of
One Price hypotheses test the same equation for individual goods traded across countries. As
3 Our focus should not be confused with that of related recent papers that attempt to explain the pass-through ofexchange rates into country CPI. In these papers, exchange rate movements lead to import price pass-through.These enter with weights into the aggregate CPI of countries, with the weights possibly to be adjusted to reflectdistribution costs as in Burstein, Neves, and Rebelo (2001), or central bank reaction functions as in Gagnon andIhrig (2001).4 See Campa and Goldberg (1997), Feenstra (1998), and Hummels, Ishii and Yi (2001) for evidence onincreasing reliance on imported inputs and vertical integration of production across countries.5 Goldberg and Knetter (1997) provide a very nice overview of this history.

5
nicely discussed in Goldberg and Knetter (1997), costs of transportation or resale (such as
trade barriers) might preclude price equalization but give rise to a stable wedge between
indices.
Exchange rate pass-through studies consider the extent to which exchange rate
movements are passed-through into traded goods prices, versus absorbed in producer profit
margins or markups. Often these studies look at indices of industrial concentration or market
power to explain pass through differences or pricing-to-market. The textbook definition of
ERPT is the percent change in local currency import prices resulting from a one percent
change in the exchange rate between the exporting and importing country. Evidence on tests
of this relationship are basically the γ estimates based on a simple equation
t t tp eγ ε= + (2)
where all lower-cased variables are in logs and ε is an error term.6 This reduced form
equation (whether in log levels or growth rates) is problematic for hypothesis testing because
it only represents a non-structural statistical relationship. Micro-foundations of pricing
behavior are required for generating more economically meaningful specifications that are
appropriate for hypothesis testing.
If the dependent variable is the home currency price of imports m from country j,
,m jtP , the pricing equation of a exporter from country j -- and its elasticity of response to an
exchange rate movement -- depend on the structure of demand and costs confronting the
exporter. If the import prices of country j are the dependent variables, the pricing rules of the
foreign exporters x as the drive their determination:
( ) ( ), , , , , , ,m j x j x j m j x j jt t t t t t t t t tP E P E Mkup P P C W Y E= = (3)
,, , , ,
,where , 0, 0, 0x j
x j x j x j x jtt w E yx j
t
PMKUP C C C
C≡ > < > .
In equation 3 ,x jtMKUP represents the markup rate of prices over costs for the
exporter. Markup rates are industry specific and depend on the demand curve facing
6 The γ’s are background information for the monetary policy debate discussed in Taylor (2000) and provided instudies such as McCarthy (2000). While Taylor argues that exchange rate pass-through elasticities appear tohave declined over time for countries that have reduced their inflation levels and inflation variability, there hadnot been systematic analysis verifying this assertion.
6
exporters x in country j. This demand depends, in turn, on ,m jt tP P , the prices of imports
relative to prices of local competitors. ,x jtC is the marginal cost function of the exporter in his
own currency. This exporter marginal cost function is increasing in export market wages,
,x jtW , and increasing in country j demand conditions Y.7 The exchange rate is an argument in
the exporter’s cost function to the extent that the exporter relies on imported inputs or has
other costs move with the relative value of the destination market currency.
Differentiation of (3) yields an expression of the form
,, , ,, , ,
, , ,1
x jx j x j x jt ym j x j x jt E t w
t t t t tx j x j x jt t t
Y CE C W CP E MKUP W Y
C C C
= + ⋅ + + ⋅ + ⋅
� � � � � (4)
where “.” over a variable represents a percentage change. Equation 4 clearly demonstrates
that empirical specifications which seek to isolate pass through elasticities should introduce
controls for the exogenous cost shifters entering into foreign exporter pricing decisions.
Without such controls the measured relationship is a statistical correlation without specific
economic interpretation in terms of exchange rate pass-through.
Further manipulation of (4) gives microfounded intuition behind pass-through
elasticities into import prices. 8 Multiplying through by ,m jt tE P and rearranging terms, the
exchange rate pass through elasticity γ is a function of the markup and foreign marginal cost
elasticities, and η λ :
1
1
λγη
+=−
(5)
where , ,m j m j
t t
t t
P P
E Eγ =
�
�, ( ) ( )
, ,
, ,0
x j x jt t
m j m jt t tt
Mkup Markup
P P P Pη = ≤
�
� �(negative for “normally shaped”
demand, which is less convex than constant elasticity curves), and , ,
0x j x jt t
t t
C C
E Eλ = ≤
�
�.
Any force that makes foreign marginal costs more sensitive to exchange rates makes
local currency import prices less sensitive to exchange rates. The inseight is that an exporter
7 More precisely, one should include as the appropriate demand variable an index of income levels across theproducer’s home market and the destination market for its exports. Since we do no have information on thecomposition of demand facing exporters in different countries, our proxy here is the GDP of the importingcountry.
7
that relies more on imported inputs will have a smaller share of local value-added in costs
which can fluctuate with exchange rates. The markup derivation underscores the point that
exporters facing highly elastic demand have with smaller exchange rate pass-through into
destination market prices. A small exporter supplying a large market populated with local
competitors will not be able to pass as much of the exchange rate fluctuation through to local
prices. The extent to which exchange rate pass-through coefficient also is differs from one
(and these concepts of endogeneity of markups) has been exposited simply and eloquently in
Dornbusch (1987) and Marston (1990), among others. Knetter (1993) and Yang (1997)
provide supportive empirics and document how pass-through into local currency import
prices is lower when local products are less differentiated.
3. Exchange Rates and Import Prices: The Evidence
A. The Data and Estimation Methodology. We capture the arguments of equation (4) through
a log-linear regression specification similar to that tested throughout the exchange rate pass-
through literature:
t t t t tp x e Zα δ γ ϕ ε= + + + + (6)
where tp are local currency import prices, tx is a primary “control” variable representing
exporter costs, and tZ is a vector of other control variables, including real GDP of the
destination market.9 A regression may generate biased estimates of pass through if foreign
wages or GDP are correlated with exchange rates but omitted from the regression.
Our approach considers pass-through into import prices of specific countries, as
opposed to other careful empirical studies of exchange rate pass-through that focus
exclusively on the export prices of individual products or baskets from a single country to a
number of destination markets.10 We pursue the import price approach because it is the more
relevant dependent variable in the debate on the inflationary consequences of exchange rate
8 Our thanks to Richard Marston for suggesting the inclusion of this elasticities interpretation.9 Goldberg and Knetter (1997) provide a very nice overview of the relationships between these studies. Beyondthe industrial organization themes, there also are a range of studies that allow for pass-through elasticities todiffer between appreciation and depreciation periods (Swamy and Thurman 1994) or to be distinct foranticipated versus unanticipated exchange rate changes (Marston 1990).10 Knetter (1993), Marston (1990), Goldberg and Knetter (1996), and Kasa (1992), among others, uses exportprices or export unit values from specific countries to multiple destinations with the intent of identifying price
8
fluctuations. Our dependent variables are import unit value indices (aggregated across all
imports, and disaggregated into major industry groups) for 25 OECD countries. For each of
these country indices we estimate short-run and long-run elasticities γ based on the statistical
specification in equation 6 (short run is one quarter, long run is four quarters).11 We provide
estimates of levels and paths of these elasticities across countries, including tests for
structural changes in pass-through rates. We then run second stage regressions to explain
cross-country and time series differences in pass-through performance with explanatory
variables that include monetary aggregates and also emphasize the importance of the
composition of a country’s import bundle.
The OECD compiles quarterly data on import unit values for OECD countries, with
our series generally commencing around 1975 and ending in 1999.12 In addition to the
country aggregates, the OECD also reports disaggregated import prices at the country level
for five product categories: Food, Energy, Raw Materials, Manufacturing, and Non-
Manufacturing products. Since we ultimately find that energy pass-through elasticities exhibit
anamolous behavior, we delve further into the prices of disaggregated energy imports. For
cross country comparisons, available further disaggregations permit analysis of Gaseous
Natural Gas, Steam Coal, and Crude Oil (data source: International Energy Agency).
Nominal exchange rates are from the International Financial Statistics (series neu),
defined in our regressions as domestic currency per unit of foreign currencies (1/neu), so that
home currency depreciations appear as increases in the nominal exchange rate series. The
real GDP series used are those of the importing countries (source: International Financial
Statistics). It is more difficult to find a primary control variable that captures the shifting
relative costs of a country’s trading partners. We construct a consolidated export partners cost
proxy by taking advantage of the IFS reporting of both real reu and nominal neu exchange
discrimination or pricing to market activity. While important in cross-country research, price discriminationacross markets also is a theme within countries and across cities. For example, see Engel and Rogers (1996).11 These elasticities have a direct economic interpretation, in contrast with the statistical measures that would begenerated by an equation such as (2). We nonetheless also generated statistical pass-through elasticities todetermine whether these differed substantially from the economic elasticities. The differences were sometimessubstantial, but were not systematically positive or negative biased across countries. We include up to three lagsof exchange rates and foreign prices/production costs in the regression. Most of the pass-through responseoccurs over the first and second lags after an exchange rate change, so the interpretation of four quarters as longrun is empirically validated. An alternative specification, which used a lagged dependent variable and relied on apartial adjustment model, generated very similar empirical results (not reported in this version of the paper).12 Data Source: OECD Statistical Compendium. 10 of the 27 country series had import price data ending in1999. 5 countries had data ending in 1998, 1 in 1997, 2 in 1996, and 2 in 1995. We use 25 countries for theempirical work, excluding Korea, Turkey and Mexico for lack of effective exchange rate indices.
9
rate series and computing ,x j j j jt t t tW neu P reu= ⋅ by country in our sample. This gives us a
measure of trading partner costs (over all partners x of importing country j), with each partner
weighted by its importance in the importing country’s trade.
The first-stage regressions are specified to generate pass through elasticities and to
follow equation (6), with the addition of lagged exchange rate and foreign production cost
terms to allow for the possibility of gradual adjustment of import prices to exchange rates:
(7)
The short-run relationship between exchange rates and the import prices of country j is given
by the estimated coefficient 1ja . The long run elasticity is given by the sum of the coefficients
on the contemporaneous exchange rate and three lags of exchange rate terms.13
The estimation methodology applied is ordinary least squares on variables in log
differences, selected after we performed extensive checks on the stationarity of series and on
appropriateness of a cointegration approach.14 We were unable to reject the hypothesis that
the (log) series of import prices, foreign costs, and effective exchange rates were
nonstationary. We performed additional tests to determine whether these three variables were
cointegrated, i.e. whether a linear combination of these variables resulted in a stationary
process.15 Abstracting from the issue of low power of these tests, and despite predictions of
theory, we rejected the cointegration cointegration hypothesis and consequently did not apply
an error correction model.
13 Note that while the theoretical antecedents of this equation are log-level relationships among variables, forestimation the variables in these equations are first-differenced to control for the possibility of unit roots in thetime series variables contained in these specifications.14 Dickey Fuller Unit root tests on the logarithmic values of the import price, foreign costs, and exchange rateseries in an econometric specification, with time trends, reject the unit root hypothesis at the 5% level in only 3of 150 instances. This is clearly below the statistical error for 150 specifications which would be 7.5 rejections.We therefore accept that the (log) series of import prices, foreign costs, and effective exchange rates arenonstationary, with the strong caveat that these stationarity tests have low power.15 First, we test whether the (log) real exchange rate, defined as the (nominal exchange rate)*(foreignprice)/(import price), is stationary. The values of the Dickey Fuller test rejected the hypothesis that the realexchange rate was nonstationary at the 5% level in 8 instances of 150. This is exactly what the statistical errorfor a 150 specifications would suggest (7.5 rejections). Therefore, we reject that the log real exchange rate isstationary, and that the vector (1,1,-1) is a cointegrating vector as suggested by the theory on the real exchangerate. Of course, if there is a cointegrating vector it may differ from what this theory predicts. We run a modelwhere Import price (t) = a + b exchange rate(t) + c*foreignprice(t) + u(t), and compute fitted[u(t)] = rho*fitted[u(t-1)] + e(t). We test whether the rho are different from unity, and rejected for only 11 cases thehypothesis that rho is different from unity at the 5% level. This is slightly higher than the 7.5 instances thatstatistical error would suggest, but still very low.
, ,1 2 3 1 4 1 5...j j j j x j j j j x j j j j
t t t t t t tp a e a w a e a w a gdp v− −∆ = ∆ + ∆ + ∆ + ∆ + + ∆ +
10
Table 1: Exchange Rate Pass-through into Import Prices
Country Full Sample Pass-ThroughElasticities
Change in Pass-through Elasticities1999 versus 1989
Short Run Long-Run Short-Run Long-Run
Australia 0.55*+ 0.69*+ -0.05 0.09Austria 1.22* 1.25 0.68 0.24Belgium 0.16+ 0.71 1.02* 0.18Canada 0.65*+ 0.68*+ 0.20 -0.23Switzerland 0.67*+ 0.94* -0.09 0.09Czech Republic 0.38*+ 0.61* n.a. n.a.Germany 0.59*+ 0.79* -0.32 -0.12Denmark 0.56*+ 0.68* -0.42 -0.80*Spain 0.66*+ 0.56*+ -0.40 -0.94*Finland 0.69*+ 0.82* -0.15 -0.02France 0.53*+ 1.21* -0.82* -1.00United Kingdom 0.39*+ 0.47*+ 0.11 0.11Greece 0.40+ -0.02+ -0.61 -1.24Hungary 0.58*+ 0.85* 0.87* 0.93*Ireland 0.79* 1.37* -0.03 -1.17Iceland 1.18* 0.76* 0.41 0.19Italy 0.67*+ 0.62* -0.52 -0.65Japan 0.88* 1.26* -0.36* -0.76*Netherlands 0.75*+ 0.77* -0.18 -0.17Norway 0.51*+ 0.79* -0.18 -0.19New Zealand 0.47*+ 0.62*+ -0.39* -0.53*Poland 0.50 0.99* 0.75 0.22Portugal 0.60*+ 0.88* -0.04 -0.26Sweden 0.67*+ 0.59*+ -0.62* -0.45USA 0.26*+ 0.41*+ 0.18 0.10Average 0.61 0.77 -0.04 -0.27
Pass through increase (# countries significant) 8 (2) 9 (1)Pass through decline (# countries significant) 16 (4) 15 (5)
* Significantly different from zero at 5 percent level. + Significantly different from one at 5 percent level. Tablerevised 12/07/01 using summed lags method.
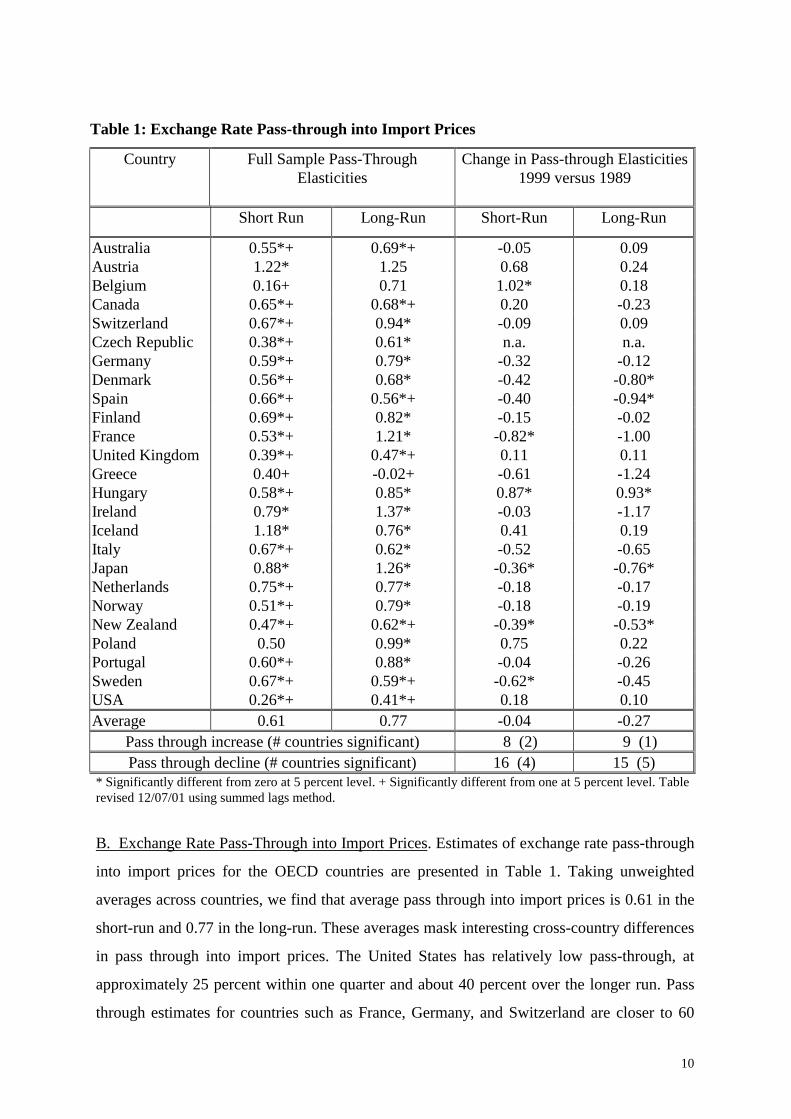
B. Exchange Rate Pass-Through into Import Prices. Estimates of exchange rate pass-through
into import prices for the OECD countries are presented in Table 1. Taking unweighted
averages across countries, we find that average pass through into import prices is 0.61 in the
short-run and 0.77 in the long-run. These averages mask interesting cross-country differences
in pass through into import prices. The United States has relatively low pass-through, at
approximately 25 percent within one quarter and about 40 percent over the longer run. Pass
through estimates for countries such as France, Germany, and Switzerland are closer to 60

11
percent in the short run and 80 percent over the longer run. Smaller European countries
typically have even higher pass through rates, but a precise relationship between pass through
and country size is not empirically significant.
A recurrent issue in the macroeconomics literature is the prevalence of local currency
price stability (LCP) versus producer currency pricing (PCP). Table 2 summarizes tests over
import price data in the OECD for the existence of local currency pricing (zero pass through),
producer currency pass through (complete pass through), or partial pass through.
Table 2: Rejection of LCP or PCP for Import Prices(Entries in table show number of countries for which hypothesis is rejected.
Total number of countries is 25 for all imports, 24 for disaggregated products)
AllImports Food Energy
RawMaterials Manufact.
Non-Manufact.
Short run Reject =0 22 17 8 16 21 14
Reject =1 20 14 7 10 21 10
Reject =0 & =1 18 10 2 6 19 4
Average elasticity .61 .43 .70 .64 .49 .64
Long run Reject =0 22 16 4 16 21 8
Reject =1 8 9 7 8 10 7
Reject =0 & =1 7 5 2 7 9 2
Average elasticity .77 .61 .73 .89 .71 .81
For countries in the OECD we overwhelmingly reject both complete pass-through (or
producer currency pricing, an elasticity equal to 1) and zero pass through (or local currency
price stability) as a description of aggregate import prices in the short run. Partial pass is the
best description for import price responsiveness in the first quarter: elasticities of overall
import prices are significantly different from zero in 22 out of 25 countries and significantly
different from one for 20 out of 25 countries. In the longer run, pass through elasticities are
larger and closer to one, although complete pass-through or producer currency pricing is still
12
rejected in 9 out of 25 countries. Thus, while PCP is better supported as longer run
characterization, it still rejected in many OECD countries.
Numerous discussions have speculated that pass-through rates have recently been
declining. We address this issue directly and more rigorously by performing two types of
structural change tests. One method relies on Chow tests that assume an exogenously
imposed break point. A second set of tests that we conduct allows for endogenously
determined structural break points.16
In our implementation of familiar Chow-tests, we compare elasticities estimated over
the first half of the sample, 1977 through 1989, with those from the full sample through 1999.
The results from this split sample approach (shown in the rightmost columns of Table 1 and
summarized in the bottom two rows of the table) tell a mixed story on the direction of change
in pass-through across countries. Short run exchange rate pass-through declined for 16
countries – including 4 cases if statistically significant declines– and increased in 8 countries.
A similar pattern appears in the long run elasticities. Thus, while Chow tests suggest that
there has been a bias toward declines in exchange rate pass-through across OECD countries,
these tests also point to only a limited number of cases where these declines were statistically
significant. Declining pass-through was not evident in the aggregate import prices of the
United States. By contrast, Japan registered large declines in exchange rate pass through into
import prices. Overall, the Chow tests (with mid-point stability breaks) significantly reject
structural stability for 6 countries of the 25 countries for pass-through coefficients over the
aggregate import price series.
For the second set of tests for the stability of the passthrough relationship into
aggregated import prices, we test for the presence of a structural break as developed by
Andrews (1993) and Andrews and Ploberger (1994). The power of these tests is quite limited
by the number of observations in our import price series (generally around 100 quarters per
series). Indeed, we can never reject stability of long run pass-through according to these
tests. While short run pass-through stability is also reject for 9 countries, it is difficult to
assign the timing of instability to a particular break date, suggesting that the instability is
gradual rather than associated with a distinct point in time. The sample of 9 countries for
which stability is indicated overlaps with, but is not identical to, the Chow test instability
countries.

13
Table 3: Pass-Through Parameter stability(Entries in table show number of countries for which stability hypothesis is rejected.
Total number of countries is 25 for all imports, 24 for disaggregated products)
AllImports Food Energy
RawMaterials Manufact.
Non-Manufact.
Chow Test
Short run instability 9 2 2 3 5 3
Long run instability 6 4 1 3 4 2
Next, we consider the degree of exchange rate pass-through into the prices of
disaggregated goods, along with the stability of these elasticities. We estimate the (constant
marginal cost) pass-through elasticities for the five available sub-aggregates of import prices
reported by the OECD: Food, Energy, Raw Materials, Manufacturing Products, and Non-
manufacturing Products (Appendix Table 1 provides these estimates, by country).18
Most industries exhibit a striking degree of partial pass-through. These results on LCP
versus PCP, and on average elasticities across countries, are summarized in the last five
columns of Table 2. For all product categories --- with the exception of Energy--- we reject
the hypothesis of zero exchange rate pass-through or local currency price stability for more
than half of the countries. For Manufacturing and Food, we similarly reject complete pass
through (PCP). The evidence in support of partial pass-through is strongest for
Manufacturing imports, for which short-run pass through differs significantly from both zero
and one in 19 out of 24 countries. Food also exhibits partial pass through in the short run.
Local currency pricing is often rejected for Non-Manufacturing and Raw Materials, but
rejections of producer currency pricing are more mixed across countries.
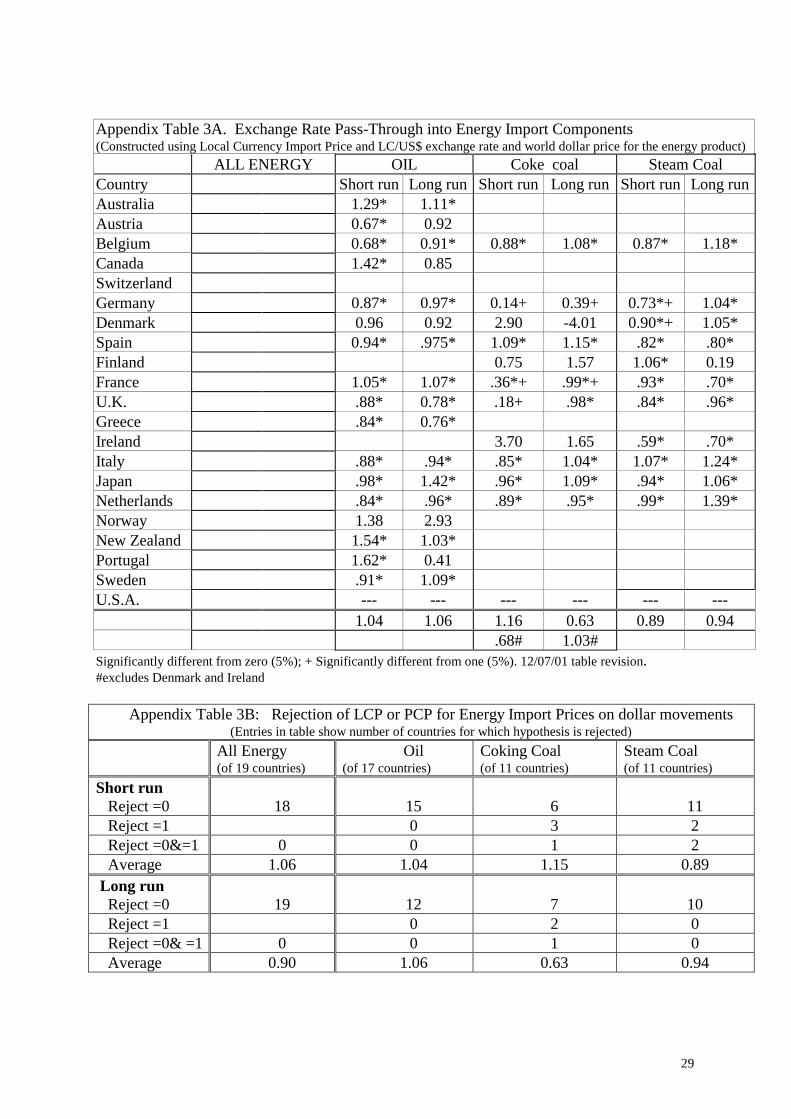
Energy imports have the most anomalous behavior among all the product categories.
Country experiences vary considerably, with our evidence showing that these pass-through
elasticities calculated using effective exchange rates are noisy, but cluster either around zero
16 Hansen (2001) provides a good critique of different types of structural change tests.17 Another important issue with respect to monetary policy is the pass-through comparison for final goods pricesversus imported intermediate goods prices (Obstfeld 2000). Energy and Raw Materials can be viewed as beingcloser to classification as imported intermediate goods than Food, Manufacturing, and Non-manufacturingProducts.18 Another important issue with respect to monetary policy is the pass-through comparison for final goods pricesversus imported intermediate goods prices (Obstfeld 2000). Energy and Raw Materials can be viewed as beingcloser to classification as imported intermediate goods than Food, Manufacturing, and Non-manufacturingProducts.

14
(rejected in short run for only 8 of 24 countries) or around one (rejected for 7 of 24
countries). Energy pass-through rates can be quite high for some countries. Further
examination of the Energy series, as well as examination of disaggregated import price series
for Oil, Coking Coal, and Steam Coal,19 leads us to conclude that the noise surrounding pass-
through elasticity estimates is greatly reduced in regressions that include real bilateral
exchange rates against the U.S. dollar, instead of country-specific effective exchange rate
series. Dollar pass-through into Energy prices is near one in all countries.
The finding of stability of pass-through into disaggregated import prices contributes to
a deeper understanding of the sources of fluctuations in pass-through into aggregate import
prices. Indeed, the aggregate import price series could potentially evolve over time because of
changes in the composition of the import bundles, rather than because of changes in the
underlying pass-through elasticities on component products. For the underlying classes of
imports we formally test for the stability of these pass-through elasticities by country, with
the sample period divided into two intervals (1975:1 to 1986:4, and 1987:1 to 1999:4). As
summarized in Table 3, we never reject stability of the disaggregated pass-through
coefficients for more than 5 countries, and the number is closer to 2 or 3 in any product
category across 24 countries.20 By contrast, the basic Chow test rejects stability in 9 of the 25
cases aggregate import price series. These results as an indicate that exchange rate pass-
through rates for the sub-indices are more stable than the exchange rate pass-through for
aggregated import prices.
19See Appendix Table 3 for detailed results. The countries for which Oil import price data are included are:Australia, Austria, Belgium, Canada, Germany, Denmark, Spain, France, U.K., Greece, Italy, Japan,Netherlands, Norway, New Zealand, Portugal, and Sweden. We do not report pass-through for the U.S. importprices, since these tests are for currencies vis-à-vis the U.S. dollar.20 Many of these instances of product category instability are attributed to data from New Zealand and Japan.Excluding these two countries, the number of countries for which there are rejects in the disaggregated datatypically falls to 1 or 2.21See Appendix Table 3 for detailed results. The countries for which Oil import price data are included are:Australia, Austria, Belgium, Canada, Germany, Denmark, Spain, France, U.K., Greece, Italy, Japan,Netherlands, Norway, New Zealand, Portugal, and Sweden. We do not report pass-through for the U.S. importprices, since these tests are for currencies vis-à-vis the U.S. dollar.22 An interesting observation is that the short run pass-through elasticities of Energy import prices with respectto the dollar are higher than the long run elasticities in 16 out of the 19 countries examined. Future researchcould investigate whether substitution into alternative sources of energy or lower cost products, as discussed inBurstein, Neves, and Rebelo (2001), is occurring over longer horizons following real dollar fluctuations vis-a-vis the local currency.

15
4. Exchange Rates and Import Prices: A Macro or Micro Phenomenon?
The previous section demonstrated the prevalence of partial exchange rate pass through
into import prices, and the large cross-country and time-series variation in some elasticities.
In this section we explore which hypotheses, posed in recent debates over the link between
macroeconomic variables and pass-through and focusing on the endogeneity of markups to
the macroeconomic environment, are borne out in the data. We also pose an alternative
explanation for time series changes in aggregate import price pass-through. Specifically, we
consider the degree to which changes in aggregate import elasticities are attributable to
movements over time in the composition of imports.
A. Macro determinants of pass-through. Taylor (2000) hypothesized that the decline in
average inflation rates in the developed world has also resulted in a decline in the degree in
which firms pass-through changes in costs into prices for their final goods. All else equal,
lower inflation leads to lower import price pass-through. The relationship between more
stable monetary policy and pass through, explored via optimal invoicing currency choics is
also explored in recent theoretical work by Devereux and Engel (2001) and Bacchetta and
van Wincoop (2001). If exporters set their prices in the currency of the country that has the
most stable monetary policies, import prices in local currency terms would be more stable in
countries with more stable monetary policy. All else equal, exchange rate pass-through
would be higher for countries with more volatile monetary policy.
Another reason for macro variables to influence pass through is due to exporter
competition for market share. As discussed in Froot and Klemperer (1989), exchange rate
pass-through may be lower when nominal exchange rate variability is high and exporters to a
country try to maintain local market share.
Country size may be another important factor in ranking pass-through elasticities of
countries. Exchange rate pass-through may be higher if the exporters are large in number
relative to the presence of local competitors. As a first pass at this issue, we posit that pass-
through elasticities would be inversely related to country real GDP, although we recognize
that introducing measure of sector-specific openness may be an alternative way to proceed.
23 Many of these instances of product category instability are attributed to data from New Zealand and Japan.Excluding these two countries, the number of countries for which there are rejects in the disaggregated datatypically falls to 1 or 2.

16
To test for the importance of these alternative hypotheses, we run a second stage
regression to explore the determinants of short-run and long-run pass-through elasticities of
specific countries, with right hand side variables of country-specific average inflation rates,
money growth rates, exchange rate volatility, and real GDP. The bivariate and multivariate
panel regressions use weighted least squares regressions of short and long run elasticities. In
this weighted least squares method, where we use as weights the inverse of the standard error
of the estimated pass-through elasticities, noisy estimates receive less weight in the second
stage specifications.
The time series variables used in constructing these macro variables are all measured
quarterly over the sample period 1975:1 to 1999:4. Money is the average annualized growth
rate of the money supply (in logs): Inflation is average annualized inflation rate, based on
consumer price indices (in logs). Exvol is the average of the quarterly squared changes in the
nominal exchange rate; GDP: is the value, in 1996 US dollars, of the GDP of each country
measured in 1978 (period 1), 1984 (period 2), 1990(period 3), 1996 (period 4). The 1996 US
Dollar value is the nominal value in national currency deflated using the CPI deflator and
converted into U.S. dollar at the average 1996 nominal exchange rate.
The second stage regression is given by
or i i isr lr xγ α β ε= + + (8)
Despite the observation that U.S. pass-through rates are quite low, across the OECD
there is no systematic relationship between pass-through and country real GDP. Some large
countries have high pass through (Japan) while some small countries have low pass through
(Czech Republic). These panel tests, which do not have a time series component, show that
country-specific rates of exchange rate pass-through into import prices are not significantly
correlated with inflation or money growth. However, short-run elasticities are correlated with
nominal exchange rate volatility histories of countries: countries with more nominal volatility
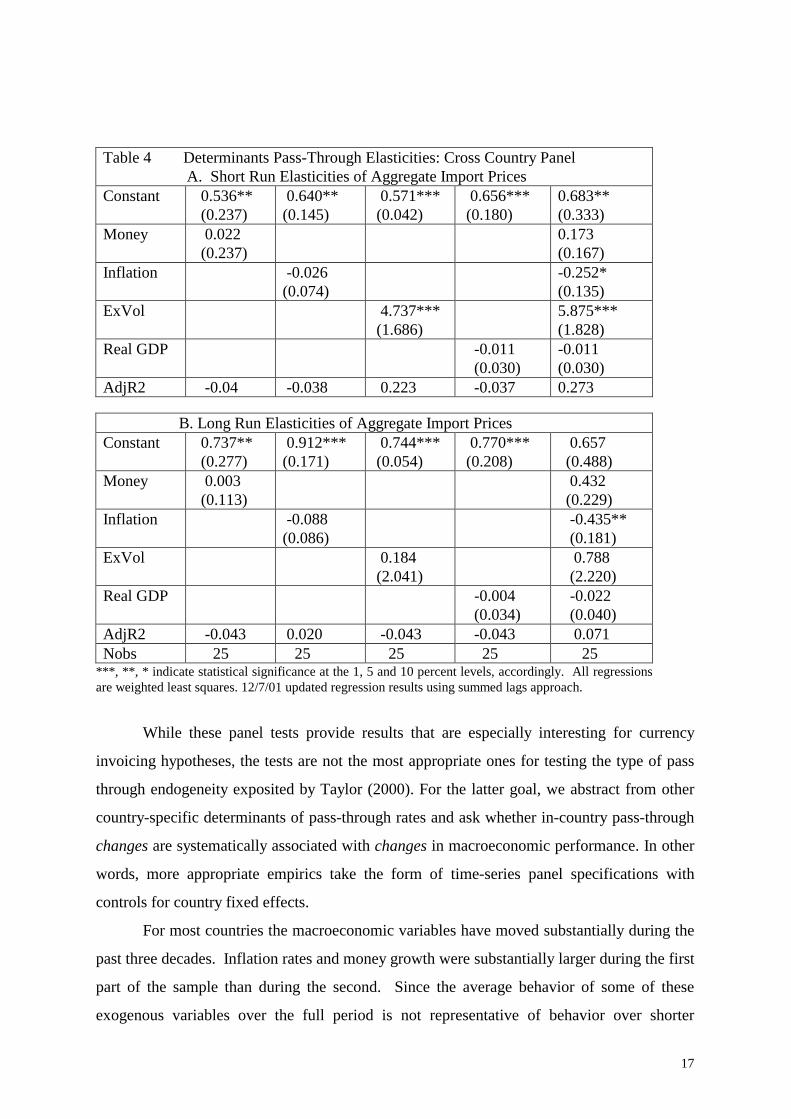
also have higher pass through rates. The results are reported in Table 4 (Panel A: short run
elasticities, Panel B: long run elasticities).
17
Table 4 Determinants Pass-Through Elasticities: Cross Country Panel A. Short Run Elasticities of Aggregate Import PricesConstant 0.536**
(0.237) 0.640**(0.145)
0.571*** (0.042)
0.656*** (0.180)
0.683**(0.333)
Money 0.022 (0.237)
0.173(0.167)
Inflation -0.026(0.074)
-0.252*(0.135)
ExVol 4.737*** (1.686)
5.875***(1.828)
Real GDP -0.011 (0.030)
-0.011(0.030)
AdjR2 -0.04 -0.038 0.223 -0.037 0.273
B. Long Run Elasticities of Aggregate Import PricesConstant 0.737**
(0.277) 0.912***(0.171)
0.744*** (0.054)
0.770*** (0.208)
0.657 (0.488)
Money 0.003 (0.113)
0.432 (0.229)
Inflation -0.088(0.086)
-0.435** (0.181)
ExVol 0.184 (2.041)
0.788 (2.220)
Real GDP -0.004 (0.034)
-0.022 (0.040)
AdjR2 -0.043 0.020 -0.043 -0.043 0.071Nobs 25 25 25 25 25
***, **, * indicate statistical significance at the 1, 5 and 10 percent levels, accordingly. All regressionsare weighted least squares. 12/7/01 updated regression results using summed lags approach.
While these panel tests provide results that are especially interesting for currency
invoicing hypotheses, the tests are not the most appropriate ones for testing the type of pass
through endogeneity exposited by Taylor (2000). For the latter goal, we abstract from other
country-specific determinants of pass-through rates and ask whether in-country pass-through
changes are systematically associated with changes in macroeconomic performance. In other
words, more appropriate empirics take the form of time-series panel specifications with
controls for country fixed effects.
For most countries the macroeconomic variables have moved substantially during the
past three decades. Inflation rates and money growth were substantially larger during the first
part of the sample than during the second. Since the average behavior of some of these
exogenous variables over the full period is not representative of behavior over shorter

18
intervals, we split the sample period into four periods (1975:1 to 1980:4, 1981:1 to 1986:4,
1987:1 to 1992:4, 1993:1 to 1999:4). For each interval we estimate the short and long-run
pass through elasticities of aggregated import prices for each country. We perform second
stage specifications that are a time-series panel version of equation 8. Estimated elasticities
are regressed against the countries macroeconomic variables of the respective time periods,
again using weighted least squares with pass-through observation weighted by the inverse of
its estimated standard error. The second stage regressions include country and time dummies
to account for other country and period-specific effects not controlled for by the exogenous
variables.
The time-series panel results presented in Table 5 show the role of changes in
macroeconomic determinants in driving changes in short run and long run pass-through
elasticities. Consistent with Taylor’s (2000) arguments, short-run pass through is lower when
a country achieves lower inflation, less money growth, or less exchange rate variability.
Lower and more stable monetary conditions induce producers to pass on a smaller percentage
of cost shocks into final goods prices. While money growth and exchange rate volatility do
not appear to be statistically important in these multivariate regressions, this is mainly due to
their high correlation with inflation (which is picking up the statistical contribution of both
terms).
Despite their joint statistical significance, these macroeconomic variables account for
a negligible amount of the variation over time in pass-through elasticities across countries.
The order of magnitude of inflation changes on pass-through changes is low, especially in the
context of inflation ranges observed with the OECD: a one percentage point increase in the
average inflation rate for a country is associated with a 0.0023 increase in pass-through.
Indeed, F-tests show that these macro variables have no explanatory power for long-run pass
through rates across our OECD country sample.

19
Table 5 Macroeconomic Determinants of Pass-Through: Time Series Panel Regressions
Short-Run Pass-Through(Levels)
Long-Run Pass-Through(Levels)
time dummies � � � �
Country dummies � � � �
Money -0.018(0.105)
-0.099(0.175)
Inflation 0.231**(0.103)
0.229**(0.101)
0.335*(0.165)
0.322*(0.162)
Exchange rate volatility 33.71(37.97)
32.315(36.696)
6.903(58.29)
-0.867(53.25)
Real GDP 0.010(0.021)
0.010(0.021)
-0.017(0.036)
-0.016(0.036)
Adj. R2 0.244 0.259 0.055 0.068
Adj. R2 from specificationwith only Macro variables
-0.030 -0.018 -0.021 -0.011
# obs 80 80 80 80
***, **, * indicate statistical significance at the 1, 5 and 10 percent levels, accordingly. All regressions areweighted least squares. 12/7/01 updated regression results using summed lags approach.
B. The Role of the Composition of Trade. Changes in the composition of country imports
is an alternative explanation for changes in exchange rate pass-through into import prices.
We previously demonstrated that different categories of products have different import-price
pass-through elasticities. Then, to what extent were there systematic changes in the
composition of trade? If a country shifts the content of its trade from industries with high
pass-through elasticities into industries with lower elasticities, overall import pass-through
elasticities will decline. Conversely, a shift to higher pass-through products would raise the
overall pass-through elasticity of aggregated import prices.
20
To explore the importance of the changing composition of trade for each country, we
decompose import trade into their five different product categories.24 Data from 1980 and
1992 dramatically illustrate an important feature of OECD trade over these decades. In 1980
manufacturing imports comprised more that 50 percent of the overall (merchandise) import
bill for most countries (see Appendix Table 4). The clear exceptions were countries heavily
reliant on imported energy, notably Japan, followed by Italy and France.
(insert Figure 1)
Japan also stood out among OECD countries for the relatively large share of raw
materials in its imports. However, due to lower energy prices, changes in energy policies, and
a dramatic growth of manufacturing trade, by the 1990s there was a striking cross-country
shift in the composition of imports. By 1992 manufactured products became more than 70
percent of the imports of many OECD countries, and often closer to 80 percent of the import
bill. For France, manufactured products grew from 45 to 79 percent of imports. At the same
time these countries experienced a clear decline in the share of Energy Products in total
imports, as illustrated in Figure 1, and an almost identical increase in the share of
Manufacturing Products. Since product categories have distinct (and relatively stable) pass-
through rates, this shift in the relative importance of Energy and Manufacturing products in
import volumes will be shown to account for a significant fraction of the changes observed in
the pass-through elasticities into aggregated import prices across OECD countries.
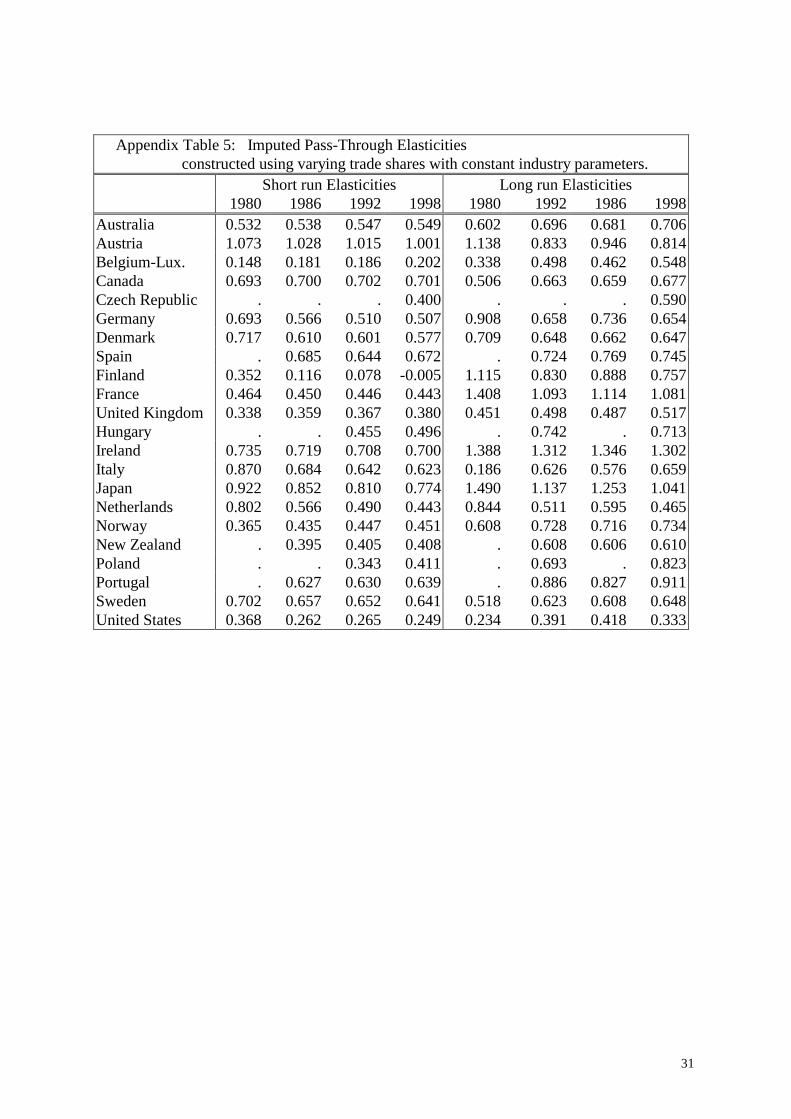
To make this point econometrically by constructing an “imputed trade elasticity”
measure for each country. This construct capture the changes in a country’s aggregate pass-
through elasticities specifically attributable exclusively to changes its composition of imports.
Using constant full sample elasticities for each of the five industry groupings for each
country, we apply time-specific shares of each industry in the country’s total imports of at
1980, 1986, 1992, and 1998. (The resulting elasticities are shown in Appendix Table 5.25)
This approach tracks reasonably well the pattern of pass-through declines observed in
the actual pass-through estimates for the sample of countries for which comparisons are
possible. The imputed measure generates declines for 10 of the 14 cases where declines were
24 These categories are defined by the availability of cross-country data on import prices.

21
observed in the actual data. The imputed measure generates pass-through increases in 5 of
the 7 cases where increased pass-through was observed in the actual data.
The main reason for this decline in the aggregate import price elasticity is due to the
decline in the relative weight in overall imports of energy and raw materials, the two products
for which the import price elasticities were often highest, and the increase in the other
product categories with lower pass-through rates. Between 1980 and 1998, the aggregate
pass-through elasticity for the United States would have declined from 0.37 to 0.25 over this
period solely due to the change in the product composition of imports. For Italy, the decline
would have been far more dramatic, from 0.87 to 0.62.
C. Micro v. Macro Determinants of Exchange Rate Pass-Through. As a final exercise
we run a horse race to statistically compare the explanatory power of the micro versus macro
variables for exchange rate pass-through movements over time and across countries. For
most countries we have pass-through estimates at four intervals. We have imputed elasticities
(from the disaggregated import data) for the 21 countries that had adequate trade share
decompositions for our purposes.
Our regression is of the form:
(9)
where country and time dummies are included, and weighted least squares estimation is again
applied.
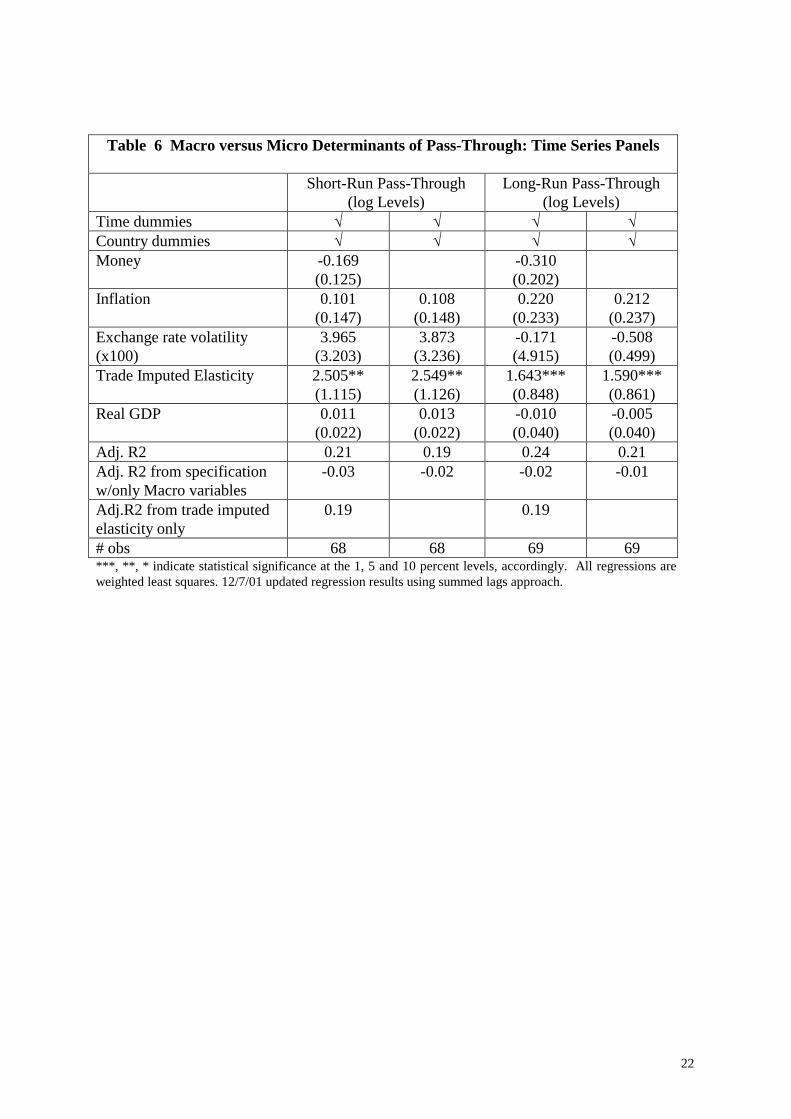
These specifications, reported in Table 6, show that common time dummies, macro
variables and imputed trade shares explain about 20 percent of the observed differences over
time in the short-run pass-through elasticities of countries. Almost all of the explanatory
power is from the imputed trade elasticity variables, even though this composition argument
is made with only the coarse disaggregate series available in the data. In fact, the hypothesis
of the joint insignificance of the macro variables cannot be reject at the one percent level. We
conclude that trade composition effects dominate as explanations for movements over time in
the short-run sensitivity of import prices to exchange rates.
25 Availability of the appropriate disaggregated import data reduced the number of countries included in thissection.
or , 1 2 3 4
5 or ,
ln ln inf ln ln
ln
j j j j jsr lr t t t t t
j jsr lr t t
money lation exchVol GDP
constructedPT
γ β β β β
β µ
∆ = ∆ + ∆ + ∆ + ∆
+ ∆ +
22
Table 6 Macro versus Micro Determinants of Pass-Through: Time Series Panels
Short-Run Pass-Through(log Levels)
Long-Run Pass-Through(log Levels)
Time dummies � � � �
Country dummies � � � �
Money -0.169(0.125)
-0.310(0.202)
Inflation 0.101(0.147)
0.108(0.148)
0.220(0.233)
0.212(0.237)
Exchange rate volatility(x100)
3.965(3.203)
3.873(3.236)
-0.171(4.915)
-0.508(0.499)
Trade Imputed Elasticity 2.505**(1.115)
2.549**(1.126)
1.643***(0.848)
1.590***(0.861)
Real GDP 0.011(0.022)
0.013(0.022)
-0.010(0.040)
-0.005(0.040)
Adj. R2 0.21 0.19 0.24 0.21Adj. R2 from specificationw/only Macro variables
-0.03 -0.02 -0.02 -0.01
Adj.R2 from trade imputedelasticity only
0.19 0.19
# obs 68 68 69 69***, **, * indicate statistical significance at the 1, 5 and 10 percent levels, accordingly. All regressions areweighted least squares. 12/7/01 updated regression results using summed lags approach.
23
5. Conclusions
In this paper we have provided cross-country, time-series, and industry-specific
evidence on the pass-through of changes in exchange rates into import prices across a large
sample of OECD countries since 1975. The cross-country average is that import prices in
local currencies reflect 60 percent of exchange rate fluctuations in the short run, and nearly
80 percent over the long-run. Rates of exchange rate pass-through into U.S. import prices are
about half the OECD average on pass-through rates. Partial pass is the best description for
import price responsiveness in the first quarter following an exchange rate movement. In the
longer run, pass through elasticities are larger and closer to one, although complete pass-
through or producer currency pricing is still rejected in many cases. We conclude that PCP is
better supported as longer run characterization, but caution PCP is nonetheless rejected in
many OECD countries.
While there is some evidence that pass-through rates have been declining over time in
some countries, this pattern does not generalize across the OECD. Macroeconomic variables
play a significant but limited role in explaining cross-country differences in levels of pass-
through elasticities. Most notably, pass-through into import prices is lower for countries with
low inflation variability. However, time series panels confirm that short-run exchange rate
pass-through elasticities rise with price inflation (or higher money growth rates). Despite
statistical correlations, the quantitative importance of these effects have been small in the
OECD. We conclude that recent arguments for virtuous cycles between inflation, money
policy effectiveness and pass-through have not been of first-order importance within the
OECD countries.
Observed increases or decreases in pass-through rates into aggregate import price
series more closely reflects changes over time in the composition of import bundles of OECD
countries. Pass-through elasticities for manufacturing products and food products are
generally partial, so that both local currency price stability and producer price stability are
rejected for most countries. By contrast, energy imports appear to have the most polar and
noisiest import price elasticities among the different product categories. The shift in the
import composition toward manufactures and away from energy and raw materials imports
have contributed significantly to pass-through declines in about half of the OECD countries
examined. These types of changes in pass-through into import prices –associated with
widespread changes in the composition of industrial activity and trade --- are likely to be

24
more durable than those associated with the types of changes in macroeconomic policy
environments observed in the OECD in recent decades.
References
Bacchetta, Philippe and Eric vanWincoop. 2001. “A Theory of the Currency Denomination of
International Trade.” Manuscript, November.
Ball, Laurence. 1999. “Monetary Policy Rules in an Open Economy.” in John Taylor (Ed.)
Monetary Policy Rules (University of Chicago Press, Chicago).
Burstein, Ariel, Joao Neves, and Sergio Rebelo. 2001. “Distribution Costs and Real Exchange
Rate Dynamics During Exchange Rate Based Stabilizations”. Forthcoming Journal of
Monetary Economics.
Campa, Jose and Linda Goldberg. 1997. “The Evolving External Orientation of
Manufacturing: Evidence from Four Countries.” Economic Policy Review (July, Federal
Reserve Bank of New York).
Clarida, Richard, Jordi Gali, and Mark Gertler. 1998. “Monetary Policy Rules in Practice:
Some International Evidence.” European Economic Review, 42: 1033-67.
Corsetti, Giancarlo and Paolo Pesenti. 2001. “International Dimensions of Optimal Monetary
Policy.” mimeo, June.
Cunningham, Alastair and Andrew Haldane. 1999. “The Monetary Transmission Mechanism
in the United Kingdom: Pass-Through and Policy Rules” prepared for the 3rd Annual
Conference of the Central Bank of Chile, September 21-22.
Devereux, Michael. 2000. “Monetary Policy, Exchange Rate Flexibility and Exchange Rate
Pass Through”. October manuscript.
Devereux, Michael and Charles Engel. 2000. “Monetary Policy in the Open Economy
Revisited: Price Setting and Exchange Rate Flexibility.” National Bureau of Economic
Research working paper no. 7665.
Devereux, Michael and Charles Engel. 2001. “Endogenous Currency of Price Setting in a
Dynamic Open Economy Model.” Manuscript, June.
Dornbusch, R., “Exchange Rates and Prices,” American Economic Review 77 (March 1987),
93-106.

25
Engel, Charles and John Rogers. 1996. “How Wide is the Border?” American Economic
Review. Vol. 86 no.5 (December) pp.1112-25.
Feenstra, Robert. 1998. Integration of Trade and Disintegration of production in the global
economy.” The Journal of Economic Perspectives vol. 12 pp.31-50.
Froot, Ken and Paul Klemperer. 1989. “Exchange Rate Pass-Through When Market Share
Matters,” American Economic Review (September),pp. 637-54.
Gagnon, Joseph and Jane Ihrig. 2001. “Monetary Policy and Exchange Rate Pass-Through”.
Board of Governors of the Federal Reserve System, International Finance Discussion
Papers #704 (July).
Goldberg, Pinelopi and Michael Knetter. 1997. “Goods Prices and Exchange Rates: What
Have we Learned?” Journal of Economic Literature, vol. 35 pp. 1243-92.
Hansen, Bruce E. 1997. “Approximate Asymptotic P Values for Structural Change Tests”
Journal of Business and Economic Statistics. January. 12:1, pp.60-67.
Hansen, Bruce E. 2001. “The New Econometrics of Structural Change: Dating Breaks in U.S.
Labor Productivity”, Journal of Economic Perspectives vol. 15 no. 4 Fall pp.117-128.
Hummels, David, Jun Ishii, and Kei-Mu Yi. 2001. “The Nature and Growth of Vertical
Specialization in World Trade”. Journal of International Economics. June vol.54 (1).
pp.75-96.
Kasa, Kenneth. 1992. “Adjustment Costs and Pricing to Market”, Journal of International
Economics. (February) vol. 32 no.1-2 pp.1-30.
Knetter, Michael. 1989. “Price Discrimination by U.S. and German Exporters” American
Economic Review, March vol. 79 pp.198-210.
Knetter, Michael. 1993. “International Comparisons of Pricing to Market Behavior.”
American Economic Review, June vol. 83 pp.473-86.
Lane, Philip. 1997. “Inflation in Open Economies”. Journal of International Economics vol.
42 pp.327-347.
Marston, Richard. 1990. “Pricing to Market in Japanese Manufacturing” Journal of
International Economics. Vol. 29 pp.217-36.
McCarthy, Jonathon. 2000. “Pass-Through of Exchange Rates and Import Prices to Domestic
Inflation in Some Industrialized Economies”. Manuscript, Federal Reserve Bank of New
York (August).

26
Obstfeld, Maurice. 2000. “International Macroeconomics: Beyond the Mundell-Fleming
Model.” mimeo, December.
Swamy, P. and Stephan Thurman. 1994. “Exchange Rate Episodes and the Pass-Through of
Exchange Rates to Import Prices.” Journal of Policy Modeling vol. 16 (6): pp. 609-623.
Taylor, John B. 2000. “Low Inflation, Pass-Through, and the Pricing Power of Firms”
European Economic Review, June volume 44 issue 7 pp. 1389-1408.
Yang, Jaiwen. 1997. “Exchange Rate Pass-Through into U.S. Manufacturing Industries”
Review of Economics and Statistics. vol. 79, pp. 95-104.
27
Data Appendix:
OECD import price series
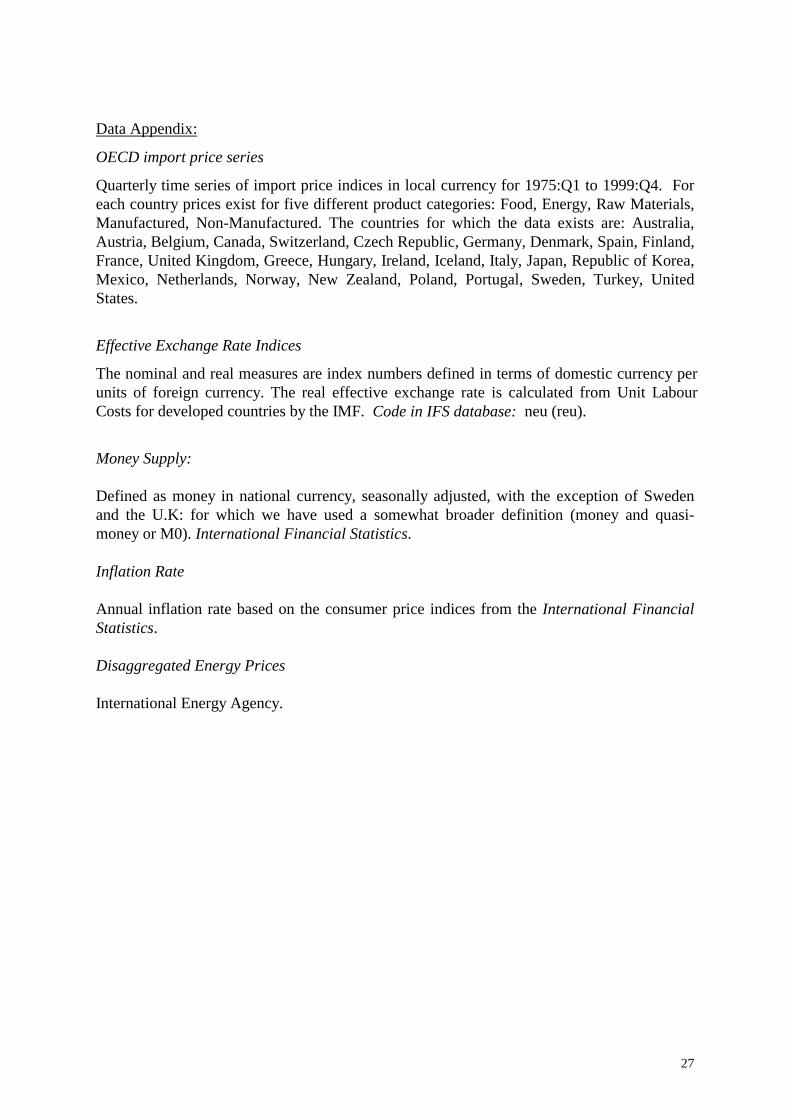
Quarterly time series of import price indices in local currency for 1975:Q1 to 1999:Q4. Foreach country prices exist for five different product categories: Food, Energy, Raw Materials,Manufactured, Non-Manufactured. The countries for which the data exists are: Australia,Austria, Belgium, Canada, Switzerland, Czech Republic, Germany, Denmark, Spain, Finland,France, United Kingdom, Greece, Hungary, Ireland, Iceland, Italy, Japan, Republic of Korea,Mexico, Netherlands, Norway, New Zealand, Poland, Portugal, Sweden, Turkey, UnitedStates.
Effective Exchange Rate Indices
The nominal and real measures are index numbers defined in terms of domestic currency perunits of foreign currency. The real effective exchange rate is calculated from Unit LabourCosts for developed countries by the IMF. Code in IFS database: neu (reu).
Money Supply:
Defined as money in national currency, seasonally adjusted, with the exception of Swedenand the U.K: for which we have used a somewhat broader definition (money and quasi-money or M0). International Financial Statistics.
Inflation Rate
Annual inflation rate based on the consumer price indices from the International FinancialStatistics.
Disaggregated Energy Prices
International Energy Agency.

28
Appendix Table 1: Import Pass-through Elasticities (Statistical), 1975 - 1999
Country Full Sample Pass-ThroughElasticities
Change in Elasticities1999 versus 1989
Short Run Long-Run Short-Run Long-Run
Australia 0.548*+ 0.596*+ -0.010 0.161Austria 1.079* 1 0.600 0.469Belgium 0.658* 1.307* 0.154 0.021Canada 0.704*+ 0.706*+ 0.114 -0.235Switzerland 0.597*+ 0.735*+ -0.121 0.142Czech Republic 0.494*+ 0.801* n.a. n.a.Germany 0.497*+ 0.734* -0.272 0.021Denmark 0.701*+ 1.419*+ -0.582* -0.919*Spain 0.727*+ 0.780* -0.281 -0.382Finland 0.587*+ 0.450*+ -0.002 0.324France 0.562*+ 1.569*+ -0.479 -1.279*United Kingdom 0.314*+ 0.564*+ 0.112 0.063Greece 0.300+ 0.268 -0.489 -0.93Hungary 0.464*+ 0.595*+ 0.903* 1.053*Ireland 0.802* 1.443* 0.016 -1.105Iceland -0.012+ -0.028+ 1.142* 0.441Italy 0.747* 1.124* -0.429 -0.934*Japan 0.841* 1.177* -0.397* -0.725*Netherlands 0.737* 1.122* -0.362 -0.401Norway 0.377*+ 0.337+ -0.270 -0.26New Zealand 0.582*+ 0.767* -0.410* -0.703*Poland 0.495*+ 0.887* 0.163 0.31Portugal 0.559*+ 1.086* 0.007 0.374Sweden 0.678*+ 0.676* -0.595* -0.41USA 0.184*+ 0.292*+ 0.256 0.28Average 0.569 0.816 -0.128 -0.224
* Significantly different from zero at the 5 percent level. + Significantly different from one at 5 percent level.12/07/01 table revision.
29
Appendix Table 3A. Exchange Rate Pass-Through into Energy Import Components(Constructed using Local Currency Import Price and LC/US$ exchange rate and world dollar price for the energy product)
ALL ENERGY OIL Coke coal Steam CoalCountry Short run Long run Short run Long run Short run Long runAustralia 1.29* 1.11*Austria 0.67* 0.92Belgium 0.68* 0.91* 0.88* 1.08* 0.87* 1.18*Canada 1.42* 0.85SwitzerlandGermany 0.87* 0.97* 0.14+ 0.39+ 0.73*+ 1.04*Denmark 0.96 0.92 2.90 -4.01 0.90*+ 1.05*Spain 0.94* .975* 1.09* 1.15* .82* .80*Finland 0.75 1.57 1.06* 0.19France 1.05* 1.07* .36*+ .99*+ .93* .70*U.K. .88* 0.78* .18+ .98* .84* .96*Greece .84* 0.76*Ireland 3.70 1.65 .59* .70*Italy .88* .94* .85* 1.04* 1.07* 1.24*Japan .98* 1.42* .96* 1.09* .94* 1.06*Netherlands .84* .96* .89* .95* .99* 1.39*Norway 1.38 2.93New Zealand 1.54* 1.03*Portugal 1.62* 0.41Sweden .91* 1.09*U.S.A. --- --- --- --- --- ---
1.04 1.06 1.16 0.63 0.89 0.94.68# 1.03#
Significantly different from zero (5%); + Significantly different from one (5%). 12/07/01 table revision.#excludes Denmark and Ireland
Appendix Table 3B: Rejection of LCP or PCP for Energy Import Prices on dollar movements(Entries in table show number of countries for which hypothesis is rejected)
All Energy(of 19 countries)
Oil(of 17 countries)
Coking Coal(of 11 countries)
Steam Coal(of 11 countries)
Short run Reject =0 18 15 6 11 Reject =1 0 3 2 Reject =0&=1 0 0 1 2 Average 1.06 1.04 1.15 0.89 Long run Reject =0 19 12 7 10 Reject =1 0 2 0 Reject =0& =1 0 0 1 0 Average 0.90 1.06 0.63 0.94

30
Appendix Table 4: Share of total imports by major product categoryFood Energy Raw Materials Manufacturing Nonmanufacturing
Country 1980 1992 1980 1992 1980 1992 1980 1992 1980 1992
Australia 5.38 4.61 13.78 5.83 4.72 2.88 74.31 84.51 1.81 2.17Austria 5.97 4.89 15.44 5.13 7.09 4.32 71.34 85.61 0.16 0.06Belgium 10.25 9.93 17.49 7.58 7.69 5.36 61.61 70.83 2.96 6.29Canada 0.00 6.11 19.17 4.34 9.65 3.30 71.18 82.96 0.00 3.29SwitzerlandCzech RepublicGermany 10.86 9.63 22.53 7.46 8.29 4.74 55.83 75.99 2.50 2.18Denmark 10.24 12.85 22.49 6.14 6.57 4.23 59.41 73.98 1.30 2.80Spain n.a. 10.93 n.a. 10.06 n.a. 5.35 n.a. 73.36 n.a. 0.29Finland 6.77 5.82 28.58 12.85 5.57 7.55 58.82 73.75 0.27 0.03France 0.00 9.44 55.45 7.97 0.00 3.50 44.55 78.81 0.00 0.29U. Kingdom 12.02 10.65 13.29 5.57 7.46 4.06 64.35 78.38 2.88 1.34GreeceHungary n.a. 5.50 n.a. 15.01 n.a. 4.11 n.a. 75.36 n.a. 0.01Ireland 11.61 11.29 14.80 5.19 3.59 2.52 67.50 78.17 2.49 2.83Iceland n.a. 9.44 n.a. 8.31 n.a. 5.06 n.a. 76.98 n.a. 0.21Italy 0.00 11.80 55.76 8.46 0.00 7.23 40.74 67.80 3.50 4.72Japan 10.45 15.97 49.79 22.65 16.91 11.11 21.75 47.97 1.10 2.30Netherlands 12.60 11.77 23.79 8.53 7.14 4.88 55.08 74.60 1.38 0.21Norway 6.63 6.13 17.31 3.42 8.89 7.13 66.80 83.21 0.37 0.11New Zealand n.a. 6.62 n.a. 6.54 n.a. 4.08 n.a. 82.69 n.a. 0.07Poland n.a. 10.65 n.a. 16.81 n.a. 6.12 n.a. 66.35 n.a. 0.07Portugal n.a. 11.07 n.a. 8.16 n.a. 4.58 n.a. 75.77 n.a. 0.43Sweden 6.78 7.13 24.17 8.67 4.61 3.80 64.03 79.76 0.41 0.64United States 7.58 5.27 33.86 10.28 4.51 2.82 51.10 77.84 2.95 3.79
Share of food includes imports in SITCs 0 and 1, Raw Materials includes SITCs 3 and 4,Energy includes SITC 3, Manufacturing includes SITCs 5, 6, 7, and 8, and Non-Manufacturing includes SITC 9.
31
Appendix Table 5: Imputed Pass-Through Elasticities constructed using varying trade shares with constant industry parameters.
Short run Elasticities Long run Elasticities1980 1986 1992 1998 1980 1992 1986 1998
Australia 0.532 0.538 0.547 0.549 0.602 0.696 0.681 0.706Austria 1.073 1.028 1.015 1.001 1.138 0.833 0.946 0.814Belgium-Lux. 0.148 0.181 0.186 0.202 0.338 0.498 0.462 0.548Canada 0.693 0.700 0.702 0.701 0.506 0.663 0.659 0.677Czech Republic . . . 0.400 . . . 0.590Germany 0.693 0.566 0.510 0.507 0.908 0.658 0.736 0.654Denmark 0.717 0.610 0.601 0.577 0.709 0.648 0.662 0.647Spain . 0.685 0.644 0.672 . 0.724 0.769 0.745Finland 0.352 0.116 0.078 -0.005 1.115 0.830 0.888 0.757France 0.464 0.450 0.446 0.443 1.408 1.093 1.114 1.081United Kingdom 0.338 0.359 0.367 0.380 0.451 0.498 0.487 0.517Hungary . . 0.455 0.496 . 0.742 . 0.713Ireland 0.735 0.719 0.708 0.700 1.388 1.312 1.346 1.302Italy 0.870 0.684 0.642 0.623 0.186 0.626 0.576 0.659Japan 0.922 0.852 0.810 0.774 1.490 1.137 1.253 1.041Netherlands 0.802 0.566 0.490 0.443 0.844 0.511 0.595 0.465Norway 0.365 0.435 0.447 0.451 0.608 0.728 0.716 0.734New Zealand . 0.395 0.405 0.408 . 0.608 0.606 0.610Poland . . 0.343 0.411 . 0.693 . 0.823Portugal . 0.627 0.630 0.639 . 0.886 0.827 0.911Sweden 0.702 0.657 0.652 0.641 0.518 0.623 0.608 0.648United States 0.368 0.262 0.265 0.249 0.234 0.391 0.418 0.333

32
App
endi
x T
able
2:
Dis
aggr
egat
ed I
mpo
rt P
rice
Ind
ices
, Ful
l Dat
a Sa
mpl
e
FOO
DE
NE
RG
YR
AW
MA
TE
RIA
LS
MA
NU
FAC
TU
RIN
GN
ON
-M
AN
UFA
CT
UR
ING
Shor
t-R
unL
ong-
Run
Shor
t-R
unL
ong-
Run
Shor
t-R
unL
ong-
Run
Shor
t-R
unL
ong-
Run
Shor
t-R
unL
ong-
Run
Aus
tral
ia0.
326*
+0.
364*
+0.
454
-0.3
01+
0.37
9*+
0.51
9*+
0.57
3*+
0.80
4*+
0.46
8*+
0.11
4+A
ustr
ia0.
018
0.38
81.
582
3.06
31.
385
2.61
91.
019*
0.63
41.
513*
2.74
7*B
elgi
um0.
107+
0.64
0*-0
.347
-1.3
810.
840*
1.84
5*0.
211+
0.58
3*0.
112+
0.43
7C
anad
a0.
836*
0.70
1*0.
803
-0.3
850.
433+
0.63
8*0.
699*
+0.
728*
+0.
676*
0.36
6Sw
itzer
land
0.43
5*+
0.79
5*1.
889*
+2.
684*
+0.
533*
+0.
744*
+0.
632*
+0.
851*
.1.
200*
2.17
5*+
Cze
ch R
epub
lic0.
449*
0.97
0*-0
.554
1.03
40.
604*
0.98
80.
460*
+0.
509*
+-0
.040
+0.
911
Ger
man
y0.
319*
+0.
483*
+1.
514*
2.00
0*0.
824*
1.11
4*0.
403*
+0.
501*
+0.
970*
1.32
8*D
enm
ark
0.65
0*+
0.22
8*1.
202*
+0.
927
1.08
3*+
1.06
0*0.
496*
+0.
666*
+1.
103*
+0.
882
Spai
n0.
731*
+0.
636*
0.86
3*-0
.576
+0.
681*
1.12
4*0.
597*
+0.
889*
0.86
5*0.
142+
Finl
and
-0.1
680.
652
1.59
92.
375
0.38
80.
004
-0.2
00+
0.65
91.
071
1.62
0Fr
ance
0.78
2*1.
301*
0.50
11.
691
0.41
9*+
1.05
6*0.
583
1.29
0*U
nite
d K
ingd
om0.
218*
+0.
523*
+0.
092+
-0.0
51+
0.41
7*+
0.58
4*+
0.40
6*+
0.53
2*+
0.25
2*+
0.31
5+G
reec
e0.
391+
0.52
00.
052+
-1.2
890.
207+
0.05
50.
519*
+0.
237+
0.19
6-0
.434
Hun
gary
0.73
2*1.
059*
-0.0
35+
0,91
90.
718*
0.85
9*0.
518*
+0.
677*
0.23
5+0.
943*
Irel
and
0.74
1*1.
314*
0,94
3*1.
923*
0.88
1*2.
203*
+0.
680*
1.22
8*0.
762*
1.70
2*It
aly
0.50
0*+
0.53
8*+
1.11
1-0
.225
1.13
4*0.
923
0.54
1*+
0.73
7*0.
862*
0.32
8Ja
pan
0.71
0*+
0.73
1*+
1.07
9*2.
165*
+0.
882*
0.79
9*0.
693*
+0.
848*
0.94
1*1.
489*
+N
ethe
rlan
ds0.
293*
0.22
2+2.
120*
2.18
11.
203*
1.67
8*0.
286*
+0.
287*
+1.
252*
1.41
2*N
orw
ay0.
642*
-0.0
65+
-0.0
810.
089
0.19
30.
389
0.47
6*+
0.84
2*0.
311+
0.08
4N
ew Z
eala
nd0.
518*
+0.
651*
0.01
7+0.
528
0.39
7*+
0.44
5*+
0.42
7*+
0.61
9*+
0.42
9*+
0.62
9Po
land
0.01
7+0.
124+
0.07
1+0.
192+
0.01
5+-0
.154
+0.
495
0.99
0*0.
061+
0.12
0+Po
rtug
al0.
330
0.90
2*0.
375
0.02
11.
068*
1.22
7*0.
677*
+0.
958*
0.21
30.
447
Swed
en0.
631*
+0.
615
0.96
3*0.
025
0.45
0*+
0.45
4*+
0.62
8*+
0.69
9*0.
873*
0.31
3U
nite
d St
ates
0.08
3+0.
238+
0.69
1-0
.160
+ 0
.060
+0.
386*
+0.
219*
+0.
488*
+0.
457+
0.11
8+av
erag
e0.
429
0.60
50.
704
0.72
70.
642
0.89
10.
495
0.70
90.
640
0.81
2*S
igni
fica
ntly
dif
fere
nt f
rom
zer
o (5
%),
+ S
igni
fica
ntly
dif
fere
nt f
rom
one
(5%
). 1
2/7/
01: i
nclu
des
lagg
ed c
oeff
icie
nt m
etho
d.

33
App
endi
x T
able
4:
Cha
nge
over
tim
e in
Dis
aggr
egat
ed I
mpo
rt P
rice
Pas
s-T
hrou
gh E
last
iciti
es (
1999
-198
9)FO
OD
EN
ER
GY
RA
W M
AT
ER
IAL
SM
AN
UFA
CT
UR
ING
NO
N-
MA
NU
FAC
TU
RIN
G
Shor
t-R
unL
ong-
Run
Shor
t-R
unL
ong-
Run
Shor
t-R
unL
ong-
Run
Shor
t-R
unL
ong-
Run
Shor
t-R
unL
ong-
Run
Aus
tral
ia-0
.053
0.00
9-0
.039
-0.1
580.
042
0.16
8-0
.051
0.01
70.
032
0.01
2A
ustr
ia0.
360
0.34
3-0
.813
-1.6
59-0
.187
-0.1
80-0
.023
-0.0
13-0
.533
-1.0
54B
elgi
um-0
.243
-0.6
081.
080
1.49
70.
514
0.65
10.
201
0.18
50.
273
0.32
0C
anad
a-0
.338
-0.3
120.
392
0.43
40.
105
0.01
60.
003
0.00
60.
125
0.01
7Sw
itzer
land
-0.0
090.
010
-0.1
09-0
.471
-0.0
67-0
.057
-0.0
170.
006
-0.0
31-0
.337
Cze
ch R
epub
lic0.
232
-1.6
731.
658
0.91
7-0
.848
-0.6
970.
083
0.12
0-0
.849
0.03
8G
erm
any
-0.0
01-0
.193
-0.4
35-1
.597
-0.2
65-0
.471
-0.0
97-0
.183
-0.2
95-1
.059
Den
mar
k0.
128
0.20
9-0
.390
-0.7
61-0
.081
0.05
10.
057
0.22
7-0
.100
0.02
3Sp
ain
0.07
70.
063
0.10
0-0
.067
0.05
60.
057
-0.0
31-0
.005
0.05
5-0
.029
Finl
and
0.22
20.
158
1.05
20.
746
0.50
70.
349
-0.2
67-0
.152
0.59
40.
419
Fran
ce-0
.003
-0.0
20-0
.585
-1.0
56-0
.042
0.02
1-0
.266
-0.4
20U
nite
d K
ingd
om0.
077
0.09
9-0
.070
-0.2
53-0
.027
-0.3
540.
003
0.04
8-0
.026
-0.2
96G
reec
e0.
138
0.12
30.
248
0.28
90.
168
0.12
90.
100
0.12
70.
220
0.16
0H
unga
ry0.
143
0.29
30.
483
0.70
90.
295
0.20
70.
657
1.02
10.
329
0.46
2Ir
elan
d0.
014
-0.0
79-0
.595
-1.9
28-0
.045
-0.0
230.
105
-0.1
19-0
.350
-1.2
33It
aly
-0.3
97-0
.315
-1.6
37-2
.754
-0.2
15-0
.049
-0.1
41-0
.090
-0.4
89-0
.807
Japa
n-0
.047
-0.0
75-0
.535
-1.0
68-0
.221
-0.2
28-0
.104
-0.1
36-0
.329
-0.6
19N
ethe
rlan
ds0.
040
0.04
0-0
.254
-1.1
76-0
.134
0.15
90.
041
0.04
0-0
.128
-0.4
35N
orw
ay0.
189
0.15
00.
822
0.90
40.
483
0.49
30.
123
0.13
90.
400
0.40
9N
ew Z
eala
nd-0
.190
-0.2
050.
199
0.18
6-0
.054
-0.0
72-0
.110
-0.1
300.
068
0.05
2Po
land
0.01
8-0
.078
0.01
5-0
.189
0.03
00.
015
-0.4
44-0
.120
0.05
6-0
.069
Port
ugal
0.34
20.
347
-0.2
87-0
.725
-0.1
090.
030
0.10
00.
108
0.16
80.
171
Swed
en-0
.172
-0.1
260.
221
-0.0
02-0
.070
-0.0
01-0
.210
-0.1
53-0
.099
-0.2
25U
nite
d St
ates
0.00
5-0
.007
0.93
21.
303
0.06
40.
115
-0.0
340.
032
0.54
90.
679
aver
age
0.02
4-0
.077
0.06
1-0
.279
0.00
00.
009
-0.0
020.
036
-0.0
23-0
.156

34
Figu
re 1
Per
cent
age
Poin
t Dec
line
of E
nerg
y Sh
are
in Im
port
s, b
y O
EC
D C
ount
ry
05101520253035404550