exchange rate risk management of export firms: new ... · studies of firms' foreign exchange...
TRANSCRIPT

DPRIETI Discussion Paper Series 13-E-024
Exchange Rate Risk Management of Export Firms:New findings from a questionnaire survey
ITO TakatoshiRIETI
KOIBUCHI Satoshi Chuo University
SATO KiyotakaYokohama National University
SHIMIZU JunkoGakushuin University
The Research Institute of Economy, Trade and Industryhttp://www.rieti.go.jp/en/
RIETI Discussion Paper Series 13-E-024
April 2013
Exchange Rate Risk Management of Export Firms:1†
New findings from a questionnaire survey
ITO Takatoshi (University of Tokyo/RIETI) KOIBUCHI Satoshi (Chuo University)
SATO Kiyotaka ( Yokohama National University) SHIMIZU Junko§(Gakushuin University)
Abstract
In this paper, we present new findings of Japanese firms' exchange rate risk managements
based on a questionnaire survey sent to all Tokyo Stock Exchange listed firms in 2009.
Using their responses, we conduct empirical analysis to investigate the relation between
respective risk management tools including the choice of invoice currency and the price
revision strategy (pass-through). Results show the following: first, firms with higher sales
and greater dependency on foreign markets more actively engage in currency hedging
including financial and operational hedging. Second, Japanese firms use both financial and
operational hedging complementarily. Third, U.S. dollar invoicing is supported by both
financial and operational hedging. Fourth, yen-invoicing substitutes for both financial and
operational hedging. Fifth, pass-through also substitutes for financial hedging. These
findings indicate that Japanese firms use operational hedging, financial hedging strategies,
and pass-through policies depending on their choice of invoicing currency.
Keywords: Exchange rate risk management; Invoice currency; Operational hedge;
Financial hedge; Exchange rate pass-through
JEL classification: G32, G15, F41
†1The paper is based on the result of RIETI Questionnaire Survey conducted in 2009 under the name of RIETI We thank various supports from RIETI and are grateful for helpful comments and suggestions by research group members. § Corresponding Author: [email protected]
RIETI Discussion Papers Series aims at widely disseminating research results in the form of professional
papers, thereby stimulating lively discussion. The views expressed in the papers are solely those of the
author(s), and do not represent those of the Research Institute of Economy, Trade and Industry.
2
1. Introduction
Volatile foreign exchange rate fluctuation causes a large influence on both the business
performance of globally active firms in the short term and the corporate strategies including the
placement of the production base in the medium term to long term. The degree of these
influences might depend on each firm's exchange rate risk management. It is said that firms use
a combination of financial hedges and operational hedges to manage their currency exposure.
Although financial hedges are conducted to hedge their currency exposure using foreign
exchange derivatives in foreign exchange markets, operational hedges are used among the firm's
international subsidiaries to reduce their foreign exchange exposure. With the development of
sophisticated financial hedge techniques in foreign exchange markets, such as forward contracts,
currency swaps, and currency options, firms can hedge their currency exposure. However, these
transactions can only ensure a certain amount of earnings in terms of the home currency in a
certain period. They cannot fully avoid the influence of appreciation of the home currency itself.
For example, in response to the yen's appreciation in 1995, Japanese exporting firms promoted
the transfer of production bases overseas, or increased the capacity of existing overseas bases,
and increased the share of imported components from overseas. They took those measures and
others to ensure the benefits.
Another reason why a strong currency quickly turns into economic and political issues in
countries having massive export sectors such as Japan and other East Asian countries is that
many Asian export firms invoice their exports in US dollars. A stronger home currency reduces
overseas sales income of exporting firms when they convert their foreign currency earnings into
home currency. If their exports are invoiced in the home currency, their business performance
would not be strongly affected by currency appreciation, at least in the short run. Consequently,
the choice of invoicing currency is strongly related to the choice of exchange rate risk
management tools. Furthermore, whether firms can make their price revisions in response to
foreign exchange fluctuations (exchange rate pass-through) and how frequently they can do so
are to some degree related to their exchange rate risk management. If firms have a sufficiently
competitive product that it is possible to revise their prices to maintain constant earnings, then
exchange rate fluctuations would not cause any severe impact on their performances, at least in
a certain period while the trading volume does not change. Accordingly, the effectiveness of
exchange risk management, the choice of invoicing currency and the decision of exchange rate
pass-through are strongly related mutually.
As described in this paper, we investigate the exchange rate risk management of Japanese
firms based on responses to a questionnaire survey. Questionnaires were sent to all Japanese
manufacturing firms listed in the stock exchanges in September 2009 with the cooperation of
3
the Research Institute of Economy, Trade, and Industry (RIETI). The questionnaire survey
(henceforth, 2009 RIETI survey) covers rich information not only on the firms' foreign
exchange rate risk management but also on the firms' choice of invoicing currency and price
revision (pass-through) strategy. The survey results are classified by industry and by firm size
using annual financial reports of sample firms, through which new evidence of Japanese firms'
exchange rate risk management, such as the usage of financial and operational hedging and
price revision are presented. Our analysis shows how Japanese firms combine three different
tools of exchange rate risk management policies, operational and financial hedging and
exchange rate pass-through under their own choice of invoicing currency, to mitigate the
influence of exchange rate risk. Given a growing regional production network of Japanese firms,
our findings based on the questionnaire study will present important implications for future
exchange rate policies to propose more effective exchange rate risk management.
The remainder of this paper is organized as follows. Section 2 presents a review of earlier
studies of firms' foreign exchange risk management and presents discussion of the relation
between the variety of exchange rate risk management and the invoicing currency choice
conducted by globally operating firms. Section 3 briefly presents the 2009 RIETI survey results.
Section 4 describes an empirical analysis conducted to ascertain the relation between exchange
rate risk management tools including the choice of invoicing currency and pass through. Section
5 concludes with a presentation of the results.
2. Exchange Rate Risk Management, Currency Invoicing, and Pricing Policy
2-1. Variety of Exchange Rate Risk Management
A number of empirical studies have examined the question of how firms deal with the
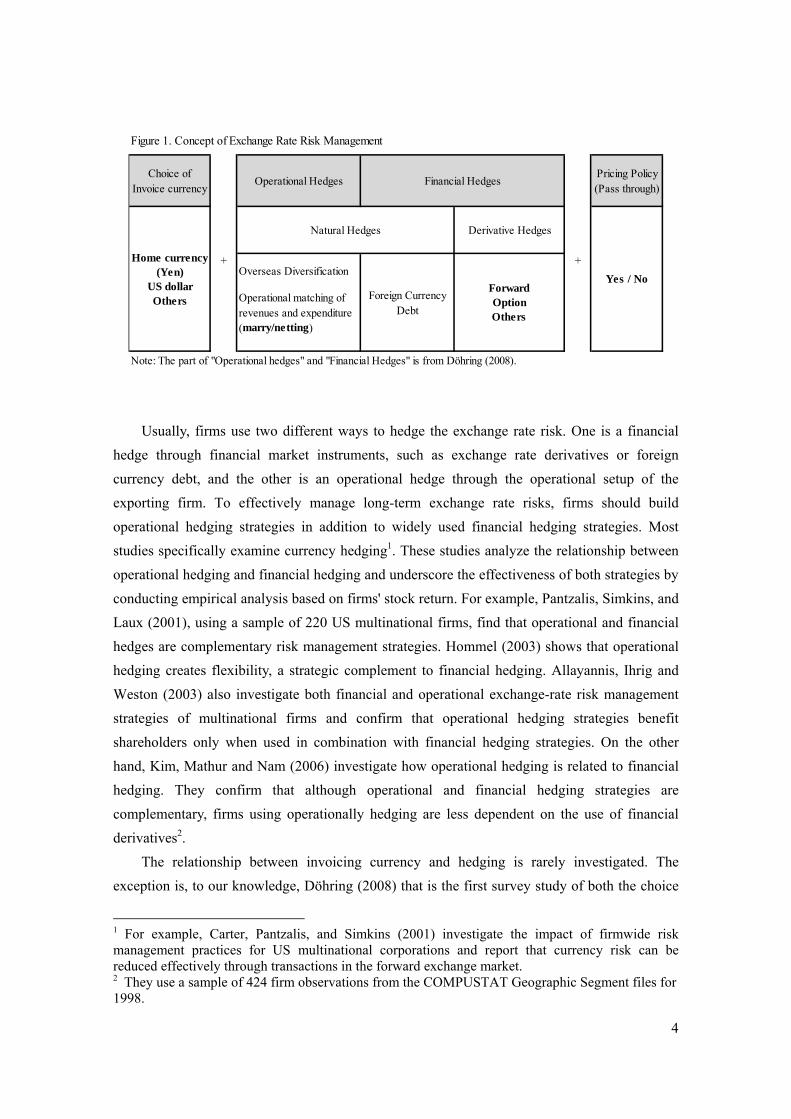
foreign exchange rate risk. Figure 1 shows a conceptual diagram of corporate exchange rate risk
management by partly employing the framework of Döhring (2008).
4
Usually, firms use two different ways to hedge the exchange rate risk. One is a financial
hedge through financial market instruments, such as exchange rate derivatives or foreign
currency debt, and the other is an operational hedge through the operational setup of the
exporting firm. To effectively manage long-term exchange rate risks, firms should build
operational hedging strategies in addition to widely used financial hedging strategies. Most
studies specifically examine currency hedging1. These studies analyze the relationship between
operational hedging and financial hedging and underscore the effectiveness of both strategies by
conducting empirical analysis based on firms' stock return. For example, Pantzalis, Simkins, and
Laux (2001), using a sample of 220 US multinational firms, find that operational and financial
hedges are complementary risk management strategies. Hommel (2003) shows that operational
hedging creates flexibility, a strategic complement to financial hedging. Allayannis, Ihrig and
Weston (2003) also investigate both financial and operational exchange-rate risk management
strategies of multinational firms and confirm that operational hedging strategies benefit
shareholders only when used in combination with financial hedging strategies. On the other
hand, Kim, Mathur and Nam (2006) investigate how operational hedging is related to financial
hedging. They confirm that although operational and financial hedging strategies are
complementary, firms using operationally hedging are less dependent on the use of financial
derivatives2.
The relationship between invoicing currency and hedging is rarely investigated. The
exception is, to our knowledge, Döhring (2008) that is the first survey study of both the choice
1 For example, Carter, Pantzalis, and Simkins (2001) investigate the impact of firmwide risk management practices for US multinational corporations and report that currency risk can be reduced effectively through transactions in the forward exchange market. 2 They use a sample of 424 firm observations from the COMPUSTAT Geographic Segment files for 1998.
Figure 1. Concept of Exchange Rate Risk Management
Note: The part of "Operational hedges" and "Financial Hedges" is from Döhring (2008).
+ +
Natural Hedges
Financial Hedges
ForwardOptionOthers
Foreign CurrencyDebt
Pricing Policy(Pass through)
Yes / No
Operational Hedges
Operational matching ofrevenues and expenditure(marry/netting)
Derivative Hedges
Choice ofInvoice currency
Home currency(Yen)
US dollarOthers
Overseas Diversification
5
of invoicing currency and financial/operational hedging. It is shown that invoicing choice is
substitute to derivative hedging such as exchange rate forward in eliminating transaction risk
and also that firms would be expected to opt for either of them depending on the relative cost
of these strategies. Conducting a survey of actual hedging strategies and techniques of large
corporations from a euro-area perspective, Döhring (2008) concludes that whether a domestic
currency invoicing and hedging are substitutes or complements depends crucially on the size
and geographical orientation of the exporting firm and on the structure of the destination
market.
Regarding the relationship between pass-through and hedging, Bartram, Brown and Minton
(2010) shows empirically that firms pass-through some porting of currency changes to
customers and use both operational and financial hedges for the remainder of foreign exchange
exposure. They assume that corporate financial managers can use pricing (pass-through) policy,
operational hedging and financial hedging strategies to mitigate the impact of currency
fluctuations. Using a sample of 1,150 manufacturing firms in 16 countries, it is empirically
shown that pass-through and operational hedging each reduce exposure by 10–15% whereas
financial hedging with foreign debt lowers exposure by 40%.
As for recent country specific studies, Chiand and Lin (2007) examine financial and
operational hedge strategies of foreign exchange exposures using multiple-horizon data of
Taiwan non-financial firms during 1998–2005 and find that the use of operational hedging
strategies does not help reduce foreign exchange exposures for Taiwan firms. Pramborg (2005)
compares the hedging practices between Swedish and Korean nonfinancial firms and shows that
Korean firms used much smaller financial derivatives than Swedish firms with more
dependence on foreign debt than derivatives. Both studies indicate that the difficulties of
exchange rate risk management in underdeveloped foreign exchange market like Taiwan and
Korea. Although Japanese exporting firms tend to face large volatility of yen/US dollar
exchange rate, surprisingly few studies conduct firm level analysis of hedging and exchange rate
risk management of Japanese firms3.
2-2. Japanese Firms' Feature of Currency Invoicing and Pricing Policy
Japan is well-known for its unique pattern of the choice of trade invoice currency, which is
an overdependence of the US dollar invoicing in spite of an economically advanced country.
According to the "stylized facts" on the choice of invoice currency based on the empirical
3 As for a research using Japanese data, Jayasinghe and Tsui (2008) examine the exchange rate exposure of sectoral indexes in Japanese industries and report significant evidence of exposed returns and its asymmetric conditional volatility of exchange rate exposure by employing a bivariate GJR-GARCH model.
6
research in the 1970s such as Grassman (1973) and Page (1977), trade between two
economically advanced countries tends to be invoiced in the exporter's currency. Trade between
economically advanced and economically developing countries is generally invoiced in the
economically advanced country’s currency. However, Japan’s currency invoicing pattern
evidently contradicts the stylized facts. First, Japanese exporters have a strong tendency to
choose importer’s currency for their exports to economically advanced countries such as the
United States and EU. Second, US dollar invoicing is prevalent in Japan’s exports to Asia.
There has been growing literature on the determinants of currency invoicing. Then they
typically use the data on the share of currency invoicing at a country level, however, there were
not many empirical studies of Japanese firms level4. One of the latest exceptions is Ito et al.
(2012), which employed an interview survey of leading Japanese exporters to overcome the data
constraint5. Because of the interview survey related to about the firm-level information related
to the exchange rate risk management, the destination breakdown data on the choice of invoice
currency, and the underlying reason for their invoicing choice, Ito et. al. (2010) confirmed new
determinants of Japanese firms' invoice currency as follows: (1) export channel of the type , for
instance, intra-firm trade, inter-firm trade, or trade via a trading company; (2) each currency's
transaction cost; (3) the intensity of competition in the export destination markets and the
degree of product differentiation; and (4) the structure of production and distribution network in
which goods are produced in Asia and shipped to the United States as the final destination.
In the case of intra-firm trade, importer’s currency invoicing is prevalent in Japanese
exports to economically advanced countries. Because the exports are destined for local
subsidiaries that face severe competition in the local markets, Japanese parent firms have a
strong tendency to take an exchange rate risk by invoicing in the importer’s currency. It also
makes economic sense to concentrate currency risk at the headquarters, because it is better
equipped with risk management expertise and with scale economies. Especially if the local
subsidiaries are production base and their final destination is US, their choice of US dollar
invoicing is rational as a part of their strategy of exchange rate risk management.
On one hand, some Japanese firms that export highly differentiated products or have a
dominant share in global markets choose yen invoicing. In addition, the small size firms, that
have no their own treasury department because of a budget constraint, usually ask a trading
4 Goldberg and Tille (2009) used highly detailed Canadian import data at a customs level with rich information on the source country, invoice currency, value of transactions, etc. In addition, Friberg and Wilander (2008) conducted a questionnaire survey analysis with Swedish exporting firms for empirical tests on determinants of currency invoicing, which is a useful approach to obtain detailed data at a firm level. 5 Ito et al.(2012) interviewed the treasurers of 23 Japanese companies from four major export industries (automobile, electrical machinery, general machinery, and electronic components) over the one-year period between autumn 2007 and autumn 2008.

7
company to manage their foreign exchange business. In this case, they also tend to use yen
invoicing in their transactions with a trading company. Accordingly, Japanese firms' choice of
invoice currency is rather complicated, but should be considered with other risk management
tools.
Japanese firms' strong tendency of invoicing in the importer’s currency is consistent with
the pricing-to-market (PTM) behavior discussed in the literature. As Goldberg and Tille (2004)
show, currency invoicing choice affects the degree of pass-through. Theoretically, pass-through
is unity under the producer currency pricing (PCP) if prices are fixed, although pass-though is
zero under the local currency pricing (LCP) in the short run. Empirically, however, firms adjust
their prices in response to the movement of exchange rates. For example, if Japanese exporters
choose US dollar invoicing (LCP) and raise their prices according to the yen's appreciation, then
the pass-through effect of yen/dollar exchange rate increases from zero. In contrast, if Japanese
exporters choose yen invoicing (PCP) and lower their prices according to the yen's appreciation,
then the pass-through effect decreases from unity. Whether they can raise the price (in the case
of LCP) or keep the price unchanged (in the case of PCP) to secure their constant revenue in
terms of the home currency or not depends on the degree of competition they face, in other
words, how differentiated the products are that they export. Furthermore, firms' price revision
depends on how effectively they hedge their exchange rate risk in advance.
Similar to Bartram, Brown and Minton (2010), we assume that Japanese firms have four
options of exchange rate risk management: (1) choice of invoice currency, (2) pricing
(pass-through) policy, (3) operational hedging, and (4) financial hedging, to mitigate the impact
of currency fluctuations, based on which we analyze the results of 2009 RIET survey to clarify
the notable characteristics of the Japanese firms’ exchange rate risk management.
Compared with the related studies described above, the novelties of this paper are
three-fold: (i) This is the first detailed investigation of the exchange rate risk management of
Japanese firms from three different tools, such as invoicing currency choice, pricing (pass
through) strategy and financial/operational hedging policy; (ii) Each exchange rate risk
management policy is analyzed by firm size, (iii) The robustness of each exchange rate risk
management policy is scored and compared by firm size.
3. Questionnaire Survey – the Case of Japanese Exporters’ risk management
In this section, we present the results of 2009 RIETI Survey related to Japanese firms'
exchange rate risk management. To elucidate their features, we classify our results by the firm
size. Regarding the size, we set two different measures, firm size, and the foreign sales ratio.
8
The former is a category based on total consolidated sales immediately before the survey
(mostly as of March 2009) that splits all listed manufacturers into three categories consisting of
large (upper 1/3), medium (middle 1/3), and small (lower 1/3). The latter is also a category
based on foreign sales ratio (total foreign sales / total consolidated sales) splitting all listed
manufacturers into high (upper 1/3), medium (middle 1/3), and low (lower 1/3).
3-1. Share of Currency Invoicing in Japanese Exports to the World
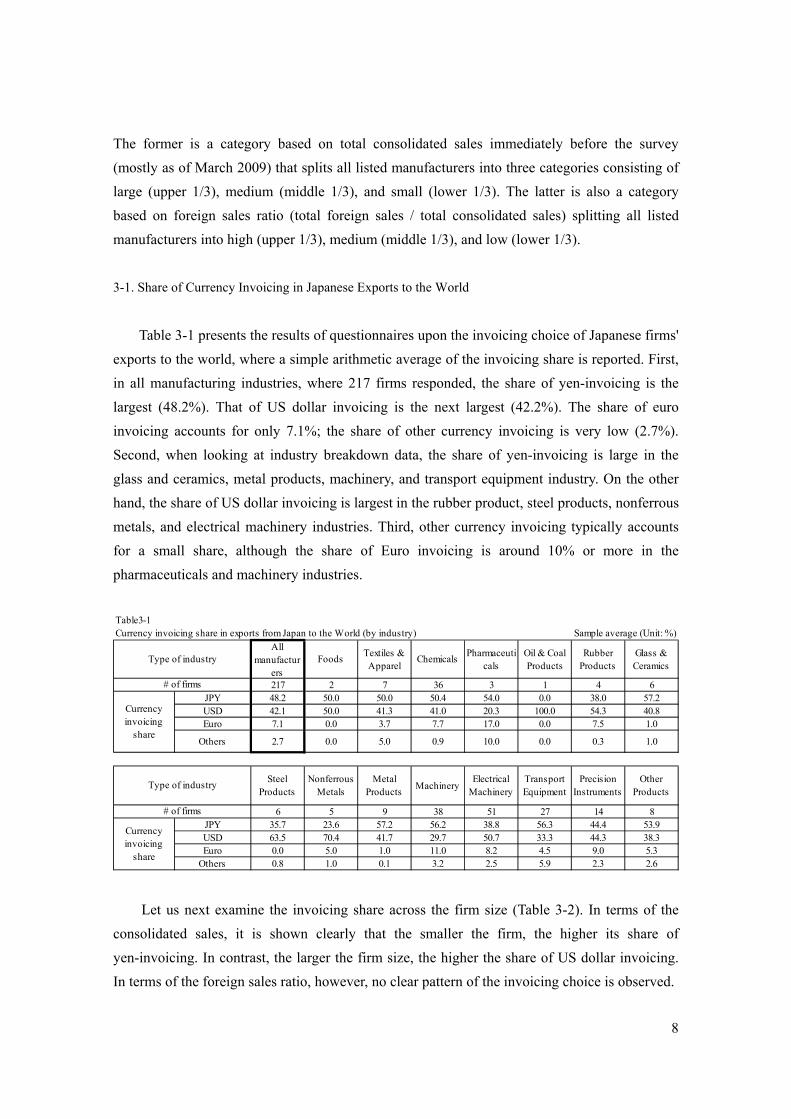
Table 3-1 presents the results of questionnaires upon the invoicing choice of Japanese firms'
exports to the world, where a simple arithmetic average of the invoicing share is reported. First,
in all manufacturing industries, where 217 firms responded, the share of yen-invoicing is the
largest (48.2%). That of US dollar invoicing is the next largest (42.2%). The share of euro
invoicing accounts for only 7.1%; the share of other currency invoicing is very low (2.7%).
Second, when looking at industry breakdown data, the share of yen-invoicing is large in the
glass and ceramics, metal products, machinery, and transport equipment industry. On the other
hand, the share of US dollar invoicing is largest in the rubber product, steel products, nonferrous
metals, and electrical machinery industries. Third, other currency invoicing typically accounts
for a small share, although the share of Euro invoicing is around 10% or more in the
pharmaceuticals and machinery industries.
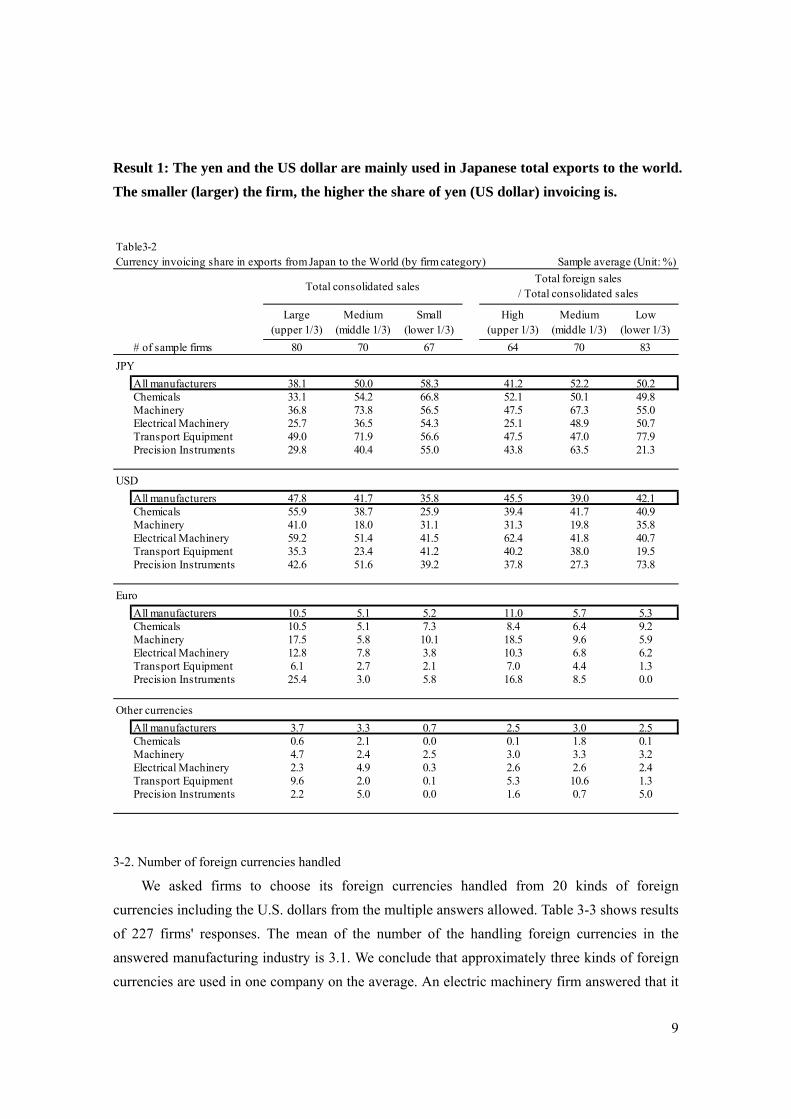
Let us next examine the invoicing share across the firm size (Table 3-2). In terms of the
consolidated sales, it is shown clearly that the smaller the firm, the higher its share of
yen-invoicing. In contrast, the larger the firm size, the higher the share of US dollar invoicing.
In terms of the foreign sales ratio, however, no clear pattern of the invoicing choice is observed.
Table3-1Currency invoicing share in exports from Japan to the World (by industry)
Allmanufactur
ersFoods
Textiles &Apparel
ChemicalsPharmaceuti
calsOil & CoalProducts
RubberProducts
Glass &Ceramics
217 2 7 36 3 1 4 6JPY 48.2 50.0 50.0 50.4 54.0 0.0 38.0 57.2USD 42.1 50.0 41.3 41.0 20.3 100.0 54.3 40.8Euro 7.1 0.0 3.7 7.7 17.0 0.0 7.5 1.0
Others 2.7 0.0 5.0 0.9 10.0 0.0 0.3 1.0
SteelProducts
NonferrousMetals
MetalProducts
MachineryElectrical
MachineryTransportEquipment
PrecisionInstruments
OtherProducts
6 5 9 38 51 27 14 8JPY 35.7 23.6 57.2 56.2 38.8 56.3 44.4 53.9USD 63.5 70.4 41.7 29.7 50.7 33.3 44.3 38.3Euro 0.0 5.0 1.0 11.0 8.2 4.5 9.0 5.3
Others 0.8 1.0 0.1 3.2 2.5 5.9 2.3 2.6
Currencyinvoicing
share
Sample average (Unit: %)
Type of industry
# of firms
Currencyinvoicing
share
Type of industry
# of firms
9
Result 1: The yen and the US dollar are mainly used in Japanese total exports to the world.
The smaller (larger) the firm, the higher the share of yen (US dollar) invoicing is.
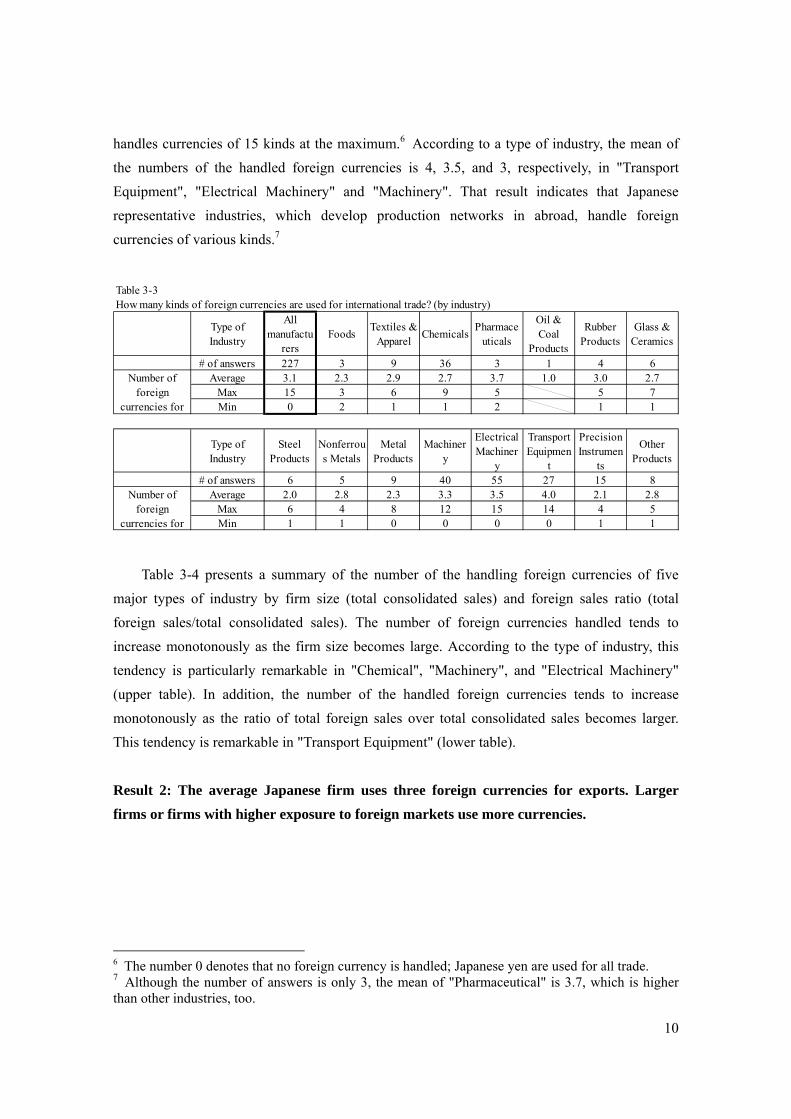
3-2. Number of foreign currencies handled
We asked firms to choose its foreign currencies handled from 20 kinds of foreign
currencies including the U.S. dollars from the multiple answers allowed. Table 3-3 shows results
of 227 firms' responses. The mean of the number of the handling foreign currencies in the
answered manufacturing industry is 3.1. We conclude that approximately three kinds of foreign
currencies are used in one company on the average. An electric machinery firm answered that it
Table3-2Currency invoicing share in exports from Japan to the World (by firm category)
Large(upper 1/3)
Medium(middle 1/3)
Small(lower 1/3)
High(upper 1/3)
Medium(middle 1/3)
Low(lower 1/3)
# of sample firms 80 70 67 64 70 83
JPY
All manufacturers 38.1 50.0 58.3 41.2 52.2 50.2Chemicals 33.1 54.2 66.8 52.1 50.1 49.8Machinery 36.8 73.8 56.5 47.5 67.3 55.0Electrical Machinery 25.7 36.5 54.3 25.1 48.9 50.7Transport Equipment 49.0 71.9 56.6 47.5 47.0 77.9Precision Instruments 29.8 40.4 55.0 43.8 63.5 21.3
USD
All manufacturers 47.8 41.7 35.8 45.5 39.0 42.1Chemicals 55.9 38.7 25.9 39.4 41.7 40.9Machinery 41.0 18.0 31.1 31.3 19.8 35.8Electrical Machinery 59.2 51.4 41.5 62.4 41.8 40.7Transport Equipment 35.3 23.4 41.2 40.2 38.0 19.5Precision Instruments 42.6 51.6 39.2 37.8 27.3 73.8
Euro
All manufacturers 10.5 5.1 5.2 11.0 5.7 5.3Chemicals 10.5 5.1 7.3 8.4 6.4 9.2Machinery 17.5 5.8 10.1 18.5 9.6 5.9Electrical Machinery 12.8 7.8 3.8 10.3 6.8 6.2Transport Equipment 6.1 2.7 2.1 7.0 4.4 1.3Precision Instruments 25.4 3.0 5.8 16.8 8.5 0.0
Other currencies
All manufacturers 3.7 3.3 0.7 2.5 3.0 2.5Chemicals 0.6 2.1 0.0 0.1 1.8 0.1Machinery 4.7 2.4 2.5 3.0 3.3 3.2Electrical Machinery 2.3 4.9 0.3 2.6 2.6 2.4Transport Equipment 9.6 2.0 0.1 5.3 10.6 1.3Precision Instruments 2.2 5.0 0.0 1.6 0.7 5.0
Sample average (Unit: %)
Total consolidated salesTotal foreign sales
/ Total consolidated sales
10
handles currencies of 15 kinds at the maximum.6 According to a type of industry, the mean of
the numbers of the handled foreign currencies is 4, 3.5, and 3, respectively, in "Transport
Equipment", "Electrical Machinery" and "Machinery". That result indicates that Japanese
representative industries, which develop production networks in abroad, handle foreign
currencies of various kinds.7
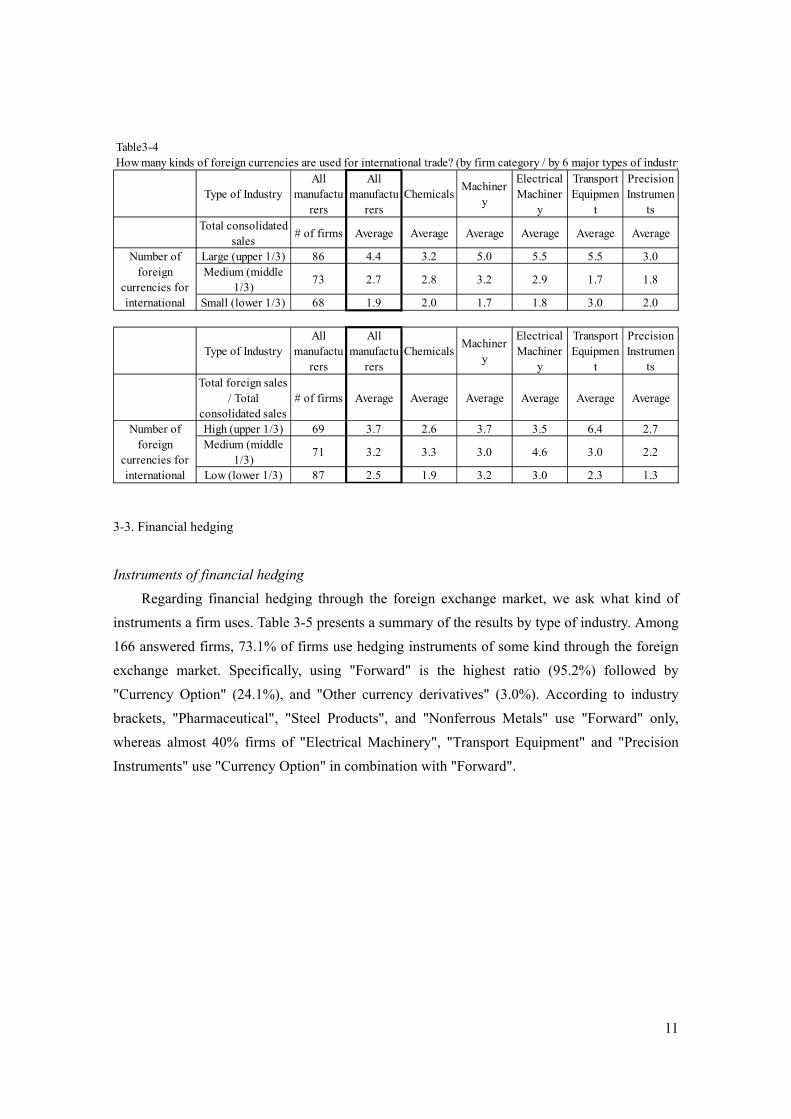
Table 3-4 presents a summary of the number of the handling foreign currencies of five
major types of industry by firm size (total consolidated sales) and foreign sales ratio (total
foreign sales/total consolidated sales). The number of foreign currencies handled tends to
increase monotonously as the firm size becomes large. According to the type of industry, this
tendency is particularly remarkable in "Chemical", "Machinery", and "Electrical Machinery"
(upper table). In addition, the number of the handled foreign currencies tends to increase
monotonously as the ratio of total foreign sales over total consolidated sales becomes larger.
This tendency is remarkable in "Transport Equipment" (lower table).
Result 2: The average Japanese firm uses three foreign currencies for exports. Larger
firms or firms with higher exposure to foreign markets use more currencies.
6 The number 0 denotes that no foreign currency is handled; Japanese yen are used for all trade. 7 Although the number of answers is only 3, the mean of "Pharmaceutical" is 3.7, which is higher than other industries, too.
Table 3-3How many kinds of foreign currencies are used for international trade? (by industry)
Type ofIndustry
Allmanufactu
rersFoods
Textiles &Apparel
ChemicalsPharmace
uticals
Oil &Coal
Products
RubberProducts
Glass &Ceramics
# of answers 227 3 9 36 3 1 4 6Average 3.1 2.3 2.9 2.7 3.7 1.0 3.0 2.7
Max 15 3 6 9 5 5 7Min 0 2 1 1 2 1 1
Type ofIndustry
SteelProducts
Nonferrous Metals
MetalProducts
Machinery
ElectricalMachiner
y
TransportEquipmen
t
PrecisionInstrumen
ts
OtherProducts
# of answers 6 5 9 40 55 27 15 8Average 2.0 2.8 2.3 3.3 3.5 4.0 2.1 2.8
Max 6 4 8 12 15 14 4 5Min 1 1 0 0 0 0 1 1
Number offoreign
currencies for
Number offoreign
currencies for
11
3-3. Financial hedging
Instruments of financial hedging
Regarding financial hedging through the foreign exchange market, we ask what kind of
instruments a firm uses. Table 3-5 presents a summary of the results by type of industry. Among
166 answered firms, 73.1% of firms use hedging instruments of some kind through the foreign
exchange market. Specifically, using "Forward" is the highest ratio (95.2%) followed by
"Currency Option" (24.1%), and "Other currency derivatives" (3.0%). According to industry
brackets, "Pharmaceutical", "Steel Products", and "Nonferrous Metals" use "Forward" only,
whereas almost 40% firms of "Electrical Machinery", "Transport Equipment" and "Precision
Instruments" use "Currency Option" in combination with "Forward".
Table3-4How many kinds of foreign currencies are used for international trade? (by firm category / by 6 major types of industry
Type of IndustryAll
manufacturers
Allmanufactu
rersChemicals
Machinery
ElectricalMachiner
y
TransportEquipmen
t
PrecisionInstrumen
tsTotal consolidated
sales# of firms Average Average Average Average Average Average
Large (upper 1/3) 86 4.4 3.2 5.0 5.5 5.5 3.0Medium (middle
1/3)73 2.7 2.8 3.2 2.9 1.7 1.8
Small (lower 1/3) 68 1.9 2.0 1.7 1.8 3.0 2.0
Type of IndustryAll
manufacturers
Allmanufactu
rersChemicals
Machinery
ElectricalMachiner
y
TransportEquipmen
t
PrecisionInstrumen
tsTotal foreign sales
/ Totalconsolidated sales
# of firms Average Average Average Average Average Average
High (upper 1/3) 69 3.7 2.6 3.7 3.5 6.4 2.7Medium (middle
1/3)71 3.2 3.3 3.0 4.6 3.0 2.2
Low (lower 1/3) 87 2.5 1.9 3.2 3.0 2.3 1.3
Number offoreign
currencies forinternational
Number offoreign
currencies forinternational

12
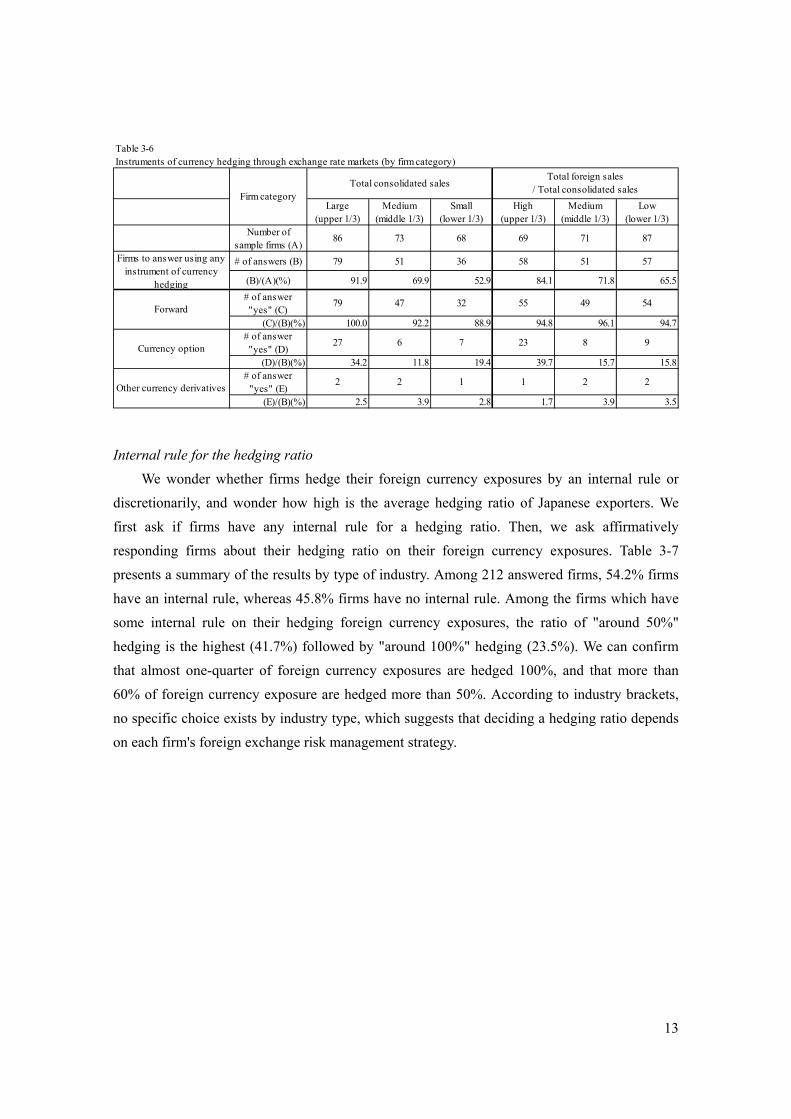
In Table 3-6, we present a summary of results above by firm size (total consolidated sales)
and foreign sales ratio (total foreign sales/total consolidated sales). The ratio of using some kind
of currency hedging instruments increases monotonously as a firm size becomes greater. In
addition, the ratio of using "Forward" and "Currency Option" tends to become higher as a firm
size becomes larger. Firms with large consolidated sales or large foreign sales actively use
currency hedging instruments through foreign exchange markets.
Result 3: Around three quarters of Japanese firms use some foreign exchange hedging
instruments through the foreign exchange market. Larger firms or firms with higher
exposure to foreign markets use more hedging instruments for their foreign exchange risk
management.
Table 3-5Instruments of currency hedging through exchange rate markets (by industry)
Type of industryAll
manufacturers
FoodsTextiles &Apparel
ChemicalsPharmaceuti
calsOil & CoalProducts
RubberProducts
Glass &Ceramics
Number of sample firms(A)
227 3 9 36 3 1 4 6
# of answers (B) 166 3 8 24 3 1 3 4
(B)/(A)(%) 73.1 100.0 88.9 66.7 100.0 100.0 75.0 66.7
# of answer "yes" (C) 158 2 8 24 3 1 2 4(C)/(B)(%) 95.2 66.7 100.0 100.0 100.0 100.0 66.7 100.0
# of answer "yes" (D) 40 1 1 4 0 1 1 2(D)/(B)(%) 24.1 33.3 12.5 16.7 0.0 100.0 33.3 50.0
# of answer "yes" (E) 5 1 0 2 0 0 0 0(E)/(B)(%) 3.0 33.3 0.0 8.3 0.0 0.0 0.0 0.0
Type of industrySteel
ProductsNonferrous
MetalsMetal
ProductsMachinery
ElectricalMachinery
TransportEquipment
PrecisionInstruments
OtherProducts
Number of sample firms(A)
6 5 9 40 55 27 15 8
# of answers (B) 4 4 3 33 42 18 9 7
(B)/(A)(%) 66.7 80.0 33.3 82.5 76.4 66.7 60.0 87.5
# of answer "yes" (C) 4 4 3 32 38 18 8 7(C)/(B)(%) 100.0 100.0 100.0 97.0 90.5 100.0 88.9 100.0
# of answer "yes" (D) 0 0 1 4 13 7 4 1(D)/(B)(%) 0.0 0.0 33.3 12.1 31.0 38.9 44.4 14.3
# of answer "yes" (E) 0 0 0 0 2 0 0 0(E)/(B)(%) 0.0 0.0 0.0 0.0 4.8 0.0 0.0 0.0
Currency option
Other currencyderivatives
Firms to answer anyinstrument of
currency hedging
Forward
Currency option
Other currencyderivatives
Firms to answer anyinstrument of
currency hedging
Forward
13
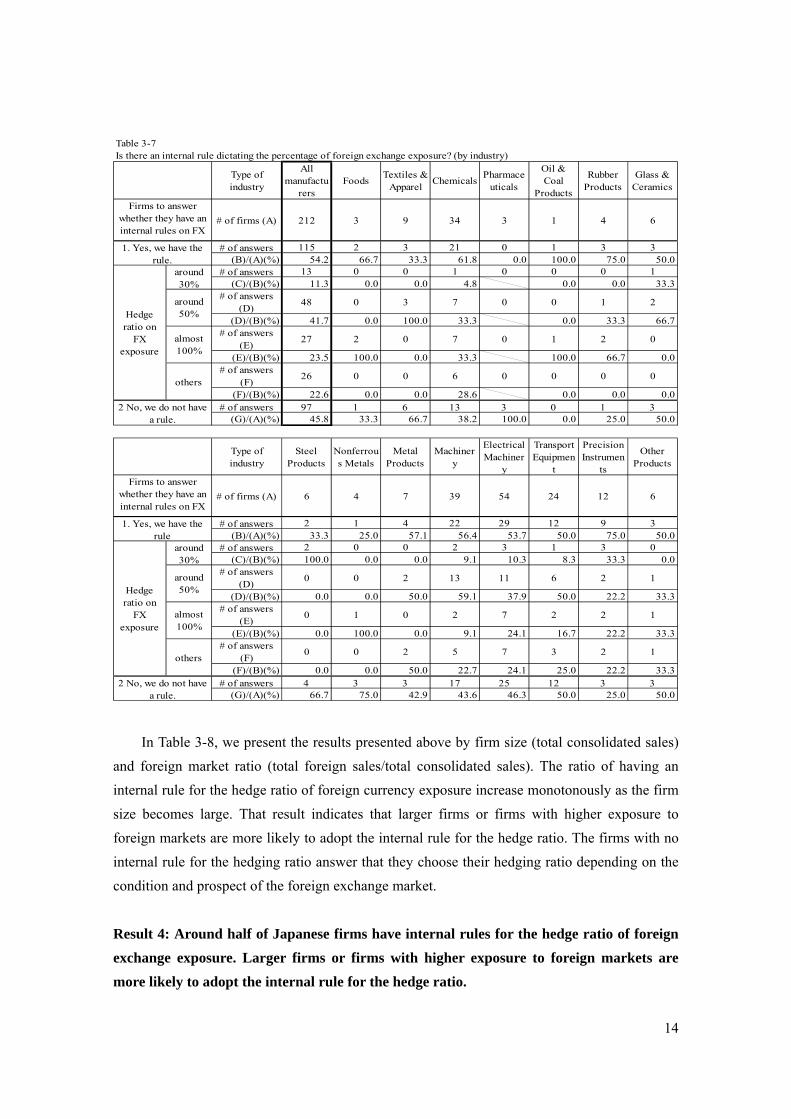
Internal rule for the hedging ratio
We wonder whether firms hedge their foreign currency exposures by an internal rule or
discretionarily, and wonder how high is the average hedging ratio of Japanese exporters. We
first ask if firms have any internal rule for a hedging ratio. Then, we ask affirmatively
responding firms about their hedging ratio on their foreign currency exposures. Table 3-7
presents a summary of the results by type of industry. Among 212 answered firms, 54.2% firms
have an internal rule, whereas 45.8% firms have no internal rule. Among the firms which have
some internal rule on their hedging foreign currency exposures, the ratio of "around 50%"
hedging is the highest (41.7%) followed by "around 100%" hedging (23.5%). We can confirm
that almost one-quarter of foreign currency exposures are hedged 100%, and that more than
60% of foreign currency exposure are hedged more than 50%. According to industry brackets,
no specific choice exists by industry type, which suggests that deciding a hedging ratio depends
on each firm's foreign exchange risk management strategy.
Table 3-6Instruments of currency hedging through exchange rate markets (by firm category)
Large(upper 1/3)
Medium(middle 1/3)
Small(lower 1/3)
High(upper 1/3)
Medium(middle 1/3)
Low(lower 1/3)
Number ofsample firms (A)
86 73 68 69 71 87
# of answers (B) 79 51 36 58 51 57
(B)/(A)(%) 91.9 69.9 52.9 84.1 71.8 65.5
# of answer"yes" (C)
79 47 32 55 49 54
(C)/(B)(%) 100.0 92.2 88.9 94.8 96.1 94.7# of answer"yes" (D)
27 6 7 23 8 9
(D)/(B)(%) 34.2 11.8 19.4 39.7 15.7 15.8# of answer
"yes" (E)2 2 1 1 2 2
(E)/(B)(%) 2.5 3.9 2.8 1.7 3.9 3.5
Firm categoryTotal consolidated sales
Total foreign sales/ Total consolidated sales
Firms to answer using anyinstrument of currency
hedging
Forward
Currency option
Other currency derivatives
14
In Table 3-8, we present the results presented above by firm size (total consolidated sales)
and foreign market ratio (total foreign sales/total consolidated sales). The ratio of having an
internal rule for the hedge ratio of foreign currency exposure increase monotonously as the firm
size becomes large. That result indicates that larger firms or firms with higher exposure to
foreign markets are more likely to adopt the internal rule for the hedge ratio. The firms with no
internal rule for the hedging ratio answer that they choose their hedging ratio depending on the
condition and prospect of the foreign exchange market.
Result 4: Around half of Japanese firms have internal rules for the hedge ratio of foreign
exchange exposure. Larger firms or firms with higher exposure to foreign markets are
more likely to adopt the internal rule for the hedge ratio.
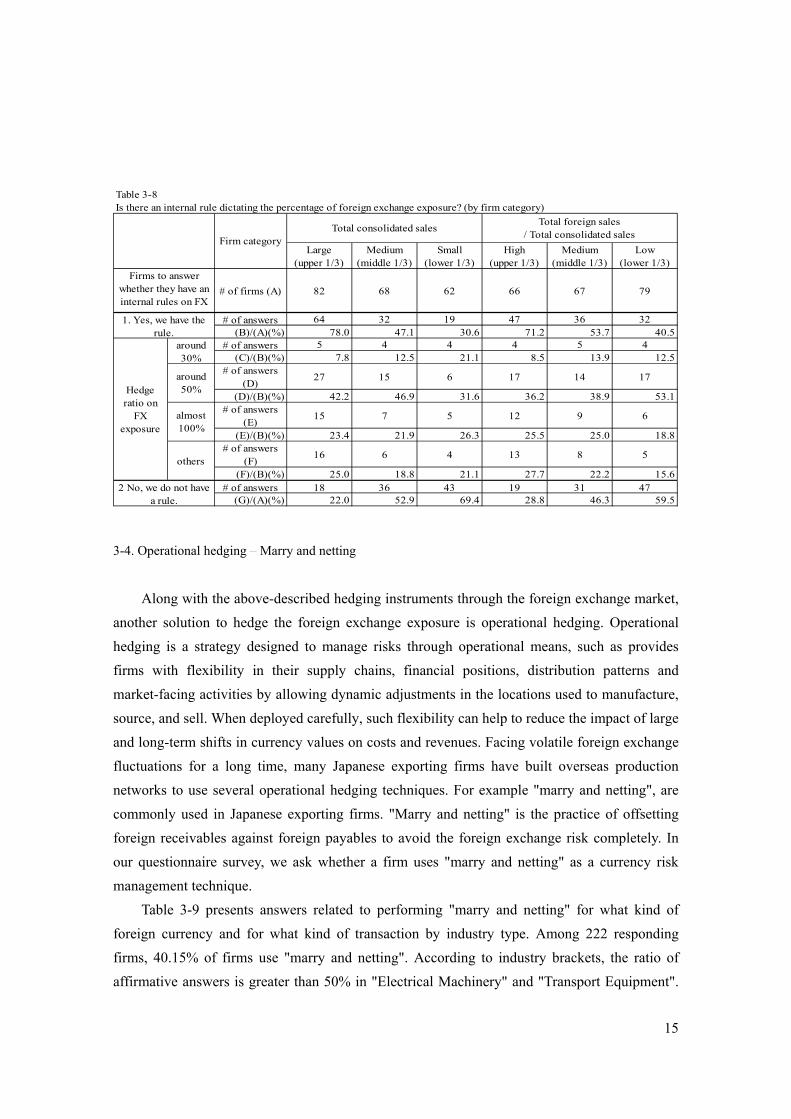
Table 3-7Is there an internal rule dictating the percentage of foreign exchange exposure? (by industry)
Type ofindustry
Allmanufactu
rersFoods
Textiles &Apparel
ChemicalsPharmace
uticals
Oil &Coal
Products
RubberProducts
Glass &Ceramics
# of firms (A) 212 3 9 34 3 1 4 6
# of answers 115 2 3 21 0 1 3 3(B)/(A)(%) 54.2 66.7 33.3 61.8 0.0 100.0 75.0 50.0
# of answers 13 0 0 1 0 0 0 1(C)/(B)(%) 11.3 0.0 0.0 4.8 0.0 0.0 33.3
# of answers(D)
48 0 3 7 0 0 1 2
(D)/(B)(%) 41.7 0.0 100.0 33.3 0.0 33.3 66.7# of answers
(E)27 2 0 7 0 1 2 0
(E)/(B)(%) 23.5 100.0 0.0 33.3 100.0 66.7 0.0# of answers
(F)26 0 0 6 0 0 0 0
(F)/(B)(%) 22.6 0.0 0.0 28.6 0.0 0.0 0.0# of answers 97 1 6 13 3 0 1 3
(G)/(A)(%) 45.8 33.3 66.7 38.2 100.0 0.0 25.0 50.0
Type ofindustry
SteelProducts
Nonferrous Metals
MetalProducts
Machinery
ElectricalMachiner
y
TransportEquipmen
t
PrecisionInstrumen
ts
OtherProducts
# of firms (A) 6 4 7 39 54 24 12 6
# of answers 2 1 4 22 29 12 9 3(B)/(A)(%) 33.3 25.0 57.1 56.4 53.7 50.0 75.0 50.0
# of answers 2 0 0 2 3 1 3 0(C)/(B)(%) 100.0 0.0 0.0 9.1 10.3 8.3 33.3 0.0
# of answers(D)
0 0 2 13 11 6 2 1
(D)/(B)(%) 0.0 0.0 50.0 59.1 37.9 50.0 22.2 33.3# of answers
(E)0 1 0 2 7 2 2 1
(E)/(B)(%) 0.0 100.0 0.0 9.1 24.1 16.7 22.2 33.3# of answers
(F)0 0 2 5 7 3 2 1
(F)/(B)(%) 0.0 0.0 50.0 22.7 24.1 25.0 22.2 33.3# of answers 4 3 3 17 25 12 3 3
(G)/(A)(%) 66.7 75.0 42.9 43.6 46.3 50.0 25.0 50.02 No, we do not have
a rule.
2 No, we do not havea rule.
Firms to answerwhether they have aninternal rules on FX
1. Yes, we have therule
Hedgeratio on
FXexposure
around30%
around50%
almost100%
others
Firms to answerwhether they have aninternal rules on FX
1. Yes, we have therule.
Hedgeratio on
FXexposure
around30%
around50%
almost100%
others
15
3-4. Operational hedging – Marry and netting
Along with the above-described hedging instruments through the foreign exchange market,
another solution to hedge the foreign exchange exposure is operational hedging. Operational
hedging is a strategy designed to manage risks through operational means, such as provides
firms with flexibility in their supply chains, financial positions, distribution patterns and
market-facing activities by allowing dynamic adjustments in the locations used to manufacture,
source, and sell. When deployed carefully, such flexibility can help to reduce the impact of large
and long-term shifts in currency values on costs and revenues. Facing volatile foreign exchange
fluctuations for a long time, many Japanese exporting firms have built overseas production
networks to use several operational hedging techniques. For example "marry and netting", are
commonly used in Japanese exporting firms. "Marry and netting" is the practice of offsetting
foreign receivables against foreign payables to avoid the foreign exchange risk completely. In
our questionnaire survey, we ask whether a firm uses "marry and netting" as a currency risk
management technique.
Table 3-9 presents answers related to performing "marry and netting" for what kind of
foreign currency and for what kind of transaction by industry type. Among 222 responding
firms, 40.15% of firms use "marry and netting". According to industry brackets, the ratio of
affirmative answers is greater than 50% in "Electrical Machinery" and "Transport Equipment".
Table 3-8Is there an internal rule dictating the percentage of foreign exchange exposure? (by firm category)
Large(upper 1/3)
Medium(middle 1/3)
Small(lower 1/3)
High(upper 1/3)
Medium(middle 1/3)
Low(lower 1/3)
# of firms (A) 82 68 62 66 67 79
# of answers 64 32 19 47 36 32(B)/(A)(%) 78.0 47.1 30.6 71.2 53.7 40.5
# of answers 5 4 4 4 5 4(C)/(B)(%) 7.8 12.5 21.1 8.5 13.9 12.5
# of answers(D)
27 15 6 17 14 17
(D)/(B)(%) 42.2 46.9 31.6 36.2 38.9 53.1# of answers
(E)15 7 5 12 9 6
(E)/(B)(%) 23.4 21.9 26.3 25.5 25.0 18.8# of answers
(F)16 6 4 13 8 5
(F)/(B)(%) 25.0 18.8 21.1 27.7 22.2 15.6# of answers 18 36 43 19 31 47
(G)/(A)(%) 22.0 52.9 69.4 28.8 46.3 59.5
Hedgeratio on
FXexposure
around30%
around50%
almost100%
others
2 No, we do not havea rule.
Firm categoryTotal consolidated sales
Total foreign sales/ Total consolidated sales
Firms to answerwhether they have aninternal rules on FX
1. Yes, we have therule.

16
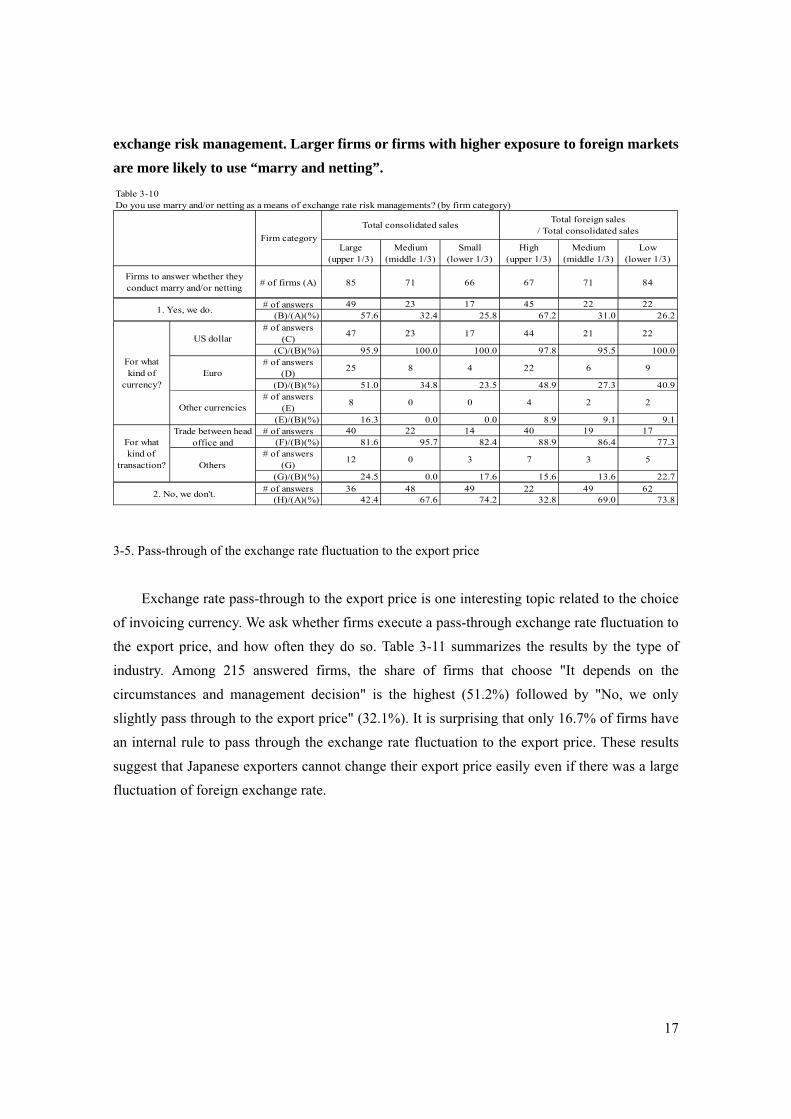
Regarding the target currency for marry and netting, the U.S. dollar is the highest (97.8%)
followed by the euro (41.6%). Furthermore, marry and netting is used mainly for trade between
the head office and subsidiaries (85.4%).
In Table 3-10, we summarize results presented above by firm size (total consolidated sales
and total foreign sales/total consolidated sales). The share of firms using "marry and netting"
increases monotonously as the total consolidated sales increase and the degree of the exposure
to the overseas markets becomes greater.
Result 5: Around 40% of Japanese firms use “marry and netting” as a means of foreign
Table 3-9Do you use marry and/or netting as a means of exchange rate risk managements? (by industry)
Type ofindustry
Allmanufact Foods
Textiles&
Chemicals
Pharmaceuticals
Oil &Coal
RubberProducts
Glass &Ceramics
# of firms (A) 222 3 9 36 3 1 4 6
# of answers 89 1 4 13 1 0 0 1(B)/(A)(%) 40.1 33.3 44.4 36.1 33.3 0.0 0.0 16.7
# of answers(C)
87 1 4 13 1 0 0 1
(C)/(B)(%) 97.8 100.0 100.0 100.0 100.0 100.0# of answers
(D)37 1 0 3 1 0 0 0
(D)/(B)(%) 41.6 100.0 0.0 23.1 100.0 0.0# of answers
(E)8 0 0 0 0 0 0 0
(E)/(B)(%) 9.0 0.0 0.0 0.0 0.0 0.0# of answers 76 0 3 11 1 0 0 1
(F)/(B)(%) 85.4 0.0 75.0 84.6 100.0 100.0# of answers
(G)15 1 1 2 0 0 0 0
(G)/(B)(%) 16.9 100.0 25.0 15.4 0.0 0.0# of answers 133 2 5 23 2 1 4 5
(H)/(A)(%) 59.9 66.7 55.6 63.9 66.7 100.0 100.0 83.3
Type ofindustry
SteelProducts
Nonferrous Metals
MetalProducts
Machinery
Electrical
Machinery
TransportEquipme
nt
PrecisionInstrume
nts
OtherProducts
# of firms (A) 6 5 9 39 55 25 13 8# of answers
(B)0 1 1 14 32 14 3 4
(B)/(A)(%) 0.0 20.0 11.1 35.9 58.2 56.0 23.1 50.0# of answers
(C)0 1 1 13 32 13 3 4
(C)/(B)(%) 100.0 100.0 92.9 100.0 92.9 100.0 100.0# of answers
(D)0 0 0 10 15 5 2 0
(D)/(B)(%) 0.0 0.0 71.4 46.9 35.7 66.7 0.0# of answers
(E)0 0 0 2 2 4 0 0
(E)/(B)(%) 0.0 0.0 14.3 6.3 28.6 0.0 0.0# of answers 0 1 1 14 26 11 3 4
(F)/(B)(%) 100.0 100.0 100.0 81.3 78.6 100.0 100.0# of answers
(G)0 0 0 0 5 6 0 0
(G)/(B)(%) 0.0 0.0 0.0 15.6 42.9 0.0 0.0# of answers
(H)6 4 8 25 23 11 10 4
(H)/(A)(%) 100.0 80.0 88.9 64.1 41.8 44.0 76.9 50.02. No, we don't.
For whatkind of
currency?
US dollar
Euro
Other currencies
For whatkind of
transaction?
Between headoffice and
Others
For whatkind of
transaction?
Trade between headoffice and
Others
2. No, we don't.
1. Yes, we do.
Firms to answer whether theyconduct marry and/or netting
1. Yes, we do.
For whatkind of
currency?
US dollar
Euro
Other currencies
17
exchange risk management. Larger firms or firms with higher exposure to foreign markets
are more likely to use “marry and netting”.
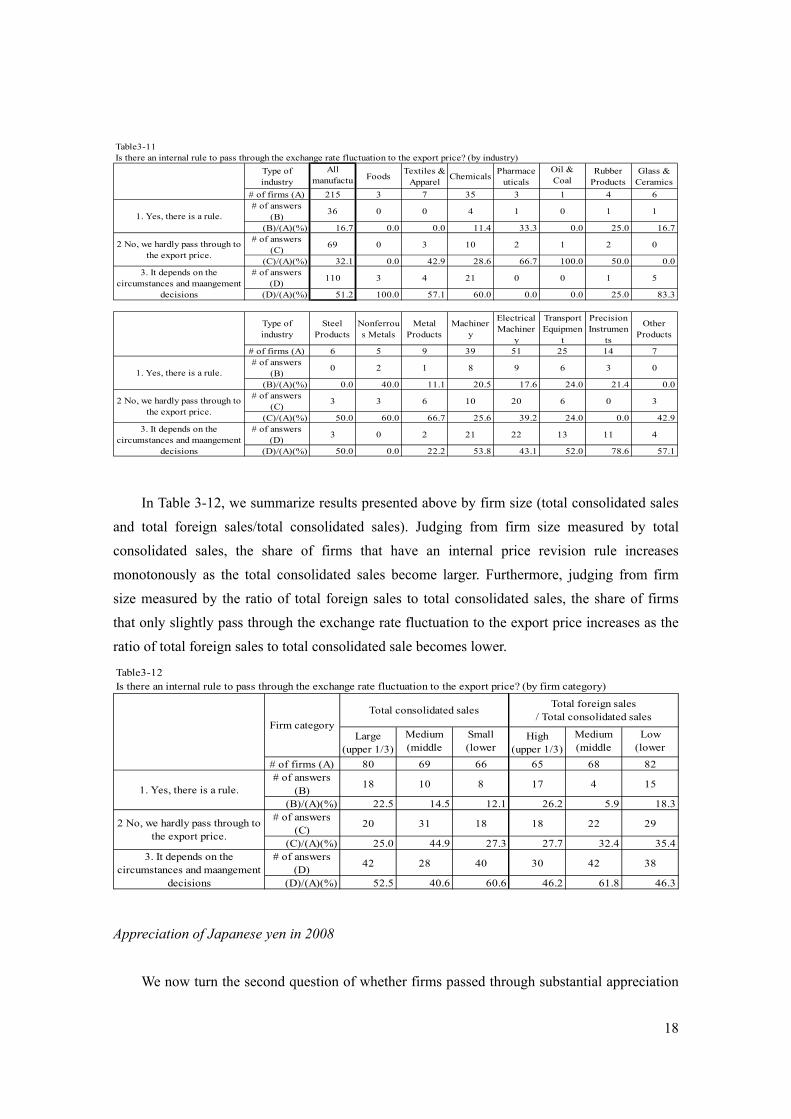
3-5. Pass-through of the exchange rate fluctuation to the export price
Exchange rate pass-through to the export price is one interesting topic related to the choice
of invoicing currency. We ask whether firms execute a pass-through exchange rate fluctuation to
the export price, and how often they do so. Table 3-11 summarizes the results by the type of
industry. Among 215 answered firms, the share of firms that choose "It depends on the
circumstances and management decision" is the highest (51.2%) followed by "No, we only
slightly pass through to the export price" (32.1%). It is surprising that only 16.7% of firms have
an internal rule to pass through the exchange rate fluctuation to the export price. These results
suggest that Japanese exporters cannot change their export price easily even if there was a large
fluctuation of foreign exchange rate.
Table 3-10Do you use marry and/or netting as a means of exchange rate risk managements? (by firm category)
Large(upper 1/3)
Medium(middle 1/3)
Small(lower 1/3)
High(upper 1/3)
Medium(middle 1/3)
Low(lower 1/3)
# of firms (A) 85 71 66 67 71 84
# of answers 49 23 17 45 22 22(B)/(A)(%) 57.6 32.4 25.8 67.2 31.0 26.2
# of answers(C)
47 23 17 44 21 22
(C)/(B)(%) 95.9 100.0 100.0 97.8 95.5 100.0# of answers
(D)25 8 4 22 6 9
(D)/(B)(%) 51.0 34.8 23.5 48.9 27.3 40.9# of answers
(E)8 0 0 4 2 2
(E)/(B)(%) 16.3 0.0 0.0 8.9 9.1 9.1# of answers 40 22 14 40 19 17
(F)/(B)(%) 81.6 95.7 82.4 88.9 86.4 77.3# of answers
(G)12 0 3 7 3 5
(G)/(B)(%) 24.5 0.0 17.6 15.6 13.6 22.7# of answers 36 48 49 22 49 62
(H)/(A)(%) 42.4 67.6 74.2 32.8 69.0 73.82. No, we don't.
For whatkind of
currency?
US dollar
Euro
Other currencies
For whatkind of
transaction?
Trade between headoffice and
Others
Firm category
Total consolidated salesTotal foreign sales
/ Total consolidated sales
Firms to answer whether theyconduct marry and/or netting
1. Yes, we do.
18
In Table 3-12, we summarize results presented above by firm size (total consolidated sales
and total foreign sales/total consolidated sales). Judging from firm size measured by total
consolidated sales, the share of firms that have an internal price revision rule increases
monotonously as the total consolidated sales become larger. Furthermore, judging from firm
size measured by the ratio of total foreign sales to total consolidated sales, the share of firms
that only slightly pass through the exchange rate fluctuation to the export price increases as the
ratio of total foreign sales to total consolidated sale becomes lower.
Appreciation of Japanese yen in 2008
We now turn the second question of whether firms passed through substantial appreciation
Table3-11Is there an internal rule to pass through the exchange rate fluctuation to the export price? (by industry)
Type ofindustry
Allmanufactu Foods
Textiles &Apparel
ChemicalsPharmace
uticals
Oil &Coal
RubberProducts
Glass &Ceramics
# of firms (A) 215 3 7 35 3 1 4 6# of answers
(B)36 0 0 4 1 0 1 1
(B)/(A)(%) 16.7 0.0 0.0 11.4 33.3 0.0 25.0 16.7# of answers
(C)69 0 3 10 2 1 2 0
(C)/(A)(%) 32.1 0.0 42.9 28.6 66.7 100.0 50.0 0.0# of answers
(D)110 3 4 21 0 0 1 5
(D)/(A)(%) 51.2 100.0 57.1 60.0 0.0 0.0 25.0 83.3
Type ofindustry
SteelProducts
Nonferrous Metals
MetalProducts
Machinery
ElectricalMachiner
y
TransportEquipmen
t
PrecisionInstrumen
ts
OtherProducts
# of firms (A) 6 5 9 39 51 25 14 7# of answers
(B)0 2 1 8 9 6 3 0
(B)/(A)(%) 0.0 40.0 11.1 20.5 17.6 24.0 21.4 0.0# of answers
(C)3 3 6 10 20 6 0 3
(C)/(A)(%) 50.0 60.0 66.7 25.6 39.2 24.0 0.0 42.9# of answers
(D)3 0 2 21 22 13 11 4
(D)/(A)(%) 50.0 0.0 22.2 53.8 43.1 52.0 78.6 57.1
2 No, we hardly pass through tothe export price.
3. It depends on thecircumstances and maangement
decisions
1. Yes, there is a rule.
2 No, we hardly pass through tothe export price.
3. It depends on thecircumstances and maangement
decisions
1. Yes, there is a rule.
Table3-12Is there an internal rule to pass through the exchange rate fluctuation to the export price? (by firm category)
Large(upper 1/3)
Medium(middle
Small(lower
High(upper 1/3)
Medium(middle
Low(lower
# of firms (A) 80 69 66 65 68 82# of answers
(B)18 10 8 17 4 15
(B)/(A)(%) 22.5 14.5 12.1 26.2 5.9 18.3# of answers
(C)20 31 18 18 22 29
(C)/(A)(%) 25.0 44.9 27.3 27.7 32.4 35.4# of answers
(D)42 28 40 30 42 38
(D)/(A)(%) 52.5 40.6 60.6 46.2 61.8 46.3
3. It depends on thecircumstances and maangement
decisions
Firm category
Total consolidated salesTotal foreign sales
/ Total consolidated sales
1. Yes, there is a rule.
2 No, we hardly pass through tothe export price.
19
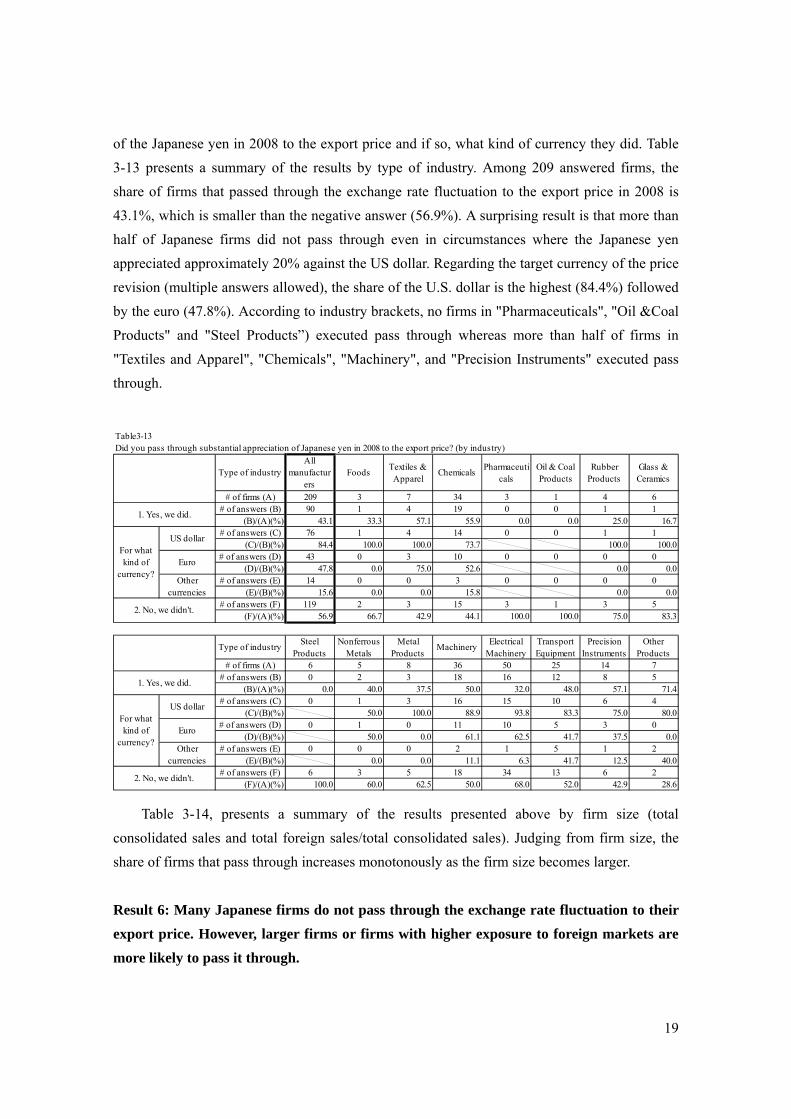
of the Japanese yen in 2008 to the export price and if so, what kind of currency they did. Table
3-13 presents a summary of the results by type of industry. Among 209 answered firms, the
share of firms that passed through the exchange rate fluctuation to the export price in 2008 is
43.1%, which is smaller than the negative answer (56.9%). A surprising result is that more than
half of Japanese firms did not pass through even in circumstances where the Japanese yen
appreciated approximately 20% against the US dollar. Regarding the target currency of the price
revision (multiple answers allowed), the share of the U.S. dollar is the highest (84.4%) followed
by the euro (47.8%). According to industry brackets, no firms in "Pharmaceuticals", "Oil &Coal
Products" and "Steel Products”) executed pass through whereas more than half of firms in
"Textiles and Apparel", "Chemicals", "Machinery", and "Precision Instruments" executed pass
through.
Table 3-14, presents a summary of the results presented above by firm size (total
consolidated sales and total foreign sales/total consolidated sales). Judging from firm size, the
share of firms that pass through increases monotonously as the firm size becomes larger.
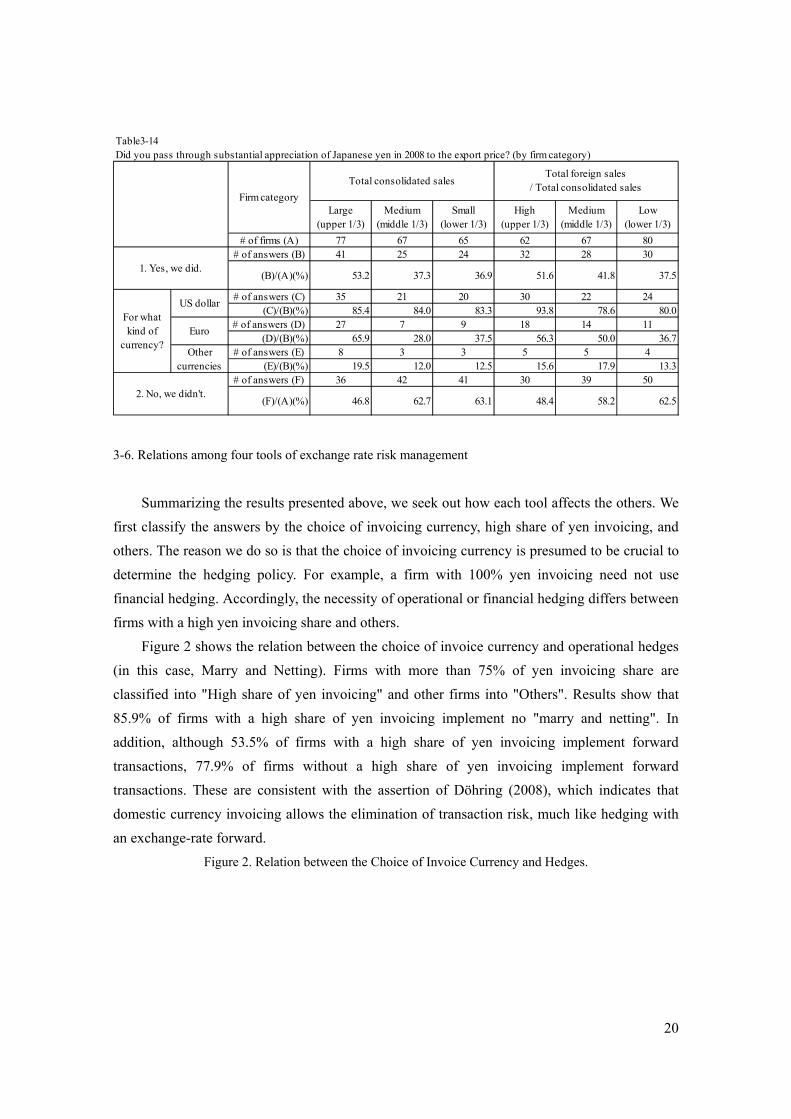
Result 6: Many Japanese firms do not pass through the exchange rate fluctuation to their
export price. However, larger firms or firms with higher exposure to foreign markets are
more likely to pass it through.
Table3-13Did you pass through substantial appreciation of Japanese yen in 2008 to the export price? (by industry)
Type of industryAll
manufacturers
FoodsTextiles &Apparel
ChemicalsPharmaceuti
calsOil & CoalProducts
RubberProducts
Glass &Ceramics
# of firms (A) 209 3 7 34 3 1 4 6# of answers (B) 90 1 4 19 0 0 1 1
(B)/(A)(%) 43.1 33.3 57.1 55.9 0.0 0.0 25.0 16.7# of answers (C) 76 1 4 14 0 0 1 1
(C)/(B)(%) 84.4 100.0 100.0 73.7 100.0 100.0# of answers (D) 43 0 3 10 0 0 0 0
(D)/(B)(%) 47.8 0.0 75.0 52.6 0.0 0.0# of answers (E) 14 0 0 3 0 0 0 0
(E)/(B)(%) 15.6 0.0 0.0 15.8 0.0 0.0# of answers (F) 119 2 3 15 3 1 3 5
(F)/(A)(%) 56.9 66.7 42.9 44.1 100.0 100.0 75.0 83.3
Type of industrySteel
ProductsNonferrous
MetalsMetal
ProductsMachinery
ElectricalMachinery
TransportEquipment
PrecisionInstruments
OtherProducts
# of firms (A) 6 5 8 36 50 25 14 7# of answers (B) 0 2 3 18 16 12 8 5
(B)/(A)(%) 0.0 40.0 37.5 50.0 32.0 48.0 57.1 71.4# of answers (C) 0 1 3 16 15 10 6 4
(C)/(B)(%) 50.0 100.0 88.9 93.8 83.3 75.0 80.0# of answers (D) 0 1 0 11 10 5 3 0
(D)/(B)(%) 50.0 0.0 61.1 62.5 41.7 37.5 0.0# of answers (E) 0 0 0 2 1 5 1 2
(E)/(B)(%) 0.0 0.0 11.1 6.3 41.7 12.5 40.0# of answers (F) 6 3 5 18 34 13 6 2
(F)/(A)(%) 100.0 60.0 62.5 50.0 68.0 52.0 42.9 28.62. No, we didn't.
2. No, we didn't.
1. Yes, we did.
For whatkind of
currency?
US dollar
Euro
Othercurrencies
1. Yes, we did.
For whatkind of
currency?
US dollar
Euro
Othercurrencies
20
3-6. Relations among four tools of exchange rate risk management
Summarizing the results presented above, we seek out how each tool affects the others. We
first classify the answers by the choice of invoicing currency, high share of yen invoicing, and
others. The reason we do so is that the choice of invoicing currency is presumed to be crucial to
determine the hedging policy. For example, a firm with 100% yen invoicing need not use
financial hedging. Accordingly, the necessity of operational or financial hedging differs between
firms with a high yen invoicing share and others.
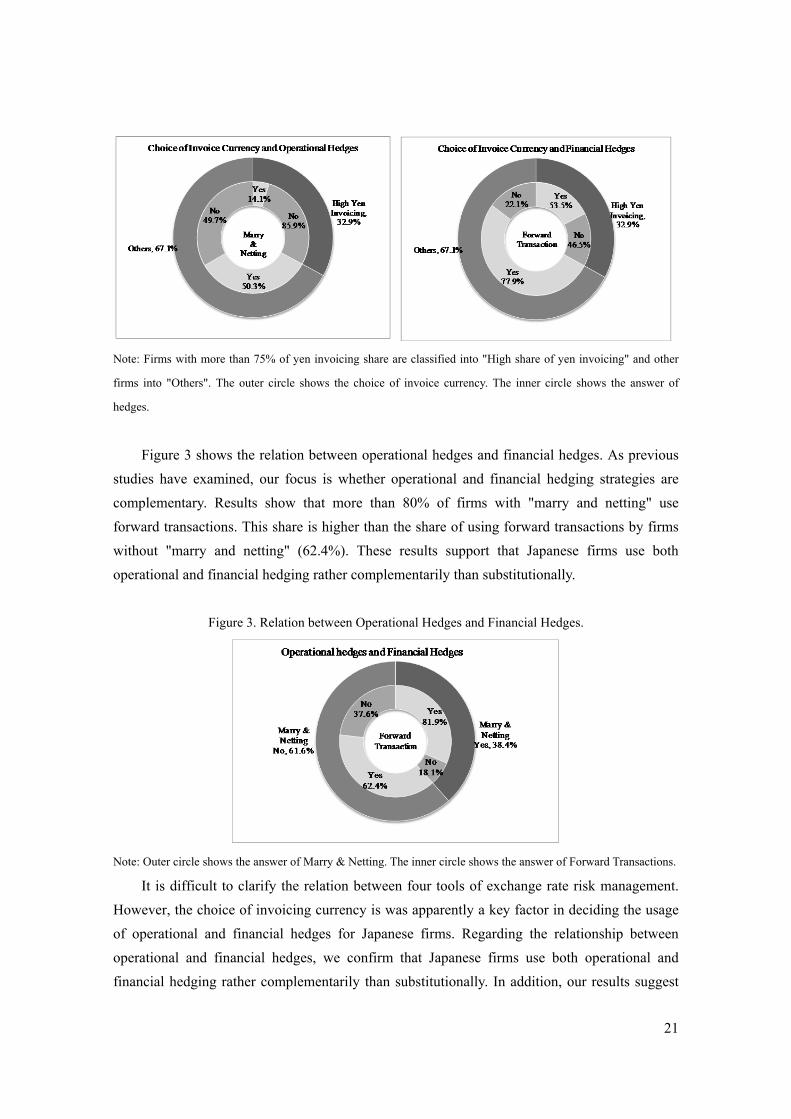
Figure 2 shows the relation between the choice of invoice currency and operational hedges
(in this case, Marry and Netting). Firms with more than 75% of yen invoicing share are
classified into "High share of yen invoicing" and other firms into "Others". Results show that
85.9% of firms with a high share of yen invoicing implement no "marry and netting". In
addition, although 53.5% of firms with a high share of yen invoicing implement forward
transactions, 77.9% of firms without a high share of yen invoicing implement forward
transactions. These are consistent with the assertion of Döhring (2008), which indicates that
domestic currency invoicing allows the elimination of transaction risk, much like hedging with
an exchange-rate forward.
Figure 2. Relation between the Choice of Invoice Currency and Hedges.
Table3-14Did you pass through substantial appreciation of Japanese yen in 2008 to the export price? (by firm category)
Large(upper 1/3)
Medium(middle 1/3)
Small(lower 1/3)
High(upper 1/3)
Medium(middle 1/3)
Low(lower 1/3)
# of firms (A) 77 67 65 62 67 80# of answers (B) 41 25 24 32 28 30
(B)/(A)(%) 53.2 37.3 36.9 51.6 41.8 37.5
# of answers (C) 35 21 20 30 22 24(C)/(B)(%) 85.4 84.0 83.3 93.8 78.6 80.0
# of answers (D) 27 7 9 18 14 11(D)/(B)(%) 65.9 28.0 37.5 56.3 50.0 36.7
# of answers (E) 8 3 3 5 5 4(E)/(B)(%) 19.5 12.0 12.5 15.6 17.9 13.3
# of answers (F) 36 42 41 30 39 50
(F)/(A)(%) 46.8 62.7 63.1 48.4 58.2 62.52. No, we didn't.
Firm category
Total consolidated salesTotal foreign sales
/ Total consolidated sales
1. Yes, we did.
For whatkind of
currency?
US dollar
Euro
Othercurrencies
21
Note: Firms with more than 75% of yen invoicing share are classified into "High share of yen invoicing" and other
firms into "Others". The outer circle shows the choice of invoice currency. The inner circle shows the answer of
hedges.
Figure 3 shows the relation between operational hedges and financial hedges. As previous
studies have examined, our focus is whether operational and financial hedging strategies are
complementary. Results show that more than 80% of firms with "marry and netting" use
forward transactions. This share is higher than the share of using forward transactions by firms
without "marry and netting" (62.4%). These results support that Japanese firms use both
operational and financial hedging rather complementarily than substitutionally.
Figure 3. Relation between Operational Hedges and Financial Hedges.
Note: Outer circle shows the answer of Marry & Netting. The inner circle shows the answer of Forward Transactions.
It is difficult to clarify the relation between four tools of exchange rate risk management.
However, the choice of invoicing currency is was apparently a key factor in deciding the usage
of operational and financial hedges for Japanese firms. Regarding the relationship between
operational and financial hedges, we confirm that Japanese firms use both operational and
financial hedging rather complementarily than substitutionally. In addition, our results suggest

22
that some Japanese firms use the pricing policy (pass through) as one method of exchange rate
risk management. Overall, to mitigate the impact of currency fluctuations, Japanese firms use
operational hedging, financial hedging strategies, and pricing policies depending on their own
choice of invoicing currency.
4. Determinants of financial and operational hedging
In this section, we conduct empirical analysis to investigate the determinants of financial
and operational hedging from the results of a 2009 RIET survey. In relation to the previous
studies, we specifically examine the following questions:
i) Does yen invoicing supplement hedging?
ii) Are operational and financial hedging strategies complements or substitutes?
iii) Does pass-through alternate financial hedging?
To explore these questions, we employ the following specification:
Prob(βFHi =1) = α0 + α1Sizei + α2 Foreign Sales Ratio + α3 Number of Foreign Currencyi
+ β1 Share of Japanese yen Invoicingi + β2 Share of US dollar Invoicingi
+ γ1 Dummy of Marry/Nettingi + γ2 Dummy of Pass-throughi + εi
where βFHi is a dummy of Financial Hedging for firm i on the left-hand-side, and Prob(βFH
i =1)
denotes the probability of a firm that uses at least one kind of financial hedging tool. Because
the basic explanatory variables are on the right-hand-side, we first include a “size” of firm i
measured by the log of total consolidated sales, “foreign sales ratio”, which is a proximity for
foreign market exposure and which is calculated as total foreign sales of firms i divided by total
consolidated sales, and the “number of foreign currencies” used by firm i extracted from the
questionnaire survey.
After controlling these basic variables, we examine the impacts of adoption of other
hedging strategies on financial hedging. “Share of Japanese yen (US dollar) Invoicing” is
defined as a percent of Japanese yen (US dollar) invoicing in all exports to the world of firm i
extracted from the questionnaire survey. “Dummy for Marry/Netting” is a dummy variable that
takes 1 if firm i answered that it conducted Marry/netting in its trade, whereas “Dummy for
Pass-through” is also a dummy variable that takes 1 if firm i answered that it had the pricing
policy as the internal rule to change export prices in the case of exchange rate fluctuation
23
between the time of contract and time of settlement. We ran both the probit estimation and the
ordered probit estimation.
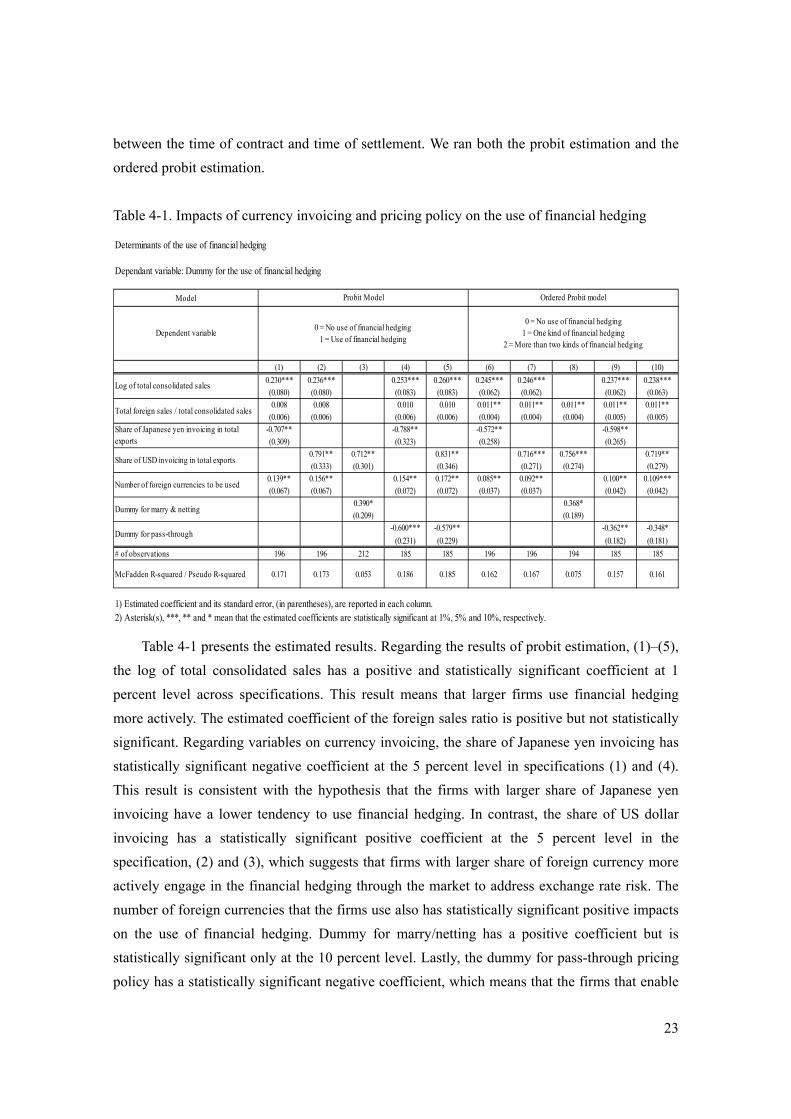
Table 4-1. Impacts of currency invoicing and pricing policy on the use of financial hedging
Table 4-1 presents the estimated results. Regarding the results of probit estimation, (1)–(5),
the log of total consolidated sales has a positive and statistically significant coefficient at 1
percent level across specifications. This result means that larger firms use financial hedging
more actively. The estimated coefficient of the foreign sales ratio is positive but not statistically
significant. Regarding variables on currency invoicing, the share of Japanese yen invoicing has
statistically significant negative coefficient at the 5 percent level in specifications (1) and (4).
This result is consistent with the hypothesis that the firms with larger share of Japanese yen
invoicing have a lower tendency to use financial hedging. In contrast, the share of US dollar
invoicing has a statistically significant positive coefficient at the 5 percent level in the
specification, (2) and (3), which suggests that firms with larger share of foreign currency more
actively engage in the financial hedging through the market to address exchange rate risk. The
number of foreign currencies that the firms use also has statistically significant positive impacts
on the use of financial hedging. Dummy for marry/netting has a positive coefficient but is
statistically significant only at the 10 percent level. Lastly, the dummy for pass-through pricing
policy has a statistically significant negative coefficient, which means that the firms that enable
Determinants of the use of financial hedging
Dependant variable: Dummy for the use of financial hedging
Model
(1) (2) (3) (4) (5) (6) (7) (8) (9) (10)
0.230*** 0.236*** 0.253*** 0.260*** 0.245*** 0.246*** 0.237*** 0.238***(0.080) (0.080) (0.083) (0.083) (0.062) (0.062) (0.062) (0.063)0.008 0.008 0.010 0.010 0.011** 0.011** 0.011** 0.011** 0.011**
(0.006) (0.006) (0.006) (0.006) (0.004) (0.004) (0.004) (0.005) (0.005)-0.707** -0.788** -0.572** -0.598**
(0.309) (0.323) (0.258) (0.265)0.791** 0.712** 0.831** 0.716*** 0.756*** 0.719**(0.333) (0.301) (0.346) (0.271) (0.274) (0.279)
0.139** 0.156** 0.154** 0.172** 0.085** 0.092** 0.100** 0.109***(0.067) (0.067) (0.072) (0.072) (0.037) (0.037) (0.042) (0.042)
0.390* 0.368*(0.209) (0.189)
-0.600*** -0.579** -0.362** -0.348*
(0.231) (0.229) (0.182) (0.181)
# of observations 196 196 212 185 185 196 196 194 185 185
McFadden R-squared / Pseudo R-squared 0.171 0.173 0.053 0.186 0.185 0.162 0.167 0.075 0.157 0.161
1) Estimated coefficient and its standard error, (in parentheses), are reported in each column.2) Asterisk(s), ***, ** and * mean that the estimated coefficients are statistically significant at 1%, 5% and 10%, respectively.
Dummy for pass-through
Probit Model Ordered Probit model
Dependent variable0 = No use of financial hedging
1 = Use of financial hedging
0 = No use of financial hedging1 = One kind of financial hedging
2 = More than two kinds of financial hedging
Log of total consolidated sales
Total foreign sales / total consolidated sales
Share of Japanese yen invoicing in totalexports
Share of USD invoicing in total exports
Number of foreign currencies to be used
Dummy for marry & netting
24
them to impose currency risks against their customers in the negotiation have less tendency to
use financial hedging.
We also estimated the ordered probit model using a dependent variable that takes 2 if the
firm uses more than financial hedging tools of two kinds, and 1 if only one kind of financial
hedging tool is used. Alternatively, it is zero if there is no use of financial hedging. Estimated
results are similar to those of the probit model except for the statistical significance of the
estimated coefficient of the “foreign sales ratio.” The foreign sales ratio in the specifications
(6)–(10) has a statistically significant positive coefficient at the 5 percent level, which means
that the firms that are more dependent on the overseas market more actively engage in financial
hedging.
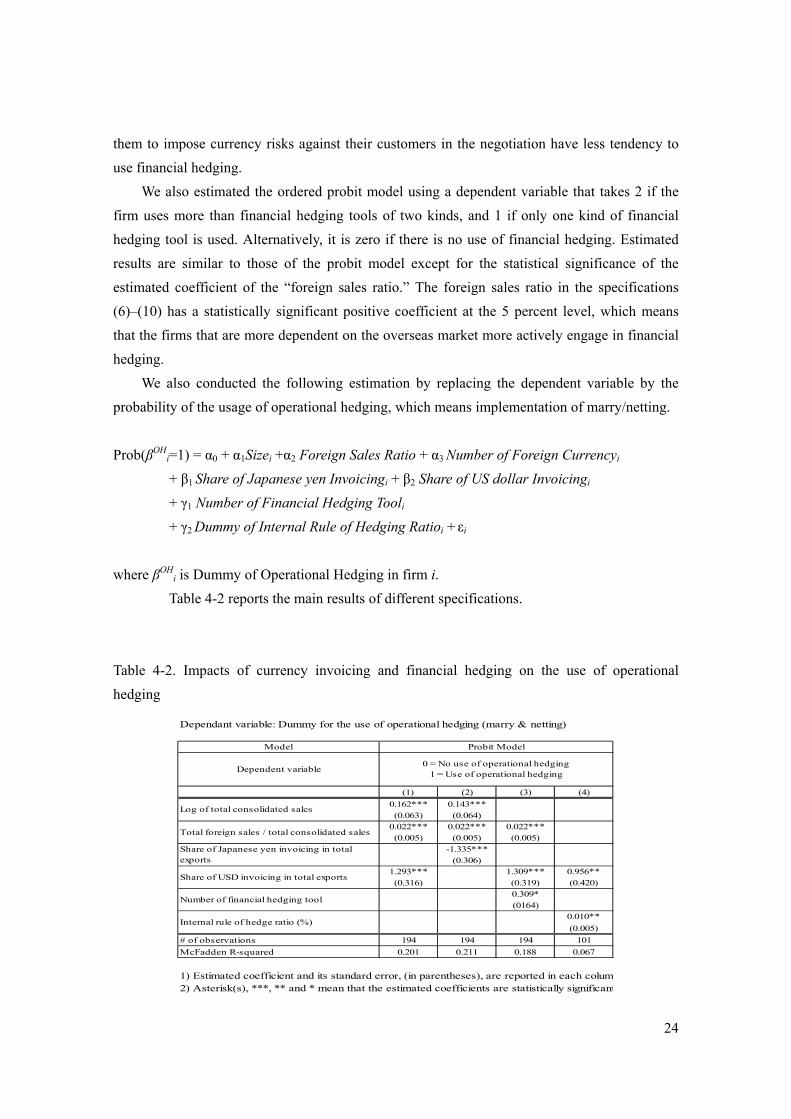
We also conducted the following estimation by replacing the dependent variable by the
probability of the usage of operational hedging, which means implementation of marry/netting.
Prob(βOHi=1) = α0 + α1Sizei +α2 Foreign Sales Ratio + α3 Number of Foreign Currencyi
+ β1 Share of Japanese yen Invoicingi + β2 Share of US dollar Invoicingi
+ γ1 Number of Financial Hedging Tooli
+ γ2 Dummy of Internal Rule of Hedging Ratioi + εi
where βOHi is Dummy of Operational Hedging in firm i.
Table 4-2 reports the main results of different specifications.
Table 4-2. Impacts of currency invoicing and financial hedging on the use of operational
hedging
Dependant variable: Dummy for the use of operational hedging (marry & netting)
Model
(1) (2) (3) (4)
0.162*** 0.143***
(0.063) (0.064)0.022*** 0.022*** 0.022***
(0.005) (0.005) (0.005)
-1.335***
(0.306)1.293*** 1.309*** 0.956**
(0.316) (0.319) (0.420)
0.309*
(0164)0.010**
(0.005)
# of observations 194 194 194 101
McFadden R-squared 0.201 0.211 0.188 0.067
1) Estimated coefficient and its standard error, (in parentheses), are reported in each colum2) Asterisk(s), ***, ** and * mean that the estimated coefficients are statistically significant
Dependent variable0 = No use of operational hedging
1 = Use of operational hedging
Log of total consolidated sales
Total foreign sales / total consolidated sales
Share of Japanese yen invoicing in totalexports
Share of USD invoicing in total exports
Internal rule of hedge ratio (%)
Probit Model
Number of financial hedging tool
25
In summarizing the results of this section, we confirm the following findings: first, Japanese
firms use both operational and financial hedging complementarily; second, yen invoicing
substitutes operational and financial hedging; third, adoption of pricing policy consistent with
the Pass-Through also substitutes for financial hedging.
5. Conclusion
As described herein, we investigate the features of Japanese exporting firms' exchange rate
risk management from the results of a 2009 RIETI survey. Results confirm that Japanese
exporting firms use operational hedging, financial hedging strategies and pricing policies
depending on their own choice of invoicing currency to mitigate the impact of currency
fluctuation.
This is the first detailed investigation of the exchange rate risk management policy of
Japanese firms. From results of a 2009 RIETI survey and subsequent empirical analysis using
survey results, the features of Japanese exporting firms' exchange risk management were
elucidated as follows. First, firms with larger sales and greater dependency on foreign markets
more actively engage in exchange rate risk management. Second, Japanese firms use both
financial and operational hedging complementarily. Third, yen invoicing itself can reduce firms’
exposure. Our contribution is that we show how Japanese exporting firms combine three
different tools of exchange rate risk management policies, operational and financial hedging and
exchange rate pass-through under their own choice of invoicing currency. Given the growing
regional production network of Japanese firms, our findings based on the questionnaire study
will have important implications for exporting firms seeking to expand their overseas businesses
in the future. As our results show, small size firms have little experience in conducting exchange
rate risk management. Therefore, it is important for them to ascertain how large multinational
firms use and combine the exchange rate risk management tools effectively. Additionally, the
policymakers must recognize that the financial and operational hedge plays an important role in
mitigating the exchange rate risk, especially for firms which choose US dollar invoicing. In the
sense, promoting deregulation of foreign transactions and foreign exchange markets particularly
for Asian countries is indispensable to support their exchange rate risk management.
Consequently, our new findings will provide important implications not only for Japanese firms'
exchange rate risk managers to built more efficient exchange risk management system, but also
for policymakers to support the current and future expansion of regional production networks of
Japanese firms.
Some results are not sufficiently strong because of insufficient items of the questionnaire

26
survey, which should be partially reinforced by another source such as firms' financial reports.
Particularly for operational hedges, we use only "marry and netting" as a proxy of operational
hedges. However, more aspects reflect firms' operational hedges. To confirm the robustness of
our scoring procedures, the effects of the above tools of exchange rate risk management should
be tested empirically using firms' stock returns as many previous studies have tested. These
remain as issues to be explored in future investigations.
27
References
Allayannis, George, Jane Ihrig and James P. Weston, 2001, "Exchange-Rate Hedging: Financial
vs. Operational Strategies," American Economic Review Papers & Proceedings, 91 (2),
391–395.
Bartram, Söhnke M., Gregory W. Brown, and Bernadette A. Minton, 2010, "Resolving the
exposure puzzle: The many facets of exchange rate exposure," Journal of Financial
Economics, 95(2), 148–173.
Carter, David, Christos Pantzalis and Betty J. Simkins, 2003, "Firmwide Risk Management of
Foreign Exchange Exposure by U.S. Multinational Corporations," Working Paper Series.
Risk Management eJournal 01/2001; DOI:10.2139/ssrn.255891.
Chiang, Yi-Chein, Hui-Ju Lin, 2007, “Foreign Exchange Exposures, Financial and Operational
Hedge Strategies of Taiwan Firms,” Investment Management and Financial Innovation,
Volume 4, Issue 3, 95–105.
Döhring, Björn, 2008, “Hedging and invoicing strategies to reduce exchange rate exposure: a
euro-area perspective,” Economic Papers 299, European Commission.
Friberg, Richard and Fredrik Wilander, 2008, "The Currency Denomination of Exports—A
Questionnaire Study," Journal of International Economics, 75, 54–69.
Froot, Kenneth, David Scharfstein, and Jeremy Stein, 1993, “Risk Management: Coordinating
Corporate Investment and Financing Policies,” Journal of Finance, 48, 1629–1658.
Goldberg, Linda S. and Cédric Tille, 2008, “Vehicle Currency Use in International Trade,”
Journal of International Economics, 76(2), 177–192.
Goldberg, Linda S. and Cédric Tille, 2009, “Micro, Macro, and Strategic Forces in International
Trade Invoicing,” NBER Working Paper No. 15470, National Bureau of Economic
Research.
Grassman, Sven, 1973, “A Fundamental Symmetry in International Payments.” Journal of
International Economics, 3, 105–16.
Hommel, Ulrich, 2003, "Financial versus operative hedging of currency risk," Global Finance
Journal, 14(1), 1–18.
Ito, Takatoshi, Satoshi Koibuchi, Kiyotaka Sato and Junko Shimizu, 2012, “The Choice of an
Invoicing Currency by Globally Operating Firms: A Firm-Level Analysis of Japanese
Exporters’ Invoicing Behavior,” International Journal of Finance and Economics, 17, 305–
320.
Jayasinghe, Prabhath, and Albert K. Tsui, 2008 "Exchange rate exposure of sectoral returns and
volatilities: Evidence from Japanese industrial sectors," Japan and the World Economy,
20(4), 639–660.
Kamps, Annette, 2006, “The Euro as Invoicing Currency in International Trade,” ECB Working
28
Paper No. 665, European Central Bank.
Page, S. A. B., 1977, “Currency of Invoicing in Merchandise Trade,” National Institute
Economic Review, 33, 1241–1264.
Pramborg, Bengt, 2005, "Foreign exchange risk-management practices between Swedish and
Korean firms," Pacific-Basin Finance Journal, 13, 343–366.
Pantzalis, Christos, Betty J Simkins, Paul A Laux, 2001, "Operational Hedges and the Foreign
Exchange Exposure of US Multinational Corporations," Journal of International Business
Studies, 32(44), 793–813.