exchange rates chapter 8. firm in home serve foreign markets / source from abroad? stay domestic...
TRANSCRIPT

Exchange Rates
Chapter 8

Firm in Homeserve foreign markets / source from abroad?
Stay domestic
Export
Export or local production?
Import or local production?
ImportMultinational activity:
horizontalMultinational activity:
vertical
no
yes, serve foreign market
yes, source from abroad
exportlocal
productionimportlocal
production
Selling in foreign currency
Producing and selling in foreign
currency
Producing in foreign currency
Buying in foreign currency
nature of exchange rate risk nature of exchange rate risk
Figure 8.1 Exchange rates, trade and multinational activity
Exposure to exchange rate risks
• Economic exposure– Transaction risk– Translation risk
• Spot versus forward exchange rates

Table 8.1 Some international currency symbols
Country Currency Symbol ISO code Australia dollar A$ AUD Canada dollar C$ CAD China yuan CNY EMU countries euro € EUR India rupee Rs INR Iran rial RI IRR Japan yen ¥ JPY Kuwait dinar KD KWD Mexico peso Ps MXP Saudi Arabia riyal SR SAR Singapore dollar S$ SGD South Africa rand R ZAR Switzerland franc SF CHF United Kingdom pound £ GBP United States dollar $ USD
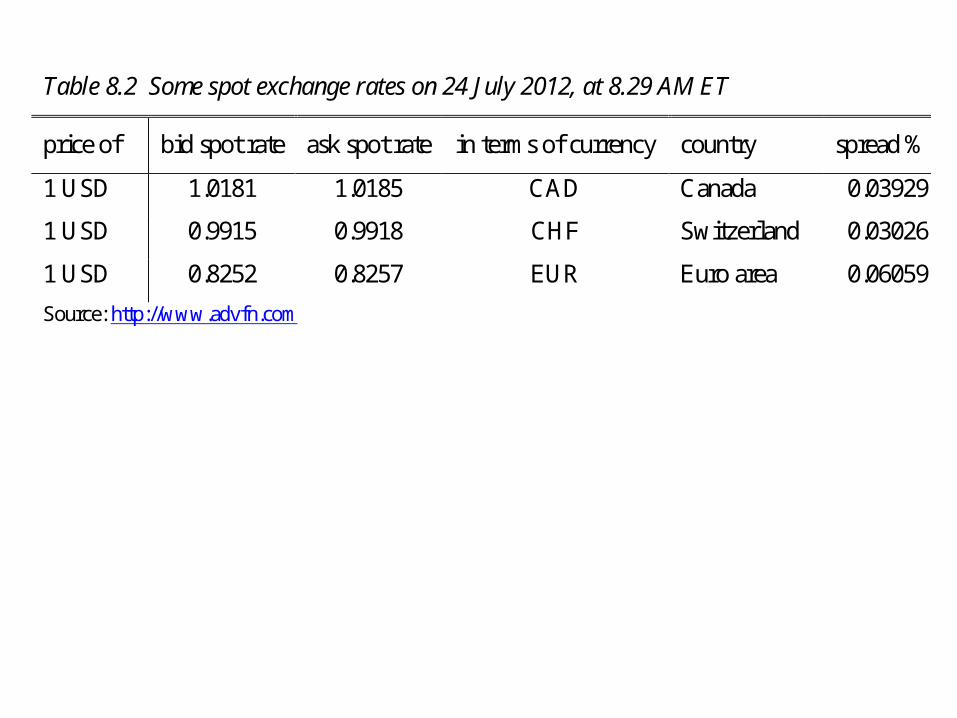
Table 8.2 Some spot exchange rates on 24 July 2012, at 8.29 AM ET
price of bid spot rate ask spot rate in terms of currency country spread %
1 USD 1.0181 1.0185 CAD Canada 0.03929
1 USD 0.9915 0.9918 CHF Switzerland 0.03026
1 USD 0.8252 0.8257 EUR Euro area 0.06059
Source: http://www.advfn.com

Figure 8.2 Some exchange rates; daily data, 2000 – 2011
Exchange rates: price of US dollar in local currency (daily rates)
0
1
2
2000 2002 2004 2006 2008 2010 2012
0
10
20
Canada; CAD/US
Switzerland; CHF/USD
S Africa; ZAR/USD(right-hand scale)
Data source: www.federalreserve.gov

Figure 8.3 Australia – USA; spot and forward exchange rates of US dollar, 1976-2011
Australia; spot and 3-month forward rates (AUD/USD)
0.7
0.9
1.1
1.3
1.5
1.7
1.9
2.1
1976 1981 1986 1991 1996 2001 2006 2011
spot
forward
Data source: IFS.
• Arbitrage (Table 8.3)
• Players and markets
• Forward exchange rates and hedging
• Trading volume (Fig. 8.4)
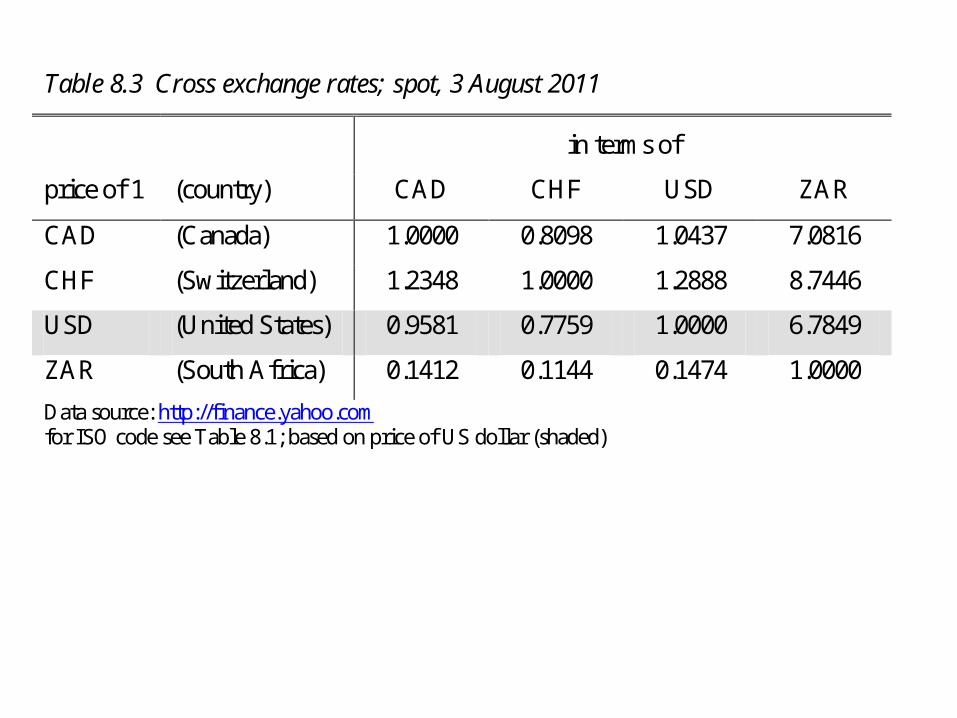
Table 8.3 Cross exchange rates; spot, 3 August 2011
in terms of
price of 1 (country) CAD CHF USD ZAR
CAD (Canada) 1.0000 0.8098 1.0437 7.0816
CHF (Switzerland) 1.2348 1.0000 1.2888 8.7446
USD (United States) 0.9581 0.7759 1.0000 6.7849
ZAR (South Africa) 0.1412 0.1144 0.1474 1.0000
Data source: http://finance.yahoo.com for ISO code see Table 8.1; based on price of US dollar (shaded)

Figure 8.4 Global foreign exchange market turnover, 1998 – 2010
Global foreign exchange market turnover; daily averages in April 2010 (bn US $)
0
400
800
1200
1600
2000
1998 2001 2004 2007 2010
foreign exchange swaps
spot transactions
outright forwards
Data source: BIS (2010), triennial central bank survey

Figure 8.5 Most used currencies on the foreign exchange market, 1998 – 2010
Currency distribution of reported foreign exchange market turnover; percentage shares of average daily turnover in April
0
10
20
30
40
50
60
70
80
90
1998 2001 2004 2007 2010
US dollar Euro Japanese yen Pound sterling Australian dollar Swiss franc
Data source: BIS (2010); * Because two currencies are involved in each transaction, the sum of the percentage shares of individual currencies totals 200 percent instead of 100 percent.

• Exchange rates and prices
• Effective exchange rates

Figure 8.6 Exchange rates and prices, 1960-2009
US exchange rates and consumer prices, 1960-2009
-5
0
5
10
15
20
25
30
-5 0 5 10 15 20 25 30
exchange rate differential
infla
tion
diff
eren
tial
Argentina
Peru
Uruguay
BoliviaTurkey
Calculations based on World Development Indicators online; 64 observations; the line has a 45 slope.

Figure 8.7 Exchange rates and intervention
S
European goods
S0
S M(S)0
X(S)
S M(S)1
A
intervention
DC
B
parity band
S
European goods
S0
S M(S)0
X(S)
S M(S)1
A
intervention
DC
B
parity band

Figure 8.8 De facto exchange rate arrangements, April 30, 2010
De facto exchange rate regimes; # of countries, April 2010
0 5 10 15 20 25 30 35 40 45
No separate legal tender
Currency board
Conventional peg
Stabilized arrangement
Crawling peg
Crawl-like arrangement
Pegged rate with band
Other managed arrangement
Floating
Free floating
Ecuador
Hong Kong
Venezuela, Niger, Morocco, Cameroon
China, Bangladesh
Nicaragua
Ethiopia
Belarus
Russia, Singapore, Egypt
Indonesia, India, Pakistan, Philippines
Australia, UK, USA, Eurozone
Data source: IMF (2010, Appendix II); selected countries listed for each regime, see also Table 23.1

Figure 8.9 US dollar: effective exchange rates, 1973-2011
a. US effective exchange rates, broad
0
100
200
300
400
1972 1980 1988 1996 2004 2012
real
nominal
b. US effective exchange rates, major
0
50
100
150
200
1972 1980 1988 1996 2004 2012
real
nominal
Data source: www.federalreserve.gov

Figure 8.9 US dollar: effective exchange rates, 1973-2011
c. US real effective exchange rates, major and broad
65
75
85
95
105
115
125
1972 1980 1988 1996 2004 2012
major currencies
broad currencies
March 1985 February 2002
Data source: www.federalreserve.gov

Figure 8.10 Out-of-sample exchange rate forecasting
Out of sample forecasting
0
5
10
15
20$
/DM
1-m
$/D
M 6
-m
$/D
M 1
2-m
$/Y
en
1-m
$/Y
en
6-m
$/Y
en
12
-m
$/£
1-m
$/£
6-m
$/£
12
-mcurrency pair and duration (months)
root
mea
n sq
uare
d er
ror
of f
orec
ast
Random walk
Monetary
Dornbusch
Portfolio
Data source: Meese and Rogoff (1983)

Figure 8.11 Canada; interest rates and inflation rate (CPI), 1970 – 2011
Canada; inflation and nominal and real interest rate, 1970-2011
-4
0
4
8
12
16
20
24
1970 1980 1990 2000 2010
nominal interest rate
real interest rate
inflation rate
Data source: IFS; bank rate (end of period) and cpi (% change), monthly data

Figure 8.12 UK; interest rates and term structure, 1980-2011
UK; 3 month and 6 month interest rates and term structure
0
10
20
1980 1985 1990 1995 2000 2005 2010
-1
0
13 months
6 months
term structure(right-hand scale)
Data source: IFS; 3 and 6 month Paris Interbank Offer rate

Arbitrage and interest parity
• Fisher equation:
r = i - π
• Covered interest parity (Fig. 8.13)
Equilibrium condition:
[F(1+iUS)/E]L = [(1+iEU)]L
F/E = (1+iEU)/(1+iUS)

Figure 8.13 Two investment options
L euro to invest
exchange L euro for L/S dollar
receive (1+iEU)L euroinvest L in European bonds
invest L/S in American bonds receive (1+iUS)(L/S) dollar
exchange (1+iUS)(L/S) dollar for F(1+iUS )(L/S) euro
compare revenueL euro to invest
exchange L euro for L/Edollar
receive (1+iEU)L euroinvest L in European bonds
invest L/E in American bonds receive (1+iUS)(L/E)dollar
exchange (1+iUS)(L/E)dollar for F(1+iUS )(L/E)euro
compare revenue

(BOX 8.4) Figure 8.14 Australia – USA: 12-month covered interest parity
Australia-USA; 12 months covered interest parity
-0.03
0
0.03
0.06
0.09
-0.03 0 0.03 0.06 0.09
12 month forward - spot rate
inte
rest
rat
e di
ffer
entia
l
Data source: IFS; shown interest rates are interbank offered rates, 1986-2005

Interest parity, transaction costs, exchange rates, and capital mobility
• rhome = rforeign + risk + TC
A simple version of uncovered interest parity (UIP) condition:
• rhome = rforeign + dE ; TC = 0, risk = dE
Given rforeign ,UIP indicates that in a world of high degree of capital mobility, the domesticinterest rate can differ from the foreign interest rate only if the exchange rate is not fixed.