excited state dipole moments from solvatochromic data...
TRANSCRIPT

Chapter VI
EXCITED STATE DIPOLE MOMENTS FROMSOLVATOCHROMIC DATA
This Chapter is organised in two sections. The first section is devoted to
studies on some 7-nitrobenz-2-oxa-l,3-diazol-4-yl (NBD) derivatives in which
we first attempt to find out the correct Onsager cavity radii required for the
analysis of solvatochromic data to measure the change in the dipole moment on
excitation using the Lippert-Mataga equation. Then we focus on two other
model compounds containing the NBD chromophore to determine the nature of
the emitting state and possible role of rotary decay mechanism using AMI
calculations. The second section of the Chapter is concerned with estimation of
the excited state dipole moments of a set of coumarin derivatives using a
recently developed modified Lippert Mataga equation in which the Stokes shift
between the absorption and fluorescence wavenumbers is con elated with the
microscopic solvent polarity parameter, E-j .'
6.1. Studies on NBD derivatives
6.1.1. Selection of Onsager cavity radius
Even though a number of direct methods such as fluorescence
polarisation,2 electric dichroism,3 stark splitting of rotational levels4 and
microwave conductivity or absorption*1 are available and considered to be fairly
accurate for the estimation of the excited state dipole moment, the most
common ones are based on the analysis of the solvatochromism of the
absorption and fluorescence maxima.6-7 In the method suggested by Lippert and

Mataga, the Stokes shift between the absorption and fluorescence maxima is
related to the dipole moment change on excitation and solvent polarity function
involving the dielectric constant and refractive index (equn. 3.3).6-7 The main
difficulty associated with quantitative measurement of the change in dipole
moment on excitation using the above method is the choice of the Onsager
cavity radius. In fact, it has been reported that the values obtained for Aji of a
fluorophore from the above equation may differ frorn the actual values by as
much as 50% depending on the choice of the cavity radius.8 In the absence of
any clear guidelines for the selection of the cavity radius of a particular system,
the choice is often arbitrary 8~n and hence the determined Aji values are far
from accurate. We address to this Onsager radius problem by considering some
NBD derivatives in which the length of the molecules is varied keeping the
basic chromophore unchanged (Chart 6.1).
CHART 6.1
158
1. XandY=-H2. X - CH3 and Y = H3.X = CH2-CH3andY = H4 . X - CH2-(CH2)4-COOH and Y = H
5 . X - CH2CH2CH3 and Y - H6. X and Y - CH2CH3
7. Xand Y-CH 3
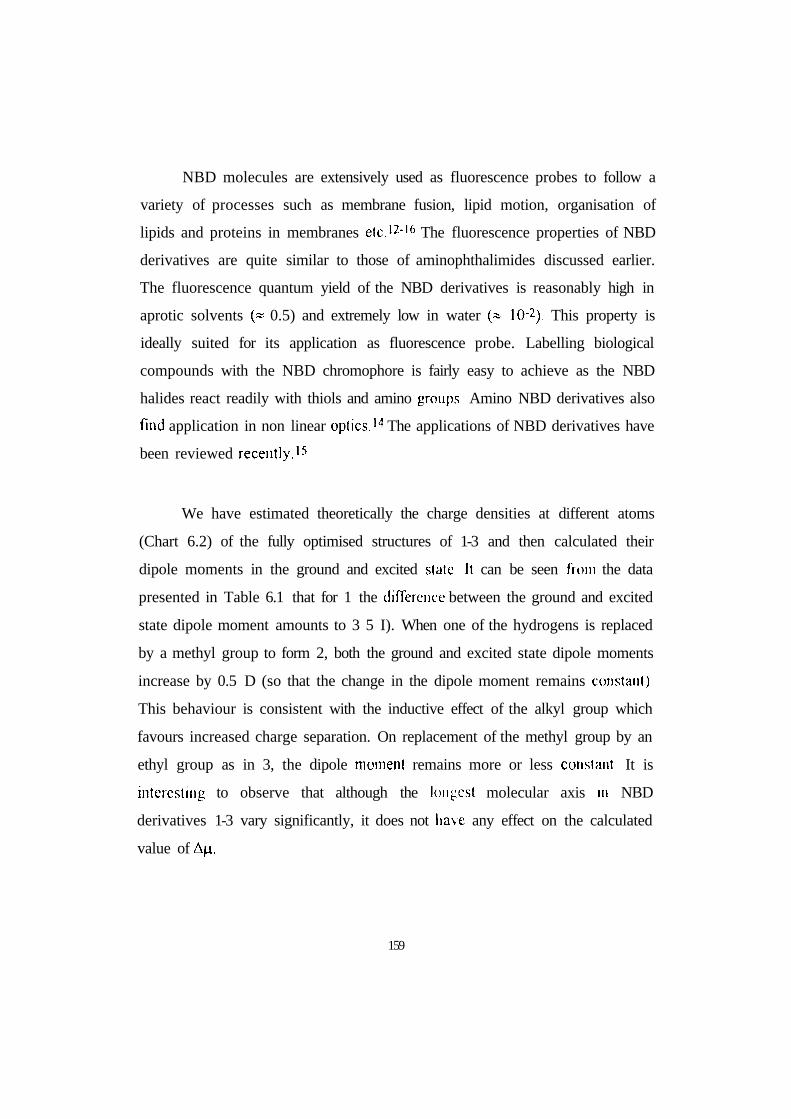
NBD molecules are extensively used as fluorescence probes to follow a
variety of processes such as membrane fusion, lipid motion, organisation of
lipids and proteins in membranes etc.12"16 The fluorescence properties of NBD
derivatives are quite similar to those of aminophthalimides discussed earlier.
The fluorescence quantum yield of the NBD derivatives is reasonably high in
aprotic solvents (« 0.5) and extremely low in water (» 10"2). This property is
ideally suited for its application as fluorescence probe. Labelling biological
compounds with the NBD chromophore is fairly easy to achieve as the NBD
halides react readily with thiols and amino groups Amino NBD derivatives also
find application in non linear optics.14 The applications of NBD derivatives have
been reviewed recently.15
We have estimated theoretically the charge densities at different atoms
(Chart 6.2) of the fully optimised structures of 1-3 and then calculated their
dipole moments in the ground and excited state It can be seen from the data
presented in Table 6.1 that for 1 the difference between the ground and excited
state dipole moment amounts to 3 5 I). When one of the hydrogens is replaced
by a methyl group to form 2, both the ground and excited state dipole moments
increase by 0.5 D (so that the change in the dipole moment remains constant)
This behaviour is consistent with the inductive effect of the alkyl group which
favours increased charge separation. On replacement of the methyl group by an
ethyl group as in 3, the dipole moment remains more or less constant It is
interesting to observe that although the longest molecular axis in NBD
derivatives 1-3 vary significantly, it does not have any effect on the calculated
value of Afi.
159

1 2
3
CHARI 6.2
160

The invariance of the Au. values on the length of the alkyl chain suggests
that for even longer derivatives such as 4, which is actually used in fluorescence
applications, one should not consider, for the purpose of the selection of the
Onsager radius, the length of the long axis of the molecule; instead, the cavity
radius should be measured from the maximum distance across which the charge
separation takes place. If it were not so, A|.i for the compound 3, based on its
longest molecular axis (as calculated theoretically) and solvatochromic data for
4 (as solvatochromism of the absorption and fluorescence bands of these
compounds do not differ significantly) would have been 5.5 D which is nearly
55% more than the estimated value of 3.5 D. The theoretically calculated
distance between the average coordinates of the oxygen atoms in the nitro group
and the nitrogen atom of the amino group (which remains practically the same in
all these derivatives), where charge separation could occur is 6.38 A Half of
this, i.e. 3.19 A when used for the analysis of the solvatochromic data of 4, An
value is obtained as 3.9 D which is in line with the Ap. values for the other
compounds.
Table 6.1. Dipole Moments (in D) of NBD Derivatives.
Compound
1
2
3
4a
9.1
9.6
9.5
-
Me
12.6
13.2
13.2
-
AM
3.5
3.6
3.5
3.9
Method used
AMI
AMI
AMI
Spectral shifta assuming an Onsager cavity radius of 3.19 A
161

6.1.2. Nature of the emitting state and the role of rotary decay mechanism: Atheoretical analysis
Recently, nonfluorescent TICT state has been proposed for one of the two
NBD derivatives, 5 and 6 (Chart 6.1) to account for the polarity dependence of
the fluorescence properties.17 In order to get insight into the Photophysical
behaviour of NBD derivatives we have carried out calculations, similar to those
performed on DMABN and aminophthalimides, on two simpler compounds, 1
and 7 whose application encompasses large areas of interest.12'16 We highlight
only the salient features of the results which are relevant to the rotary decay
process.
6.1.2.1. Ground state properties
The ground state profiles of the two molecules in the gas phase, shown
as a function of the twist angles in figs 6.1 and 6.2, are quite similar to those
obtained for other compounds reported in the thesis. The planar conformation is
the most stable form (energy minimum observed for dihedral angle of 0-10 deg).
The planar form is significantly stabilised with respect to the twisted form on
solvation. The twisted forms are high enough in energy compared with the
respective planar forms so as not to expect any twisting in the ground state
either in the gas phase or in presence of any solvent The ground state dipole
moments at the planar conformation are 9.1 and 9.76 D for 1 and 7 respectively
162

Fig.6.1. Variation of the ground state energy of 1 as a function of the twistangle in the gas phase (•), dioxane (•), and Ace!r>f^fcti[g U)
Twist angle / deg
163

Twist angle / deg
Fig.6.2. Variation of the ground state energy of 7 as a function of the twistangle in the gas phase (*), dioxane (•), and Ace-tor>itTi(£f#}
164

6.1.2.2. Excited slate properties
The variation of the lowest excited singlet state energy as a function of
the twist angle of the amino group in the gas phase as well as in two solvents is
shown in fig. 6.3 for 1. The calculated energy profiles in dioxane and
acetonitrile suggest that for 1 twisting is not possible because of high barrier
involved (0.41 eV in acetonitrile). Therefore, the emitting state of 1 can only be
an LE state whose dipole moment is estimated as 12.6 D Tor 7, the energy
profiles are shown in fig. 6.4. It can be seen that LIZ -> TICT process is almost
barrier-less in polar media such as in acetonitrile Therefore, one expects the
TICT state to be populated for this compound. However, it is interesting to note
that in this particular case the solvent stabilisation of the excited TICT state
leads to lowering of its energy below the ground state in this particular
conformation. In other words, crossing of the zerocth order ground and excited
states results in a situation such that on excitation, 7 is expected to slide down
the surface to a twisted conformation without emission of photons Thus the
TICT state in N-alkylated derivatives of NBD should be nonfluorescent.
165
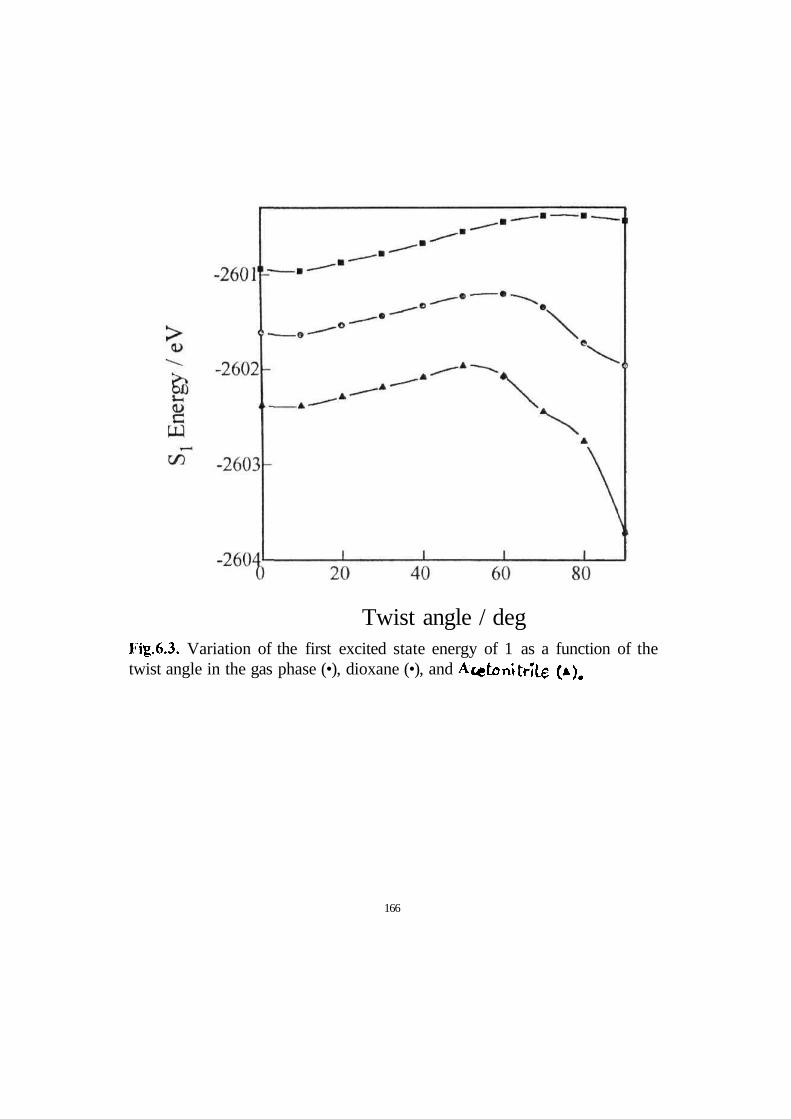
Fig.6.3. Variation of the first excited state energy of 1 as a function of thetwist angle in the gas phase (•), dioxane (•), and Acetonitrile (*),
Twist angle / deg
166

Fig.6.4. Variation of the first excited state energy of 7 as a function of thetwist angle in the gas phase (*), dioxane (•), and Acetonitrile (•).
Twist angle / deg
167

6.2. Studies on coumarin derivatives
It is well documented in the literature that solvatochromic shifts of dipolar
species correlate much better with the microscopic solvent polarity parameters
such as Ej(30) or E j 1 8 than with traditionally used bulk solvent polarity
functions, Af (as defined in Chapter 111) or F2(D,n)7 (as defined below)
involving dielectric constant (D) and refractive index (n).19
F2(D,n) = [{(D-l)/(D+2)H(n2-l)/(n2+l)}] [2n2* l)/(n2+2)] 6.1
This has also been demonstrated by us in Chapter V using the solvatochromic
data for AP and DAP. The theoretical basis for the correlation of the Stokes shift
with ET has been published recently1 (discussed in detail in Chapter III).
According to this formulation
Al' - 11307.6 {( A// / A// D)2(aD /a)3}llj +constant. 6.2
ALI can be determined from the slope of the plot of the Stokes shift vs E-r using
the reported Ayi^ of 9 D of the betaine dye and its Onsager radius, ap of 6.2
A.13
In view of better correlation observed in plots of AV against E T , the
slope from which the Ap. values are evaluated is expected to be more accurate.
In addition, the above equn. provides a number of practical advantages. First,
the formulation used in this method provides a partial cancellation of the
problems associated with Onsager radius in the original Lippert-Mataga
equation6, because ratios of two Onsager radii are involved. Second, the method
168

provides definite advantage for studies with binary solvent mixtures Since the
use of a mixture of just two solvents, one polar and the other nonpolar, provides
systematic variation of the polarity with any desired number of data points and
the polarity of various compositions are experimentally determined simply by
measuring E j , the experimental procedure is simplified and statistical analysis
is more reliable than that using different solvents. In view of this we apply the
methoi to determine the excited state dipole moments of a set of coumarin dyes
(Chart 6.3) extensively used in laser applications.20
CHART 6.3
169

The excited state dipole moments of these molecules control the tunability
range of their emission energy as a function of the solvent polarity. Further,
since some of these systems may possess low-lying TICT state,21 the
fluorescence can originate from either an LE state or a TICT state. Since it is
possible to differentiate these two states on the basis of their dipole moments,
our measurements should provide insight to the nature of the emitting state.
The absorption and emission maxima of the dyes in various solvents are
compiled in Table 6.2. The solvents where strong specific interactions (e.g. 11-
bonding) with the dyes are possible were excluded. As can be seen from the
Table, the shift of emission peaks with solvent polarity changes is more
pronounced than the same for the absorption peaks. This indicates that Aji (\ie
— fig) is positive. The correlation coefficients of the Stokes shifts of the six dyes
with the solvent polarity functions F2 (D, n), recommended by Koutek on the
basis of a detailed statistical analysis7as well as B T , are presented in Table 6.3
As seen from the Table, the correlation of experimental Stokes shifts of the
coumarins with ET is far superior to that with the F2 (D,n) function Fig. 6.5
and 6.6 show typical plots of Stokes shifts versus F2 (D,n) and ET respectively
for C102 as an illustrative example.
170

Table 6.2. Wave numbers (cm" ) of the absorption and emission (withinl>:uTtitlu'sis) inaxiiun of tin- six tounuiiin dyes in Hu- different solvents.
Compound
Cl
C102
Cl 20
C151
Cl 52
Cl 53
CCI4
28011(24863)
27027(24260)
30030(25893)
28490(24108)
26596(22810)
25000(22371)
Toluene
27855(24449)
26882(23923)
29762(25562)
27933(23288)
26042(22212)
24630(21386)
1,4-Dioxane27777(24271)
23667(23641)
29498(25240)
27624(22748)
26110(21720)
24510(29790)
THF
27624(24178)
26525(23343)
29070(24975)
26810(22371)
25840(21249)
24331(20492)
Ethylacetate27739(24026)
26738(23063)
29498(24950)
27472(22492)
25740(21258)
24450(20358)
Acetone
27247(23618)
26247(22624)
29070(24643)
27027(21949)
25510(20483)
24038(19717)
Acflh)nitrite27137(23694)
26110(22302)
29325(24486)
27322(21844)
25381(20317)
23923(19470)
171

Table 6.3. Correlation coefficients for the fit of the Stokes shifts of thecoumarin dyes against the solvent polarity functions Ej and F2 (D,n).
Molecule
Cl
C102
Cl 20
C151
C152
Cl 53
Using polarity functions
F2 (D,n)
0.780
0.899
0.693
0.676
0.924
0.863
b T
0.945
0.968
0.887
0.892
0.948
0.931
Using E^ ofbinary mixture8
0.963
0.989
0.910
0.949
0.957
0.958a acetonitrile.benzene mixture; 9 compositions used in the correlation.
172

Fig.6.5. Plot of Stokes shifts of C102 versus the solvent polarity function, F2
(D,n) of the seven solvents shown in Table 6.2.
173

Fig.6.6. Plot of Stokes shifts of Cl02 versus the solvent polarity function,ET of the seven solvents shown in Table 6.2.
174

Table 6.3 also provides the conelation coefficients for the plot of the
Stokes shift versus the E j obtained in a separate experiment employing the
binary solvent mixtures of benzene and acetonitrile. Nine compositions ranging
from 20% to 100% acetonitrile were used and the Ej values experimentally
determined. We have examined the reproducibility of these experimentally
determined Ey values using the empirical equation for ET suggested by
Langhals.22 The agreement between the theoretical and experimental ET values
of the mixtures is excellent at the compositions used. As seen in Table 6.3, the
correlation of Stokes shifts of the six dyes is at its best with ET values of the
solvent mixtures. Since the number of data points used here are more, the
statistical relevance of this fit is also enhanced over that using the different
solvents. The plot of Stokes shirts versus the ET parameter employing the
acetonitrile-benzene binary mixture, for Cl02 is shown in fig 6.7. Though the
ET values and the Stokes shifts span a slightly smaller range here, the number
of data points is larger and the superiority of the fit is clearly seen.
175

Fig. 6.7. Plot of Stokes shifts of the molecule C102 versus E T valuesof the acetonitrile-benzene mixture of nine different compositions.
The Onsager radius, the ground and excited state dipole moments and A i
values of six dyes are given in Table 6.4. The ground state dipole moments of
the dyes Cl, C102 and C120 are those evaluated using the AMI procedure of
McCarthy and Blanchard.23 The last three compounds (Cl51, Cl52 and Cl53)
contain fluorine atoms for which the AMI parainetrisation is known to be
176

inadequate, especially for the computation of the heats of formation and
geometry. Therefore, we have carried out the geometry optimisation for these
molecules using the PM3 parametrisation.24 Using these geometries, the ng and
^ were calculated using the AMI procedure. It is seen that between every pair
of dyes related by a CH3 / CF3 substitution, the latter has a slightly lower dipole
moment. Examination of the atomic charges on tlie amino group, carbonyl
oxygen, CH3 and CF3 groups provides an insight into tlie reason for this The
decrease in fig is caused by the fact that the CH3-K) dipole component that
adds to the principal N-»O vectors in the methyl-substituted compound is
replaced by the much smaller CF3->0 component in the trifluoromethyl-
substituted molecules. The experimental A i values obtained (using cqn 6.2)
from the slopes of the plots against E j values of the different solvents as well
as of the binary mixtures are found to be similar, except for some variation in
the case of Cl. However, it appears from the Table that Au, values for the dyes
as determined by this method are slightly lower than the reported values.23,25
This suggests that there is a need for the Onsager radius used for tlie betainc dye
to be scaled to slightly larger value However, it would be probably appropriate
that scaling of Onsager radius, if necessary, be undertaken only when the
excited state dipole moment of tlie compounds are available from one of the
direct methods such as microwave absorption or conductivity measurements
which produces more accurate values and does not depend on the Onsager
cavity radius. The last column of Table 6.4 provides the \ie calculated using
theoretical pg and the A|n determined experimentally using the binary mixture.
177

Table 6.4. Comparison of An values obtained from the present analysis invarious solvents and binary mixture with the computed values.
Molecule
Cl
C102
C120
C151
C152
C153
a (A)
3.48
3.46
3.46
3.46
3.45
3.46
(theory)6.35
6.43
6.03
4.49
5.96
5.36
AM/D
Varioussolvents
1.45
1.84
1.43
1.72
1.92
2.27
Binarymixture
2.25
2.11
1.44
1.58
2.16
2.22
Theoretical8
3.46
3.66
2.16
2.60
4.03
4.46
Me/D*
8.60
8.54
7.47
6.07
8.12
7.58
athe values for Cl, C102 and C120 are from ref 23. The values for C151, C152 andCl53 are those calculated in the present study using PM3 optimised geometries.
Calculated using the experimental Au and the theoretical j.ig values.
As seen from Table 6.4, the change of dipole moment on electronic
excitation is rather small for all the molecules studied. This suggests that the
emission of these dyes originate from a state, which although more polar than
the ground state, is probably an LE state. Further, it may be noted that the
compounds Cl02 and Cl53 are fairly rigid and incapable of showing a twist
around the C-N bond. The close similarity of the \ic of these molecules with
their respective counterparts capable of twisting, implies that the emitting states
of all these systems are 1CT in nature. TICT states if present, appear to be non-
emissive.
178

6.3. References
1 M. Ravi, A. Samanta, T.P. Radliakrishnan, ./• Phys. Chem 98, 9133, 1994.
2 J. Czekalla, Z. Electron., 64, 1221, 1960, b) ty. Liptay, Z. Naturforsch,
18a, 705, 1963.
3 a) W. Liptay, J. Czekalla, 2. Naturforsch, Jia, 1072, 1960; b) J. Czekalla,
W. Liptay, K.O. Meyer, Ber. Bunsengcs. Phys Chem., 67, 465, 1963, c) W.
Liptay, Angew. Chem., 81, 195, 1969, d) W. Liptay, In Excited States, EC.
Lim, ed. Academic Press New York, Vol 1, p 129, 1974.
4 a) DE. Freeman, W. Klemperer, ./. Chem. Phys , 45, 52, 1966, b) DE.
Freeman, J.R. Lombardi, W. Klemperer,./. Chem. Phys., 45, 58, 1966
5 a) R.J. Visser, P C M . Weisenborn, C.AG.O. Vanna, MP. dellaas, J.M.
Wannan, Chem. Phys Lett, ]04, 38, 1984; b) S.A Jonker, J.M. Wannan,
Chem. Phys. Lett., J_85, 36, 1991; c) RW. Fessenden, P.M. Carton, 11 Paul,
11. Shimamori,./. Phys. C/?em.,83, 1676, 1979.
6 a) E.Z. Lippert, Z, Naturforsch, K)A, 541, 1955, Z. Electmchem., 61, 962,
1957; b) E. Lippert, W. Luder, 11. Boos, Adv. Mol. Spectros., 6, 125, 1956,
c) N. Mataga, Y. Kaifu, M. Koizumi, Bull. Chem. Soc. Jpn., 28, 690, 1955,
d) N. Mataga, Y. Torihashi, Bull Chem. Soc. Jpn., 36, 356, 1963; e) N.
Mataga, Bull. Chem. Soc. Jpn., 36, 620, 654, 1963.
7 B. Koutek, Collect. Czech Commun., 43, 2368, 1978.
8 a) C.J. Scliskar, I. Brand, ./. Am. Chem. Soc 93, 5414, 1971; b) J C.
Werner, R.M. Hoffman, J. Phys. Chem. 77, 1611, 1973.
179

9 a) K.A. Zachariasse, T.V. Haar, A. Hebecker, U. Leinhos, W. Kuhnle, Pure
Appl. Chem., 65, 1705, 1993, b) W. Baumaim, H. Bischof, J.C. Frohling, C.
Brittinger, W. Rettig, K. Rotkiewicz, J. Photochem. Photobiol. A: Chem.,
64* 49, 1992; c) J.C. Tseng and L. A. Singer J. Phys. Chem., 93, 7092,
1989.
10 S. Wang, J. Cai, R. Sadygov and E. C. him J. Phys. Chem., 99, 7416, 1995.
11 a) T. Hagaii, D. Pilloud, P. Suppan, Chem. Phys. Lea., 139, 499, 1987; b) P.
Suppan,,/. Chem. Soc. Faraday Trans. 1, 83, 495, 1987.
12 P.B. Ghosh, M.W. Whitehouse, Biochem. J., 108, 155, 1968.
13 K.W. Street, S.A. Krause, Anal. Lett., 19, 735, 1986.
14 J. Mori, T. Kaino, Phys. Lett. A, 127, 259, 1988.
15 A. Chattopadhyay, Chem. Phys. Lipids., 1, 53, 1990.
16 A. Chattopadhyay,./. Bwphys. 59, 191, 1991.
17 S.F. Forgues, J. Fayet, A. Lopez, ./. Photochem. Photobiol A: Chem., 70,
229, 1993.
18 C. Reichardt, Solvents and Solvent Effects in Organic Chemistry, Chapter 7,
VCH; Weinheim, 1988
19 a) G.S Cox, P.J. Hauptinan, NJ . Turro,,/. Photochem. Photobiol, 39, 597,
1984; b) V. Nagarajan, A.M. Brearly, T. Rang, P.F. Barbara, J. Chem. Phys.
86,3183,1987.
20 a) K.H. Drexhange, In Topics in Applied Physics, Dye Lasers, Vol. 1, F.P
Schafer, ed. Springer: Berlin, 1973; b) AN. Fletcher, Appl. Phys., U, 295,
1977.
21 a) G. Jones II, W.R. Jackson, A.M. Halpern, Chem. Phys. Lett., 72, 391,
1980, b) G. Jones II, W.R. Jackson, C. Choi, W.R. Berginark, J. Phys.
Chem., 89,294,1985.
180

22 H. Langhals, Angew. Chcm. Int. Ed. Engi, 21, 724, 1982
23 P.K. McCarthy, GJ. Blanchard, J. Phys. Chcm. 97, 12205, 1993.
24 J.J.P. Stewart, J. Comput. Chcm., H), 209, 1989.
25 K. Rechthaler, G. Kohler, Chcm. Phys., 189, 99, 1994.
181