ex–dividend day price and volume: the case of 2003 ... tax journal 106 over dividends. elton and...
TRANSCRIPT

Ex–Dividend Day Price and Volume: The Case of 2003 Dividend Tax Cut
105
National Tax JournalVol. LXI, No. 1March 2008
Abstract - We examine the impact of the 2003 dividend tax cut, which removes the differential taxation between dividends and capi-tal gains for individual investors, on the ex–dividend day price and trading volume. We fi nd the ex–dividend day price and volume are affected by taxes, risk, and transaction costs. The ex–dividend day price drop ratio (excess return) increases (decreases) and dividend clienteles weaken after the tax cut. Ex–dividend day abnormal volume among high dividend yield stocks decreases after the tax cut consistent with a diminished motivation for tax–induced trading. Our results suggest that individual investors have a measurable effect on the ex–dividend day price and trading volume.
INTRODUCTION
On May 28, 2003, President George W. Bush signed into law the Jobs and Growth Tax Relief Reconciliation Act
of 2003 (hereafter 2003 Act). The 2003 Act creates lower dividend and capital gains tax rates for individual investors.1 Dividends were previously taxed at the ordinary income tax rate applicable to each taxpayer. However, under the 2003 Act, dividends received by an individual shareholder are taxed at the same rates that apply to capital gains. By removing the preferential tax treatment of capital gains over dividends for individuals, the 2003 Act provides a unique and signifi cant event to study the impact of taxes and individual investors on the ex–dividend day stock price and trading behavior.
Research has focused extensively on ex–dividend day stock behavior. However, there is no consensus on the explanation for the widely documented phenomenon that the ex–dividend day price drops by less than the amount of the dividend. The tax–based explanation attributes this phenomenon to the preferential taxation of capital gains
Ex–Dividend Day Price and Volume: The Case of 2003 Dividend Tax Cut
Yi Zhang & Kathleen A. FarrellUniversity of Nebraska–Lincoln, Lincoln, NE 68588–0490
Todd A. BrownStephen F. Austin State University, Nacogdoches, TX 75962
1 Previously, assets held for more than one year were generally taxed at a maximum net capital gains rate of 20 percent (ten percent for taxpayers in the ten and 15 percent tax bracket). A lower rate of 18 percent (eight percent for taxpayers in the ten and 15 percent tax brackets) applied to capital gains on assets held for more than fi ve years (qualifi ed fi ve–year capital gains). Under the 2003 Act, the maximum net capital gains tax for assets held for more than one year was lowered from 20 to 15 percent (and from ten to fi ve percent for taxpayers in the ten or 15 percent tax bracket). These new rates apply to sales and exchanges and payments received on or after May 6, 2003.

NATIONAL TAX JOURNAL
106
over dividends. Elton and Gruber (1970) proposed the tax clientele theory that the ex–dividend day price drop ratio (PDR) reflects the relative tax rates between dividends and capital gains. Extending the tax clientele theory, Michaely and Vila (1995) propose the dynamic trading clien-tele theory which argues that investors with differential tax–induced valuation of dividends and capital gains trade with each other around the ex–dividend day, so as to determine the ex–dividend day price and trading volume. The dynamic trading clientele theory combines tax motivations, transaction costs, and the risk tolerance of investors. Two alternative explanations that challenge the tax–based explanation include the short–term arbitrage theory proposed by Kalay (1982). He argues that arbitrageurs dominate the market and exploit any difference between the ex–dividend day price and the dividend such that any difference remaining is equal to transaction costs. Because arbitrageurs dominate the market in the short–term trading theory, tax changes that impact only individuals would not be predicted to impact the ex–dividend day PDR. Sec-ondly, market microstructure arguments suggest that price discreteness (e.g., Bali and Hite, 1998) or bid–ask bounce (e.g., Frank and Jagannathan, 1998) causes the ex–dividend day price drop to be less than the dividend.
Our paper attempts to determine the role of taxes and individual investors in the determination of stock prices and trading volume around the ex–dividend day. We analyze the ratio of price drop to dividend on the ex–dividend day, the excess return and trading volume around the ex–dividend day before and after the 2003 Act. We examine stocks that pay regular taxable cash dividends, excluding closed–end funds, unit investment trusts, exchange traded funds (ETFs), American depository receipts (ADRs), and real estate investment trusts (REITs), between
February 2001 and December 2005. By beginning our analysis in February 2001, we avoid the change in the market micro-structure and transaction costs associated with stocks converting to decimal quota-tions through the end of January 2001. We also attempt to address whether indi-vidual investors have a signifi cant effect on ex–dividend price behavior around the 2003 dividend tax cut.
Our results support the tax–based explanation for ex–dividend day price and trading behavior. With the removal of the preferential taxation for capital gains over dividends, the ex–dividend day PDR increases and moves toward one while the excess return decreases and moves toward zero. Our results show the dividend clienteles, either in the form of long–term buy and hold clienteles in the model of Elton and Gruber (1970) or in the form of trading clienteles in the model of Michaely and Vila (1995), weaken after the 2003 Act. Also with the reduction of the tax heterogeneity among investors, ex–dividend day abnormal trading vol-ume among high dividend yield stocks signifi cantly decreases after the 2003 Act consistent with a diminished motivation for tax–induced trading.
We also fi nd signifi cant effects associated with transaction costs on the ex–dividend day PDR, excess return and trading vol-ume and risk on the ex–dividend day PDR, and trading volume. These fi ndings are consistent with predictions of the dynamic tax–motivated trading clientele model of Michaely and Vila (1995). Furthermore, given that the 2003 Act only changes the tax rates for individual investors and not tax–exempt institutional investors or cor-porate investors, our results suggest that individual investors have a measurable effect on the ex–dividend day stock price and trading behavior.
Our study contributes to the literature in the following ways. First, we are among the few to analyze the recent tax cut and its

Ex–Dividend Day Price and Volume: The Case of 2003 Dividend Tax Cut
107
associated effects on both the ex–dividend day price formation and tax–motivated trading activities around the ex–dividend day in a comprehensive setting. Although other studies analyze the 2003 dividend tax cut, many focus on the tax cut’s impact on corporate dividend payouts or the markets reaction to the dividend tax cut (e.g., Amromin, Harrison, and Sharpe, 2006; Auerbach and Hassett, 2006; Chetty and Saez, 2006; and Howton and Howton, 2006). An exception is Chetty, Rosenberg, and Saez (2007) who analyze the effect of the 2003 dividend tax cut on ex–dividend day price and excess returns, but do not examine trading volume. Cloyd, Li, and Weaver (2006) focus on both the effect of price discreteness and the 2003 tax cut on excess returns and trading volume, but their post–Act time period is very short, ending in December of 2003. If individual investor taxes impact security prices, excess returns, and trading volume, this, in turn, can affect various facets of corporate fi nance, governmental revenue collection, and financial investments. Second, our study provides additional empirical support for the tax–motivated trading clientele model of Michaely and Villa (1995). Lastly, our study suggests that tax laws that infl uence the relative taxation of individual investors affect individual investors’ trading behavior and the price formation of dividend pay-ing stocks.
This paper is organized as follows. The first section describes the related literature regarding the ex–dividend day PDR, excess return and trading volume, and develops our hypotheses on the effect of the 2003 tax cut on the ex–dividend day market behavior. The second section
describes our data and empirical meth-odology. The third section presents our empirical results and the fourth section concludes the study.
THEORY AND HYPOTHESES
Miller and Modigliani (1961) show that when a stock goes ex–dividend, its price theoretically should drop by the amount of the dividend. However, empirical research has widely documented that the price drop is less than the amount of the dividend.2 There are many explanations for this phe-nomenon, including the differential tax treatment of capital gains and dividends.
Miller and Modigliani (1961) fi rst pro-pose the idea of dividend clienteles. They argue that while dividend policy may be irrelevant in determining a corporation’s value, in imperfect capital markets in which dividends are taxed more heavily than capi-tal gains, investors could form “clienteles” so that investors in high tax brackets hold low dividend yield stocks, while investors in low tax brackets hold high dividend yield stocks. Elton and Gruber (1970) argue that differential taxation of dividends and capital gains affects the behavior of prices on the day stocks pay dividends. In their model, marginal investors are long–term investors, who should be indifferent to selling on the cum–dividend day or ex–dividend day.3 In equilibrium, ignoring transaction costs and risk, the PDR refl ects the ratio of differential tax rates between dividends and capital gains:
[1] PDR =P P
Dtt
cum ex d
c
− = −−11
where
2 See for example, Campbell and Beranek (1955), Elton and Gruber (1970), Kalay (1982), Lakonishok and Ver-maelen (1983), Barclay (1987), Karpoff and Walkling (1990).
3 As described by Elton, Gruber, and Rentzler (1984), at the time of the original Elton and Gruber (1970) analysis, transaction costs were suffi ciently high to ensure that short–term traders were not setting equilibrium prices on the ex–dividend day.

NATIONAL TAX JOURNAL
108
Pcum is the cum–dividend day price,Pex is the expected ex–dividend day
price,D is the dividend amount,td is the dividend tax rate and tc is the capital gains tax rate.
The tax effect on the ex–dividend day share price can also be expressed in terms of excess return. The ex–dividend day realized return is equal to
[2] P D PP
P PD
DP
t
ex cum
cum
cum ex
cum
+ − = − −⎛⎝⎜
⎞⎠⎟
× =
1
dd c
c cum
tt
DP
−−1
*
as implied by the static tax clientele model of Elton and Gruber (1970). The excess return for the ex–dividend day is the realized daily return subtracted from the expected return.
Many studies have used changes in tax laws to test the tax clientele theory (or long–term trading hypothesis) of Elton and Gruber (1970). Evidence support-ing the tax effect is provided by several studies, e.g., Barclay (1987), Robin (1991), Lasfer (1995), Koski (1996), Lamdin and Hiemstra (1993), Poterba and Summers (1984), Bell and Jenkinson (2002), and Gra-ham, Michaely, and Roberts (2003). How-ever, Michaely (1991) fi nds the 1986 Tax Reform has no effect on the ex–dividend day price behavior. Michaely argues that individual investors are less infl uential while institutional and corporate traders play a more signifi cant role on the ex–divi-dend day price behavior when transaction costs are lower. If the marginal investor is the corporate investor, who has prefer-ential taxation of dividends over capital gains, then the PDR should be greater than one. Eades, Hess, and Kim (1984) fi nd evidence consistent with the tax clienteles if the marginal investors are corporations. Elton, Gruber, and Blake (2005) revisit the tax clientele theory by studying taxable
versus nontaxable closed–end funds. They fi nd the PDR for nontaxable closed–end funds is larger than one, which is consis-tent with the prediction of the tax theory as dividend tax rates are lower than capital gains tax rates.
Several studies extend the work of Elton and Gruber (1970), to investigate how the interaction of taxes, transaction costs, and risk affects ex–dividend day price and volume. Michaely and Vila (1995) develop a dynamic model where ex–dividend day price and volume is a function of tax het-erogeneity among traders, aggregate risk tolerance and risk of the individual stock around the ex–dividend day. Investors with differential tax–induced valuation of dividends and capital gains trade with each other around the ex–dividend day which can generate higher volume, higher excess return and a PDR less than one. In the Michaely and Vila model, the PDR refl ects the relative tax rates of all market participants, not just the marginal trader’s:
[3] E PDRX K
D D Pe( )
( / )/
= − = −α σ α ν2
where α− is the average of investors’ rela-tive tax preference of dividend to capital gains weighted by their risk tolerance; X is the aggregate demand for securities on the ex–dividend day; σe
2 is the ex–dividend day variance; K is the aggregate risk toler-ance and ν is the risk premium.
Michaely and Vila (1995) also show that trading volume around the ex–dividend day is positively related to tax heterogene-ity and negatively related to transaction costs and risk resulting from the devia-tion from an otherwise optimal portfolio. Empirical support for the dynamic tax–motivated trading hypothesis is provided by Michaely and Murgia (1995), Michaely and Vila (1996), Wu and Hsu (1996), and Dhaliwal and Li (2006).
Alternatively, the short–term trading theory is based on the premise that mar-ket pricing is dominated by short–term
Ex–Dividend Day Price and Volume: The Case of 2003 Dividend Tax Cut
109
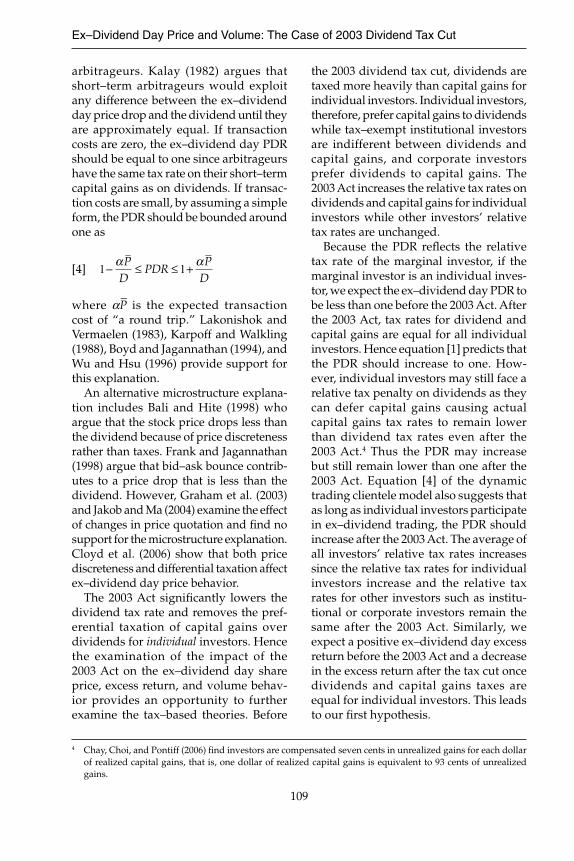
arbitrageurs. Kalay (1982) argues that short–term arbitrageurs would exploit any difference between the ex–dividend day price drop and the dividend until they are approximately equal. If transaction costs are zero, the ex–dividend day PDR should be equal to one since arbitrageurs have the same tax rate on their short–term capital gains as on dividends. If transac-tion costs are small, by assuming a simple form, the PDR should be bounded around one as
[4] 1 1− ≤ ≤ +α αPD
PDRP
D
where αP–
is the expected transaction cost of “a round trip.” Lakonishok and Vermaelen (1983), Karpoff and Walkling (1988), Boyd and Jagannathan (1994), and Wu and Hsu (1996) provide support for this explanation.
An alternative microstructure explana-tion includes Bali and Hite (1998) who argue that the stock price drops less than the dividend because of price discreteness rather than taxes. Frank and Jagannathan (1998) argue that bid–ask bounce contrib-utes to a price drop that is less than the dividend. However, Graham et al. (2003) and Jakob and Ma (2004) examine the effect of changes in price quotation and fi nd no support for the microstructure explanation. Cloyd et al. (2006) show that both price discreteness and differential taxation affect ex–dividend day price behavior.
The 2003 Act signifi cantly lowers the dividend tax rate and removes the pref-erential taxation of capital gains over dividends for individual investors. Hence the examination of the impact of the 2003 Act on the ex–dividend day share price, excess return, and volume behav-ior provides an opportunity to further examine the tax–based theories. Before
the 2003 dividend tax cut, dividends are taxed more heavily than capital gains for individual investors. Individual investors, therefore, prefer capital gains to dividends while tax–exempt institutional investors are indifferent between dividends and capital gains, and corporate investors prefer dividends to capital gains. The 2003 Act increases the relative tax rates on dividends and capital gains for individual investors while other investors’ relative tax rates are unchanged.
Because the PDR refl ects the relative tax rate of the marginal investor, if the marginal investor is an individual inves-tor, we expect the ex–dividend day PDR to be less than one before the 2003 Act. After the 2003 Act, tax rates for dividend and capital gains are equal for all individual investors. Hence equation [1] predicts that the PDR should increase to one. How-ever, individual investors may still face a relative tax penalty on dividends as they can defer capital gains causing actual capital gains tax rates to remain lower than dividend tax rates even after the 2003 Act.4 Thus the PDR may increase but still remain lower than one after the 2003 Act. Equation [4] of the dynamic trading clientele model also suggests that as long as individual investors participate in ex–dividend trading, the PDR should increase after the 2003 Act. The average of all investors’ relative tax rates increases since the relative tax rates for individual investors increase and the relative tax rates for other investors such as institu-tional or corporate investors remain the same after the 2003 Act. Similarly, we expect a positive ex–dividend day excess return before the 2003 Act and a decrease in the excess return after the tax cut once dividends and capital gains taxes are equal for individual investors. This leads to our fi rst hypothesis.
4 Chay, Choi, and Pontiff (2006) fi nd investors are compensated seven cents in unrealized gains for each dollar of realized capital gains, that is, one dollar of realized capital gains is equivalent to 93 cents of unrealized gains.

NATIONAL TAX JOURNAL
110
Hypothesis 1a: The PDR for dividend paying stocks should increase after the 2003 Act and become closer to one.
Hypothesis 1b: The ex–dividend day excess return for dividend paying stocks should decrease after the 2003 Act and become closer to zero.
The dividend clientele theory states that investors in high (low) tax brackets will prefer low (high) dividend pay-ing stocks when there is preferential taxation of capital gains to dividends. Thus, the implied relative tax rates for marginal investors should decrease with dividend yields. As the PDR refl ects the marginal investor’s tax rate, it should be an increasing function of dividend yield. When the tax differential for individual investors disappears (or weakens due to the deferability of capital gains) after the 2003 Act, equation [1] predicts that the dividend clientele effect will disappear (or weaken). However, to the extent that transaction costs are important and dividend yield proxies transaction costs, the relation between the PDR and the dividend yield becomes uncertain. As dividend yield increases, more indi-vidual investors can participate in the ex–dividend day trading due to the lower transaction costs, which will change the aggregate average relative tax rate.5 Thus, the relation between the PDR (or excess return) and dividend yield becomes an empirical question. Our second hypoth-esis follows.
Hypothesis 2a: The PDR should be posi-tively correlated with the dividend yield before the 2003 Act and the correlation should weaken or disappear after the 2003 Act.
Hypothesis 2b: The ex–dividend day excess return should be positively cor-related with the dividend yield before the 2003 Act and the correlation should weaken or disappear after the 2003 Act.
The dynamic trading clientele theory predicts a large abnormal volume (AV) around the ex–dividend day. Also tax–induced trading around the ex–dividend day results from the differential valuations of dividends versus capital gains among market participants. Because the 2003 Act not only removes the tax heterogene-ity among individual investors, but also aligns the tax differential of individual investors with institutional investors and arbitrageurs, the gains of trading become smaller. With the reduction of tax–induced trading motives, ex–dividend day trading volume should decrease. This leads to our third hypothesis.
Hypothesis 3: The trading volume around the ex–dividend day should decrease after the 2003 Act.
Transaction costs play an important role in trading behavior. Trading around the ex–dividend day may be unprofi table when traders face large transaction costs. Since low dividend yield stocks have rela-tively higher transaction costs than high dividend yield stocks, stocks with a high dividend yield are more likely to show a signifi cant amount of tax–induced trading around the ex–dividend day. Hence, we expect the decrease in the ex–dividend day trading volume to be more signifi -cant for high dividend yield stocks. Risk, just like transaction costs, discourages trading around the ex–dividend day. As implied by the dynamic trading model of Michaely and Vila (1995), trading volume is a decreasing function of transaction costs
5 See Cloyd et al. (2006) for further discussions of how the positive relation between dividend yield and ex–day abnormal returns may be mitigated by heterogeneous tax rates across investors.

Ex–Dividend Day Price and Volume: The Case of 2003 Dividend Tax Cut
111
and risk. Therefore our last hypothesis is as follows.
Hypothesis 4: Trading volume is positively related to dividend yield and negatively related to risk and transaction costs.
Given that the 2003 Act only lowers dividend tax rates for individuals, any signifi cant changes on the ex–dividend day price behavior before and after the tax cut would suggest that the ex–dividend day price refl ects individual investors’ relative tax rates on dividends and capital gains. This would suggest that individual investors’ preferences have a measurable impact on ex–dividend day price forma-tion and trading behavior.
DATA AND METHODOLOGY
We collect data from the Center for Research in Security Prices (CRSP). We examine fi rms that pay taxable regular cash dividends (distribution codes 1222, 1232, 1242, and 1252) to their common stockhold-ers (share codes 10, 11, and 12).6 We exclude closed–end funds, unit investment trusts, ETFs, ADRs, and REITs because of their different tax treatment and more complex distributions. We eliminate observations where the dividend was less than one cent,7 where there was no trade on the ex–dividend date, or the price was lower than fi ve dollars.8 By the end of January 2001, all New York Stock Exchange (NYSE)
stocks had converted their price quotations to decimals.9 Thus, we choose February 2001 as the starting point of our study to avoid the possible effect of the change in the market microstructure. We eliminate year 2003 as the transition year since there may be a lag in investors’ restructuring of their portfolios.10 Therefore we use 2001 (excluding January) and 2002 to represent a distinct pre–Act period and 2004 and 2005 to represent a distinct post–Act period.
To estimate the PDR, we adopt a method-ology similar to Michaely (1991). We adjust the ex–dividend day closing price by the expected daily return of the stock.11 We esti-mate the expected return using the market model over the window –45 to –2 and +2 to +45, where day zero is the ex–dividend day and the market return is the value–weighted market portfolio (including distributions). Our event window is the same that is used by Michaely and Vila (1995)
[5] PDRP
PE r
Di
i cumi ex
i
i
=−
+,,
( )1
where
Pi,cum is the cum–dividend day closing price for stock i,
Pi,ex is the ex–dividend day closing price for stock i,
E(ri) is the expected daily return of stock i, estimated by the market model, and
Di is the dividend amount for stock i.
6 The share and distribution codes are the same as those used for the announcement analysis in Chetty et al. (2007).
7 The minimum tick size is one cent. 8 Following Elton, Gruber, and Blake (2005) among others, we eliminate observations with prices below fi ve
dollars because for low–priced securities, the bid/ask spread is large relative to the dividend and introduces noise into our analysis.
9 See details in Graham et al. (2003).10 Our data show that the PDR is extremely high in the second quarter of 2003 when the Act is enacted and the
PDRs of the third and fourth quarter of 2003 are still close to that of 2002, which implies a lag. 11 The natural ex–dividend price is the opening price. But the opening price is biased because all orders on the
books are adjusted by the amount of the dividend. Therefore, we use closing prices and adjust for the daily return on the ex–dividend day (e.g., Elton et al., 2005; Lamdin and Hiemstra, 1993; and Wu and Hsu, 1996).

NATIONAL TAX JOURNAL
112
Due to the large variation in our divi-dend distribution sample, we winsorize the data at the 2.5 percent level to reduce the effect of outliers.12 Furthermore, fol-lowing Michaely (1991), we correct two sources of heteroskedasticity: the securi-ty’s variance and the dividend yield effect. The stock variance is calculated from the market model and dividend yield is calcu-lated as the amount of the cash dividend divided by the cum–dividend price. As shown in Michaely (1991), the covariance matrix of the disturbances of ex–dividend day PDR is
Ωiji id if i j
otherwise=
⎧⎨⎪
⎩⎪
=σ 2 2
0
/
where σi2 is the variance of stock i, esti-
mated from the market model, and di is the dividend yield on stock i.
So the mean PDR is calculated using weighted least squares where:
[6] PDRd PDR
d
i i ii
n
i ii
n=×
=
=
∑
∑
( / )
( / )
2 2
1
2 2
1
σ
σ.
In addition, we use the median of the PDR since the price drop ratio may not be normally distributed. The Wilcoxon sign test is used to test the median difference from one and Wilcoxon–Mann–Whitney test is used to test the difference in the PDR before and after the 2003 Act. The two–sided p–value is reported in the tables.
We also analyze the ex–dividend day excess returns to further examine the ex–dividend day price behavior. We cal-culated the ex–dividend day excess return on stock i as
[7] P D P
PE ri ex i i cum
i cumi
, ,
,
( )+ −
− .
Besides the ex–dividend day, we exam-ine returns of ten days surrounding the ex–dividend day. Our study window is [–5, +5], where day zero is the ex–dividend day. We use [–45, –6] and [6, 45] as our esti-mation window to calculate the expected return by the market model. We adopt the weighted least squares with the inverse of the standard deviation of the estimation period return as the weight to correct for heteroskedasticity.
Following Michaely and Vila (1995), risk is measured by the variance of the security’s return scaled by the variance of the market returns during the estimation period of the market model. Similar to Michaely and Vila (1996), we use market capitalization on the cum–dividend day as a proxy for transaction costs. Our assump-tion is that large–capitalization stocks are more liquid and have lower transaction costs. To reduce the effect of outliers, we specify the variable as the natural loga-rithm of market capitalization.
Similar to Michaely and Vila (1995) and Graham et al. (2003), we measure trading volume by stock turnover. Daily turnover is defi ned as the ratio of daily shares traded to shares outstanding. We compute the average turnover from the average daily turnover for days –45 to –6 and +6 to +45
[8] ATOTO
Ti
itt= ∈ − − ∪ + +∑ [ , ] [ , ]45 6 6 45
where TOit is the daily turnover for secu-rity i on day t, and T is the number of days with valid volume observations in the esti-mation period. Then for each day in the
12 Graham et al. (2003) trim the top and bottom 2.5 percentiles of premium to reduce the effect of outliers in their analysis. As an alternative to winsorizing our data, we trim the top and bottom 2.5 percentiles and the results are qualitatively the same as those reported in the paper.

Ex–Dividend Day Price and Volume: The Case of 2003 Dividend Tax Cut
113
event window [–5, +5], we calculate the AV as the difference between the stock’s actual to average turnover, relative to the average turnover:
[9] AVTO ATO
ATOitit i
i
= −
The mean daily AV for the sample is computed as
[10] AVAV
Ntt
iti
N
= ∈ − +=∑1 5 5[ , ]
We also compute the cumulative abnor-mal volume (CAV) of 11 days around the ex–dividend day. The mean of CAV is cal-culated in the same way as the mean of AV. T–statistics for the volume are calculated using the cross–sectional estimates of the variance of abnormal volume. Given that the daily turnover data is highly skewed, we winsorize the daily AV data at the 2.5 percent level. Data with missing or nega-tive trading volume are deleted from the sample.
EMPIRICAL RESULTS
We begin by providing some overall statistics regarding the dividend behav-ior of fi rms (share codes 10–12) tracked by CRSP (distribution codes 1222, 1232, 1242, and 1252) between the period 2001 and 2005 in Table 1.13 We eliminate fi rms paying less than a one–cent regular dividend and fi rms with a stock price lower than fi ve dollars. Based on these restrictions, the number of fi rms paying regular dividends has increased from 1,751 fi rms in 2001 to 1,898 fi rms in 2005. The number of dividend initiations and the number of fi rms continuing to pay dividends has similarly increased over the period with a corresponding decline in the number of fi rms discontinuing dividends. Most dramatically, the number of fi rms initiating dividends more than doubled between 2002 and 2003 (102 to 215) and the number of fi rms discontinuing dividends went from 310 in 2001 to 119 in 2003.14 We also document an increasing average annual dividend per share which during the pre–Act period was 0.536 and 0.546
TABLE 1SUMMARY OF DIVIDEND PAYMENT
Number of fi rms paying dividendsNumber of fi rms initiating dividendsNumber of fi rms discontinuing dividendsNumber of fi rms continuing dividends
Number of fi rms increasing dividendsNumber of fi rms with no change in dividendsNumber of fi rms decreasing dividends
Average annual dividend amount per sharePercentage change in dividendAverage annual dividend yield
2001
1,751112310
1639
707798134
0.5361.13%2.57%
2002
1,661102192
1559
619798142
0.5461.87%2.47%
2003
1,757215119
1542
715684143
0.5470.18%2.36%
2004
1,847190100
1657
844678135
0.5602.38%2.11%
2005
1,898181130
1717
898659160
0.583
4.11%2.16%
Note: This table provides summary of fi rms (share codes 10–12) paying regular dividends (distribution codes 1222, 1232, 1242, and 1252) between 2001 and 2005. Firms paying lower than one–cent dividend or with price lower than fi ve dollars are eliminated. Percentage change in dividend is calculated as (average annualized dividend per sharet – average annualized dividend per sharet–1)/average annualized dividend per sharet.
13 We eliminate share codes for closed–end funds, unit investment trusts, ETFs, ADRs, REITs, and distribution codes for unknown, unspecifi ed, special, interim, and non–recurring dividends.
14 Our results appear consistent with Chetty and Saez (2006) who provide detailed analyses of the effect of the dividend tax cut on overall corporate payout policy.

NATIONAL TAX JOURNAL
114
in 2001 and 2002, respectively, while the average annual dividend per share during the post–Act period was 0.560 and 0.583 in 2004 and 2005, respectively.
Table 1 shows that the composition of fi rms paying dividends across time may be changing substantially. Chetty and Saez (2006) also fi nd that the 2003 Act induced many fi rms to initiate dividend payments. To avoid introducing a composition bias into the sample, we restrict the remainder of our analysis to fi rms that pay dividends in all four years of the pre– and post–Act periods that results in a sample of 1,278 fi rms. Firms may change the amount or fre-quency of distribution of dividends during the pre– and post–Act periods, however.15
PDR AND EXCESS RETURN ANALYSIS
Next we turn our focus to Table 2, Panel A where we present descriptive statistics for the ex–dividend day PDR for each of the four years around the 2003 Act. Unless otherwise noted, all results reported for the PDR are based on the winsorized data to reduce the effect of outliers caused by the large variation in the PDR that arises from a large price change or a tiny dividend. First we note that there are 4,318 and 4,713 dividend distribution events in 2001 and 2002, respectively, while the number of payouts is 4,772 and 4,677 in 2004 and 2005, respectively. Although we restrict the analysis to 1,278 fi rms that pay
TABLE 2EX–DIVIDEND DAY PDR
Year
Median(Sign test p value)Mean(t–stat)MinMax S.DSample size
2001
0.510***(0.00)
0.653***(9.68)–18.8120.616.684,318
2002
0.613***(0.00)
0.645***(11.14)–16.1318.245.814,713
2004
0.763***(0.00)
0.857***(5.92)–13.3714.634.644,772
2005
0.757***(0.00)
0.870***(5.65)–13.9014.674.624,677
Panel A: PDR for Taxable Quarterly Dividends
Panel B: Difference in PDR
Median(Wilcoxon p value)Mean(t–stat)Sample size
Pre–Act
0.562***(0.00)
0.648***(14.74)9,031
Post–Act
0.759***(0.00)
0.864***(8.17)9,449
Post–Pre
0.197***(0.00)
0.215***(7.40)18,480
Difference(02–01)
0.105***(0.04)–0.009(–0.18)9,031
Difference(05–04)
–0.006(0.50)0.012(0.37)9,449
Notes: PDR is defi ned as the cum–dividend day closing price minus the ex–dividend day closing price (adjusted by the expected daily return) divided by the dividend amount. The expected daily return is estimated using the market model with estimation period [–45, –6] and [6, 45]. The market return is defi ned as the return of the value–weighted market portfolio including distributions. The mean has been corrected for two sources of het-eroskedasticity: the security’s variance and the dividend yield effect. Data are winsorized at [2.5%, 97.5%]. The sample includes taxable dividend payments (distribution codes 1222, 1232, 1242, and 1252) of common stocks (share codes 10–12) in 2001 (excluding January), 2002, 2004, and 2005. Pre–Act period is from February 1, 2001 to December 31, 2002; Post–Act period is from January 1, 2004 to December 31, 2005. Wilcoxon sign test p–values are reported for testing the median equal to one and t–statistics are reported for testing the mean equal to one. In Panel B, Wilcoxon–Mann–Whitney test two side p–values are reported for testing the difference in the medians equal to zero and t–statistics are reported for testing the difference in the means equal to zero.*, **, and *** indicate statistical signifi cance at the 10%, 5%, and 1% levels, respectively.
15 To determine the sensitivity of our results to requiring fi rms to pay dividends over all four years of the pre– and post–Act period, we estimate all of our model specifi cations with the full sample of fi rms that meet the share and distribution code requirements. Our results are qualitatively the same as those reported unless otherwise noted in the paper.

Ex–Dividend Day Price and Volume: The Case of 2003 Dividend Tax Cut
115
dividends in all four years, our dividend distribution sample sizes are not equal for several reasons. First, we only capture 11 months of distributions in 2001 due to decimalization. Second, firms may increase or reduce the frequency of pay-ment over the four–year period.
As shown in Panel A of Table 2, the mean PDR is signifi cantly lower than one before the tax cut: 0.653 for 2001 and 0.645 for 2002. After the 2003 Act the mean PDR increases to 0.857 in 2004 and 0.870 in 2005. Analyzing the medians generates similar results. The median PDR increases from 0.510 in 2001 and 0.613 in 2002 to 0.763 in 2004 and 0.757 in 2005.16 Despite the signifi cant increase in the PDR from 2002 to 2004, the PDR remains signifi cantly less than one. This phenomenon may result from individual investors’ ability to defer capital gains which causes capital gains tax rates to remain lower than dividend tax rates for individual investors even after the 2003 Act. Alternatively, a PDR that is less than one is also consistent with the dynamic trading model of Michaely and Vila (1995). Even when the average relative tax rate is one, the risk involved in the ex–dividend day trading results in a PDR that is less than one (see, for example, equation [4]).
We also test the structural change in the PDR by dividing the sample into pre– and post–Act periods, as presented in Panel B of Table 2. The median (mean) PDR increases after the 2003 Act from 0.562 (0.648) to 0.759 (0.864), respectively. The increase in both the median and mean PDR from the pre– to post–Act period is statistically signifi cant at the one percent level. Furthermore there is no signifi cant shift in the mean PDR between 2001 and 2002 or between 2004 and 2005. These results suggest a structural change between the pre– and post–Act periods, thus lending support to our fi rst
hypothesis. Absent any shift in the market microstructure such as price discreteness or bid–ask bounce, the structural change in the PDR is associated with the dividend tax cut. Therefore, our data support the tax–based theory on the ex–dividend day price behavior. The relative taxation of dividends and capital gains does affect the ex–dividend day price behavior of stocks.
One potential limitation to our analysis is that we analyze a short–window around the reform. Chetty et al. (2007) perform a similar analysis of the PDR around the 2003 Act and fi nd that although the PDR does rise signifi cantly after the Act, the magnitude of the increase is in large part due to the unusually low value of the PDR during the 2000–2002 period. They argue that there is a time series pattern in the PDR that appears to be unrelated to taxes. To address this concern, we calculate the PDR for 1998 and 1999 since this period captures a similar dividend tax regime as in the 2001 and 2002 period. In results not shown, we calculate the full sample winsorized mean (median) PDR to be 0.754 (0.647) and 0.707 (0.629) for 1998 and 1999, respectively. In 2001 and 2002, we calculate the mean (median) PDR for the full sample to be 0.698 (0.475) and 0.671 (0.558), respectively. We do not restrict the sample to dividend payers for the fi ve–year period between 2001 and 2005 since this would impose an additional survivorship bias on the sample if we extend this requirement back to 1998. Consistent with the fi ndings of Chetty et al. (2007) and Graham et al. (2003), we note that the mean and median PDRs in 1998 and 1999 are higher than the PDRs in 2001 and 2002. However, in our sample of fi rms, the mean and median PDR after the 2003 Act remains signifi cantly higher than the respective PDRs of 1998 and 1999. Although it appears that the PDR
16 Our PDR calculations appear reasonable compared to Chetty et al. (2007) who document a median premium of 0.61 in 2002 and 0.74 for 2004.

NATIONAL TAX JOURNAL
116
in 2001 and 2002 is unusually low relative to other time periods, our conclusion that taxes have a signifi cant effect on the PDR appears robust to the choice of alternative pre–Act periods.
Similarly, Table 3 presents the excess returns for ten days surrounding the ex–dividend day for our four year sample period. Consistent with the PDR results, ex–dividend day excess returns are sig-nifi cantly positive. The ex–dividend day excess return is 0.319 percent in 2001 and 0.283 percent in 2002, and it decreases to 0.108 percent in 2004 and 0.119 percent in 2005. Consistent with Eades et al. (1984) and other studies, we fi nd excess returns are not unique for the ex–dividend day. The fi ve trading days before the ex–divi-dend day generally have positive excess returns while the fi ve trading days after the ex–dividend day generally have negative excess returns or excess returns insignifi cantly different from zero. But the excess returns of the ex–dividend day are much larger in magnitude compared to other trading days. These patterns can be seen from Figure 1. Figure 1 also illustrates
that excess returns for days surrounding the ex–day in the post–Act period are smaller and less volatile than those in the pre–Act period.
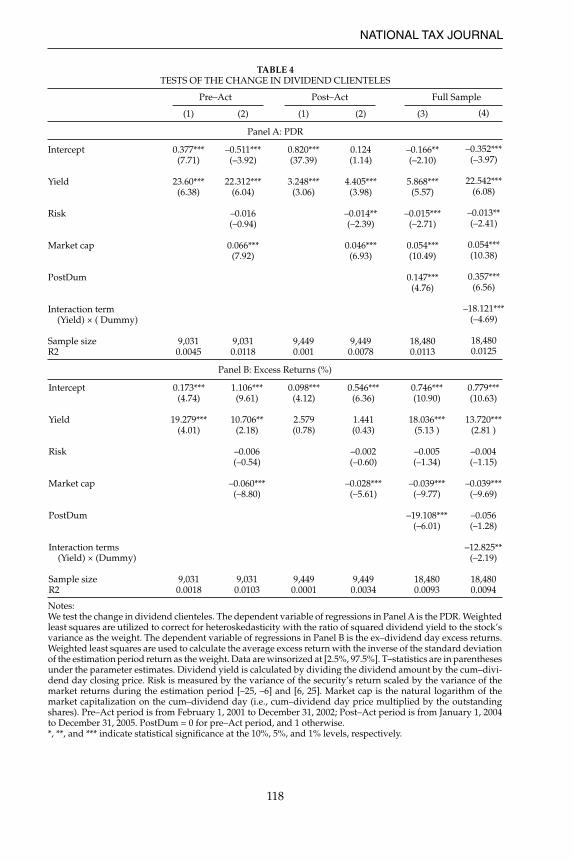
To examine the relation between the dividend yield and the PDR, we perform regressions where PDR is our dependent variable, as shown in Table 4, Panel A. Consistent with the predictions of the dividend clientele theory, regression (1) shows that there is a positive and sig-nifi cant relation between dividend yield and PDR in both the pre– and post–Act periods. The coeffi cient on the dividend yield in the post–Act period is much smaller than that in the pre–Act period, indicating the weakening of the dividend yield effect. Based on the dynamic trading clientele theory, we include a proxy for risk (σi
2/ σm2) and transaction costs (log of
market capitalization) in regressions (2), (3), and (4). Consistent with the theory, we find a significant negative relation between risk and a signifi cant positive relation between market capitalization and the PDR in all but one specifi cation (Pre–Act) where risk is insignifi cant.17 In
TABLE 3EXCESS RETURN FOR THE TEN DAYS SURROUNDING THE EX–DIVIDEND DAY
2001 2002 2004 2005
Day
–5–4–3–2–1012345
ER(%)
0.041 0.017–0.002 0.016 0.159*** 0.319*** 0.028 0.016–0.062**–0.026 0.003
t–stat
1.41 0.60–0.09 0.59 5.6710.77 0.97 0.58–2.21–0.90 0.13
ER(%)
0.080*** 0.067*** 0.061**–0.003 0.038*** 0.283***–0.037 0.038–0.046* 0.031–0.015
t–stat
3.38 2.66 2.52–0.14 1.5911.33–1.46 1.57–1.85 1.35–0.63
ER(%)
0.014 0.045**–0.025 0.055*** 0.052*** 0.108*** 0.010 0.002 0.043*–0.039**–0.012**
t–stat
0.73 2.45–1.36 3.12 2.99 6.01 0.56 0.09 1.77–2.20–0.68
ER(%)
0.018 0.044** 0.019–0.010 0.042** 0.119*** 0.047 0.018 0.027–0.015–0.045***
t–stat
0.88 2.50 1.10–0.48 2.13 6.54 2.76 1.04 1.51–0.88–2.77
Notes: The excess return is the return above that predicted by the market model. The market return is defi ned as the return of the value–weighted portfolio including distributions. The estimation period for the market model is [–45, –6] and [6, 45]. Weighted least squares are used to calculate the average excess return with the inverse of the standard deviation of the estimation period return as the weight. Excess returns in the 11–day event window [–5, +5] are presented (ex–dividend day = 0). T–statistics are for testing the null hypothesis that mean excess return is zero. Pre–Act period is from February 1, 2001 to December 31, 2002; Post–Act period is from January 1, 2004 to December 31, 2005. *, **, and *** indicate statistical signifi cance at the 10%, 5%, and 1% levels, respectively.
17 If we estimate Panel A of Table 4 for the full sample of fi rms without restricting the sample to dividend payers in all four years, the risk measure becomes insignifi cant in the post–Act period.

Ex–Dividend Day Price and Volume: The Case of 2003 Dividend Tax Cut
117
the pre–Act period, the dividend yield effect is very strong, which may dominate the effect of risk. Because stocks with large fi rm size tend to have lower transaction costs, the positive relation between the PDR and market capitalization indicates a negative association between transac-tion costs and the PDR. The 2003 Act sig-nifi cantly increases the average PDR even after controlling for dividend yield, risk, and market capitalization, as refl ected in the signifi cant positive coeffi cient on a post–Act dummy variable in regression (3). In column 4, we interact the dividend yield with our post–Act dummy variable to further determine whether dividend clienteles weaken after the reduction in dividend taxes for individuals. The coef-fi cient on the interaction term (–18.121) is negative and signifi cant, suggesting that the dividend clienteles weaken signifi -cantly after the 2003 Act.
We similarly analyze the relation between dividend yield and ex–dividend day excess returns with results reported in Panel B of Table 4. Regression (1) shows that the dividend yield effect is signifi cant in the pre–Act period and is insignifi cant in the post–Act period. Regression (2)
shows that market capitalization has a signifi cant effect on excess returns in both pre– and post–Act periods, indicating that transaction costs have a signifi cant positive effect on ex–dividend day excess returns. Risk, however, is insignifi cant in all model specifi cations, consistent with the fi nding of Michaely and Villa (1995). They argue that this result is consistent with the notion that only beta risk is priced, as excess returns are already beta adjusted.
We also test the structural change in ex–dividend day excess returns before and after the 2003 Act. The average excess return declines after the tax cut, as reflected in the significant negative coeffi cient on a post–Act dummy vari-able in regression (3). This result lends further support to our fi rst hypothesis that the relative taxation of dividends and capital gains does affect the ex–dividend day excess return behavior of stocks. We further add the interaction term of the dividend yield with the post–Act dummy variable into regression (4). The excess return is positively related to the dividend yield, but the relation weakens in the post–Act period, as indicated by
Figure 1. Excess Return for the Ten Days Surrounding the Ex–dividend Day
NATIONAL TAX JOURNAL
118
TABLE 4TESTS OF THE CHANGE IN DIVIDEND CLIENTELES
Panel A: PDR
Pre–Act Post–Act Full Sample
Intercept
Yield
Risk
Market cap
PostDum
Interaction term (Yield) × ( Dummy)
Sample sizeR2
(1)
0.377***(7.71)
23.60***(6.38)
9,0310.0045
(2)
–0.511***(–3.92)
22.312***(6.04)
–0.016(–0.94)
0.066***(7.92)
9,0310.0118
(1)
0.820***(37.39)
3.248***(3.06)
9,4490.001
(2)
0.124(1.14)
4.405***(3.98)
–0.014**(–2.39)
0.046***(6.93)
9,4490.0078
(3)
–0.166**(–2.10)
5.868***(5.57)
–0.015***(–2.71)
0.054***(10.49)
0.147***(4.76)
18,4800.0113
(4)
–0.352***(–3.97)
22.542***(6.08)
–0.013**(–2.41)
0.054***(10.38)
0.357***(6.56)
–18.121***(–4.69)
18,4800.0125
Panel B: Excess Returns (%)
Intercept
Yield
Risk
Market cap
PostDum
Interaction terms (Yield) × (Dummy)
Sample sizeR2
0.173***(4.74)
19.279***(4.01)
9,0310.0018
1.106***(9.61)
10.706**(2.18)
–0.006(–0.54)
–0.060***(–8.80)
9,0310.0103
0.098***(4.12)
2.579(0.78)
9,4490.0001
0.546***(6.36)
1.441(0.43)
–0.002(–0.60)
–0.028***(–5.61)
9,4490.0034
0.746***(10.90)
18.036***(5.13 )
–0.005(–1.34)
–0.039***(–9.77)
–19.108***(–6.01)
18,4800.0093
0.779***(10.63)
13.720***(2.81 )
–0.004(–1.15)
–0.039***(–9.69)
–0.056(–1.28)
–12.825**(–2.19)
18,4800.0094
Notes: We test the change in dividend clienteles. The dependent variable of regressions in Panel A is the PDR. Weighted least squares are utilized to correct for heteroskedasticity with the ratio of squared dividend yield to the stock’s variance as the weight. The dependent variable of regressions in Panel B is the ex–dividend day excess returns. Weighted least squares are used to calculate the average excess return with the inverse of the standard deviation of the estimation period return as the weight. Data are winsorized at [2.5%, 97.5%]. T–statistics are in parentheses under the parameter estimates. Dividend yield is calculated by dividing the dividend amount by the cum–divi-dend day closing price. Risk is measured by the variance of the security’s return scaled by the variance of the market returns during the estimation period [–25, –6] and [6, 25]. Market cap is the natural logarithm of the market capitalization on the cum–dividend day (i.e., cum–dividend day price multiplied by the outstanding shares). Pre–Act period is from February 1, 2001 to December 31, 2002; Post–Act period is from January 1, 2004 to December 31, 2005. PostDum = 0 for pre–Act period, and 1 otherwise.*, **, and *** indicate statistical signifi cance at the 10%, 5%, and 1% levels, respectively.

Ex–Dividend Day Price and Volume: The Case of 2003 Dividend Tax Cut
119
the statistically signifi cant negative coef-ficient of the interaction term: –12.825 percent. The results in Table 4 Panels A and B provide support for our second hypothesis that predicts a weakening of the dividend clienteles.
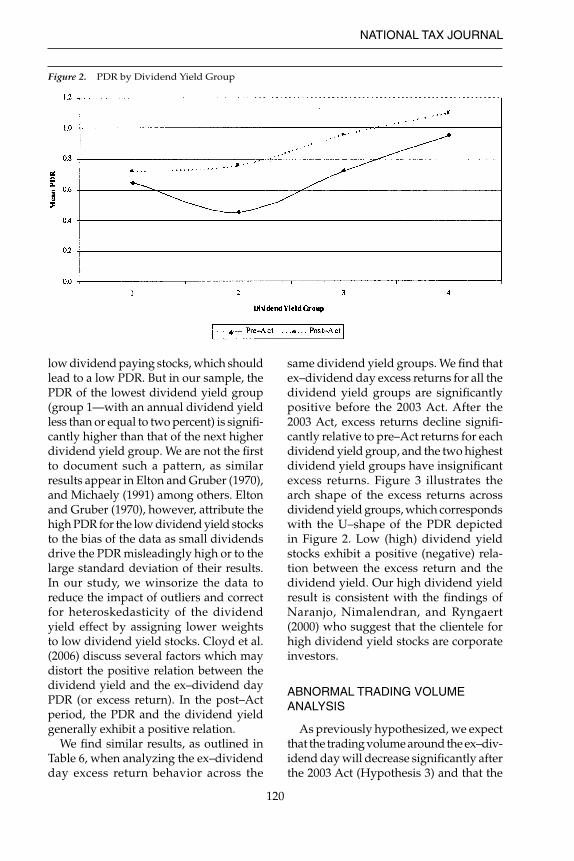
To gain further insight into dividend tax clienteles, we separate our sample into four dividend yield groups based on Graham et al. (2003) as follows (right–end-point inclusive):18 annualized dividend yield less than or equal to two percent, between two and four percent, between four and six percent, and greater than six percent. Table 5 presents the mean and median PDR of each dividend yield group. In the pre–Act period, the mean (median) PDR is signifi cantly lower than one for each dividend yield group except the highest group which has a PDR that is insignifi cantly different from one. The mean (median) PDR is higher in the post–Act period than in the pre–Act period for
each dividend yield group. The highest dividend yield group has a PDR higher than one in the post–Act period, consistent with the notion that the marginal inves-tor for the highest dividend yield stocks are corporate investors. We also note that the standard deviation decreases in the post–Act period relative to the pre–Act period. We graph the mean PDR of each dividend yield group in Figure 2.19 We illustrate that the mean PDR of each dividend yield group after the tax change is larger than before the tax change. The entire PDR curve shifts up and is less varied in the post–Act period compared to the pre–Act period.
Contrary to the prediction of the divi-dend tax clientele theory that a positive relation exists between the PDR and the dividend yield, we fi nd a U–shaped relation in the pre–Act period. As the dividend clientele theory predicts, inves-tors in the high tax brackets tend to hold
TABLE 5PDR GROUPED BY DIVIDEND YIELD
Group
1234
1234
Dividend Yield (y)
y<=2%2%<y<=4%4%<y<=6%
y>6%
y<=2%2%<y<=4%4%<y<=6%
y>6%
Post–Act
N
4,0943,6731,052
212
4,7493,839
721140
Median
0.547***0.451***0.751***0.998
0.712***0.686***0.932**1.157**
S.D.
8.653a
3.274c
1.826c
1.466
6.1442.396c
1.196c
1.454
Mean
0.648***0.456***0.731***0.958
0.719***0.760***0.9581.100**
SE
0.077b
0.039c
0.044c
0.065
0.0490.026c
0.031b
0.049
Pre–Act
Notes: We separate the sample into groups based on annualized dividend yields. Data are winsorized at [2.5%, 97.5%]. The mean PDR is adjusted for heteroskedasticity. Pre–Act period is from February 1, 2001 to December 31, 2002; Post–Act period is from January 1, 2004 to December 31, 2005. Statistical signifi cance for testing mean or median PDR different from one is indicated in the table. We also test for the difference between the PDR of the dividend yield group and the next higher dividend yield group (e.g., group 1 to group 2).*, **, and *** indicate statistical signifi cance at the 10%, 5%, and 1% levels, respectively.a, b, and c indicates statistically signifi cant (10%, 5%, and 1% levels) difference from the next dividend yield group.
18 Graham et al. (2003) divide observations based on quarterly dividend yields into fi ve groups: less than 0.5 percent, between 0.5 and one percent, between one and 1.5 percent, between 1.5 and 2.0 percent, and greater than 2.0 percent. Because we have a very small number of observations with an annual dividend yield greater than eight percent (2% × 4), we combine these observations into the fourth group.
19 The graph of the median PDR shows a similar pattern.
NATIONAL TAX JOURNAL
120
low dividend paying stocks, which should lead to a low PDR. But in our sample, the PDR of the lowest dividend yield group (group 1—with an annual dividend yield less than or equal to two percent) is signifi -cantly higher than that of the next higher dividend yield group. We are not the fi rst to document such a pattern, as similar results appear in Elton and Gruber (1970), and Michaely (1991) among others. Elton and Gruber (1970), however, attribute the high PDR for the low dividend yield stocks to the bias of the data as small dividends drive the PDR misleadingly high or to the large standard deviation of their results. In our study, we winsorize the data to reduce the impact of outliers and correct for heteroskedasticity of the dividend yield effect by assigning lower weights to low dividend yield stocks. Cloyd et al. (2006) discuss several factors which may distort the positive relation between the dividend yield and the ex–dividend day PDR (or excess return). In the post–Act period, the PDR and the dividend yield generally exhibit a positive relation.
We fi nd similar results, as outlined in Table 6, when analyzing the ex–dividend day excess return behavior across the
same dividend yield groups. We fi nd that ex–dividend day excess returns for all the dividend yield groups are signifi cantly positive before the 2003 Act. After the 2003 Act, excess returns decline signifi -cantly relative to pre–Act returns for each dividend yield group, and the two highest dividend yield groups have insignifi cant excess returns. Figure 3 illustrates the arch shape of the excess returns across dividend yield groups, which corresponds with the U–shape of the PDR depicted in Figure 2. Low (high) dividend yield stocks exhibit a positive (negative) rela-tion between the excess return and the dividend yield. Our high dividend yield result is consistent with the fi ndings of Naranjo, Nimalendran, and Ryngaert (2000) who suggest that the clientele for high dividend yield stocks are corporate investors.
ABNORMAL TRADING VOLUME ANALYSIS
As previously hypothesized, we expect that the trading volume around the ex–div-idend day will decrease signifi cantly after the 2003 Act (Hypothesis 3) and that the
Figure 2. PDR by Dividend Yield Group

Ex–Dividend Day Price and Volume: The Case of 2003 Dividend Tax Cut
121
trading volume will be positively related to dividend yield and negatively related to risk and transaction costs (Hypothesis 4). Thus, to analyze tax–induced trading around the ex–dividend day, we estimate abnormal trading volume for ten days surrounding the ex–dividend day for the pre– and post–Act period. We also ana-lyze abnormal trading volume for high dividend yield stocks that we defi ne as an annualized dividend yield greater than
four percent. We use four percent since Graham et al. (2003) fi nd that most AV activity occurs in stocks with quarterly dividend yields above one percent and argue that the result is consistent with greater dividend capture activity where the payoff to such activity is highest.
Analyzing the full sample results in Table 7, Panel A, we fi nd signifi cant posi-tive AV for most of the 11 days around the ex–dividend day and AV is much higher
Figure 3. Ex–dividend Day Excess Return by Dividend Yield Group
TABLE 6EXCESS RETURN GROUPED BY DIVIDEND YIELD
Pre–Act Post–Act
Group
1234
Dividend Yield (y)
y<=2%2%<y<=4%4%<y<=6%
y>6%
N
4,0943,6731,052 212
ER (%)
0.142*** 0.443*** 0.333***
0.130
SE (%)
0.030c
0.029a
0.0520.122
N
4,7493,839 721 140
ER (%)
0.094*** 0.163***
0.027–0.137
SE (%)
0.019b
0.020c
0.036b
0.111
Notes: We separate the sample into groups based on annualized dividend yields. The mean excess return is adjusted for heteroskedasticity. Pre–Act period is from February 1, 2001 to December 31, 2002; Post–Act period is from January 1, 2004 to December 31, 2005. Standard errors for the mean excess return are reported. Statistical signifi cance for testing mean excess return different from zero is indicated in the table. We also test for the difference in the excess return between the dividend yield group and the next higher dividend yield group (e.g., group 1 to group 2).*, **, and *** indicate statistical signifi cance at the 10%, 5%, and 1% levels, respectively.a, b, and c indicates statistically signifi cant (10%, 5%, and 1% levels) difference from the next dividend yield group.

NATIONAL TAX JOURNAL
122
on the cum–dividend day (day –1) and ex–dividend day (day 0) than the other days. Panel B of Table 7 shows even higher AV for high dividend yield stocks, which is consistent with the tax–induced trading theory. When the dividend yield is high, the tax benefi t of exchanging dividends and capital gains is greater, thus provid-ing greater motivation for investors to trade. In the pre–Act period, the high dividend yield stocks have an average AV of 35.86 percent on the cum–dividend day and 28.62 percent on the ex–divi-dend day. In the post–Act period, the AV decreases to only 18.02 percent on the cum–dividend day and 19.83 percent on the ex–dividend day. Figure 4 depicts the CAV from days –5 to +5 for the pre– and post–Act period. The CAV for the pre– and post–Act period does not exhibit a pronounced difference for the full sample of dividend paying firms. Figure 5 depicts the CAV only for the high divi-dend yield stocks. For the high divi-dend yield sample, the post–Act period CAV is lower than that in the pre–Act period particularly after the cum–divi-dend day.
We also calculate the CAV as the sum of the AV during the 11–day event window encompassing the ex–dividend day. We further separate the sample into low–, medium– and high–yield dividend pay-ing groups (annual dividend yields less than or equal to two percent, two to four percent, and greater than four percent, respectively). We present the average CAV for the 11–day event window in Table 8. For the full sample, the CAV is 27.29 per-cent before the 2003 Act and 31.53 percent after the 2003 Act. The difference is not signifi cant at conventional levels. How-ever, when we separate the sample into low–, medium– and high–yield groups, the strong positive relation between divi-dend yield and trading volume becomes obvious. The magnitude of the CAV for the low–yield group (3.22 percent) and the medium–yield group (0.49 percent) before the 2003 Act is insignifi cant from zero and much lower than that of the high–yield group (183.14 percent). In the post–act period, the CAV of the low– and medium–yield groups increases to 16.44 percent and 34.58 percent, respectively. But only the change in the medium–yield
TABLE 7THE AV FOR THE TEN DAYS SURROUNDING THE EX–DIVIDEND DAY
Panel A: Full Sample Panel B: High Dividend Yield
Pre–Act Pre–ActPost–Act Post–Act
Day
–5–4–3–2–1012345
AV (%)
2.83*** 4.96*** 2.31 0.78***12.48***18.44*** 6.05***13.07*** 0.16–0.42 0.11
t–stat
2.42 3.10 1.75 0.56 6.98 7.08 2.53 2.53 0.12–0.20 0.07
AV (%)
7.75*** 6.81*** 5.51*** 4.91***11.90*** 7.72*** 2.60** 3.40*** 3.08*** 1.30 2.44***
t–stat
5.555.003.753.436.017.322.072.842.801.182.28
AV (%)
2.10 3.12–0.09 0.60 35.86*** 28.62*** 3.38 2.82–1.95–4.19–1.53
t–stat
0.89 1.30–0.04 0.25 9.79 8.43 1.38 1.05–0.84–1.75–0.66
AV (%)
3.44 0.48 4.24* 9.90***18.02***19.83*** 0.95–0.64 2.72–0.63–2.64
t–stat
1.81 0.25 2.10 4.76 8.25 8.36 0.49–0.32 1.38–0.34–1.13
Notes: AV is defi ned as the difference between a stock’s actual to average turnover, relative to the average turnover. Daily turnover is defi ned as the ratio of daily shares traded to shares outstanding. We compute the average turnover by using the estimation period [–45, –6] and [6, 45]. Data are winsorized at [2.5%, 97.5%]. T–statistics for testing whether AV is equal to zero are computed using the cross–sectional estimates of the variance of AV. Pre–Act period is from February 1, 2001 to December 31, 2002; Post–Act period is from January 1, 2004 to December 31, 2005. The high dividend yield sample is those stocks with an annualized dividend yield greater than 4%. The CAV in Figures 4 and 5 is the sum of the AV up to and including that day.*, **, and *** indicate statistical signifi cance at the 10%, 5%, and 1% levels, respectively.

Ex–Dividend Day Price and Volume: The Case of 2003 Dividend Tax Cut
123
group is statistically signifi cant. Alterna-tively, the CAV of the high–yield group declines significantly after the 2003 Act to 101.12 percent. These results are generally consistent with our fourth hypothesis. With the reduction of the tax heterogeneity in the market, ex–dividend day trading volume decreases for high dividend yield stocks as the tax–induced motives to trade decrease. However, the overall trading volume is not signifi cantly different between pre– and post–Act since most of our sample is low– and medium–
dividend yield stocks.20 For low– and medium–yield dividend paying stocks, most trading may be for non–tax reasons since a small dividend is not attractive in terms of tax considerations, however, investors may time their trading around the ex–dividend day to capture abnormal returns. Thus, the effect of the reduction in tax heterogeneity on tax–motivated trad-ing does not show up in the full sample results.
We also analyze the effect of risk and transaction costs on the ex–dividend day
Figure 4. Cumulative Abnormal Volume
Figure 5. CAV of High Dividend Yield Group
20 If we estimate the full sample without winsorizing the data, we fi nd that the overall CAV signifi cantly decreases in the post–Act period. We also estimate AV utilizing the log of turnover as described by Chae (2005), but fi nd that our results are highly sensitive to this adjustment. We note that much of the abnormal trading volume activity occurs for high dividend yield stocks. Thus, mitigating the effect of the high dividend yield stocks on abnormal trading volume makes it diffi cult to draw inferences regarding dividend clienteles. Therefore, we caution the reader that our results are sensitive to the choice of proxy for abnormal trading volume and the trimming of volume data.

NATIONAL TAX JOURNAL
124
trading volume. Following Michaely and Vila (1996), we regress CAV on dividend yield, idiosyncratic risk, beta, market capitalization, and a post–Act dummy variable for the full sample and each of the three dividend yield groups.
Results are shown in Table 9. We fi nd a signifi cant negative relation between idiosyncratic risk and trading volume for high– and low–yield stocks, but an insig-nifi cant relation between idiosyncratic risk and trading volume for medium–
TABLE 8CUMULATIVE ABNORMAL VOLUME
Pre–Act Post–Act Post–Pre
Full sample
Low–yield group
Medium–yield group
High–yield group
N
9,031
4,094
3,673
1,264
CAV (%)
27.29***(4.99)
3.22(0.44)
0.49(0.06)
183.14***(10.48)
N
9,449
4,749
3,839
861
CAV (%)
31.53***(7.28)
16.44***(2. 78)
34.58***(4.90)
101.12***(7.22)
CAV (%)
4.24(0.61)
13.22(1.41)
34.09***(3.03)
–82.03***(–3.66)
Notes: The CAV is the sum of the AV during the 11–day event window encompassing the ex–dividend day. Data are winsorized at [2.5%, 97.5%]. Low dividend yield group has an annualized dividend yield less than or equal to 2%. High dividend yield group has an annualized dividend yield greater than 4%. The remainder of the sample is the medium–yield group. Pre–Act period is from February 1, 2001 to December 31, 2002; Post–Act period is from January 1, 2004 to December 31, 2005. *, **, and *** indicate statistical signifi cance at the 10%, 5%, and 1% levels, respectively.
TABLE 9TESTS OF THE CHANGE IN THE CAV
Intercept
PostDum
Yield
Risk
Beta
Market cap
Sample sizeR2
Full Sample
–3.165*** (–15.14)0.176**(2.34)
28.419*** (13.18)
–0.018** (–2.49)
–0.421*** (–6.03)
0.213*** (15.69)
18,4800.0226
High–Yield Group
–3.652***(–5.73)
–0.820***(–3.21)
28.021***(5.41)
–0.091**(–3.15)
–0.890*** (–3.37)
0.338***(7.54)
2,1250.0610
Medium–Yield Group
–2.848***(–6.69)
0.334***(2.74)–1.609(–0.16)0.011(0.91)
–0.417***(–3.77)
0.228***(10.58)
7,5120.0165
Low–Yield Group
–1.758***(–5.15)
0.295***(2.92)0.092(0.01)
–0.032***(–3.44)
–0.316***(–3.38)
0.139***(6.95)
8,8430.0092
Notes: We test the structural changes in CAV ten days surrounding the ex–dividend day. The dependent variable of the Ordinary Least Squares model is the CAV. Data are winsorized at [2.5%, 97.5%]. Pre–Act period is from February 1, 2001 to December 31, 2002; Post–Act period is from January 1, 2004 to December 31, 2005. PostDum = 0 for Pre–Act period and 1 otherwise. Low–yield group has an annualized dividend yield less than or equal to 2%. High–yield group has an annualized dividend yield greater than 4%. The remainder of the sample is the medium–yield group. Dividend yield is calculated by dividing the dividend amount by the cum–dividend day closing price. Risk is mea-sured by the variance of a security’s return scaled by the variance of the market return during the estimation period [–25, –6] and [6, 25]. Beta is obtained from the OLS market model. Market cap is the natural logarithm of the market capitalization on the cum–dividend day (i.e., cum–dividend day price multiplied by the outstanding shares). T–statistics for testing the difference from zero are in parentheses.*, **, and *** indicate statistical signifi cance at the 10%, 5%, and 1% levels, respectively.

Ex–Dividend Day Price and Volume: The Case of 2003 Dividend Tax Cut
125
yield stocks.21 The coeffi cients of beta are signifi cantly negative for all groups, con-sistent with the fi nding of Michaely and Vila (1996). Also the coeffi cient on market capitalization is positive and signifi cant in all specifications that is consistent with the prediction that transaction costs decrease trading volume. In addition, we fi nd the dividend yield effect is only signifi cant for the high–yield sample and the full sample. The cumulative trading volume for high dividend yield stocks sig-nifi cantly declines after the 2003 Act even after controlling for risk, transaction costs, and market risk, indicated by the signifi -cant negative coeffi cient on the post–Act dummy variable: –0.820. In general, our results support a positive relation between trading volume and dividend yield, a negative relation between trading volume and risk, and a negative relation between trading volume and transaction costs as predicted by the fourth hypothesis, but our results appear to be driven by high dividend paying stocks.
CONCLUSION
The paper examines the effect of the 2003 Act on investor behavior. The net effect of the 2003 Act was to align the tax rates on capital gains and dividends for individual investors, whereas previously individual investors paid a higher rate on dividend income relative to capital gains. We fi nd that more corporations tend to pay dividends in the post–Act period. We also fi nd that dividend paying fi rms increased the amount of dividends per share, but the dividend yield tends to decrease in the post–Act period. Analyz-ing tax relevance versus tax irrelevance on ex–dividend day market behavior, our fi ndings support the tax–based view that the relative taxation of dividends versus
capital gains does affect ex–dividend day price and trading behavior. We fi nd that the ex–dividend day PDR increases and the excess return decreases in the post–Act period.
We also find evidence that overall dividend clienteles weaken after the 2003 Act as evidenced by a decrease in the relation between the dividend yield and the ex–dividend day PDR (or excess return). Consistent with the trading clien-tele theory, we fi nd a signifi cant effect of transaction costs on the ex–dividend day PDR and excess returns, and a signifi cant effect of risk on the PDR. As the tax hetero-geneity among investors is reduced after the Act, tax–motivated trading around the ex–dividend day declines signifi cantly for high dividend yield stocks. We also fi nd that trading volume is negatively related to risk and transaction costs and posi-tively related to dividend yield although the result appears to be driven by high dividend yield stocks. We interpret our results to be generally consistent with the dynamic trading clientele model of Michaely and Vila (1995). The ex–divi-dend day stock price and trading behavior is jointly affected by relative taxation of dividend versus capital gains, risk, and transaction costs. Given that the 2003 Act only affects the relative tax rates for indi-vidual investors, our results suggest that individual investors play an important role in ex–dividend day price formation and trading activities.
Acknowledgments
We appreciate the helpful comments and suggestions from anonymous refer-ees, Ravi Jain, and seminar participants at the 2006 Financial Management Asso-ciation meetings and the University of Nebraska–Lincoln.
21 If we estimate Table 9 for the full sample of fi rms without restricting the sample to dividend payers in all four years, we fi nd a negative and signifi cant relation between idiosyncratic risk and trading volume in all four specifi cations.

NATIONAL TAX JOURNAL
126
REFERENCES
Amromin, Gene, Paul Harrison, and Steven Sharpe. “How Did the 2003 Dividend Tax Cut Af-
fect Stock Prices?” FRB of Chicago Working Paper No. 2006–17. Chicago, IL: Federal Reserve Bank of Chicago, 2006.
Auerbach, Alan J., and Kevin A. Hassett. “Dividend Taxes and Firm Valuation: New Evidence.” American Economic Review 96 No. 2 (May, 2006): 119–23.
Bali, Rakesh, and Gailen L. Hite. “Ex Dividend Day Stock Price Behavior:
Discreteness or Tax–Induced Clienteles?” Journal of Financial Economics 47 No. 2 (Feb-ruary, 1998): 127–59.
Barclay, Michael J. “Dividends, Taxes, and Common Stock
Prices: the Ex–dividend Day Behavior of Common Stock Prices before the Income Tax.” Journal of Financial Economics 19 No. 1 (September, 1987): 31–44.
Bell, Leonie, and Tim Jenkinson. “New Evidence of the Impact of Dividend
Taxation and on the Identity of the Marginal Investor.” Journal of Finance 57 No. 3 (June, 2002): 1321–46.
Boyd, John H., and Ravi Jagannathan. “Ex–dividend Price Behavior of Common
Stocks.” Review of Financial Studies 7 No. 4 (Winter, 1994): 711–41.
Campbell, James A., and Willam Beranek. “Stock Price Behavior on Ex–dividend Dates.” Journal of Finance 10 No. 4 (Decem-ber, 1955): 425–29.
Chae, Joon. “Trading Volume, Information Asymmetry,
and Timing Information.” Journal of Finance 60 No. 1 (February, 2005): 413–42.
Chay, J. B., Dosoung Choi, and Jeffrey Pontiff. “Market Valuation of Tax–Timing Options: Evidence from Capital Gains Distributions.” Journal of Finance 61 No. 2 (April, 2006): 837–65.
Chetty, Raj, and Emmanuel Saez. “The Effect of the 2003 Dividend Tax Cut
on Corporate Behavior: Interpreting the Evidence.” American Economic Review 96 No. 2 (May, 2006): 124–9.
Chetty, Raj, Joseph Rosenberg, and Emmanuel Saez. “The Effect of Taxes on Market Responses
to Dividend Announcements and Payments: What Can We Learn from the 2003 Dividend Tax Cut?” In Taxing Corporate Income in the 21st Century, edited by Alan J. Auerbach, James R. Hines, and Joel Slemrod, 1–35. Cambridge: Cambridge University Press, 2007.
Cloyd, C. Bryan, Oliver Zhen Li, and Connie D. Weaver. “Ticks and Tax: the Joint Effects of Price
Discreteness and Taxation on Ex–dividend Day Returns.” Journal of the American Taxation Association 28, No. 2 (Fall, 2006): 23–46.
Dhaliwal, Dan, and Oliver Zhen Li. “Investor Tax Heterogeneity and Ex–divi-
dend Day Trading Volume.” Journal of Finance 61 No. 1 (February, 2006): 463–90.
Eades, Kenneth M., Patrick J. Hess, and E. Han Kim. “On Interpreting Security Returns during
the Ex–dividend Period.” Journal of Financial Economics 13 No. 1 (March, 1984): 3–34.
Elton, Edwin J., and Martin J. Gruber. “Marginal Stockholder Tax Rates and the
Clientele Effect.” Review of Economics and Statistics 52 No. 1 (February, 1970): 68–74.
Elton, Edwin J., Martin J. Gruber, and Christopher R. Blake. “Marginal Stockholder Tax Effects and Ex–
dividend Day Price Behavior: Evidence from Taxable Versus Nontaxable Closed–End Funds.” Review of Economics and Statistics 87 No. 3 (August, 2005): 579–86.
Elton, Edwin J., Martin J. Gruber, and Joel Rentzler. “The Ex–Dividend Day Behavior of Stock
Prices; A Re–Examination of Clientele Ef-fect: A Comment.” Journal of Finance 39 No. 2 (June, 1984): 551–6.
Frank, Murray, and Ravi Jagannathan. “Why Do Stock Prices Drop by Less than
the Value of the Dividend? Evidence from a Country without Taxes.” Journal of Finan-cial Economics 47 No. 2 (February, 1998): 161–88.

Ex–Dividend Day Price and Volume: The Case of 2003 Dividend Tax Cut
127
Graham, John R., Roni Michaely, and Michael R. Roberts. “Do Price Discreteness and Transactions
Costs Affect Stock Returns? Comparing Ex–dividend Pricing before and after Decimalization.” Journal of Finance 58 No. 6 (December, 2003): 2611–35.
Howton, Shelly W., and Shawn D. Howton. “The Corporate Response to the 2003 Divi-dend Tax Cut.” Journal of Applied Finance 16 No. 1 (Spring/Summer, 2006): 62–71.
Jakob, Keith, and Tongshu Ma. “Tick Size, NYSE Rule 118, and Ex–divi-
dend Day Stock Price Behavior.” Journal of Financial Economics 72 No. 3 (June, 2004): 605–25.
Kalay, Avner. “The Ex–dividend Day Behavior of Stock
Prices: A Re–examination of the Clientele Effect.” Journal of Finance 37 No. 4 (Septem-ber, 1982): 1059–70.
Karpoff, Jonathan M., and Ralph A. Walkling. “Short Term Trading around Ex–dividend Days: Additional Evidence.” Journal of Financial Economics 21 No. 2 (September, 1988): 291–98.
Koski, Jennifer Lynch. “A Microstructure Analysis of Ex–dividend
Stock Price Behavior before and after the 1984 and 1986 Tax Reform Acts.” Journal of Business 69 No. 3 (July, 1996): 313–38.
Lakonishok, Josef, and Theo Vermaelen. “Tax Reform and Ex–dividend Day Behav-
iour.” Journal of Finance 38 No. 4 (September, 1983): 1157–79.
Lamdin, Douglas J., and Craig Hiemstra. “Ex–Dividend Day Share Price Behavior: Effects of the Tax–Reform Act of 1986.” Review of Economics and Statistics 75 No. 4 (November, 1993): 778–83.
Lasfer, M. Ameziane. “Ex–Day Behavior—Tax or Short–Term
Trading Effects.” Journal of Finance 50 No. 3 (July, 1995): 875–97.
Michaely, Roni, and Maurizio Murgia. “The Effect of Tax Heterogeneity on Prices
and Volume around the Ex–dividend Day: Evidence from the Milan Stock Exchange.” The Review of Financial Studies 8 No. 2 (Sum-mer, 1995): 369–99.
Michaely, Roni. “Ex–Dividend Day Stock–Price Behavior:
The Case of the 1986 Tax–Reform Act.” Journal of Finance 46 No. 3 (July, 1991): 845–59.
Michaely, Roni, and Jean–Luc Vila. “Investors’ Heterogeneity, Prices, and Vol-
ume around the Ex–dividend Day.” Journal of Financial and Quantitative Analysis 30 No. 2 (June, 1995): 171–98.
Michaely, Roni, and Jean–Luc Vila. “Trading Volume with Private Valuation:
Evidence from the Ex–dividend Day.” The Review of Financial Studies 9 No. 2 (Summer, 1996): 471–509.
Miller, Merton H., and Franco Modigliani. “Dividend Policy, Growth, and the Valua-tion of Shares.” Journal of Business 34 No. 4 (October, 1961): 411–33.
Naranjo, Andy, M. Nimalendran, and Mike Ryngaert. “Time Variation of Ex–dividend Day Stock
Returns and Corporate Dividend Capture: A Reexamination.” Journal of Finance 55 No. 5 (October, 2000): 2357–72.
Poterba, James M., and Lawrence H. Summers. “New Evidence that Taxes Affect the Valua-tion of Dividends.” Journal of Finance 39 No. 5 (December, 1984): 1397–415.
Robin, Ashok J. “The Impact of the 1986 Tax–Reform Act
on Ex–Dividend Day Returns.” Financial Management 20 No. 1 (Spring, 1991): 60–70.
Wu, Chunchi, and Junming Hsu. “The Impact of the 1986 Tax Reform on
Ex–dividend Day Volume and Price Be-havior.” National Tax Journal 49 No. 2 (June, 1996): 177–92.
