exec summary table status quo farming economy recreation economy fish and farm economy drought...
Post on 20-Dec-2015
213 views
TRANSCRIPT

Exec Summary Table
Status QuoFarming Economy
Recreation Economy
Fish and Farm Economy
Drought Conditions
Direct Revenue for the Region and Percent Change by Scenario
Hotels $15,122 (4.0%) 31.4% 13.3% 7.4% Real Estate $20,841 0.0% 0.0% 0.0% 0.0% Agriculture $40,183 171.0% (52.5%) 63.2% (61.2%)Recreation $5,158 (66.9%) 374.1% 222.0% 223.0% Tourism $53,391 (3.7%) 43.8% 12.4% (3.0%)
Net Change in Market Value $0 $62,873 $24,631 $44,811 ($13,889)Net Change in Expressed Value $0 ($15,541) $92,853 $51,546 $47,737
Market Value $132,041 $194,915 $156,673 $176,853 $118,151Expressed Value $45,396 $29,853 $138,248 $96,942 $93,133
Total Value $177,437 $224,768 $294,922 $273,795 $211,285
Table 3: Summary of Results from All Scenarios (all numbers in $1000s)
Flow Table
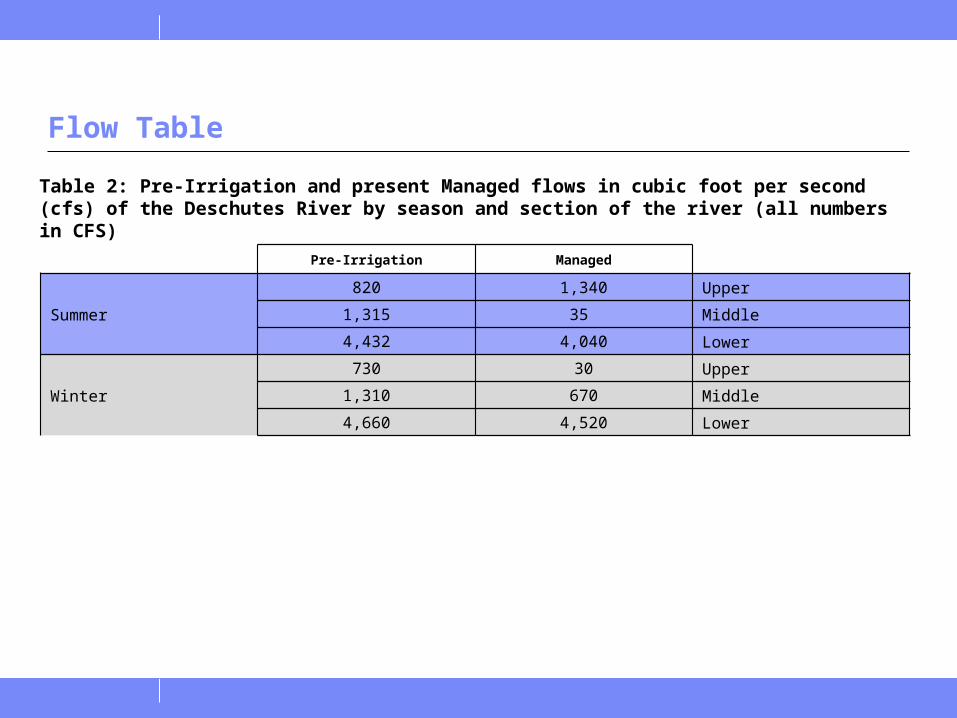
Pre-Irrigation Managed
Summer
820 1,340 Upper
1,315 35 Middle
4,432 4,040 Lower
Winter
730 30 Upper
1,310 670 Middle
4,660 4,520 Lower
Table 2: Pre-Irrigation and present Managed flows in cubic foot per second (cfs) of the Deschutes River by season and section of the river (all numbers in CFS)
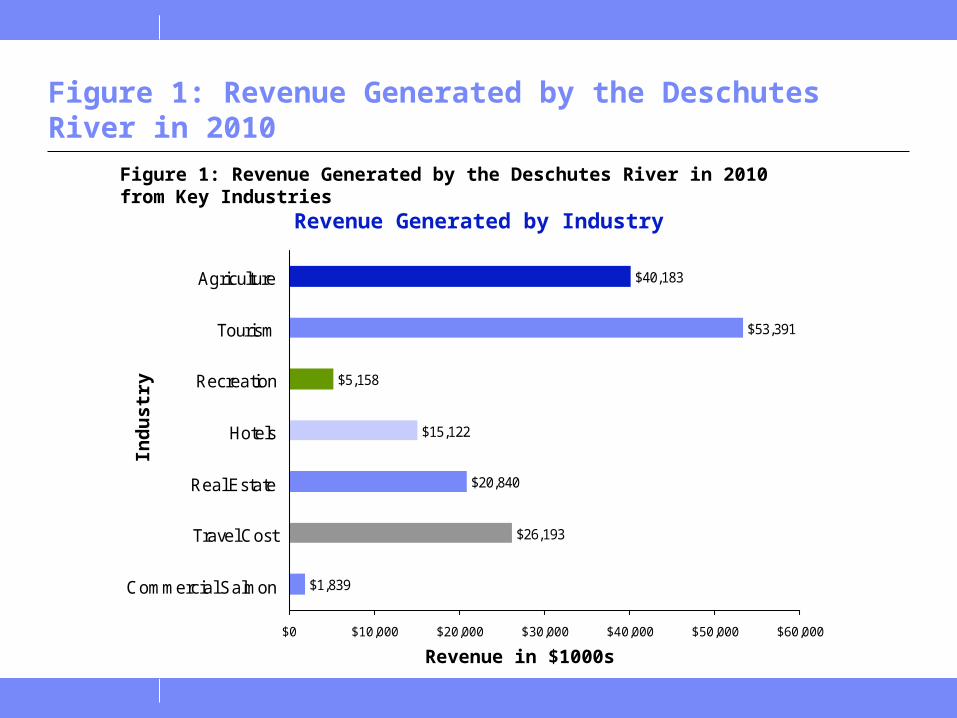
Figure 1: Revenue Generated by the Deschutes River in 2010
$40,183
$5,158
$15,122
$20,840
$26,193
$1,839
$53,391
$0 $10,000 $20,000 $30,000 $40,000 $50,000 $60,000
Agriculture
Tourism
Recreation
Hotels
Real Estate
Travel Cost
Commercial Salmon
Ind
us
try
Revenue in $1000s
Revenue Generated by Industry
Figure 1: Revenue Generated by the Deschutes River in 2010 from Key Industries
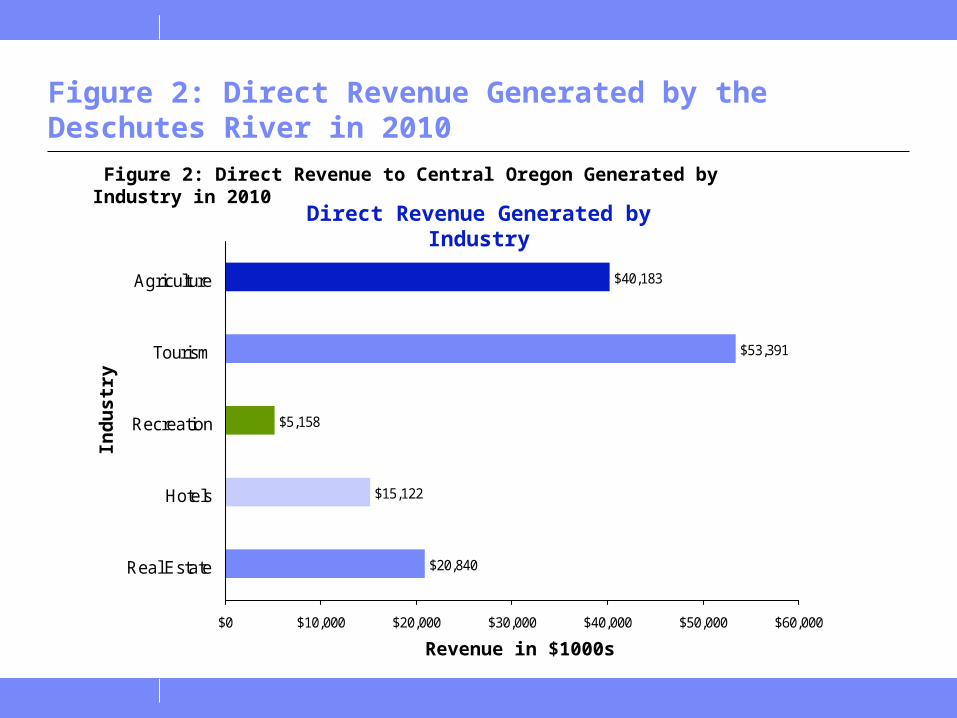
Figure 2: Direct Revenue Generated by the Deschutes River in 2010
$40,183
$53,391
$5,158
$15,122
$20,840
$0 $10,000 $20,000 $30,000 $40,000 $50,000 $60,000
Agriculture
Tourism
Recreation
Hotels
Real Estate
Ind
us
try
Revenue in $1000s
Direct Revenue Generated by Industry
Figure 2: Direct Revenue to Central Oregon Generated by Industry in 2010
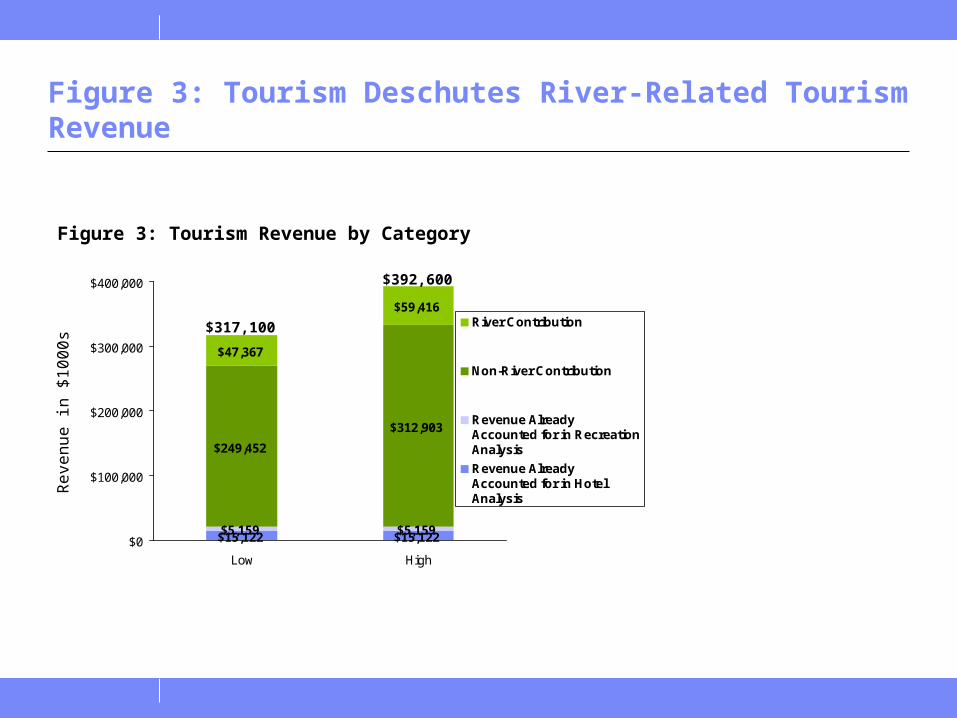
Figure 3: Tourism Deschutes River-Related Tourism Revenue
$15,122 $15,122$5,159 $5,159
$249,452
$312,903
$47,367
$59,416
$0
$100,000
$200,000
$300,000
$400,000
Low High
River Contribution
Non-River Contribution
Revenue AlreadyAccounted for in RecreationAnalysis
Revenue AlreadyAccounted for in HotelAnalysis
Figure 3: Tourism Revenue by Category
Re
ven
ue
in $
10
00
s
$317,100
$392,600
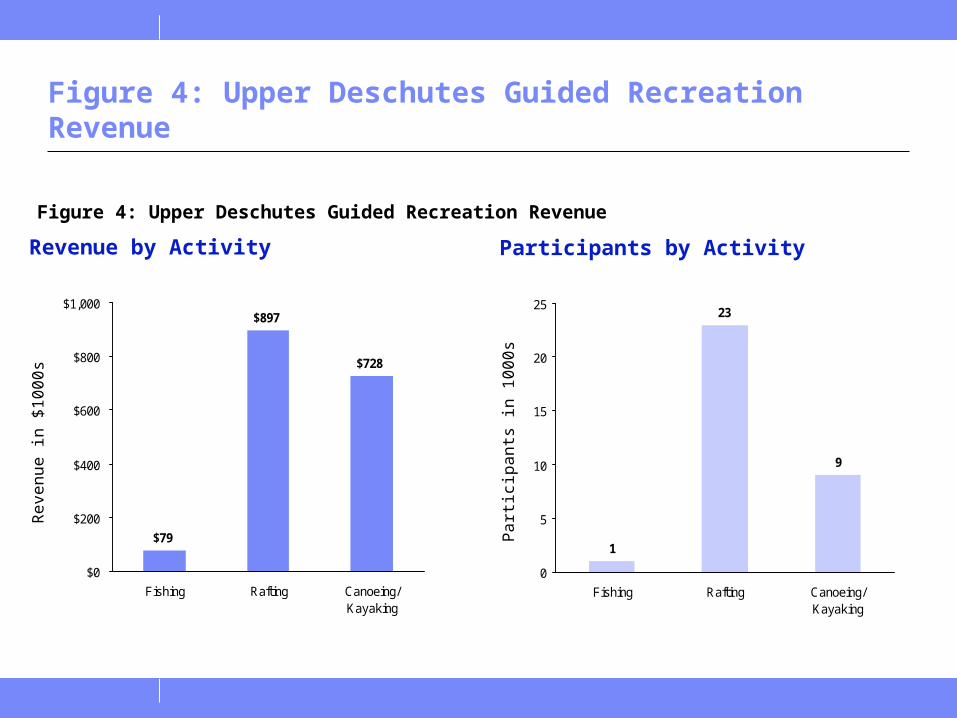
Figure 4: Upper Deschutes Guided Recreation Revenue
1
23
9
0
5
10
15
20
25
Fishing Rafting Canoeing/Kayaking
Participants by Activity
$79
$897
$728
$0
$200
$400
$600
$800
$1,000
Fishing Rafting Canoeing/Kayaking
Revenue by Activity
Pa
rtic
ipa
nts
in 1
00
0s
Re
ven
ue
in $
10
00
s
Figure 4: Upper Deschutes Guided Recreation Revenue
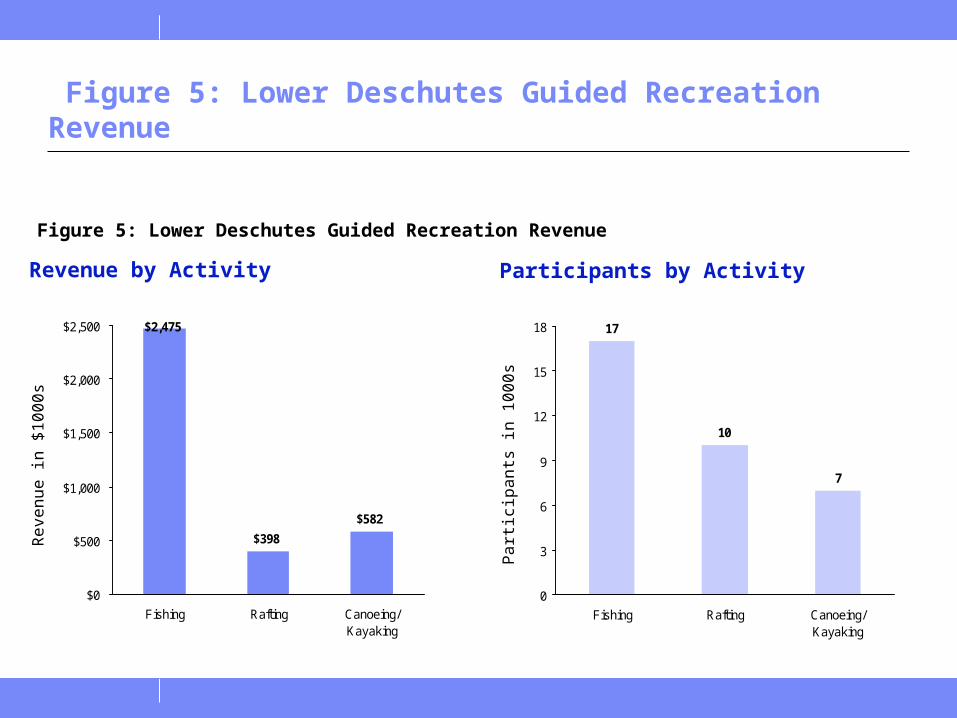
Figure 5: Lower Deschutes Guided Recreation Revenue
17
10
7
0
3
6
9
12
15
18
Fishing Rafting Canoeing/Kayaking
Participants by Activity
$2,475
$398
$582
$0
$500
$1,000
$1,500
$2,000
$2,500
Fishing Rafting Canoeing/Kayaking
Revenue by Activity
Pa
rtic
ipa
nts
in 1
00
0s
Re
ven
ue
in $
10
00
s
Figure 5: Lower Deschutes Guided Recreation Revenue

Figure 6: Hotel Revenue and Jobs from River
$10,365
$3,310
$13,676
$1,020
$425
$1,445
$0
$4,000
$8,000
$12,000
$16,000
Summer (May-Oct) Winter (Nov-Apr) Total
River Contribution River Premium
$11,385
Figure 6: Hotel Revenue and Jobs from River
$3,735
$15,1222,000
1,000
Re
ven
ue
in $
10
00
s
Job
s
Jobs

Figure 7: Upper Deschutes River-Related Hotel Revenue by Season
$7,076
$1,887
$261
$93
$0
$2,000
$4,000
$6,000
$8,000
Summer (May-Oct) Winter (Nov-Apr)
River Contribution River Premium
Figure 7: Upper Deschutes River-Related Hotel Revenue by Season
Re
ven
ue
in $
10
00
s
$7,337
$1,980
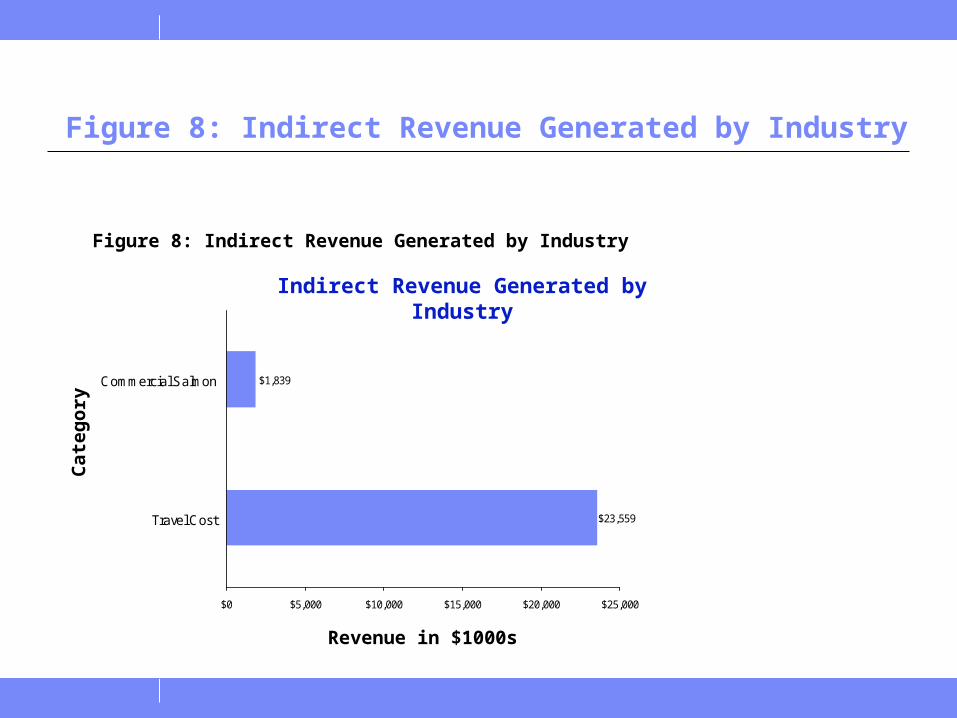
Figure 8: Indirect Revenue Generated by Industry
Revenue in $1000s
$1,839
$23,559
$0 $5,000 $10,000 $15,000 $20,000 $25,000
Commercial Salmon
Travel Cost
Cat
ego
ry
Indirect Revenue Generated by Industry
Figure 8: Indirect Revenue Generated by Industry

Figure 9: Commercial Salmon Value and Rebuilding Scenarios
$1,839
$2,654
$3,139
$4,090
$4,593
$3,422
$0
$1,000
$2,000
$3,000
$4,000
$5,000
Market Non-Market
Historic Steady
Rebuilding Midpoint
Best Case Future
Commercial Salmon Value and Rebuilding Scenarios
Val
ue
in $
100
0sFigure 9: Commercial Salmon Values

Figure 10: Travel Expense of Visitors to Central Oregon
$28,793 $23,558
$124,066$151,637
$0
$50,000
$100,000
$150,000
$200,000
High Low
River Contribution Other Expense
Figure 10: Travel Expense of Visitors to Central Oregon
Exp
en
se in
$1
00
0s
$147,625
$180,431

Figure 11: Deschutes River-related travel expenditures by mode
$0
$50,000
$100,000
$150,000
$200,000
Low High
Rental Car Only
RV
Fly (and Fly + Car)
Private Car Only
Figure 11: Deschutes River Related Travel Expenditures by Mode
Exp
en
se in
$1
00
0s $147,625
$180,431

Figure 12: Additional Benefits
1,389
173
358
1,514
0
500
1,000
1,500
2,000
Agriculture Hotels Recreation Tourism
Jobs by Industry
Job
s
$9,831
$4,985
$5,044
Benefit by Activity
Canoeing/Kayaking
Rafting
Fishing
Additional Benefit by Activityin $1000
$19,861
Figure 12: Additional Benefits from Unguided Recreation and Job Creation

Figure 13: Upper Deschutes Additional Benefits form Non-Guided Recreation
2
87
33
0
25
50
75
100
Fishing Rafting Canoeing/Kayaking
Participants by Activity
$303
$3,453
$2,803
$0
$800
$1,600
$2,400
$3,200
$4,000
Fishing Rafting Canoeing/Kayaking
Additional Benefits by Activity
Pa
rtic
ipa
nts
in 1
00
0s
Re
ven
ue
in $
10
00
s
Figure 13: Upper Deschutes Additional Benefits form Non-Guided Recreation
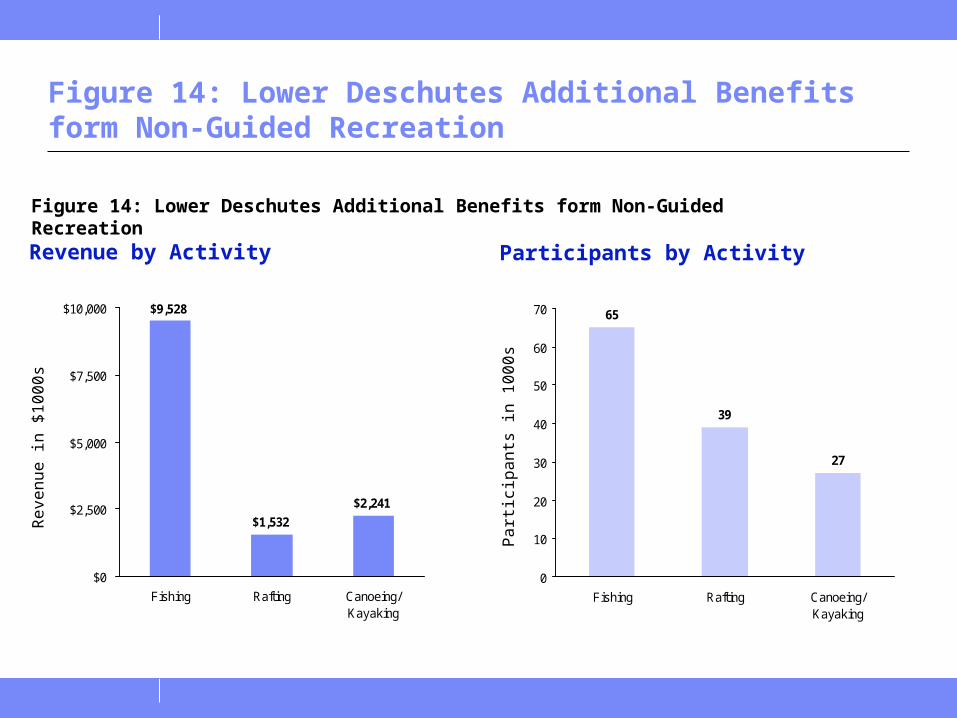
Figure 14: Lower Deschutes Additional Benefits form Non-Guided Recreation
65
39
27
0
10
20
30
40
50
60
70
Fishing Rafting Canoeing/Kayaking
Participants by Activity
$9,528
$1,532
$2,241
$0
$2,500
$5,000
$7,500
$10,000
Fishing Rafting Canoeing/Kayaking
Revenue by Activity
Pa
rtic
ipa
nts
in 1
00
0s
Re
ven
ue
in $
10
00
s
Figure 14: Lower Deschutes Additional Benefits form Non-Guided Recreation

Figure 15: Revenue by Scenario by Category
0 50 100 150 200 250
Current RiverEconomy
Farming Economy
Recreation Economy
Fish and FarmEconomy
Draught Conditions
Hotels
Real Estate
Agriculture
Recreation
Tourism
Sce
nar
io
Value in $Millions
Revenue by Scenario by Category
Figure 15: Revenue by Scenario by Category
$132
$194
$157
$177
$118

Scenario Snap Shot: Farming Economy
Farming Economy
In-stream flow change from present day river economy
Revenue by ActivityIn $1000s
Summer Winter
Upper: 0% 0%
Middle: 0% -95%
Lower: -99% 0%
Revenue change from present day river economy
Hotels: -4%
Real Estate: 0%
Agriculture: 171%
Recreation: -70% Additional Expressed Value
Tourism: -4% Non-Guided Recreation Value: -70%
TOTAL 48% Travel Cost WTP: -10%
CHANGE IN TOTAL VALUE: 27%
$49,006
$1,649
$108,905
$20,841
$14,514
Revenue by Activity
Hotels
Real Estate
Agriculture
Recreation
Tourism
$194,915

Scenario Snap Shot: Recreation Economy
River Recreation and Tourism Economy
In-stream flow change from present day river economy
Revenue by ActivityIn $1000s
Summer Winter
Upper: 0% 0%
Middle: 6,521% -95%
Lower: -18% 0%
Revenue change from present day river economy
Hotels: 31%
Real Estate: 0%
Agriculture: -53%
Recreation: 374% Additional Expressed Value
Tourism: 44% Non-Guided Recreation Value: 374%
Total Rev: 19% Travel Cost WTP: 80%
CHANGE IN TOTAL VALUE: 66%
$73,218
$23,648
$19,089
$20,841
$19,878
Revenue by Activity
Hotels
Real Estate
Agriculture
Recreation
Tourism
$156,637

Scenario Snap Shot: Fish and Farm
Fish and Farm Economy
In-stream flow change from present day river economy
Revenue by ActivityIn $1000s
Summer Winter
Upper: 0% 0%
Middle: 2,173% -95%
Lower: -18% 0%
Revenue change from present day river economy
Hotels: 13%
Real Estate: 0%
Agriculture: 63%
Recreation: 222% Additional Expressed Value
Tourism: 12% Non-Guided Recreation Value: 222%
Total Rev: 34% Travel Cost WTP: 34%
CHANGE IN TOTAL VALUE: 54%
$57,214
$16,061
$65,597
$20,841
$17,139
Revenue by Activity
Hotels
Real Estate
Agriculture
Recreation
Tourism
$176,853
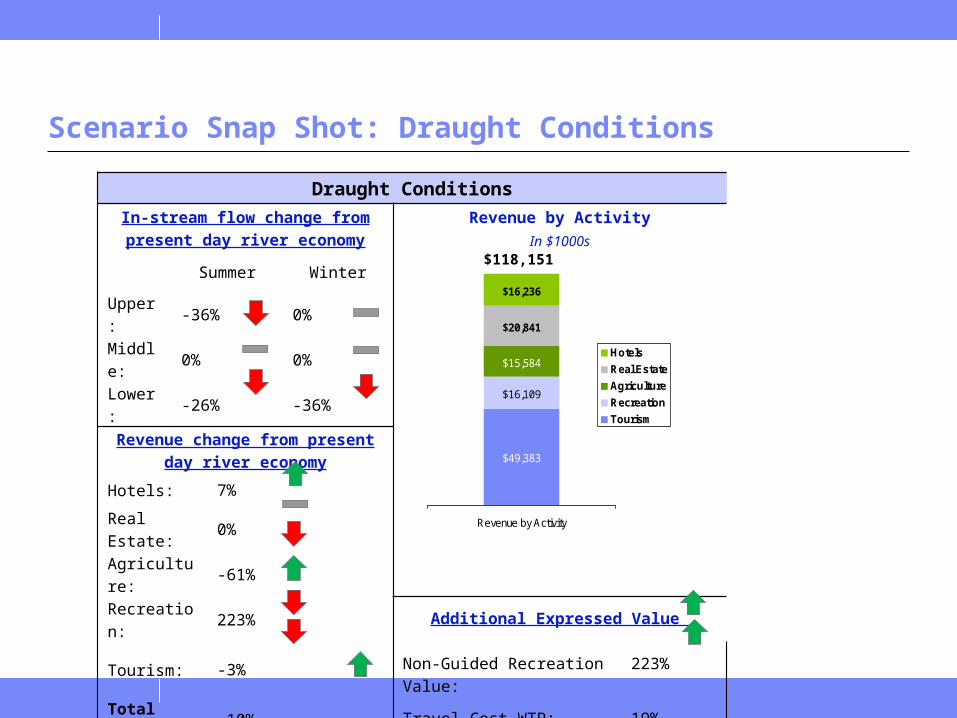
Scenario Snap Shot: Draught Conditions
Draught Conditions
In-stream flow change from present day river economy
Revenue by ActivityIn $1000s
Summer Winter
Upper: -36% 0%
Middle: 0% 0%
Lower: -26% -36%
Revenue change from present day river economy
Hotels: 7%
Real Estate: 0%
Agriculture: -61%
Recreation: 223% Additional Expressed Value
Tourism: -3% Non-Guided Recreation Value: 223%
Total Rev: -10% Travel Cost WTP: 19%
CHANGE IN TOTAL VALUE: 19%
$49,383
$16,109
$15,584
$20,841
$16,236
Revenue by Activity
Hotels
Real Estate
Agriculture
Recreation
Tourism
$118,151