executing for growth and returns - united rentals quarter...executing for growth and returns...
TRANSCRIPT

Executing for Growth
and Returns
Quarterly Financial Review Update
Fourth Quarter and Full Year 2017

2
Introductory Information
Unless otherwise specified, the information in this presentation, including forward-looking statements related to our outlook, is as of our most recent earnings call held on January 25, 2018. We make no commitment to update any such information contained in this presentation.
Certain statements in this presentation are forward-looking statements within the meaning of Section 21E of the Securities Exchange Act of 1934, as amended, and the Private Securities Litigation Reform Act of 1995, known as the PSLRA. These statements can generally be identified by the use of forward-looking terminology such as "believe," "expect," "may," "will,― "should," "seek," "on-track," "plan," "project," "forecast," "intend" or "anticipate," or the negative thereof or comparable terminology, or by discussions of vision, strategy or outlook. These statements are based on current plans, estimates and projections, and, therefore, you should not place undue reliance on them. No forward-looking statement can be guaranteed, and actual results may differ materially from those projected. Factors that could cause actual results to differ materially from those projected include, but are not limited to, the following: (1) the challenges associated with past or future acquisitions, including Neff Rentals and NES Rentals, such as undiscovered liabilities, costs, integration issues and/or the inability to achieve the cost and revenue synergies expected; (2) a slowdown in North American construction and industrial activities, which could reduce our revenues and profitability; (3) our significant indebtedness, which requires us to use a substantial portion of our cash flow for debt service and can constrain our flexibility in responding to unanticipated or adverse business conditions; (4) the inability to refinance our indebtedness at terms that are favorable to us, or at all; (5) the incurrence of additional debt, which could exacerbate the risks associated with our current level of indebtedness; (6) noncompliance with covenants in our debt agreements, which could result in termination of our credit facilities and acceleration of outstanding borrowings; (7) restrictive covenants and amount of borrowings permitted under our debt agreements, which could limit our financial and operational flexibility; (8) an overcapacity of fleet in the equipment rental industry; (9) a decrease in levels of infrastructure spending, including lower than expected government funding for construction projects; (10) fluctuations in the price of our common stock and inability to complete stock repurchases in the time frame and/or on the terms anticipated; (11) our rates and time utilization being less than anticipated; (12) our inability to manage credit risk adequately or to collect on contracts with customers; (13) our inability to access the capital that our business or growth plans may require; (14) the incurrence of impairment charges; (15) trends in oil and natural gas could adversely affect demand for our services and products; (16) our dependence on distributions from subsidiaries as a result of our holding company structure and the fact that such distributions could be limited by contractual or legal restrictions; (17) an increase in our loss reserves to address business operations or other claims and any claims that exceed our established levels of reserves; (18) the incurrence of additional costs and expenses (including indemnification obligations) in connection with litigation, regulatory or investigatory matters; (19) the outcome or other potential consequences of litigation and other claims and regulatory matters relating to our business, including certain claims that our insurance may not cover; (20) the effect that certain provisions in our charter and certain debt agreements and our significant indebtedness may have of making more difficult or otherwise discouraging, delaying or deterring a takeover or other change of control of us; (21) management turnover and inability to attract and retain key personnel; (22) our costs being more than anticipated, and the inability to realize expected savings in the amounts or timeframes planned; (23) our dependence on key suppliers to obtain equipment and other supplies for our business on acceptable terms; (24) our inability to sell our new or used fleet in the amounts, or at the prices, we expect; (25) competition from existing and new competitors; (26) security breaches, cybersecurity attacks and other significant disruptions in our information technology systems; (27) the costs of complying with environmental, safety and foreign laws and regulations as well as other risks associated with non-U.S. operations, including currency exchange risk; (28) labor difficulties and labor-based legislation affecting our labor relations and operations generally; (29) increases in our maintenance and replacement costs, and/or decreases in the residual value of our equipment; and (30) the effect of changes in tax law, such as the effect of the Tax Cuts and Jobs Act that was enacted on December 22, 2017. For a more complete description of these and other possible risks and uncertainties, please refer to our Annual Report on Form 10-K for the year ended December 31, 2017, as well as to our subsequent filings with the SEC. The forward-looking statements contained herein speak only as of the date hereof, and we make no commitment to update or publicly release any revisions to forward-looking statements in order to reflect new information or subsequent events, circumstances or changes in expectations.
Note: This presentation provides information about free cash flow, EBITDA, adjusted EBITDA and adjusted EPS, which are non-GAAP financial measures. This presentation includes a reconciliation between free cash flow and GAAP cash from operations, a reconciliation between both adjusted EBITDA and EBITDA, on the one hand, and GAAP net income, on the other hand, a reconciliation between both adjusted EBITDA and EBITDA, on the one hand, and GAAP cash from operations, on the other hand, a reconciliation between adjusted EPS and GAAP EPS and a reconciliation between forward-looking free cash flow and forward-looking GAAP cash from operations. Information reconciling forward-looking adjusted EBITDA to GAAP financial measures is unavailable to the company without unreasonable effort. The company is not able to provide reconciliations of forward looking adjusted EBITDA to GAAP financial measures because certain items required for such reconciliations are outside of the company’s control and/or cannot be reasonably predicted, such as the provision for income taxes. Preparation of such reconciliations would require a forward-looking balance sheet, statement of income and statement of cash flow, prepared in accordance with GAAP, and such forward-looking financial statements are unavailable to the company without unreasonable effort. The company provides a range for its adjusted EBITDA forecast that it believes will be achieved, however it cannot accurately predict all the components of the adjusted EBITDA calculation.

3
Q4 2017 Results
Rates +1.1% YOY Pro Forma +2.0%**
Time Utilization 70.0%, an increase of 70 bps YOY Pro Forma +100 bps YOY**
Adjusted EBITDA*
$947M or 49.3% margin, reflecting increases of $198M and 10 bps YOY, respectively
LTM ROIC 8.8%, an increase of 50 bps YOY
*Adjusted EBITDA is a non-GAAP measure. See the tables provided elsewhere in this presentation for reconciliations to the most comparable GAAP measures.
**Pro forma results reflect the combination of United Rentals and NES Rentals and Neff Corporation for the relevant periods presented. The NES acquisition closed in April 2017 and the
Neff acquisition closed in October 2017.
Adjusted EBITDA of $947M in Q4 at a margin of 49.3%

4
2017 Full Year Results
Rates (0.2%)
Pro Forma +0.4%
Time Utilization
69.5%, an increase of 160 bps
Pro Forma 69.1%, an increase of 150 bps
Adjusted EBITDA*
$3.164B or 47.6% margin, reflecting an
increase of $405M and a decrease of 30
bps
Net Rental CapEx after gross purchases $1.219B net, $1.769B gross
Free Cash Flow**
$983M
*Adjusted EBITDA and Free Cash Flow are non-GAAP measures. See tables presented elsewhere in this presentation for reconciliations to the most comparable GAAP measures.
**Excludes merger and restructuring cash payments of $76M
Adj. EBITDA of $3.164B on Record Full Year Time Utilization

5
2018 Outlook
Total Revenue $7.3B to $7.6B
Adjusted EBITDA(1) $3.60B to $3.75B
Net Rental Capital Expenditures $1.2B to $1.35B, after gross
purchases of $1.8B to $1.95B
Net Cash Provided by Operating Activities
$2.625B to $2.825B
Free Cash Flow(1)(2) $1.3B to $1.4B
(1) Adjusted EBITDA and Free Cash Flow are non-GAAP measures. See the table provided elsewhere in this presentation for a reconciliation of forecasted Free Cash Flow to the most comparable GAAP measure. Information reconciling forecasted adjusted EBITDA to the most comparable GAAP financial measures is unavailable to the company without unreasonable effort, as discussed in the ―Introductory Information‖ slide.
(2) Excluding the impact of merger and restructuring related costs.

6
OEC-on-Rent Progression
3,000
4,000
5,000
6,000
7,000
8,000
9,000
1-Jan 1-Feb 1-Mar 1-Apr 1-May 1-Jun 1-Jul 1-Aug 1-Sep 1-Oct 1-Nov 1-Dec
OE
C-o
n-R
en
t ($
M)
2014
2015
2016
2017
OEC-on-Rent Growth Strong Through Q4 2017
NES acquisition – April 4
Neff acquisition – October 2

7
Monthly Sequential Pricing
2015 2016 2017 2017 Pro-
Forma*
January (0.5%) (0.4%) (0.5%) (0.5%)
February (0.6%) (0.8%) (0.5%) (0.4%)
March (0.3%) (0.7%) (0.2%) (0.2%)
April 0.0% (0.2%) (0.7%) 0.0%
May (0.1%) 0.5% 0.5% 0.5%
June (0.1%) 0.6% 1.0% 1.0%
July (0.2%) 0.0% 0.4% 0.4%
August 0.0% (0.1%) 0.5% 0.5%
September 0.0% (0.2%) 0.4% 0.4%
October (0.1%) (0.2%) (0.1%) 0.0%
November (0.5%) (0.3%) 0.1% 0.1%
December (0.5%) (0.2%) (0.1%) (0.1%)
Sequential and YOY Rental Rates
2016 2017 2017 Pro-
Forma*
January (2.6%) (1.8%) (1.9%)
February (2.8%) (1.5%) (1.5%)
March (3.2%) (0.9%) (1.0%)
April (3.2%) (1.5%) (0.8%)
May (2.5%) (1.4%) (0.6%)
June (1.8%) (0.9%) (0.1%)
July (1.6%) (0.6%) +0.2%
August (1.7%) +0.1% +0.9%
September (1.8%) +0.6% +1.4%
October (2.0%) +0.8% +1.7%
November (1.9%) +1.2% +2.1%
December (1.6%) +1.2% +2.1%
Year Over Year Pricing
*Pro forma results reflect the combination of United Rentals, NES Rentals and Neff Corporation for the relevant periods presented. The NES acquisition closed in April 2017 and the Neff
acquisition closed in October 2017.
Pricing Trajectory Remains Encouraging

8
YOY Rental Rates
3.3%
2.8%
2.4%
2.1%
1.6%
0.9%
0.1%
(0.3%)
(1.1%)
(1.9%)
(2.6%)
(2.8%)
(3.2%)
(2.5%)
(1.7%)
(1.6%)
(1.7%)
(2.0%) (1.9%)
(1.6%)
(1.8%)
(1.5%)
(0.9%) (0.8%)
(0.6%)
(0.1%)
0.2%
0.9%
1.4%
1.7%
2.1% 2.1%
(4.0%)
(3.0%)
(2.0%)
(1.0%)
0.0%
1.0%
2.0%
3.0%
4.0%Year over Year Rates Pro-Forma Year over Year Rates*
*Pro forma results reflect the combination of United Rentals , NES Rentals and Neff Corporation for the relevant periods presented. The NES acquisition closed in April 2017 and
the Neff acquisition closed in October 2017.
Rate Momentum Consistently Improved Since January 2017

9
2015 2016 2017 YoY
January 63.7% 62.2% 64.1% 2.1 pt
February 63.9% 64.3% 65.9% 1.6 pt
March 64.9% 65.9% 68.1% 2.2 pt
April 65.7% 67.5% 68.6% 1.1 pt
May 66.6% 67.2% 69.6% 2.4 pt
June 67.7% 68.0% 70.0% 2.0 pt
July 68.6% 69.2% 70.4% 1.2 pt
August 70.0% 70.0% 71.5% 1.5 pt
September 71.3% 71.7% 73.6% 1.9 pt
October 72.0% 72.8% 74.0% 1.2 pt
November 68.7% 69.6% 70.5% 0.9 pt
December 63.8% 65.5% 65.5% 0.0 pt
Time Utilization
As Reported
2017 Full Year Time Utilization Sets Record
2015 2016 2017 YoY
January 63.5% 62.1% 63.8% 1.7 pt
February 63.8% 64.0% 65.3% 1.3 pt
March 64.8% 65.7% 67.2% 1.5 pt
April 65.7% 67.1% 68.4% 1.3 pt
May 66.6% 67.1% 69.4% 2.3 pt
June 67.9% 68.0% 69.7% 1.7 pt
July 68.8% 69.1% 70.3% 1.2 pt
August 69.9% 69.8% 71.3% 1.5 pt
September 71.1% 71.2% 73.1% 1.9 pt
October 71.8% 72.4% 74.0% 1.6 pt
November 68.6% 69.3% 70.5% 1.2 pt
December 63.7% 65.3% 65.5% 0.2 pt
Pro-Forma
*Pro forma results reflect the combination of United Rentals, NES Rentals and Neff Corporation for the relevant periods presented. The NES acquisition closed in April 2017 and the Neff acquisition closed in October 2017.

10
Percent Change Year-over-Year
2017 2018
Commercial Total 8.8% 4.0%
Office 8.9% 4.0%
Retail and Other Commercial 10.0% 4.6%
Lodging/Hotel 6.1% 2.4%
Industrial Total -6.6% +1.1%
Institutional Total 3.5% 4.1%
Healthcare 0.9% 3.5%
Education 4.9% 4.8%
Religious -9.2% -1.0%
Public Safety 1.4% 3.7%
Recreation & Amusement 7.1% 3.0%
Consensus Forecast for U.S. Construction Put-in-Place
Source: American Institute of Architects (AIA) – As of July 28, 2017 (most recent estimates)
Includes: Dodge, IHS Economics, Moody’s Economy, FMI, CMD, Associated Builders & Contractors and Wells Fargo Securities

11
Real Total U.S. Construction Spend Climbing
Source: U.S. Census Bureau
Investment Remains Modest Relative to Long Term Averages
$2,500
$3,000
$3,500
$4,000
$4,500
$5,000
$5,500
196
4
196
5
196
6
196
7
196
8
196
9
197
0
197
1
197
2
197
3
197
4
197
5
197
6
197
7
197
8
197
9
198
0
198
1
198
2
198
3
198
4
198
5
198
6
198
7
198
8
198
9
199
0
199
1
199
2
199
3
199
4
199
5
199
6
199
7
199
8
199
9
200
0
200
1
200
2
200
3
200
4
200
5
200
6
200
7
200
8
200
9
201
0
201
1
201
2
201
3
201
4
201
5
201
6
201
7E
Real total U.S. construction spend per capita 10-year avg 20-year avg 30-year avg 40-year avg

12
Industrial Outlook – U.S.
Source: Industrial Information Resources (January 2018) Note: Based on total project spending
Industrial Spend Forecast
U.S. Industrial Spending Expected to Grow 5.9% in 2018
Chemical, O&G Pipelines, Power, Industrial Manufacturing and Food & Beverage Forecast to Drive Growth in 2018
2017 to 2018 Change
2% or more decline
2% or more growth
Between -2% and +2%

13
Source: Industrial Information Resources (January 2018) Note: Based on total project spending. Includes actual and forecasted impact of exchange rate from $CAD to $USD
Industrial Outlook - Canada
Industrial Spend Forecast (USD)
2017 to 2018 Change
Canadian Industrial Spending Expected to Grow 4.2% in 2018
Chemical, O&G Pipelines, O&G Production and Food & Beverage Forecast to See Most Growth in 2018
2% or more decline
2% or more growth
Between -2% and +2%

14
Industrial Project Pipeline
Projects with Targeted Start Date in Next 12 Months
Source: Industrial Information Resources (January 2018) Project pipeline includes all active projects with a target start date in the following 12 months (all phases of planning)
Capital & Maintenance Pipeline Both Above Recent Highs
$414
$566 $584
$519 $484
$545 $537
$595
$0
$100
$200
$300
$400
$500
$600
$700
Q2 '16 Q3 '16 Q4 16 Q1 '17 Q2 '17 Q3 '17 Q4 '17 Q1 '18
Billio
ns
Value of Capital Projects
$11.2 $12.2 $12.4
$13.7
$14.9 $14.0
$14.4 $15.3
$0
$2
$4
$6
$8
$10
$12
$14
$16
$18
Q2 '16 Q3 '16 Q4 16 Q1 '17 Q2 '17 Q3 '17 Q4 '17 Q1 '18B
illio
ns
Value of Maintenance Projects
15
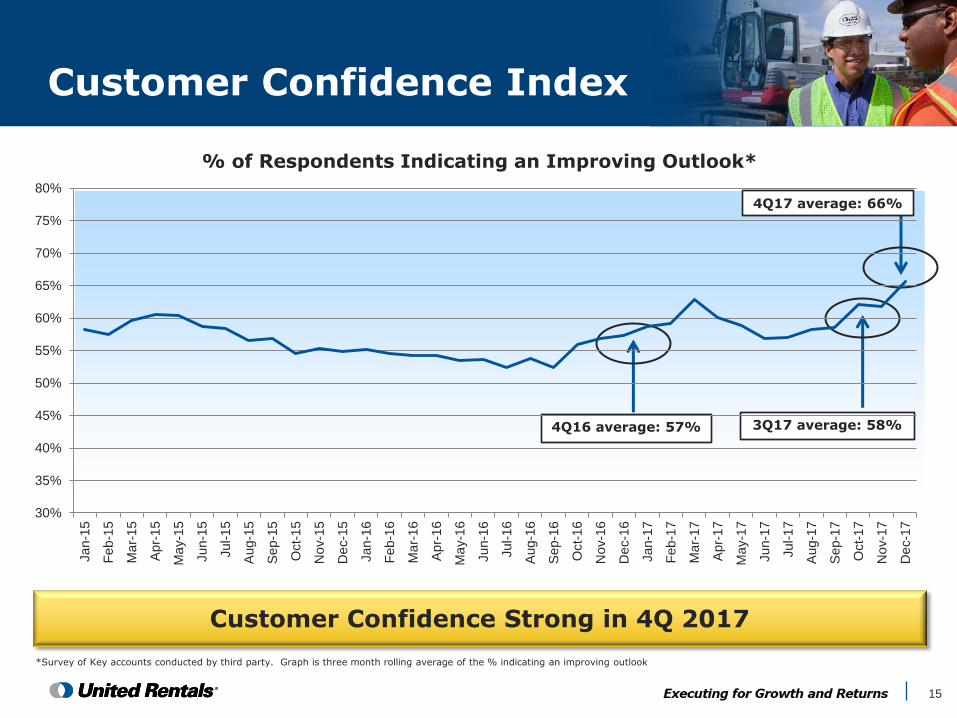
Customer Confidence Index
Customer Confidence Strong in 4Q 2017
*Survey of Key accounts conducted by third party. Graph is three month rolling average of the % indicating an improving outlook
4Q17 average: 66%
3Q17 average: 58% 4Q16 average: 57%
30%
35%
40%
45%
50%
55%
60%
65%
70%
75%
80%
Jan-1
5
Feb
-15
Ma
r-1
5
Apr-
15
Ma
y-1
5
Jun-1
5
Jul-1
5
Aug-1
5
Sep-1
5
Oct-
15
No
v-1
5
De
c-1
5
Jan-1
6
Feb
-16
Ma
r-1
6
Apr-
16
Ma
y-1
6
Jun-1
6
Jul-1
6
Aug-1
6
Sep-1
6
Oct-
16
No
v-1
6
De
c-1
6
Jan-1
7
Feb
-17
Ma
r-1
7
Apr-
17
Ma
y-1
7
Jun-1
7
Jul-1
7
Aug-1
7
Sep-1
7
Oct-
17
No
v-1
7
De
c-1
7
% of Respondents Indicating an Improving Outlook*

16
*All serialized assets regardless of equipment value (non bulk) included in time utilization **Fleet age is calculated on an OEC-weighted basis Note: Time Utilization, Dollar Utilization and Average Fleet Age are calculated using ARA metrics
3,400 Equipment Classes with Original Cost of $11.5B
Booms and Lifts
Earth Moving Forklifts Trench and Other
Total/ Average
% of Q4 2017 Rental Revenue
33.3% 13.8% 18.9% 34.0%
Time Utilization*
74.0% 64.2% 79.9% 59.8% 70.0%
Dollar Utilization
40.6% 42.6% 39.2% 56.0% 44.8%
Average Fleet Age** (in months)
53.7 41.6 41.7 45.2 47.0
Q4 Dollar Utilization 44.8%

17
Managing Fleet with a Life Cycle Approach
Selling Oldest Fleet
Rental Capex and Used Sales ($M)*
2013 2014 2015 2016 2017
85
88 87 85
91
Ag
e o
f U
sed
Sale
s i
n M
on
ths
2013 2014 2015 2016 2017
1,580 1,701 1,534
1,246
1,769
($490) ($544) ($538) ($496) ($550)
Time Utilization
2013 2014 2015 2016 2017
68.2%
68.8%
67.3%
67.9%
69.5%
$0$1,000$2,000$3,000$4,000$5,000$6,000$7,000$8,000$9,000
$10,000$11,000$12,000
≤ 1 1-2 2-3 3-4 4-5 5-6 6-7 7-8 8-9 >9 Total
Years
Age Composition ($M)
18
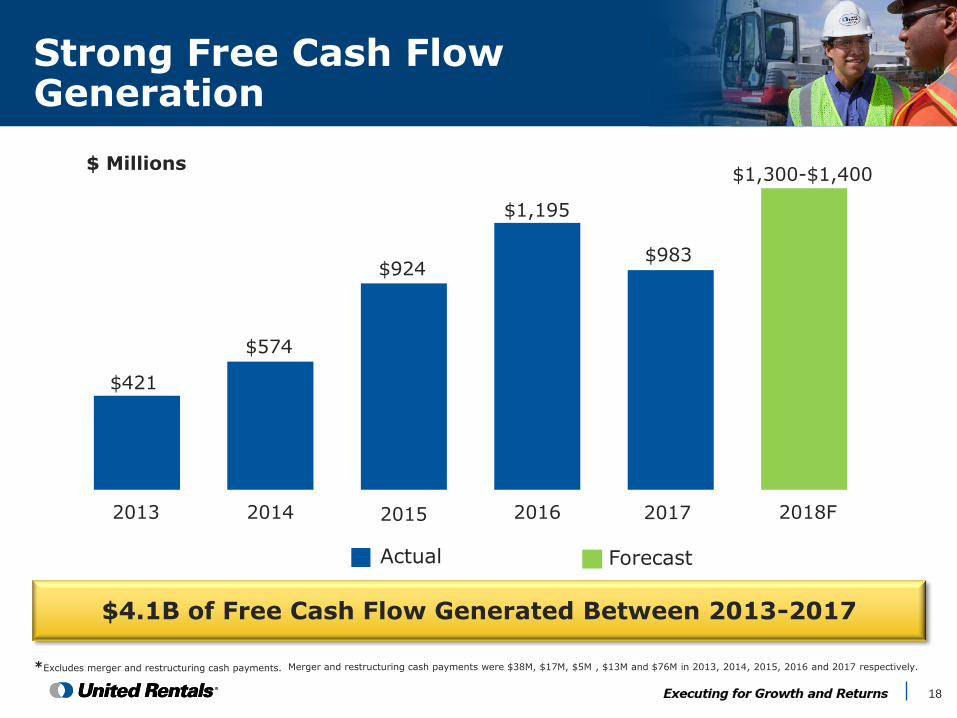
2013 2014 2015 2016 2017
Strong Free Cash Flow Generation
*Excludes merger and restructuring cash payments.
$ Millions $1,300-$1,400
Actual Forecast
$4.1B of Free Cash Flow Generated Between 2013-2017
Merger and restructuring cash payments were $38M, $17M, $5M , $13M and $76M in 2013, 2014, 2015, 2016 and 2017 respectively.
2018F
$421
$574
$924
$1,195
$983

19
2017 2018E
Rental CapEx Spend $1,769M – Gross
$1,219M – Net $1.80B - $1.95B – Gross $1.20B - $1.35B – Net
Cash Taxes $205M
~ $150M
Cash Interest
$357M
~ $430M
Assumptions Driving FCF Outlook

20
(1) Leverage Ratio calculated as total debt and QUIPs, net of cash, excluding original issuance discounts, premiums, and deferred financing divided by adjusted EBITDA.
assumes no M&A.
(2) Pro Forma assumes RSC acquisition occurred on January 1, 2011 and excludes cost synergies.
(3) Pro Forma assumes RSC acquisition occurred on January 1, 2012.
Balance Sheet Remains Strong
4.6
3.6
3.0 2.9 2.8 2.7
2.9
2011 2012 2013 2014 2015 2016 2017
Actual Forecast
2018
2
3
2.5x – 3.5x Target Leverage Range Across the Cycle
“Dry Powder”

21
Adjusted Earnings Per Share
GAAP Reconciliation
We define ―earnings per share – adjusted‖ as the sum of earnings per share – GAAP, as reported plus the impact of the following special items: merger related costs, merger related intangible asset amortization, impact on rental depreciation related to acquired fleet and property and equipment, impact of the fair value mark-up of acquired fleet, impact on interest expense related to fair value adjustment of acquired RSC indebtedness, restructuring charge, asset impairment charge and loss on repurchase/redemption of debt securities and amendment of ABL facility. Management believes that earnings per share - adjusted provides useful information concerning future profitability. However, earnings per share - adjusted is not a measure of financial performance under GAAP. Accordingly, earnings per share - adjusted should not be considered an alternative to GAAP earnings per share. The table below provides a reconciliation between earnings per share – GAAP, as reported, and earnings per share – adjusted.
Three Months Ended Year Ended
December 31, December 31,
2017 2016 2017 2016 Earnings per share - GAAP, as reported (1)
$ 10.45
$ 1.80
$ 15.73
$ 6.45
After-tax impact of:
Merger related costs (2) 0.13
—
0.36
—
Merger related intangible asset amortization (3) 0.32
0.29
1.15
1.12
Impact on depreciation related to acquired fleet and property and equipment (4)
0.01
—
0.05
—
Impact of the fair value mark-up of acquired fleet (5) 0.23
0.06
0.59
0.25
Impact on interest expense related to fair value adjustment of acquired RSC indebtedness (6)
—
—
—
(0.01 ) Restructuring charge (7)
0.15
0.05
0.36
0.11
Asset impairment charge (8) —
—
0.01
0.03
Loss on repurchase/redemption of debt securities and amendment of ABL facility
0.08
0.47
0.39
0.70
Earnings per share - adjusted (1) $ 11.37
$ 2.67
$ 18.64
$ 8.65
Tax rate applied to above adjustments (9) 38.6 % 37.9 % 38.5 % 38.2 %
(1) Earnings per share – GAAP, as reported and earnings per share – adjusted include estimated benefits of $8.03 and $8.05 for the three months and year ended December 31, 2017, respectively, associated with the enacted tax reform discussed above.
(2) Reflects transaction costs associated with the NES and Neff acquisitions discussed above. We have made a number of acquisitions in the past and may continue to make acquisitions in the future. Merger related costs only include costs associated with major acquisitions that significantly impact our operations. The historic acquisitions that have included merger related costs are RSC, which had annual revenues of approximately $1.5 billion prior to the acquisition, and National Pump, which had annual revenues of over $200 million prior to the acquisition. NES had annual revenues of approximately $369 million, and Neff had annual revenues of approximately $413 million.
(3) Reflects the amortization of the intangible assets acquired in the RSC, National Pump, NES and Neff acquisitions. (4) Reflects the impact of extending the useful lives of equipment acquired in the RSC, NES and Neff acquisitions, net of the
impact of additional depreciation associated with the fair value mark-up of such equipment.
(5) Reflects additional costs recorded in cost of rental equipment sales associated with the fair value mark-up of rental equipment acquired in the RSC, NES and Neff acquisitions and subsequently sold. (6) Reflects a reduction of interest expense associated with the fair value mark-up of debt acquired in the RSC acquisition. (7) Primarily reflects severance and branch closure charges associated with our closed restructuring programs and our current restructuring program. We only include such costs that are part of a restructuring program as restructuring charges. Since the first such restructuring program was initiated in 2008, we have completed three restructuring programs. We have cumulatively incurred total restructuring charges of $284 million under our restructuring programs. (8) Reflects write-offs of leasehold improvements and other fixed assets in connection with our restructuring programs. (9) The tax rates applied to the adjustments reflect the statutory rates in the applicable entity.
22
EBITDA and Adjusted EBITDA GAAP
Reconciliations
$ Millions
The table below provides a reconciliation between net income and EBITDA and adjusted EBITDA.
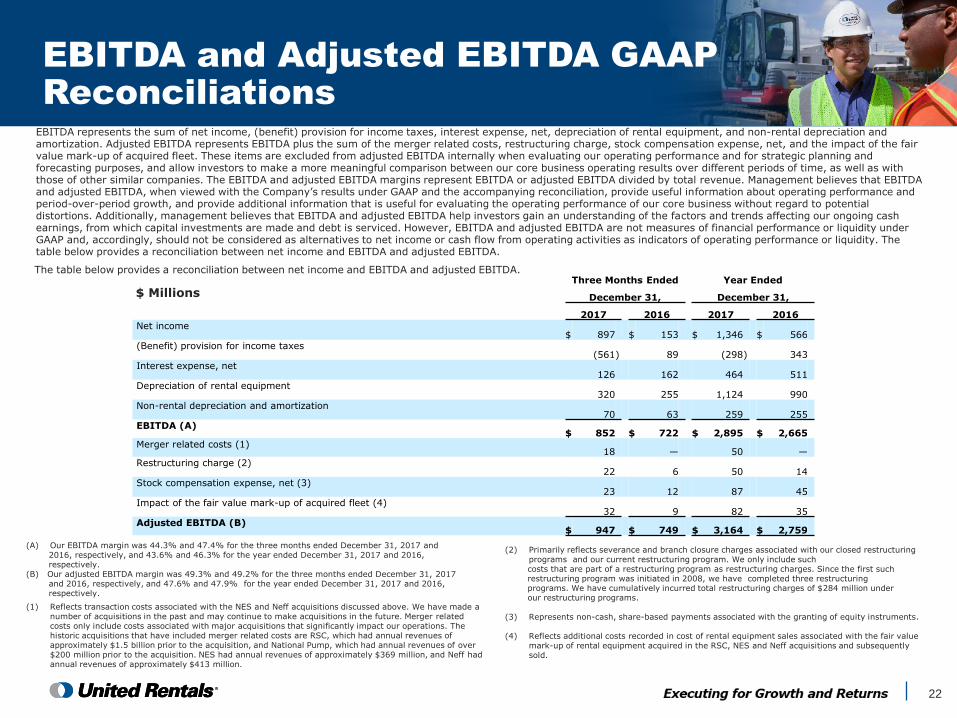
EBITDA represents the sum of net income, (benefit) provision for income taxes, interest expense, net, depreciation of rental equipment, and non-rental depreciation and amortization. Adjusted EBITDA represents EBITDA plus the sum of the merger related costs, restructuring charge, stock compensation expense, net, and the impact of the fair value mark-up of acquired fleet. These items are excluded from adjusted EBITDA internally when evaluating our operating performance and for strategic planning and forecasting purposes, and allow investors to make a more meaningful comparison between our core business operating results over different periods of time, as well as with those of other similar companies. The EBITDA and adjusted EBITDA margins represent EBITDA or adjusted EBITDA divided by total revenue. Management believes that EBITDA and adjusted EBITDA, when viewed with the Company’s results under GAAP and the accompanying reconciliation, provide useful information about operating performance and period-over-period growth, and provide additional information that is useful for evaluating the operating performance of our core business without regard to potential distortions. Additionally, management believes that EBITDA and adjusted EBITDA help investors gain an understanding of the factors and trends affecting our ongoing cash earnings, from which capital investments are made and debt is serviced. However, EBITDA and adjusted EBITDA are not measures of financial performance or liquidity under GAAP and, accordingly, should not be considered as alternatives to net income or cash flow from operating activities as indicators of operating performance or liquidity. The table below provides a reconciliation between net income and EBITDA and adjusted EBITDA.
Three Months Ended Year Ended
December 31, December 31,
2017 2016 2017 2016 Net income
$ 897
$ 153
$ 1,346
$ 566
(Benefit) provision for income taxes (561 ) 89
(298 ) 343
Interest expense, net 126
162
464
511
Depreciation of rental equipment 320
255
1,124
990
Non-rental depreciation and amortization 70
63
259
255
EBITDA (A) $ 852
$ 722
$ 2,895
$ 2,665
Merger related costs (1) 18
—
50
—
Restructuring charge (2) 22
6
50
14
Stock compensation expense, net (3) 23
12
87
45
Impact of the fair value mark-up of acquired fleet (4) 32
9
82
35
Adjusted EBITDA (B) $ 947
$ 749
$ 3,164
$ 2,759
(A) Our EBITDA margin was 44.3% and 47.4% for the three months ended December 31, 2017 and 2016, respectively, and 43.6% and 46.3% for the year ended December 31, 2017 and 2016, respectively. (B) Our adjusted EBITDA margin was 49.3% and 49.2% for the three months ended December 31, 2017 and 2016, respectively, and 47.6% and 47.9% for the year ended December 31, 2017 and 2016, respectively.
(1) Reflects transaction costs associated with the NES and Neff acquisitions discussed above. We have made a number of acquisitions in the past and may continue to make acquisitions in the future. Merger related costs only include costs associated with major acquisitions that significantly impact our operations. The historic acquisitions that have included merger related costs are RSC, which had annual revenues of approximately $1.5 billion prior to the acquisition, and National Pump, which had annual revenues of over $200 million prior to the acquisition. NES had annual revenues of approximately $369 million, and Neff had annual revenues of approximately $413 million.
(2) Primarily reflects severance and branch closure charges associated with our closed restructuring programs and our current restructuring program. We only include such
costs that are part of a restructuring program as restructuring charges. Since the first such restructuring program was initiated in 2008, we have completed three restructuring programs. We have cumulatively incurred total restructuring charges of $284 million under our restructuring programs. (3) Represents non-cash, share-based payments associated with the granting of equity instruments. (4) Reflects additional costs recorded in cost of rental equipment sales associated with the fair value
mark-up of rental equipment acquired in the RSC, NES and Neff acquisitions and subsequently sold.

23
Reconciliation of Net Cash Provided by Operating Activities to EBITDA and Adjusted EBITDA
$ Millions
Three Months Ended Year Ended
December 31, December 31,
2017 2016 2017 2016 Net cash provided by operating activities
$ 464 $ 323
$ 2,230
$ 1,953
Adjustments for items included in net cash provided by operating activities but excluded from the calculation of EBITDA:
Amortization of deferred financing costs and original issue discounts
(3 ) (2 ) (9 ) (9 ) Gain on sales of rental equipment
67 58
220
204
Gain on sales of non-rental equipment —
1
4
4
Merger related costs (1) (18 ) —
(50 ) —
Restructuring charge (2) (22 ) (6 ) (50 ) (14 )
Stock compensation expense, net (3) (23 ) (12 ) (87 ) (45 )
Loss on repurchase/redemption of debt securities and amendment of ABL facility
(11 ) (65 ) (54 ) (101 ) Excess tax benefits from share-based payment arrangements
— 5
—
58
Changes in assets and liabilities 255
214
129
101
Cash paid for interest 52
121
357
415
Cash paid for income taxes, net 91
85
205
99
EBITDA $ 852
$ 722
$ 2,895
$ 2,665
Add back:
Merger related costs (1) 18
—
50
—
Restructuring charge (2) 22
6
50
14
Stock compensation expense, net (3) 23
12
87
45
Impact of the fair value mark-up of acquired fleet (4) 32
9
82
35
Adjusted EBITDA $ 947
$ 749
$ 3,164
$ 2,759
(1) Reflects transaction costs associated with the NES and Neff acquisitions discussed above. We have made a number of acquisitions in the past and may continue to make acquisitions in the future. Merger related costs only include costs associated with major acquisitions that significantly impact our operations. The historic acquisitions that have included merger related costs are RSC, which had annual revenues of approximately $1.5 billion prior to the acquisition, and National Pump, which had annual revenues of over $200 million prior to the acquisition. NES had annual revenues of approximately $369 million, and Neff had annual revenues of approximately $413 million.
(2) Primarily reflects severance and branch closure charges associated with our closed restructuring programs and our current restructuring program. We only include such costs that are part of a restructuring program as restructuring charges. Since the first such restructuring program was initiated in 2008, we have completed three restructuring programs. We have cumulatively incurred total restructuring charges of $284 million under our restructuring programs. (3) Represents non-cash, share-based payments associated with the granting of equity instruments. (4) Reflects additional costs recorded in cost of rental equipment sales associated with the fair value mark-up of rental equipment acquired in the RSC, NES and Neff acquisitions and subsequently sold.

24
Free Cash Flow GAAP Reconciliation
$ Millions
$ Millions
The table below provides a reconciliation between 2018 forecasted net cash provided by operating activities and free cash flow.
We define free cash flow as (i) net cash provided by operating activities less (ii) purchases of rental and non-rental equipment plus (iii) proceeds from sales of rental and non-rental equipment, and excess tax benefits from share-based payment arrangements. Management believes that free cash flow provides useful additional information concerning cash flow available to meet future debt service obligations and working capital requirements. However, free cash flow is not a measure of financial performance or liquidity under GAAP. Accordingly, free cash flow should not be considered an alternative to net income or cash flow from operating activities as an indicator of operating performance or liquidity. The table below provides a reconciliation between net cash provided by operating activities and free cash flow.
Three Months Ended Year Ended
December 31, December 31,
2017 2016 2017 2016 Net cash provided by operating activities
$ 464 $ 323
$ 2,230
$ 1,953
Purchases of rental equipment (284 ) (101 ) (1,769 ) (1,246 )
Purchases of non-rental equipment (33 ) (28 ) (120 ) (93 )
Proceeds from sales of rental equipment 172
135
550
496
Proceeds from sales of non-rental equipment 6 2
16
14
Excess tax benefits from share-based payment arrangements (1) —
5
—
58
Free cash flow (2) $ 325
$ 336
$ 907
$ 1,182
(1) The excess tax benefits from share-based payment arrangements result from stock-based compensation windfall deductions in excess of the amounts reported for financial reporting purposes. We adopted accounting guidance in 2017 that changed the cash flow presentation of excess tax benefits from share-based payment arrangements. In the table above, the excess tax benefits from share-based payment arrangements for 2017 are presented as a component of net cash provided by operating activities, while, for 2016, they are presented as a separate line item. Because we historically included the excess tax benefits from share-based payment arrangements in the free cash flow calculation, the adoption of this guidance did not change the calculation of free cash flow. (2) Free cash flow included aggregate merger and restructuring related payments of $24 million and $2 million for the three months ended December 31, 2017 and 2016, respectively, and $76 million and $13 million for the years ended December 31, 2017 and 2016, respectively.
Net cash provided by operating activities $2,625 - $2,825
Purchases of rental equipment $(1,800)-$(1,950)
Proceeds from sales of rental equipment $550-$650
Purchases of non-rental equipment, net of proceeds from sales $(75)-$(125)
Free cash flow (excluding the impact of merger and restructuring related payments) $1,300- $1,400