executing our tap agenda - siemens · december 2007 october 2010 q3 conference call april 2008 ......
TRANSCRIPT

Copyright © Siemens AG 2008. All rights reserved.
Executing Our TAP Agenda
Peter Löscher, President and CEO
JPMorgan 6th Annual Pan-European Capital Goods & Aerospace CEO Conference London, June 12th, 2008

Page 2 June 12th, 2008 Copyright © Siemens AG 2008. All rights reserved.JPMorgan 6th European Capital Goods Conference
This document contains forward-looking statements and information – that is, statements related to future, not past, events. These statements may be identified by words such as “expects,” “looks forward to,” “anticipates,” “intends,” “plans,” “believes,” “seeks,”“estimates,” “will,” “project” or words of similar meaning. Such statements are based on our current expectations and certain assumptions, and are, therefore, subject to certain risks and uncertainties. A variety of factors, many of which are beyond Siemens’control, affect our operations, performance, business strategy and results and could cause the actual results, performance or achievements of Siemens to be materially different from any future results, performance or achievements that may be expressed orimplied by such forward-looking statements. For us, particular uncertainties arise, among others, from changes in general economic and business conditions (including margin developments in major business areas); the challenges of integrating major acquisitions and implementing joint ventures and other significant portfolio measures; changes in currency exchange rates and interest rates;introduction of competing products or technologies by other companies; lack of acceptance of new products or services by customers targeted by Siemens; changes in business strategy; the outcome of pending investigations and legal proceedings, especially the corruption investigation we are currently subject to in Germany, the United States and elsewhere; the potential impact of such investigations and proceedings on our ongoing business including our relationships with governments and other customers;the potential impact of such matters on our financial statements; as well as various other factors. More detailed information about certain of these factors is contained throughout this report and in our other filings with the SEC, which are available on the Siemens website, www.siemens.com, and on the SEC's website, www.sec.gov. Should one or more of these risks or uncertainties materialize, or should underlying assumptions prove incorrect, actual results may vary materially from those described in the relevant forward-looking statement as expected, anticipated, intended, planned, believed, sought, estimated or projected. Siemens does not intend or assume any obligation to update or revise these forward-looking statements in light of developments which differ from those anticipated.
EBITDA (adjusted), Return on capital employed, Free cash flow, Cash conversion and Net debt are Non-GAAP financial measures.A reconciliation of these amounts to the most directly comparable IFRS financial measures is available on our Investor Relationswebsite under www.siemens.com/ir, Financial Publications, Quarterly Reports. 'Group profit from operations' is reconciled to 'Income before income taxes' of Operations under 'Reconciliation to financial statements' in the table 'Segment Information'.
Safe Harbour Statement

Page 3 June 12th, 2008 Copyright © Siemens AG 2008. All rights reserved.JPMorgan 6th European Capital Goods Conference
Attractive markets with tailwind from MEGATRENDS
Focused on three Sectors with strong end markets
1) Combined revenues of businesses 2) Combined revenues of businesses including €1.4 bn Dade Behring pro-forma
High BUSINESS QUALITY in #1 or #2 positions
EnergyBusinesses from
Power GenerationPower Transmission & Distribution
IndustryBusinesses from
Automation & DrivesIndustrial Solutions & ServicesTransportation SystemsBuilding TechnologiesOsram
HealthcareBusinesses from
Medical Solutions
Three SECTORS
Sie
men
s IT
Sol
utio
ns a
nd S
ervi
ces
Sie
men
s Fi
nanc
ial S
ervi
ces
Cross-sectoral
~€20bn1)
~€40bn1)
~€11bn2)Regional shift ofeconomic gravity
Growing demand forsafety and security
Increasing mobility
Growing demand forhealth- and elder care
Growing need forenvironmental care
Increasing scarcity ofnatural resources
Mega-trends
DemographicChange
Urbanization

Page 4 June 12th, 2008 Copyright © Siemens AG 2008. All rights reserved.JPMorgan 6th European Capital Goods Conference
Priorities are clearly defined
Main Topics
Portfolio priorities
Leadership structure
Capital allocation
Target margins
SG&A reduction
Equity culture
Our Principles …
IncreaseTRANSPARENCY
EnforceACCOUNTABILITY
DrivePERFORMANCE
New structureas of Jan 081)
Clear focus on organic growth
Continued com-mitment to SBB2)
First outlinein Q3 2008
Implementation ongoing4)
New targets for2010 defined3)
1) see page 6 for new Sector setup2) see page 22 for execution of € 2 bn first tranche of share buyback3) see page 17 for new target margins on Sector and Division levels4) see pages 11-13 and 18-19 for details on SG&A cost reduction

Page 5 June 12th, 2008 Copyright © Siemens AG 2008. All rights reserved.JPMorgan 6th European Capital Goods Conference
Organic growth is clear portfolio priority
Organic Growth
Exploit global growth opportunities1)
Exploit potential from past acquisitions (> EUR 20 billion over last 5 years)
Earnings conversion2)
1
Three sectors: Energy, Industry and Healthcare3)
Less complex, more competitive4)
Streamlining2
Value creation
Strict financial hurdle rates
M&A deal book
Selectiveinvestment3
Sector CFO namedDivision CEO and CFO namedDecember 2007
New organization approvedManaging Board incl. Sector CEO approved
November 2007Supervisory Board
Share buyback completedCapital structure target achievedSG&A project completedTarget margins achieved
October 2010
Streamlining Other Operations completedOctober 2009
New management compensation scheme in place October 2008
Start pro forma reporting in new structureOutline new management compensation schemeGuidance on EPS range for 2009
July 2008Q3 conference call
Update on SG&A project April 2008 Q2 analyst conference
New target margins for Energy and Industry SectorTarget margins for Divisions
January 2008 AGM
Milestones (deliverables)Reporting dates
1) see page 7 and 8 for strong order growth in Q2 20082) see page 9 for strong earnings conversion of key value drivers in Q2 20083) see page 6 for new Sector setup4) see page 12 for new regional cluster setup

Page 6 June 12th, 2008 Copyright © Siemens AG 2008. All rights reserved.JPMorgan 6th European Capital Goods Conference
1) not reported externally because of cross-divisional service character 2) 7/11 for shareholder representatives 3) no members of former Group boards
New organizational setup in place –leadership, governance and people
Clear chain of
commandand
escalation path
Sector CFO namedDivision CEO and CFO namedDecember 2007
New organization approvedManaging Board incl. Sector CEO approved
November 2007Supervisory Board
Share buyback completedCapital structure target achievedSG&A project completedTarget margins achieved
October 2010
Streamlining Other Operations completedOctober 2009
New management compensation scheme in place October 2008
Start pro forma reporting in new structureOutline new management compensation schemeGuidance on EPS range for 2009
July 2008Q3 conference call
Update on SG&A project April 2008 Q2 analyst conference
New target margins for Energy and Industry SectorTarget margins for Divisions
January 2008 AGM
Milestones (deliverables)Reporting dates
Supervisory Board 11/20 new 2)
Industry Energy
Osram Service Rotating Equipment 1)
Industry Solutions Power Transmission
Mobility Power Distribution
Healthcare
Industry Automation Fossil Power Generation Imaging & IT
Drive Technologies Renewable Energy Workflow & Solutions
Building Technologies Oil & Gas Diagnostics
6/15 Division CEO new 3)
Global Function HeadsFinance and ControllingLegal and ComplianceHuman ResourcesTechnology
6/8 new
Managing BoardChief Executive Officer
IndustryCEO
EnergyCEO
HealthcareCEO

Page 7 June 12th, 2008 Copyright © Siemens AG 2008. All rights reserved.JPMorgan 6th European Capital Goods Conference
Q2 2008 – key figures and financial highlights
Adjusted1)nominal
% Change
2%
15%
-38%
-67%
-56%
-32%
1%
12%
1,623 m2,619 mFree Cash Flow (Cont. Op.)
412 m1,259 mNet income (''all-in'')
565 m1,286 mIncome from Cont. Op.
1,203 m1,781 mGroup profit from Operations
18,001 m
20,850 m
Q2 2007
18,094 mSales (Cont. Op.)
23,371 m
Q2 2008
New orders (Cont. Op.)
1) Adjusted for portfolio and currency translation effects
Very strong y-o-y organic order growth1) of 15% across all regions
No slowdown for market leader A&D
Group Profit from Operations affected by € 857m project charges, but: very good underlying margins
Income from Continuing Operations affected by increased expenses for compliance investigations and costs related to Siemens transformation programs
Page 8 June 12th, 2008 Copyright © Siemens AG 2008. All rights reserved.JPMorgan 6th European Capital Goods Conference
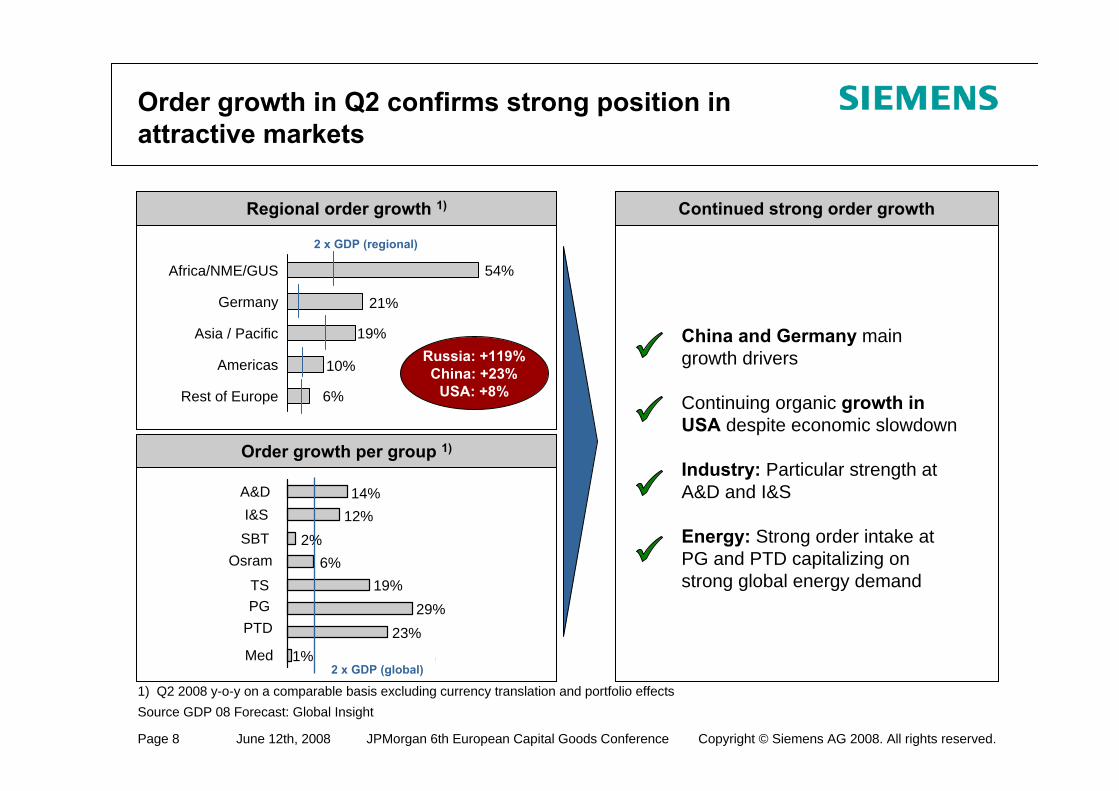
Order growth per group 1)
Regional order growth 1)
1) Q2 2008 y-o-y on a comparable basis excluding currency translation and portfolio effectsSource GDP 08 Forecast: Global Insight
14%
SBTI&S
Med
Osram
A&D
TSPG
PTD
12%2%
6%19%
29%23%
1%2 x GDP (global)
54%Africa/NME/GUS
21%Germany
19%Asia / Pacific
10%Americas
6%Rest of Europe
2 x GDP (regional)
Continued strong order growth
China and Germany main growth drivers
Continuing organic growth in USA despite economic slowdown
Industry: Particular strength at A&D and I&S
Energy: Strong order intake at PG and PTD capitalizing on strong global energy demand
Order growth in Q2 confirms strong position in attractive markets
Russia: +119%China: +23%
USA: +8%

Page 9 June 12th, 2008 Copyright © Siemens AG 2008. All rights reserved.JPMorgan 6th European Capital Goods Conference
Key value drivers show strong earnings conversion
A&D Med PTD
14.2%
14.4%
Q2 2007
16.7%
Q2 2008
+310 bp
17.5%
13.4%
15.3%
Q2 2007 Q2 2008
16.3%
+100 bp
12.5%
8.1%
Q2 2007
11.6%
Q2 2008
+350 bp
PPA - € 35mOTC - € 2m
PPA - € 50mOTC - € 52m
Margin improvement driven by economies of scale as a result of high capacity utilization
Increasing underlying profitability despite challenges
in market conditions
Favorable product mix and economies of scale associated
with higher revenue
PPA - € 37mOTC - € 9m
PPA - € 10m
As reported Adjusted for PPA, one time costs (OTC)

Page 10 June 12th, 2008 Copyright © Siemens AG 2008. All rights reserved.JPMorgan 6th European Capital Goods Conference
Our innovative solutions address key customer needs
Unifying Product Planningand Production
Shortening engineering processFaster time to market by up to 50%
Gas turbine SGT5-8000HFast start-up capability & operational flexibilityHigh reliability and availability In combined cycle duty efficiencyof over 60%
Siemens Gas Turbine –Unmatched Efficiency
Lowest life cycle costsReduced investment costs/kW
MAGNETOM EssenzaCompletely produced in ChinaComplete range of clinical applicationsCertified for worldwide delivery
World’s first high end –low cost MR scanner
Significantly lower price :< $1mAddressing new market segment-
smaller community hospitals
Digital design / Digital factoryIntegrated plant engineering(Simatic Automation Designer)Virtual commissioningCollaborative Data Management(Worldwide implementation of Teamcenter Platform, e.g. at VW)

Page 11 June 12th, 2008 Copyright © Siemens AG 2008. All rights reserved.JPMorgan 6th European Capital Goods Conference
SG&A cost reduction
€ bn, as reported1)
Main drivers
Eliminating duplicate functions on all levels by new accountability principles
Reducing number of legal entities and reporting units
Cutting overhead by new Sector setup2) and Regional clusters
Driving cost efficiency through streamlined go-to-market
Target breakdown
-6%
-22%
SG&A cost reduction plan for € 1.2 bn in place
11.9
FY 06
~8.9
~3.2
12.1
FY 07
10.9
G&A
Sales &Marketing
FY 10
∼2.5
∼8.4
-10%
1) Continuing operations (i.e., without Siemens VDO) 2) see page 19 for new Sector setup
Sector CFO namedDivision CEO and CFO namedDecember 2007
New organization approvedManaging Board incl. Sector CEO approved
November 2007Supervisory Board
Share buyback completedCapital structure target achievedSG&A project completedTarget margins achieved
October 2010
Streamlining Other Operations completedOctober 2009
New management compensation scheme in place October 2008
Start pro forma reporting in new structureOutline new management compensation schemeGuidance on EPS range for 2009
July 2008Q3 conference call
Update on SG&A project April 2008 Q2 analyst conference
New target margins for Energy and Industry SectorTarget margins for Divisions
January 2008 AGM
Milestones (deliverables)Reporting dates

Page 12 June 12th, 2008 Copyright © Siemens AG 2008. All rights reserved.JPMorgan 6th European Capital Goods Conference
Regional clusters: more transparent, faster and closer to the customers
Increased sales efficiency across countries Bundling of central functions within clustersOptimized span of control for Sectors and Regions
~190 Countries ~70 Regional Companies
20 Clusters
Sector CFO namedDivision CEO and CFO namedDecember 2007
New organization approvedManaging Board incl. Sector CEO approved
November 2007Supervisory Board
Share buyback completedCapital structure target achievedSG&A project completedTarget margins achieved
October 2010
Streamlining Other Operations completedOctober 2009
New management compensation scheme in place October 2008
Start pro forma reporting in new structureOutline new management compensation schemeGuidance on EPS range for 2009
July 2008Q3 conference call
Update on SG&A project April 2008 Q2 analyst conference
New target margins for Energy and Industry SectorTarget margins for Divisions
January 2008 AGM
Milestones (deliverables)Reporting dates
Expected benefits
Page 13 June 12th, 2008 Copyright © Siemens AG 2008. All rights reserved.JPMorgan 6th European Capital Goods Conference
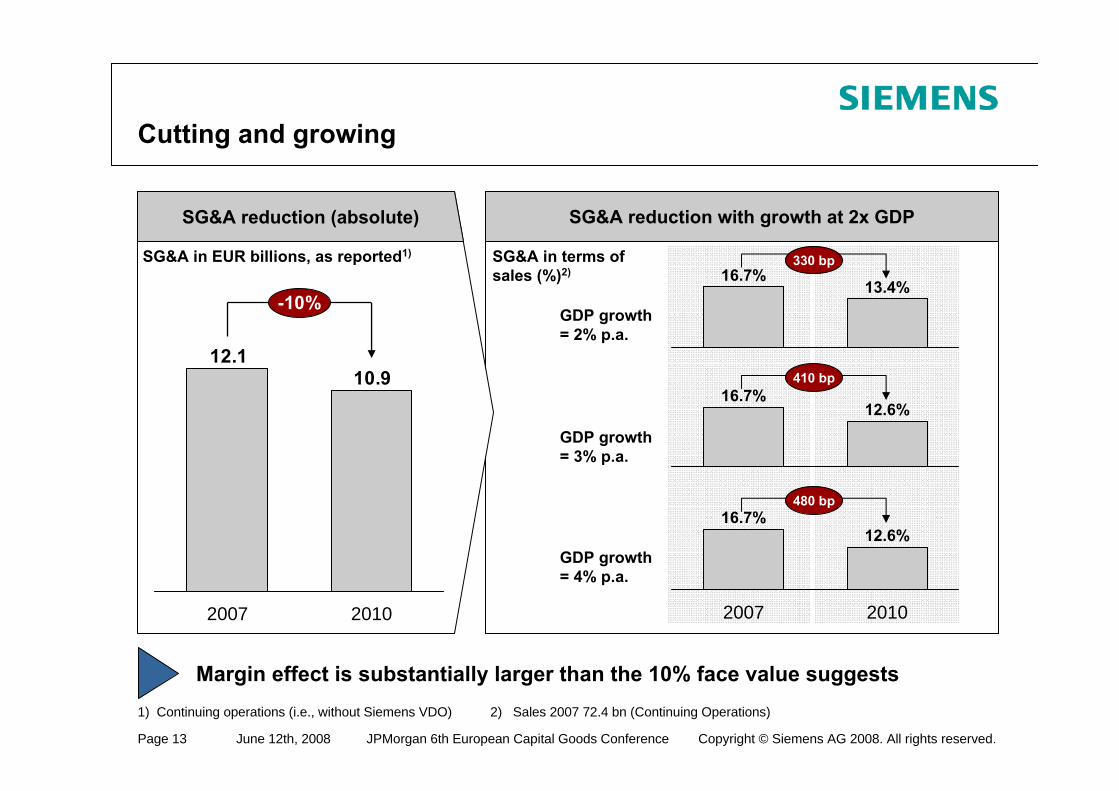
SG&A reduction with growth at 2x GDPSG&A reduction (absolute)
GDP growth = 3% p.a.
GDP growth = 4% p.a.
GDP growth = 2% p.a.
330 bp
410 bp
480 bp
SG&A in EUR billions, as reported1) SG&A in terms of sales (%)2)
Cutting and growing
10.912.1
2007
-10%
2010
16.7%12.6%
16.7%
2007
12.6%
2010
13.4%16.7%
2) Sales 2007 72.4 bn (Continuing Operations)
Margin effect is substantially larger than the 10% face value suggests1) Continuing operations (i.e., without Siemens VDO)

Page 14 June 12th, 2008 Copyright © Siemens AG 2008. All rights reserved.JPMorgan 6th European Capital Goods Conference
Outlook 2008
Organic revenue growth for the fiscal year will be twice the rate of GDP growth
Group Profit from Operations will match prior year’s level
Income from Continuing Operations will match prior year’s level
This outlook excludes earnings impacts that may arise from legal and regulatory matters, which are not yet quantifiable, and from measures that may be taken as part of Siemens’ transformation programs, including SG&A reduction. Within discontinued operations, divestment of the enterprise networking business is expected to result in a substantial loss.

Page 15 June 12th, 2008 Copyright © Siemens AG 2008. All rights reserved.JPMorgan 6th European Capital Goods Conference
TAP – consistent execution against plan
Sector CFO namedDivision CEO and CFO namedDecember 2007
New organization approvedManaging Board incl. Sector CEO approved
November 2007Supervisory Board
Share buyback completedCapital structure target achievedSG&A project completedTarget margins achieved
October 2010
Streamlining Other Operations completedOctober 2009
New management compensation scheme in place October 2008
Start pro forma reporting in new structureOutline new management compensation schemeGuidance on EPS range for 2009
July 2008Q3 conference call
Update on SG&A project April 2008 Q2 analyst conference
New target margins for Energy and Industry SectorTarget margins for Divisions
January 2008 AGM
Milestones (deliverables)Reporting dates

Page 16 June 12th, 2008 Copyright © Siemens AG 2008. All rights reserved.JPMorgan 6th European Capital Goods Conference
Backup

Page 17 June 12th, 2008 Copyright © Siemens AG 2008. All rights reserved.JPMorgan 6th European Capital Goods Conference
Profitability targets close the gap to best competitors
1) Best possible comparison with Groups of former organization (blurred due to selective movement of businesses)
16-19%Diagnostics
12-16%Renewable Energy10-14% PG
5-7% I&S10-14%Oil & Gas
7-10% PTD10-14%Power Transmission
11-15%Power Distribution
13-15% Med
14-17%Imaging & ITHealthcare14-17% Workflow & Solutions
Fossil Power Generation
Osram
Mobility
Industry Solutions
Building Technologies
Drive Technologies
Industry Automation
Division
10-14% PG11-15%
Energy11-15%
10-12% Osram10-12%
11-14%
5-7% TS5-7%
5-7% I&S5-7%
7-9% SBT7-10%
11-16%12-15% A&D
12-17%
Industry 9-13%
Main competitorsTarget margin of former Group 1)ChangeNew 2010
target marginSector
Sector CFO namedDivision CEO and CFO namedDecember 2007
New organization approvedManaging Board incl. Sector CEO approved
November 2007Supervisory Board
Share buyback completedCapital structure target achievedSG&A project completedTarget margins achieved
October 2010
Streamlining Other Operations completedOctober 2009
New management compensation scheme in place October 2008
Start pro forma reporting in new structureOutline new management compensation schemeGuidance on EPS range for 2009
July 2008Q3 conference call
Update on SG&A project April 2008 Q2 analyst conference
New target margins for Energy and Industry SectorTarget margins for Divisions
January 2008 AGM
Milestones (deliverables)Reporting dates

Page 18 June 12th, 2008 Copyright © Siemens AG 2008. All rights reserved.JPMorgan 6th European Capital Goods Conference
Key G&A improvement areas and levers identified
∼3.2Baseline FY 2007
Leverage newsector organization
Leverage new regionalcluster organization
Operate with clearaccountability
Ensure effective cor-porate governance
Capture synergies ofscale by appropriate
pooling
Ensure operational excellence
Target FY 2010 ∼2.5
Reductionby 22%
Key improvement areas
Consolidation of headquarter central functions from 8 Groups into 3 Sectors(e.g., in accounting, controlling, communication)
Bundling of infrastructure from ~ 70 regional companies into 20 regional clusters to exploit cost synergies (e.g., in accounting, controlling, IT)
No institutionalized 2nd opinionReduction of profit center structures from 900 to 500No corporate-driven performance controlling for regionsReduction of consultant support
Streamlining Corporate headquarters to governance activities resulting in cost reduction Reduction of number of corporate programs and initiatives by > 50%Reduction in number of legal entities from 1,800 to < 1,000Centralizing of auditing
Bundling of shared services to double Siemens-internal service coverageConsolidation of real-estate management into a single entity
Optimize fragmented and oversized IT services by infrastructure standardizationand application consolidationIntroduction of rolling forecast replacing bottom-up planning
Reported G&A cost, € bn

Page 19 June 12th, 2008 Copyright © Siemens AG 2008. All rights reserved.JPMorgan 6th European Capital Goods Conference
Levers for sales cost reduction and efficiency gains
FY 2007
Optimizationof infrastructure
Optimizationof back office
Front end
FY 2010 ∼8.4
∼8.9
Reductionby 6%
Key improvement areas
Bundling of infrastructure in Clusters Integration of legal entitiesStreamlining of sales mgt. structures Discontinuation of major IT projectsBundling of shared services to double service coverage
Centralization of sales back office (e.g. offer preparation, technical consulting,…) in 20 Clusters (instead of 70 countries) or across ClustersInterface optimization between HQ-Regions, no duplicate functionsReduction of HQ back office functions Removal of cross-Divisional coordination functions in vertical markets
Efficiency increase
Growth related increase
Sales efficiency:Standardization of planning, logistics, pricing, CRM processes across Clusters and selected DivisionsFocused market approach (selection of market segments) Leverage e-Business
Go-to-market / sales channels:Redefining sales representation in smaller countriesRestructuring of sales officesStronger orientation towards verticals like automotive, F&BLeverage channel management with partners Joint wholesale approachLeverage cross-Divisional sales
Reported sales cost, € bn

Page 20 June 12th, 2008 Copyright © Siemens AG 2008. All rights reserved.JPMorgan 6th European Capital Goods Conference
Growth
Update on Fit42010 comprehensive target system
Cash conversion Capital structureAdj. industrial net debt / EBITDA
Capital efficiency
1 – growth rate
>2x GDP ROCE 14 - 16%
0.8x – 1.0x
Cash
ProfitabilityGrowth
Capitalstructure
1) FY 2007 adjusted for VDO proceeds € 11.4 bn and Dade Behring purchase price € 5.2 bn
4%
10%10%
FY 2006 FY 2007 Q2 2008 YTD
9.6%
FY 2006
12.7%
FY 2007
8.6%
Q2 2008 YTD
Q2 2008 YTD
0.040.37
0.76 1)
FY 2006 FY 2007FY 2006 FY 2007
0.86
Q2 2008 YTD
0.69
1.73
Page 21 June 12th, 2008 Copyright © Siemens AG 2008. All rights reserved.JPMorgan 6th European Capital Goods Conference
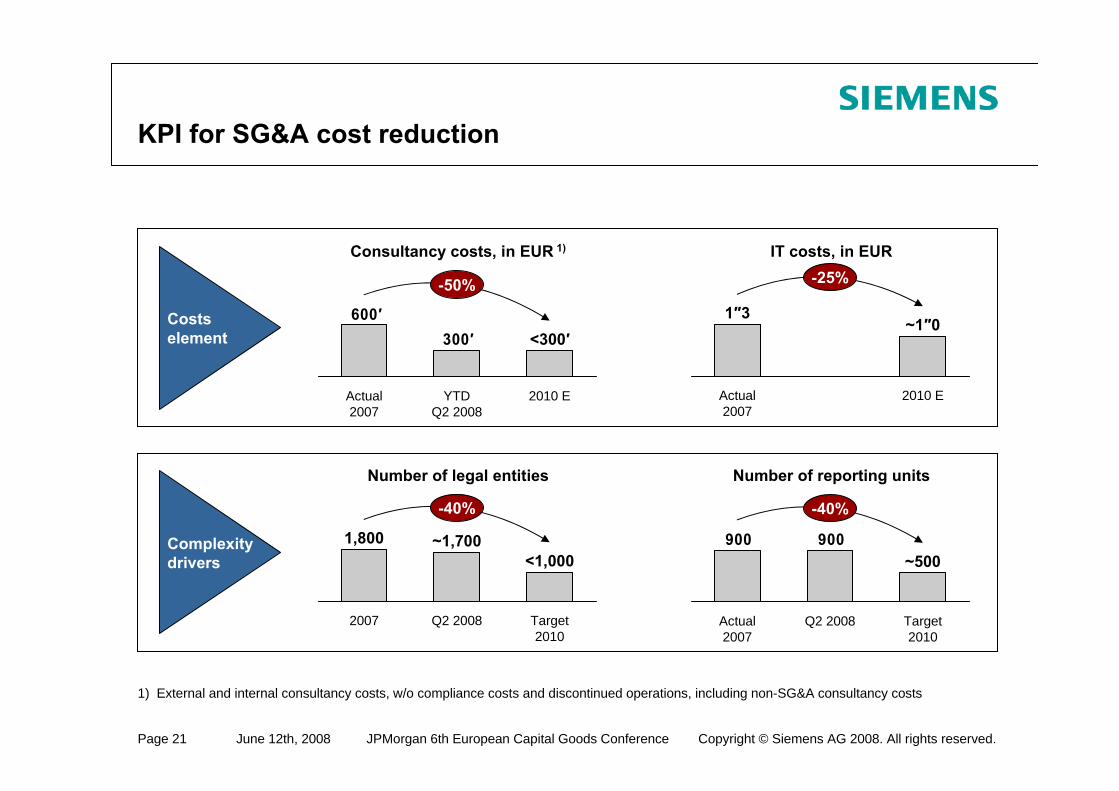
KPI for SG&A cost reduction
1) External and internal consultancy costs, w/o compliance costs and discontinued operations, including non-SG&A consultancy costs
Costs element
Complexitydrivers
Consultancy costs, in EUR 1) IT costs, in EUR
Number of legal entities Number of reporting units
300′600′
<300′
-50%
2010 EYTD Q2 2008
Actual2007
Actual2007
-25%
1″3
2010 E
~1″0
900900
Q2 2008
-40%
Target2010
Actual2007
~5001,800
2007
~1,700
Q2 2008
<1,000
Target2010
-40%

Page 22 June 12th, 2008 Copyright © Siemens AG 2008. All rights reserved.JPMorgan 6th European Capital Goods Conference
€ 2 bn share buyback tranche successfully executed
Number of sharesoutstanding
Share price and daily repurchase volume28 Jan – 8 April
We are fully committed to the share buyback program and will provide continuing updates of next steps
0
200.000
400.000
600.000
800.000
1.000.000
28-Jan-08
5-Feb-08
13-Feb-08
21-Feb-08
29-Feb-08
10-Mar-08
18-Mar-08
28-Mar-08
7-Apr-08
Volu
me
50
60
70
80
90
100
Share Price (€)
Repurchased Vo lume Gro ss Repurchased P rice
914.2m
01 Jan 08
24.9m
889.3m
08 Apr 08
(2.7% of sharesoutstanding)
Sector CFO namedDivision CEO and CFO namedDecember 2007
New organization approvedManaging Board incl. Sector CEO approved
November 2007Supervisory Board
Share buyback completedCapital structure target achievedSG&A project completedTarget margins achieved
October 2010
Streamlining Other Operations completedOctober 2009
New management compensation scheme in place October 2008
Start pro forma reporting in new structureOutline new management compensation schemeGuidance on EPS range for 2009
July 2008Q3 conference call
Update on SG&A project April 2008 Q2 analyst conference
New target margins for Energy and Industry SectorTarget margins for Divisions
January 2008 AGM
Milestones (deliverables)Reporting dates
Page 23 June 12th, 2008 Copyright © Siemens AG 2008. All rights reserved.JPMorgan 6th European Capital Goods Conference
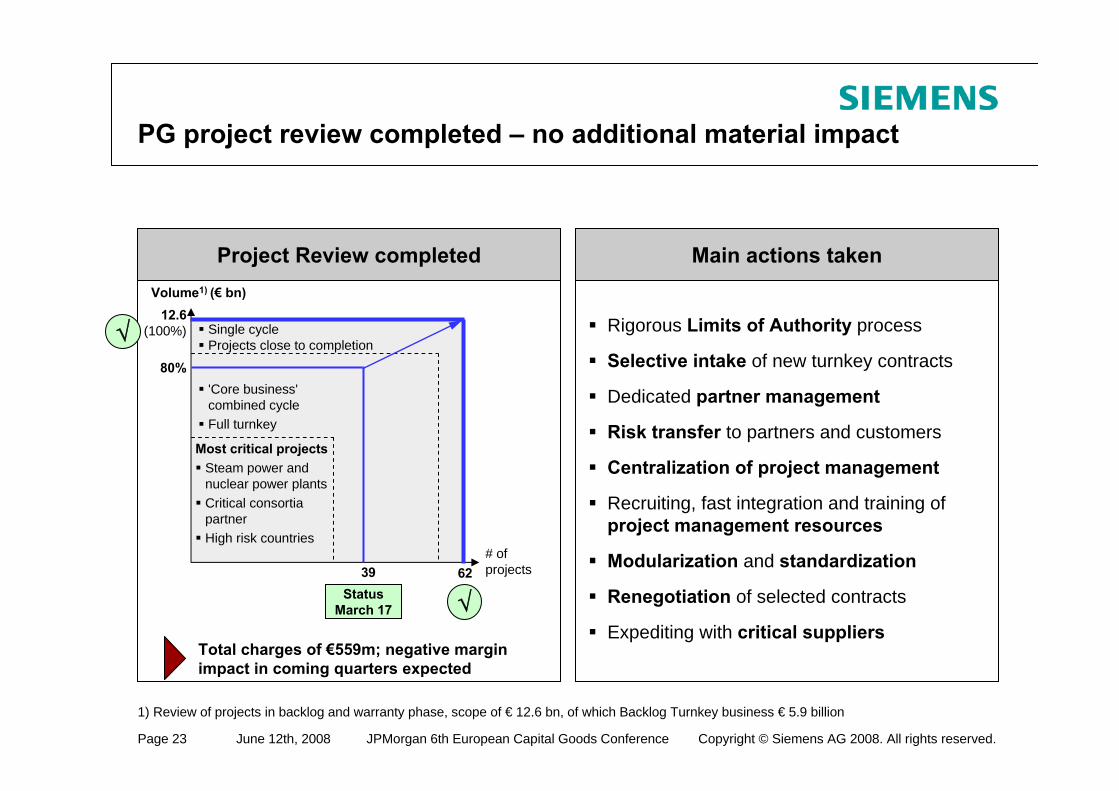
PG project review completed – no additional material impact
Project Review completed Main actions taken
Rigorous Limits of Authority process
Selective intake of new turnkey contracts
Dedicated partner management
Risk transfer to partners and customers
Centralization of project management
Recruiting, fast integration and training of project management resources
Modularization and standardization
Renegotiation of selected contracts
Expediting with critical suppliers
# of projects
Most critical projectsSteam power and nuclear power plantsCritical consortia partnerHigh risk countries
12.6(100%)
80%
Volume1) (€ bn)
'Core business' combined cycleFull turnkey
Single cycle Projects close to completion
62Status
March 17
39
√
Total charges of €559m; negative margin impact in coming quarters expected
√
1) Review of projects in backlog and warranty phase, scope of € 12.6 bn, of which Backlog Turnkey business € 5.9 billion

Page 24 June 12th, 2008 Copyright © Siemens AG 2008. All rights reserved.JPMorgan 6th European Capital Goods Conference
Business mix will drive higher Fossil PG margins
Backlog in Fossil
29%
Turnkey
71%
Products & Service
€ 22.5 bn08/03/31
Order intake in Fossil
30%
Turnkey
70%
Products & Service
€ 4.2 bnQ2 2008
Turning turnkey backlog into sales
Business mix will change
1,5 2,2 1,8
3,0
1,3
>2010
5.9
4Q 07 Turned into
revenue
New order intake
6.6
2Q 08 2H 08 2009 2010
0,5
Backlog in € bn
Order intake (%)
39% 34% 33%
61%
100%
2007
66%
100%
2010E
67%
100%
Long termtarget
Turnkey
Products& Service
New orders in 07-08 more profitable than older projects
Challenges from Olkiluoto - project <50% completed
Fossil PG Margin of 7-9% in 2009
Fossil's 2010 target of 11-15% confirmed

Page 25 June 12th, 2008 Copyright © Siemens AG 2008. All rights reserved.JPMorgan 6th European Capital Goods Conference
Financial Calendar
July
June
June 2008 Post Q2 roadshows with CEO and CFO in New York and Boston (June 9-10), London (June 12), Frankfurt (June 13)
June 4, 2008Deutsche Bank German & Austrian Corporate Conference – Joe Kaeser, CFO
June 12, 2008JPMorgan Pan-European CEO Conference – Peter Löscher, CEO
August/September No events planned so far
June 30 – July 1, 2008Capital Market Days of Sector Energy – Munich, Germany
July 30, 2008Q3 Financial report and conference call

Page 26 June 12th, 2008 Copyright © Siemens AG 2008. All rights reserved.JPMorgan 6th European Capital Goods Conference
Reconciliation and Definitions for Non-GAAP Measures (I)
Group profit from Operations is reconciled to Income before income taxes of Operations under Reconciliation to financial statements on thetable Segment Information. See our Financial Publications at our Investor Relations website under www.siemens.com/ir.
Earnings before interest and taxes (EBIT) (adjusted) is Income from continuing operations before income taxes less Financial income (expense), net and Income (loss) from investments accounted for using the equity method, net.
Earnings before interest, taxes, depreciation and amortization (EBITDA) (adjusted) is EBIT before Depreciation and Amortization, definedas amortization and impairments of intangible assets depreciation and impairments of property, plant and equipment.
Group profit is reconciled to EBIT and EBITDA on the table Segment Information Analysis (II). See our Financial Publications at our Investor Relations website under www.siemens.com/ir.
Return on Capital Employed (ROCE) is a measure of how capital invested in the Company or the Group yields competitive returns. For the Company, ROCE is calculated as Net income (before interest) divided by average Capital employed (CE). Net income (before interest) is defined as Net income excluding Other interest income (expense), net and excluding taxes on Other interest income (expense), net. Taxes on Other interest income (expense), net are calculated in simplified form by applying the current tax rate which can be derived from the Consolidated Statements of Income, to Other interest income (expense), net. CE is defined as Total equity plus Long-term debt plus Short-term debt and current maturities of long-term debt minus Cash and cash equivalents. Because Siemens reports discontinued operations, Siemens also calculates ROCE on a continuing operations basis, using Income from continuing operations rather than Net income. For purposes of this calculation, CE is adjusted by the net figure for Assets classified as held for disposal included in discontinued operations less Liabilities associated with assets classified as held for disposal included in discontinued operations.For the Operations Groups, ROCE is calculated as Group profit divided by average Net capital employed (NCE). Group profit for the Operations Groups is principally defined as earnings before financing interest, certain pension costs and income taxes. Group profit excludes various categories of items which are not allocated to the Groups since the Managing Board does not regard such items as indicative of the Groups’performance. NCE for the Operations Groups is defined as total assets less tax assets, provisions and non-interest bearing liabilities other than tax liabilities.Average (Net) Capital employed for the fiscal year is calculated as a 'five-point average' obtained by averaging the (Net) Capital employed at the beginning of the first quarter plus the final figures for all four quarters of the fiscal year. For the calculation of the average during for the quarters, see below:

Page 27 June 12th, 2008 Copyright © Siemens AG 2008. All rights reserved.JPMorgan 6th European Capital Goods Conference
Reconciliation and Definitions for Non-GAAP Measures (II)
• NCE for Operations Groups
Our cash target is based on the Cash Conversion Rate (CCR), which serves as a target indicator for the Company’s or the Group’s cash flow. For the Company, CCR is defined as the ratio of Free cash flow to Net income, where Free cash flow equals the Net cash provided by (used in) operating activities less Additions to intangible assets and property, plant and equipment. Because Siemens reports discontinued operations, this measure is also shown on a continuing operations basis, using Income from continuing operations, Net cash provided by (used in) operating activities – continuing operations and Additions to intangible assets and property, plant and equipment for continuing operations for the calculation. For the Groups, CCR is defined as Free cash flow divided by Group profit.
All values needed for the calculation of ROCE and CCR can be obtained from the Consolidated Financial Statements and Notes to Consolidated Financial Statements.Group profit, Net capital employed and Free cash flow for the Company and the Groups can be found on the table Segment information. Our Consolidated Financial Statements are available on our Investor Relations website under www.siemens.com/ir.
Siemens ties a portion of its executive incentive compensation to achieving economic value added (EVA) targets. EVA measures the profitability of a business (using Group profit for the Operating Groups and Income before income taxes for the Financing and Real estate businesses as a base) against the additional cost of capital used to run a business (using NCE for the Operating Groups and risk-adjusted equity for the Financing and Real estate businesses as a base). A positive EVA indicates that a business has earned more than its cost of capital, and is therefore defined as value-creating. A negative EVA indicates that a business is earning less than its cost of capital and is therefore defined as value-destroying. Other organizations that use EVA may define and calculate EVA differently.
Average calculation for CE*:
4 Point average: (CE ending Q4 Prior year + CE ending Q1 + CE ending Q2 + CE ending Q3) / 4Q3
3 Point average: (CE ending Q4 Prior year + CE ending Q1 + CE ending Q2) / 3Q2
2 Point average: (CE ending Q4 Prior year + CE ending Q1) / 2Q1Year-to-Date
2 Point average: (CE ending Q3 + CE ending Q4) / 2Q4
2 Point average: (CE ending Q2 + CE ending Q3) / 2Q3
2 Point average: (CE ending Q1 + CE ending Q2) / 2Q2
2 Point average: (CE ending Q4 Prior year + CE ending Q1) / 2Q1Quarter-to-Date

Page 28 June 12th, 2008 Copyright © Siemens AG 2008. All rights reserved.JPMorgan 6th European Capital Goods Conference
Reconciliation and Definitions for Non-GAAP Measures (III)
Our capital structure target is based on an Adjusted industrial net debt divided by EBITDA (adjusted). For the calculation of Adjusted industrial net debt, we subtract from Net debt (defined as Long-term debt plus Short-term debt and current maturities of long-term debt less Cash and cash equivalents less Available-for-sale financial assets) (1) SFS debt excluding SFS internally purchased receivables and (2) 50% of the nominal amount of our hybrid bond; and add/subtract (3) Funded status of Pension benefits, (4) Funded status of Other post-employment benefits; andadd (5) Credit guarantees. The components of Net debt are available on our Consolidated Balance Sheets, SFS debt less internally purchased receivables is available in our Management Discussion & Analysis under Capital Resources and Requirements. The Funded status of our principle pension plans and Other post-employment benefits, the amount of credit guarantees and the nominal amount of our Hybrid bond is available in the Notes to our Consolidated Financial Statements.
To measure Siemens’ achievement of the goal to grow at twice the rate of global GDP, we use GDP on real basis (i.e. excluding inflationand currency translation effects) with data provided by Global Insight Inc. and compare those growth rates with growth rates of our revenue(under IFRS). In accordance with IFRS, our revenue numbers are not adjusted by inflation and currency translation effects.
Return on equity (ROE) margin for SFS was calculated as SFS’ Income before income taxes divided by the allocated equity for SFS.Allocated equity for SFS for the financial year 2007 is €1.041 billion. The allocated equity for SFS is determined and influenced by the respective credit ratings of the rating agencies and by the expected size and quality of its portfolio of leasing and factoring assets and equity investments and is determined annually. This allocation is designed to cover the risks of the underlying business and is in line with common credit risk management standards in banking. The actual risk profile of the SFS portfolio is monitored and controlled monthly and is evaluated against the allocated equity.
Group profit from Operations, EBIT (adjusted), EBITDA (adjusted), ROCE, CCR, EVA and Adjusted industrial net debt are or may be Non-GAAP financial measures as defined in relevant rules of the U.S. Securities and Exchange Commission. Our management takes these measures,among others, into account in its management of our business, and for this reason we believe that investors may find it useful to consider these measures in their evaluation of our performance. None of Group profit from Operations, EBIT (adjusted), EBITDA (adjusted), ROCE and EVA should be viewed in isolation as an alternative to IFRS net income for purposes of evaluating our results of operations; CCR should not be viewed in isolation as an alternative to measures reported in our IFRS cash flow statement for purposes of evaluating our cash flows; and Adjusted industrial net debt should not be viewed in isolation as an alternative to liabilities reported in our IFRS balance sheet for purposes of evaluating our financial condition.

Page 29 June 12th, 2008 Copyright © Siemens AG 2008. All rights reserved.JPMorgan 6th European Capital Goods Conference
Siemens Investor Relations Team
Webpage: http://www.siemens.com/investorrelations
e-mail: [email protected]
Telephone: +49-89-636-32474
Fax: +49-89-636-32830
Michael Sen +49-89-636-33780
Gerald Brady +1-408-492-4439
Florian Flossmann +49-89-636-34095
Sabine Groß +49-89-636-35755
Dr. Martin Meyer +49-89-636-33693
Christof Schwab +49-89-636-32677
Dr. Gerd Venzl +49-89-636-44144