execution drives top-line and margin expansion full …€¦ · rtd tea contributed to the growth,...
TRANSCRIPT

Results for the year ended 31 December 2015 19 February 2016
Page 1 of 34
EXECUTION DRIVES TOP-LINE AND MARGIN EXPANSION
Coca-Cola HBC AG, a leading bottler of The Coca-Cola Company, reports its financial results for the full year
ended 31 December 2015.
Full-year highlights
• Underlying trends in volume growth continued to be strong in the fourth quarter leading to a 2.6%
increase in reported volume for the year
o Established markets returned to growth for the first time in five years, with good performances in Italy
and Greece
o Volumes grew in all countries in the Developing markets segment with particularly positive trends in
Poland and Hungary
o Double-digit growth in Nigeria, Romania and Ukraine helped drive volume in the Emerging markets
segment up by 2.5%, despite the anticipated mid single-digit decline in Russia
o Volume growth in all key categories except for RTD Tea
• FX-neutral net sales revenue per case developed positively in the fourth quarter, resulting in a marginal
increase for the full year; deflation in Europe and affordability concerns in certain markets limited pricing
opportunities in the Established and Developing market segments, largely offsetting the pricing actions
taken in Emerging markets
• Net sales revenue declined by 2.5% after a -5.1% adverse foreign exchange impact
• Comparable EBIT was €473.2 million – up 11.4%; comparable EBIT margin expanded by 100 basis points;
pricing actions in certain countries, favourable input costs and volume leverage, particularly in
Established and Developing markets, more than offset the significant adverse impact from currencies,
primarily the Russian Rouble
• Increased profits and further improvements in working capital helped generate €411.8 million of free cash
flow for the year bringing the 2013-2015 free cash flow to €1.16 billion
• On a reported basis, EBIT increased by 15.8% to €418.2 million; net profit was €280.3 million
• Comparable EPS increased by 13.5% to €0.864; reported EPS declined by 4.7% to €0.771
• The Board of Directors proposes a €0.40 dividend per share, a 11.1% uplift on the 2014 dividend
Full Year Change
2015 2014
Volume (m unit cases) 2,055.0 2,002.9 2.6%
Net sales revenue (€ m) 6,346.1 6,510.2 -2.5% Net sales revenue per unit case (€) 3.09 3.25 -4.9% FX-neutral net sales revenue per unit case (€) 3.09 3.08 0.3% Operating profit (EBIT) (€ m) 418.2 361.1 15.8% Comparable EBIT (€ m) 473.2 424.7 11.4% EBIT margin (%) 6.6 5.5 110bps Comparable EBIT margin (%) 7.5 6.5 100bps Net profit* (€ m) 280.3 294.8 -4.9% Comparable net profit* (€ m) 314.3 277.4 13.3% Basic earnings per share (EPS) (€) 0.771 0.809 -4.7% Comparable EPS (€) 0.864 0.761 13.5%
*Net Profit and Comparable Net Profit refer to net profit and comparable net profit respectively after tax attributable to owners of the parent.
Dimitris Lois, Chief Executive Officer of Coca-Cola HBC AG, commented:
“I am pleased with our progress in 2015; volumes grew in all segments for the first time in five years and
margins have improved significantly. Our commercial initiatives supported volume expansion and we made
further efficiency gains to ensure continued profitable growth.
“Conditions in Europe are slowly improving while countries with large oil exposure face ongoing difficult
trading conditions. Going into 2016 we will continue to take action to address the challenges on a country by
country basis. Overall we think the business is well placed to build further on both the volume growth and
margin expansion achieved in 2015.”
Results for the year ended 31 December 2015 19 February 2016
Page 2 of 34
SPECIAL NOTE REGARDING THE INFORMATION SET OUT HEREIN
Unless otherwise indicated, the condensed consolidated interim financial statements and the financial and operating data or other information included herein relate to Coca-Cola HBC AG and its subsidiaries (“Coca-Cola HBC” or the “Company” or “we” or the “Group”).
FORWARD-LOOKING STATEMENTS
This document contains forward-looking statements that involve risks and uncertainties. These statements may generally, but not always, be identified by the use of words such as “believe”, “outlook”,
“guidance”, “intend”, “expect”, “anticipate”, “plan”, “target” and similar expressions to identify forward-looking statements. All statements other than statements of historical facts, including, among others,
statements regarding our future financial position and results, our outlook for 2016 and future years, business strategy and the effects of the global economic slowdown, the impact of the sovereign debt
crisis, currency volatility, our recent acquisitions, and restructuring initiatives on our business and financial condition, our future dealings with The Coca-Cola Company, budgets, projected levels of consumption
and production, projected raw material and other costs, estimates of capital expenditure, free cash flow, effective tax rates and plans and objectives of management for future operations, are forward-looking
statements. By their nature, forward-looking statements involve risk and uncertainty because they reflect our current expectations and assumptions as to future events and circumstances that may not prove
accurate. Our actual results and events could differ materially from those anticipated in the forward-looking statements for many reasons, including the risks described in the 2014 Integrated Annual Report
for Coca-Cola HBC AG and its subsidiaries.
Although we believe that, as of the date of this document, the expectations reflected in the forward-looking statements are reasonable, we cannot assure you that our future results, level of activity,
performance or achievements will meet these expectations. Moreover, neither we, nor our directors,
employees, advisors nor any other person assumes responsibility for the accuracy and completeness of the forward-looking statements. After the date of the condensed consolidated financial statements
included in this document, unless we are required by law or the rules of the UK Financial Conduct Authority to update these forward-looking statements, we will not necessarily update any of these forward-looking
statements to conform them either to actual results or to changes in our expectations.
Results for the year ended 31 December 2015 19 February 2016
Page 3 of 34
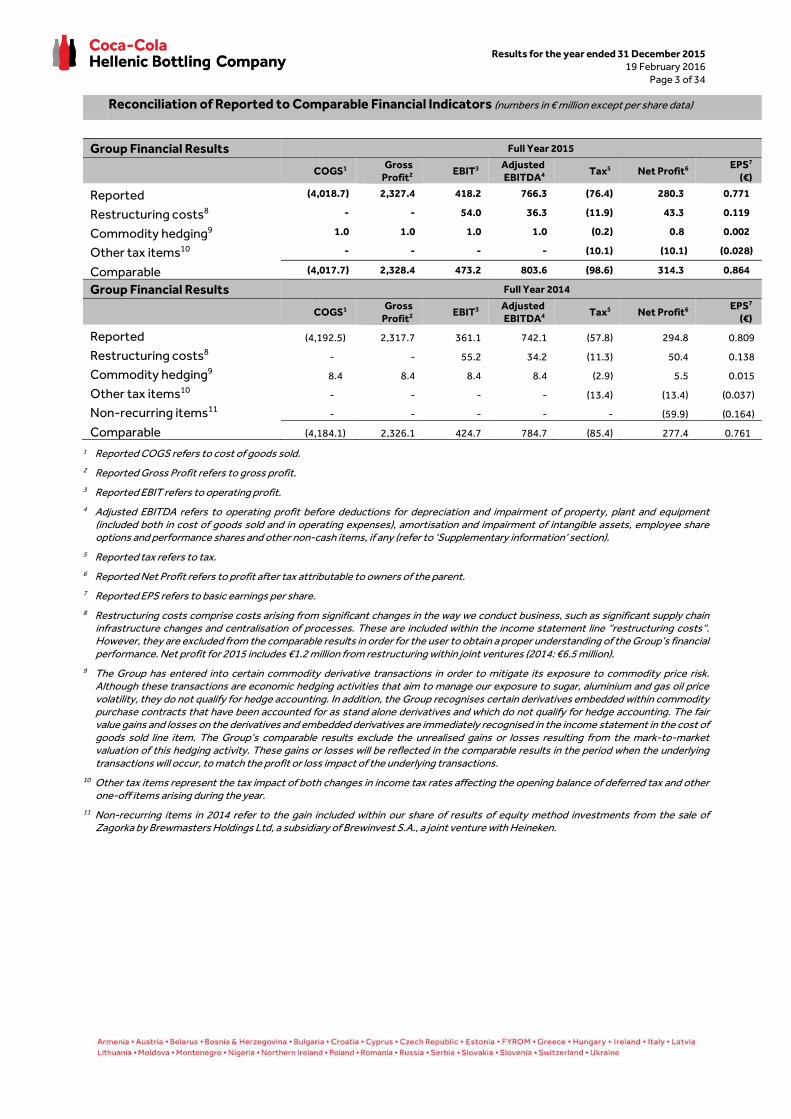
Reconciliation of Reported to Comparable Financial Indicators (numbers in € million except per share data)
Group Financial Results Full Year 2015
COGS1 Gross
Profit2 EBIT3
Adjusted EBITDA4
Tax5 Net Profit6 EPS7 (€)
Reported (4,018.7) 2,327.4 418.2 766.3 (76.4) 280.3 0.771
Restructuring costs8 - - 54.0 36.3 (11.9) 43.3 0.119
Commodity hedging9 1.0 1.0 1.0 1.0 (0.2) 0.8 0.002
Other tax items10 - - - - (10.1) (10.1) (0.028)
Comparable (4,017.7) 2,328.4 473.2 803.6 (98.6) 314.3 0.864
Group Financial Results Full Year 2014
COGS1 Gross
Profit2 EBIT3
Adjusted EBITDA4
Tax5 Net Profit6 EPS7
(€)
Reported (4,192.5) 2,317.7 361.1 742.1 (57.8) 294.8 0.809
Restructuring costs8 - - 55.2 34.2 (11.3) 50.4 0.138
Commodity hedging9 8.4 8.4 8.4 8.4 (2.9) 5.5 0.015
Other tax items10 - - - - (13.4) (13.4) (0.037)
Non-recurring items11 - - - - - (59.9) (0.164)
Comparable (4,184.1) 2,326.1 424.7 784.7 (85.4) 277.4 0.761
1 Reported COGS refers to cost of goods sold.
2 Reported Gross Profit refers to gross profit.
3 Reported EBIT refers to operating profit.
4 Adjusted EBITDA refers to operating profit before deductions for depreciation and impairment of property, plant and equipment (included both in cost of goods sold and in operating expenses), amortisation and impairment of intangible assets, employee share options and performance shares and other non-cash items, if any (refer to ‘Supplementary information’ section).
5 Reported tax refers to tax.
6 Reported Net Profit refers to profit after tax attributable to owners of the parent.
7 Reported EPS refers to basic earnings per share.
8 Restructuring costs comprise costs arising from significant changes in the way we conduct business, such as significant supply chain infrastructure changes and centralisation of processes. These are included within the income statement line “restructuring costs“. However, they are excluded from the comparable results in order for the user to obtain a proper understanding of the Group’s financial performance. Net profit for 2015 includes €1.2 million from restructuring within joint ventures (2014: €6.5 million).
9 The Group has entered into certain commodity derivative transactions in order to mitigate its exposure to commodity price risk. Although these transactions are economic hedging activities that aim to manage our exposure to sugar, aluminium and gas oil price volatility, they do not qualify for hedge accounting. In addition, the Group recognises certain derivatives embedded within commodity purchase contracts that have been accounted for as stand alone derivatives and which do not qualify for hedge accounting. The fair value gains and losses on the derivatives and embedded derivatives are immediately recognised in the income statement in the cost of goods sold line item. The Group’s comparable results exclude the unrealised gains or losses resulting from the mark-to-market valuation of this hedging activity. These gains or losses will be reflected in the comparable results in the period when the underlying transactions will occur, to match the profit or loss impact of the underlying transactions.
10 Other tax items represent the tax impact of both changes in income tax rates affecting the opening balance of deferred tax and other one-off items arising during the year.
11 Non-recurring items in 2014 refer to the gain included within our share of results of equity method investments from the sale of Zagorka by Brewmasters Holdings Ltd, a subsidiary of Brewinvest S.A., a joint venture with Heineken.

Results for the year ended 31 December 2015 19 February 2016
Page 4 of 34
Group Operational Review
Over the year we have successfully managed the business, in challenging macroeconomic and trading
conditions, to deliver strong results. This performance marks an important step in returning our business to sustainable growth and higher margins.
The combination of affordability measures in certain countries, targeted and better-quality marketing, and our focus on execution ensured volume growth in the year. Enhanced volume growth, favourable input
costs and operating cost discipline drove a 100 basis point improvement in our comparable EBIT margin in the year despite the adverse impact of currencies.
Volume performance
Volume increased in the year by 2.6%, cycling a 2.8% decline in the prior year. Good performance from
Sparkling and Water further supported by Juice helped achieve this growth.
Established market volume increased by 1.0%, cycling a 5.4% decline in the prior year, and posting growth
for the first time in five years. Good Water performance, particularly in Italy, Austria and Greece, as well as Energy growth offset a marginal decline in the sparkling beverages category. Developing market volume
grew by 5.7%, following a 6.0% decline in the prior year. All markets and categories with the exception of RTD Tea contributed to the growth, with notable performances in Poland and Hungary. Emerging markets
posted 2.5% growth, cycling a stable performance in the prior year. With the exception of Russia and Belarus, all of our markets delivered very good growth. In particular, Nigeria, Romania and Ukraine achieved
growth rates in low teens.
Category performance
Sparkling beverages volume grew by 2% boosted by trade marketing initiatives such as ‘Share a Coke’ in
Nigeria and Coke with Food across our markets, organised trade performance in the Developing segment
and affordability measures in certain markets. These actions more than offset the challenging trading conditions in Russia, Belarus, Ireland and Greece. Within the category, Trademark Coca-Cola increased by
3.3%, Coke Zero by 23.5% and Fanta by 4.0%.
Juice volume increased by 7.9% in the year. Russia was the key driver of this growth as a result of the
performance of our expanded portfolio offering in the country, incorporating our newest brand Moya Semya. Our investments in juice innovation in Nigeria also paid off with a 19.2% volume uplift in the
country. Excluding Moya Semya, growth in the juice category overall for the Group was 2.1%. Water grew by 4.7% in the period, with good performances in most of our countries, particularly Ukraine, Poland, Italy
and Romania. Energy drinks category sustained its growth momentum, increasing volumes by 6.6% driven by Hungary, Poland, Serbia and Ireland.
Our Premium Spirits volume declined by 6.1%. Revenues were €181.8 million - down 8.6% compared to prior year - after a 13.2% adverse currency movement in the year.
Single-serve packs increased by 3.6%, while multi-serves increased by 1.9%, leading to a 0.4 percentage point improvement in package mix. All segments improved their mix, Emerging markets being the key
contributor to the performance. Sparkling mix improved by 0.9 percentage points while Water mix deteriorated by 0.5 percentage points in the year.

Results for the year ended 31 December 2015 19 February 2016
Page 5 of 34
Group Operational Review (continued)
Key financials
FX-neutral net sales revenue per unit case grew for the fifth consecutive year, increasing by 0.3% in the year. Good delivery of our revenue growth management initiatives in a number of Emerging markets was,
largely offset by the impact of our affordability measures and deflationary pressures.
Net sales revenue of €6.3 billion was down 2.5% compared to prior year. The 5.1% headwind from adverse
movements in currencies was only partly offset by the improved volume and the revenue growth initiatives, including pricing, taken during the period.
FX-neutral input cost per unit case declined by 9% as expected. The lower cost of EU sugar and PET resin benefited the Established and Developing segments in particular.
Our restructuring efforts in recent years and tight cost management have optimised the cost base, better positioning the business for operating leverage, although higher currency management costs in a very
volatile year, coupled with the sharp adverse currency impact on revenue, led to a stable performance in terms of operating expenses as a percentage of net sales revenue.
Comparable EBIT was €473.2 million, leading to a 100 basis point expansion in comparable EBIT margin to 7.5%. Favourable input costs, increased volume and the benefits from our revenue growth management
initiatives more than offset the €173.5 million adverse impact of currency movements. Comparable EBIT
and comparable EBIT margin increased considerably in the Established and Developing market segments, while profitability in the Emerging markets segment declined. On a reported basis, we delivered €418.2
million of EBIT in the year, a €57.1 million improvement on the prior year.
We incurred €54.0 million in pre-tax restructuring charges in the year, the majority of which was due to
planned actions in the Established and Emerging segments. We continue to effectively execute our restructuring plans, targeting an increasingly agile and efficient organisation.
In the year, we grew free cash flow by €79.1 million to €411.8 million. Key drivers of the improvement were working capital reduction, improved operational profitability and capital expenditure. Both the balance
sheet working capital position and the working capital days improved in the year.
Comparable net profit of €314.3 million and comparable earnings per share of €0.864 were 13.3% and
13.5% higher than in the prior year, respectively. Reported net profit and reported basic earnings per share were €280.3 million and €0.771, respectively, in the period.
In line with our progressive dividend policy, the Board of Directors proposes a full-year dividend of 0.40 Euros per share, an 11.1% increase on the 2014 dividend. The dividend payment will be subject, among
other things, to shareholders’ approval at our annual general meeting.
Results for the year ended 31 December 2015 19 February 2016
Page 6 of 34
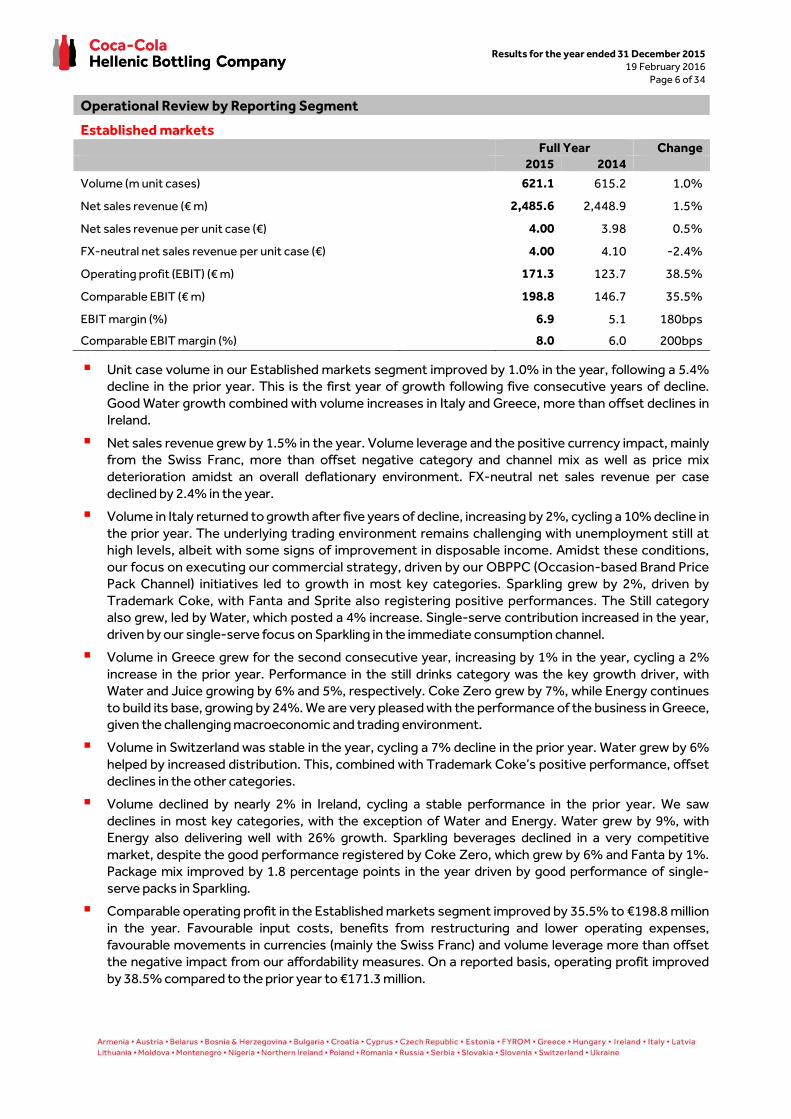
Operational Review by Reporting Segment
Established markets Full Year Change
2015 2014
Volume (m unit cases) 621.1 615.2 1.0%
Net sales revenue (€ m) 2,485.6 2,448.9 1.5%
Net sales revenue per unit case (€) 4.00 3.98 0.5%
FX-neutral net sales revenue per unit case (€) 4.00 4.10 -2.4%
Operating profit (EBIT) (€ m) 171.3 123.7 38.5%
Comparable EBIT (€ m) 198.8 146.7 35.5%
EBIT margin (%) 6.9 5.1 180bps
Comparable EBIT margin (%) 8.0 6.0 200bps
� Unit case volume in our Established markets segment improved by 1.0% in the year, following a 5.4% decline in the prior year. This is the first year of growth following five consecutive years of decline.
Good Water growth combined with volume increases in Italy and Greece, more than offset declines in Ireland.
� Net sales revenue grew by 1.5% in the year. Volume leverage and the positive currency impact, mainly from the Swiss Franc, more than offset negative category and channel mix as well as price mix
deterioration amidst an overall deflationary environment. FX-neutral net sales revenue per case
declined by 2.4% in the year.
� Volume in Italy returned to growth after five years of decline, increasing by 2%, cycling a 10% decline in
the prior year. The underlying trading environment remains challenging with unemployment still at high levels, albeit with some signs of improvement in disposable income. Amidst these conditions,
our focus on executing our commercial strategy, driven by our OBPPC (Occasion-based Brand Price Pack Channel) initiatives led to growth in most key categories. Sparkling grew by 2%, driven by
Trademark Coke, with Fanta and Sprite also registering positive performances. The Still category also grew, led by Water, which posted a 4% increase. Single-serve contribution increased in the year,
driven by our single-serve focus on Sparkling in the immediate consumption channel.
� Volume in Greece grew for the second consecutive year, increasing by 1% in the year, cycling a 2%
increase in the prior year. Performance in the still drinks category was the key growth driver, with Water and Juice growing by 6% and 5%, respectively. Coke Zero grew by 7%, while Energy continues
to build its base, growing by 24%. We are very pleased with the performance of the business in Greece, given the challenging macroeconomic and trading environment.
� Volume in Switzerland was stable in the year, cycling a 7% decline in the prior year. Water grew by 6%
helped by increased distribution. This, combined with Trademark Coke’s positive performance, offset
declines in the other categories.
� Volume declined by nearly 2% in Ireland, cycling a stable performance in the prior year. We saw
declines in most key categories, with the exception of Water and Energy. Water grew by 9%, with Energy also delivering well with 26% growth. Sparkling beverages declined in a very competitive
market, despite the good performance registered by Coke Zero, which grew by 6% and Fanta by 1%. Package mix improved by 1.8 percentage points in the year driven by good performance of single-
serve packs in Sparkling.
� Comparable operating profit in the Established markets segment improved by 35.5% to €198.8 million
in the year. Favourable input costs, benefits from restructuring and lower operating expenses,
favourable movements in currencies (mainly the Swiss Franc) and volume leverage more than offset the negative impact from our affordability measures. On a reported basis, operating profit improved
by 38.5% compared to the prior year to €171.3 million.

Results for the year ended 31 December 2015 19 February 2016
Page 7 of 34
Operational Review by Reporting Segment (continued)
Developing markets
Full Year Change
2015 2014
Volume (m unit cases) 378.7 358.3 5.7%
Net sales revenue (€ m) 1,092.0 1,054.1 3.6%
Net sales revenue per unit case (€) 2.88 2.94 -2.0%
FX-neutral net sales revenue per unit case (€) 2.88 2.95 -2.4%
Operating profit (EBIT) (€ m) 87.4 52.0 68.1%
Comparable EBIT (€ m) 98.6 57.9 70.3%
EBIT margin (%) 8.0 4.9 310bps
Comparable EBIT margin (%) 9.0 5.5 350bps
� Unit case volume in our Developing market segment grew by 5.7% in the year, with good
performances in all of our countries. The sparkling beverages category was the main growth driver, supported by Water and to a lesser extent Juice.
� Net sales revenue grew by 3.6% in the period. Benefits of improved volume and category mix as well
as the positive currency impact more than offset unfavourable channel and price mix. On an FX-
neutral basis, net sales revenue per unit case declined by 2.4% in the year.
� In Poland, volume increased by 7% in the period. This follows a 7% decline in the prior year when we
rationalised unprofitable volume by removing certain SKUs. Volume growth in the period was driven by Sparkling beverages growing by 7%, boosted by good results particularly in the organised trade.
Still beverages posted a 7% increase driven by Water performance with both plain and flavoured water increasing. Package mix deteriorated by 1.1 percentage points in the year, driven by the strong
performance of Sparkling multi-serve packages in the discounters channel.
� Volume in Hungary increased by 8% in the year, cycling a 1% decline in the prior year, posting growth
across all key categories. Sparkling beverages increased by 8%, with positive performance across the board. Notably Coca-Cola Zero grew by 30%. Water grew by 12% driven by marketing activations in
the fragmented trade. Energy volumes were up 37%, continuing their double-digit growth and
reflecting the solid performance of our new product and flavour launches. Juice volumes increased by 3%, helped by the growth of Cappy. Our focus on increasing single-serve contribution delivered
results, with package mix improving by 1.7 percentage points in the year, driven by the sparkling beverages category.
� Czech Republic volume grew by 4% in the year, with good performance across all key categories. This
performance is a testament to the success of our strategic decision to focus on value-accretive
volume and healthy growth. Water was the main driver of this performance with significant support from Sparkling which increased by 2% helped by the strong performance of Fanta in the organised
trade. Juice also grew strongly, posting a 14% increase. Good growth of single-serve packages in the Sparkling category led to a 0.2 percentage points improvement in the package mix.
� Developing markets posted a €40.7 million increase in comparable operating profit to €98.6 million in
the year. Favourable input costs and improved volume more than offset the impact of adverse
channel mix as well as increased marketing and promotional activity. Comparable operating margin for the segment recorded a significant improvement, up 350 basis points. Reported operating profit
improved by €35.4 million compared to the prior year, reaching €87.4 million.
Results for the year ended 31 December 2015 19 February 2016
Page 8 of 34
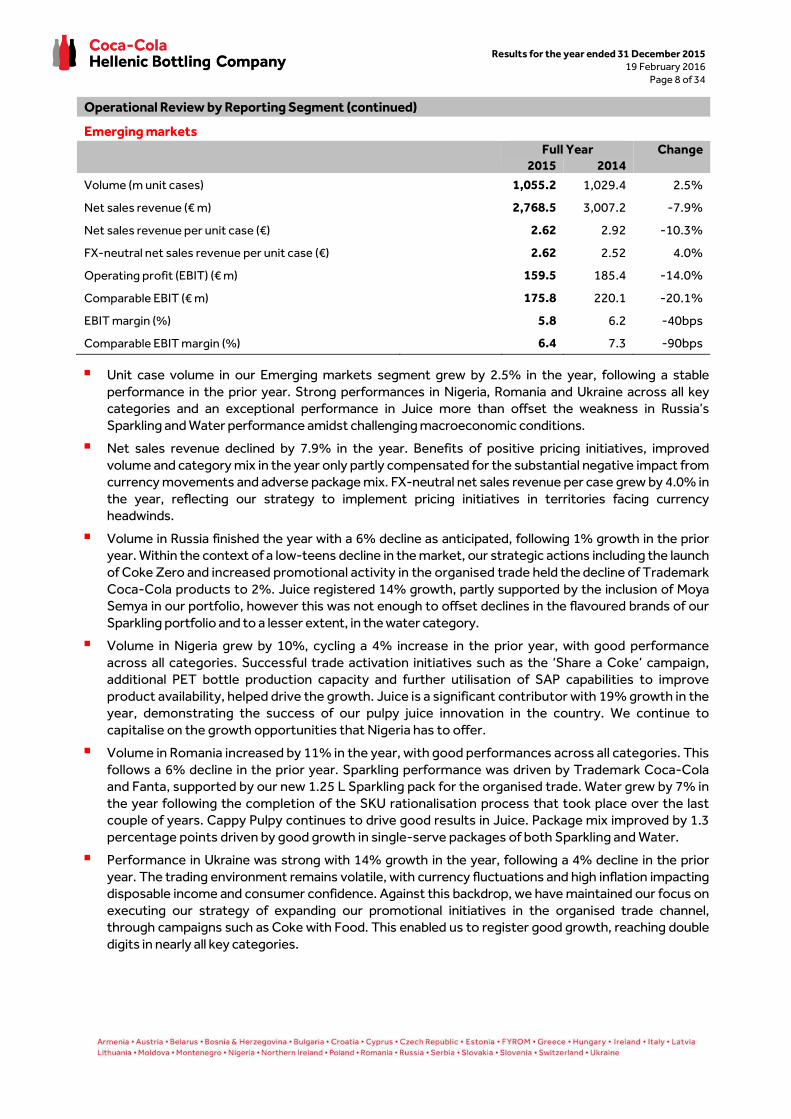
Operational Review by Reporting Segment (continued)
Emerging markets
Full Year Change
2015 2014
Volume (m unit cases) 1,055.2 1,029.4 2.5%
Net sales revenue (€ m) 2,768.5 3,007.2 -7.9%
Net sales revenue per unit case (€) 2.62 2.92 -10.3%
FX-neutral net sales revenue per unit case (€) 2.62 2.52 4.0%
Operating profit (EBIT) (€ m) 159.5 185.4 -14.0%
Comparable EBIT (€ m) 175.8 220.1 -20.1%
EBIT margin (%) 5.8 6.2 -40bps
Comparable EBIT margin (%) 6.4 7.3 -90bps
� Unit case volume in our Emerging markets segment grew by 2.5% in the year, following a stable
performance in the prior year. Strong performances in Nigeria, Romania and Ukraine across all key categories and an exceptional performance in Juice more than offset the weakness in Russia’s
Sparkling and Water performance amidst challenging macroeconomic conditions.
� Net sales revenue declined by 7.9% in the year. Benefits of positive pricing initiatives, improved
volume and category mix in the year only partly compensated for the substantial negative impact from currency movements and adverse package mix. FX-neutral net sales revenue per case grew by 4.0% in
the year, reflecting our strategy to implement pricing initiatives in territories facing currency headwinds.
� Volume in Russia finished the year with a 6% decline as anticipated, following 1% growth in the prior year. Within the context of a low-teens decline in the market, our strategic actions including the launch
of Coke Zero and increased promotional activity in the organised trade held the decline of Trademark
Coca-Cola products to 2%. Juice registered 14% growth, partly supported by the inclusion of Moya Semya in our portfolio, however this was not enough to offset declines in the flavoured brands of our
Sparkling portfolio and to a lesser extent, in the water category.
� Volume in Nigeria grew by 10%, cycling a 4% increase in the prior year, with good performance
across all categories. Successful trade activation initiatives such as the ‘Share a Coke’ campaign, additional PET bottle production capacity and further utilisation of SAP capabilities to improve
product availability, helped drive the growth. Juice is a significant contributor with 19% growth in the year, demonstrating the success of our pulpy juice innovation in the country. We continue to
capitalise on the growth opportunities that Nigeria has to offer.
� Volume in Romania increased by 11% in the year, with good performances across all categories. This
follows a 6% decline in the prior year. Sparkling performance was driven by Trademark Coca-Cola and Fanta, supported by our new 1.25 L Sparkling pack for the organised trade. Water grew by 7% in
the year following the completion of the SKU rationalisation process that took place over the last couple of years. Cappy Pulpy continues to drive good results in Juice. Package mix improved by 1.3
percentage points driven by good growth in single-serve packages of both Sparkling and Water.
� Performance in Ukraine was strong with 14% growth in the year, following a 4% decline in the prior
year. The trading environment remains volatile, with currency fluctuations and high inflation impacting disposable income and consumer confidence. Against this backdrop, we have maintained our focus on
executing our strategy of expanding our promotional initiatives in the organised trade channel, through campaigns such as Coke with Food. This enabled us to register good growth, reaching double
digits in nearly all key categories.

Results for the year ended 31 December 2015 19 February 2016
Page 9 of 34
Operational Review by Reporting Segment (continued)
Emerging markets
� Our Emerging markets segment posted a €44.3 million decline in comparable operating profit to €175.8 million, leading to a 90 basis point deterioration in the segment’s comparable operating margin
to 6.4%. Higher currency-driven pricing and revenue growth management initiatives, improved volume and favorable input costs only partly offset the significant currency headwinds and higher
operating and overhead costs. On a reported basis, operating profit declined by 14% compared to prior year to €159.5 million.

Results for the year ended 31 December 2015 19 February 2016
Page 10 of 34
Business Outlook
The outlook for 2016 is characterised by increased volatility. In the Euro area, growth prospects are revised upwards, reflecting the expected benefits from the oil and commodity price developments and
the accommodating monetary conditions. However in contrast, growth estimates are revised downwards in the countries exporting these commodities.
In our territory, we face mixed prospects. On the one hand, we expect a reversal from deflation to inflation, and improvements in unemployment levels and private consumption in many of our markets
benefitting from the low oil prices. On the other hand, oil exporting countries such as Russia and Nigeria continue to face ongoing challenges in an otherwise buoyant emerging markets landscape.
The commercial initatives that we put in place in 2015 proved to be effective, leading to good volume growth in all three segments. We are determined to build further on this success and plan similar
initiatives in 2016. Looking forward, we expect to maintain volume growth in all three market segments.
One of our key areas of focus in 2016 is revenue growth management. We have planned pricing actions in markets impacted by foreign currency depreciation and markets where deflationary pressures are
abating. In addition, we will continue with our OBPPC initiatives to achieve better value for every case we sell. We expect substantial improvements in FX-neutral net sales revenue per case in the full year for all
three segments.
The recent volatility of the Russian Rouble and the risk of a Nigerian Naira devaluation make it difficult to
estimate the potential impact of currencies on our business. Taking into account our hedged positions and current spot rates, we expect an adverse impact on EBIT from foreign currency to amount to €135
million for the full year.
World and EU sugar prices have started rising from their lows in 2015 and PET resin prices, which are
correlated with oil prices, are expected to further decrease if the current levels of oil price persist in the remainder of the year. Given that we entered into contracts, which cover all of our EU sugar and the
majority of our World sugar needs for 2016, and based on current oil spot prices, we are confident that we can limit the increase in our overall input costs per case to low single digits on an FX-neutral basis.
Our efforts to gain further efficiencies in our operating cost base continue. Aided by anticipated growth in our revenue, we expect to deliver a significant reduction in operating expenses as a percentage of net
sales revenue in the year.
Overall our focus for 2016 is to build on this year’s good performance with another year of volume and
revenue growth along with margin expansion. We have strong plans and our track record gives us
confidence that we can take appropriate action in countries where we face challenging market conditions. Our efficiency programmes have, over several years, created a strong platform. As many of
our European markets slowly improve, we expect to capitalise on this platform.
Technical guidance
Our initiatives to further improve operational efficiencies remain unchanged. For 2016, we have identified restructuring initiatives of approximately €35 million. We expect these initiatives to yield €25
million in annualised benefits from 2017 onwards, while the initiatives already taken in 2015 and those
that we will take in 2016 are expected to yield €22 million of total benefits in 2016.
Considering the dynamics of the evolving mix of profitability in our country portfolio, we expect our
comparable effective tax rate to be in a range between 24% and 26%.
Annual capital expenditure over the medium term is expected to range between 5.5% and 6.5% of net
sales revenue, although in 2016, we expect this ratio to materialise at the lower end of this range as a result of the significant volatility in some of our Emerging markets.
Results for the year ended 31 December 2015 19 February 2016
Page 11 of 34
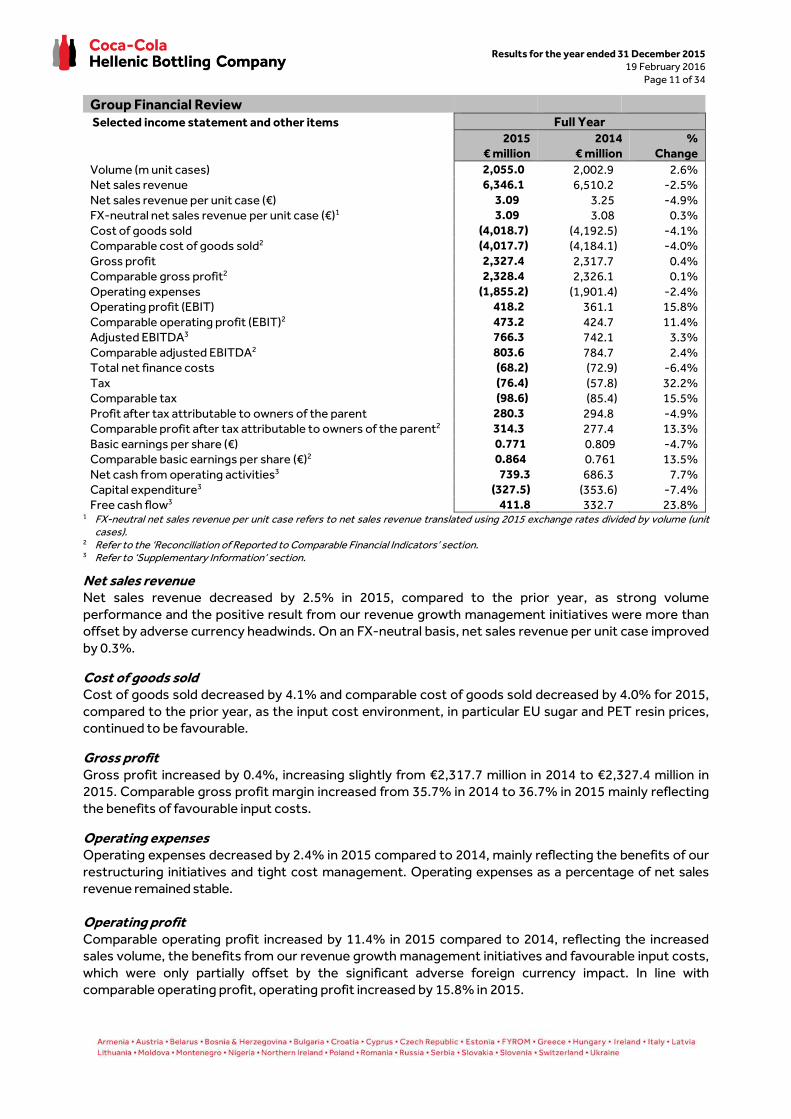
Group Financial Review Selected income statement and other items Full Year
2015
€ million 2014
€ million %
Change
Volume (m unit cases) 2,055.0 2,002.9 2.6% Net sales revenue 6,346.1 6,510.2 -2.5%
Net sales revenue per unit case (€) 3.09 3.25 -4.9% FX-neutral net sales revenue per unit case (€)1 3.09 3.08 0.3%
Cost of goods sold (4,018.7) (4,192.5) -4.1% Comparable cost of goods sold2 (4,017.7) (4,184.1) -4.0%
Gross profit 2,327.4 2,317.7 0.4%
Comparable gross profit2 2,328.4 2,326.1 0.1%
Operating expenses (1,855.2) (1,901.4) -2.4% Operating profit (EBIT) 418.2 361.1 15.8%
Comparable operating profit (EBIT)2 473.2 424.7 11.4%
Adjusted EBITDA3 766.3 742.1 3.3%
Comparable adjusted EBITDA2 803.6 784.7 2.4%
Total net finance costs (68.2) (72.9) -6.4%
Tax (76.4) (57.8) 32.2%
Comparable tax (98.6) (85.4) 15.5%
Profit after tax attributable to owners of the parent 280.3 294.8 -4.9% Comparable profit after tax attributable to owners of the parent2 314.3 277.4 13.3%
Basic earnings per share (€) 0.771 0.809 -4.7% Comparable basic earnings per share (€)2 0.864 0.761 13.5%
Net cash from operating activities3 739.3 686.3 7.7% Capital expenditure3 (327.5) (353.6) -7.4% Free cash flow3 411.8 332.7 23.8%
1 FX-neutral net sales revenue per unit case refers to net sales revenue translated using 2015 exchange rates divided by volume (unit cases).
2 Refer to the ‘Reconciliation of Reported to Comparable Financial Indicators’ section. 3 Refer to ‘Supplementary Information’ section.
Net sales revenue Net sales revenue decreased by 2.5% in 2015, compared to the prior year, as strong volume
performance and the positive result from our revenue growth management initiatives were more than offset by adverse currency headwinds. On an FX-neutral basis, net sales revenue per unit case improved
by 0.3%.
Cost of goods sold Cost of goods sold decreased by 4.1% and comparable cost of goods sold decreased by 4.0% for 2015,
compared to the prior year, as the input cost environment, in particular EU sugar and PET resin prices, continued to be favourable.
Gross profit Gross profit increased by 0.4%, increasing slightly from €2,317.7 million in 2014 to €2,327.4 million in 2015. Comparable gross profit margin increased from 35.7% in 2014 to 36.7% in 2015 mainly reflecting
the benefits of favourable input costs.
Operating expenses Operating expenses decreased by 2.4% in 2015 compared to 2014, mainly reflecting the benefits of our
restructuring initiatives and tight cost management. Operating expenses as a percentage of net sales revenue remained stable.
Operating profit Comparable operating profit increased by 11.4% in 2015 compared to 2014, reflecting the increased sales volume, the benefits from our revenue growth management initiatives and favourable input costs,
which were only partially offset by the significant adverse foreign currency impact. In line with comparable operating profit, operating profit increased by 15.8% in 2015.

Results for the year ended 31 December 2015 19 February 2016
Page 12 of 34
Group Financial Review (continued)
Total net finance costs Total net finance costs decreased by €4.7 million in 2015, compared to 2014 mainly due to the cessation of hyperinflation accounting in Belarus and lower net foreign exchange losses.
Tax On a comparable basis, Coca-Cola HBC’s effective tax rate was approximately 24% for 2015 compared to 23% for 2014. On a reported basis, the Group’s effective tax rate was approximately 21% for 2015
and 16% for 2014. Coca-Cola HBC’s effective tax rate varies depending on the mix of taxable profits by territory, the non-deductibility of certain expenses, non-taxable income and other one-off tax items
across its territories. In 2014 the reported effective tax rate was impacted by the net impact of the gain
from the sale of equity method investments.
Profit after tax attributable to owners of the parent On a comparable basis, profit after tax attributed to owners of the parent increased by 13.3% in 2015 compared to 2014, mainly driven by higher operating profitability.
Net cash from operating activities and capital expenditure Net cash from operating activities increased by 7.7% in 2015 compared to 2014, reflecting increased operating profitability and the improvement in working capital.
Capital expenditure, net of receipts from the disposal of assets and including principal repayments of finance lease obligations, decreased by 7.4% in the year. In 2015, capital expenditure amounted to
€327.5 million of which 55% was related to investment in production equipment and facilities and 24% to the acquisition of marketing equipment. In 2014, capital expenditure amounted to €353.6 million of
which 51% was related to investment in production equipment and facilities and 25% to the acquisition of marketing equipment.
In 2015, free cash flow grew by €79.1 million to €411.8 million, reflecting increased cash from operating
activities and lower capital expenditure.

Results for the year ended 31 December 2015 19 February 2016
Page 13 of 34
The financial measures Adjusted EBITDA, Capital Expenditure and Free Cash Flow consist of the following reported amounts in the condensed consolidated financial statements:
Full Year
2015
€ million 2014
€ million
Profit after tax 280.7 294.2
Tax charged to the income statement 76.4 57.8
Total finance costs, net 68.2 72.9
Share of results of equity method investments (7.1) (63.8)
Operating profit (EBIT) 418.2 361.1
Depreciation and impairment of property, plant and equipment 340.2 368.8
Amortisation of intangible assets 0.4 0.4
Employee share options and performance shares 8.8 12.1
Other non-cash items (1.3) (0.3)
Adjusted EBITDA 766.3 742.1
Losses / (gains) on disposal of non-current assets 1.8 (1.8)
Decrease in working capital 43.9 15.0
Tax paid (72.7) (69.0)
Net cash from operating activities 739.3 686.3
Payments for purchases of property, plant and equipment (331.5) (362.6)
Principal repayments of finance lease obligations (13.8) (14.0)
Proceeds from sale of property, plant and equipment 17.8 23.0
Capital expenditure (327.5) (353.6)
Net cash from operating activities 739.3 686.3 Capital expenditure (327.5) (353.6)
Free cash flow 411.8 332.7
The volume, net sales revenue and net sales revenues per unit case on a reported and FX-neutral base, are provided for NARTD and premium spirits, as set out below:
Full Year %
NARTD 2015 2014 Change
Volume (m unit cases) (1) 2,052.6 2,000.3 2.6% Net sales revenue (€ m) 6,164.3 6,311.3 -2.3%
Net sales revenue per Unit Case (€) 3.00 3.16 -5.1%
FX-neutral net sales revenue per unit case (€) 3.00 3.00 -
Full Year %
Premium Spirits 2015 2014 Change
Volume (m unit cases)(1) 2.396 2.553 -6.1% Net sales revenues (€ m) 181.8 198.9 -8.6% Net sales revenue per unit case (€) 75.9 77.9 -2.6%
FX-neutral net sales revenue per unit case (€) 75.9 67.6 12.3%
Full Year %
Total 2015 2014 Change
Volume (m unit cases)(1) 2,055.0 2,002.9 2.6%
Net sales revenue (€ m) 6,346.1 6,510.2 -2.5%
Net sales revenue per unit case (€) 3.09 3.25 -4.9%
FX-neutral net sales revenue per unit case (€) 3.09 3.08 0.3% (1) For NARTD volume, one unit case corresponds to approximately 5.678 litres or 24 servings, being a typically used measure of volume. For premium spirits
volume, one unit case also corresponds to 5.678 litres.
Supplementary Information

Results for the year ended 31 December 2015 19 February 2016
Page 14 of 34
Coca-Cola HBC Group
Coca-Cola HBC is a leading bottler of The Coca-Cola Company with a sales volume of more than 2 billion unit cases. It has a broad geographic footprint with operations in 28 countries serving a population of
approximately 590 million people. Coca-Cola HBC offers a diverse range of non-alcoholic ready to drink beverages in the sparkling, juice, water, sport, energy, tea and coffee categories. Coca-Cola HBC is
committed to promoting sustainable development in order to create value for its business and for society. This includes providing products that meet the beverage needs of consumers, fostering an
open and inclusive work environment, conducting its business in ways that protect and preserve the environment and contribute to the socio-economic development of the local communities.
Coca-Cola HBC has a premium listing on the London Stock Exchange (LSE: CCH) and its shares are listed
on the Athens Exchange (ATHEX: EEE). Coca-Cola HBC is included in the Dow Jones Sustainability and FTSE4Good Indexes. For more information, please visit http://www.coca-colahellenic.com.
Financial information in this announcement is presented on the basis of
International Financial Reporting Standards (“IFRS”).
Conference call
Coca-Cola HBC will host a conference call for financial analysts and investors to discuss the 2015 full-year financial results on 19 February 2016 at 10:00 am Swiss time (9:00 am London, 11:00 am Athens,
and 4:00 am New York time). Interested parties can access the live, audio webcast of the call through Coca-Cola HBC’s website (www.coca-colahellenic.com/investorrelations/webcasts).
Enquiries
Coca-Cola HBC Group
Basak Kotler
Investor Relations Director Tel: +41 41 726 0143
email: [email protected]
Nikos Efstathopoulos Investor Relations Manager
Tel: +30 210 618 3260 email: [email protected]
International media contact:
Teneo
Rob Morgan
Ben Ullmann Anushka Mathew
Tel: +44 20 7240 2486 [email protected]
[email protected] [email protected]
Greek media contact:
V+O Communications
Argyro Oikonomou Tel: +30 211 7501219
email: [email protected]
Results for the year ended 31 December 2015 19 February 2016
Page 15 of 34
Condensed consolidated financial statements for the six months and the
year ended 31 December 2015

Results for the year ended 31 December 2015 19 February 2016
Page 16 of 34
Condensed consolidated balance sheet (unaudited)
Note
As at
31 December 2015
€ million
As at
31 December 2014
€ million
Assets
Intangible assets 4 1,911.6 1,884.8
Property, plant and equipment 4 2,545.5 2,624.1
Other non-current assets 208.1 308.0
Total non-current assets 4,665.2 4,816.9
Inventories 435.8 414.2
Trade and other receivables 939.3 1,010.6
Cash and cash equivalents 5 487.4 636.3
1,862.5 2,061.1
Assets classified as held for sale 5.5 1.0
Total current assets 1,868.0 2,062.1
Total assets 6,533.2 6,879.0
Liabilities
Short-term borrowings 5 781.5 548.6
Other current liabilities 1,709.4 1,647.3
Total current liabilities 2,490.9 2,195.9
Long-term borrowings 5 923.0 1,556.3
Other non-current liabilities 295.2 335.7
Total non-current liabilities 1,218.2 1,892.0
Total liabilities 3,709.1 4,087.9
Equity
Owners of the parent 2,819.8 2,787.0
Non-controlling interests 4.3 4.1
Total equity 2,824.1 2,791.1
Total equity and liabilities 6,533.2 6,879.0
The accompanying notes form an integral part of these condensed consolidated financial statements
Results for the year ended 31 December 2015 19 February 2016
Page 17 of 34
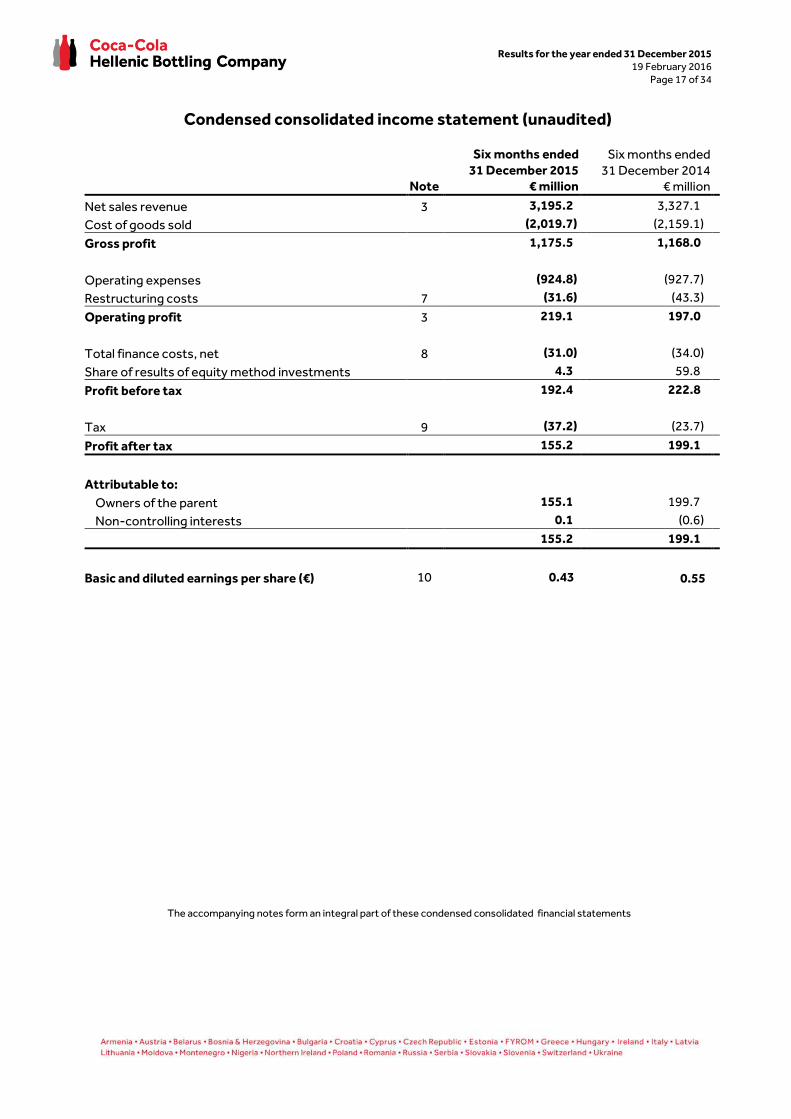
Condensed consolidated income statement (unaudited)
Note
Six months ended
31 December 2015
€ million
Six months ended
31 December 2014
€ million
Net sales revenue 3 3,195.2 3,327.1
Cost of goods sold (2,019.7) (2,159.1)
Gross profit 1,175.5 1,168.0
Operating expenses (924.8) (927.7)
Restructuring costs 7 (31.6) (43.3)
Operating profit 3 219.1 197.0
Total finance costs, net 8 (31.0) (34.0)
Share of results of equity method investments 4.3 59.8
Profit before tax 192.4 222.8
Tax 9 (37.2) (23.7)
Profit after tax 155.2 199.1
Attributable to:
Owners of the parent 155.1 199.7
Non-controlling interests 0.1 (0.6)
155.2 199.1
Basic and diluted earnings per share (€) 10 0.43 0.55
The accompanying notes form an integral part of these condensed consolidated financial statements

Results for the year ended 31 December 2015 19 February 2016
Page 18 of 34
Condensed consolidated statement of comprehensive income (unaudited)
Six months ended
31 December 2015
€ million
Six months ended
31 December 2014
€ million
Profit after tax for the period 155.2 199.1
Other comprehensive income:
Items that may be subsequently reclassified to income
statement:
Valuation gain / (loss) on available-for-sale assets 0.2 (0.7)
Cash flow hedges:
Net (losses)/gains during the period (2.2) 12.1
Net losses reclassified to
profit and loss for the period 1.4 3.6
Transfers to inventory for the period (7.4) (8.2) (4.2) 11.5
Foreign currency translation (178.3) (275.7)
Share of other comprehensive income of
equity method investments (1.1) (0.1)
Income tax relating to items that may be subsequently
reclassified to income statement (1.6) (7.8)
(189.0) (272.8)
Items that will not be subsequently reclassified to income
statement:
Actuarial gains / (losses) 6.0 (16.7)
Income tax relating to items that will not be subsequently
reclassified to income statement (2.5) 2.3
3.5 (14.4)
Other comprehensive income for the period, net of tax (185.5) (287.2)
Total comprehensive income for the period (30.3) (88.1)
Total comprehensive income attributable to:
Owners of the parent (30.4) (87.5)
Non-controlling interests 0.1 (0.6)
(30.3) (88.1)
The accompanying notes form an integral part of these condensed consolidated financial statements
Results for the year ended 31 December 2015 19 February 2016
Page 19 of 34
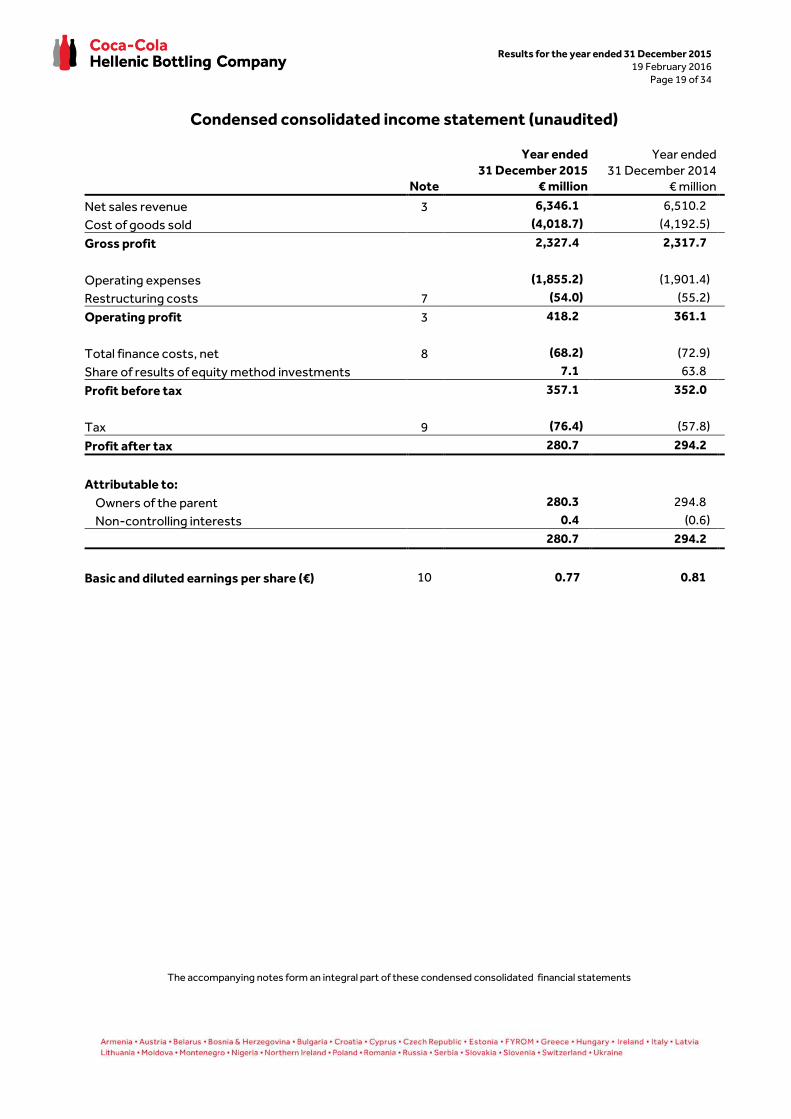
Condensed consolidated income statement (unaudited)
Note
Year ended
31 December 2015
€ million
Year ended
31 December 2014
€ million
Net sales revenue 3 6,346.1 6,510.2
Cost of goods sold (4,018.7) (4,192.5)
Gross profit 2,327.4 2,317.7
Operating expenses (1,855.2) (1,901.4)
Restructuring costs 7 (54.0) (55.2)
Operating profit 3 418.2 361.1
Total finance costs, net 8 (68.2) (72.9)
Share of results of equity method investments 7.1 63.8
Profit before tax 357.1 352.0
Tax 9 (76.4) (57.8)
Profit after tax 280.7 294.2
Attributable to:
Owners of the parent 280.3 294.8
Non-controlling interests 0.4 (0.6)
280.7 294.2
Basic and diluted earnings per share (€) 10 0.77 0.81
The accompanying notes form an integral part of these condensed consolidated financial statements

Results for the year ended 31 December 2015 19 February 2016
Page 20 of 34
Condensed consolidated statement of comprehensive income (unaudited)
Year ended
31 December 2015
€ million
Year ended
31 December 2014
€ million
Profit after tax for the year 280.7 294.2
Other comprehensive income:
Items that may be subsequently reclassified to income
statement:
Valuation gain / (loss) on available-for-sale assets 0.1 (0.6)
Cash flow hedges:
Net (losses)/gains during the year (5.2) 5.4
Net losses reclassified to
profit and loss for the year 4.6 7.4
Transfers to inventory for the year (19.7) (20.3) (6.4) 6.4
Foreign currency translation (65.8) (322.0)
Share of other comprehensive income of
equity method investments (0.2) -
Income tax relating to items that may be subsequently
reclassified to income statement 5.5 (6.6)
(80.7) (322.8)
Items that will not be subsequently reclassified to income
statement:
Actuarial gains / (losses) 11.1 (38.7)
Income tax relating to items that will not be subsequently
reclassified to income statement (2.9) 6.6
8.2 (32.1)
Other comprehensive income for the year, net of tax (72.5) (354.9)
Total comprehensive income for the year 208.2 (60.7)
Total comprehensive income attributable to:
Owners of the parent 207.8 (60.1)
Non-controlling interests 0.4 (0.6)
208.2 (60.7)
The accompanying notes form an integral part of these condensed consolidated financial statements

Results for the year ended 31 December 2015 19 February 2016
Page 21 of 34
Condensed consolidated statement of changes in equity (unaudited)
Attributable to owners of the parent
Share capital
€ million
Share Premium
€ million
Group
Reorganization reserve
€ million
Treasury shares
€ million
Exchange
equalisation reserve
€ million
Other reserves
€ million
Retained earnings
€ million
Total
€ million
Non-
controlling interests
€ million
Total equity
€ million
Balance as at 1 January 2014 1,997.4 5,287.1 (6,472.1) (70.7) (293.3) 388.7 2,125.1 2,962.2 5.1 2,967.3 Shares issued to employees
exercising stock options 0.7 0.7 - - - - - 1.4 - 1.4
Share-based compensation:
Options - - - - - 12.1 - 12.1 - 12.1 Movement in shares held for
equity compensation plan - - - - - (2.3) - (2.3) - (2.3)
Hyperinflation impact - - - - - - 3.2 3.2 - 3.2 Share of other changes in equity
of equity method investments - - - - - - (0.5) (0.5) - (0.5)
Appropriation / transfer of
reserves - - - - - (138.0) 138.0 - - -
Dividends (note 13) - (130.2) - - - - 1.2 (129.0) (0.4) (129.4)
1,998.1 5,157.6 (6,472.1) (70.7) (293.3) 260.5 2,267.0 2,847.1 4.7 2,851.8
Profit for the year net of tax - - - - - - 294.8 294.8 (0.6) 294.2
Other comprehensive income for the year, net of tax - - - - (322.0) (0.8) (32.1) (354.9) - (354.9)
Total comprehensive income for
the year, net of tax(1) - - - - (322.0) (0.8) 262.7 (60.1) (0.6) (60.7)
Balance as at 31 December 2014 1,998.1 5,157.6 (6,472.1) (70.7) (615.3) 259.7 2,529.7 2,787.0 4.1 2,791.1
(1) The amount included in the exchange equalisation reserve of €322.0 million loss for 2014 represents the exchange loss attributed to the owners of the parent.
The amount included in other reserves of €0.8 million loss for 2014 consists of loss on valuation of available-for-sale financial assets of €0.6 million, cash flow hedges gains of €6.4 million (of which €5.4 million represents revaluation gain for the year, €7.4 million represents revaluation loss reclassified to profit and loss for the year and €6.4 million represents revaluation gain reclassified to inventory for the year) and the deferred tax expense thereof amounting to €6.6 million.
The amount of €262.7 million gain comprises profit for the year of €294.8 million plus actuarial loss of €38.7 million less a deferred tax income of €6.6 million.
The amount of €0.6 million loss included in non-controlling interests for 2014 represents the share of non-controlling interests in retained earnings.
The accompanying notes form an integral part of these condensed consolidated financial statements

Results for the year ended 31 December 2015 19 February 2016
Page 22 of 34
Condensed consolidated statement of changes in equity (unaudited)
Attributable to owners of the parent
Share
Capital € million
Share
Premium € million
Group Reorganization
reserve € million
Treasury
shares € million
Exchange equalisation
reserve € million
Other
reserves € million
Retained
earnings € million
Total € million
Non- controlling
interests € million
Total
equity € million
Balance as at 1 January 2015 1,998.1 5,157.6 (6,472.1) (70.7) (615.3) 259.7 2,529.7 2,787.0 4.1 2,791.1 Shares issued to employees
exercising stock options 2.0 3.1 - - - - - 5.1 - 5.1
Share-based compensation:
Options and performance shares - - - - - 8.8 - 8.8 - 8.8 Movement in shares held for
equity compensation plan - - - (0.6) - 1.3 - 0.7 - 0.7
Acquisition of treasury shares (note 11)
- - - (58.5) - - - (58.5) - (58.5)
Appropriation of reserves - - - (2.2) - 5.2 (3.0) - - - Dividends (note 13) - (132.4) - - - - 1.3 (131.1) (0.2) (131.3)
2,000.1 5,028.3 (6,472.1) (132.0) (615.3) 275.0 2,528.0 2,612.0 3.9 2,615.9
Profit for the year net of tax - - - - - - 280.3 280.3 0.4 280.7 Other comprehensive income for
the year, net of tax - - - - (66.1) (14.6) 8.2 (72.5) - (72.5)
Total comprehensive income for the year net of tax(2)
- - - - (66.1) (14.6) 288.5 207.8 0.4 208.2
Balance as at 31 December 2015 2,000.1 5,028.3 (6,472.1) (132.0) (681.4) 260.4 2,816.5 2,819.8 4.3 2,824.1
(2) The amount included in the exchange equalisation reserve of €66.1 million loss for 2015 represents the exchange loss attributed to the owners of the parent.
The amount included in other reserves of €14.6 million loss for 2015 consists of gain on valuation of available-for-sale financial assets of €0.1 million, cash flow hedges losses of €20.3 million (of which €5.2 million represents revaluation loss for the year, €4.6 million represents revaluation loss reclassified to profit and loss for the year and €19.7 million represents revaluation gain reclassified to inventory for the year), €0.1 million gain relating to share of other comprehensive income of equity method investments and the deferred tax income thereof amounting to €5.5 million.
The amount of €288.5 million gain comprises profit for the year of €280.3 million plus actuarial gains of €11.1 million less a deferred tax expense of €2.9 million.
The amount of €0.4 million gain included in non-controlling interests for 2015 represents the share of non-controlling interests in retained earnings.
The accompanying notes form an integral part of these condensed consolidated financial statements

Results for the year ended 31 December 2015 19 February 2016
Page 23 of 34
The accompanying notes form an integral part of these condensed consolidated financial statements
Condensed consolidated cash flow statement (unaudited)
Note
Year ended
31 December 2015 € million
Year ended
31 December 2014 € million
Operating activities
Profit after tax for the year 280.7 294.2 Total finance costs, net 8 68.2 72.9 Share of results of equity method investments (7.1) (63.8) Tax charged to the income statement 76.4 57.8 Depreciation and impairment of property, plant and equipment 4 340.2 368.8 Employee share options and performance shares 8.8 12.1 Amortisation of intangible assets 4 0.4 0.4 Other non- cash items (1.3) (0.3)
766.3 742.1 Loss /(gain) on disposal of non-current assets 1.8 (1.8)
Increase in inventories (37.1) (38.0)
Increase in trade and other receivables (13.8) (53.9)
Increase in trade and other payables 94.8 106.9
Tax paid (72.7) (69.0)
Net cash from operating activities 739.3 686.3
Investing activities
Payments for purchases of property, plant and equipment (331.5) (362.6)
Payments for purchase of intangible assets 17 - (14.1)
Proceeds from sales of property, plant and equipment 17.8 23.0
Net receipts from investments 17 118.2 6.6
Interest received 9.5 10.0
Net cash used in investing activities (186.0) (337.1)
Financing activities
Proceeds from shares issued to employees exercising stock options 11 5.1 1.4
(Payments) / proceeds for shares held by non-controlling interests (1.2) 2.6
Share buy-back payments 11 (58.5) -
Dividends paid to owners of the parent (131.1) (129.0)
Dividends paid to non-controlling interests (0.2) (0.4)
Proceeds from borrowings 742.7 1,137.9
Repayments of borrowings (1,162.7) (1,347.2)
Principal repayments of finance lease obligations (13.8) (14.0)
Interest paid (69.5) (91.3)
Net cash used in financing activities (689.2) (440.0) Decrease in cash and cash equivalents (135.9) (90.8)
Movement in cash and cash equivalents
Cash and cash equivalents at 1 January 636.3 737.5
Decrease in cash and cash equivalents (135.9) (90.8)
Effect of changes in exchange rates (13.0) (11.4)
Hyperinflation impact on cash - 1.0
Cash and cash equivalents at the end of the year 487.4 636.3

Results for the year ended 31 December 2015 19 February 2016
Page 24 of 34
Selected explanatory notes to the condensed consolidated financial statements (unaudited)
1. Basis of preparation and accounting policies
Basis of preparation
These condensed consolidated financial statements are prepared in accordance with International Financial Reporting Standards ("IFRS") as issued by the International Accounting Standards Board ("IASB")
applicable to Interim Financial Reporting ("IAS 34"). These condensed consolidated financial statements should be read in conjunction with the 2014 annual financial statements, which include a full description of
the Group’s accounting policies.
Comparative figures have been reclassified and adjusted where necessary to conform with changes in
presentation in the current year according to IAS 1 presentation requirements. More specifically, an amount of €1.0 million included in ‘Trade and other receivables’ was reclassified from the 2014
comparatives and shown separately to ‘Assets classified as held for sale’ on the condensed consolidated balance sheet.
Accounting policies
The accounting policies used in the preparation of the condensed consolidated financial statements of Coca-Cola HBC AG (“Coca-Cola HBC”, the “Company” or the “Group”) are consistent with those used in
the annual financial statements for the year ended 31 December 2014, except for the amendments to the IFRSs effective as of 1 January 2015, but which do not have a material impact on the condensed
consolidated financial statements of the Group.
In January 2016, the IASB issued a new standard, IFRS 16 Leases; the Group is currently assessing the
effect that it will have on the consolidated financial statements of the Group.
Results for the year ended 31 December 2015 19 February 2016
Page 25 of 34
Selected explanatory notes to the condensed consolidated financial statements (unaudited)
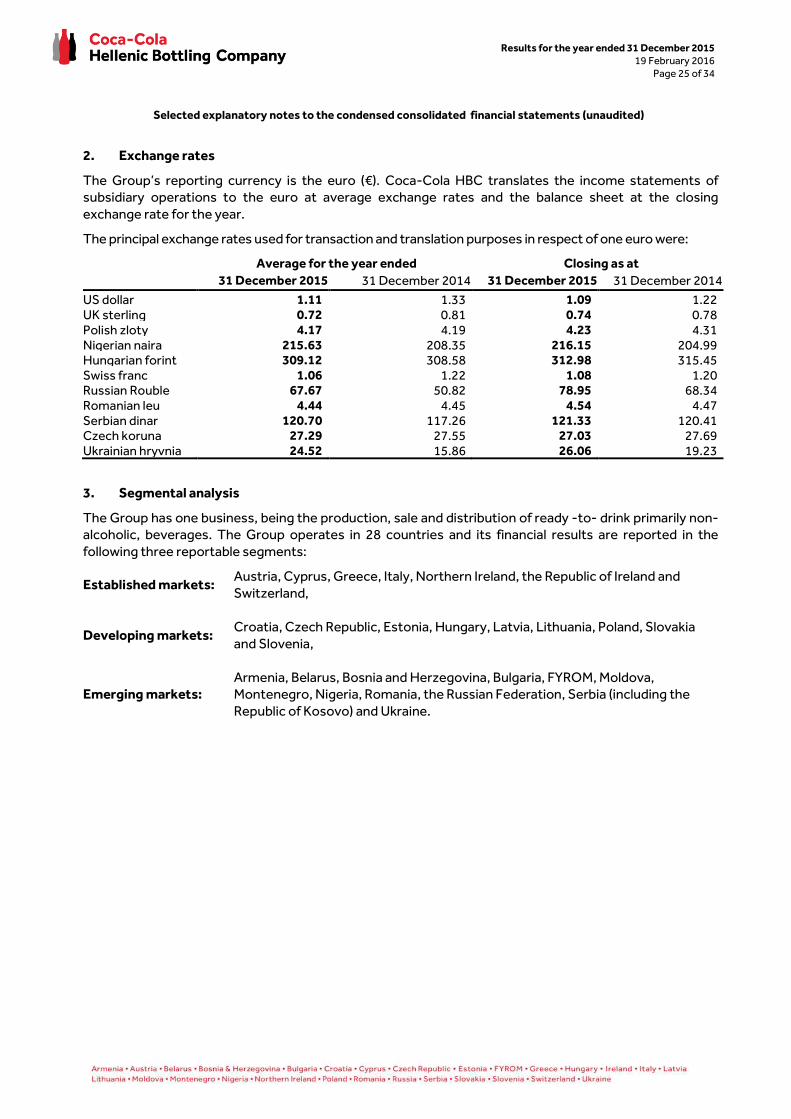
2. Exchange rates
The Group’s reporting currency is the euro (€). Coca-Cola HBC translates the income statements of subsidiary operations to the euro at average exchange rates and the balance sheet at the closing
exchange rate for the year.
The principal exchange rates used for transaction and translation purposes in respect of one euro were:
Average for the year ended Closing as at
31 December 2015 31 December 2014 31 December 2015 31 December 2014
US dollar 1.11 1.33 1.09 1.22 UK sterling 0.72 0.81 0.74 0.78 Polish zloty 4.17 4.19 4.23 4.31 Nigerian naira 215.63 208.35 216.15 204.99 Hungarian forint 309.12 308.58 312.98 315.45 Swiss franc 1.06 1.22 1.08 1.20 Russian Rouble 67.67 50.82 78.95 68.34 Romanian leu 4.44 4.45 4.54 4.47 Serbian dinar 120.70 117.26 121.33 120.41 Czech koruna 27.29 27.55 27.03 27.69 Ukrainian hryvnia 24.52 15.86 26.06 19.23
3. Segmental analysis
The Group has one business, being the production, sale and distribution of ready -to- drink primarily non-alcoholic, beverages. The Group operates in 28 countries and its financial results are reported in the
following three reportable segments:
Established markets: Austria, Cyprus, Greece, Italy, Northern Ireland, the Republic of Ireland and
Switzerland,
Developing markets: Croatia, Czech Republic, Estonia, Hungary, Latvia, Lithuania, Poland, Slovakia
and Slovenia,
Emerging markets: Armenia, Belarus, Bosnia and Herzegovina, Bulgaria, FYROM, Moldova, Montenegro, Nigeria, Romania, the Russian Federation, Serbia (including the
Republic of Kosovo) and Ukraine.

Results for the year ended 31 December 2015 19 February 2016
Page 26 of 34
Selected explanatory notes to the condensed consolidated financial statements (unaudited)
Information on the Group’s segments is as follows:
Six months ended Year ended
31 December
2015
31 December
2014
31 December
2015
31 December
2014
Volume in unit cases(1) (million)
Established countries 315.8 309.3 621.1 615.2
Developing countries 197.9 188.0 378.7 358.3
Emerging countries 534.7 535.4 1,055.2 1,029.4
Total volume 1,048.4 1,032.7 2,055.0 2,002.9
Net sales revenue (€ million)
Established countries 1,248.6 1,220.9 2,485.6 2,448.9
Developing countries 563.4 549.4 1,092.0 1,054.1
Emerging countries 1,383.2 1,556.8 2,768.5 3,007.2
Total net sales revenue 3,195.2 3,327.1 6,346.1 6,510.2
Operating profit (€ million)
Established countries 98.1 64.8 171.3 123.7
Developing countries 43.5 29.2 87.4 52.0
Emerging countries 77.5 103.0 159.5 185.4
Total operating profit 219.1 197.0 418.2 361.1
Reconciling items (€ million)
Finance costs, net (31.0) (34.0) (68.2) (72.9)
Tax (37.2) (23.7) (76.4) (57.8)
Share of results of equity method investments 4.3 59.8 7.1 63.8
Non-controlling interests (0.1) 0.6 (0.4) 0.6
Profit after tax attributable to owners of the
parent 155.1 199.7 280.3 294.8
Additional information by product type:
Six months ended Year ended
31 December
2015 31 December
2014 31 December
2015 31 December
2014
Volume in unit cases(1) (million)
NARTD(2) 1,047.0 1,031.1 2,052.6 2,000.3
Premium spirits 1.4 1.6 2.4 2.6
Total volume 1,048.4 1,032.7 2,055.0 2,002.9
Net sales revenue (€ million)
NARTD(2) 3,087.8 3,204.4 6,164.3 6,311.3
Premium spirits 107.4 122.7 181.8 198.9
Total net sales revenue 3,195.2 3,327.1 6,346.1 6,510.2 (1) For NARTD volume, one unit case corresponds to approximately 5.678 litres or 24 servings, being a typically used measure of volume. For premium spirits volume, one unit case corresponds also to 5.678 litres. Volume data is derived from unaudited operational data. (2) Non alcoholic, ready-to-drink beverages.

Results for the year ended 31 December 2015 19 February 2016
Page 27 of 34
Selected explanatory notes to the condensed consolidated financial statements (unaudited)
4. Tangible and intangible assets
Property, plant
and equipment € million
Intangible assets € million
Opening net book value as at 1 January 2015 2,624.1 1,884.8
Additions 367.4 -
Reclassified from assets held for sale 0.9 -
Reclassified to assets held for sale (5.4) -
Disposals (15.0) -
Depreciation, impairment and amortisation (340.2) (0.4)
Foreign exchange differences (86.3) 27.2
Closing net book value as at 31 December 2015 2,545.5 1,911.6
5. Net debt As at
31 December 2015
€ million 31 December 2014
€ million
Long-term borrowings 923.0 1,556.3
Short-term borrowings 781.5 548.6
Cash and cash equivalents (487.4) (636.3)
Net debt 1,217.1 1,468.6
During November 2015 the outstanding bond of €600 million maturing in November 2016 was reclassified from long term borrowings to short term borrowings. In addition, the bond of $400 million issued in 2003,
which was fully hedged by cross currency swap contracts and which matured in September 2015, was repaid using the available cash balance.
6. Financial risk management and financial instruments
The Group’s activities expose it to a variety of financial risks: market risk (including currency risk, interest rate risk, and commodity price risk), credit risk, liquidity risk and capital risk. There have been no changes
in the risk management policies since 31 December 2014.
The Group’s financial instruments recorded at fair value are included in Level 2 within the fair value
hierarchy. The financial instruments include derivatives for which there have been no changes in valuation techniques and inputs used to determine their fair value since 31 December 2014. As at 31 December
2015, the total derivatives included in Level 2 were financial assets of €17.3 million and financial liabilities of €55.4 million.
During 2015 the Group recognized embedded derivatives whose risks and economic characteristics were not considered to be closely related to the commodity contract in which they were embedded. The
valuation techniques used to determine their fair value maximized the use of observable market data. The fair value of the embedded derivatives as at 31 December 2015 amounted to a financial asset of €6.2
million and are classified within Level 2.
There were no transfers between Level 1, 2 and 3 during 2015. The fair value of bonds and notes payable as at 31 December 2015, including the current portion, is €1,465.8 million, compared to their book value of
€1,394.7 million, including the current portion.

Results for the year ended 31 December 2015 19 February 2016
Page 28 of 34
Selected explanatory notes to the condensed consolidated financial statements (unaudited)
7. Restructuring costs
Restructuring costs amounted to €31.6 million before tax for the six months ended 31 December 2015.
The Group recorded €13.7 million, €8.2 million and €9.7 million of restructuring charges in its established, developing and emerging countries respectively. For the six months ended 31 December 2014,
restructuring costs amounted to €43.3 million. The Group recorded €19.8 million, €6.2 million and €17.3 million of restructuring charges in its established, developing and emerging countries respectively. The
restructuring costs mainly concern redundancy costs and impairment of property, plant and equipment.
Restructuring costs amounted to €54.0 million before tax for the year 2015. The Group recorded €23.9
million, €9.0 million and €21.1 million of restructuring charges in its established, developing and emerging countries respectively. For the year 2014, restructuring costs amounted to €55.2 million. The Group
recorded €25.6 million, €7.3 million and €22.3 million of restructuring charges in its established, developing and emerging countries respectively. The restructuring costs mainly concern redundancy
costs and impairment of property, plant and equipment.
8. Total finance costs, net
Six months ended
31 December 2015 € million
31 December 2014 € million
Interest income (4.5) (5.3)
Finance costs 33.4 35.2
Net foreign exchange losses 2.1 4.2
Gain on net monetary position - (0.1)
Total finance costs, net 31.0 34.0
Year ended
31 December 2015 € million
31 December 2014 € million
Interest income (9.5) (10.0)
Finance costs 70.2 69.6
Net foreign exchange losses 7.5 10.9
Loss on net monetary position - 2.4
Total finance costs, net 68.2 72.9
Hyperinflation
Belarus was considered to be a hyperinflationary economy from the fourth quarter of 2011 and up until 31
December 2014. During this period hyperinflation accounting was applied in accordance with IAS 29. However, since 1 January 2015 hyperinflation accounting has been discontinued, as Belarus ceased to
meet the criteria of a hyperinflationary economy as defined by IAS 29. All amounts expressed in the measuring unit at 31 December 2014 were treated as the basis for the carrying amounts as at 1 January
2015.

Results for the year ended 31 December 2015 19 February 2016
Page 29 of 34
Selected explanatory notes to the condensed consolidated financial statements (unaudited)
9. Tax
The Group’s effective tax rate for 2015 may differ from the theoretical amount that would arise using the weighted average tax rate applicable to profits of the consolidated entities, as a consequence of a number
of factors, the most significant of which are the application of statutory tax rates of the countries in which
the Group operates, the non-deductibility of certain expenses, the non-taxable income and one off tax items.
10. Earnings per share
Basic earnings per share is calculated by dividing the net profit attributable to the owners of the parent by the weighted average number of shares outstanding during the period (full year of 2015: 363,727,764, full
year of 2014: 364,304,795, six months ended 31 December 2015: 363,061,665, six months ended 31 December 2014: 364,331,278). Diluted earnings per share is calculated by adjusting the weighted average
number of ordinary shares outstanding to assume conversion of all dilutive ordinary shares arising from exercising employee stock options.
11. Share capital
In 2014, the share capital of Coca-Cola HBC increased by the issue of 129,022 new ordinary shares following the exercise of stock options pursuant to the Coca-Cola HBC AG’s employees’ stock option
plan. Total proceeds from the issuance of the shares under the stock option plan amounted to €1.4 million.
Ιn 2015, the share capital of Coca-Cola HBC increased by the issue of 322,050 new ordinary shares
following the exercise of stock options pursuant to the Coca-Cola HBC AG’s employees’ stock option plan. Total proceeds from the issuance of the shares under the stock option plan amounted to €5.1
million.
On 23 June 2015, the Annual General Meeting adopted a proposal for share buy-back of up to 3,000,000 ordinary shares of Coca-Cola HBC for the purpose of neutralizing the dilution resulting from shares issues
under Coca-Cola HBC’s equity compensation plans. The program was completed in full during 2015 for a consideration of €58.5 million.
Following the above changes, as at 31 December 2015 the share capital of the Group amounted to
€2,000.1 million and comprised 368,141,297 shares with a nominal value of CHF 6.70 each.
12. Non-controlling interests
On 8 June 2011, the Board of Directors of the Coca-Cola HBC’s subsidiary Nigerian Bottling Company plc
(“NBC”) resolved to propose a scheme of arrangement between NBC and its minority shareholders, involving the cancellation of part of the share capital of NBC. The transaction was approved by the Board
of Directors and General Assembly of NBC on 8 June 2011 and 22 July 2011 respectively and resulted in
the acquisition of the remaining 33.6% of the voting shares of NBC bringing the Group’s interest in the subsidiary to 100%. The transaction was completed in September 2011 and NBC was de-listed from the
Nigerian Stock Exchange. The consideration for the acquisition of non-controlling interests was €100.2 million, including transaction costs of €1.8 million, out of which €73.8 million was paid as of 31 December
2015 (as of 31 December 2014: €72.6 million).

Results for the year ended 31 December 2015 19 February 2016
Page 30 of 34
Selected explanatory notes to the condensed consolidated financial statements (unaudited)
13. Dividends
The Board of Directors of Coca-Cola HBC AG has proposed a €0.40 dividend per share in respect of 2015. If approved by the shareholders of Coca-Cola HBC AG, this dividend will be paid in 2016.
The shareholders of Coca-Cola HBC AG approved the dividend distribution of €0.36 per share at the Annual General Meeting held on 23 June 2015. The total dividend amounted to €132.4 million and was paid
on 28 July 2015. Of this an amount of €1.3 million relates to shares held by the Group.
On 25 June 2014 the shareholders of Coca-Cola HBC AG at the Annual General Meeting approved the
dividend distribution of €0.354 per share. The total dividend amounted to €130.2 million and was paid on 29 July 2014. Of this an amount of €1.2 million related to shares held by the Group.
14. Contingencies
There have been no significant adverse changes in contingencies since 31 December 2014 (as described in our 2014 Integrated Annual Report available on the Coca-Cola Hellenic’s web site:
www.coca-colahellenic.com). On 7 July 2015, the Supreme Administrative Court of Greece rejected our appeal against the decision of the Court of Appeals that upheld the decision but reduced the fine imposed
by the Greek Competition Authority. The Supreme Administrative Court also rejected the counter-appeals by the Competition Authority and one of our competitors. Following this development, the case
is closed.
15. Capital commitments
As of 31 December 2015 the Group has capital commitments of €75.4 million (31 December 2014: €81.0 million), which mainly relate to plant and machinery equipment.
16. Number of employees
The average number of full-time equivalent employees in 2015 was 33,311 (36,362 for 2014).
17. Related party transactions
a) The Coca-Cola Company
As at 31 December 2015, The Coca-Cola Company and its subsidiaries (collectively, ‘‘TCCC’’) indirectly
owned 23.1% (2014: 23.1%) of the issued share capital of Coca-Cola HBC.
Total purchases of concentrate, finished products and other materials from TCCC and its subsidiaries
during the full year and the six months ended 31 December 2015 amounted to €1,355.0 million and €642.9 million (€1,381.1 million and €651.4 million in the respective prior year periods). Total net contributions received
from TCCC for marketing and promotional incentives during the same period amounted to €89.5 million and €56.3 million (€78.7 million and €48.1 million in the respective prior year periods) while the Group received
contributions for purchases of coolers amounting of €0.5 million for both the full year and the six months ended
31 December 2015 (€0.3 million for both prior year periods).
During 2015, the Group sold €9.1 million of finished goods and raw materials to TCCC, while there were no such
sales for the six months ended 31 December 2015 (€28.1 million and €16.2 million in the respective prior year periods), while other income from TCCC was €6.6 million and €2.8 million for the full year and the six months
ended 31 December 2015 (€18.2 million and €9.6 million in the respective prior year periods). Other expenses from TCCC amounted to €4.1 million and €4.0 million for the full year and the six months ended 31 December
2015 (€3.2 million and €3.1 million in the respective prior year periods).
As at 31 December 2015, the Group had a total amount of €72.4 million due from TCCC (€88.2 million as at 31
December 2014), and had a total amount of €216.8 million due to TCCC including loans payable of €13.5 million (€222.3 million including loans payable of €7.3 million as at 31 December 2014).

Results for the year ended 31 December 2015 19 February 2016
Page 31 of 34
Selected explanatory notes to the condensed consolidated financial statements (unaudited)
17. Related party transactions (continued)
An amount of €14.1 million was paid to TCCC in the second quarter of 2014 in relation to the acquisition of certain intangible assets.
b) Frigoglass S.A. (‘Frigoglass’) and Kar-Tess Holding
Frigoglass, a company listed on the Athens Exchange, is a manufacturer of coolers, cooler parts, glass bottles, crowns and plastics. Truad Verwaltungs AG, currently indirectly owns 44.4% of Frigoglass and
also indirectly controls Kar Tess Holding, which holds approximately 23.2% (2014: 23.2%) of Coca Cola HBC’s total issued capital. Frigoglass has a controlling interest in Frigoglass Industries Limited, a company
in which Coca-Cola HBC has a 23.9% effective interest, through its investment in NBC. Furthermore, during 2015 Coca-Cola HBC acquired through its investment in NBC a 23.9% effective interest of
Frigoglass West Africa Ltd., a company in which Frigoglass has a controlling interest.
During the full year and the six months ended 31 December 2015, the Group made purchases of €101.7 million
and €51.8 million (€91.4 million and €49.5 million in the respective prior year periods) of coolers, raw materials and containers from Frigoglass and its subsidiaries and incurred maintenance and other expenses of €14.8 million and
€8.5 million (€14.1 million and €7.6 million in the respective prior year periods). The Group recorded other income of €0.8 million and €0.6 million from Frigoglass during the full year and the six months ended 31 December 2015
(€0.1 million for both prior year periods). As at 31 December 2015, Coca-Cola HBC owed €23.6 million (€12.1 million as at 31 December 2014) to, and was owed €0.6 million (€0.4 million as at 31 December 2014) by
Frigoglass.
c) Beverage Partners Worldwide (“BPW”)
BPW is a 50/50 joint venture between TCCC and Nestlé. The Group purchased inventory from BPW of €82.9 million and €31.6 million during the full year and the six months ended 31 December 2015 respectively (€79.0
million and €27.8 million in the respective prior year periods). As at 31 December 2015, the Group owed €5.8 million (€3.6 million as at 31 December 2014) to, and was owed €5.4 million (€0.9 million as at 31 December 2014)
by BPW.
d) Other related parties
During the full year and the six months ended 31 December 2015, the Group purchased €22.6 million and €12.2
million of raw materials and finished goods (€19.7 million and €9.3 million in the respective prior year periods) from other related parties and recorded sales of finished goods of €0.3 million and €0.1 million (€0.3 million for both
prior year periods) to other related parties. In addition, the Group received reimbursement for direct marketing expenses of €0.7 million and €0.3 million for the full year and the six months ended 31 December 2015 (€0.2
million for both prior year periods) from other related parties. Furthermore, the Group acquired €2.3 million and €1.5 million in tangible fixed assets from other related parties during the full year and the six months ended 31
December 2015 (€1.4 million and €0.4 million in the respective prior year periods). During the full year and six months ended 31 December 2015, the Group incurred other expenses of €29.0 million and €14.3 million (€31.2
million and €13.4 million in the respective prior year periods) and recorded income of €0.4 million and €0.2 million
respectively (€0.5 million and €0.2 million in the respective prior year periods). As at 31 December 2015, the Group owed €1.7 million (€8.9 million as at 31 December 2014) to, and was owed €2.3 million including loans
receivable of €0.1 million (€2.3 million as at 31 December 2014 with loans receivable of €0.2 million) by other related parties.

Results for the year ended 31 December 2015 19 February 2016
Page 32 of 34
Selected explanatory notes to the condensed consolidated financial statements (unaudited)
17. Related party transactions (continued)
e) Joint Ventures
During the full year and the six months ended 31 December 2015, the Group purchased €49.0 million and €23.5 million of finished goods (€56.5 million and €28.7 million in the respective prior year periods) from joint ventures
while the Group recorded sales of finished goods to joint ventures of €11.9 million and €11.3 million for the full year and the six months ended 31 December 2015 (€0.7 million and €0.4 million in the respective prior year
periods). In addition, the Group received reimbursement for direct marketing expenses of €0.6 million and €0.5 million for the full year and the six months ended 31 December 2015 (€0.3 million for for both prior year periods).
Furthermore, during the full year and the six months ended 31 December 2015, the Group incurred expenses of €0.6 million and €0.3 million (€0.9 million and €0.5 million for for both prior year periods) and recorded other
income for the full year and the six months ended 31 December 2015 of €2.5 million and €2.0 million from joint ventures (€2.7 million and €2.2 million in the respective prior year periods). In addition, the Group acquired €1.2
million in tangible fixed assets from joint ventures for the full year and the six months ended 31 December 2015 (nil in the respective prior year periods). As at 31 December 2015, the Group owed €42.2 million including loans
payable of €17.4 million (€163.7 million as at 31 December 2014 including loans payable of €150.2 million) to, and was owed €13.0 million including loans receivable of €7.9 million (€17.4 million as at 31 December 2014 including
loans receivable of €5.1 million) by joint ventures. During 2015 the Group received dividends of €119.6 million from Brewinvest S.A. Group of companies.
There were no transactions between Coca-Cola HBC and the directors and senior management except for
remuneration for both the full year and the six months ended 31 December 2015 and the respective prior year periods.
There were no other significant transactions with related parties for the year ended 31 December 2015.
18. Recent developments in Ukraine, the Russian Federation, Greece and Nigeria
We disclosed in our 2014 Integrated Annual Report that the ongoing situation in Ukraine and the Russian
Federation has adversely impacted the economies of these countries, and among other things, resulted in increased volatility in currency markets, causing the Russian rouble and the Ukrainian hryvnia to
depreciate significantly against some major currencies. Although there have been no significant developments following the publication of our Integrated Annual Report, we continuously monitor and
assess the situation in order to ensure that timely actions and initiatives are undertaken to minimize potential adverse impact on the Company's performance.
In addition, we disclosed in our 2014 Integrated Annual Report that the macroeconomic and financial
environment in Greece remained fragile. The recent developments relating to the instability of the Greek banking sector and the resulting imposition of capital controls restricting the movement of funds out of
Greece, are anticipated to further impact consumer’s disposable income which may adversely affect the Group’s operations in Greece for 2016. Our 2015 revenues for Greece amounted to 6% of consolidated
net sales revenues and our 2015 non-current assets for the territory amounted to 3% of the consolidated non-current assets. We are continuously monitoring developments in Greece. As at 31 december 2015,
cash and cash equivalents of €7.2 million were subject to capital controls.
Furthermore, in Nigeria, the introduction of tight capital controls and the pegging of the Naira to USD at a rate that may not be reflecting the supply and demand rate for the currency, may result in volatility in the local
currency. We are continuously monitoring and assessing the situation and we are taking timely actions to secure the smooth operation of our business in this challenging environment and minimize any adverse impact of a
potential currency devaluation on the Group's performance.

Results for the year ended 31 December 2015 19 February 2016
Page 33 of 34
Selected explanatory notes to the condensed consolidated financial statements (unaudited)
19. Subsequent events
In December 2015, the Group signed an agreement for the acquisition of Neptūno Vandenys, UAB, the leading bottled water company in Lithuania. The acquisition is subject to customary closing conditions,
including relevant regulatory approvals and is expected to be completed towards the end of the first quarter of 2016.
Following the 31st of December 2015, the Group incurred €1.4 million of restructuring costs before tax, of which €0.3 million, €0.5 million and €0.6 million in its established, developing and emerging markets respectively.

Results for the year ended 31 December 2015 19 February 2016
Page 34 of 34
Volume by country for 2015 and 2014
Million unit cases 2015 2014 % change 2015 vs 2014
Established Markets
Austria 89.9 89.6 -
Cyprus 16.1 15.8 2%
Greece 101.0 100.0 1%
Italy 265.7 259.9 2%
Republic of Ireland
and Northern Ireland 71.6 72.8 -2%
Switzerland 76.8 77.1 -
Total 621.1 615.2 1%
Developing Markets
Baltics 26.1 26.0 -
Croatia 24.6 23.9 3%
Czech Republic 51.1 49.1 4%
Hungary 83.8 77.5 8%
Poland 165.8 155.2 7%
Slovakia 21.3 20.7 3%
Slovenia 6.0 5.9 2%
Total 378.7 358.3 6%
Emerging Markets
Armenia 8.6 8.8 -2%
Belarus 38.4 43.9 -13%
Bosnia and Herzegovina 16.1 15.6 3%
Bulgaria 57.6 54.7 5%
Moldova 6.7 6.2 8%
Nigeria 232.0 210.6 10%
Romania 153.9 139.2 11%
Russian Federation 366.0 390.2 -6%
Serbia (including the Republic
of Kosovo) and Montenegro 90.2 84.7 6%
Ukraine 85.7 75.5 14%
Total 1,055.2 1,029.4 3%
Total Coca-Cola HBC 2,055.0 2,002.9 3%