executive and board remuneration report 2015 - eyfile/execboardremuneration-no2015.pdf · ey norway...
TRANSCRIPT
EY Norway
Executive and Board Remuneration Report 2015

►EY’s 2015 Executive and board remuneration report presents commentary on the market, legislative, regulatory, governance and shareholder issues that affect executive and board remuneration. It provides an overview of remuneration trends in 2015 and outlines our views on expected changes and potential issues for 2016.
►This report analyzes executive remuneration and board fee quantum and policy information for companies included in the Oslo Stock Exchange Benchmarking Index (OSEBX) as of June 2015. The analysis is based on information disclosed in the 2014 annual reports and other public disclosures released to June 2015.
►We include a discussion of the external issues we observe as influencing remuneration strategies in 2015, changes in regulations in the financial sector, the economic environment and evolving shareholder views.
►We also set out key focus areas and issues which we anticipate will be of influence in 2016.
►We generally sort the remuneration data into four groups of executives; CEO, CFO, Head of Business Unit (HBU) and Head of Corporate Functions (HCF), to allow reflection on the most appropriate comparisons. In analyses from previous years, however, the HBUs and HCFs have constituted one joint category labelled ‘Other Executives’. In cases where we find direct year-to-year comparison between these categories especially relevant we therefore use Other Executives in the present report, which represents an aggregation of the HBU and HCF categories. The HBU category refers to executives whose role implies the management of a specific product- and/or geographic unit. HCFs are those executives in charge of any corporate functions, including HR, Public Affairs, Compliance, and so on. We only include those executives that are defined by the company in their annual report as members of the corporate management group and whose remuneration is reported.►A more comprehensive and tailored analysis of the underlying data can be provided on request.
About this report
2 | EY Norway Executive and Board Remuneration Report 2015

ContentsAbout this report 2
Contents 3
Speed read 4
The remuneration environment 6
The Norwegian economy in 201 6
Executive remuneration in state-owned companies 7
Executive remuneration in finance institutions 7
Global remuneration trends 8
Executive remuneration: market insights 10
Data presented 10
Remuneration levels 11
Remuneration movement 12
Sector analysis 14
Remuneration mix 20
Short-term incentive policy 22
Separate commentary on long-term incentives: the EY LTI survey 26
Plan types 27
LTI levels 28
Performance-based LTI 29
Board fees: market insights 32
Analysis of board fee levels 33
Number of board members 33
Anticipated trends and issues for 2016 34
3EY Norway Executive and Board Remuneration Report 2015 |

Speed read►Factors such as falling oil prices, cut in the key policy rate as well as falling exchange rate occurred in Norway during 2014. However, as most of these factors occurred during the last half of 2014 no major consequences of the factors can be seen on the remuneration packages for executives in 2014. It is expected that larger effects will become evident when considering the executive remuneration in 2015.
►This report shows that the executive remuneration environment has continued to grow during 2014 and that the total compensation packages for CEO, CFO, HBU and HCF have all increased from 2013 to 2014. On average the total compensation has increased by 24% in this period for OSEBX executives. By comparison the national salary average for all employees increased by 3.2% in the same period, according to Statistics Norway. Note that the results depend on the statistic used (average versus median) and on whether new hires and/or entries on OSEBX are included in the analysis or not.
►A sector specific analysis shows that the total compensation for CEO increased in a number of sectors from 2013 to 2014, but decreased in other sectors. For CFO, the total compensation increased within all sectors except a slight decrease within the IT sector. For other executives (HBU and HCF), however, a decrease from 2013 to 2014 was found for the majority of sectors.►45 out of the 48 companies in our data-sample from 2014 report that they have a short-term incentive (STI) plan, whereas for 2013 the number was 42 of 43 companies. The majority of the companies report that the maximum bonus opportunity equals 50% of base salary. Profit was the most commonly used financial performance measure (31%), followed by return measures (24%). With regards to non-financial measure, people measure was the most commonly used in 2014 (67%).
►A separate study of 2014 practice of long-term incentives (LTI) among OSEBX companies revealed that share options were the most commonly used LTI, and
these incentives were equal to between 32% and 48% of executives’ base salary. Performance-based LTI plans were used by 55% of companies, and total shareholder return (TSR) and earnings per share (EPS) were the most common performance measures.
As for board directors, no notable developments in board fees were seen between 2013 and 2014. Board fee levels varied along with company market capitalization, and there were generally more non-executive directors (NEDs) on the boards of companies with high market capitalization than companies with lower market capitalization.
►We expect that corresponding data for 2015, when available, will reveal a greater effect of the recent developments in the Norwegian economy on executive remuneration than what could be seen in 2014 figures. A more evident interest in a clear and reasonable link between executive pay and organizational performance is anticipated in future years.
4 | EY Norway Executive and Board Remuneration Report 2015

5EY Norway Executive and Board Remuneration Report 2015 |

The remuneration environmentThe Norwegian economy in 2014The last 10-15 years, a combination of increasing oil-prices, growing oil investments, and an increased level of import from China has given an exceptional economic growth in Norway. The global recession had limited effects on Norway compared to other areas; instead it can be said that 2014 became the year with the most changes and uncertainty in Norway. Even though the Norwegian economy grew steadily also in 2014 several factors occurred, particularly during the last half of 2014, which began to affect the Norwegian economy:
• At the end of 2014 the oil prices were halved since summer (the prices were at its lowest in January 2015).
• The Norwegian Bank made a cut in the key policy rate • The exchange rate fell by 11%-12% during a period of four
weeks at the end of 2014
In particular the falling oil prices led to challenges for the companies in the oil and gas industry. During the last half of 2014, several companies (mainly from the west and south of Norway where most of the oil and gas companies are located) began to report cut-backs and dismissals, and the trend has continued into 2015. As a consequence, we do not expect that the companies in the oil and gas industry will continue to drive the overall salary level in 2015 upwards to the same extent as before, and we expect a generally lower wage growth for 2015. Furthermore, these developments in the oil and gas sector are expected to have ripple effects into other business sectors and contribute to increased unemployment and a potential lower temperature in the housing market.
6 | EY Norway Executive and Board Remuneration Report 2015
Executive remuneration in state-owned companiesIn the beginning of 2015, the Ministry of Trade and Fisheries published new guidelines related to salary and other compensation for executives in state-owned companies. Effective from 13 February 2015, the new guidelines apply to subsidiaries where parent company is wholly owned by the state or where the state has more than 90% ownership. The main changes in the new guidelines are:
• ►They no longer support company pension schemes which secure pension above 12 G.
• ►They include an opening for companies with state ownership to include performance criteria within LTI and consider LTI as variable pay
In addition to these changes, the Ministry maintained the limit of variable pay (STI) to 50% of base salary.
Executive remuneration in finance institutions►During 2014 the Ministry of Finance introduced changes in the Norwegian regulations for bonus schemes in the financial sector due to implementation of the new EU Capital Requirement Directive (CRD IV).
►The new regulations were effective from 1 January 2015 and the Norwegian Financial Supervisory Authority also introduced guidelines on how the new regulations should be understood and will be regulated by the Ministry of Finance.
►The new regulations and guidelines represent a tightening compared to previous guidelines. The main changes include:
• ►A limitation of variable pay to 100% of fixed pay for executives/employees covered by the Directive (i.e. the corporate management team, employees in control functions and potential “risk takers” for the company). The variable pay can in some cases be increased to 200% if certain predetermined conditions are fulfilled.
• ►►The above is also incorporated in the Norwegian regulation and applies to executives/employees considered to be covered by the regulation. However, for CEO, CFO and others in the corporate management team in banks, the limit of variable pay to half of the fixed pay has been maintained in the Norwegian Regulation.
• ►►The new Directive addresses new qualitative and quantitative requirements related to the evaluation of which executives/employees that will be considered as covered by the new regulations. The requirements are regarded as more comprehensive than earlier and we expect that more of the executives/employees in the covered finance institutions will be included than previously.
►The finance institutions will need to do a new evaluation of whether additional employees/executives are to be covered by the new regulations. Furthermore, we expect an increase of the base salary for such covered employees/executives to compensate for the reduced bonus potential.
The remuneration environment
7EY Norway Executive and Board Remuneration Report 2015 |
8 | EY Norway Executive and Board Remuneration Report 2015
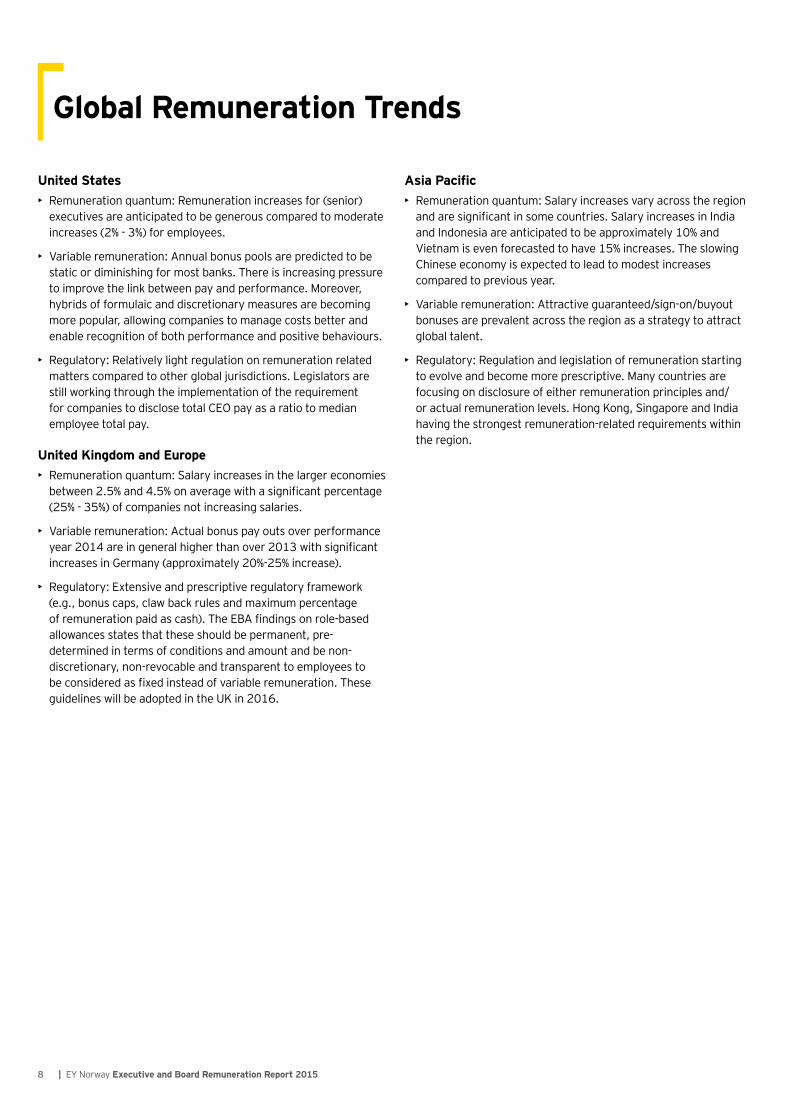
United States• Remuneration quantum: Remuneration increases for (senior)
executives are anticipated to be generous compared to moderate increases (2% - 3%) for employees.
• Variable remuneration: Annual bonus pools are predicted to be static or diminishing for most banks. There is increasing pressure to improve the link between pay and performance. Moreover, hybrids of formulaic and discretionary measures are becoming more popular, allowing companies to manage costs better and enable recognition of both performance and positive behaviours.
• Regulatory: Relatively light regulation on remuneration related matters compared to other global jurisdictions. Legislators are still working through the implementation of the requirement for companies to disclose total CEO pay as a ratio to median employee total pay.
United Kingdom and Europe• Remuneration quantum: Salary increases in the larger economies
between 2.5% and 4.5% on average with a significant percentage (25% - 35%) of companies not increasing salaries.
• Variable remuneration: Actual bonus pay outs over performance year 2014 are in general higher than over 2013 with significant increases in Germany (approximately 20%-25% increase).
• Regulatory: Extensive and prescriptive regulatory framework (e.g., bonus caps, claw back rules and maximum percentage of remuneration paid as cash). The EBA findings on role-based allowances states that these should be permanent, pre-determined in terms of conditions and amount and be non-discretionary, non-revocable and transparent to employees to be considered as fixed instead of variable remuneration. These guidelines will be adopted in the UK in 2016.
Global Remuneration Trends
Asia Pacific• Remuneration quantum: Salary increases vary across the region
and are significant in some countries. Salary increases in India and Indonesia are anticipated to be approximately 10% and Vietnam is even forecasted to have 15% increases. The slowing Chinese economy is expected to lead to modest increases compared to previous year.
• Variable remuneration: Attractive guaranteed/sign-on/buyout bonuses are prevalent across the region as a strategy to attract global talent.
• Regulatory: Regulation and legislation of remuneration starting to evolve and become more prescriptive. Many countries are focusing on disclosure of either remuneration principles and/or actual remuneration levels. Hong Kong, Singapore and India having the strongest remuneration-related requirements within the region.

9EY Norway Executive and Board Remuneration Report 2015 |
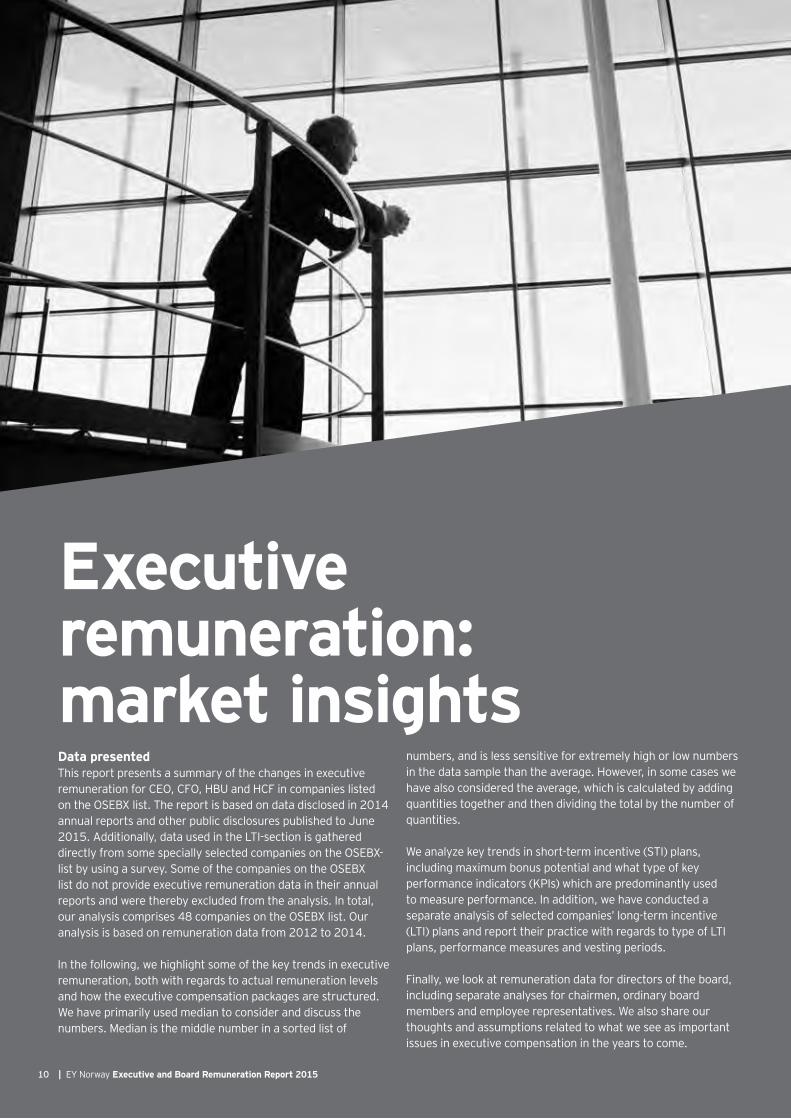
Executive remuneration: market insightsData presented►This report presents a summary of the changes in executive remuneration for CEO, CFO, HBU and HCF in companies listed on the OSEBX list. The report is based on data disclosed in 2014 annual reports and other public disclosures published to June 2015. Additionally, data used in the LTI-section is gathered directly from some specially selected companies on the OSEBX-list by using a survey. Some of the companies on the OSEBX list do not provide executive remuneration data in their annual reports and were thereby excluded from the analysis. In total, our analysis comprises 48 companies on the OSEBX list. Our analysis is based on remuneration data from 2012 to 2014.
►In the following, we highlight some of the key trends in executive remuneration, both with regards to actual remuneration levels and how the executive compensation packages are structured. We have primarily used median to consider and discuss the numbers. Median is the middle number in a sorted list of
numbers, and is less sensitive for extremely high or low numbers in the data sample than the average. However, in some cases we have also considered the average, which is calculated by adding quantities together and then dividing the total by the number of quantities.
►We analyze key trends in short-term incentive (STI) plans, including maximum bonus potential and what type of key performance indicators (KPIs) which are predominantly used to measure performance. In addition, we have conducted a separate analysis of selected companies’ long-term incentive (LTI) plans and report their practice with regards to type of LTI plans, performance measures and vesting periods.
►Finally, we look at remuneration data for directors of the board, including separate analyses for chairmen, ordinary board members and employee representatives. We also share our thoughts and assumptions related to what we see as important issues in executive compensation in the years to come.
10 | EY Norway Executive and Board Remuneration Report 2015

Remuneration levels
►The tables below report median remuneration levels by compensation element for CEO, CFO, Head of Business Unit (HBU) and Head of Corporate Functions (HCF).
►In addition to executive remuneration at the OSEBX level, we have distinguished between the top 20 and bottom 20 OSEBX companies in terms of their market capitalization by 31 December 2014.
►The compensation elements are consistently higher among the top 20 than the bottom 20 companies, for all categories of executives. In other words, executive remuneration levels in 2014 seemed to vary in line with market capitalization. Median total CEO compensation in top 20 was 80% higher than in bottom 20, and CFO and HBU total remuneration was approximately twice as high in the top 20 as in the bottom 20.
Figure 1: Median executive remuneration elements OSEBX 2014: all companies, top 20 and bottom 20
All companies 2014 (NOK’000)Median Salary Benefits Pension STI bonus Total remuneration*
CEO 3 635 187 269 1 567 7 186
CFO 2 554 145 85 607 3 419
HBU 2 164 111 138 619 3 354
HCF 1 497 68 107 350 2 353
Top 20 companies based on market cap 31.12.14 (NOK’000)Median Salary Benefits Pension STI bonus Total remuneration*
CEO 4 589 187 1 196 1 416 7 773
CFO 3 048 182 601 931 5 354
HBU 2 645 200 637 718 5 035
HCF 1 689 170 271 454 2 542
Bottom 20 companies based on market cap 31.12.14 (NOK’000)Median Salary Benefits Pension STI bonus Total remuneration*
CEO 2 780 186 106 1 359 4 328
CFO 1 860 118 70 462 2 751
HBU 1 789 53 118 401 2 320
HCF 1 497 34 64 292 1 787
* Total remuneration here includes base salary, benefits, pension and STI bonus. For analyses of long-term incentive (LTI) awards, see our separate LTI section (page 26-30).
11EY Norway Executive and Board Remuneration Report 2015 |
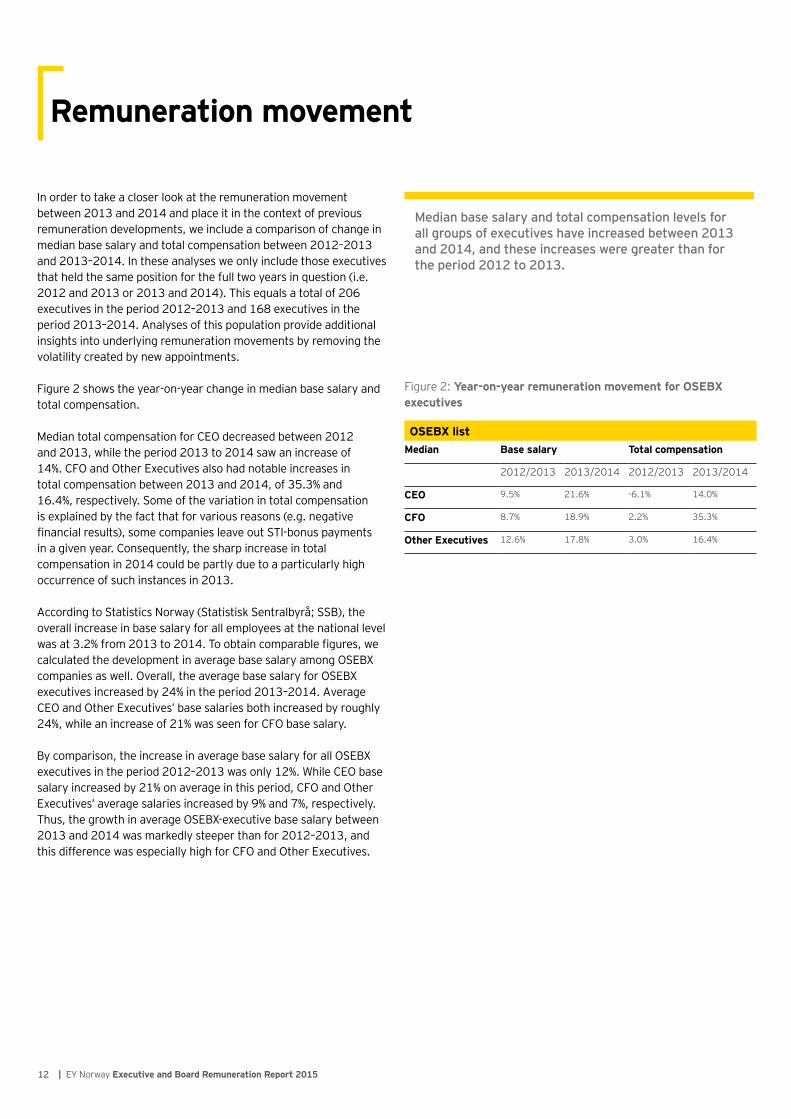
►In order to take a closer look at the remuneration movement between 2013 and 2014 and place it in the context of previous remuneration developments, we include a comparison of change in median base salary and total compensation between 2012–2013 and 2013–2014. In these analyses we only include those executives that held the same position for the full two years in question (i.e. 2012 and 2013 or 2013 and 2014). This equals a total of 206 executives in the period 2012–2013 and 168 executives in the period 2013–2014. Analyses of this population provide additional insights into underlying remuneration movements by removing the volatility created by new appointments.
Figure 2 shows the year-on-year change in median base salary and total compensation.
Median total compensation for CEO decreased between 2012 and 2013, while the period 2013 to 2014 saw an increase of 14%. CFO and Other Executives also had notable increases in total compensation between 2013 and 2014, of 35.3% and 16.4%, respectively. Some of the variation in total compensation is explained by the fact that for various reasons (e.g. negative financial results), some companies leave out STI-bonus payments in a given year. Consequently, the sharp increase in total compensation in 2014 could be partly due to a particularly high occurrence of such instances in 2013.
►According to Statistics Norway (Statistisk Sentralbyrå; SSB), the overall increase in base salary for all employees at the national level was at 3.2% from 2013 to 2014. To obtain comparable figures, we calculated the development in average base salary among OSEBX companies as well. Overall, the average base salary for OSEBX executives increased by 24% in the period 2013–2014. Average CEO and Other Executives’ base salaries both increased by roughly 24%, while an increase of 21% was seen for CFO base salary.
►By comparison, the increase in average base salary for all OSEBX executives in the period 2012–2013 was only 12%. While CEO base salary increased by 21% on average in this period, CFO and Other Executives’ average salaries increased by 9% and 7%, respectively. Thus, the growth in average OSEBX-executive base salary between 2013 and 2014 was markedly steeper than for 2012–2013, and this difference was especially high for CFO and Other Executives.
Remuneration movement
Figure 2: Year-on-year remuneration movement for OSEBX executives
OSEBX listMedian Base salary Total compensation
2012/2013 2013/2014 2012/2013 2013/2014
CEO 9.5% 21.6% -6.1% 14.0%
CFO 8.7% 18.9% 2.2% 35.3%
Other Executives 12.6% 17.8% 3.0% 16.4%
Median base salary and total compensation levels for all groups of executives have increased between 2013 and 2014, and these increases were greater than for the period 2012 to 2013.
12 | EY Norway Executive and Board Remuneration Report 2015

13EY Norway Executive and Board Remuneration Report 2015 |

Sector analysis
►While the analyses so far have looked at executive remuneration at the total level and at the top 20- and bottom 20 level, this section presents analyses of total compensation by sector. All sectors represented at OSEBX are included, with the exception of the Supply sector, which had no companies on OSEBX in 2013 and hence cannot be compared.
►As in previous sections of this report, total compensation in these analyses represents the sum of base salary, STI bonus, benefits, and pension contributions. For discussion and analyses of LTI, see page 26-30.
►As figure 3 illustrates, several sectors saw an increase in CEO total compensation from 2013 to 2014. The Health, IT, Materials and Telecom sectors, on the other hand, had decreases in compensation levels. Closer inspection revealed that for these sectors, a decline had occurred in base salary, STI and pension contributions between 2013 and 2014. This development is more likely due to new hires or new companies entering the OSEBX list, than to decreases in the base salary of incumbent executives. CEO compensation thus seems to be characterized by an overall decrease in 2014 in the Health, IT, Materials and Telecom sectors.►CFO total compensation generally increased between 2013 and 2014 across sectors, with the exception of a slight decline in the IT sector. An especially sharp increase is found in the Energy, Consumer staples, and Materials sectors.
To allow for direct comparison of other executives in 2014 and 2013, figure 5 presents the median total compensation of Other Executives in 2013, and the average of the median total compensation for HBU and HCF in 2014. Contrary to CEO and CFO total compensation, the levels in the Other Executives group seem to be on the decrease in most sectors. The exceptions are the Consumer discretionary, Consumer staples, and Materials sectors.
Note that this analysis is not based on the same data as the Remuneration movement table on page 12, which had only those executives that held the same executive role for the full period 2013–2014. Thus, the present data is influenced by new companies entering OSEBX in 2014 that may have lower remuneration levels to Other Executives than those companies that previously constituted the OSEBX list.
Figure 3: Median CEO total compensation by sector, 2014 and 2013
0
2000
4000
6000
8000
10000
12000
14000 2014 2013
TNOK
2014 2013
TNOK
2014 2013
TNOK
HBU 2014 HCF 2014TNOK
TNOK
0
1000
2000
3000
4000
5000
6000
7000
010002000300040005000600070008000
0
1000
2000
3000
4000
5000
6000
7000
8000
02000400060008000
10000
Base STI Benefits Pension Total
2014 2013
14 | EY Norway Executive and Board Remuneration Report 2015

Figure 4: Median CFO total compensation by sector, 2014 and 2013
Figure 5: Median Other Executives total compensation by sector, 2014 and 2013
0
2000
4000
6000
8000
10000
12000
14000 2014 2013
TNOK
2014 2013
TNOK
2014 2013
TNOK
HBU 2014 HCF 2014TNOK
TNOK
0
1000
2000
3000
4000
5000
6000
7000
010002000300040005000600070008000
0
1000
2000
3000
4000
5000
6000
7000
8000
02000400060008000
10000
Base STI Benefits Pension Total
2014 2013
0
2000
4000
6000
8000
10000
12000
14000 2014 2013
TNOK
2014 2013
TNOK
2014 2013
TNOK
HBU 2014 HCF 2014TNOK
TNOK
0
1000
2000
3000
4000
5000
6000
7000
010002000300040005000600070008000
0
1000
2000
3000
4000
5000
6000
7000
8000
02000400060008000
10000
Base STI Benefits Pension Total
2014 2013
15EY Norway Executive and Board Remuneration Report 2015 |
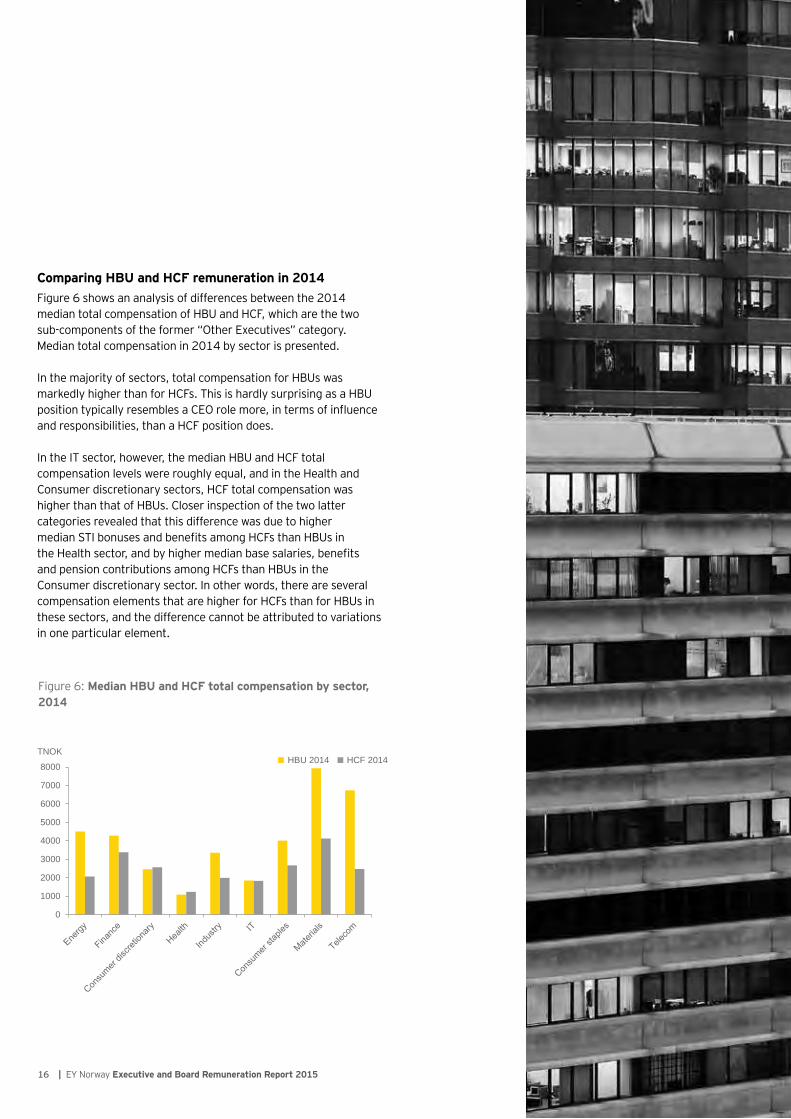
Comparing HBU and HCF remuneration in 2014Figure 6 shows an analysis of differences between the 2014 median total compensation of HBU and HCF, which are the two sub-components of the former “Other Executives” category. Median total compensation in 2014 by sector is presented.
In the majority of sectors, total compensation for HBUs was markedly higher than for HCFs. This is hardly surprising as a HBU position typically resembles a CEO role more, in terms of influence and responsibilities, than a HCF position does.
In the IT sector, however, the median HBU and HCF total compensation levels were roughly equal, and in the Health and Consumer discretionary sectors, HCF total compensation was higher than that of HBUs. Closer inspection of the two latter categories revealed that this difference was due to higher median STI bonuses and benefits among HCFs than HBUs in the Health sector, and by higher median base salaries, benefits and pension contributions among HCFs than HBUs in the Consumer discretionary sector. In other words, there are several compensation elements that are higher for HCFs than for HBUs in these sectors, and the difference cannot be attributed to variations in one particular element.
Figure 6: Median HBU and HCF total compensation by sector, 2014
0
2000
4000
6000
8000
10000
12000
14000 2014 2013
TNOK
2014 2013
TNOK
2014 2013
TNOK
HBU 2014 HCF 2014TNOK
TNOK
0
1000
2000
3000
4000
5000
6000
7000
010002000300040005000600070008000
0
1000
2000
3000
4000
5000
6000
7000
8000
02000400060008000
10000
Base STI Benefits Pension Total
2014 2013
16 | EY Norway Executive and Board Remuneration Report 2015

17EY Norway Executive and Board Remuneration Report 2015 |
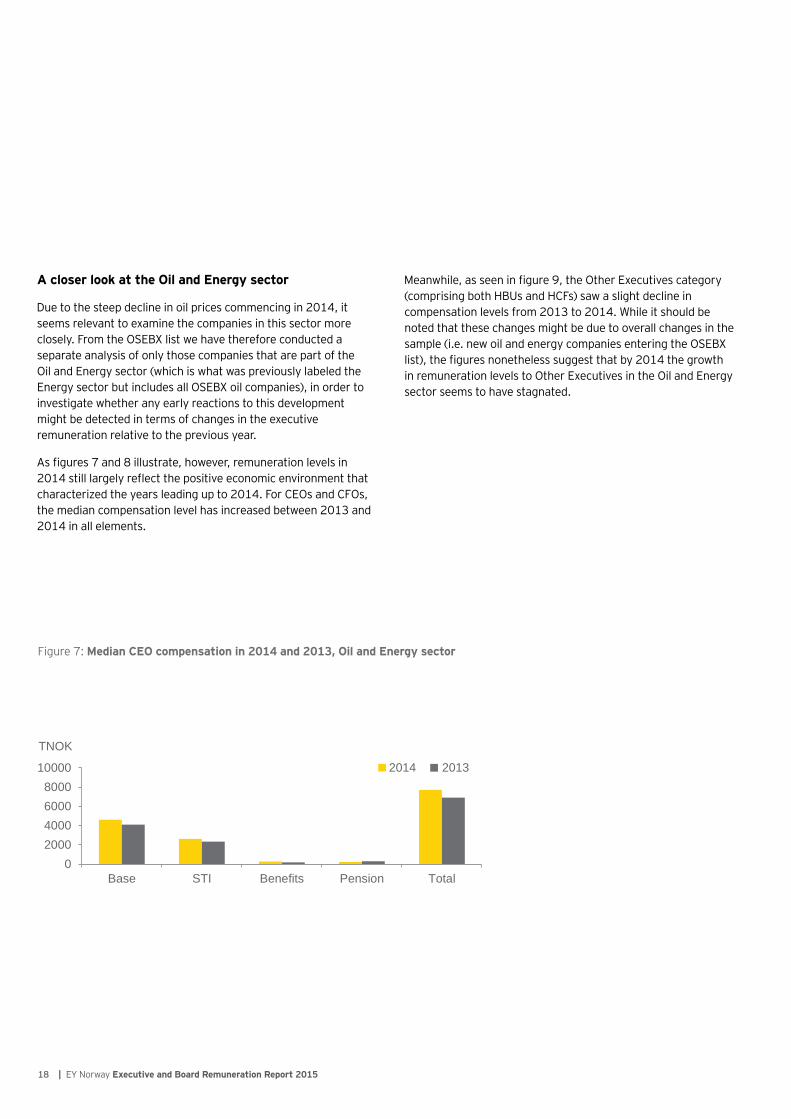
A closer look at the Oil and Energy sector
►Due to the steep decline in oil prices commencing in 2014, it seems relevant to examine the companies in this sector more closely. From the OSEBX list we have therefore conducted a separate analysis of only those companies that are part of the Oil and Energy sector (which is what was previously labeled the Energy sector but includes all OSEBX oil companies), in order to investigate whether any early reactions to this development might be detected in terms of changes in the executive remuneration relative to the previous year.
►As figures 7 and 8 illustrate, however, remuneration levels in 2014 still largely reflect the positive economic environment that characterized the years leading up to 2014. For CEOs and CFOs, the median compensation level has increased between 2013 and 2014 in all elements.
Figure 7: Median CEO compensation in 2014 and 2013, Oil and Energy sector
2014 2013
TNOK
TNOK
TNOK
2014 2013
2014 2013
02000400060008000
10000
Base STI Benefits Pension Total
010002000300040005000
Base STI Benefits Pension Total
0
1000
2000
3000
4000
5000
Base STI Benefits Pension Total
►Meanwhile, as seen in figure 9, the Other Executives category (comprising both HBUs and HCFs) saw a slight decline in compensation levels from 2013 to 2014. While it should be noted that these changes might be due to overall changes in the sample (i.e. new oil and energy companies entering the OSEBX list), the figures nonetheless suggest that by 2014 the growth in remuneration levels to Other Executives in the Oil and Energy sector seems to have stagnated.
18 | EY Norway Executive and Board Remuneration Report 2015

Figure 8: Median CFO compensation in 2014 and 2013, Oil and Energy sector
2014 2013
TNOK
TNOK
TNOK
2014 2013
2014 2013
02000400060008000
10000
Base STI Benefits Pension Total
010002000300040005000
Base STI Benefits Pension Total
0
1000
2000
3000
4000
5000
Base STI Benefits Pension Total
Figure 9: Median Other Executive compensation in 2014 and 2013, Oil and Energy sector
2014 2013
TNOK
TNOK
TNOK
2014 2013
2014 2013
02000400060008000
10000
Base STI Benefits Pension Total
010002000300040005000
Base STI Benefits Pension Total
0
1000
2000
3000
4000
5000
Base STI Benefits Pension Total
19EY Norway Executive and Board Remuneration Report 2015 |
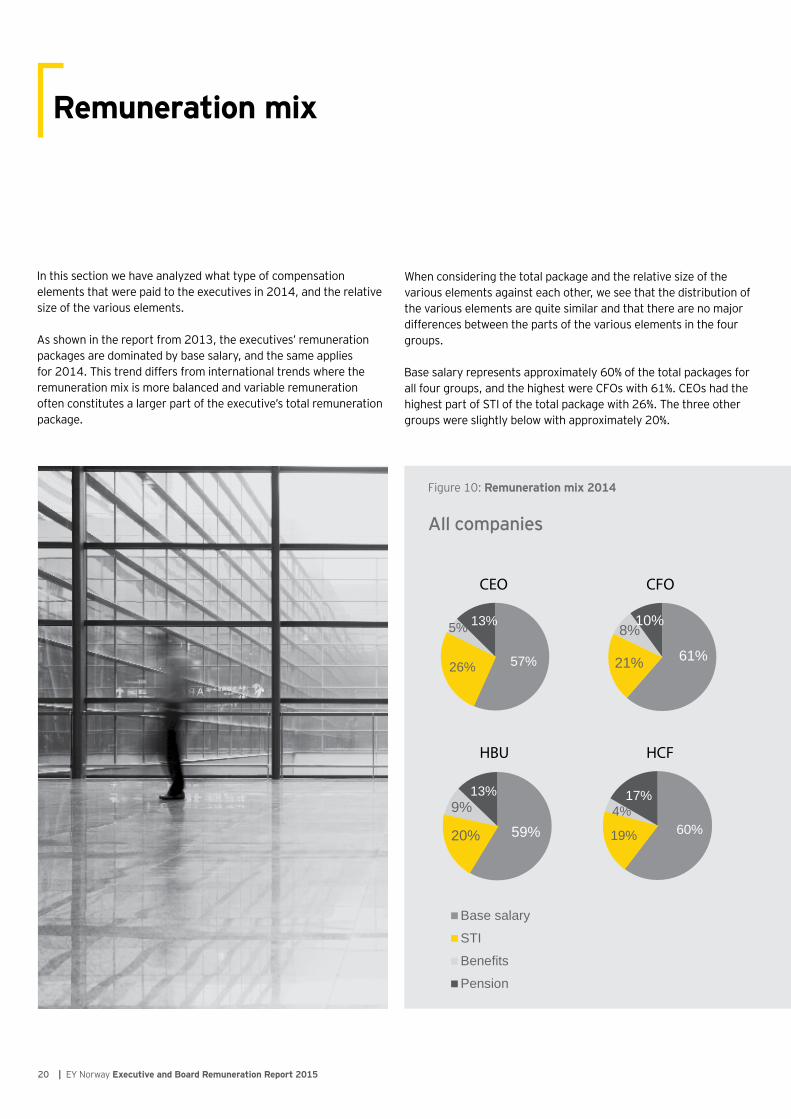
►In this section we have analyzed what type of compensation elements that were paid to the executives in 2014, and the relative size of the various elements.
►As shown in the report from 2013, the executives’ remuneration packages are dominated by base salary, and the same applies for 2014. This trend differs from international trends where the remuneration mix is more balanced and variable remuneration often constitutes a larger part of the executive’s total remuneration package.
Remuneration mix
Figure 10: Remuneration mix 2014
All companies
57%26%
5% 13%
61%21%
8%10%
59%20%
9%13%
60%19%
4%17%
Base salary
STI
Benefits
Pension
Base salary
STI
Benefits
Pension
Base salary
STI
Benefits
Pension
CEO CFO
HBU HCF
CEO CFO
HBU HCF
CEO CFO
HBU HCF
59%17%
3%
21%
58%21%
6%16%
56%18%
8%
18%
60%22%
6%12%
64%21%
8%7%
60%19%
11%9%
59%12%
2%
27%
56%32%
6%6%
When considering the total package and the relative size of the various elements against each other, we see that the distribution of the various elements are quite similar and that there are no major differences between the parts of the various elements in the four groups.
►Base salary represents approximately 60% of the total packages for all four groups, and the highest were CFOs with 61%. CEOs had the highest part of STI of the total package with 26%. The three other groups were slightly below with approximately 20%. ►
20 | EY Norway Executive and Board Remuneration Report 2015

Figure 11: Remuneration mix 2014
Top 20 companies
Figure 12: Remuneration mix 2014
Bottom 20 companies
57%26%
5% 13%
61%21%
8%10%
59%20%
9%13%
60%19%
4%17%
Base salary
STI
Benefits
Pension
Base salary
STI
Benefits
Pension
Base salary
STI
Benefits
Pension
CEO CFO
HBU HCF
CEO CFO
HBU HCF
CEO CFO
HBU HCF
59%17%
3%
21%
58%21%
6%16%
56%18%
8%
18%
60%22%
6%12%
64%21%
8%7%
60%19%
11%9%
59%12%
2%
27%
56%32%
6%6%
When considering the top 20 companies, base salary is distributed approximately similarly to the “all companies” category. Pension contributions, on the other hand, hold a notably higher percentage in the top 20 companies than in “all companies”, with the exception of HCFs. Comparing pension in top 20 and bottom 20 companies shows large variety in all groups, except HCF which is remarkably higher in the bottom 20 than the top 20 companies. (27% in bottom 20 and 12% in top 20). However, this is likely due to lower base salary within the HCF group, which leads to pension having a higher share of the total package considering the relative size of the different elements.
►For CEOs, the proportion of STI varies quite widely when comparing top 20 companies, where the STI-part is 17% of the total package, with bottom 20, where the STI-part is 32% (which also was the highest proportion of STI of the four groups). Considering the top 20 companies, HCFs had the highest proportion of STI with 22%.
21EY Norway Executive and Board Remuneration Report 2015 |

Short-term incentive policy
Quantum►45 of the companies report that they have a STI-plan. Out of these, 71% of the companies report that the maximum bonus potential for the executives is capped, and 58% report the cap as a percentage of base salary. The majority of the companies report that the maximum bonus opportunity equals 50% of base salary. However, the market shows a wide spread from bonus payments capped at 25% of base salary up to 150%.
Figure 13: Maximum bonus potential in all companies* in 2014 and 2013
0
2
4
6
8
10
12
14
Below 50% 50 % 51% -100% Over 100%
2014 2013
No. of companies
*All companies that report maximum bonus potential as a percentage of base salary.
59%
21%Industry
Materials
Finance
Energy
Telecom
IT
Supply
Consumables
Health
22 | EY Norway Executive and Board Remuneration Report 2015

23EY Norway Executive and Board Remuneration Report 2015 |

24 | EY Norway Executive and Board Remuneration Report 2015
EY viewpoint: the quality of performance measuresA much debated topic regarding variable pay is the ratiobetween fixed and variable pay. And indeed it is veryimportant to provide executives with an optimal pay mixwhich on the one hand provides sufficient incentives toimprove (long term) business performance, and at thesame time prevents excessive risk taking. However, anoptimal pay mix can best be determined with having aclear understanding of what defines performance andhow it can be measured. It is widely accepted that thequality of performance measures is determined by thelevel of control the executive has over it and the level ofalignment of the performance measure with the interestsof the company owners. It follows that when the qualityof available performance measures is low, optimallythe emphasis on variable remuneration should also below and vice versa. Therefore, the pay mix which isoptimal for an executive of a specific company cannotbe determined by benchmarking alone. By taking thequality of available performance measures into account,remuneration committees can optimize a pay mix basedon a benchmarked starting point. Finally, behavioralaspects are also important, which shows the challengeremuneration committees face.

Financial performance measures►As seen in Figure 14, profit measures were commonly used as KPI in STI-plans (31%). The most common profit measures were operating margin and changes in EBITA or EBITDA.
►However, “others” lies above profit over most commonly used measures. Some companies report that STI-bonus is contingent upon business unit- or group level financial performance “targets,” without specifying what type of targets these are. Such statements are therefore categorized under “Other” financial measures and are the reason for the high number under this category.
►Furthermore, many companies do not provide details of the KPIs used in their STI-plans and therefore, the figures do not illustrate the full picture regarding market practice.
Non-financial performance measures►71% of the companies that report operating a STI-plan report that they have non-financial performance metrics in their annual bonus plan.
►The percentage of companies with non-financial performance metrics is higher for companies in the top 20 (95%) than companies in the bottom 20 (58%).
►People measure was the most commonly used non-financial measure in 2014 and its frequency has also increased from 45% in 2013 to 67% in 2014. A people measure is typically a leadership evaluation, in terms of employee survey feedback or an assessment of the congruence between leadership behaviors and organizational values.
►Other disclosed non-financial measures include assessments of health, safety and environment (HSE) and evaluations of the implementation of strategic business plans.
Profit was the most commonly used financial performance measure (31%)
31%
The most frequent non-financial performance measure in 2014 was people measures (67%).
67%
Figure 14: KPIs used in STI-plans, OSEBX 2014
Financial measure* Non-financial measure*Profit 31% People measures 67%
Return 24% HSE 11%
Others 49% Business plans/strategy 13%
25EY Norway Executive and Board Remuneration Report 2015 |

When it comes to long term incentives (LTI), data collection from companies’ annual reports becomes more challenging than for other compensation elements. A LTI is defined as a payment with a performance- and/or vesting period of more than one year, typically three to five years. Shares or share options are commonly used as LTI. In the annual reports, some companies report LTI awards in terms of their value at grant, while others report the exercise value of previously granted incentives. Some companies leave out the reporting of LTI altogether. For ease of comparison, EY has therefore conducted a separate survey asking companies to state the grant value of LTI awards to executives in 2014. The survey also asked for further details regarding plan composition and performance criteria. The following presents findings from this survey, supplemented by annual-report data from those companies that do report LTI awards at grant. The total sample comprises 14 OSEBX companies.
It is important to keep in mind that this is a limited sample that is unlikely to cover all possible variations within the OSEBX list; still, the sample is diverse and offers several relevant examples of overall market practice. Five of the companies are state-owned, and a variety of sectors is represented among both state-owned and non-state-owned companies.
Separate commentary on long-term incentives: the EY LTI-survey
Figure 15: Sectors represented in the EY LTI sample
0
2
4
6
8
10
12
14
Below 50% 50 % 51% -100% Over 100%
2014 2013
No. of companies
*All companies that report maximum bonus potential as a percentage of base salary.
59%
21%Industry
Materials
Finance
Energy
Telecom
IT
Supply
Consumables
Health
The EY LTI survey collected data on OSEBX companies’:Grant values
Plan types
Performance criteria
26 | EY Norway Executive and Board Remuneration Report 2015

Plan types►Share option plans are used as LTI by the clear majority of non-state-owned companies, with a median vesting period of three years. Some operate a further lock-in period of two to three years after vesting, but this was only the case for two of the companies in the present study.
Other plan types, although less common, include synthetic shares or share appreciation rights (SAR). These plans do not require the recipient to purchase actual shares in the market, but he or she still receives the benefits of any positive development in share price for a specified number of units.
►For companies with state ownership, LTI is generally awarded in the form of cash bonuses where the net amount is invested in shares with a three years holding period. However, the state-owned companies express that these plans are up for review in 2015 in light of the new regulatory changes posed by the Ministry of Trade and Fisheries in 2015 (see page 7).
The majority of companies used share options as LTI in 2014
27EY Norway Executive and Board Remuneration Report 2015 |

LTI levels►Figure 16 reports the median LTI level among the 14 companies in our LTI sample. While the LTI level is markedly higher among CEOs than the other three categories, the latter three have roughly similar LTI levels.
►In an additional analysis we compared the median LTI and STI levels. For all executives, median LTI was higher than median STI. This difference was less prominent for CEOs and CFOs than for HBUs and HCFs, suggesting that CEO and CFO LTI and STI generally represent a more equal percentage of base salary than LTI and STI for the other two executive categories.
Annual LTI awards were higher than STI bonuses for all categories of executives
As Figure 17 suggests, the different categories of executives vary in terms of their LTI level relative to base salary. Compared to the other executives, the CFOs in this sample have the lowest LTI-to-base-salary ratio, while the CEOs have the highest. LTI for HCFs is relatively high compared to HBUs, when seen in relation to their base salaries.
Figure 16: Median LTI for CEO, CFO, HBU and HCF 2014
0200400600800
100012001400160018002000
CEO CFO HBU HCF
48%
32%
38%42%
0%
10%
20%
30%
40%
50%
60%
CEO CFO HBU HCF
LTITNOK
Figure 17: Median LTI as percentage of base salary
0200400600800
100012001400160018002000
CEO CFO HBU HCF
48%
32%
38%42%
0%
10%
20%
30%
40%
50%
60%
CEO CFO HBU HCF
LTITNOK
28 | EY Norway Executive and Board Remuneration Report 2015

Performance-based LTI►In the years up to and including 2014, the Norwegian state’s regulations for executive remuneration posed restrictions on the LTI of companies with state ownership. According to these regulations stock options are not permitted. The state owned companies has generally implemented a LTI in the form of share grants up to 30% of base salary with a holding period of three years, which have been regarded as fixed remuneration. This has caused less leeway for state-owned companies when it came to the use of performance criteria in their LTI schemes. Meanwhile, companies that do not have state ownership have been including performance measures in their LTI plans to an increasing extent. From 2015, however, the Ministry of Trade and Fisheries has opened up for the use of LTI as variable, performance-based salary for companies with state ownership as well.
Figure 18: Remuneration in state-owned and non-state-owned companies in 2014
Figure 18 illustrates the difference between state-owned and non-state owned companies in terms of LTI levels. The LTI level is consistently lower in state-owned than in non-state- owned companies, with an especially large difference for CEOs. In light of the recent regulatory changes, this difference might be expected to diminish in the years following 2014. It is also important to remember that the total sample comprises five state-owned and nine non-state-owned companies, so it is possible that the differences are largely attributable to characteristics of the companies in this particular sample rather than nation-wide or global tendencies.
No
stat
e ow
ners
hip
Stat
e ow
ners
hip
Total remuneration
Total remuneration
Non-cash
compensation
Fixed remuneration
Fixed remuneration
Variable pay
Variable pay
Non-cash
compensation
T otal direct com
pensation
Total direct com
pensation
Pension Pension
STISTI
LTILTI
Base salary
Base salary
Benefits in kind
Benefits in kind
29EY Norway Executive and Board Remuneration Report 2015 |

►Out of the nine non-state-owned companies, only five (i.e. 55%) responded that their 2014 LTI plans were performance-based. That is, LTI awards in the form of shares are by definition performance-based to some extent as their value reflects the company’s share-price development, but it is possible and increasingly common to include other financial KPIs that determine the degree of vesting as well.
Five companies stated that they use such additional KPIs, and the most common ones were total shareholder return (TSR) and earnings per share (EPS) growth. One company also had a measure of health, safety and environment (HSE) as a KPI criterion in their LTI scheme. Performance periods typically ranged from two to four years.
Moreover, many companies disclosed that they have recently revised or are planning to revise their LTI plans in the near future. Reasons include a desire for better alignment of shareholders’ and executives’ interests, and transitions to more performance-based programs.
Figure 19: Median LTI in state-owned versus non-state-owned companies, 2014
0
1000
2000
3000
4000
CEO CFO HBU HCF
State-owned
Non-state-owned
TNOK
Performance-based LTI was used by 55% of non-state-owned companies in 2014
The most common LTI performance measures were:Total shareholder return (TSR)
Earnings per share (EPS)
30 | EY Norway Executive and Board Remuneration Report 2015

31EY Norway Executive and Board Remuneration Report 2015 |

Board fees: market insights
32 | EY Norway Executive and Board Remuneration Report 2015

Analysis of board fee levels►This section contains analyses of non-executive director (NED) fee policy information. Analyses were undertaken for chairman, NED and employee representatives. Below, the median and average levels for all companies on the OSEBX list are reported, as well as the median and average level for the top 20 and bottom 20 companies.
►As displayed in figure 20, the overall median Chairman fee in 2014 was tNOK 465. In the top 20 the median Chairman fee is notably higher (tNOK 555) than in the bottom 20 (tNOK 400), and the average is over twice as high. The latter finding is due to a small number of companies in the sample with extremely high Chairman fees that increase the average level, and thus the median is a
Number of board members►In order to offer some insight into trends regarding the number of NEDs and Employee representatives on OSEBX boards, the average number of these board members is reported. The number of NEDs on the main board increases slightly in line with market capitalization. The average number of NEDs in the top 20 companies is six compared to four in the bottom 20 companies. The average number of Employee representatives, on the other hand, is lower among the top 20 companies than the bottom 20 companies.
Chairman fee NED base fee Employee representative fee
TotalMedian 465 243 194
Average 465 253 193
Top 20 companiesMedian 555 274 218
Average 882 274 239
Bottom 20 companiesMedian 400 185 96
Average 418 225 105
Figure 20: Chairman, NED and Employee representative board fees (NOK ‘000) 2014
more representative statistic for the overall data. As for NEDs and Employee representatives, the fees are also higher among the top 20 than the bottom 20 companies.
►When comparing the figures with corresponding statistics for 2013, no systematic changes were identified. While there are slight increases and decreases in certain elements between 2014 and 2013, the overall picture remains more or less unchanged.
Figure 21: Number of NEDs and Employee representatives on the main board 2014
Number of NEDs Number of Employee representatives
Total Average 5 3
Top 20 companies Average 6 3
Bottom 20 companies Average 4 4
33EY Norway Executive and Board Remuneration Report 2015 |

Anticipated trends and issues for 2016
34 | EY Norway Executive and Board Remuneration Report 2015
2016: Anticipated trends
Based on the findings and discussions in this report, we expect a number of factors to influence the Norwegian remuneration environment in the coming year and beyond.
In 2015 we have experienced a substantial reduction of the activity in the Norwegian Oil and Gas sector combined with a low oil price, weakening Norwegian Krone and low interest rates. As a result of the discontinuation of the previously positive economic environment, a general stagnation of the growth in remuneration levels may be expected in the Oil and Gas sector, but we also expect stagnation in other sectors. In particular, it seems likely that companies will place greater emphasis on aligning remuneration with financial results. This development may be seen in reductions in the overall annual STI-bonus potentials and/or introductions of more stringent performance criteria. We expect that those companies that do not currently operate a cap on variable salary are likely to introduce one in the near future, and possibly also that existing caps will be tightened where applicable. Furthermore, an increase in transitions from non-performance-based to performance-based LTI schemes seems probable. The global trend of designing LTI plans such that payout is contingent upon several financial performance KPIs is already evident in Norway to some extent. We expect even further increases in this trend in the following years as the shareholders are likely to become more interested in seeing a clear and reasonable link between executive pay and organizational performance.
The increased awareness of performance-and-pay alignment is also likely to apply to state-owned companies from 2015 onwards, after the regulatory changes introduced by the Norwegian Ministry of Trade and Fisheries. With the opportunity to include LTI in the variable-pay segment, companies with state ownership now have more leeway when it comes to making LTI payments performance-based. As reported by the majority of state-owned companies in our LTI survey, such a transition is currently on the agenda.
Another change that affects state-owned companies as of 13 February 2015 is the cessation of pension contributions for salary above 12 times the National Insurance Base amount (mNOK 1,08). All the Norwegian state-owned companies that are surveyed have executives with salaries above this level and company pension plans are common for the C-suit. According to the new regulations, new hired executives should not be included in existing company pension schemes. As a consequence we expect that state-owned companies are required to compensate new hired executives for the lack of company pension schemes in the future. We do not believe that this particular change will necessarily alter the Total Compensation levels but an increase of base salary in combination with LTI awards is anticipated.
As for companies in the Norwegian finance sector, regulations that work to discourage excessive risk-taking are becoming stricter. As of 1 January 2015, a greater number of organizational roles are defined as key- and/or risk-taking personnel than previously, and the regulations posed by the Norwegian Financial Supervisory Authority places further limitations on the variable-pay levels of covered employees. Consequently, a desire among finance institutions to compensate for any reductions in variable bonus payments may be seen in the form of increases in base salaries, which may have an adverse impact on the company financial results.
In conclusion, the Norwegian economy has changed and is changing to a considerable extent, and this somewhat uncertain horizon has implications for executive remuneration design. Companies are well advised to actively use incentive plans as a means to encourage behaviors that help maximize productivity, but in ways that maintain or even reduce current cost. It is more relevant now than ever for companies to focus on getting a better return from their remuneration investment by taking a broader view of reward design and remuneration “worth”. Analytic driven approaches can maximize perceived value as measured by the employees for the same or lower cost to the company. Moreover, as different STI and LTI performance measures support and emphasize different aspects of company performance, companies may balance risk through the use of multiple performance measures. The use of too many performance measures, however, may be sub-optimal in that it can dilute the focus of executives’ attention, which may not result in the best outcomes for shareholders, participants or the company.
By designing executive remuneration schemes that have high quality and relevance, companies may therefore obtain the best possible performance from their executives to help them thrive in the future as well as in the present.
35EY Norway Executive and Board Remuneration Report 2015 |

Who we are
Trond [email protected] +47 908 23 452
Marit BjøraltSenior [email protected] +47 414 27 502
Susanna [email protected] +47 954 14 159
EY | Assurance | Tax | Transactions | Advisory
About EYEY is a global leader in assurance, tax, transaction and advisory services. The insights and quality services we deliver help build trust and confidence in the capital markets and in economies the world over. We develop outstanding leaders who team to deliver on our promises to all of our stakeholders. In so doing, we play a critical role in building a better working world for our people, for our clients and for our communities.
EY refers to the global organization, and may refer to one or more, of the member firms of Ernst & Young Global Limited, each of which is a separate legal entity. Ernst & Young Global Limited, a UK company limited by guarantee, does not provide services to clients. For more information about our organization, please visit ey.com
© 2015 EYGM Limited. All Rights Reserved.
ED None
EY material on this page has been prepared for general informational purposes only and is not intended to be relied upon as accounting, tax, or other professional advice. Please refer to your advisors for specific advice.
ey.com/no
B15044