executive benefi ts survey - hay group benefits survey contents introduction 3 executive retirement...
TRANSCRIPT

Executive Benefi ts Survey Results of the 2011 Executive Retirement Benefi ts & Perquisites Survey
www.haygroup.com
© 2011 Hay Group. All rights reserved. www.haygroup.com
2 Executive Benefits Survey
Contents
Introduction 3
Executive retirement plans 3
Nonqualified deferred compensation programs 6
Executive perquisite prevalence 8
Executive benefits in the future 9
Participant statistics 10
Survey participants 12
© 2011 Hay Group. All rights reserved. www.haygroup.com
3 Executive Benefits Survey
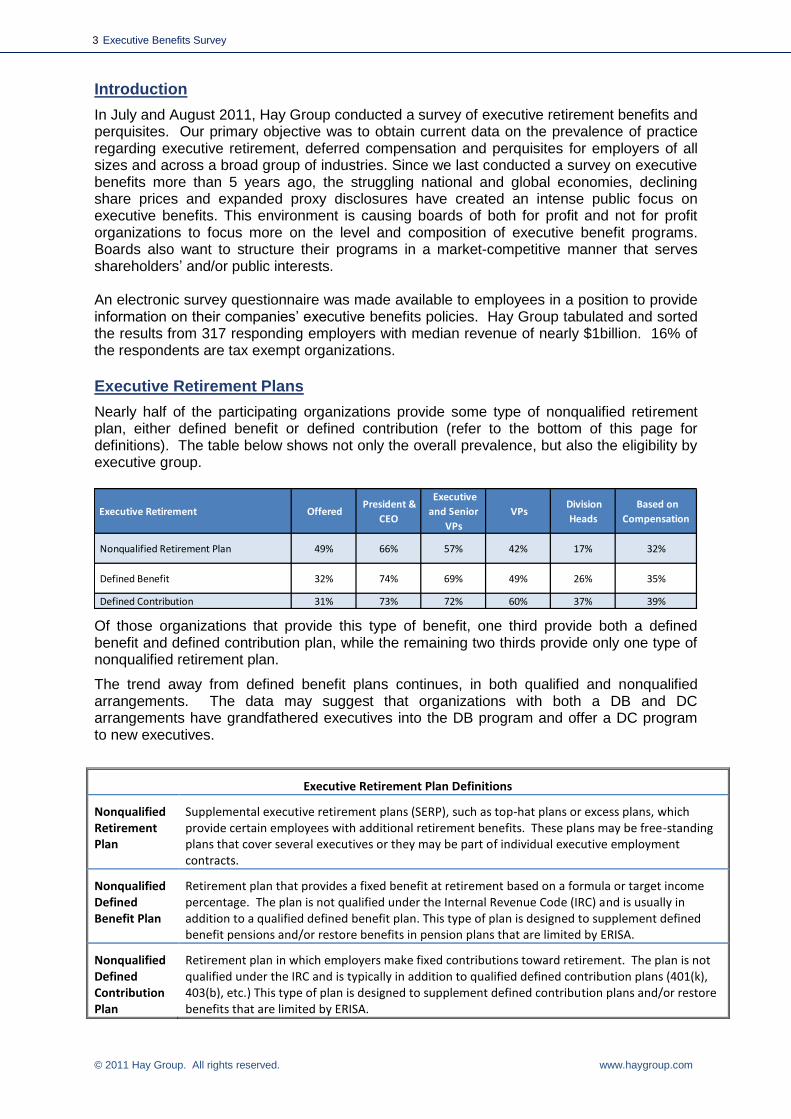
Introduction
In July and August 2011, Hay Group conducted a survey of executive retirement benefits and perquisites. Our primary objective was to obtain current data on the prevalence of practice regarding executive retirement, deferred compensation and perquisites for employers of all sizes and across a broad group of industries. Since we last conducted a survey on executive benefits more than 5 years ago, the struggling national and global economies, declining share prices and expanded proxy disclosures have created an intense public focus on executive benefits. This environment is causing boards of both for profit and not for profit organizations to focus more on the level and composition of executive benefit programs. Boards also want to structure their programs in a market-competitive manner that serves shareholders’ and/or public interests. An electronic survey questionnaire was made available to employees in a position to provide information on their companies’ executive benefits policies. Hay Group tabulated and sorted the results from 317 responding employers with median revenue of nearly $1billion. 16% of the respondents are tax exempt organizations.
Executive Retirement Plans
Nearly half of the participating organizations provide some type of nonqualified retirement plan, either defined benefit or defined contribution (refer to the bottom of this page for definitions). The table below shows not only the overall prevalence, but also the eligibility by executive group.
Executive Retirement Offered President &
CEO
Executive
and Senior
VPs
VPs Division
Heads
Based on
Compensation
Nonqualified Retirement Plan 49% 66% 57% 42% 17% 32%
Defined Benefit 32% 74% 69% 49% 26% 35%
Defined Contribution 31% 73% 72% 60% 37% 39%
Of those organizations that provide this type of benefit, one third provide both a defined benefit and defined contribution plan, while the remaining two thirds provide only one type of nonqualified retirement plan.
The trend away from defined benefit plans continues, in both qualified and nonqualified arrangements. The data may suggest that organizations with both a DB and DC arrangements have grandfathered executives into the DB program and offer a DC program to new executives.
Executive Retirement Plan Definitions
Nonqualified Retirement Plan
Supplemental executive retirement plans (SERP), such as top-hat plans or excess plans, which provide certain employees with additional retirement benefits. These plans may be free-standing plans that cover several executives or they may be part of individual executive employment contracts.
Nonqualified Defined Benefit Plan
Retirement plan that provides a fixed benefit at retirement based on a formula or target income percentage. The plan is not qualified under the Internal Revenue Code (IRC) and is usually in addition to a qualified defined benefit plan. This type of plan is designed to supplement defined benefit pensions and/or restore benefits in pension plans that are limited by ERISA.
Nonqualified Defined Contribution Plan
Retirement plan in which employers make fixed contributions toward retirement. The plan is not qualified under the IRC and is typically in addition to qualified defined contribution plans (401(k), 403(b), etc.) This type of plan is designed to supplement defined contribution plans and/or restore benefits that are limited by ERISA.

© 2011 Hay Group. All rights reserved. www.haygroup.com
4 Executive Benefits Survey
Prevalence of executive retirement plans differs by industry as the graph below illustrates.
59%
50% 47% 45%
32%
20%
0%
10%
20%
30%
40%
50%
60%
70%
Industrial Consumer Goods
Health Care Financial Tax Exempt Services
Pe
rce
nt
Industry
Executive Retirement Plan Prevalence by Industry
Organizations have a variety of reasons for providing a nonqualified retirement plan, as the table below shows.
Executive Retirement Plan
Objective
President
& CEO
Executive and
Senior VPs VPs
Division
Heads
Based on
Compensation
Make up for IRS Limits 74% 77% 71% 55% 32% 38%
Bring retirement income to a target
level 33% 87% 71% 44% 23% 15%
Include deferred compensation 32% 90% 80% 72% 38% 30%
Provide "golden handcuffs" to retain
executives 32% 82% 80% 45% 22% 16%
Recruit mid-career executives 26% 73% 78% 59% 32% 24%
Improve early retirement benefits 12% 79% 74% 47% 26% 26%
Include bonuses not covered in
qualified plans 12% 79% 63% 42% 16% 21%
Provide benefits for executives with
insufficient service 8% 75% 67% 42% 17% 17%
Provide retirement benefits to
executives with no qualifed plan 8% 77% 85% 31% 8% 8%
Maintain benefits from executive's
prior employer 6% 78% 67% 33% 22% 33%
"Keep whole" executive transferring
from subsidiaries or other countries 3% 75% 75% 50% 50% 25%

© 2011 Hay Group. All rights reserved. www.haygroup.com
5 Executive Benefits Survey
DEFINITION OF PAY
The definition of pay in nonqualified retirement plans is most typically base salary plus annual incentives.
Elements of Pay Included
Base Salary 92%
Annual Incentives 75%
Long-term Incentives 18%
Deferred Compensation 41% 52% of organizations with a nonqualified retirement plan have some type of funding in place.
Rabbi trust 72%
Life insurance 23%
Other 11%
Paid out in cash each year without gross-up for taxes 7%
Severance plan 4%
Paid out in cash each year with gross-up for taxes 2%
Secular trust 1%
Not-for-profit stock option plan 1%
Vehicle used to fund or secure plan
Definitions
Rabbi Trust A trust created for the purpose of supporting the non-qualified benefit obligations of employers to their employees. These trusts are sometimes referred to as "grantor trusts". Called a Rabbi trust due to the first initial ruling made by the IRS on behalf of a synagogue, these forms of trusts create security for employees because the assets within the trust are typically outside the control of the employers and are irrevocable.
Secular Trust A variation of the irrevocable Rabbi trust arrangement used with a nonqualified deferred compensation plan. Because the assets in a secular trust are not subject to the claims of creditors, it offers an executive more security than a Rabbi trust.

© 2011 Hay Group. All rights reserved. www.haygroup.com
6 Executive Benefits Survey
Nonqualified Deferred Compensation Programs
This section details the findings of voluntary deferred compensation programs, which may or may not have an employer contribution. Prevalence of deferred compensation programs is 53%, slightly higher than nonqualified retirement plans. Prevalence is also higher at lower executive levels.
Yes 53%
No 39%
Considering 5%
Not Considering 3%
Do you offer a nonqualified deferred
compensation plan to executives?
President & CEO 71%
Executive and Sr. VPs 71%
VPs 63%
Division Heads 43%
Based on compensation 43%
Who is eligible for the plan?
Code Section 409A imposed strict requirements regarding deferral elections, timing of payments and acceleration of payments on nonqualified deferred compensation arrangements. The impact of 409A may account for the relatively static prevalence of these types of arrangements. In addition, the restrictions placed on deferral elections and payment timing may have diminished the attractiveness of these types of programs. Participation in NQDC programs is on average 39%.
The elements of compensation that are eligible to be deferred under NQDC programs are as follows:
Base 89%
STI 79%
LTI - Cash 25%
LTI - Stock 9%
Restricted Stock 7%
What Type of Compensation is Eligible to be Deferred?
Just over one third of organizations are making company contributions to their deferred compensation programs.
Yes 36%
No 64%
Do you match deferrals?

© 2011 Hay Group. All rights reserved. www.haygroup.com
7 Executive Benefits Survey
Separation from service, death and disability top the list of criteria for payment of benefits, while lump sum payments and annual instalments are the most prevalent payment type.
Separation of Service 90% Lump Sum 94%
Death 84% Fixed Annual Installments 62%
Disability 70% Single or J&S Annuity 10%
Change of Control 48% Monthly Installments 10%
Specified Period of Time 45% Other 7%
Hardship 43%
Other 9%
What are the payment options under the NQDC
plan?
What are the criteria for payment of benefits under the
NQDC plan?
The most prevalent basis for crediting interest to participant accounts was found in the “other” category, as more than half the respondents in this category indicated that participants earn a rate of return based on their selected investments. Nearly all of the remaining respondents in this category mirror the return of the 401(k) plan funds, as elected by the participant.
Participant Directed Investments 30%
Stock Index 20%
Mirror 401(k) Plan Investments 17%
Bond Index 16%
Fixed Rate 13%
Treasury Note 11%
Prime Rate 11%
Company Stock 11%
Other 8%
What is the basis for interest crediting on NQDC deferrals?
With regard to funding, 54% of organizations have some type of funding arrangement in place for their NQDC program.
Informally funded 54%
Unfunded 44%
Considering 2%
Rabbi trust 69%
Life insurance 30%
Other 13%
Paid out in cash each year without gross-up for taxes 8%
Secular trust 2%
Not-for-profit stock option plan 0%
Severance plan 0%
Is the NQDC plan funded?
What vehicles are used to fund the NQDC?

© 2011 Hay Group. All rights reserved. www.haygroup.com
8 Executive Benefits Survey
Executive Perquisite Prevalence
The following perquisites are the most prevalent:
Cell phones / Blackberry
Company Car / Car Allowance
Severance Pay
Employment Contracts
Perquisites that show increased prevalence from prior surveys are Executive Physical Examinations and Executive Coaching.
Perquisites that have decreased in prevalence include Executive Medical Reimbursement and Country Club Memberships. Although still prevalent, Employment Contracts have also decreased in prevalence.
Executive Perquisites Offered President &
CEO
Executive and
Senior VPs VPs Division Heads
Based on
Compensation
Cellular Phones 79% 94% 87% 83% 67% 9%
Exec Severance Pay Practice 51% 87% 80% 58% 29% 8%
Employment Contracts 48% 19% 55% 23% 13% 8%
Exec Physical Exams 43% 96% 85% 55% 20% 4%
Golden Parachutes 42% 92% 83% 31% 13% 7%
Exec Parking 39% 95% 83% 56% 27% 1%
Exec Group Life Insurance 37% 88% 80% 57% 22% 10%
Exec LTD 37% 84% 80% 60% 26% 22%
Car Allowance 36% 78% 71% 56% 34% 4%
Average Car Allowance Amount $11,988 $10,921 $10,376 $11,187 $7,667
Personal Financial Counseling/Tax Prep 31% 95% 82% 40% 19% 6%
Company Cars 30% 93% 57% 38% 24% 4%
Home Office Equipment 29% 93% 66% 57% 29% 2%
Exec Vacation Policy 28% 92% 84% 75% 33% 6%
Executive Coaching 26% 92% 80% 52% 29% 5%
Country Club Membership 24% 94% 51% 27% 9% 8%
Company Aircraft - Personal Use 18% 95% 41% 10% 7% 2%
Key Person Life Insurance 18% 93% 56% 36% 15% 11%
Event Tickets or Boxes 16% 92% 71% 55% 35% 10%
Post-Emp Consulting Agreement 15% 63% 67% 41% 28% 15%
Airline Club Membership 15% 93% 67% 41% 20% 4%
Athletic/Fitness Club Membership 14% 93% 75% 64% 34% 11%
Exec Medical Reimbursements 13% 93% 79% 50% 24% 5%
Paid Spouse Travel Expenses 13% 93% 56% 20% 7% 5%
Luncheon Membership 13% 93% 65% 30% 13% 8%
Excess Personal Liability Insurance 11% 89% 83% 60% 29% 6%
Exec Retiree Medical 10% 91% 81% 59% 47% 6%
Chaffeur 10% 90% 27% 10% 3% 7%
Home Security 9% 89% 41% 11% 7% 7%
Apartments/Houses/Suites 8% 71% 50% 13% 4% 4%
Split Dollar Insurance 5% 73% 80% 53% 33% 13%
Exec Dining Room 4% 86% 64% 50% 36% 14%
Personal Legal Services 4% 92% 83% 67% 42% 8%
Sabbatical Leave 3% 88% 88% 88% 75% 13%
Dependent College Tuition 3% 63% 63% 63% 50% 25%
Executive Flex Plan 3% 88% 75% 75% 50% 25%
Average Executive Flex Plan Amount $24,800 $13,500 $6,750 $3,250 $6,000
With regard to tax gross ups of executive perquisites, 82% of respondents do NOT gross up any perquisites for tax purposes. Within the 18% of organizations that do gross up perquisites, car allowance is the most commonly grossed up perquisite.
© 2011 Hay Group. All rights reserved. www.haygroup.com
9 Executive Benefits Survey
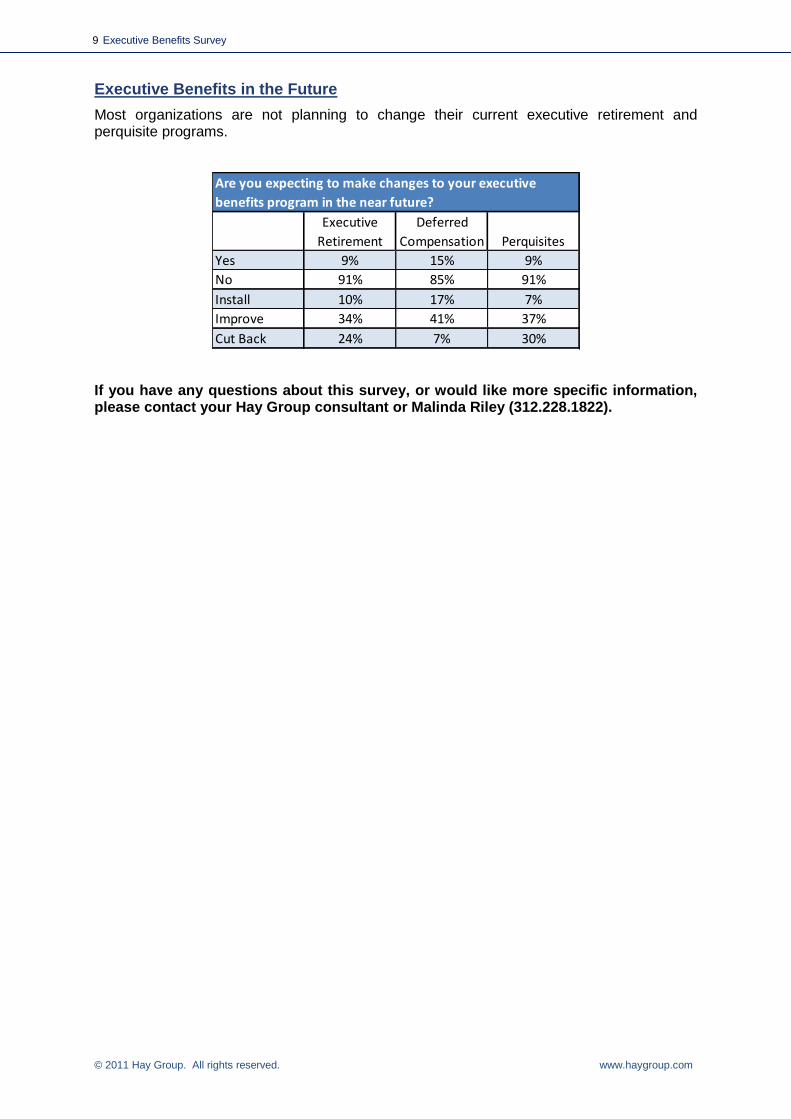
Executive Benefits in the Future
Most organizations are not planning to change their current executive retirement and perquisite programs.
Executive
Retirement
Deferred
Compensation Perquisites
Yes 9% 15% 9%
No 91% 85% 91%
Install 10% 17% 7%
Improve 34% 41% 37%
Cut Back 24% 7% 30%
Are you expecting to make changes to your executive
benefits program in the near future?
If you have any questions about this survey, or would like more specific information, please contact your Hay Group consultant or Malinda Riley (312.228.1822).

© 2011 Hay Group. All rights reserved. www.haygroup.com
10 Executive Benefits Survey
Participant statistics
Data from 317 companies is included in this survey summary. Survey participants came from many industries, with consumer goods, industrial and financial organizations representing the majority of the group.
Industrial, 27%
Services, 22%
Health Care7%
Consumer Goods, 16%
Financial, 19%
2011 Executive Benefit SurveySurvey Partipants by Industry
317 total participants
Survey participants by ownership status
Of the 317 respondents, 16% are tax exempt organizations (public sector or not for profit).
© 2011 Hay Group. All rights reserved. www.haygroup.com
11 Executive Benefits Survey
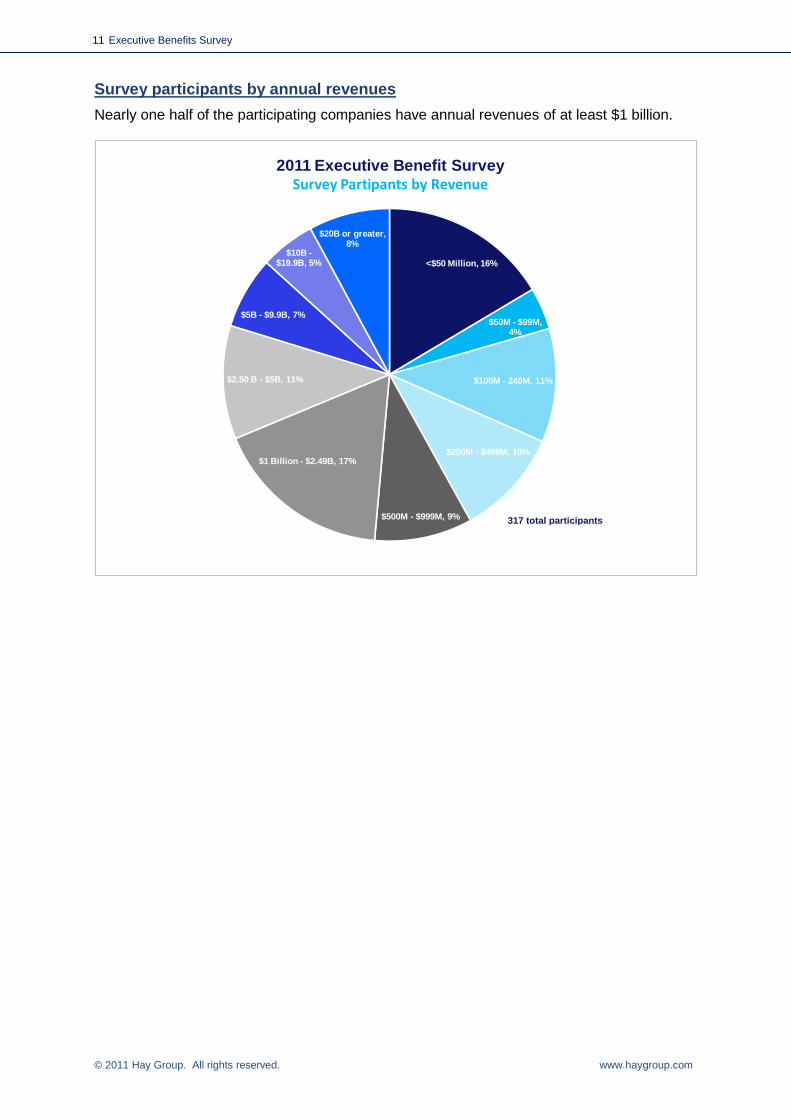
Survey participants by annual revenues
Nearly one half of the participating companies have annual revenues of at least $1 billion.
<$50 Million, 16%
$50M - $99M, 4%
$100M - 249M, 11%
$250M - $499M, 10%
$500M - $999M, 9%
$1 Billion - $2.49B, 17%
$2.50 B - $5B, 11%
$5B - $9.9B, 7%
$10B -$19.9B, 5%
$20B or greater, 8%
2011 Executive Benefit SurveySurvey Partipants by Revenue
317 total participants
© 2011 Hay Group. All rights reserved. www.haygroup.com
12 Executive Benefits Survey
Survey participants (317)*
CONSUMER GOODS (52)
Ace Hardware
Advance Auto Parts
Art Van Furniture
Bunge
Cabelas
Cargill, Incorporated
Carlson Restaurants
Coca-Cola Bottling Co. Consolidated
Collective Brands, Inc.
ConAgra Foods, Inc.
Dollar General Corp
Dr Pepper Snapple Group
DSW Inc.
Finish Line
Flexi Compras Corp
Fossil
Gap Inc.
Haggar Clothing Co.
Hallmark Cards, Inc.
Helzberg Diamonds
Kao Brands Company
La-Z-Boy Incorporated
Limited Brands, Inc.
Limited Stores, LLC
Lowe's Companies, Inc.
MillerCoors
Nordstrom
Oxford Industries Inc
PepsiCo
Pier 1 Imports
PVH Corp.
Russian Standard Vodka USA, Inc.
Sears Holdings Corporation
Shopko Stores
Sonic Automotive, Inc.
Sports Authority
Stage Stores Inc.
Staples Future
Talbots, Inc.
Target Corporation
The Finish Line, Inc.
The Pampered Chef
The Pantry Inc
The TJX Companies, Inc.
Tiffany & Co.
Toyota Motor Sales, U.S.A., Inc
Toys "R" Us
Tupperware Brands Corporation
Tyson Foods, Inc.
ULTA Beauty
Zale Corporation
ZF Group NAO
FINANCIAL (61)
Alfa Mutual Insurance Company
Arkansas Blue Cross Blue Shield
Associated Bank
Babson Capital Management LLC
Blue Cross and Blue Shield of Kansas
Blue Cross Blue Shield of Michigan
Blue Cross Blue Shield of NE
Blue Cross Blue Shield of North Dakota
Boston Mutual Life Ins. Co.
Broadridge Financial Solutions
Capital One
CareFirst BCBS
Chemung Canal Trust Company
Citizens Financial Bank
Colonial Properties Trust
CUNA Mutual Group
Delta Dental of Kansas
Discover Financial Services
Equifax Inc.
FHNC
Fiducial Support Systems, Inc
First Citizens Bank
Florida Business Development Corporation
Fox Chase Bank
FWCJUA
ICW Group
Island Holdings, Inc.
IWIF
Kansas City Life Insurance Company
Lansing Trade Group, LLC
Legg Mason
MidCountry Financial Corp
Missouri Employers Mutual
Montana State Fund
Munich American Reassurance Company
Mutual of Omaha Insurance Co
OneBeacon Insurance
Penn National Insurance
Pinnacol Assurance
Protective Life Corporation
Regency Centers
RenaissanceRe
Ruane Associates Inc
San Antonio Credit Union
Securian Financial Group
State Street Corporation
Texas Mutual Insurance Company
The Ayco Co LP
The Bostonian Group
The Glenmede Trust Company
The PMI Group, Inc.
The Principal Financial Group
The Providence Mutual Fire Insurance Company
TMNA Services, LLC
UMB Bank
UMD
United Fire Group
US Federal Credit Union
Washington Real Estate Inv. Trust
© 2011 Hay Group. All rights reserved. www.haygroup.com
WMayer & Associates
Workforce Safety & Insurance of ND
GOVERNMENT (11)
Bexar County
City of Anaheim
City of El Paso
City of St. Charles
DFW International Airport
Indian Prairie School District 204
Jackson County
Metropolitan Washington Airports Authority
Minnesota Department of Human Services
North Texas Tollway Authority
Town of Greenwich, Municipal Gov’t
HEALTH CARE (20)
American Dietetic Association
Beloit Health System
Burnett Medical Center
CIGNA
CRF Health
Daiichi Sankyo, Inc.
Emblem Health
Endo Pharmaceuticals
H. Lee Moffitt Cancer Center
Hope Network
Hospira, Inc.
Johnson & Johnson
Octapharma Plasma
Pfizer
Santen Inc.
Signature Healthcare
Southwest General Health Center
The Osborn
The Visiting Nurse Association of Texas
Woods Services
INDUSTRIAL (84)
Americas Styrenics
AOC, LLC
Apache Corporation
ARC International
Autoliv ASP, Inc.
Bacardi USA, Inc
Barnes Group Inc.
BNSF Railway Company
BreitBurn Management Company, LLC
Bridgestone Americas
Brunswick Corporation
Caterpillar Inc.
Celanese
Coca-Cola Inc.
COG Operating LLC
Conwed Plastics
Cranston Print Works Company
Curtiss Wright Corporation
Dayton Superior Corp
Delphi Corp
DHI
Dyno Nobel
Ebara International Corp
Elliott Group
Euramax International
Fechheimer Brothers Company
Freescale
FrieslandCampina (Thailand)
G&K Services
GEA WSUS
Glatfelter
Globe Speciality Metals
GROWMARK, Inc.
Haworth, Inc.
Hitachi Canadian Industries Ltd.
Holland 1916
Indiana Packers Corp
Ingersoll Rand
Intermatic, Inc.
IXYS Corp.
Johns Manville
J-W Energy Company
KB Home
Kongsberg Automotive
Lennox International
Link-Belt Construction Equipment
Luitpold Pharmaceuticals
Material Sciences Corp
Mitsui USA
Motorola Solutions
National Fuel Gas Company
Newmont Mining
Nitto Americas Inc.
NOVA Chemicals
OCTAL
Perfetti Van Melle USA
Plains Exploration & Production Company
Procter & Gamble
Puma Energy
Repsol
SABIC IP
Sasol North America Inc.
Snap-on Incorporated
Southco, Inc.
Southern Star Central Gas Pipeline, Inc.
Southwestern Energy Company
Spraylat Corporation
Stepan Company
Teknion Corporation
THAL ENGINEERING
The Hershey Company
TIDI Products LLC
Tomra of North America, Inc
Topcon
Tower International
Treatt USA
TriMas Corporation
Trouw Nutrition USA
United Technologies
Unitil Corporation
URS Energy & Construction
ViewCast Corporation
Wells Enterprise, Inc.
Williams International
© 2011 Hay Group. All rights reserved. www.haygroup.com
NOT FOR PROFIT (9)
American Dental Association
National Cooperative of Health Networks
Association (NCHN)
NRA
Ohio Hospital Association
The Dayton Foundation
The Mind Research Network
The Society for Industrial and Applied Mathematics
(SIAM)
YMCA of Greater Rochester
YMCA of the Greater Tri-Valley
SERVICES (66)
3C
A.S.K. ASSOCIATES, INC.
Accor, North America
ACI Worldwide
Acme Services
American Family Insurance
American Student Assistance
Associated Press
AT&T
AutoNation, Inc
BI-LO, LLC
Brownells Inc
Campero USA
CCIM institute
CenturyLink, Inc
CH2M HILL
CHEP
Corner Bakery Cafe
Cornerstone On Demand
COUNTRY Financial
CSC
David C Cook Publishing
Day & Zimmermann
Delta Air Lines, Inc.
Denny's, Inc.
Design Group Staffing Inc.
DIRECTV
DLT&V Systems Engineering
ECG, Inc.
ES&S
FutureSense, Inc.
Gannett Fleming, Inc
Garden Fresh Restaurant Corp
General Parts International
Glacier Water Services, Inc.
Heat Transfer Research, Inc
ICBC
Interpublic Group of Companies
ipCG
JetBlue Airways
Kamehameha Schools
KBR
Laureate Education
Legal Sea Foods, LLC
LSG Sky Chefs
MRIGlobal
National Judicial College
O'Charley's Inc.
Odfjell
OSG Ship Management, Inc
PSEG
Severn Trent Services
Sprint
Staples
SuperMedia
Technip USA Inc
Texas Guaranteed
The Andersons, Inc
The Minto Group
The New York Times Company
Unisys
University of Alaska
Valere Consulting
VT Services, Inc.
W.W. Grainger, Inc.
Wagner Industries Inc.
UTILITIES/ENERGY (9)
Con Edison
Electric Reliability Council of Texas, Inc. (ERCOT)
Fayetteville Public Works Commission
Hibbing Public Utilities
Idaho Power Company
*Includes 5 undisclosed participants
Hay Group is a global management consulting fi rm that works with leaders to transform strategy into reality. We develop talent, organise people to be more eff ective and motivate them to perform at their best. Our focus is on making change happen and helping people and organisations realise their potential.
We have over 2600 employees working in 84 offi ces in 48 countries. Our clients are from the private, public and not-for-profi t sectors, across every major industry. For more information please contact your local offi ce through www.haygroup.com.
Africa Cape TownJohannesburg Pretoria
Asia Bangkok BeijingHo Chi Minh CityHong KongJakarta Kuala LumpurMumbaiNew Delhi SeoulShanghaiShenzhenSingaporeTokyo
Europe AmsterdamAthens BarcelonaBerlin BilbaoBirminghamBratislavaBrusselsBucharestBudapest Dublin
FrankfurtGlasgowHelsinkiIstanbulKievLilleLisbonLondon MadridManchesterMilanMoscowOsloParisPrague RomeStockholmStrasbourgViennaVilniusWarsaw ZeistZurich
Latin America BogotáBuenos AiresLimaMexico CitySan JoséSantiagoSão Paulo
Middle EastDubaiRiyadhTel Aviv
North America AtlantaBoston CalgaryChicagoDallasEdmontonHalifaxKansas CityLos Angeles MetroMontrealNew York MetroOttawaPhiladelphiaReginaSan FranciscoTorontoVancouverWashington DC Metro
Pacifi c AucklandBrisbaneMelbournePerthSydneyWellington