executive compensation: pay-for-performance in …wps.fep.up.pt/wps/wp517.pdfn. 517 december 2013...
TRANSCRIPT
n. 517 December 2013
ISSN: 0870-8541
Executive Compensation: Pay-for-Performance inHigh-Technology Firms
Paula Faria1
Francisco Vitorino Martins1
Elísio Brandão1
1 FEP-UP, School of Economics and Management, University of Porto
Paula Faria [email protected]
School of Economics and Management, University of Porto
Francisco Vitorino Martins [email protected]
School of Economics and Management, University of Porto
Elísio Brandão [email protected]
School of Economics and Management, University of Porto
Executive Compensation: Pay-for-Performance in High-Technology Firms
Abstract This study examines the relationship between corporate performance and the Chief Executive Officer (CEO) compensation in high-technology firms in the S&P 500. The total short- and long-term CEO compensation in high-technology was compared with other industrial sectors from standard classification codes and tested in terms of corporate performance. The ExecuComp database was used to find the variables and to create a sample of firms between 2004 and 2010. Important corporate performance variables are used in this work, such as assets, employees, sales, net income, and earnings per share (EPS), as reported by the firms for each year. A panel data GLS with a fixed effect model for time is estimated that describes total compensation for the period between 2004 and 2010. The result was aligned with the theory of executive compensations to address agency problems and to examine CEO pay-for-performance. The main objective of this paper is to consistently demonstrate that the performance is determined for the total CEO compensation for short- and long-term periods and to examine whether the total remuneration paid to CEOs in high-technology firms in the S&P 500 is related to corporate finance. This work provides a better understanding of the relationship between compensation and performance in high-technology firms. Results suggest that high-tech firms tend to use more sophisticated performance measurements to determine CEO compensation.
Keywords: corporate finance, CEO compensation, accounting
JEL classification: G30, M52, M41
2
While most management scholars would agree that technological innovation is a key source
for competitive advantage in high-technology firms and that top executives in those firms should
be rewarded accordingly, little is known about which executive pay policies are more appropriate
for those organizations to promote such goals. The high-technology sector plays a pivotal role in
the new economy and has become the major source of employment and productivity growth over
the last years. Innovativeness is also one of the fundamental instruments for growth strategies to
enter new markets and to provide the company with a competitive edge.
The purpose of this study is to investigate the relation between the Chief Executive Officer
(CEO) pay and the value, performance, and behavior of the firms in terms of innovation in
high-technologies. This work will contribute to this subject as it introduces a new measurement
pertaining to the relationship between the CEO and the other members of the top executive team.
Furthermore, this paper studies the relation between this measurement and the performance and
behavior of firms in terms of innovation. For that, this paper will use a new data sample of
high-tech companies in the S&P 500 for the period between 2004 and 2010.
In their paper, entitled “The CEO pay slice”, Bebchuk, Cremers, and Peyer (2011) studied
the relation between the CEO pay slice and the value, performance, and behavior of public firms,
demonstrating a rich set of relations between these aspects. Furthermore, Makri, Lane, and
Gomez-Mejia (2006) reported empirical evidence that high-technology firms that use
outcome-based and behavior-based performance criteria to reward executives exhibit better
market performance than those that do not. Their research on innovation CEO pay linkages in
high-technology firms has focused on aligning pay with the quantity of innovation inputs (R&D
spending) and outputs (number of patents). In fact, authors show the importance of the quality of
innovation outputs. They argue that for CEO pay-performance relations in high-technology firms
these views are not incompatible, but represent two sides of the same coin (Makri, Lane, &
Gomez-Mejia, 2006).
The theory summarizes that executive pay should be designed by the board to maximize
shareholder value. The level and structure of executive pay have already been discussed in the
literature, resulting in three dominant views. One strand of literature studies the
pay-to-performance sensitivity. Jensen and Murphy (1990a) showed that CEO wealth is only
3
weakly related to firm performance. Subsequently, another view provides abundant evidence of a
significant increase in CEO pay in both absolute and relative terms since 1990, which is
consistent with a better alignment of interests between managers and shareholders (Murphy, 1999;
Bebchuk & Fried, 2004; Frydman, 2009). Another important strand of literature explains the
level and the functional form of pay as skimming issues rather than optimal contracting
outcomes.
The inner workings of a top executive team and their importance for firm performance and
innovation are hard to observe or quantify. As previously described, in order to promote firm
growth, sustainable advantage, innovation and performance behavior, the role of the CEO is
fundamental. Furthermore, over the last years, due to the effects of the global financial crisis, the
role of the CEO has been called into question, as well as their behavior and their
pay-compensation as a result of their performance and objectives. Moreover, it is essential to
maintain confidence in the executive for there to be a balance between the institutions that foster
the best conditions for their employees and maximize the profits of their shareholders. For these
reasons, and because this subject is pertinent, it is interesting to examine these issues and
contribute to the enrichment of research in this area.
This study explores the performance determinants of the high-tech and all other CEO pays
for long-term and short-term periods. This work also attempts to examine the systematic
difference in CEO pays and the performance expectations of high-tech firms and others firms.
Furthermore, this paper attempts to examine how high-tech and other CEO pays are related to
various performance measurements, such as assets and employment in their specificity in
high-tech firms, sales growth, operating income before depreciation, net income before
extraordinary items and discontinued operations, and earnings per share (EPS).
This work is organized as follows: Section two contains a revision of the main theories in
the literature, as well as an analysis of executive compensation in order to address agency
problems. Furthermore, this section provides an analysis in order to examine CEO pays for
performance. Section three explains the research hypotheses and section four presents the
methodology, sample, and data collection for the regression estimation, as well as the results of
the econometric model in order to assess the influence that firm performance has on executive
4
compensation. Lastly, the main conclusions are discussed, as well as some limitations and new
perspectives for future research.
Corporate Performance and CEO Compensation
In the period between 1970 and 2005, it was observed that executive compensations
increased tremendously. The underlying reasons for these executive compensations need to be
discussed and analyzed so as to provide a better understanding on this matter as we move into the
future. Much literature on executive compensation has emerged since Jensen and Meckling (1976)
published their work. According to Jensen and Murphy (1990b):
There are serious problems with CEO compensation, but “excessive” pay is not the
biggest issue. The relentless focus on how much CEOs are paid diverts public attention
from the real problem—how CEOs are paid. In most publicly held companies, the
compensation of top executives is virtually independent of performance. (pp 138)
Executive Compensations to Address Agency Problems
The emergence and general acceptance of the agency theory and the parallel research on
executive compensation began in the early 1980s. It was the evolution of the modern corporation
with ownership separation and control that undermined the agency theory. Early studies in this
area focused on documenting the relation between CEO pay and company performance.
The problem of managerial power is analyzed in modern finance as an agency problem. The
discussion of executive compensation must proceed with the fundamental agency problem
afflicting management decision-making as background. According to Jensen and Murphy
(1990a), there are two approaches to agency problems. The authors state that there is an optimal
contracting approach, which is when boards use design compensation schemes to maximize
shareholder value with efficient incentives. To connect the agency problem and the executive
compensation, the authors use the managerial power approach, when this connection is seen as an
integral part of the agency problems. It is important to remember that the principal-agent
problems treat the difficulties that arise under conditions where information is incomplete and
asymmetric whenever a principal hires an agent (Jensen & Murphy, 1990a). The agency theory is
directed as an agency relationship between principal and agent in which one part—the
5
principal—delegates work to another—the agent—, who performs that work. It is created at any
company that is not owned by its manager. This theory may be summarized as having two
problems: firstly, the agency problems arise when the desires or goals of the principal and agent
are conflicting and when it is difficult or expensive for the principle to verify what the agent is
doing; the second is the problem of risk sharing that arises when the principal and agent have
different attitudes towards risk. Maybe the agent and the principal prefer different actions and
different risk choices. Jensen and Meckling (1976) suggested that the agents of a company have
the tendency to expropriate from the company because the benefits are higher than the cost as
such costs are shared or undertaken by various shareholders. Therefore, there should be a balance,
and both parties’ participation constraints should be satisfied. According to them, the agency
problem existed in all organizations and cooperatives, including universities (Jensen & Meckling
1976). The agency problem is a classic problem in corporate governance as a result to motivate
executives to do what is best for their company when they themselves do not own the company.
It is necessary to anticipate the agency problem as because of it company investors may try to
specify how the manager should act. Furthermore, it is necessary to analyze this problem because
the owner may not be able to predict the business and may not know the best action for their
manager (Shleifer & Vishny, 1996). The contracts signed between shareholders and managers are
usually general, specifying broad goals and the division of profits. These contracts do not specify
how managers should behave in specific business situations.
Some authors see the weakness of shareholder rights more generally and warn shareholders
and their advisers to focus on the corporate governance provisions that really matter for the
firm’s value (Bebchuk, Cohen, & Ferrell, 2009; Cremers & Nair, 2005). To help solve the
apparent theoretical paradox in agency predictions on the normative consequences of
performance-based pay, it is possible to create a common fate for the principal and the agent, or
to make the agent overly conservative. The agency theory has been the foundation for both
positive and negative answers to the key question: Does incentive compensation help
high-technology firms attain higher subsequent performance levels (Makri, Lane, &
Gomez-Mejia, 2006)?
Some authors assume CEOs to be more powerful when they serve as chair of the board,
6
when they are the only member of the board, and when they have the status of a founder (Adams,
Almeida, & Ferreira, 2005).
Examining CEO Pay-for-Performance
For Murphy (1999), the components of CEO pay are substantially heterogeneous in pay
practices across firms and industries. Most executive pay packages contain four basic
components: a base salary, an annual bonus linked to accounting performance, stock options, and
long-term incentive plans. Moreover, executives participate in employee benefit plans and also
receive special benefits, such as life insurance and supplemental executive retirement plans.
Today the packages of most CEO compensations have many components, which include payouts
for long-run incentive plans, restrict option grants and restrict stock grants, pension plans, various
perquisites and, in some cases, severance payments. Perquisites, pensions, and severance pay are
important, and yet less understood components (Frydman & Jenter, 2010; Jensen & Murphy,
1990a). It is difficult to obtain information on these components because of insufficient
disclosure. Some authors suggest that the perks may be a signal of weak corporate governance,
particularly when firms find ways to conceal the re-porting of perks (Grinstein, Weinbaum, &
Yehuda, 2011). For pensions, the evidence is similar to that of the perquisites (Sundaram &
Yermack, 2007). Executives pay substantial attention to the salary-determination process because
salaries comprise a declining percentage of total compensation. Base salaries are key components
of executive employment contracts and represent the fixed component in executive contracts.
Executives will naturally prefer a dollar increase in base salary to a dollar increase in target bonus
or variable compensation, and so the target bonuses, for example, are typically expressed as a
percentage of base salary. Each dollar increase in the base salary has positive implications on
many other compensation components. Most compensation components are measured relatively
to base salary levels, for example, the option grants are expressed as a multiple of base salary.
In the 1980s and 1990s, there was a steady increase in stock option grants within executive
compensation, which on a Black-Scholes basis now constitutes the single largest component of
CEO pay. Stock options are contracts which give the recipient the right to buy a share of stock at
a pre-specified exercise price for a pre-specified term. In other words, the recipient has the option
to buy a certain number of company shares for a specified price. Therefore, there is a direct link
7
between managerial rewards and share-price appreciation. The incentives from stock options do
not, however, mimic the incentives from stock ownership because only stock-price appreciation
is rewarded, as opposed to total shareholder returns. Therefore, the value of options increases
with stock-price volatility. Other reason for this is that the options lose incentive value once the
stock price falls sufficiently below the exercise price.
The literature focuses on equity-based compensation paid in the form of restricted stocks,
stock options, and other instruments whose value is tied to future equity returns. Equity-based
compensation is widely documented in the research examining pay versus performance (Jensen
& Meckling, 1976). Murphy (2003) and Jensen (2004) stated that the increase in stock options
pay is the result of the boards’ inability to evaluate the true cost of this form of compensation.
The controversy over CEO compensation reflects a perception that CEOs effectively set their
own pay levels. In most companies, the last decisions over executive pay are made by members
outside the board of directors who are keenly aware of the conflicts of interest between managers
and shareholders over the level of pay. However, the CEOs and other top managers exert at least
some influence on the level and on the structure of their pay (Jensen & Murphy, 1990a; Murphy,
1999).
In the substantial heterogeneity across companies and industries, executive bonus plans can
be categorized in terms of three basic components: performance measurements, performance
standards, and the structure of the pay-performance relation. Hall and Liebman (1998) showed
that CEOs are, in fact, not paid like bureaucrats, but that there is a strong relationship between
firm performance and CEO compensation. The annual bonus contracts are characterized by
discretion. In some firms, boards can use discretion while allocating a fixed bonus, but discretion
in this case only affects individual allocations and not the overall amount of the executive
payouts. A percentage of their bonus depends on individual performance. Nevertheless, this is a
subjective issue because individual performance sometimes includes performance pertaining to
some pre-determined objectives or strategic mile-stones. Often the non-financial performance
measurement used in annual incentive plans is individual performance with performance
measured relatively to pre-established objectives, as well as subjective assessments of individual
performance. Other non-financial measurements include customer satisfaction, operational and
8
strategic objectives.
Some research highlights the importance of debt-based compensation as an element of top
management contracts, and also the underlying incentive and governance implications of these
schemes. Debt-base compensation provides managers with research that includes interesting
incentives to reduce the agency cost or debt. Inside debt in the form of pensions also exerts strong
influence on the patterns of CEO turnover and other types of compensation (Sundaram &
Yermack, 2007). All this research is based on the assumption that managerial compensations
consist of only two components, cash and equity-linked instruments. These authors argue that top
managers receive significant compensations from “inside debt” that are pensions and deferred
compensations.
In recent years, the use of restricted stock has been increasing due to a combination of
reasons. Firstly, a compelling advantage held by stock options was eliminated as companies were
required to recognize a charge to earnings on fixed option grants at fair market value. Secondly,
publicly traded companies became concerned about the excessive dilution that resulted when the
majority of long-term incentives were granted in options. Restricted stock plans offer companies
much more design flexibility. Restricted stocks can be criticized mainly because of the dividend
equivalents which have to be paid on these stocks prior to the vesting of the stocks. Some authors
draw attention to the complete elimination of dividend equivalents, while others insist on its
continued use as a way to align the interests of management and shareholders in order to solve
agency problems.
EPS (Epstein & Roy, 2005) are a popular performance metric used in executive
compensation contracts (Murphy, 1999; Conyon et al., 2000). Compensation contracts that tie
managerial rewards to EPS create explicit incentives for executives to manage the EPS
denominator using stock repurchases (over and above any implicit market-based incentives
associated with increasing stock-based wealth and improving job security). However, these direct
incentives are still absent in compensation contracts that employ non-per-share-based earning
metrics, such as return on assets, and non-accounting measurements, such as stock price or
qualitative targets linked to personal objectives. Accordingly, the stock repurchases activity will
be positively associated with the incidence of EPS-based performance conditions in executive
9
compensation contracts (Core, Guay, & Verrecchia, 2003; Young & Jing, 2011). The author
argues that the level of dividend payments and the choice between dividends and stock are
sensitive to the executives’ compensation arrangements. Furthermore, a statistically and
economically strong link between stock repurchase activity and the presence of EPS performance
conditions in executive compensation contracts is documented.
For Murphy (1999), the levels of pay are higher and pay-performance sensitivities are lower
in larger firms. However, the levels of pay and pay-performance sensitivities are lower in
regulated utilities than in industrial firms. With that analysis, it was also possible to understand
that pay-performance sensitivities are driven primarily by stock options and stock ownership, and
not by other forms of compensation.
Bebchuk and Fried (2004) advocated that managerial power has played a key role in shaping
managers’ pay arrangements. The pervasive role of managerial power can largely explain the
contemporary landscape of executive compensation. The managers’ influence over their own pay
has been the focal point of the criticism on executive compensation in the media and by some
shareholders. They argue, with supporting evidence, that when executives have more power, their
pay is higher and less sensitive to performance. In their opinion, executive pay is much less
sensitive to performance than has been commonly acknowledged (Bebchuk & Fried, 2004).
Other authors study the opportunistic timing of option grants and their relation to firm
governance and structure (Berger, Ofek, & Yermack, 1997; Bebchuk, Cremers, & Peyer, 2011;
Bebchuk, Grinstein, & Peyer, 2010). Malmendier and Tate (2009), Bertrand and Schoar (2003)
study how the type and style of a CEO affect the firm’s outcomes. For that, the authors analyzed
the CEOs’ roles in achieving superstar status to the performance of their firms, and whether and
how individual managers are affected by corporate behavior and by performance (Malmendier &
Tate, 2009; Bertrand & Schoar, 2003). When other sectors were compared, it was possible to
confirm that the success of high-tech firms depends more on managing intangible assets. Some of
these assets were technology innovation, continuous improvement, software development, and
knowledge-based management. High-tech firms must continuously innovate to survive and to
sustain their firms’ growth (Shim, Lee, & Joo, 2009).
In summary, it was found that firms are subjected to the agency problem in which the CEO
10
(agent) may not work in favor of the shareholders (principal) to maximize their wealth by
improving firm performance. The decisions related to CEO compensation are based on the firms’
accounting and finance performance. Therefore, it is theorized that CEO compensation in the
function of firm performance in the high-technology with this variables; Total assets (ASSETS),
employees (EMPL), changes in sales (SALECHG), operating income before depreciation (OIBD),
net income before extraordinary items and discontinued operation (NIBEX), earning per share
(EPSEX), presented above.
Research Hypotheses
As previously discussed, existing theories provide predictions on the outlined considerations
related to firm value, allowing for two different selection hypotheses.
The first research question will be:
Hypothesis 1: The CEO compensation is positively correlated with firm performance for
high-technology companies in the short-term.
Rejection of the null hypothesis would mean that the relative weight in terms of total
compensation of each compensation component (such as salary, bonus, stock options and other
compensations) are different goals for executives, as opposed to performance in the short-term. It
might be argued that powerful incentive models are especially valuable for high value firms with
high opportunities for growth that need to be decisively and vigorously pursued. It might also be
that high value firms are especially likely to attract star CEOs.
Hypothesis 2: The CEO compensation is positively correlated with firm performance in
high-technology companies in the long-term.
It is possible that high value firms have CEOs with an interest in long-term performance and
with obtaining personal benefits in terms of total compensation.
Methodology, Sample, and Data Collection
The chosen sample is the ExecuComp database, which was used to find the variables and to
create a sample of firms between 2004 and 2010. The ExecuComp database provides yearly data
on salary, bonus, stock option, and restricted stock grants, as well as managerial stock and option
holdings for top executives in firms within the Standard & Poor’s Index (S&P 500). To test this
11
hypothesis, the following specification is run of the balanced panel of high-technology firms,
between 2004 and 2010. High-Technology firms are the firms that operate in an industry with a
four-digit SIC code of 3570, 3571, 3572, 3576, 3577, 3661, 3674, 4812, 4813, 5045, 5961, 7370,
7371, 7372, or 7373, using the Fama and French classification of 48 industry groups, instead of
four-digit SIC (Standard Industrial Classification) codes (Fama & French, 1997).
According to Bebchuk et al. (2011), in order to test the variables and to assess the
above-mentioned research hypotheses there are independent variables that will possibly be used by
the regression model to perform the estimation. At an empirical level, this analysis focuses on a
sample of 500 high-tech companies in the S&P index (S&P500), for the period between 2004 and
2010, which constitutes a sample of 3,356 observations. The ExecuComp database collects
information about seven independent variables—total assets (ASSETS), employees (EMPL),
changes in sales (SALECHG), operating income before depreciation (OIBD), net income before
extraordinary items and discontinued operation (NIBEX), earning per share (EPSEX)—and the
independent total compensation (SUMTDC1) variables are listed by year and company.
Several measurements were used as control variables in this study. These include number of
employees, assets, increase in sales, the net income, and the EPS, as a proxy of firm size, firm
performance and wealth of shareholder, the common predictors of executives’ pay.
The High-Tech Dummy (DHTECH) is equal to one if the firm operates in an industry with a
four-digit SIC code of 3570, 3571, 3572, 3576, 3577, 3661, 3674, 4812, 4813, 5045, 5961, 7370,
7371, 7372, or 7373, instead of four-digit SIC codes. The main variable of the analysis is
SUMTDC1 and it is defined by the sum of the total compensations of the top executives in each
company and it includes: salary, bonus, non-equity incentive plan compensation, grant-date fair
value of option awards, grant-date fair value of stock awards, deferred compensation earnings
reported as compensation, and other compensations.
Table 1
Executive Compensation Dependent and Independent Variables
Name Expected variation
Definition Units
Ln (SUMTDC1)
(+) Ln (the sum of the compensations of top executives includes: salary, bonus, non-equity incentive plan compensation, grant-date fair value of option awards, grant-date fair value of stock awards, deferred compensation earnings reported as compensation, and other
Thousands
12
compensations).
Ln (ASSETS) (+) Ln (the total assets as reported by the company). Millions
Ln (EMPL) (+) Ln (employees, the total employees as reported by the company (#)). Thousands
EPSEX (-) EPS (Primary) excluding extraordinary items and discontinued operations.
SALECHG (+) The year to year percentage change in Sales. Percentage
Ln (OIBD) (+) Ln (the operating income before depreciation as reported by the company). Millions
Ln (NIBEX) (+) Ln (the net income before extraordinary items and discontinued operations). Millions
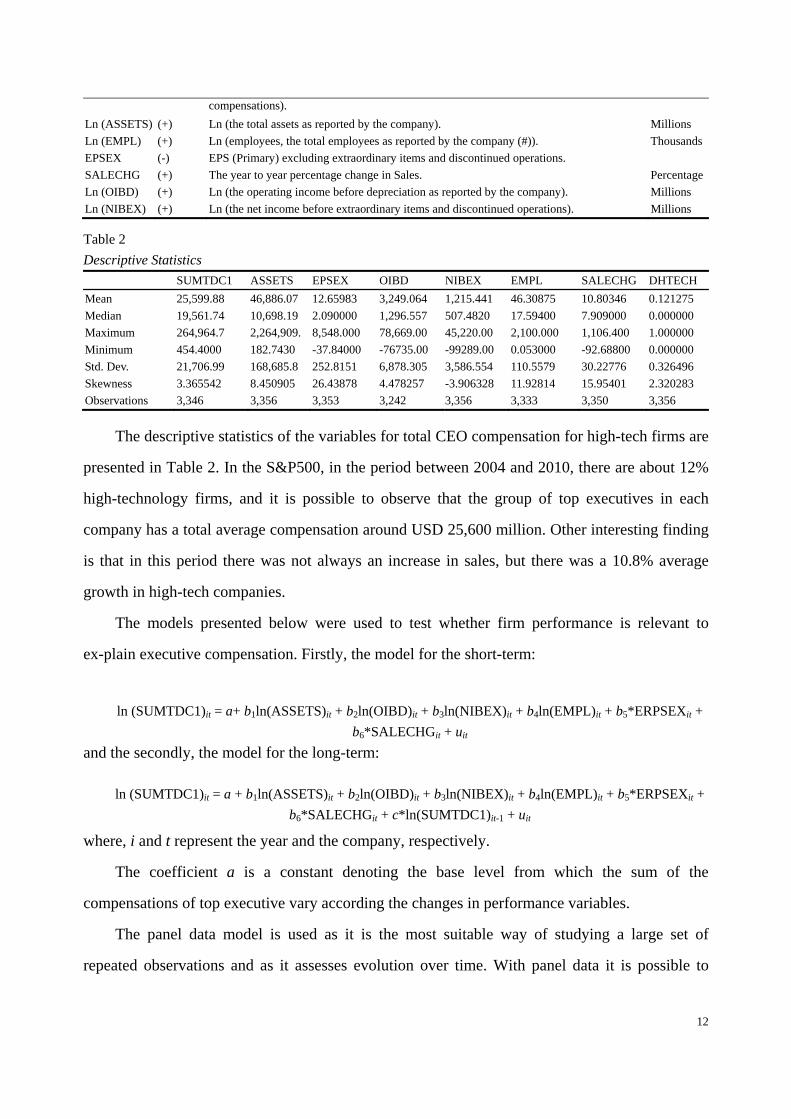
Table 2
Descriptive Statistics
SUMTDC1 ASSETS EPSEX OIBD NIBEX EMPL SALECHG DHTECH
Mean 25,599.88 46,886.07 12.65983 3,249.064 1,215.441 46.30875 10.80346 0.121275
Median 19,561.74 10,698.19 2.090000 1,296.557 507.4820 17.59400 7.909000 0.000000
Maximum 264,964.7 2,264,909. 8,548.000 78,669.00 45,220.00 2,100.000 1,106.400 1.000000
Minimum 454.4000 182.7430 -37.84000 -76735.00 -99289.00 0.053000 -92.68800 0.000000
Std. Dev. 21,706.99 168,685.8 252.8151 6,878.305 3,586.554 110.5579 30.22776 0.326496
Skewness 3.365542 8.450905 26.43878 4.478257 -3.906328 11.92814 15.95401 2.320283
Observations 3,346 3,356 3,353 3,242 3,356 3,333 3,350 3,356
The descriptive statistics of the variables for total CEO compensation for high-tech firms are
presented in Table 2. In the S&P500, in the period between 2004 and 2010, there are about 12%
high-technology firms, and it is possible to observe that the group of top executives in each
company has a total average compensation around USD 25,600 million. Other interesting finding
is that in this period there was not always an increase in sales, but there was a 10.8% average
growth in high-tech companies.
The models presented below were used to test whether firm performance is relevant to
ex-plain executive compensation. Firstly, the model for the short-term:
ln (SUMTDC1)it = a+ b1ln(ASSETS)it + b2ln(OIBD)it + b3ln(NIBEX)it + b4ln(EMPL)it + b5*ERPSEXit +
b6*SALECHGit + uit
and the secondly, the model for the long-term: ln (SUMTDC1)it = a + b1ln(ASSETS)it + b2ln(OIBD)it + b3ln(NIBEX)it + b4ln(EMPL)it + b5*ERPSEXit +
b6*SALECHGit + c*ln(SUMTDC1)it-1 + uit
where, i and t represent the year and the company, respectively.
The coefficient a is a constant denoting the base level from which the sum of the
compensations of top executive vary according the changes in performance variables.
The panel data model is used as it is the most suitable way of studying a large set of
repeated observations and as it assesses evolution over time. With panel data it is possible to
13
simultaneously explore several variations over time and between different individuals. The use of
such models has increased immensely and, in fact, combining time and cross-sectional data
brings many advantages: it is possible to use a larger number of observations and the degree of
freedom in estimates increases, thus making statistical inferences more credible. At the same time,
the risk of multicollinearity is reduced since the data in companies present different structures.
Moreover, this model provides access to further information and the efficiency and stability of
the estimators increase, while enabling the introduction of dynamic adjustments (Greene William,
2003; Gujarati, 2004).
The regression presented was estimated using the Generalized Least Squares (GLS) with a
fixed effect model for time. This means that the regression coefficients which were used with the
fixed effect model for explanatory variables do not vary over time. The estimation was conducted
assuming that the company’s heterogeneity is captured in the constant part and that it differs
between companies. The fixed effect model is the most suitable when there is a correlation
between errors and variables (Greene, William, 2003).
In order to assess the above-mentioned research hypotheses, the regression model was used
and estimated with fixed effects. The first hypothesis for the positive influence of the CEO
compensation in firm performance is presented in Table 3. As it is possible to observe, the
regressions are globally significant, with a 5% significance level. The following table presents
the results of the estimation conducted by the generalized method using the fixed effect model for
the studied data. The statistics are computed based on a panel data set of 484 firm-year
observations, a total of about 2,969 companies that represent 14.08% of high-technology firms
between 2004 and 2010. The total assets, the operating income before depreciation and the net
income before extraordinary items and discontinued operations, the growth sales and
employment, as reported by companies, are positive (see table 1 – expected variation) and
significantly related to total executive compensations.
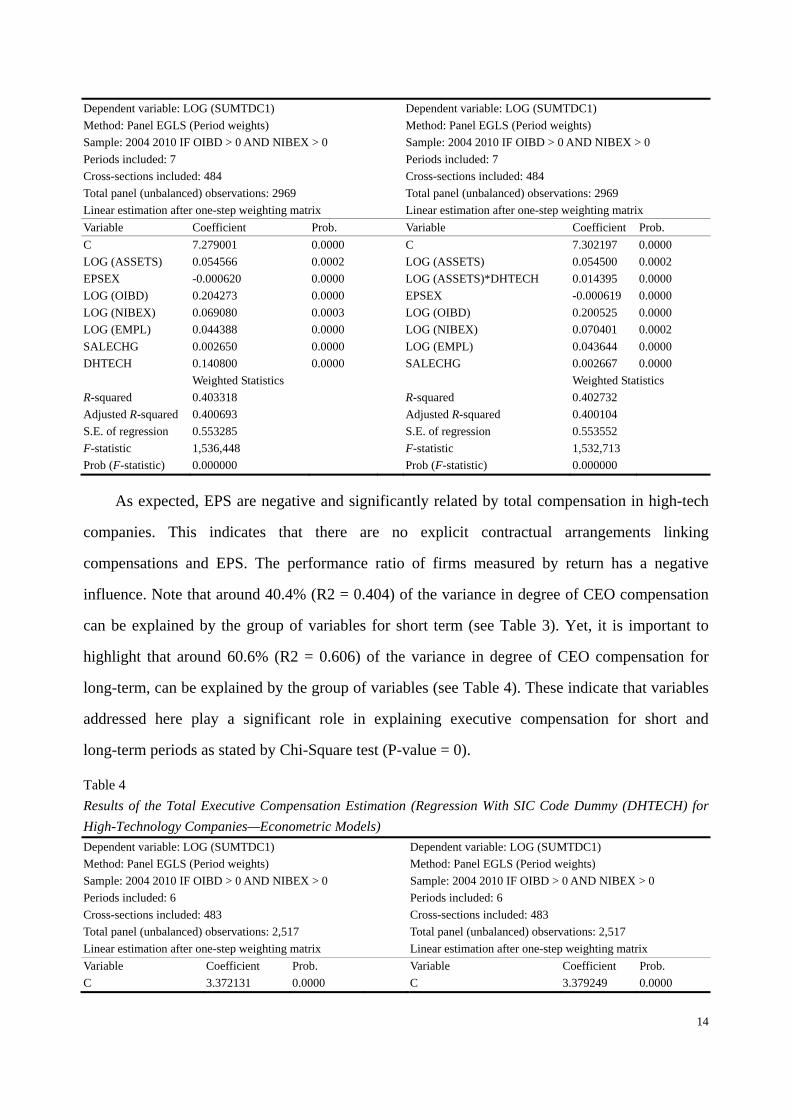
Table 3
Results of the Total Executive Compensation Estimation (Regression With SIC Code Dummy (DHTECH) for
High-Technology Companies—Econometric Models)
14
Dependent variable: LOG (SUMTDC1) Dependent variable: LOG (SUMTDC1)
Method: Panel EGLS (Period weights) Method: Panel EGLS (Period weights)
Sample: 2004 2010 IF OIBD > 0 AND NIBEX > 0 Sample: 2004 2010 IF OIBD > 0 AND NIBEX > 0
Periods included: 7 Periods included: 7
Cross-sections included: 484 Cross-sections included: 484
Total panel (unbalanced) observations: 2969 Total panel (unbalanced) observations: 2969
Linear estimation after one-step weighting matrix Linear estimation after one-step weighting matrix
Variable Coefficient Prob. Variable Coefficient Prob.
C 7.279001 0.0000 C 7.302197 0.0000
LOG (ASSETS) 0.054566 0.0002 LOG (ASSETS) 0.054500 0.0002
EPSEX -0.000620 0.0000 LOG (ASSETS)*DHTECH 0.014395 0.0000
LOG (OIBD) 0.204273 0.0000 EPSEX -0.000619 0.0000
LOG (NIBEX) 0.069080 0.0003 LOG (OIBD) 0.200525 0.0000
LOG (EMPL) 0.044388 0.0000 LOG (NIBEX) 0.070401 0.0002
SALECHG 0.002650 0.0000 LOG (EMPL) 0.043644 0.0000
DHTECH 0.140800 0.0000 SALECHG 0.002667 0.0000
Weighted Statistics Weighted Statistics
R-squared 0.403318 R-squared 0.402732
Adjusted R-squared 0.400693 Adjusted R-squared 0.400104
S.E. of regression 0.553285 S.E. of regression 0.553552
F-statistic 1,536,448 F-statistic 1,532,713
Prob (F-statistic) 0.000000 Prob (F-statistic) 0.000000
As expected, EPS are negative and significantly related by total compensation in high-tech
companies. This indicates that there are no explicit contractual arrangements linking
compensations and EPS. The performance ratio of firms measured by return has a negative
influence. Note that around 40.4% (R2 = 0.404) of the variance in degree of CEO compensation
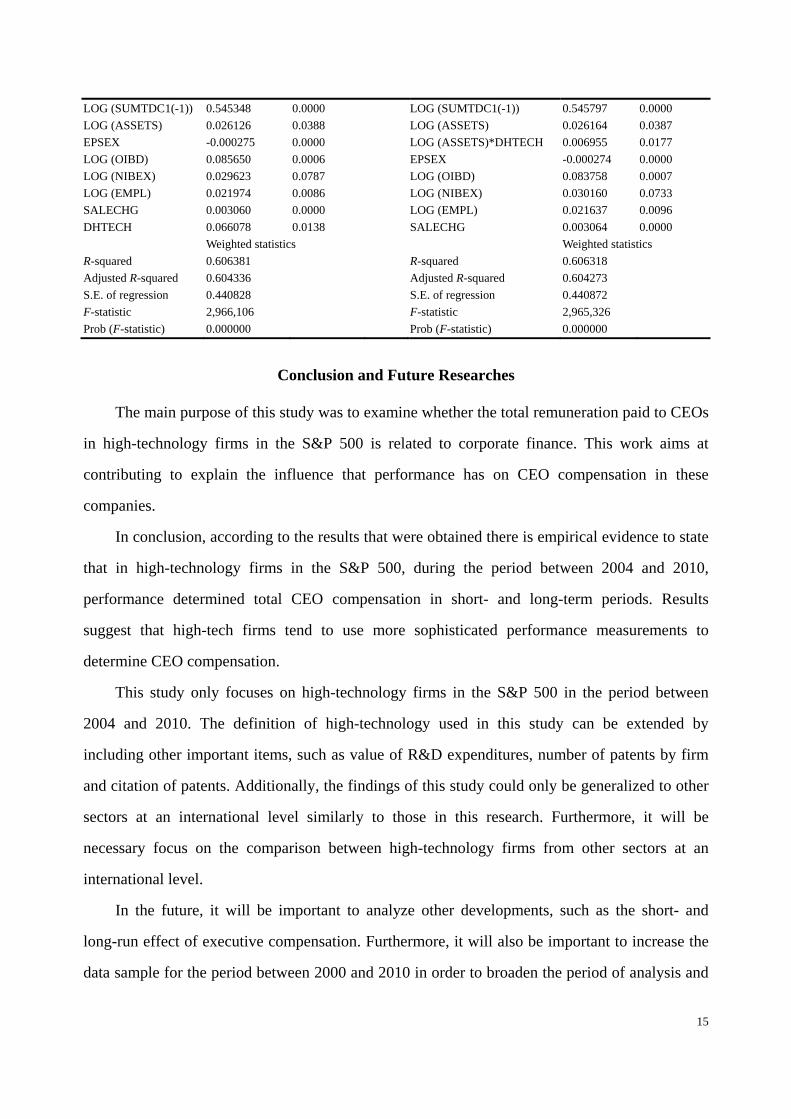
can be explained by the group of variables for short term (see Table 3). Yet, it is important to
highlight that around 60.6% (R2 = 0.606) of the variance in degree of CEO compensation for
long-term, can be explained by the group of variables (see Table 4). These indicate that variables
addressed here play a significant role in explaining executive compensation for short and
long-term periods as stated by Chi-Square test (P-value = 0).
Table 4
Results of the Total Executive Compensation Estimation (Regression With SIC Code Dummy (DHTECH) for
High-Technology Companies—Econometric Models)
Dependent variable: LOG (SUMTDC1) Dependent variable: LOG (SUMTDC1)
Method: Panel EGLS (Period weights) Method: Panel EGLS (Period weights)
Sample: 2004 2010 IF OIBD > 0 AND NIBEX > 0 Sample: 2004 2010 IF OIBD > 0 AND NIBEX > 0
Periods included: 6 Periods included: 6
Cross-sections included: 483 Cross-sections included: 483
Total panel (unbalanced) observations: 2,517 Total panel (unbalanced) observations: 2,517
Linear estimation after one-step weighting matrix Linear estimation after one-step weighting matrix
Variable Coefficient Prob. Variable Coefficient Prob.
C 3.372131 0.0000 C 3.379249 0.0000
15
LOG (SUMTDC1(-1)) 0.545348 0.0000 LOG (SUMTDC1(-1)) 0.545797 0.0000
LOG (ASSETS) 0.026126 0.0388 LOG (ASSETS) 0.026164 0.0387
EPSEX -0.000275 0.0000 LOG (ASSETS)*DHTECH 0.006955 0.0177
LOG (OIBD) 0.085650 0.0006 EPSEX -0.000274 0.0000
LOG (NIBEX) 0.029623 0.0787 LOG (OIBD) 0.083758 0.0007
LOG (EMPL) 0.021974 0.0086 LOG (NIBEX) 0.030160 0.0733
SALECHG 0.003060 0.0000 LOG (EMPL) 0.021637 0.0096
DHTECH 0.066078 0.0138 SALECHG 0.003064 0.0000
Weighted statistics Weighted statistics
R-squared 0.606381 R-squared 0.606318
Adjusted R-squared 0.604336 Adjusted R-squared 0.604273
S.E. of regression 0.440828 S.E. of regression 0.440872
F-statistic 2,966,106 F-statistic 2,965,326
Prob (F-statistic) 0.000000 Prob (F-statistic) 0.000000
Conclusion and Future Researches
The main purpose of this study was to examine whether the total remuneration paid to CEOs
in high-technology firms in the S&P 500 is related to corporate finance. This work aims at
contributing to explain the influence that performance has on CEO compensation in these
companies.
In conclusion, according to the results that were obtained there is empirical evidence to state
that in high-technology firms in the S&P 500, during the period between 2004 and 2010,
performance determined total CEO compensation in short- and long-term periods. Results
suggest that high-tech firms tend to use more sophisticated performance measurements to
determine CEO compensation.
This study only focuses on high-technology firms in the S&P 500 in the period between
2004 and 2010. The definition of high-technology used in this study can be extended by
including other important items, such as value of R&D expenditures, number of patents by firm
and citation of patents. Additionally, the findings of this study could only be generalized to other
sectors at an international level similarly to those in this research. Furthermore, it will be
necessary focus on the comparison between high-technology firms from other sectors at an
international level.
In the future, it will be important to analyze other developments, such as the short- and
long-run effect of executive compensation. Furthermore, it will also be important to increase the
data sample for the period between 2000 and 2010 in order to broaden the period of analysis and
16
to investigate the effect of the financial crisis in 2008.
Innovation constitutes an indispensable component of corporate strategies. For that, further
considerations on innovation measurements may be incorporated in order to analyze the real
motivation of the CEO. Further developments on this work will include new variables for the
other research hypotheses, including returns to measure firm performance, firm expenditures on
research and development, number of patents granted, and degree of openness. These variables
and others may be the best proxies to measure the behavior of innovation and the link between
executive compensation and firm performance. This paper will provide better understanding on
the relationship between compensation and performance in high-technology firms, something
which is often discussed in the literature.
References
Adams, R. B., Almeida, H., & Ferreira, D. (2005). Powerful CEOs and their impact on corporate
performance. Review of Financial Studies, 18(4), 1403-1432.
Bebchuk, L. A., & Fried, J. M. (2004). Pay without performance: The unfulfilled promise of
executive compensation. Cambridge, M.A.: Harvard University Press.
Bebchuk, L. A., Cremers, M., & Peyer, U. (2011). The CEO pay slice. Journal of Financial
Economics, 102, 199-221.
Bebchuk, L. A., Grinstein, Y., & Peyer, U. R. S. (2010). Lucky CEOs and lucky directors. The
Journal of Finance, 65(6), 2363-2401.
Bebchuk, L., Cohen, A., & Ferrell, A. (2009). What matters in corporate governance?. Review of
Financial Studies, 22(2), 783-827.
Berger, P. G., Ofek, E., & Yermack, D. L. (1997). Managerial entrenchment and capital structure
decisions. The Journal of Finance, 52(4), 1411-1438.
Bertrand, M., & Schoar, A. (2003). Managing with style: The effect of managers on firm policies.
Quarterly Journal of Economics, 118(4), 1169-1208.
Boycko, Maxim, Andrei Shleifer, and Robert W. Vishny, 1996, A theory of privatisation, The
Economic Journal 106, 309-319.
Conyon, Martin J., and Kevin J. Murphy, 2000, The prince and the pauper? Ceo pay in the united
states and united kingdom, The Economic Journal 110, 640-671.
Core, J. E., Guay, W. R., & Verrecchia, R. E. (2003). Price versus non-price performance
17
measures in optimal CEO compensation contracts. The Accounting Review, 78(4), 957-981.
Cremers, K. J. Martijn, and Vinay B. Nair, 2005, Governance mechanisms and equity prices, The
Journal of Finance 60, 2859-2894.
Epstein, M. J., & Roy, M. J. (2005). Evaluating and monitoring CEO performance: Evidence
from US compensation committee reports. Corporate Governance, 5(4), 75-87.
Fama, E. F., & French, K. R. (1997). Industry costs of equity. Journal of Financial Economics,
43(2), 153-193.
Frydman, C. (2009). Learning from the past: Trends in executive compensation over the 20th
century. CESifo Economic Studies, 55(3-4), 458-481.
Frydman, C., & Jenter, D. (2010). CEO compensation. National Bureau of Economic Research
Working Paper Series.
Greene, William H., 2003. Econometric analysis. (Prentice hall)
Grinstein, Y., Weinbaum, D., & Yehuda, N. (2011). The economic consequences of perk
disclosure. SSRN eLibrary.
Gujarati, Damodar N., 2004. Basic econometrics.
Hall, B. J., & Liebman, J. B. (1998). Are CEOS really paid like bureaucrats?. Quarterly Journal
of Economics, 113(3), 653-691.
Hall, Brian J. , and Kevin J. Murphy, 2003, The trouble with stock options, Journal of
Economic Perspectives 17, 49-70.
Jensen, M. C., & Murphy, K. J. (1990a). Performance pay and top-management incentives.
Journal of Political Economy, 98(2), 225-264.
Jensen, M. C., & Murphy, K. J. (1990b). CEO incentives: It’s not how much you pay, but how.
Harvard Business Review, 3, 138-153.
Jensen, M., & Meckling, W. (1976). Theory of the firm: Managerial behaviour, agency costs, and
ownership structure. Journal of Financial Economics, 3(4), 308-360.
Jensen, Michael C., 2004, Agency costs of overvalued equity, ECGI - Finance Working Paper No.
39/2004.
Makri, M., Lane, P. J., & Gomez-Mejia, L. R. (2006). CEO incentives, innovation, and
performance in technology-intensive firms: A reconciliation of outcome and behavior-based
incentive schemes. Strategic Management Journal, 27(11), 1057-1080.
Malmendier, U., & Tate, G. (2009). Superstar CEOs. The Quarterly Journal of Economics,
124(4), 1593-1638.
Murphy, K. J. (1999). Chapter 38 executive compensation. In C. A. Orley, & C. David (Eds.).
18
Handbook of Labor Economics, 3, 2485-2563.
Shim, E. S., Lee, J., & Joo, I. K (2009). CEO compensation and US high-tech and low-tech
firms’ corporate performance. Contemporary Management Research, 5, 93-106.
Sundaram, R. K., & Yermack, D. (2007). Pay me later: Inside debt and its role in managerial
compensation. Journal of Finance, 62, 1551-1588.
Young, S., & Jing, Y. (2011). Stock repurchases and executive compensation contract design:
The role of earnings per share performance conditions. Accounting Review, 86(2), 703-733.

Editorial Board ([email protected])Download available at: http://wps.fep.up.pt/wplist.php
also in http://ideas.repec.org/PaperSeries.html
20