executive summary - down east sunrise trailsunrisetrail.org/news/destecimpact082016.docx · web...
TRANSCRIPT

DOWN EAST SUNRISE TRAIL ECONOMIC IMPACT ASSESSMENT
Prepared by the:Hancock County Planning Commission8/20/2016
This study was implemented with generous support from the Sunrise Trail Coalition, Davis Conservation Foundation, Maine Bureau of Parks and Lands and Maine Department of Transportation.

ContentsExecutive Summary...................................................................................................1Historical Perspective................................................................................................2Location Analysis.......................................................................................................3Down East Sunrise Trail Map....................................................................................4Demographic Analysis...............................................................................................7Trail User Counts.....................................................................................................10
Trail User Count Methodology.............................................................................10Trail Use by Month...............................................................................................12Trail Use by Day of Week.....................................................................................13Trail Use by Time of Day......................................................................................15
Trail User Survey.....................................................................................................17User Survey Methodology....................................................................................17How do people find out about the Sunrise Trail?.................................................19Who uses the Down East Sunrise Trail?...............................................................19Where do the users live and where do they use the trail?....................................20How do users travel along the trail?.....................................................................21What do trail users like to do along the way?.......................................................23User Opinions: Trail Maintenance, Security and Cleanliness..............................24
Economic Impact of the Down East Sunrise Trail...................................................27Spending on Supplies...........................................................................................27Spending on Food and Rentals.............................................................................30Spending on Lodging............................................................................................31Total Economic Impact.........................................................................................33
Conclusions..............................................................................................................35Appendix A - Trail Counter Data..............................................................................36Appendix B - Down East Sunrise Trail User Survey................................................37References:..............................................................................................................38

Executive Summary
The Down East Sunrise Trail (DEST) was inaugurated in sections starting in 2009 for multiple users including bicyclists, walkers, ATV riders, snowmobilers and cross country skiers. The designated trail soon reached 85 miles and formed an east-west corridor to which numerous other snowmobile and ATV trails would eventually connect. In 2016 an additional two-mile section is being constructed to connect the trail to the urban center of Ellsworth, Maine. An undesignated section of trail also connects with Route 1 in Perry, Maine, bringing the useable length to over 90 miles.
This report combines several streams of data to assess the economic impacts of the Sunrise Trail between 2013 and 2015. Direct, indirect and induced economic impacts have been significant and positive.
A trail-count camera identified more than 6,000 trips by individuals as users crossed the checkpoint at the western gateway in Washington Junction in the town of Hancock during 9 months in 2014 and 2015.
Camera counts provide a very detailed map of time of travel, mode, date, day of week, season, weather conditions, persons per vehicle and more.
Two-hundred ten respondents to a user survey at trail intercepts and online indicated spending an average of $31.04 per day on food, $22.56 per day on lodging as well as major purchases of equipment such as snowmobiles, ATVs and bicycles.
Total direct economic impacts of the trail are estimated to be approximately $236,000 over the ten month study period (excluding November and December). Indirect and induced impacts may match the direct benefits, doubling the overall impact.
Overall satisfaction with the DEST is high, but bicyclists were more likely to be critical of trail surface conditions.
Users provided a wealth of comments about their experiences and attitudes about the trail.
User counts and economic impacts in this study are conservative. This study concentrates on the busiest trail head location, but a great deal of activity occurs on other sections. Future research should include additional locations for cameras and trail user intercept surveys.
1
Historical Perspective
The Calais Branch railroad corridor is 127 miles long and connects Brewer to Calais in Downeast Maine. Construction of the corridor began in 1835 in Calais, but was abandoned in 1841. Work began again in 1852, but did not reach Washington Junction in Hancock until 1893. It became formally known as the Calais Branch in 1911. Passenger service declined and was terminated in 1957. Freight service also declined until it was discontinued in 1987 when the State of Maine acquired the tracks to preserve the corridor and right of way.
After numerous studies, MaineDOT encouraged the Legislature to dismantle tracks between Washington Junction in Hancock and Ayers Junction in Pembroke for provisional use of the right of way as the Down East Sunrise Trail. Tracks remain from Brewer to Washington Junction, a portion of which is employed as an excursion rail. Tracks remain from Ayers Junction to Calais, but are largely out of use.
The Down East Sunrise Trail was inaugurated in sections starting in 2009 for multiple users including bicyclists, walkers, ATV riders, snowmobilers and cross country skiers. The designated trail soon reached 85 miles and formed an east-west corridor to which numerous other snowmobile and ATV trails eventually connected. In 2016 an additional two-mile section is being constructed to connect the trail to the urban center of Ellsworth, Maine. An undesignated section of trail also connects with Route 1 in Perry, Maine, bringing the useable length to over 90 miles.
2

Location Analysis
The context will be established very briefly with a summary of the geographic context of Washington and Hancock Counties. Data are presented in tables, maps and GIS analyses. Secondary data including the US Census and data from the Maine Office of GIS will be employed.
The Calais Branch Rail was originally built to carry passengers and freight between maritime Canada and Bangor, also connecting coastal Washington and Hancock Counties. Larger population centers include Calais, Machias, Ellsworth, Brewer and Bangor. The converted 82 mile portion follows the downeast coast, until this year only reaching Machias as a population center. Completion of the 2 mile extension in 2016 will enable trail users to reach the center of Ellsworth.
The balance of the trail passes through forests, fresh water marshes, and small rivers, and offers occasional glimpses of blueberry barrens. As a rail line, the trail topography is flat, with inclines.
Most of the land on either side of the trail is held privately. The trail also touches on public lands including the Donnell Pond-Tunk Lake, Rocky Lake, and Great Works. The trail passes numerous municipal parks including Cherryfield’s Cable Pool and the Machias-East Machias causeway.
3

Early Version of the Trail Map: Excursion Rail Operates Close to Ellsworth
Down East Sunrise Trail MapSection 1: Ellsworth to Cherryfield
While the entire length of the DEST is rural and at times remote from any population, the western gateway is relatively populated. Washington Junction is the center of excursion rail activity and is an attraction for train enthusiasts. This end is also one of the most active sections of trail, particularly the first few miles that are popular for walking, bicycling and cross country skiing. The first two miles east of Washington Junction have a superior trail surface rich in crushed concrete, ideal for bicycling. Nearby facilities include a large parking area, a snowmobile club house and a business that is renting ATVs.
Users departing from Washington Junction are immediately into the woods. Other than the occasional dirt road crossing, travelers don’t encounter much sign of population before reaching Franklin, mile post 11. Franklin offers visitors a small general store that serves meals and sells gasoline. There are small municipal
4

parks, seasonal lodging and recreation areas. Franklin permits ATVs on many local roads.
The next section is also remote, but fortuitously crosses Schoodic Bog while passing at the foot of Schoodic Mountain providing a dramatic scenic backdrop. The trail continues to Cherryfield (MP 30) that offers a general store, seasonal lodging and local attractions like Cable Pool Park.
Section 2: Cherryfield to Machias
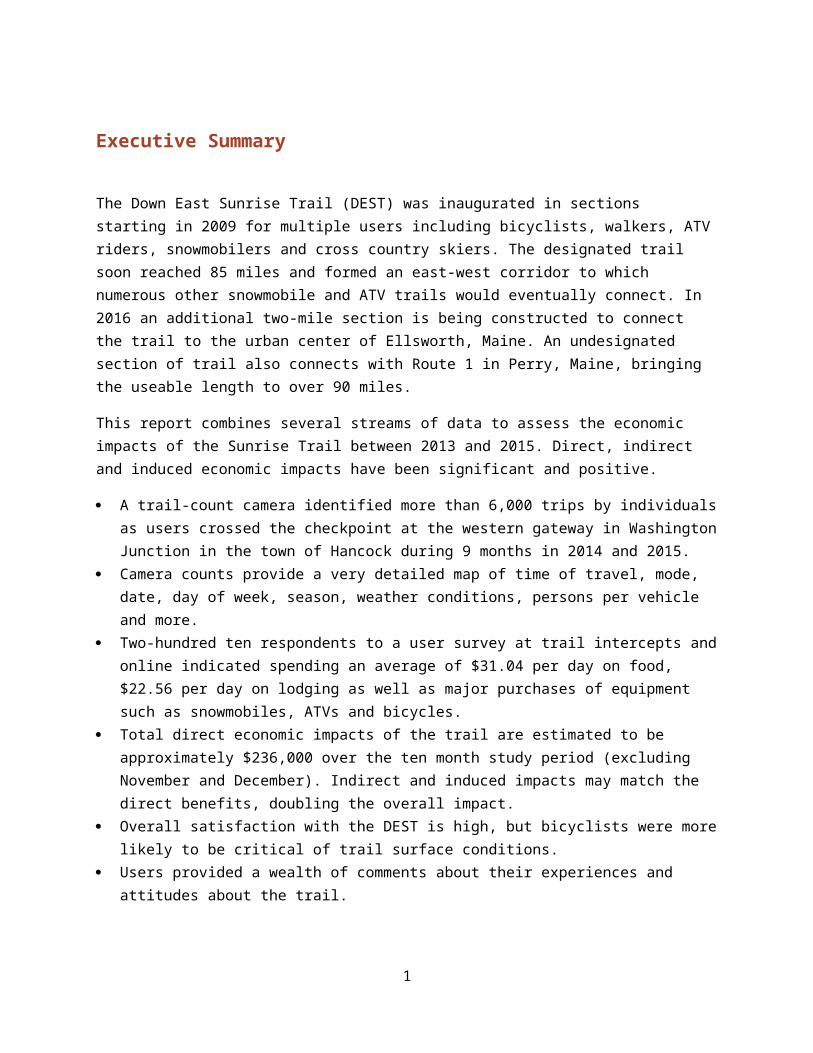
Departing Cherryfield, the trail passes a small primitive camping area that is free for trail users (MP 32). The trail continues by, but not through Harrington (Restaurants, Fuel) (MP 37), Colombia Falls (Ruggles House Museum) (MP 43), and Whitneyville (confluence of rivers). Travelers are encouraged to leave the trail and make brief side trips into these historic Maine villages. The second section of the trail ends in Machias (MP 58). Machias offers hotels, restaurants, shopping, parks and other amenities. Machias is also the second most popular section of the Sunrise Trail with many local users walking and pedaling.
5

6

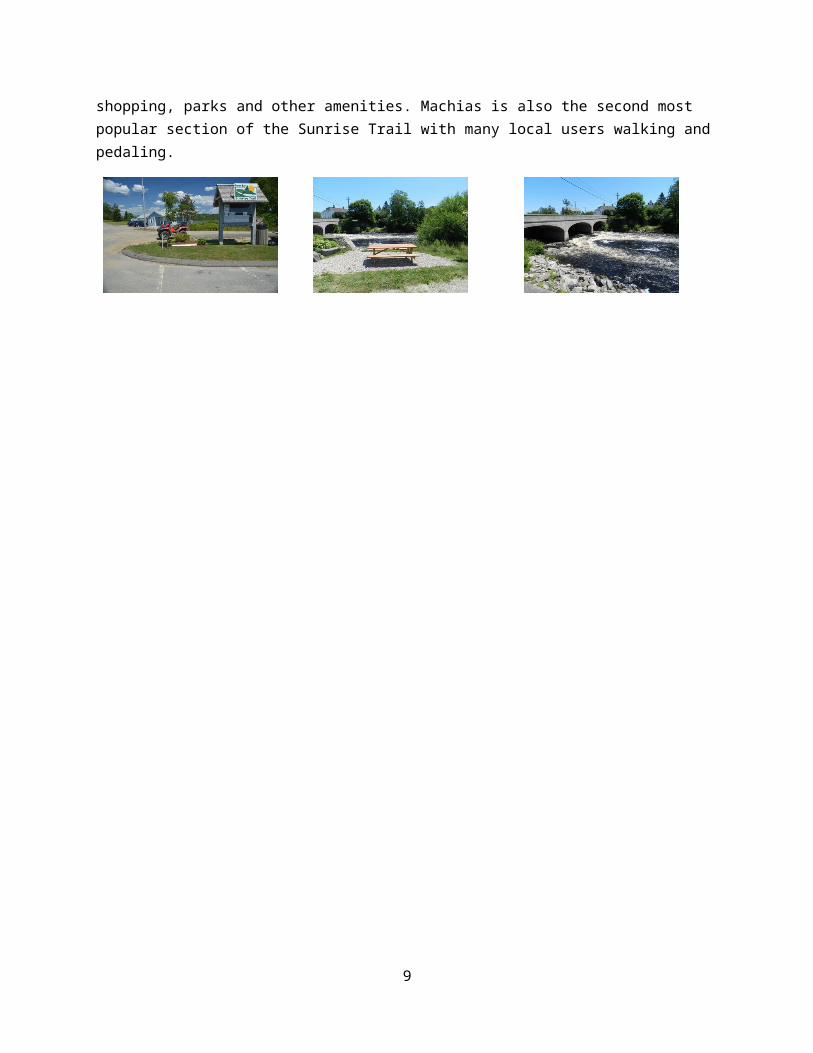
Section 3: Machias to Ayers Junction
The trail turns north (note change in map orientation) and does not encounter another population center to the end in Ayers Junction. There is one very scenic causeway over brackish water of the tidal Machias River between East Machias and Machias. This is the only coastal view on the Sunrise Trail. There are, however numerous scenic stream and wetland crossings, some of which are popular for sport fishing. The trail passes next to Rocky Lake Public Reserve Land and the Great Works Wildlife Management Area. One local business close to Ayers Junction rents cabins and campsites. Ayers Junction is a parking lot in a remote area. Fortunately a non-designated rail-trail continues to Route 1 in Perry with an onward trail for non-motorized users into Eastport. Efforts are underway to continue the Sunrise Trail to Calais using a combination of rail right of way, Moosehorn Wildlife Preserve and road shoulders.
7

8

Demographic Analysis
The combined population of Hancock and Washington County was 87,274 in the 2010 Census of Population. Hancock County accounted for 62% of the combined population. Both counties are aging rapidly. Both are at risk from year to year of shrinking as the aging population moves away or passes away faster than they are replaced by births and in-migration. Both counties are dominated by a large proportion of baby boomers and a smaller “echo” of boomer children.
2010 Census Population for State and Down East CountiesMaine Hancock County Washington County
Age Male Female Male Female Male Female<5 35,767 33,753 1,291 1,312 862 8125_9 38,081 36,035 1,362 1,297 868 895
10_14 40,495 38,518 1,429 1,363 929 88115_19 45,541 42,769 1,799 1,490 1,105 98620_24 40,426 39,220 1,608 1,384 800 78225_29 36,145 36,536 1,345 1,308 767 80530_34 35,662 36,281 1,288 1,354 828 81535_39 39,302 40,603 1,469 1,566 886 84340_44 44,957 46,514 1,663 1,803 1,002 1,07945_49 52,861 54,758 2,111 2,244 1,237 1,18650_54 54,129 56,827 2,318 2,438 1,368 1,38855_59 49,861 52,580 2,338 2,453 1,321 1,34360_64 44,361 45,299 2,171 2,277 1,318 1,32465_69 31,432 33,582 1,587 1,658 992 99470_74 22,234 25,403 1,044 1,174 726 81275_79 17,338 21,556 826 970 574 68180_84 12,125 18,274 581 822 351 50485+ 9,339 19,797 411 864 254 538
Total 650,056 678,305 26,641 27,777 16,188 16,668(Source: US 2010 Census)
9
Hancock County Population Pyramid
LT5M10_14M20_24M30_34M40_44M50_54M60_64M70_74M80_84M
-10% -5% 0% 5% 10%
HCM HCF
Washington County Population Pyramid
LT5M10_14M20_24M30_34M40_44M50_54M60_64M70_74M80_84M
-10% -5% 0% 5% 10%
WCM WCF
The following map illustrates the very small sizes of most of the towns abutting the Down East Sunrise Trail. The population data for townships are not included here, but these population counts are uniformly low. The largest City, Ellsworth, has a population under 8,000 persons.
10
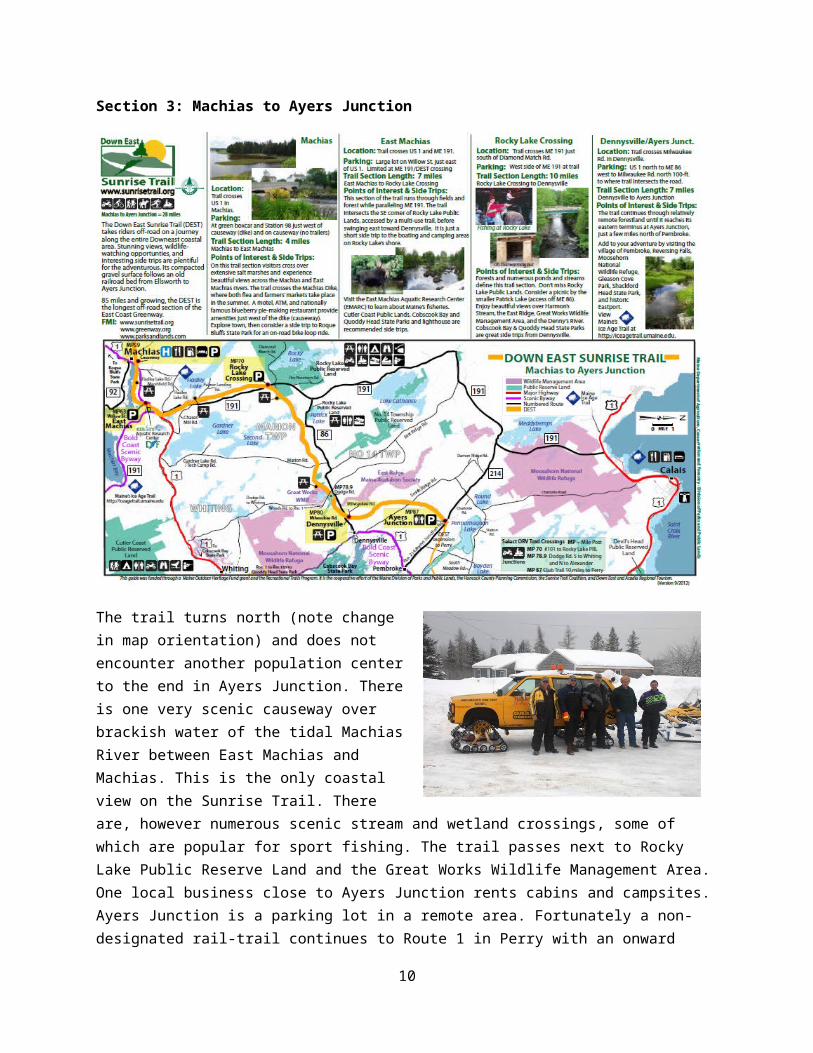
The population of Down East Maine is rural and is aging rapidly. Both counties are at risk of additional population losses. The DEST is part of a broader effort to maintain quality of life while creating attractive public infrastructure with an eye to encouraging additional migration into the region.
Median income in Maine is related to location. As one moves from the southern corner of the state income declines, with the lowest medians in the three rim counties Piscataquis, Aroostook and Washington. Eastern and northern portions of Hancock County also have relatively modest incomes, but Mount Desert Island and other western, coastal Hancock County towns increase the median. The DEST passes through areas that are characterized as working landscapes that generate few high paying jobs. One goal of creating the
11

trail has been to attract visitors from higher income areas to devote time and money to recreation on the trail.
12

Trail User Counts
The following analyses are based on 3,606 photographs that contained useful information. Most of these, as illustrated in the methodology, show one or more trail users on ATVs, snowmobiles, motorcycles, walking, bicycling, skiing, or snowshoeing.
The trail camera photographs provide two units of analysis, vehicles and individuals. Each is useful for measuring economic impact, but people are the basis for purchases of food, lodging and other supplies.
Trail User Count Methodology
Trail use counter data was collected with hidden cameras that snapped photographs when motion was detected. The advantage of using cameras over traditional look or infrared counters is that we are able to determine mode of travel, number of vehicles, number of individuals, direction of travel, time, date, light conditions and a host of contextual values. The drawbacks are also notable, including undercounts of fast-moving ATVs and slow moving walkers, camera failure at one location, battery failure on a few occasions, and a very labor-intensive process of manually tabulating each of several thousand photographs. In the end, the process was successful at collecting representative data for nine months between 2014 and 2015. Samples for three months, June, November and December, were incomplete at the time of this analysis, but will be added when the data are available.
The process of transforming photographs to data is very time consuming. Each photograph is viewed by the coder and data are entered in a database (Excel spreadsheet in this case). Each photograph is coded with location (Latitude, Longitude), date, time, direction of travel, mode of travel, number of vehicles and number of individuals.
With good camera placement most of the photographs are triggered by users, but wind moving tree branches and shadow movements also triggered photographs. We learned that camera placements needed careful testing. In one case a camera was left for several weeks only to discover that it took no user photographs, but many hundreds of images of scenic sunsets.
Another set of considerations of using hidden cameras is the potential impact on privacy and security. The privacy concerns are generally addressed by withholding specific photographs from publication. In most cases individuals are not identifiable. As is happens cameras provided useful information for improving trail
13

security. In particular the camera enabled the trail manager to determine illegal use of the trail by cars and trucks that present a risk to other users. We placed cameras in locations that we hoped would not be visible to users, fearing theft or vandalism. The need to find obscure camera locations had the undesirable consequence that some users were missed by the motion detector.
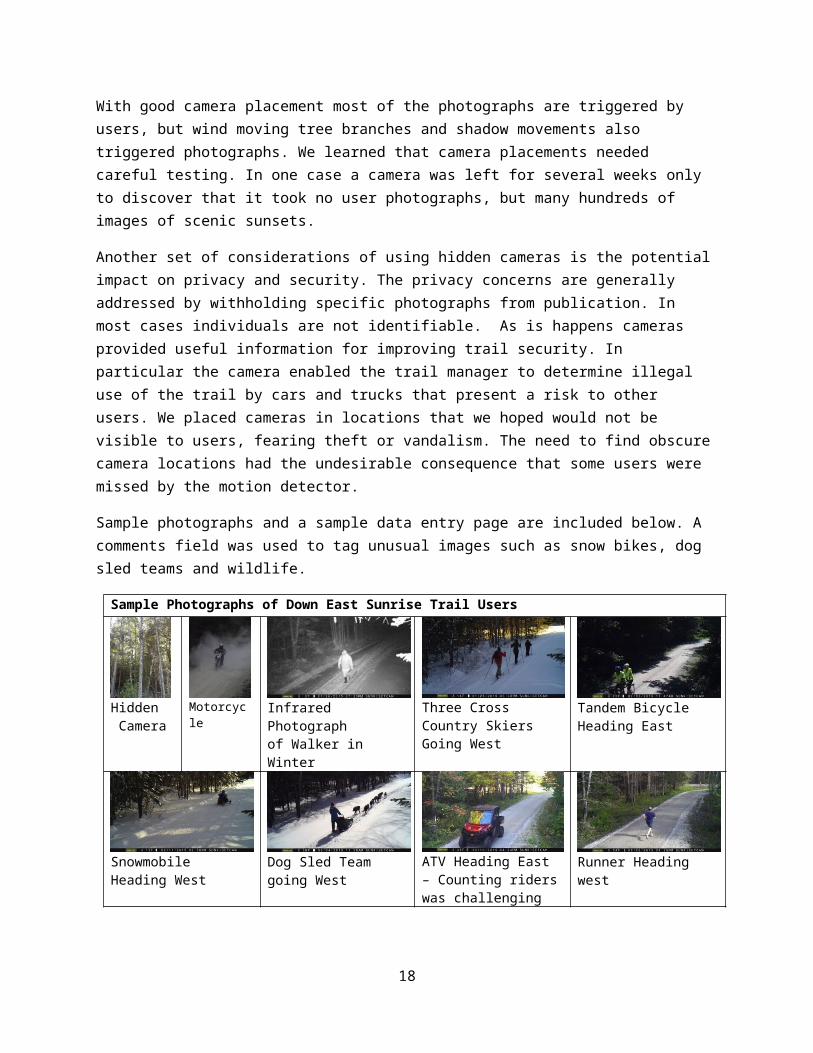
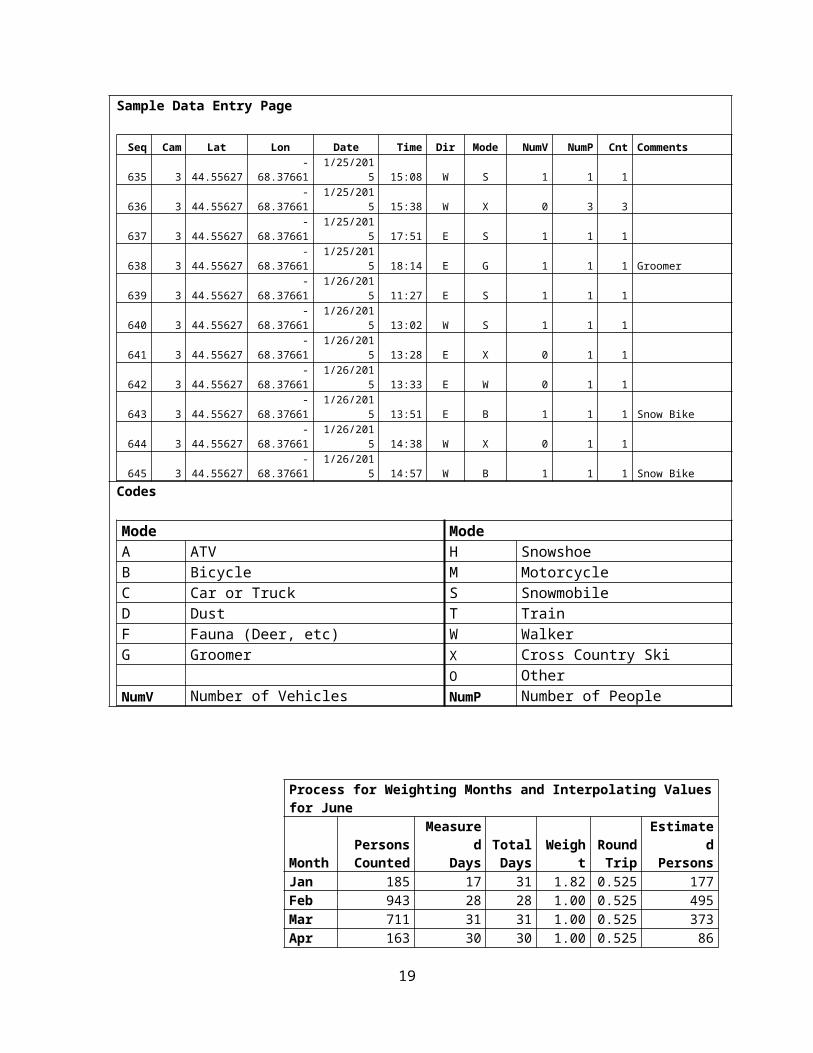
Sample photographs and a sample data entry page are included below. A comments field was used to tag unusual images such as snow bikes, dog sled teams and wildlife.
Sample Photographs of Down East Sunrise Trail Users
Hidden Camera
Motorcycle
Infrared Photograph
of Walker in Winter
Three Cross Country Skiers Going West
Tandem Bicycle Heading East
Snowmobile Heading West
Dog Sled Team going West
ATV Heading East – Counting riders was challenging
Runner Heading west
Sample Data Entry Page
Seq Cam Lat Lon Date Time Dir Mode NumV NumP Cnt Comments
635 3 44.55627 -68.37661 1/25/2015 15:08 W S 1 1 1
636 3 44.55627 -68.37661 1/25/2015 15:38 W X 0 3 3
637 3 44.55627 -68.37661 1/25/2015 17:51 E S 1 1 1
638 3 44.55627 -68.37661 1/25/2015 18:14 E G 1 1 1 Groomer
639 3 44.55627 -68.37661 1/26/2015 11:27 E S 1 1 1
640 3 44.55627 -68.37661 1/26/2015 13:02 W S 1 1 1
641 3 44.55627 -68.37661 1/26/2015 13:28 E X 0 1 1
642 3 44.55627 -68.37661 1/26/2015 13:33 E W 0 1 1
643 3 44.55627 -68.37661 1/26/2015 13:51 E B 1 1 1 Snow Bike
644 3 44.55627 -68.37661 1/26/2015 14:38 W X 0 1 1
645 3 44.55627 -68.37661 1/26/2015 14:57 W B 1 1 1 Snow Bike
14

Codes
Mode ModeA ATV H SnowshoeB Bicycle M MotorcycleC Car or Truck S SnowmobileD Dust T TrainF Fauna (Deer, etc) W WalkerG Groomer X Cross Country Ski
O OtherNumV Number of Vehicles NumP Number of People
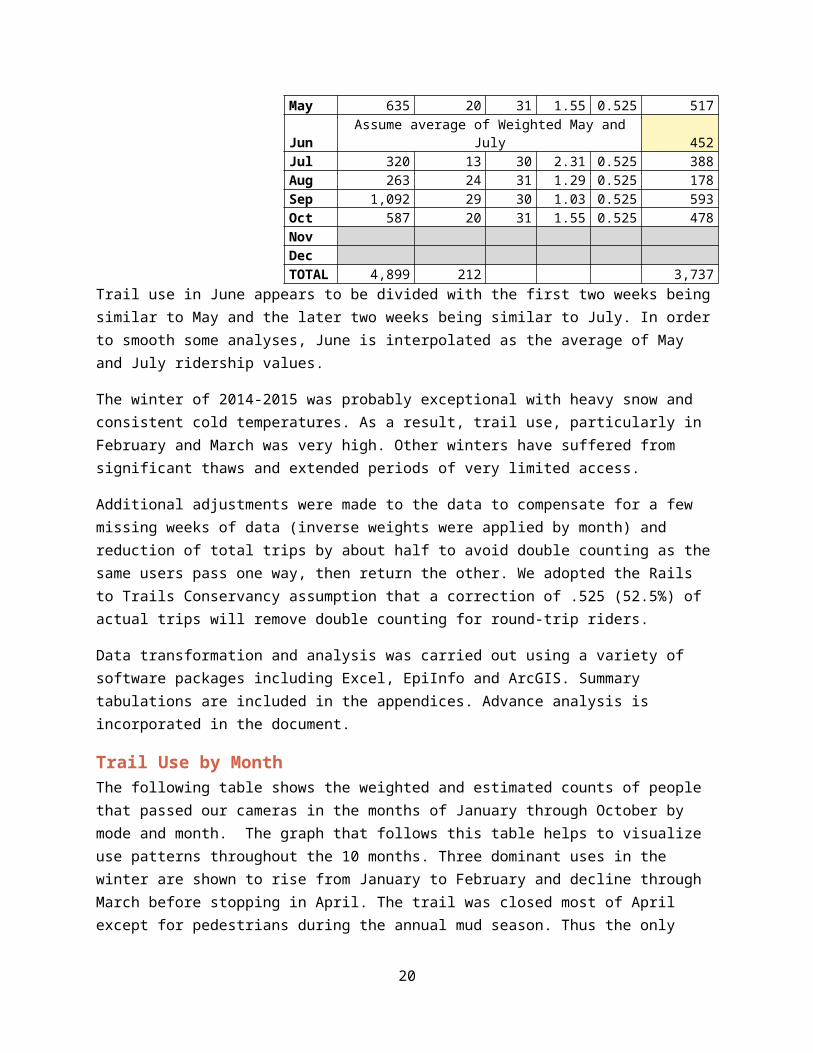
Process for Weighting Months and Interpolating Values for June
MonthPersonsCounted
MeasuredDays
TotalDays Weight
RoundTrip
EstimatedPersons
Jan 185 17 31 1.82 0.525 177Feb 943 28 28 1.00 0.525 495Mar 711 31 31 1.00 0.525 373Apr 163 30 30 1.00 0.525 86May 635 20 31 1.55 0.525 517Jun Assume average of Weighted May and July 452Jul 320 13 30 2.31 0.525 388Aug 263 24 31 1.29 0.525 178Sep 1,092 29 30 1.03 0.525 593Oct 587 20 31 1.55 0.525 478Nov Dec TOTAL 4,899 212 3,737
Trail use in June appears to be divided with the first two weeks being similar to May and the later two weeks being similar to July. In order to smooth some analyses, June is interpolated as the average of May and July ridership values.
The winter of 2014-2015 was probably exceptional with heavy snow and consistent cold temperatures. As a result, trail use, particularly in February and March was very high. Other winters have suffered from significant thaws and extended periods of very limited access.
Additional adjustments were made to the data to compensate for a few missing weeks of data (inverse weights were applied by month) and reduction of total trips by about half to avoid double counting as the same users pass one way, then return the other. We adopted the Rails to Trails Conservancy assumption that a correction of .525 (52.5%) of actual trips will remove double counting for round-trip riders.
15
Data transformation and analysis was carried out using a variety of software packages including Excel, EpiInfo and ArcGIS. Summary tabulations are included in the appendices. Advance analysis is incorporated in the document.
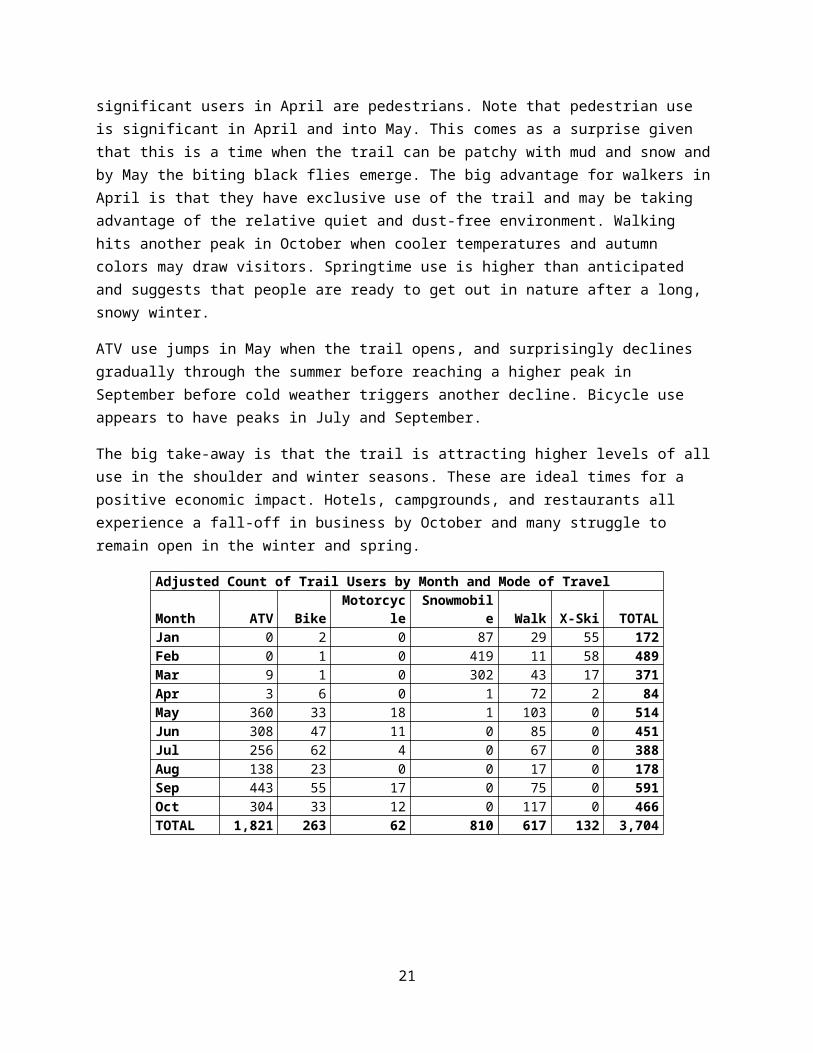
Trail Use by MonthThe following table shows the weighted and estimated counts of people that passed our cameras in the months of January through October by mode and month. The graph that follows this table helps to visualize use patterns throughout the 10 months. Three dominant uses in the winter are shown to rise from January to February and decline through March before stopping in April. The trail was closed most of April except for pedestrians during the annual mud season. Thus the only significant users in April are pedestrians. Note that pedestrian use is significant in April and into May. This comes as a surprise given that this is a time when the trail can be patchy with mud and snow and by May the biting black flies emerge. The big advantage for walkers in April is that they have exclusive use of the trail and may be taking advantage of the relative quiet and dust-free environment. Walking hits another peak in October when cooler temperatures and autumn colors may draw visitors. Springtime use is higher than anticipated and suggests that people are ready to get out in nature after a long, snowy winter.
ATV use jumps in May when the trail opens, and surprisingly declines gradually through the summer before reaching a higher peak in September before cold weather triggers another decline. Bicycle use appears to have peaks in July and September.
The big take-away is that the trail is attracting higher levels of all use in the shoulder and winter seasons. These are ideal times for a positive economic impact. Hotels, campgrounds, and restaurants all experience a fall-off in business by October and many struggle to remain open in the winter and spring.
Adjusted Count of Trail Users by Month and Mode of Travel
Month ATV BikeMotorcycl
e Snowmobile Walk X-Ski TOTAL Jan 0 2 0 87 29 55 172Feb 0 1 0 419 11 58 489Mar 9 1 0 302 43 17 371Apr 3 6 0 1 72 2 84May 360 33 18 1 103 0 514Jun 308 47 11 0 85 0 451Jul 256 62 4 0 67 0 388Aug 138 23 0 0 17 0 178Sep 443 55 17 0 75 0 591Oct 304 33 12 0 117 0 466TOTAL 1,821 263 62 810 617 132 3,704
16

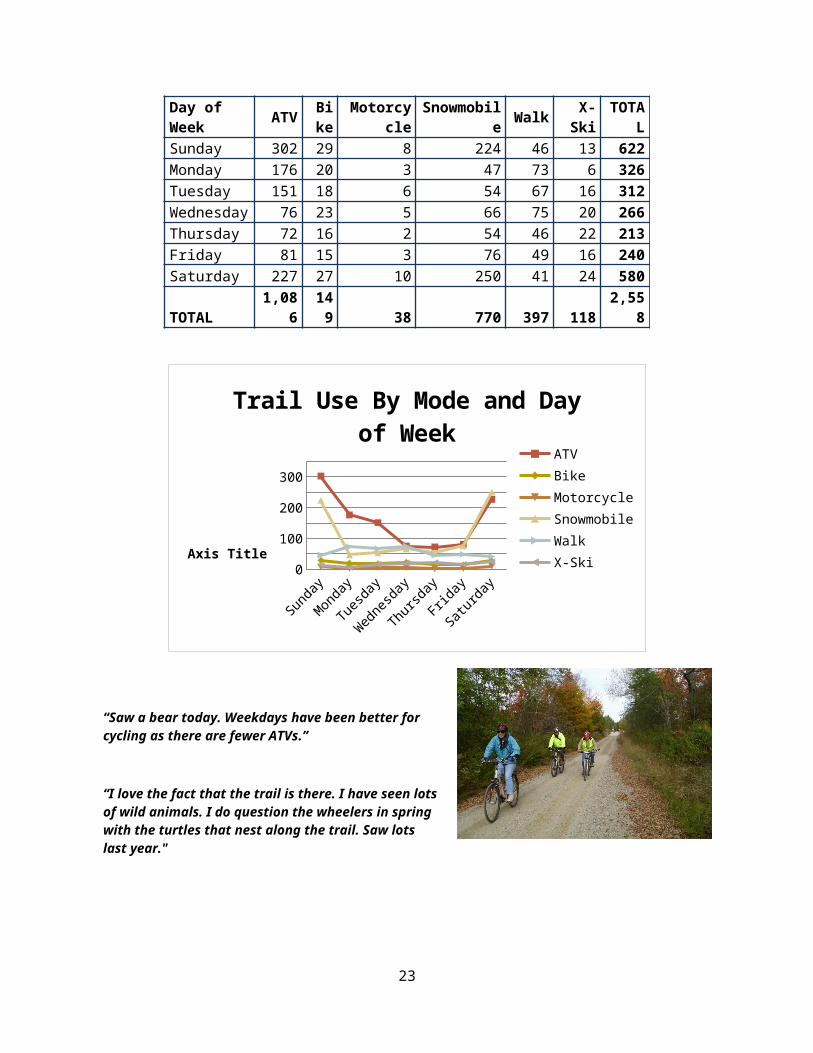
Trail Use by Day of WeekAnother consideration for economic impact and management of trail use is the day of week that people choose to travel. This following table uses weighted values, but does not include estimates for June, November nor December. The overall pattern is not surprising. Use is highest on weekends and lowest mid week. Friday use is lower than anticipated, perhaps because it is a travel day. Use on Mondays probably benefits from some busy three-day weekends.
Breaking the data down by mode of travel presents a somewhat nuanced pattern. Snowmobiles are the most concentrated weekend users while ATV use remains higher on Monday and Tuesday. Motorcycles are the smallest mode, but show a pattern similar to ATVs. Bicycle use shows relatively little variation, though like ATV’s; the weekend numbers are higher.
Walkers and cross country skiers, however, appear to be avoiding the trail on weekends, with the slight bumps-up in the middle of the week. This suggests that ATV and Snowmobile use may actually discourage slower, muscle powered use of the trail.
17

Day of Week ATV Bike Motorcycle Snowmobile Walk X-Ski TOTA
LSunday 302 29 8 224 46 13 622Monday 176 20 3 47 73 6 326Tuesday 151 18 6 54 67 16 312Wednesday 76 23 5 66 75 20 266Thursday 72 16 2 54 46 22 213Friday 81 15 3 76 49 16 240Saturday 227 27 10 250 41 24 580TOTAL 1,086 149 38 770 397 118 2,558
Sund
ay
Monda
y
Tues
day
Wedne
sday
Thur
sday
Frida
y
Satur
day
050
100150200250300350
Trail Use By Mode and Day of Week
ATVBikeMotorcycleSnowmobileWalkX-SkiAxis Title
“Saw a bear today. Weekdays have been better for cycling as there are fewer ATVs.”
“I love the fact that the trail is there. I have seen lots of wild animals. I do question the wheelers in spring with the turtles that nest along the trail. Saw lots last year."
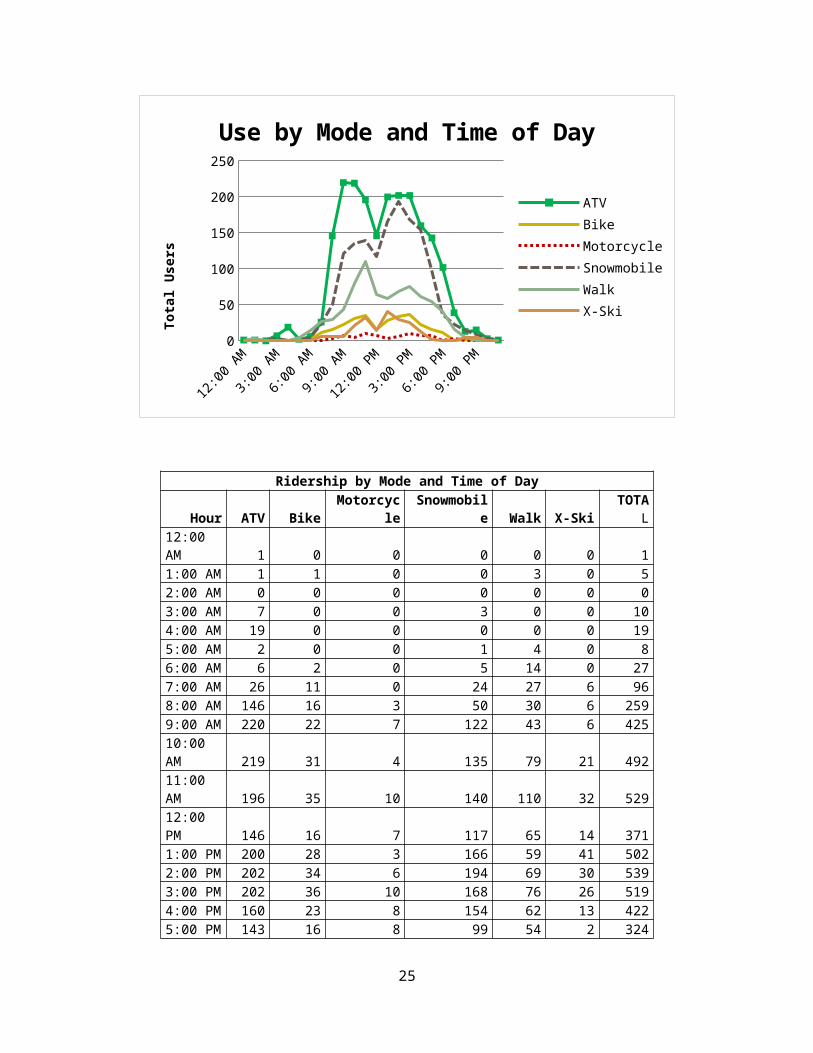
Trail Use by Time of Day
The DEST is open 24/7 with the exception of mud season, which generally occurs in April. The trail cameras have infrared capability and recorded use at all hours of the day and night. Night ridership was far lower than day time with no recorded
18
riders between 2:00 and 3:00 AM. The following graph shows counts of persons by time of day across all months and all days of the week.
As the counter is located very near the western trail head, the travelers tend to be just starting or just ending their trips. Another smaller group is in the middle of their trip, reaching Washington Junction. There are no services or amenities other than a picnic table and privy at Washington Junction, so motorized riders often turn around immediately to head back east. The bump at 3:00 and 4:00 AM for ATVs appears to be one user that makes the same trip at the same time, like a commuter.
Unlike the other patterns, there appears to be little difference in trail use by mode by time of day. All users startup at sunrise, show a noon-time dip, and a second peak in the afternoon. The winter snowmobilers and skiers start later and peak later in the morning and peak and end earlier in the afternoon reflecting shorter daylight hours during colder months.
Construction of the final two miles to High Street is going to change the time of day pattern, perhaps dramatically. Trips by ATV and snowmobile are not destination oriented. The trail is the destination. However, many riders plan their journey around lunch at the destination. Until now it has been impossible for ATV riders to access restaurants in Ellsworth. In the near future originating trips in the east will be more attractive to riders that want to go out for lunch in grand fashion.
12:00
AM
2:00 A
M
4:00 A
M
6:00 A
M
8:00 A
M
10:00
AM
12:00
PM
2:00 P
M
4:00 P
M
6:00 P
M
8:00 P
M
10:00
PM0
50
100
150
200
250
Use by Mode and Time of Day
ATVBikeMotorcycleSnowmobileWalkX-Ski
Tota
l Use
rs
Ridership by Mode and Time of DayHour ATV Bike Motorcycle Snowmobile Walk X-Ski
19
TOTAL 12:00 AM 1 0 0 0 0 0 11:00 AM 1 1 0 0 3 0 52:00 AM 0 0 0 0 0 0 03:00 AM 7 0 0 3 0 0 104:00 AM 19 0 0 0 0 0 195:00 AM 2 0 0 1 4 0 86:00 AM 6 2 0 5 14 0 277:00 AM 26 11 0 24 27 6 968:00 AM 146 16 3 50 30 6 2599:00 AM 220 22 7 122 43 6 42510:00 AM 219 31 4 135 79 21 49211:00 AM 196 35 10 140 110 32 52912:00 PM 146 16 7 117 65 14 3711:00 PM 200 28 3 166 59 41 5022:00 PM 202 34 6 194 69 30 5393:00 PM 202 36 10 168 76 26 5194:00 PM 160 23 8 154 62 13 4225:00 PM 143 16 8 99 54 2 3246:00 PM 102 11 1 37 41 0 1937:00 PM 39 0 3 23 16 0 818:00 PM 13 2 1 15 4 4 399:00 PM 15 0 0 9 0 4 2810:00 PM 3 0 0 3 0 0 611:00 PM 1 0 1 2 0 0 4
2,069 284 72 1,467 756 205 4,899
“The most amazing is that ALL get along, if it's ATVs or Snow machines, bikers, walkers or horses. Everyone shows deep respect for one another.”
Trail User Survey
20
User Survey Methodology
In addition to measuring the flow of users on the trail, economic impact depends on the behavior of the users and factors that affect future decisions about repeat visits, length of stay and purchases. The Sunrise Trail employed a rural trail survey developed by the Rails to Trails Conservancy www.railstotrails.org and used on numerous trail studies throughout the United States. This survey is most effective when it reaches a representative (random or clustered) sample of trail users. HCPC implemented the survey in two ways. A concentrated intercept survey was carried out on one full day during the summer at Washington Junction. It was a very busy day and many users agreed to complete the survey on the spot. This would be an excellent strategy, but several drawbacks should be noted. Being a warm weather survey, no winter users are captured. All the data are gathered for Washington Junction and therefore over represents walkers and cyclists relative to the eastern end of the trail. On a number of other occasions surveys were handed out along the trail and at trail related public events, but these were short duration collections and produced relatively few responses.
In order to capture data on year-round use, HCPC also posted the survey at: www.sunrisetrail.org/plans/DESTSurvey.html with a variety of announcements in newsletters, emails and banners to encourage participation. The online survey has generated a trickle of respondents over several years. Readers are encouraged to visit the website to read the entire survey. A print copy is included in the appendices.
The user survey has four focus areas:
21
1) User characteristics: age, gender, zip code, group composition, favorite sections
2) Trail use patterns: travel mode, time, frequency, length of stay, reason for use
3) Spending patterns on food, lodging and supplies4) Attitudes about the trail and willingness to contribute to its future
The Rails to Trails Conservancy has conducted more than 20 impact assessments using variants of this User Survey and have standardized data analysis and created norms for results. This is very helpful in order to understand where the Sunrise Trail Survey may differ from other trails and where results appear to be consistent with national data.
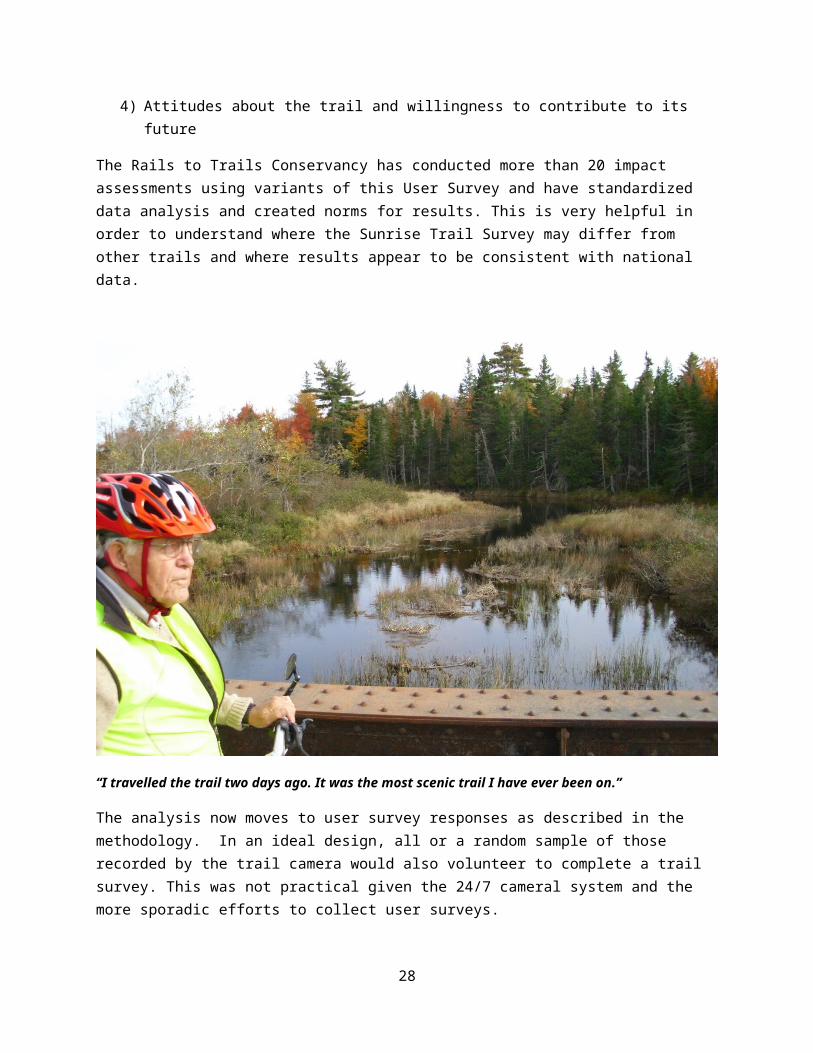
“I travelled the trail two days ago. It was the most scenic trail I have ever been on.”
The analysis now moves to user survey responses as described in the methodology. In an ideal design, all or a random sample of those recorded by the trail camera would also volunteer to complete a trail survey. This was not practical given the 24/7 cameral system and the more sporadic efforts to collect user surveys.
22

Consequently, there is no physical connection between the user survey and the trail counter data. The survey size of 209 responses is less than 1% of the trail count population. It is also the case that many of the user survey respondents participated before the trail cameras were installed and calibrated. Fortunately many of the discontinuities between counters and user survey responses can be managed statistically.
How do people find out about the Sunrise Trail?
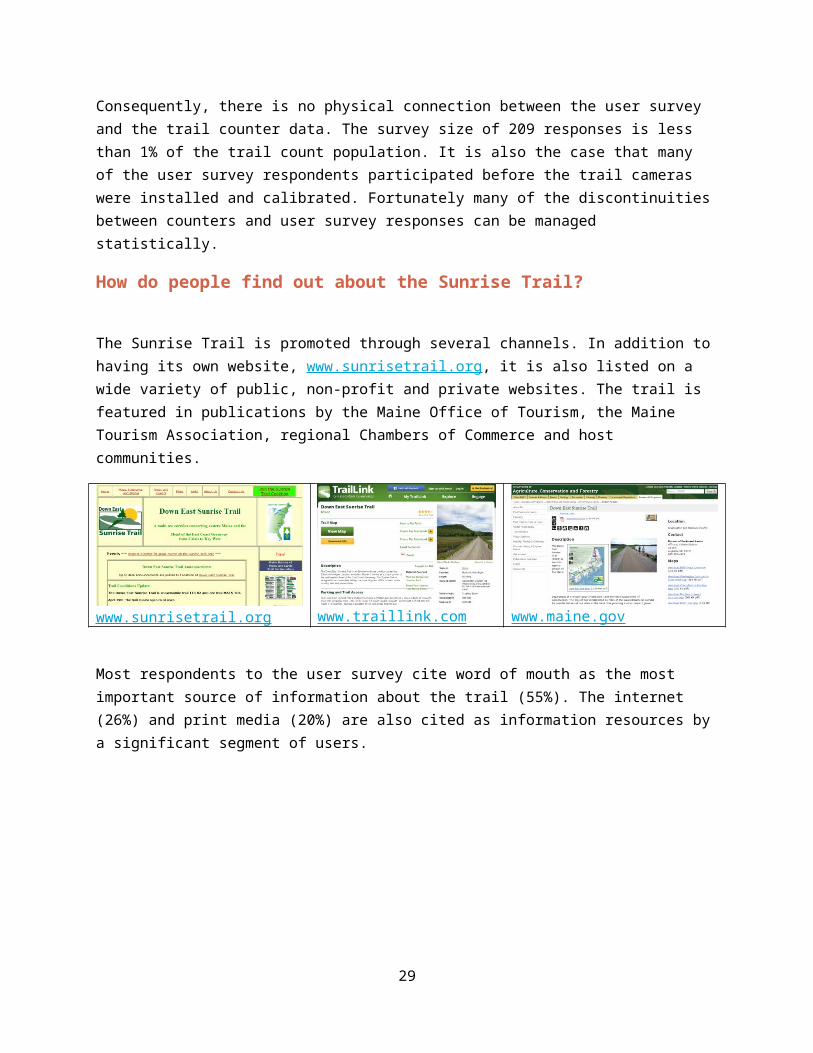
The Sunrise Trail is promoted through several channels. In addition to having its own website, www.sunrisetrail.org, it is also listed on a wide variety of public, non-profit and private websites. The trail is featured in publications by the Maine Office of Tourism, the Maine Tourism Association, regional Chambers of Commerce and host communities.
www.sunrisetrail.org www.traillink.com www.maine.gov
Most respondents to the user survey cite word of mouth as the most important source of information about the trail (55%). The internet (26%) and print media (20%) are also cited as information resources by a significant segment of users.
Word of mouth
Newspaper
Driving past
Rails-to-Trails Conservancy
Bike shop
0% 10% 20% 30% 40% 50% 60%
How did you find out about the trail?
Who uses the Down East Sunrise Trail?
23
Sunrise Trail users mirror the demographic profile of this region in many respects. The User Survey instrument collects information on the respondent and their travelling group. The age profile of respondents is older than the distribution of adults in eastern Maine, with a very large group in the 56 to 65 bracket and very few in the younger cohort. Survey response rates are typically lower among younger trail users, so this pattern may be as much the result of measurement problems as actual user age distribution. The photographic data suggest that young adults are using the trail in significant numbers. 17% of respondents also indicated that they were traveling with children under 15. Photographic evidence showed the benefits of traveling in groups, including numerous cases of vehicle failure resulting in towing.
16 to 25
26 to 35
36 to 45
46 to 55
56 to 65
66 or older
-70-60-50-40-30-20-10 0 10 20 30
Respondents by Age Group and
Gender
Male Female
Where do the users live and where do they use the trail?The following zip code map illustrates the distribution of Sunrise Trail Survey respondents. Individuals from North Carolina and Ohio are not included in the map for scaling purposes.
24

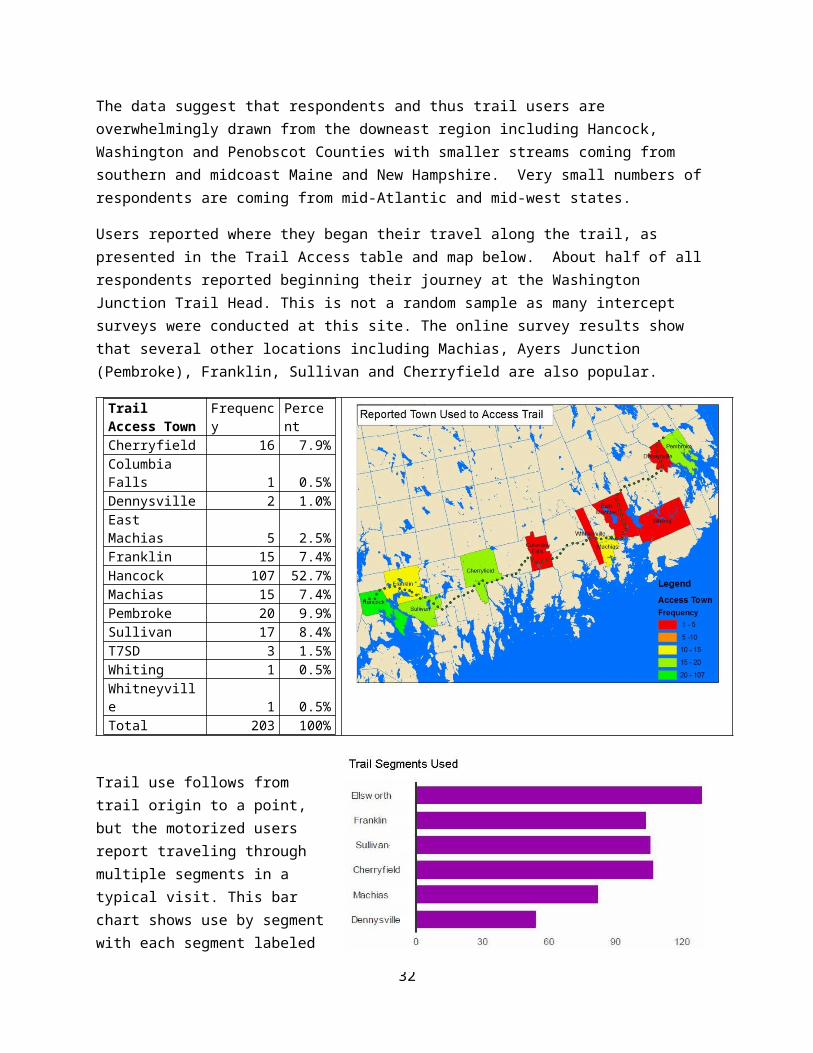
The data suggest that respondents and thus trail users are overwhelmingly drawn from the downeast region including Hancock, Washington and Penobscot Counties with smaller streams coming from southern and midcoast Maine and New Hampshire. Very small numbers of respondents are coming from mid-Atlantic and mid-west states.
Users reported where they began their travel along the trail, as presented in the Trail Access table and map below. About half of all respondents reported beginning their journey at the Washington Junction Trail Head. This is not a random sample as many intercept surveys were conducted at this site. The online survey results show that several other locations including Machias, Ayers Junction (Pembroke), Franklin, Sullivan and Cherryfield are also popular.
25
Trail Access Town Frequency PercentCherryfield 16 7.9%Columbia Falls 1 0.5%Dennysville 2 1.0%East Machias 5 2.5%Franklin 15 7.4%Hancock 107 52.7%Machias 15 7.4%Pembroke 20 9.9%Sullivan 17 8.4%T7SD 3 1.5%Whiting 1 0.5%Whitneyville 1 0.5%Total 203 100%
Trail use follows from trail origin to a point, but the motorized users report traveling through multiple segments in a typical visit. This bar chart shows use by segment with each segment labeled by its western-end. As such “Ellsworth” refers to the segment from Washington Junction to Franklin. The Trail Segment Used chart indicates that there the entire trail is popular, though use declines on the eastern end. This is particularly the case for non-motorized use.
How do users travel along the trail?Unlike the trail counter data that benefited from a very snowy winter, the user survey is dominated by summer use. Only one respondent indicated snowmobile to be their primary use, where as ATV use weighed in with 55% of respondents. Bicyclists and walkers are also over-represented in the survey when compared with the trail count data. Many respondents noted a second and even a third mode on the trail. Snowmobile use increases to 9% of respondents and ATV use climbs to 60%. Similarly, cross-country skiing and snowshoeing are noted by 11 respondents as a secondary activity. Note that the “any use” responses are not mutually exclusive and add up to more than 100%.
26

Primary Use Any UseMode Freq Percent Freq PercentATV 115 55.3% 125 60.1%Biking 49 23.6% 64 30.8%Walking / Hiking 42 20.2% 42 20.2%Snowmobile 1 0.5% 19 9.1%Cross Country Skiing / Snowshoeing 0 0.0% 11 5.3%Jogging / Running 0 0.0% 6 2.9%Other 0 0.0% 5 2.4%Motorcycle 1 0.5% 1 0.5%Horseback Riding 0 0.0% 1 0.5%Total 208 100.0% 273
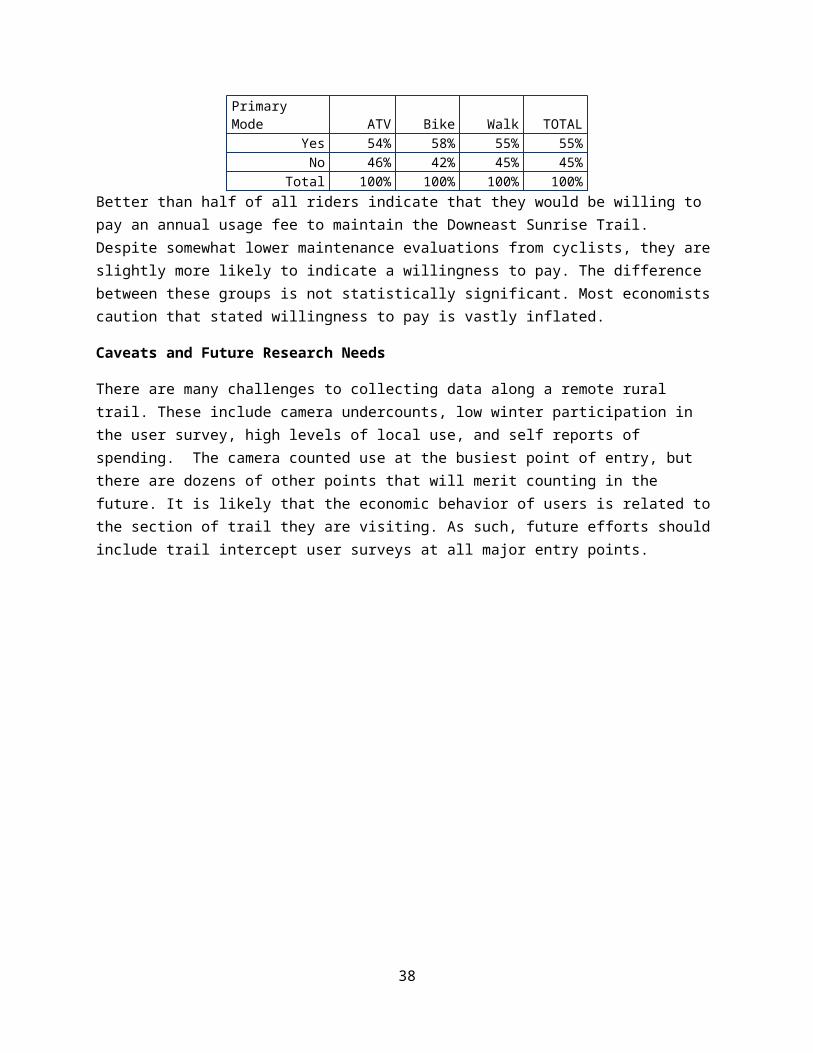
Respondents reported the frequency of their visits across a broad spectrum. The overall pattern is relatively large numbers of infrequent users and smaller numbers of regular users. The Sunrise Trail differs from urban trails in that it rarely can serve as a convenient route for commuters. There are some exceptions, such as the relative proximity of the trail to places of employment in Cherryfield, Harrington and Machias.
Respondents also reported on their preferred day of the week for traveling on the trail. The results for the three largest modes are consistent with the trail counter data. 32% of ATV users reported a preference for weekends, falling to 22% for bicyclists and 17% for walkers.
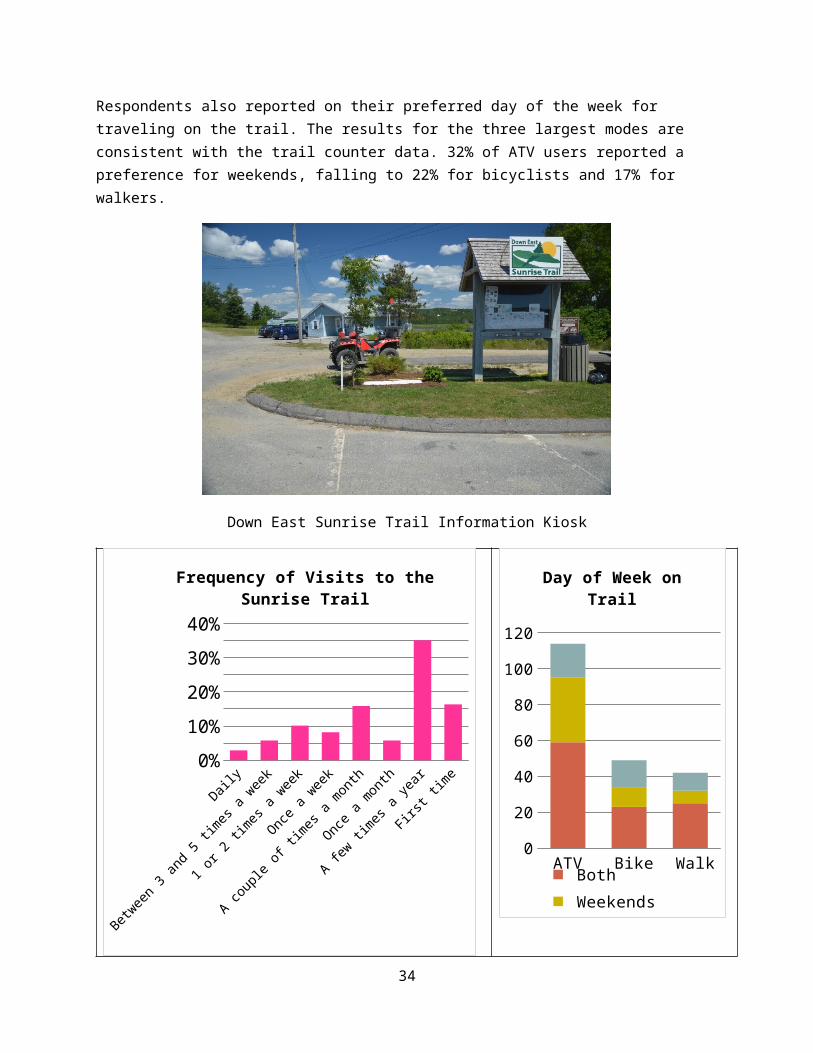
Down East Sunrise Trail Information Kiosk
27

Daily
Betwee
n 3 an
d 5 tim
es a
week
1 or 2
times
a wee
k
Once a
wee
k
A cou
ple of
times
a mon
th
Once a
mon
th
A few
times
a ye
ar
First
time
0%
10%
20%
30%
40%
Frequency of Visits to the Sunrise Trail
ATV Bike Walk 0
20
40
60
80
100
120
Day of Week on Trail
Both Weekends Weekdays
What do trail users like to do along the way?Trail users are asked to identify their primary reason for using the trail. The following table compares responses from three primary modes. The motorized users all cite recreation as their primary reason. About half of the muscle power users also cite recreation as primary, with most of the remaining respondents citing health, exercise and fitness training. The “other” category tended to be “all of the above” or variants of recreation and health.
Use the Trail For ATV * Bike Walk TOTAL Recreation 99% 51% 48% 77%Health and Exercise 0% 33% 38% 16%Fitness Training (marathon, triathlon) 0% 8% 5% 3%Other 1% 8% 10% 4%Total 100% 100% 100% 100%Total(n) 114 49 42 205
Users were also asked about ancillary activities along the trail. Not surprisingly watching flowers, wildlife and birds were relatively popular. Fishing is a very good fit with this trail, given the many river, stream and wetland crossings. Trail itineraries highlighting
28
fun fishing spots might attract another segment of people that would appreciate a day’s ride to a quiet fishing spot. Fishing, bird watching, wildlife and flora merit additional promotion in the future.
ActivityFrequenc
y PercentOther 38 21.1%Study flowers 46 25.6%Watch wildlife 153 85.0%Watch birds 110 61.1%Swim 7 3.9%Paddle 1 0.6%Fish 15 8.3%Respondents 180
FishPaddle
SwimWatch birds
Watch wildlifeStudy flowers
OtherActivities Along the Trail
User Opinions: Trail Maintenance, Security and Cleanliness
The final panel of questions in the Rails to Trails Conservancy User Survey is an assessment of user attitudes about the trail.
19: In your opinion, the maintenance of the trail is:
20: In your opinion, the safety and security along the trail is:
21: In your opinion, the cleanliness of the Trail is:
Maintenance Security CleanlinessExcellent 83 41% 91 45% 131 65%Good 84 41% 90 44% 64 32%Fair 27 13% 18 9% 6 3%Poor 7 3% 5 2% 1 0%
201 204 202
29
Maintenance Security Cleanliness0
20406080
100120140
83 91
131
84 9064
27 1867 5 1
User Attitudes about the Trail
Excellent Good Fair Poor
Respondents give high marks to the Sunrise Trail overall, with more than 80% responding good or excellent for all three criteria. Cleanliness receives 97% good or excellent ratings.
ATV Bike Walk 0%
20%
40%
60%
Attitude About MaintenanceBy Primary Mode of Transpor-
tation
Excellent Good Fair Poor
Concerns have been expressed by many cyclists about bumpy conditions along the trail. Cyclists and walkers have described occasional unsafe passing by ATVs and snowmobiles. The data indicate that ATV riders were most likely to give an excellent rating to the trail, while cyclists are most likely to give the trail a good rating. The poor ratings were most likely to come from cyclists, and it is possible that cyclists are staying away from the trail and thus not being counted in this survey. Nearly all long distance cyclists on thin-tire bikes are using the paved road network called Bike Route 1 (BR1).
“It would be great if the surface toward Machias was similar to the one closer to Ellsworth (which was perfect on our trip). [smaller gravel]”
“Guardrails along some areas of the trail would help improve safety, where the banks drop off steeply.”
30

“We love to use the sunrise trail to get onto the airline trail. One complaint is people's speed on the trail when they're using ATVs or snowmobiles.”
22: Would you be willing to pay an annual usage fee to help maintain the trail?
Primary Mode ATV Bike Walk TOTAL Yes 58 28 22 108 No 49 20 18 87
Total 107 48 40 195
Primary Mode ATV Bike Walk TOTAL Yes 54% 58% 55% 55% No 46% 42% 45% 45%
Total 100% 100% 100% 100%Better than half of all riders indicate that they would be willing to pay an annual usage fee to maintain the Downeast Sunrise Trail. Despite somewhat lower maintenance evaluations from cyclists, they are slightly more likely to indicate a willingness to pay. The difference between these groups is not statistically significant. Most economists caution that stated willingness to pay is vastly inflated.
Caveats and Future Research Needs
There are many challenges to collecting data along a remote rural trail. These include camera undercounts, low winter participation in the user survey, high levels of local use, and self reports of spending. The camera counted use at the busiest point of entry, but there are dozens of other points that will merit counting in the future. It is likely that the economic behavior of users is related to the section of trail they are visiting. As such, future efforts should include trail intercept user surveys at all major entry points.
31

Down East Sunrise Trail Inaugural Event
32
Economic Impact of the Down East Sunrise Trail
Estimating the total economic impact of the trail integrates the numeric counts achieved with the trail cameras and economic data acquired through the user survey. Trail users reported a variety of expenses connected with their mode of travel overall and their current visit specifically. The survey focuses on three clusters of travel expenses: supplies, food and lodging. These are what economists call “direct impacts”, or the amount that is generated immediately by increasing demand for local goods and services. After reviewing these direct impacts, the study will explore subsequent “indirect and induced” impacts, or those that result in subsequent transactions such as hiring additional wait staff or new restaurant equipment.
Spending on Supplies
Of these expenses, supplies are the most difficult in terms of attribution. Responders are asked:
12: Has your use of the trail influenced your purchase of: (circle all that apply)
Supply Frequency Percent Nothing 80 39.2% ********ATV 76 37.3% *******Clothing 42 20.6% ****Bike supplies 32 15.7% ***Bike 26 12.7% **Footwear 20 9.8% **Snowmobile 13 6.4% *Auto accessories 6 2.9% Respondents 205
39% of respondents reported not buying any supplies as a result of this trail. They have often spent a great deal on their vehicles, but they believe they would have purchased the vehicle were there no DEST. The next largest response is 37% that do attribute the purchase of their ATV at least to some extent to the existence of the DEST. Significant numbers of respondents also attributed their other purchases in part to the DEST. The snowmobile response is particularly notable since none of the respondents considered snowmobiles to be their primary use of the trail.
33

13: Approximately how much did you spend on the items above in the past year?
The average expenditures by primary mode are clearly higher than one can reasonably assign to a single or even multiple trips on the DEST, but they are not out of the range of what riders are spending overall. During the intercept interviews a number of respondents had to count all the ATV’s they had purchase for their children that were also riding on the trail that day. As such, an average supply expense for ATV users of $3,495 can be understood as the attribution of a major purchase for use on the trail. The costs associated with bicycles and walkers appear unrealistically high. Part of this is the result of multiple mode respondents that walk and also use an ATV or snowmobile.
The gap between mean (average) and median (the amount spent by the individual that had 50% of respondents spending less and 50% spending more) is large and indicates that the distribution of expenditures is highly skewed by a small number of persons that spent very large amounts.
Supply Cost by Primary Mode of Travel on the TrailPrimary Mode Obs Total Mean Median MaxATV 112 $391,399 $3,495 $150 $30,000Bike 48 $40,542 $845 $200 $20,000Walk 41 $47,725 $1,164 $50 $15,000All Users 201 $479,666 $2,386 $150 $30,000
Average Expenditure on Supplies
If one were to attribute 100% of these expenditures to the trail, then the sum of the three modalities would be the answer, in the range of $479,666 for 201 users for hard goods, or $2,386.40 average per users. If this amount is then projected to the estimated 3,704 users from the trail counter, the impact is $8,839,218.23. This figure is unrealistic, particularly as many of the users have repeat visits, and many are counting their entire investment in ATV and snowmobile equipment. Divide this total by an average of 41 visits per year per user in the survey to calculate a total economic impact of $215,590.69.
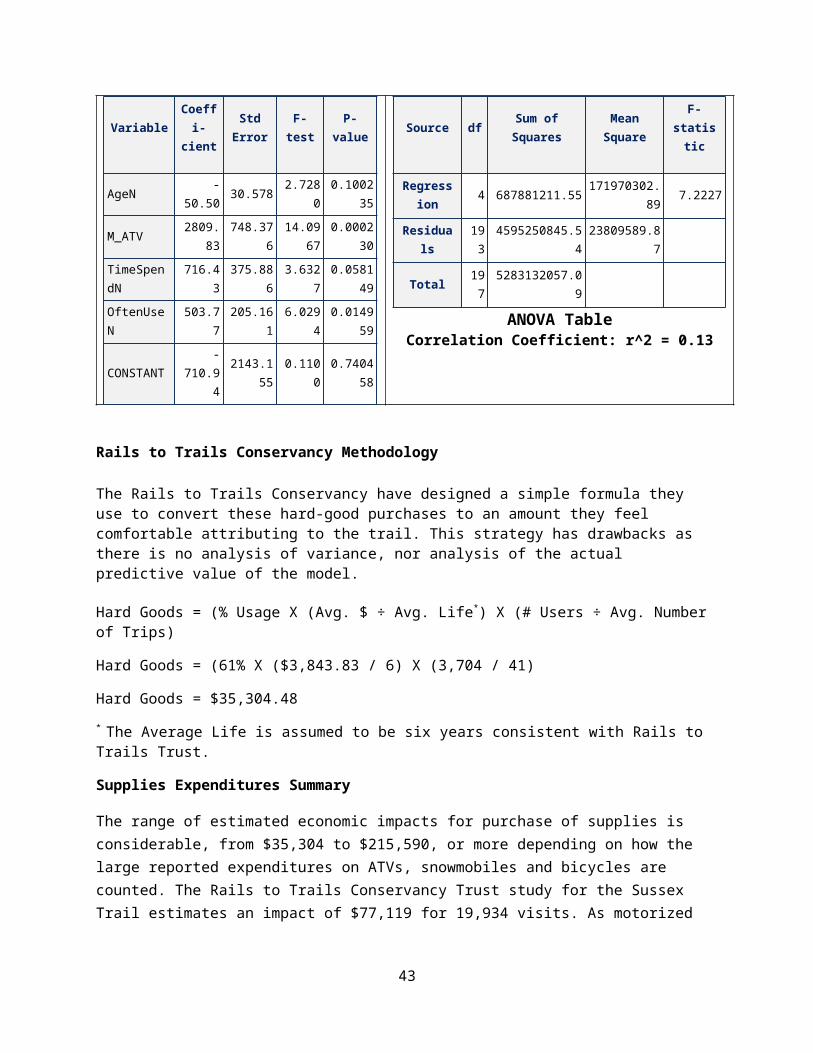
Predicting Expenditures Using Regression Analysis
A regression analysis was performed predicting level of expenditure (Supply Cost) in order to understand the independent effects of travel mode, age, frequency of trail use and length of stay on the trail.
The analysis indicates that use of an ATV contributes $2,809.83 to reported expenditure on supplies. Time spent and frequency of visits to the trail contribute to the amount people spent on supplies. More time and more frequent visits result in more spending. Age was included as a proxy for ability to spend, but the effect is
34
only marginally significant (p=.10) and indicates that younger users report spending more, after accounting for the other variables.
While these variables are statistically significant, the model only accounts for 13% of the overall variability in amount spent. The model is stronger for motorized users, and not among cyclists and walkers is greater, and as noted some of the high spenders are probably reporting on purchase of ATVs and snowmobiles. The model helps us to understand factors contributing to expenditures on supplies, but also illustrates challenges.
Outcome variable: Supply Cost / Covariates: AgeN, M_ATV, TimeSpendN, OftenUseN
VariableCoeffi-cient
Std Error
F-test P-value
AgeN -50.50 30.578 2.7280 0.100235
M_ATV 2809.83 748.376 14.0967 0.000230
TimeSpendN 716.43 375.886 3.6327 0.058149
OftenUseN 503.77 205.161 6.0294 0.014959
CONSTANT -710.94 2143.155 0.1100 0.740458
Source df Sum of Squares Mean Square F-statistic
Regression 4 687881211.55 171970302.89 7.2227
Residuals 193 4595250845.54 23809589.87
Total 197 5283132057.09
ANOVA TableCorrelation Coefficient: r^2 = 0.13
Rails to Trails Conservancy Methodology
The Rails to Trails Conservancy have designed a simple formula they use to convert these hard-good purchases to an amount they feel comfortable attributing to the trail. This strategy has drawbacks as there is no analysis of variance, nor analysis of the actual predictive value of the model.
Hard Goods = (% Usage X (Avg. $ ÷ Avg. Life*) X (# Users ÷ Avg. Number of Trips)
Hard Goods = (61% X ($3,843.83 / 6) X (3,704 / 41)
Hard Goods = $35,304.48* The Average Life is assumed to be six years consistent with Rails to Trails Trust.
Supplies Expenditures Summary
The range of estimated economic impacts for purchase of supplies is considerable, from $35,304 to $215,590, or more depending on how the large reported expenditures on ATVs, snowmobiles and bicycles are counted. The Rails to Trails Conservancy Trust study for the Sussex Trail estimates an impact of $77,119 for
35

19,934 visits. As motorized users are not permitted on the Sussex trail, a much lower impact per users is likely.
36

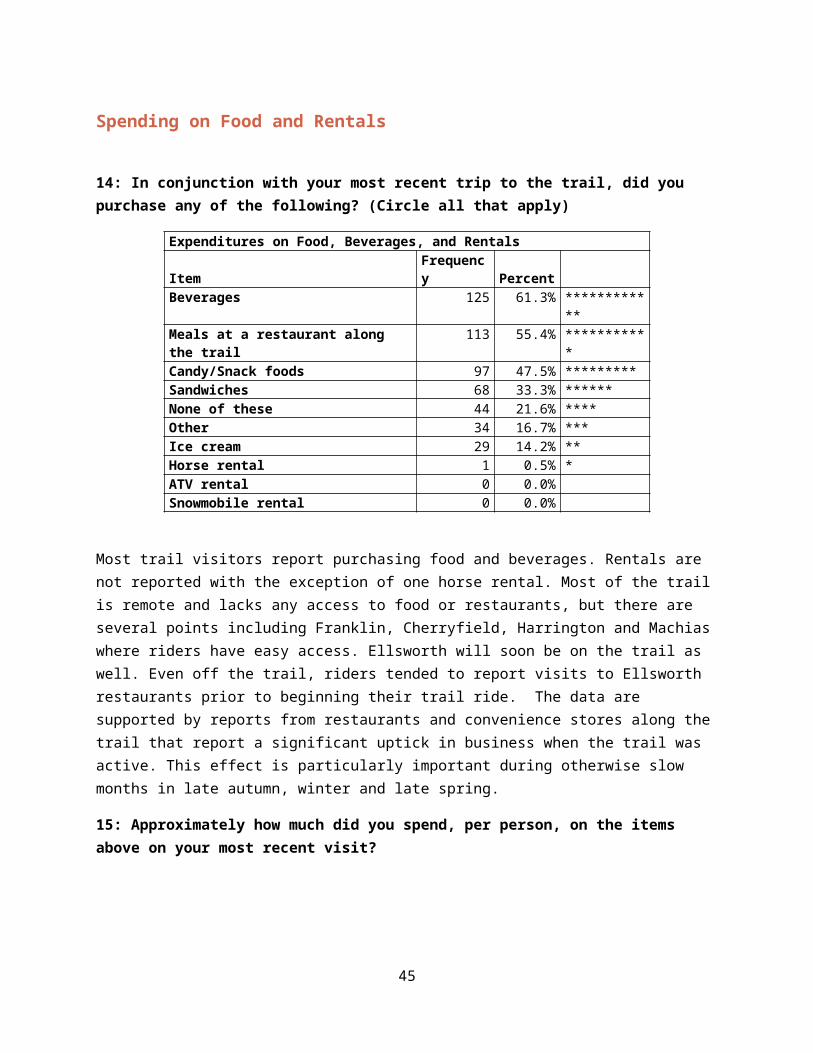
Spending on Food and Rentals
14: In conjunction with your most recent trip to the trail, did you purchase any of the following? (Circle all that apply)
Expenditures on Food, Beverages, and RentalsItem Frequency Percent Beverages 125 61.3% ************Meals at a restaurant along the trail 113 55.4% ***********Candy/Snack foods 97 47.5% *********Sandwiches 68 33.3% ******None of these 44 21.6% ****Other 34 16.7% ***Ice cream 29 14.2% **Horse rental 1 0.5% *ATV rental 0 0.0% Snowmobile rental 0 0.0%
Most trail visitors report purchasing food and beverages. Rentals are not reported with the exception of one horse rental. Most of the trail is remote and lacks any access to food or restaurants, but there are several points including Franklin, Cherryfield, Harrington and Machias where riders have easy access. Ellsworth will soon be on the trail as well. Even off the trail, riders tended to report visits to Ellsworth restaurants prior to beginning their trail ride. The data are supported by reports from restaurants and convenience stores along the trail that report a significant uptick in business when the trail was active. This effect is particularly important during otherwise slow months in late autumn, winter and late spring.
15: Approximately how much did you spend, per person, on the items above on your most recent visit?
Mode Obs Total Mean Median
ATV 107 $4,304.00 $40.22 $25.00
Bike 48 $1,386.50 $28.89 $4.75
Walk 41 $509.50 $12.43 0
All Modes 196 $6,200.00 $31.63 $15.00
www.sunrisetrail.org provides information about local services.
37

Simple Average Technique
This approach simply multiplies the average by the 3,704 users, which would be $117,157.52.
Expenditures on food and beverages is significantly related to mode of travel, with ATV riders reporting the highest amount, followed by cyclists and walkers. The medians are lower, indicating that a few high spending visitors are skewing the average higher. This is borne out by reports of spending $500 by an ATV respondent for his group, $275 and $200 by a walker. The figures are likely to be a misinterpretation of the question, reporting expenditures for the group rather than expenditures per individual.
Eliminating the eight highest spenders, greater than $100, reduces the reported means.
Mode Obs Total Mean MedianATV 103 $3,004.00 $29.17 $20.00Bike 45 $731.50 $16.26 $2.00Walk 40 $309.50 $7.74 $0.00All Modes 188 $4,045.00 $21.52 $15.00
Multiplying the adjusted average expenditure of $21.52 by 3,704 users produces a total impact of $79,695.26. For comparative purposes, the Sussex Trail study estimates a total impact of $100,837 for a much higher number of users.
Spending on Lodging
16: Did your visit to the trail involve an overnight stay in one of the following types of accommodations? (circle one response)
Accommodation Frequency Percent Motel / Hotel 24 12% **Campground 12 6% *Friend or Relatives Home 11 5% *Bed and Breakfast 6 3% None 148 74% **************Total 201 100%
In retrospect, the survey missed many housing arrangements that are characteristic of Maine including cabins, camps and short-term rental homes. These show up irregularly in the comments. Knowing that most respondents and likely most trail users live in three nearby counties suggests that lodging is not
38
needed by most. In this case 21% of respondents list hotels, campgrounds and B&Bs where they would be expected to pay on a daily basis. The numbers are low, but suggest that bike riders (36%) are more likely to use rental accommodations than ATV (20%) and walkers (10%). Only the bike riders reported using Bed and Breakfast accommodations. ATV users were most likely to use hotels and motels.
Accommodation ATV Bike Walk TotalBed and Breakfast 0 5 0 5Campground 7 3 1 11Motel / Hotel 14 8 2 24Total 21 16 3 40
Accommodation ATV Bike Walk TotalBed and Breakfast 0% 31% 0% 13%Campground 33% 19% 50% 28%Motel / Hotel 67% 50% 50% 59%Total 100% 100% 100% 100%
17. How many nights did you stay in conjunction with your visit to this trail?
Analysis of nights using accommodations shows small, but statistically insignificant differences among types of rental facilities and mode of travel. All numbers round to about 2 nights, which is reasonable. ATVs often run the trail end to end and back, or 164 miles with a hotel stay the night before leaving and one on the trail or when the return to their starting point. Cyclists need three days to ride the entire trail, but many are mixing a trail ride with riding in Acadia National Park. Only two walkers reported using rental facilities. Most walkers are likely to be local residents staying in their own homes.
Accommodation Days Obs Total MeanBed and Breakfast 5 10 2.0Campground 11 17 1.5Motel / Hotel 21 53 2.5Overall 37 80 2.2
Accommodation Days Obs Total MeanATV 21 49 2.3Bike 14 26 1.9Walk 3 5 2.5Overall 38 80 2.2
18: Approximately how much did you spend on over-night accommodations per night?
Accommodation Obs Total MeanBed and Breakfast 5 $740.00 $148.00Campground 11 $508.00 $46.18Motel / Hotel 20 $3,470.00 $173.50Overall 36 $4,718.00 $131.06Overall (<=$200) 33 $2,788.17 $84.49
Primary Mode Obs Total Mean
ATV 20$2,608.0
0 $130.40
Bike 13$1,540.0
0 $118.46Walk 3 $570.00 $190.00
39
Overall 36$4,718.0
0 $131.06
Overall (<=$200) 33$2,788.1
7 $84.49
Since the differences between modes and lengths of stay are not statistically significant, the methodology employed by the Rails to Trails Conservancy is employed.
Accommodations= (% Usage X Users Avg. $ X # Users x Avg. # Nights)Accommodations= 18% X $131.06 X 3,704 X 2.2Accommodations= $187,987.39
This is an impressive figure, and may be inflated by a few very high rental values that may represent more than one night or multiple rooms for the traveling group. Attribution can also be complicated by the multi-destination travelers that are visiting Acadia National Park or Eastport. Removing three rents greater than $200 has a significant impact on the average.
Accommodations= (% Usage X Users Avg. $ X # Users x Avg. # Nights)Accommodations= 18% X $84.49 X 3,704 X 2.2Accommodations= $121,193.30
For comparison, the calculation for Spring Valley Road on the Sussex trail is:(.115 X $52.75 X 19,934 X2.9) = $48,790
“Great connector to ATV Trail System. Makes ATV recreation very easy and fun!”
“Spent a lot.”
Total Economic Impact
Costs to Riders Low Estimate High Estimate CommentsSupplies – Hard goods
$35,304.48 $215,590.69 Attribution over multiple visits.
Food, Beverage, Consumables
$79,695.26 $117,167.35 Impact of removing outliers
Lodging $121.193.30 $187,987.39 Impact of removing outliers
Total $236,193.04 $520,745.43
Multiplier Effect
40

We should further consider indirect and induced impacts of the trail. For instance purchase of food, lodging and supplies indirectly stimulates purchases of food by restaurants, business services, parts and other links back through the supply chain. Another set of economic consequences are induced through hiring additional workers in the supply chain that in turn demand housing, groceries, education. These indirect and induced effects are often summarized as a “multiplier” effect.
Low Estimate
High Estimate
Comments
Total Direct Effect $236,193.0
4 $520,745.43Range due to attribution of big purchases and excluding “big spenders”.
Total + Direct + Indirect effects
$472,386.08 $1,041,490.86
The use of multipliers questioned in rural projects due to leakage of benefits.
Calculating the precise multiplier effect for the Down East Sunrise Trail is another process we cannot incorporate at this time. However, looking at projects, New York State uses a multiplier of 2.0 for rural rail to trail projects.i Typically multipliers diminish as the economic catchment area becomes more rural. If the supply chain is outside of the region, money leaves the system before having a chance to be re-spent. The indirect and induced impacts are quickly dispersed.
In the case of Washington Junction, many local services are relatively near, including ATV and snowmobile sales and service, hotels, motels, campgrounds, restaurants and other conveniences. Using a multiplier of 2.0 would result in total benefits ranging between $500,000 and $1,000,000.
If the western gateway of the trail can produce direct economic impacts valued at $236,192 (the low end), and total impacts at close to $500,000, the question remains whether the benefits are sufficient to justify the investment and ongoing operating costs. A full account of these costs is essential to answering the question, and as such will be the subject of a future report.
41

The Sunrise Trail website highlights businesses providing food, fuel, supplies and lodging.
42

Conclusions
The Down East Sunrise Trail has produced measurable and significant economic benefits for downeast Maine ranging from approximately $236,000 to $1,000,000 for a 10 month period in 2014-2015.Even at the low end of this range, the measured benefits appear noteworthy. In addition to these economic benefits, there have been a variety of important recreation, health, quality of life and community benefits. Rider satisfaction is high, but will only be sustained if there is ongoing attention to trail maintenance, security and cleanliness. Community satisfaction, particularly the business community, will require additional systematic research.
In order to arrive at this conclusion the Sunrise Trail Coalition with partners including the Hancock County Planning Commission, Maine Bureau of Parks and Lands, Maine Department of Transportation, Rails to Trails Conservancy and many others. The partners each have an important role for the success of the Sunrise Trail. Each also has costs associated with their role. A helpful extension to this analysis will be to identify processes to sustain the trail, helping to offset partner costs and continuing to build trail ridership and local business development.
Measuring the benefits is fraught with challenges relating to measurement, inaccurate self-reports and attribution of big assets. This study adopted the Rails to Trails Conservancy methodology in order to maintain comparability with other studies.
43
“The trail is absolutely awesome. It is the best thing so far about moving to Machias.”
Appendix A - Trail Counter Data
Hour Frequency Percent
0 1 0.03%
1 5 0.14%
3 8 0.22%
4 19 0.53%
5 7 0.19%
6 22 0.61%
7 70 1.94%
8 184 5.10%
9 294 8.15%
10 337 9.35%
11 351 9.73%
12 283 7.85%
13 371 10.29%
14 413 11.45%
15 390 10.82%
16 326 9.04%
17 245 6.79%
44

18 153 4.24%
19 66 1.83%
20 31 0.86%
21 21 0.58%
22 5 0.14%
23 4 0.11%
TOTAL 3606 100.00%
45
Day of Week Frequency Percent
Sunday 880 24.40%
Monday 437 12.12%
Tuesday 433 12.01%
Wednesday 387 10.73%
Thursday 312 8.65%
Friday 358 9.93%
Saturday 799 22.16%
TOTAL 3606100.00
%
Mode Frequency Percent
ATV 1443 40.02%
Bike 212 5.88%
Car 21 0.58%
Groomer 21 0.58%
Snow Shoe 17 0.47%
Motorcycle 61 1.69%
Other 6 0.17%
Snowmobile 1212 33.61%
Walk 491 13.62%Cross Country Ski 122 3.38%
TOTAL 3606 100.00%
Oct 358 9.93%
TOTAL 3606100.00
%
Unit of Analysis Obs Total Mean Var Std Dev Min 25% Median 75% Max Mode
Number of Vehicles 3606 3395 0.9415 0.3125 0.559 0 1 1 1 5 1
Number of Persons 3606 4899 1.3586 0.4364 0.6606 0 1 1 2 9 1
46
Direction Frequency Percent
E 1629 45.17%
W 1977 54.83%
TOTAL 3606 100.00%

Appendix B - Down East Sunrise Trail User SurveyDown East Sunrise Trail User Survey
In order to provide you with a high quality recreational experience, we are conducting a survey of trail users. Your cooperation in completing this survey will be greatly appreciated. One user per survey form please!
1: What is your zip code? _____________
2: How often, on average, do you use the trail? (circle one response) Daily Between 3 and 5 times a week 1 or 2 times a week Once a week A couple of times a month Once a month A few times a year First time
3: Please identify your age group. (circle one response) 15 and under 16 to 25 26-35 36-45 46-55 56-65 66 or older
4. Were any children under the age of 15 with you on your trail experience today? Yes No
5: What is your gender? (circle your response) Male Female
6: What is your primary activity on the trail? (circle all that apply) Walking/ Hiking Biking Jogging/Running Horseback Riding ATV XC skiing/Snowshoeing Snowmobile Other activity (specify) _______________________
7: Generally, when do you use the trail? (circle one response) Weekdays Weekends Both
8: How much time do you generally spend on the trail each visit? (circle one response) Less than 30 minutes 30 minutes to 1 hour 1 to 2 hours More than 2 hours
9: Would you consider your use of the trail to be for… (circle one response) Recreation Health and Exercise Commuting Fitness Training (marathon, triathlon) Other (specify) ______________
10. During your trail visit did you (circle all that apply) Fish Paddle Swim Watch birds Watch wildlife Study flowers
11: How did you find out about the trail? (circle all that apply) Word of mouth Roadside signage Driving past Newspaper Parks Department Bike shop Convention and Visitors Bureau Information from Rails-to-Trails Conservancy Internet web site Other ___________
12: Has your use of the trail influenced your purchase of: (circle all that apply) Bike Bike supplies Auto accessories Footwear ATV Snowmobile Clothing Nothing
13: Approximately how much did you spend on the items above in the past year? $______________
14: In conjunction with your most recent trip to the trail, did you purchase any of the following? (circle all that apply) Beverages Candy/Snack foods Sandwiches Ice cream Meals at a restaurant along the trail ATV rental Snowmobile rental Horse rental Other ________________ None of these
15: Approximately how much did you spend, per person, on the items above on your most recent visit? $____________
16: Did your visit to the trail involve an overnight stay in one of the following types of accommodations? (circle one response) Motel/Hotel Bed and Breakfast Friend or Relatives Home Campground Other (please specify) ___________
17. How many nights did you stay in conjunction with your visit to this trail? ___________
47

18: Approximately how much did you spend on over night accommodations per night? $_______________
19: In your opinion, the maintenance of the trail is (circle one) Excellent Good Fair Poor20: In your opinion, the safety and security along the trail is (circle one) Excellent Good Fair Poor21: In your opinion, the cleanliness of the Trail is (circle one) Excellent Good Fair Poor22: Would you be willing to pay an annual usage fee to help maintain the trail? (circle one response) Yes No
23: What portion of the trail do you use most often? (circle all that apply) Ellsworth-Franklin Franklin-Sullivan Sullivan-Cherryfield Cherryfield-Machias Machias-Dennysville Dennysville-Ayers Junction
References:
Rail to Trail Conservancy:
www.railstotrails.org/build-trails/trail-building-toolbox/trail-enhancements-management/trail-user-surveys-and-counting/
Google Form Results: https://docs.google.com/forms/d/1FLU19Dn057L20n4uojhZsivVpUtFQ-BJuaTwttruSBQ/viewanalytics
24: Which trail access points do you generally use when you visit the trail? _____________
Additional comments_________________________________________________
48

i “Reviewing the survey data collected on the Town of Hurley Rail Trail, it was found that about 10.5% of the trail users were non-local. Non-local users were found to spend more money in connection with their visits to the trail than local users. They averaged $202.35/trail visit versus an expenditure of only $5.19/trail visit for local users. Assuming a multiplier effect of 2.0, (typical for this type of spending in an area similar to where this trail is located, the economic impact would be about $2 million which would support about 40 FTE (Full Time Equivalent) jobs within the community. Additional economic impact exists because of increased tax revenues to the local community. Currently, Ulster County has a sales tax rate of 8% of which 4% leaves the local area and goes to New York State.” (Every Mile Counts: Economic analysis of 2008 New York Trail User Surveys - OPRHP)