executive summary - usps · executive summary toledo, oh p&dc 435 s. saint clair st toledo, oh...
TRANSCRIPT

Losing Facility Name and Type:Street Address:
City, State:Current 3D ZIP Code(s): 434-436
Type of Distribution to Consolidate:
Gaining Facility Name and Type:Current 3D ZIP Code(s):
= $4,946,783
= $251,556
= $1,590,402= $4,763,222 from Transportation (HCR and PVS)
= $6,417,998 from Maintenance
= $0 from Space Evaluation and Other Costs
= $17,969,961
= $1,740,370 from Space Evaluation and Other Costs
= $16,229,591
= 259 from Staffing - Craft
= 5 from Staffing - PCES/EAS
= 2,127,816 from Workhour Costs - Current
=
3,799,907 Detroit 6,009,099 Columbus
5,334,206 MI Meto
from Workhour Costs - Current
= 230,066
ADV ADV ADV %First-Class Mail® TBD TBD TBD TBD
Priority Mail® TBD TBD TBD TBDPackage Services TBD TBD TBD TBD
Periodicals N/A* N/A* N/A* N/A*Standard Mail N/A* N/A* N/A* N/A*
* - Periodical and Standard mail origin 3-digit ZIP Code to destination 3-digit ZIP Code volume is not available
89
Unchanged + UpgradesService Standard Impacts
by ADV
ServiceUPGRADED DOWNGRADED Unchanged +
Upgrades
Total FHP to be Transferred (Average Daily Volume)
Current FHP at Gaining Facility (Average Daily Volume)
Losing Facility Cancellation Volume (Average Daily Volume) (= Total TPH / Operating Days)
Staffing PositionsCraft Position Loss
PCES/EAS Position Loss
Volume
Space Savings
Total Annual Savings
Total One-Time Costs
Total First Year Savings
PCES/EAS Supervisory Workhour Savings from Other Curr vs Prop
Transportation SavingsMaintenance Savings
Mail Processing Craft Workhour Savings from Workhour Costs - Proposed
Non-MP Craft/EAS + Shared LDCs Workhour Savings (less Maint/Trans) from Other Curr vs Prop
Miles to Gaining Site 1: 59
Summary of AMP WorksheetsSavings/Costs
Site 1 - Detroit P&DC Site 2 - Columbus P&DC Site 3 - Michigan Metroplex P&DC
480-485480-481
Miles to Gaining Site 3:
430-433,437-438, 456-457
Executive SummaryToledo, OH P&DC435 S. Saint Clair StToledo, OH
Orig & Dest Miles to Gaining Site 2: 139.6

AMP Savings/Costs
Site 1: Detroit Site 2: Columbus Site 3: MI Metroplex TotalMail Processing Craft Workhour Savings $1,577,667 $2,187,340 $1,181,776 $4,946,783
Non-MP Craft/EAS + Shared LDCs Workhour Savings (less Maint/Trans) $131,989 $118,552 $1,015 $251,556
PCES/EAS Supervisory Workhour Savings $833,560 $714,937 $41,905 $1,590,402Transportation Savings ($220,208) $1,153,406 $3,830,024 $4,763,222
Maintenance Savings $4,932,493 $915,288 $570,217 $6,417,998Space Savings $0 $0 $0 $0
Total Annual Savings $7,255,501 $5,089,523 $5,503,091 $17,848,115$0
Total One-Time Costs $314,136 $1,426,234 $0 $1,740,370Total First Year Savings $6,941,365 $3,663,289 $5,503,091 $16,107,745
Staffing Positions
Craft Staffing Changes #(Losing Site) -4 Site 1: Detroit Site 2: Columbus Site 3: MI Metroplex Total
-340 21 45 15 -259
Management Staffing Changes(Losing Site) Site 1: Detroit Site 2: Columbus Site 3: MI Metroplex Total
-26 11 -2 12 -5

Type of Distribution to Consolidate: Orig & Dest MODS/BPI OfficeFacility Name & Type:
Street Address:City: Toledo
State: OH5D Facility ZIP Code: 43601
District: Northern OhioArea: Eastern
Finance Number: 388261Current 3D ZIP Code(s):
Miles to Gaining Facility: 139.6 MilesEXFC office: Yes
Plant Manager:Senior Plant Manager:
District Manager:Facility Type after AMP: Post Office
Facility Name & Type:Street Address:
City:State: OH
5D Facility ZIP Code: 43218District: Cincinnati
Area: EasternFinance Number: 381793
Current 3D ZIP Code(s):EXFC office: Yes
Plant Manager:Senior Plant Manager:
District Manager:
Start of Study: 9/15/2011Date Range of Data: Jul-01-2010 : Jun-30-2011
Processing Days per Year: 310Bargaining Unit Hours per Year: 1,745
EAS Hours per Year: 1,822
June 16, 2011
2/18/2012 14:40
Area Vice President:Vice President, Network Operations:
Area AMP Coordinator:HQ AMP Coordinator:
rev 09/21/2011
----- AMP Data Entry Page -----
Toledo P&DC435 S Saint Clair St
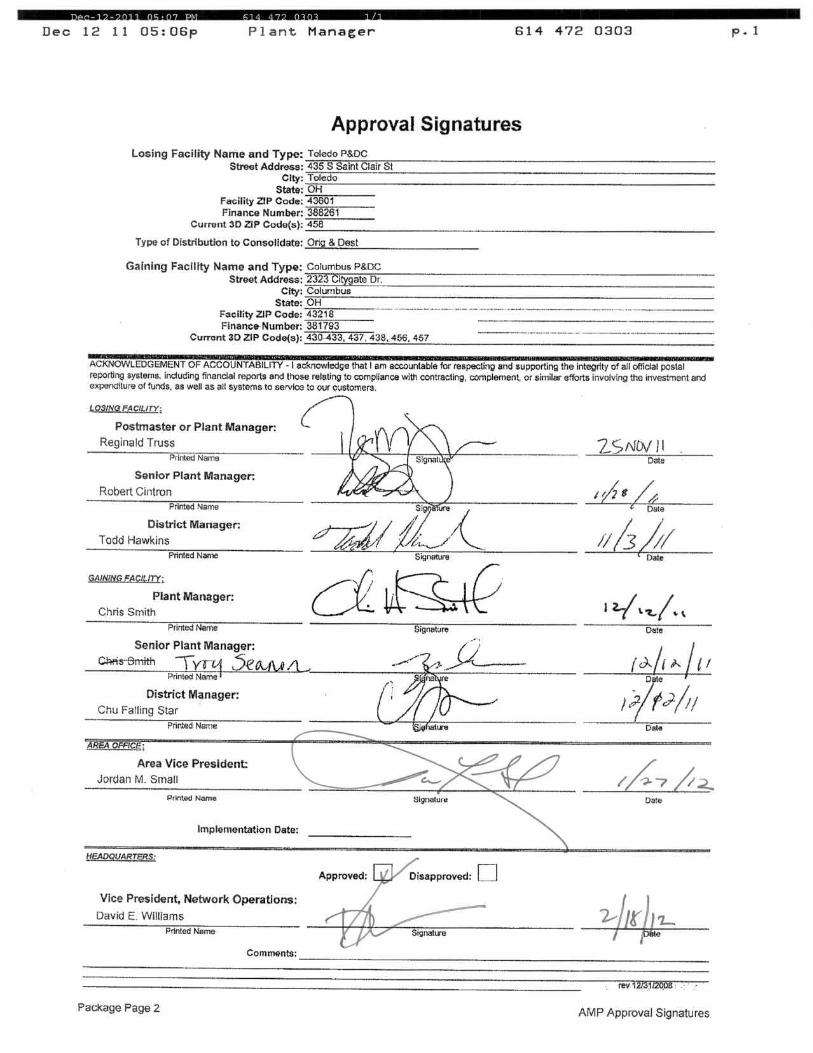
Reginald Truss
1. Losing Facility Information
Jug S. Bedi
458
Chris SmithChu Falling Star
Jordan M. SmallDavid E. Williams
Todd Hawkins
Columbus P&DC2323 Citygate Dr.
Chris Smith
4. Other Information
Robert Cintron
Columbus
430-433, 437, 438, 456, 457
2. Gaining Facility Information
Bob Roseberry
Date & Time this workbook was last saved:
3. Background Information
Date of HQ memo, DAR Factors/Cost of Borrowing/ New Facility Start-up Costs Update
Package Page 1 AMP Data Entry Page
Losing Facility Name and Type:Current 3D ZIP Code(s):
Type of Distribution to Consolidate:
Gaining Facility Name and Type:Current 3D ZIP Code(s):
rev 06/10/2009
February 18, 2012
430-433, 437, 438, 456, 457
Orig & Dest
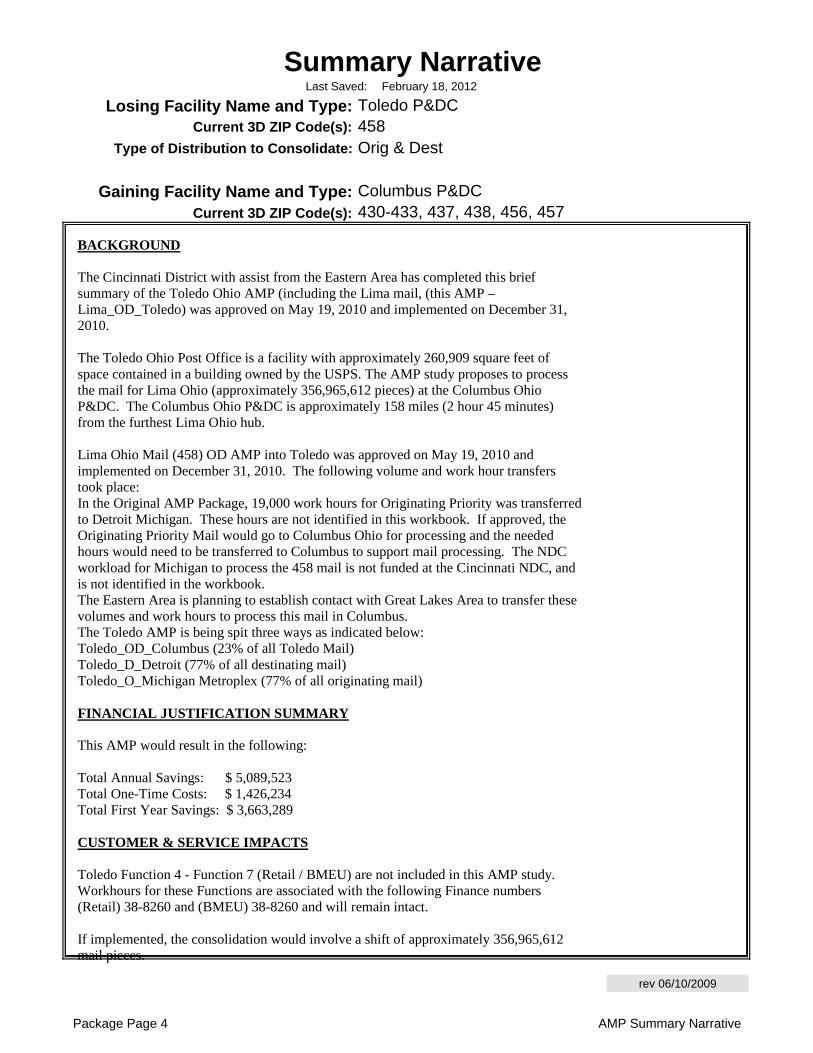
Summary NarrativeLast Saved:
Toledo P&DC
Columbus P&DC
458
BACKGROUND The Cincinnati District with assist from the Eastern Area has completed this brief summary of the Toledo Ohio AMP (including the Lima mail, (this AMP – Lima_OD_Toledo) was approved on May 19, 2010 and implemented on December 31, 2010. The Toledo Ohio Post Office is a facility with approximately 260,909 square feet of space contained in a building owned by the USPS. The AMP study proposes to process the mail for Lima Ohio (approximately 356,965,612 pieces) at the Columbus Ohio P&DC. The Columbus Ohio P&DC is approximately 158 miles (2 hour 45 minutes) from the furthest Lima Ohio hub. Lima Ohio Mail (458) OD AMP into Toledo was approved on May 19, 2010 and implemented on December 31, 2010. The following volume and work hour transfers took place: In the Original AMP Package, 19,000 work hours for Originating Priority was transferred to Detroit Michigan. These hours are not identified in this workbook. If approved, the Originating Priority Mail would go to Columbus Ohio for processing and the needed hours would need to be transferred to Columbus to support mail processing. The NDC workload for Michigan to process the 458 mail is not funded at the Cincinnati NDC, and is not identified in the workbook. The Eastern Area is planning to establish contact with Great Lakes Area to transfer these volumes and work hours to process this mail in Columbus. The Toledo AMP is being spit three ways as indicated below: Toledo_OD_Columbus (23% of all Toledo Mail) Toledo_D_Detroit (77% of all destinating mail) Toledo_O_Michigan Metroplex (77% of all originating mail) FINANCIAL JUSTIFICATION SUMMARY This AMP would result in the following: Total Annual Savings: $ 5,089,523 Total One-Time Costs: $ 1,426,234 Total First Year Savings: $ 3,663,289 CUSTOMER & SERVICE IMPACTS Toledo Function 4 - Function 7 (Retail / BMEU) are not included in this AMP study. Workhours for these Functions are associated with the following Finance numbers (Retail) 38-8260 and (BMEU) 38-8260 and will remain intact. If implemented, the consolidation would involve a shift of approximately 356,965,612 mail pieces.
Package Page 4 AMP Summary Narrative
rev 06/10/2009
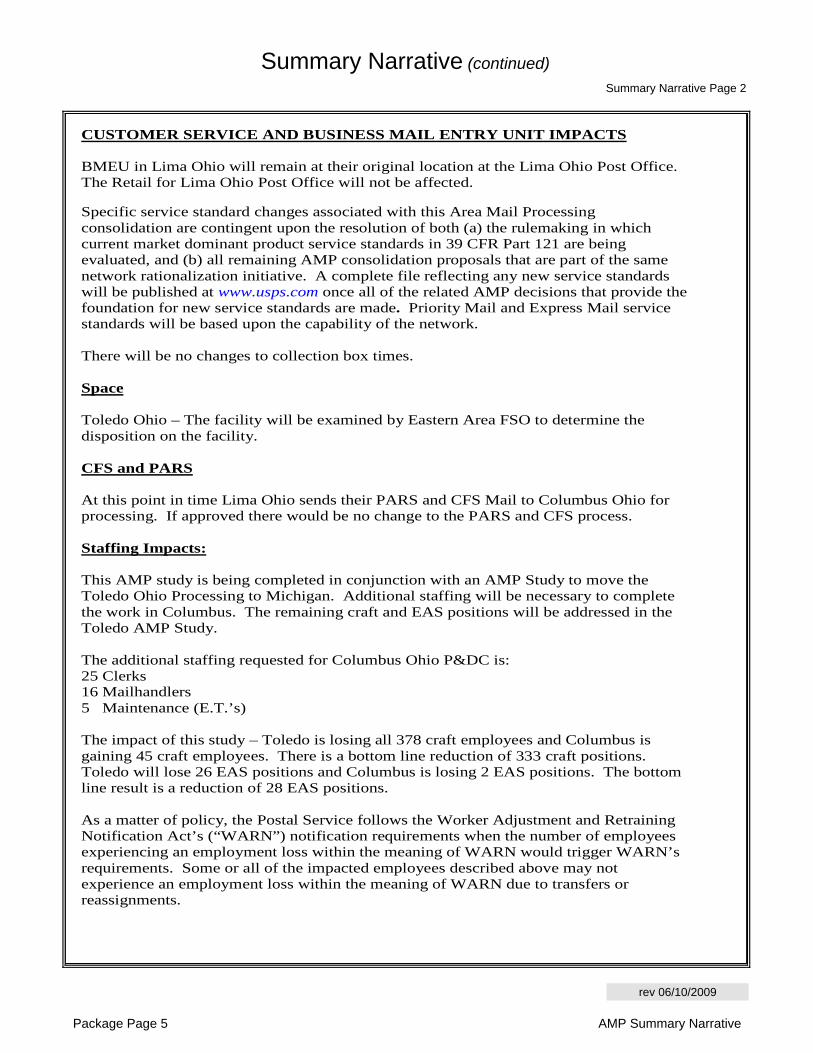
Summary Narrative (continued)Summary Narrative Page 2
CUSTOMER SERVICE AND BUSINESS MAIL ENTRY UNIT IMPACTS BMEU in Lima Ohio will remain at their original location at the Lima Ohio Post Office. The Retail for Lima Ohio Post Office will not be affected. Specific service standard changes associated with this Area Mail Processing consolidation are contingent upon the resolution of both (a) the rulemaking in which current market dominant product service standards in 39 CFR Part 121 are being evaluated, and (b) all remaining AMP consolidation proposals that are part of the same network rationalization initiative. A complete file reflecting any new service standards will be published at www.usps.com once all of the related AMP decisions that provide the foundation for new service standards are made. Priority Mail and Express Mail service standards will be based upon the capability of the network. There will be no changes to collection box times. Space Toledo Ohio – The facility will be examined by Eastern Area FSO to determine the disposition on the facility. CFS and PARS At this point in time Lima Ohio sends their PARS and CFS Mail to Columbus Ohio for processing. If approved there would be no change to the PARS and CFS process. Staffing Impacts: This AMP study is being completed in conjunction with an AMP Study to move the Toledo Ohio Processing to Michigan. Additional staffing will be necessary to complete the work in Columbus. The remaining craft and EAS positions will be addressed in the Toledo AMP Study. The additional staffing requested for Columbus Ohio P&DC is: 25 Clerks 16 Mailhandlers 5 Maintenance (E.T.’s) The impact of this study – Toledo is losing all 378 craft employees and Columbus is gaining 45 craft employees. There is a bottom line reduction of 333 craft positions. Toledo will lose 26 EAS positions and Columbus is losing 2 EAS positions. The bottom line result is a reduction of 28 EAS positions. As a matter of policy, the Postal Service follows the Worker Adjustment and Retraining Notification Act’s (“WARN”) notification requirements when the number of employees experiencing an employment loss within the meaning of WARN would trigger WARN’s requirements. Some or all of the impacted employees described above may not experience an employment loss within the meaning of WARN due to transfers or reassignments.
Package Page 5 AMP Summary Narrative

Summary Narrative Page 3Summary Narrative (continued)
Mail Processing Management to Craft Ratio
Current Proposed
SDOs to Craft 1 MDOs+SDOs to Craft 1 SDOs to Craft 1 MDOs+SDOs to Craft 1
Management to Craft 2 Ratios (1:25 target) (1:22 target) (1:25 target) (1:22 target)
Losing 1 : 34 1 : 30 Not Applic Not Applic
Gaining 1 : 27 1 : 23 1 : 29 1 : 25
1 Craft = FTR+PTR+PTF+Casuals
2 Craft = F1 + F4 at Losing; F1 only at Gaining
Management and Craft Staffing Impacts
Losing Site Gaining Site
Current
On-Rolls Proposed Diff Current
On-Rolls Proposed Diff Net Diff
Craft 1
378 - (378)
1,245
1,290
45
(333)
Management
26 - (26)
80
78
(2)
(28)
1 Craft = FTR+PTR+PTF+Casuals
TRANSPORTATION Incoming: All Incoming Mail for Lima Ohio will be processed in Columbus Ohio. Mail will be transported to Columbus Ohio via five hub offices in SFC 458. Destinating: All Destinating Mail for Lima Ohio will be processed in Columbus Ohio. Mail will be transported back to five hub offices in Lima to be dispatched to downstream offices. Express Mail: Destinating Express Mail will continue to be processed in Dayton Ohio. The Originating Express Mail will be processed in Columbus Ohio.
Package Page 6 AMP Summary Narrative
Losing Facility Name and Type:Current 3D ZIP Code(s):
Type of Distribution to Consolidate:
Gaining Facility Name and Type:Current 3D ZIP Code(s):
rev 04/2/2008
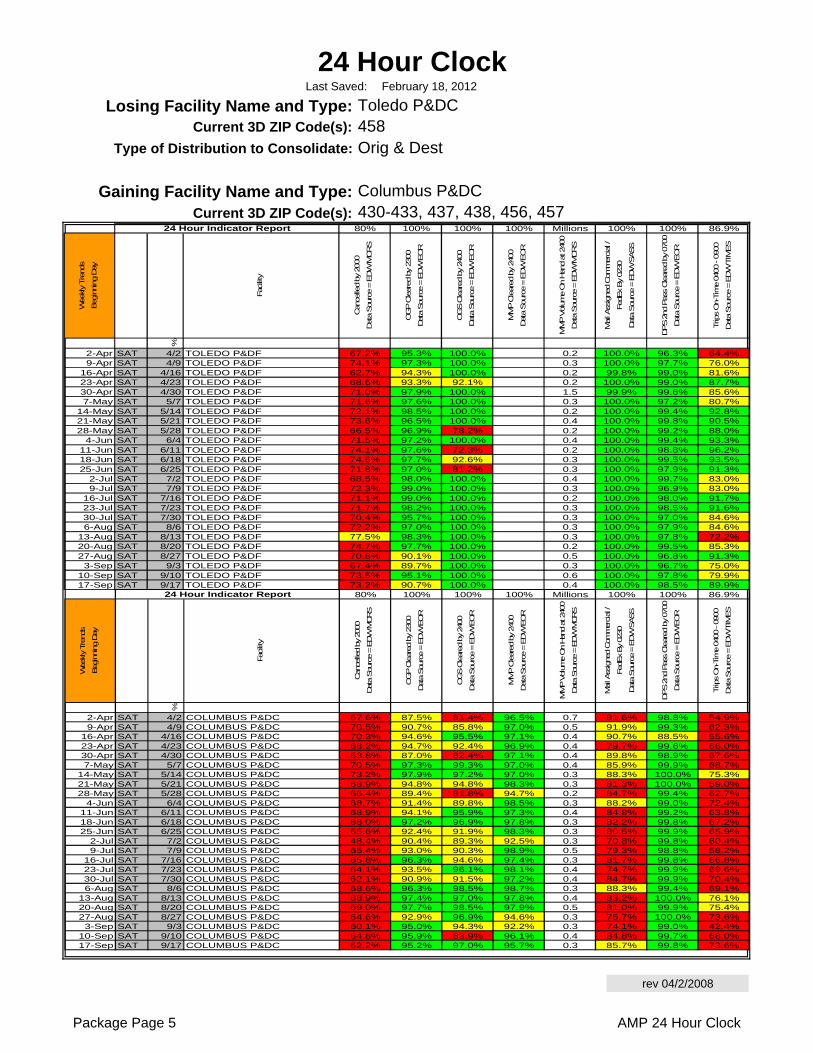
24 Hour ClockLast Saved:
Toledo P&DC
Columbus P&DC
458
February 18, 2012
430-433, 437, 438, 456, 457
Orig & Dest
80% 100% 100% 100% Millions 100% 100% 86.9%
Wee
kly Tr
ends
Beg
inning
Day
Facility
Can
celle
d by
200
0
Dat
a So
urce
= E
DW
MCRS
OG
P Cle
ared
by
2300
Dat
a So
urce
= E
DW
EOR
OG
S Cle
ared
by
2400
Dat
a So
urce
= E
DW
EOR
MM
P Cle
ared
by
2400
Dat
a So
urce
= E
DW
EOR
MM
P Volum
e On
Han
d at
240
0
Dat
a So
urce
= E
DW
MCRS
Mai
l Ass
igne
d Com
mer
cial /
FedE
x By
023
0
Dat
a Sou
rce
= ED
W S
ASS
DPS
2nd
Pass
Cle
ared
by 07
00
Dat
a So
urce
= E
DW
EOR
Trip
s On-
Tim
e 04
00 -
0900
Dat
a So
urce
= E
DW
TIM
ES
%
2-Apr SAT 4/2 TOLEDO P&DF 67.2% 95.3% 100.0% 0.2 100.0% 96.3% 64.4%9-Apr SAT 4/9 TOLEDO P&DF 74.1% 97.3% 100.0% 0.3 100.0% 97.7% 76.0%
16-Apr SAT 4/16 TOLEDO P&DF 62.7% 94.3% 100.0% 0.2 99.8% 99.0% 81.6%23-Apr SAT 4/23 TOLEDO P&DF 68.6% 93.3% 92.1% 0.2 100.0% 99.0% 87.7%30-Apr SAT 4/30 TOLEDO P&DF 71.0% 97.9% 100.0% 1.5 99.9% 99.6% 85.6%7-May SAT 5/7 TOLEDO P&DF 71.6% 97.6% 100.0% 0.3 100.0% 97.2% 80.7%
14-May SAT 5/14 TOLEDO P&DF 72.1% 98.5% 100.0% 0.2 100.0% 99.4% 92.8%21-May SAT 5/21 TOLEDO P&DF 73.6% 96.5% 100.0% 0.4 100.0% 99.8% 90.5%28-May SAT 5/28 TOLEDO P&DF 66.5% 96.9% 78.2% 0.2 100.0% 99.2% 88.0%
4-Jun SAT 6/4 TOLEDO P&DF 71.5% 97.2% 100.0% 0.4 100.0% 99.4% 93.3%11-Jun SAT 6/11 TOLEDO P&DF 74.1% 97.6% 72.3% 0.2 100.0% 98.8% 96.2%18-Jun SAT 6/18 TOLEDO P&DF 74.6% 97.7% 92.6% 0.3 100.0% 99.5% 93.5%25-Jun SAT 6/25 TOLEDO P&DF 71.8% 97.0% 81.2% 0.3 100.0% 97.9% 91.3%
2-Jul SAT 7/2 TOLEDO P&DF 68.5% 98.0% 100.0% 0.4 100.0% 99.7% 83.0%9-Jul SAT 7/9 TOLEDO P&DF 72.3% 99.0% 100.0% 0.3 100.0% 96.9% 83.0%
16-Jul SAT 7/16 TOLEDO P&DF 71.1% 99.0% 100.0% 0.2 100.0% 98.0% 91.7%23-Jul SAT 7/23 TOLEDO P&DF 71.7% 98.2% 100.0% 0.3 100.0% 98.5% 91.6%30-Jul SAT 7/30 TOLEDO P&DF 70.4% 95.7% 100.0% 0.3 100.0% 97.0% 84.6%6-Aug SAT 8/6 TOLEDO P&DF 72.2% 97.0% 100.0% 0.3 100.0% 97.9% 84.6%
13-Aug SAT 8/13 TOLEDO P&DF 77.5% 98.3% 100.0% 0.3 100.0% 97.8% 72.2%20-Aug SAT 8/20 TOLEDO P&DF 74.7% 97.7% 100.0% 0.2 100.0% 99.5% 85.3%27-Aug SAT 8/27 TOLEDO P&DF 70.8% 90.1% 100.0% 0.5 100.0% 96.8% 91.3%3-Sep SAT 9/3 TOLEDO P&DF 67.4% 89.7% 100.0% 0.3 100.0% 96.7% 75.0%
10-Sep SAT 9/10 TOLEDO P&DF 73.5% 95.1% 100.0% 0.6 100.0% 97.8% 79.9%17-Sep SAT 9/17 TOLEDO P&DF 73.2% 90.7% 100.0% 0.4 100.0% 98.5% 89.9%
24 Hour Indicator Report
80% 100% 100% 100% Millions 100% 100% 86.9%
Wee
kly Tr
ends
Beg
inning
Day
Facility
Can
celle
d by
200
0
Dat
a So
urce
= E
DW
MCRS
OGP C
lear
ed b
y 23
00
Dat
a Sou
rce
= EDW
EOR
OGS C
lear
ed b
y 24
00
Dat
a Sou
rce
= EDW
EOR
MM
P C
lear
ed b
y 24
00
Dat
a Sou
rce
= EDW
EOR
MM
P V
olum
e On
Han
d at
240
0
Dat
a So
urce
= E
DW
MCRS
Mail A
ssigne
d Com
mer
cial /
FedE
x By
023
0
Dat
a Sou
rce
= EDW
SASS
DPS 2
nd P
ass Cle
ared
by 07
00
Dat
a Sou
rce
= EDW
EOR
Trips On-
Tim
e 04
00 -
0900
Dat
a Sou
rce
= EDW
TIM
ES
%
2-Apr SAT 4/2 COLUMBUS P&DC 67.6% 87.5% 81.4% 96.5% 0.7 81.6% 98.8% 54.9%9-Apr SAT 4/9 COLUMBUS P&DC 70.5% 90.7% 85.8% 97.0% 0.5 91.9% 99.3% 62.3%
16-Apr SAT 4/16 COLUMBUS P&DC 70.3% 94.6% 95.5% 97.1% 0.4 90.7% 88.5% 55.6%23-Apr SAT 4/23 COLUMBUS P&DC 68.2% 94.7% 92.4% 96.9% 0.4 79.7% 99.6% 66.0%30-Apr SAT 4/30 COLUMBUS P&DC 63.8% 87.0% 82.4% 97.1% 0.4 89.8% 98.9% 67.6%7-May SAT 5/7 COLUMBUS P&DC 70.5% 97.3% 99.3% 97.0% 0.4 85.9% 99.9% 68.7%
14-May SAT 5/14 COLUMBUS P&DC 73.2% 97.9% 97.2% 97.0% 0.3 88.3% 100.0% 75.3%21-May SAT 5/21 COLUMBUS P&DC 68.9% 94.8% 94.8% 98.3% 0.3 81.3% 100.0% 59.0%28-May SAT 5/28 COLUMBUS P&DC 66.4% 89.4% 81.8% 94.7% 0.2 84.7% 99.4% 62.7%
4-Jun SAT 6/4 COLUMBUS P&DC 68.7% 91.4% 89.8% 98.5% 0.3 88.2% 99.0% 72.4%11-Jun SAT 6/11 COLUMBUS P&DC 68.9% 94.1% 95.9% 97.3% 0.4 84.8% 99.2% 63.8%18-Jun SAT 6/18 COLUMBUS P&DC 68.0% 97.2% 96.9% 97.8% 0.3 82.2% 99.8% 67.2%25-Jun SAT 6/25 COLUMBUS P&DC 65.6% 92.4% 91.9% 98.3% 0.3 80.5% 99.9% 65.9%
2-Jul SAT 7/2 COLUMBUS P&DC 48.4% 90.4% 89.3% 92.5% 0.3 70.8% 99.8% 60.4%9-Jul SAT 7/9 COLUMBUS P&DC 65.4% 93.0% 90.3% 98.9% 0.5 79.3% 98.8% 58.2%
16-Jul SAT 7/16 COLUMBUS P&DC 65.8% 96.3% 94.6% 97.4% 0.3 81.7% 99.8% 66.8%23-Jul SAT 7/23 COLUMBUS P&DC 64.1% 93.5% 96.1% 98.1% 0.4 74.7% 99.9% 69.6%30-Jul SAT 7/30 COLUMBUS P&DC 62.1% 90.9% 91.5% 97.2% 0.4 84.7% 99.9% 70.4%6-Aug SAT 8/6 COLUMBUS P&DC 68.6% 96.3% 98.5% 98.7% 0.3 88.3% 99.4% 69.1%
13-Aug SAT 8/13 COLUMBUS P&DC 68.9% 97.4% 97.0% 97.8% 0.4 83.2% 100.0% 76.1%20-Aug SAT 8/20 COLUMBUS P&DC 69.0% 97.7% 98.5% 97.9% 0.5 81.0% 99.9% 75.4%27-Aug SAT 8/27 COLUMBUS P&DC 64.6% 92.9% 96.9% 94.6% 0.3 75.7% 100.0% 73.6%3-Sep SAT 9/3 COLUMBUS P&DC 60.1% 95.0% 94.3% 92.2% 0.3 74.1% 99.0% 42.4%
10-Sep SAT 9/10 COLUMBUS P&DC 64.8% 95.9% 83.9% 96.1% 0.4 84.8% 99.7% 68.0%17-Sep SAT 9/17 COLUMBUS P&DC 62.2% 95.2% 97.0% 95.7% 0.3 85.7% 99.8% 73.6%
24 Hour Indicator Report
Package Page 5 AMP 24 Hour Clock
Last Saved:
Losing Facility Name and Type:Current 3D ZIP Code(s):
Miles to Gaining Facility:
Gaining Facility Name and Type:Current 3D ZIP Code(s):
rev 03/20/2008
430-433, 437, 438, 456, 457
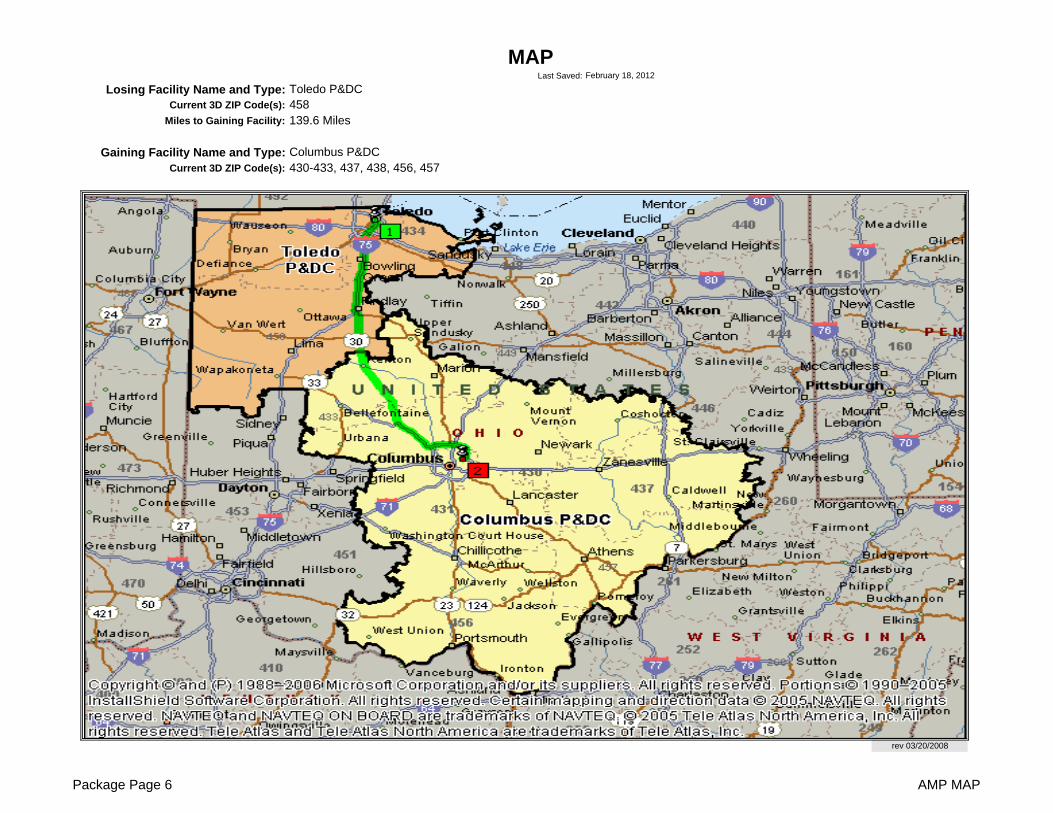
MAPToledo P&DC
Columbus P&DC
458
February 18, 2012
139.6 Miles
Package Page 6 AMP MAP

Overnight % Change All Others % Change Total % Change All % Change All % Change All % Change All % Change All % ChangeUPGRADE TBDDOWNGRADE TBDTOTAL TBDNET UP+NO CHNG TBD
VOLUME TOTAL TBD
* - Periodical and Standard mail origin 3-digit ZIP Code to destination 3-digit ZIP Code volume is not available
Overnight % Change All Others % Change Total % Change All % Change All % Change All % Change All % Change All % ChangeUPGRADE TBDDOWNGRADE TBDTOTAL TBDNET TBD
Toledo P&DC
458430-433, 437, 438, 456, 457Gaining Facility 3D ZIP Code(s):
Service Standard Changes - PairsFCM PRI
PSVC
Service Standard Changes - Average Daily Volume (data obtained from ODIS is derived from sampling and may vary from actual volume)
PSVC ALL CLASSES
rev 10/16/2009
Losing Facility 3D ZIP Code(s):
mm/dd/yyyy
Selected summary fields are transferred to the Executive Summary
PER STD
February 18, 2012
Losing Facility:
Service Standard Impacts
PRI ALL CLASSESSTD *FCM PER *
Based on report prepared by Network Integration Support dated:
Last Saved:
Package Page 7 AMP Service Standard Impacts

Last Saved: Stakeholder Notification Page 1AMP Event: Start of Study
rev 07/16/2008
Stakeholders Notification Losing Facility:
February 18, 2012(WorkBook Tab Notification - 1)Toledo P&DC
Package Page 8 AMP Stakeholders Notification
Last Saved:
07/01/10 <<=== : ===>> 06/30/11
LDC LDC LDC LDC
11 $36.25 41 $0.00 11 $37.61 41 $36.64
12 $40.59 42 $0.00 12 $39.88 42 $36.38
13 $40.86 43 $14.52 13 $37.25 43 $0.00
14 $35.00 44 $0.00 14 $44.85 44 $0.00
15 $34.40 45 $34.74 15 $36.89 45 $0.00
16 $0.00 46 $0.00 16 $0.00 46 $0.00
17 $37.67 47 $0.00 17 $39.36 47 $0.00
18 $41.59 48 $12.89 18 $37.95 48 $39.66
(1) (2) (3) (4) (5) (6) (7) (8) (9) (10) (11) (12) (13) (14)Current Current Current Current Current Current Current Current Current Current Current Current
Operation Annual FHP Annual TPH or Annual Productivity Annual Operation Annual FHP Annual TPH or Annual Productivity AnnualNumbers Workhour Costs Numbers Workhour Costs
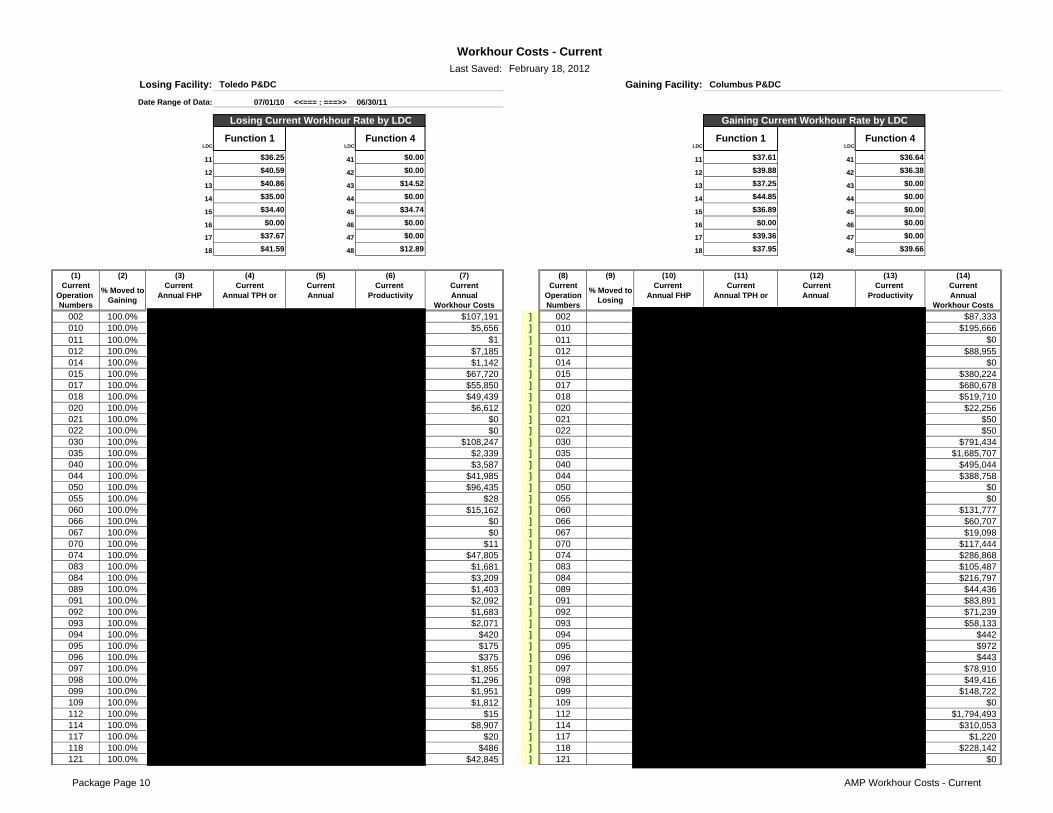
002 100.0% $107,191 \ ] 002 $87,333010 100.0% $5,656 \ ] 010 $195,666011 100.0% $1 \ ] 011 $0012 100.0% $7,185 \ ] 012 $88,955014 100.0% $1,142 \ ] 014 $0015 100.0% $67,720 \ ] 015 $380,224017 100.0% $55,850 \ ] 017 $680,678018 100.0% $49,439 \ ] 018 $519,710020 100.0% $6,612 \ ] 020 $22,256021 100.0% $0 \ ] 021 $50022 100.0% $0 \ ] 022 $50030 100.0% $108,247 \ ] 030 $791,434035 100.0% $2,339 \ ] 035 $1,685,707040 100.0% $3,587 \ ] 040 $495,044044 100.0% $41,985 \ ] 044 $388,758050 100.0% $96,435 \ ] 050 $0055 100.0% $28 \ ] 055 $0060 100.0% $15,162 \ ] 060 $131,777066 100.0% $0 \ ] 066 $60,707067 100.0% $0 \ ] 067 $19,098070 100.0% $11 \ ] 070 $117,444074 100.0% $47,805 \ ] 074 $286,868083 100.0% $1,681 \ ] 083 $105,487084 100.0% $3,209 \ ] 084 $216,797089 100.0% $1,403 \ ] 089 $44,436091 100.0% $2,092 \ ] 091 $83,891092 100.0% $1,683 \ ] 092 $71,239093 100.0% $2,071 \ ] 093 $58,133094 100.0% $420 \ ] 094 $442095 100.0% $175 \ ] 095 $972096 100.0% $375 \ ] 096 $443097 100.0% $1,855 \ ] 097 $78,910098 100.0% $1,296 \ ] 098 $49,416099 100.0% $1,951 \ ] 099 $148,722109 100.0% $1,812 \ ] 109 $0112 100.0% $15 \ ] 112 $1,794,493114 100.0% $8,907 \ ] 114 $310,053117 100.0% $20 \ ] 117 $1,220118 100.0% $486 \ ] 118 $228,142121 100.0% $42,845 \ ] 121 $0
February 18, 2012Workhour Costs - Current
Toledo P&DC Columbus P&DC
Losing Current Workhour Rate by LDC
Function 4Function 1
% Moved to Losing
% Moved to Gaining
Losing Facility: Gaining Facility:Date Range of Data:
Function 1
Gaining Current Workhour Rate by LDC
Function 4
Package Page 10 AMP Workhour Costs - Current
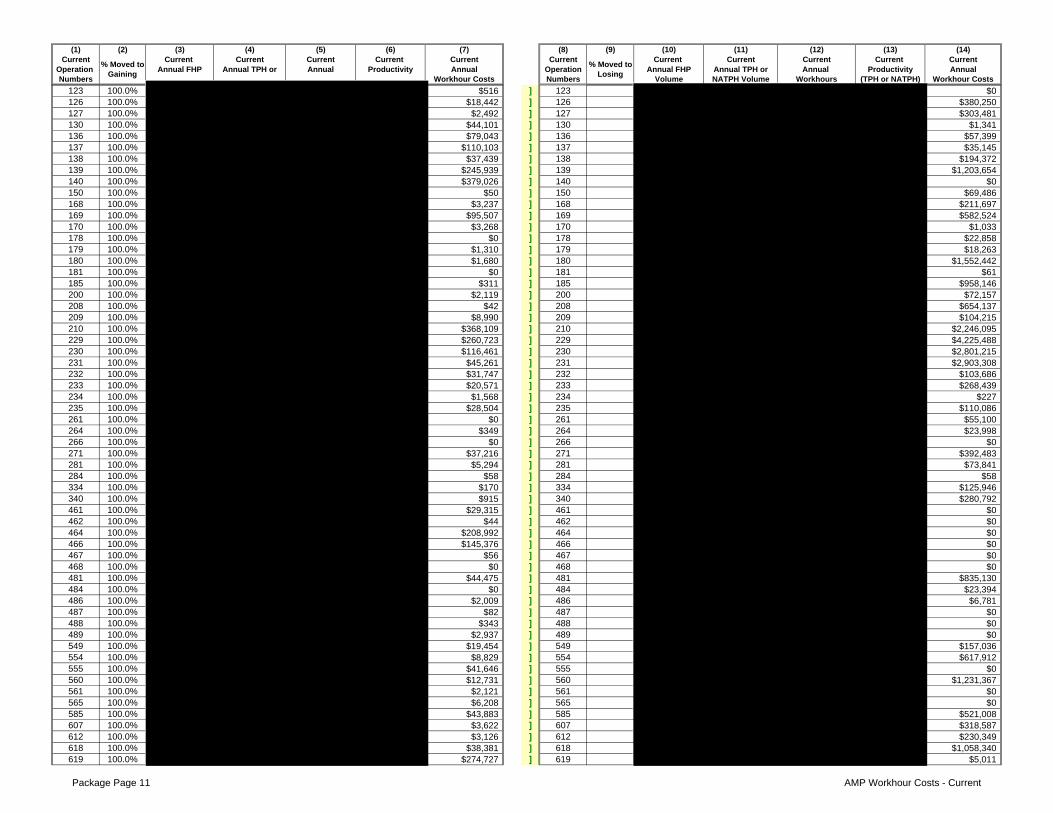
(1) (2) (3) (4) (5) (6) (7) (8) (9) (10) (11) (12) (13) (14)Current Current Current Current Current Current Current Current Current Current Current Current
Operation Annual FHP Annual TPH or Annual Productivity Annual Operation Annual FHP Annual TPH or Annual Productivity AnnualNumbers Workhour Costs Numbers Volume NATPH Volume Workhours (TPH or NATPH) Workhour Costs
% Moved to Losing
% Moved to Gaining
123 100.0% $516 \ ] 123 $0126 100.0% $18,442 \ ] 126 $380,250127 100.0% $2,492 \ ] 127 $303,481130 100.0% $44,101 \ ] 130 $1,341136 100.0% $79,043 \ ] 136 $57,399137 100.0% $110,103 \ ] 137 $35,145138 100.0% $37,439 \ ] 138 $194,372139 100.0% $245,939 \ ] 139 $1,203,654140 100.0% $379,026 \ ] 140 $0150 100.0% $50 \ ] 150 $69,486168 100.0% $3,237 \ ] 168 $211,697169 100.0% $95,507 \ ] 169 $582,524170 100.0% $3,268 \ ] 170 $1,033178 100.0% $0 \ ] 178 $22,858179 100.0% $1,310 \ ] 179 $18,263180 100.0% $1,680 \ ] 180 $1,552,442181 100.0% $0 \ ] 181 $61185 100.0% $311 \ ] 185 $958,146200 100.0% $2,119 \ ] 200 $72,157208 100.0% $42 \ ] 208 $654,137209 100.0% $8,990 \ ] 209 $104,215210 100.0% $368,109 \ ] 210 $2,246,095229 100.0% $260,723 \ ] 229 $4,225,488230 100.0% $116,461 \ ] 230 $2,801,215231 100.0% $45,261 \ ] 231 $2,903,308232 100.0% $31,747 \ ] 232 $103,686233 100.0% $20,571 \ ] 233 $268,439234 100.0% $1,568 \ ] 234 $227235 100.0% $28,504 \ ] 235 $110,086261 100.0% $0 \ ] 261 $55,100264 100.0% $349 \ ] 264 $23,998266 100.0% $0 \ ] 266 $0271 100.0% $37,216 \ ] 271 $392,483281 100.0% $5,294 \ ] 281 $73,841284 100.0% $58 \ ] 284 $58334 100.0% $170 \ ] 334 $125,946340 100.0% $915 \ ] 340 $280,792461 100.0% $29,315 \ ] 461 $0462 100.0% $44 \ ] 462 $0464 100.0% $208,992 \ ] 464 $0466 100.0% $145,376 \ ] 466 $0467 100.0% $56 \ ] 467 $0468 100.0% $0 \ ] 468 $0481 100.0% $44,475 \ ] 481 $835,130484 100.0% $0 \ ] 484 $23,394486 100.0% $2,009 \ ] 486 $6,781487 100.0% $82 \ ] 487 $0488 100.0% $343 \ ] 488 $0489 100.0% $2,937 \ ] 489 $0549 100.0% $19,454 \ ] 549 $157,036554 100.0% $8,829 \ ] 554 $617,912555 100.0% $41,646 \ ] 555 $0560 100.0% $12,731 \ ] 560 $1,231,367561 100.0% $2,121 \ ] 561 $0565 100.0% $6,208 \ ] 565 $0585 100.0% $43,883 \ ] 585 $521,008607 100.0% $3,622 \ ] 607 $318,587612 100.0% $3,126 \ ] 612 $230,349618 100.0% $38,381 \ ] 618 $1,058,340619 100.0% $274,727 \ ] 619 $5,011
Package Page 11 AMP Workhour Costs - Current
(1) (2) (3) (4) (5) (6) (7) (8) (9) (10) (11) (12) (13) (14)Current Current Current Current Current Current Current Current Current Current Current Current
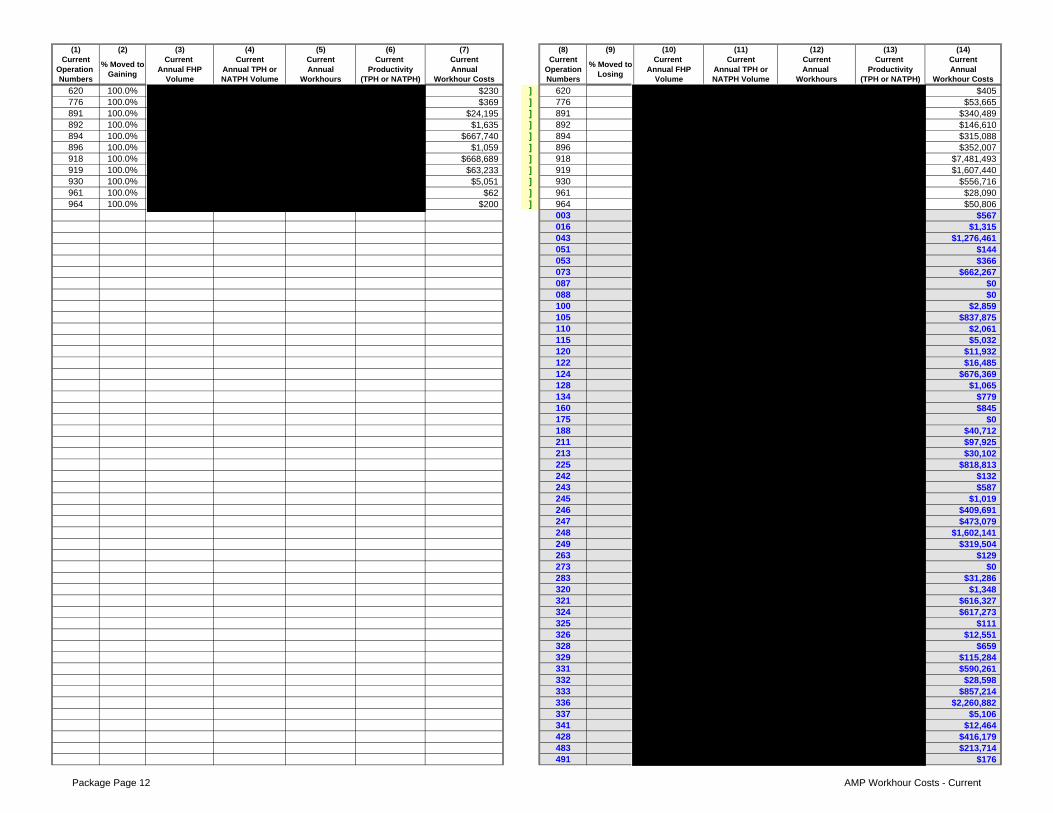
Operation Annual FHP Annual TPH or Annual Productivity Annual Operation Annual FHP Annual TPH or Annual Productivity AnnualNumbers Volume NATPH Volume Workhours (TPH or NATPH) Workhour Costs Numbers Volume NATPH Volume Workhours (TPH or NATPH) Workhour Costs
% Moved to Losing
% Moved to Gaining
620 100.0% $230 \ ] 620 $405776 100.0% $369 \ ] 776 $53,665891 100.0% $24,195 \ ] 891 $340,489892 100.0% $1,635 \ ] 892 $146,610894 100.0% $667,740 \ ] 894 $315,088896 100.0% $1,059 \ ] 896 $352,007918 100.0% $668,689 \ ] 918 $7,481,493919 100.0% $63,233 \ ] 919 $1,607,440930 100.0% $5,051 \ ] 930 $556,716961 100.0% $62 \ ] 961 $28,090964 100.0% $200 \ ] 964 $50,806
\ ] 003 $567\ ] 016 $1,315\ ] 043 $1,276,461\ ] 051 $144\ ] 053 $366\ ] 073 $662,267\ ] 087 $0\ ] 088 $0\ ] 100 $2,859\ ] 105 $837,875\ ] 110 $2,061\ ] 115 $5,032\ ] 120 $11,932\ ] 122 $16,485\ ] 124 $676,369\ ] 128 $1,065\ ] 134 $779\ ] 160 $845\ ] 175 $0\ ] 188 $40,712\ ] 211 $97,925\ ] 213 $30,102\ ] 225 $818,813\ ] 242 $132\ ] 243 $587\ ] 245 $1,019\ ] 246 $409,691\ ] 247 $473,079\ ] 248 $1,602,141\ ] 249 $319,504\ ] 263 $129\ ] 273 $0\ ] 283 $31,286\ ] 320 $1,348\ ] 321 $616,327\ ] 324 $617,273\ ] 325 $111\ ] 326 $12,551\ ] 328 $659\ ] 329 $115,284\ ] 331 $590,261\ ] 332 $28,598\ ] 333 $857,214\ ] 336 $2,260,882\ ] 337 $5,106\ ] 341 $12,464\ ] 428 $416,179\ ] 483 $213,714\ ] 491 $176
Package Page 12 AMP Workhour Costs - Current
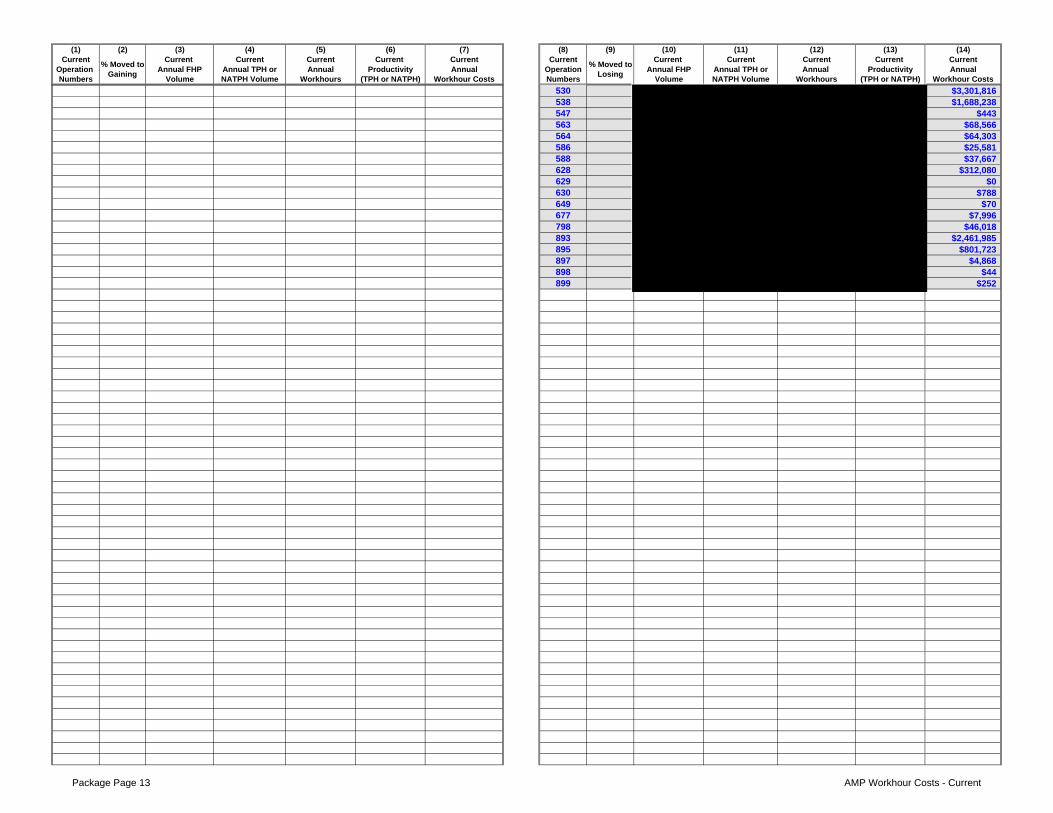
(1) (2) (3) (4) (5) (6) (7) (8) (9) (10) (11) (12) (13) (14)Current Current Current Current Current Current Current Current Current Current Current Current
Operation Annual FHP Annual TPH or Annual Productivity Annual Operation Annual FHP Annual TPH or Annual Productivity AnnualNumbers Volume NATPH Volume Workhours (TPH or NATPH) Workhour Costs Numbers Volume NATPH Volume Workhours (TPH or NATPH) Workhour Costs
% Moved to Losing
% Moved to Gaining
\ ] 530 $3,301,816\ ] 538 $1,688,238\ ] 547 $443\ ] 563 $68,566\ ] 564 $64,303\ ] 586 $25,581\ ] 588 $37,667\ ] 628 $312,080\ ] 629 $0\ ] 630 $788\ ] 649 $70\ ] 677 $7,996\ ] 798 $46,018\ ] 893 $2,461,985\ ] 895 $801,723\ ] 897 $4,868\ ] 898 $44\ ] 899 $252\ ]\ ]\ ]\ ]\ ]\ ]\ ]\ ]\ ]\ ]\ ]\ ]\ ]\ ]\ ]\ ]\ ]\ ]\ ]\ ]\ ]\ ]\ ]\ ]\ ]\ ]\ ]\ ]\ ]\ ]\ ]\ ]\ ]\ ]\ ]\ ]\ ]\ ]\ ]\ ]\ ]\ ]
Package Page 13 AMP Workhour Costs - Current

(1) (2) (3) (4) (5) (6) (7) (8) (9) (10) (11) (12) (13) (14)Current Current Current Current Current Current Current Current Current Current Current Current
Operation Annual FHP Annual TPH or Annual Productivity Annual Operation Annual FHP Annual TPH or Annual Productivity AnnualNumbers Volume NATPH Volume Workhours (TPH or NATPH) Workhour Costs Numbers Volume NATPH Volume Workhours (TPH or NATPH) Workhour Costs
% Moved to Losing
% Moved to Gaining
\ ]\ ]\ ]\ ]\ ]\ ]\ ]\ ]\ ]\ ]\ ]\ ]\ ]\ ]\ ]\ ]\ ]\ ]\ ]\ ]\ ]\ ]\ ]\ ]\ ]\ ]\ ]\ ]\ ]\ ]\ ]\ ]\ ]\ ]\ ]\ ]\ ]\ ]\ ]\ ]\ ]\ ]\ ]\ ]\ ]\ ]\ ]\ ]\ ]\ ]\ ]\ ]\ ]\ ]\ ]\ ]\ ]\ ]\ ]\ ]
Package Page 14 AMP Workhour Costs - Current

(1) (2) (3) (4) (5) (6) (7) (8) (9) (10) (11) (12) (13) (14)Current Current Current Current Current Current Current Current Current Current Current Current
Operation Annual FHP Annual TPH or Annual Productivity Annual Operation Annual FHP Annual TPH or Annual Productivity AnnualNumbers Volume NATPH Volume Workhours (TPH or NATPH) Workhour Costs Numbers Volume NATPH Volume Workhours (TPH or NATPH) Workhour Costs
% Moved to Losing
% Moved to Gaining
\ ]\ ]\ ]\ ]\ ]\ ]\ ]\ ]\ ]\ ]\ ]\ ]\ ]\ ]\ ]\ ]\ ]\ ]\ ]\ ]\ ]\ ]\ ]\ ]\ ]\ ]\ ]\ ]\ ]\ ]
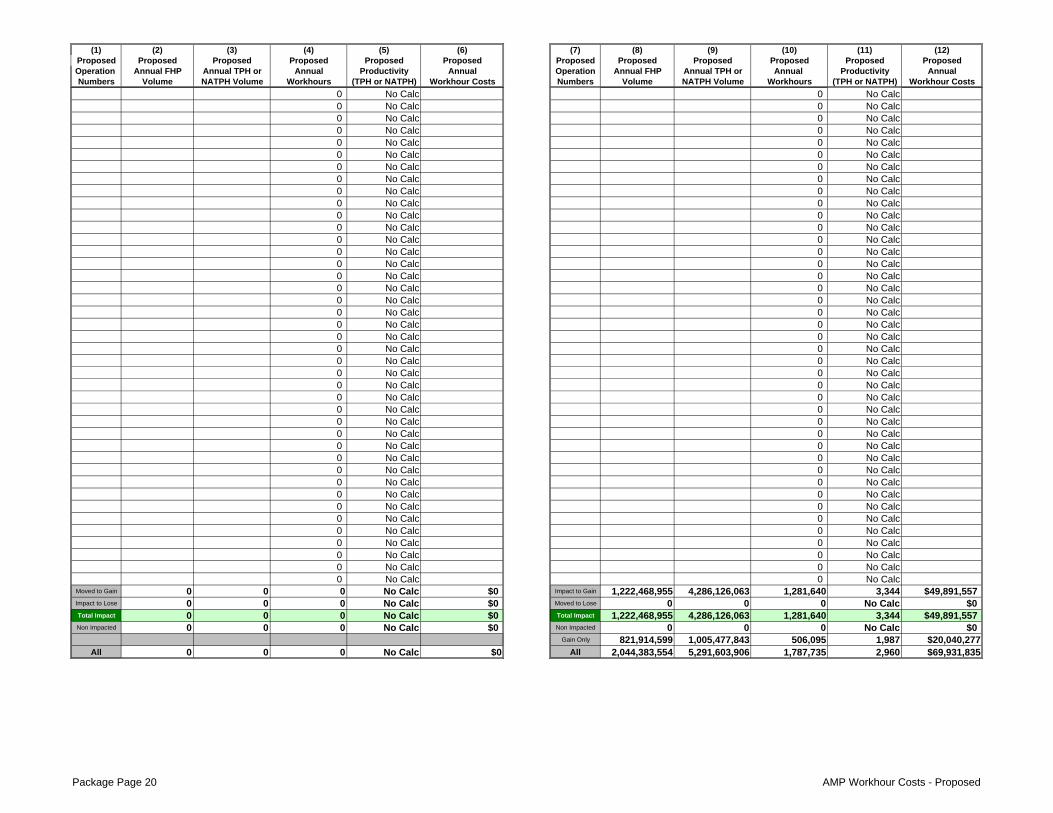
Moved to Gain 181,563,017 419,046,588 131,329 3,191 $4,960,072 Impact to Gain 1,040,905,938 3,867,079,475 1,158,602 3,338 $45,115,704Impact to Lose 0 0 0 No Calc $0 Moved to Lose 0 0 0 No Calc $0Total Impact 181,563,017 419,046,588 131,329 3,191 $4,960,072 Total Impact 1,040,905,938 3,867,079,475 1,158,602 3,338 $45,115,704Non-impacted 0 0 0 No Calc $0 Non-impacted 0 0 0 No Calc $0
Gain Only 821,914,599 1,005,477,843 555,140 1,811 $21,892,127All 181,563,017 419,046,588 131,329 3,191 $4,960,072 All 1,862,820,537 4,872,557,318 1,713,742 2,843 $67,007,831
Impact to Gain 1,222,468,955 4,286,126,063 1,289,932 3,323 $50,075,776Impact to Lose 0 0 0 No Calc $0Total Impact 1,222,468,955 4,286,126,063 1,289,932 3,323 $50,075,776Non-impacted 0 0 0 No Calc $0
Gain Only 821,914,599 1,005,477,843 555,140 1,811 $21,892,127All 2,044,383,554 5,291,603,906 1,845,072 2,868 $71,967,904
.
rev 06/11/2008
Comb Totals
Totals Totals
(This number is carried forward to AMP Worksheet Executive Summary )
Combined Current Workhour Annual Workhour Costs :
585,687 Total FHP to be Transferred (Average Daily Volume) :
(This number is carried forward to the bottom of AMP Worksheet Workhour Costs-Proposed )$71,967,904
Current FHP at Gaining Facility (Average Daily Volume) : 6,009,099 (This number is carried forward to AMP Worksheet Executive Summary )
Package Page 15 AMP Workhour Costs - Current
Last Saved:Losing Facility: Gaining Facility:
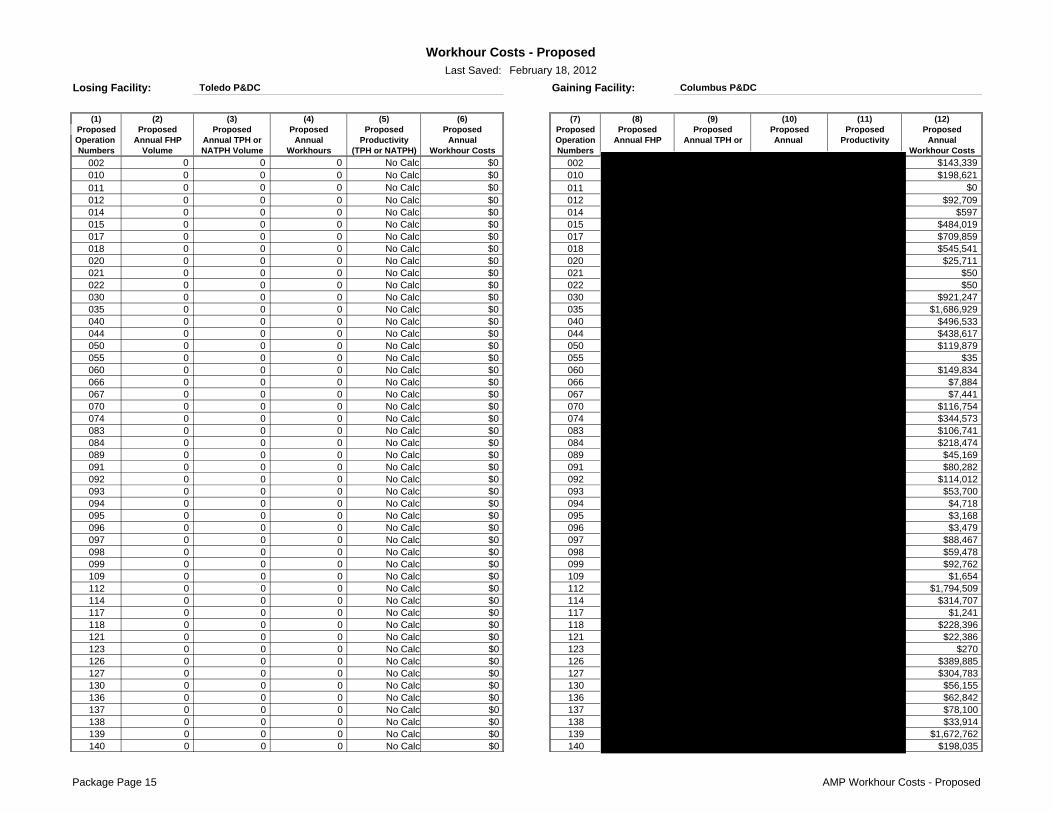
(1) (2) (3) (4) (5) (6) (7) (8) (9) (10) (11) (12)Proposed Proposed Proposed Proposed Proposed Proposed Proposed Proposed Proposed Proposed Proposed ProposedOperation Annual FHP Annual TPH or Annual Productivity Annual Operation Annual FHP Annual TPH or Annual Productivity AnnualNumbers Volume NATPH Volume Workhours (TPH or NATPH) Workhour Costs Numbers Workhour Costs
002 0 0 0 No Calc $0 002 $143,339010 0 0 0 No Calc $0 010 $198,621011 0 0 0 No Calc $0 011 $0012 0 0 0 No Calc $0 012 $92,709014 0 0 0 No Calc $0 014 $597015 0 0 0 No Calc $0 015 $484,019017 0 0 0 No Calc $0 017 $709,859018 0 0 0 No Calc $0 018 $545,541020 0 0 0 No Calc $0 020 $25,711021 0 0 0 No Calc $0 021 $50022 0 0 0 No Calc $0 022 $50030 0 0 0 No Calc $0 030 $921,247035 0 0 0 No Calc $0 035 $1,686,929040 0 0 0 No Calc $0 040 $496,533044 0 0 0 No Calc $0 044 $438,617050 0 0 0 No Calc $0 050 $119,879055 0 0 0 No Calc $0 055 $35060 0 0 0 No Calc $0 060 $149,834066 0 0 0 No Calc $0 066 $7,884067 0 0 0 No Calc $0 067 $7,441070 0 0 0 No Calc $0 070 $116,754074 0 0 0 No Calc $0 074 $344,573083 0 0 0 No Calc $0 083 $106,741084 0 0 0 No Calc $0 084 $218,474089 0 0 0 No Calc $0 089 $45,169091 0 0 0 No Calc $0 091 $80,282092 0 0 0 No Calc $0 092 $114,012093 0 0 0 No Calc $0 093 $53,700094 0 0 0 No Calc $0 094 $4,718095 0 0 0 No Calc $0 095 $3,168096 0 0 0 No Calc $0 096 $3,479097 0 0 0 No Calc $0 097 $88,467098 0 0 0 No Calc $0 098 $59,478099 0 0 0 No Calc $0 099 $92,762109 0 0 0 No Calc $0 109 $1,654112 0 0 0 No Calc $0 112 $1,794,509114 0 0 0 No Calc $0 114 $314,707117 0 0 0 No Calc $0 117 $1,241118 0 0 0 No Calc $0 118 $228,396121 0 0 0 No Calc $0 121 $22,386123 0 0 0 No Calc $0 123 $270126 0 0 0 No Calc $0 126 $389,885127 0 0 0 No Calc $0 127 $304,783130 0 0 0 No Calc $0 130 $56,155136 0 0 0 No Calc $0 136 $62,842137 0 0 0 No Calc $0 137 $78,100138 0 0 0 No Calc $0 138 $33,914139 0 0 0 No Calc $0 139 $1,672,762140 0 0 0 No Calc $0 140 $198,035
Workhour Costs - Proposed
Toledo P&DC
February 18, 2012Columbus P&DC
Package Page 15 AMP Workhour Costs - Proposed

(1) (2) (3) (4) (5) (6) (7) (8) (9) (10) (11) (12)Proposed Proposed Proposed Proposed Proposed Proposed Proposed Proposed Proposed Proposed Proposed ProposedOperation Annual FHP Annual TPH or Annual Productivity Annual Operation Annual FHP Annual TPH or Annual Productivity AnnualNumbers Volume NATPH Volume Workhours (TPH or NATPH) Workhour Costs Numbers Volume NATPH Volume Workhours (TPH or NATPH) Workhour Costs
150 0 0 0 No Calc $0 150 $69,131168 0 0 0 No Calc $0 168 $214,451169 0 0 0 No Calc $0 169 $697,754170 0 0 0 No Calc $0 170 $5,089178 0 0 0 No Calc $0 178 $22,721179 0 0 0 No Calc $0 179 $19,781180 0 0 0 No Calc $0 180 $1,553,320181 0 0 0 No Calc $0 181 $61185 0 0 0 No Calc $0 185 $958,471200 0 0 0 No Calc $0 200 $74,358208 0 0 0 No Calc $0 208 $654,159209 0 0 0 No Calc $0 209 $108,912210 0 0 0 No Calc $0 210 $2,438,427229 0 0 0 No Calc $0 229 $4,361,712230 0 0 0 No Calc $0 230 $2,862,064231 0 0 0 No Calc $0 231 $2,926,956232 0 0 0 No Calc $0 232 $132,655233 0 0 0 No Calc $0 233 $287,210234 0 0 0 No Calc $0 234 $1,658235 0 0 0 No Calc $0 235 $124,979261 0 0 0 No Calc $0 261 $57,024264 0 0 0 No Calc $0 264 $27,224266 0 0 0 No Calc $0 266 $0271 0 0 0 No Calc $0 271 $436,524281 0 0 0 No Calc $0 281 $84,079284 0 0 0 No Calc $0 284 $489334 0 0 0 No Calc $0 334 $248,759340 0 0 0 No Calc $0 340 $280,792461 0 0 0 No Calc $0 461 $29,857462 0 0 0 No Calc $0 462 $2,358464 0 0 0 No Calc $0 464 $127,336466 0 0 0 No Calc $0 466 $174,696467 0 0 0 No Calc $0 467 $923468 0 0 0 No Calc $0 468 $0481 0 0 0 No Calc $0 481 $1,003,135484 0 0 0 No Calc $0 484 $16,319486 0 0 0 No Calc $0 486 $15,054487 0 0 0 No Calc $0 487 $793488 0 0 0 No Calc $0 488 $1,117489 0 0 0 No Calc $0 489 $5,881549 0 0 0 No Calc $0 549 $174,788554 0 0 0 No Calc $0 554 $625,968555 0 0 0 No Calc $0 555 $38,002560 0 0 0 No Calc $0 560 $1,242,983561 0 0 0 No Calc $0 561 $1,936565 0 0 0 No Calc $0 565 $5,665585 0 0 0 No Calc $0 585 $561,051607 0 0 0 No Calc $0 607 $321,892612 0 0 0 No Calc $0 612 $233,201618 0 0 0 No Calc $0 618 $1,093,331619 0 0 0 No Calc $0 619 $255,472620 0 0 0 No Calc $0 620 $615776 0 0 0 No Calc $0 776 $47,318891 0 0 0 No Calc $0 891 $528,155892 0 0 0 No Calc $0 892 $247,654
Package Page 16 AMP Workhour Costs - Proposed
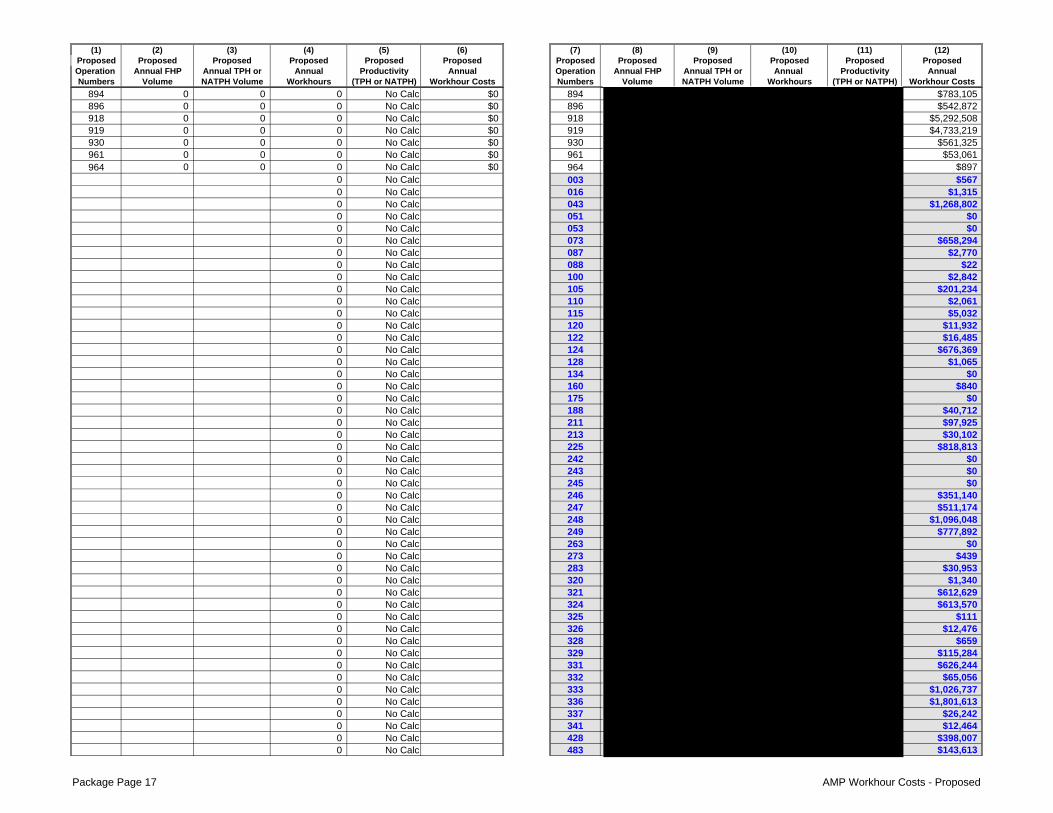
(1) (2) (3) (4) (5) (6) (7) (8) (9) (10) (11) (12)Proposed Proposed Proposed Proposed Proposed Proposed Proposed Proposed Proposed Proposed Proposed ProposedOperation Annual FHP Annual TPH or Annual Productivity Annual Operation Annual FHP Annual TPH or Annual Productivity AnnualNumbers Volume NATPH Volume Workhours (TPH or NATPH) Workhour Costs Numbers Volume NATPH Volume Workhours (TPH or NATPH) Workhour Costs
894 0 0 0 No Calc $0 894 $783,105896 0 0 0 No Calc $0 896 $542,872918 0 0 0 No Calc $0 918 $5,292,508919 0 0 0 No Calc $0 919 $4,733,219930 0 0 0 No Calc $0 930 $561,325961 0 0 0 No Calc $0 961 $53,061964 0 0 0 No Calc $0 964 $897
0 No Calc 003 $5670 No Calc 016 $1,3150 No Calc 043 $1,268,8020 No Calc 051 $00 No Calc 053 $00 No Calc 073 $658,2940 No Calc 087 $2,7700 No Calc 088 $220 No Calc 100 $2,8420 No Calc 105 $201,2340 No Calc 110 $2,0610 No Calc 115 $5,0320 No Calc 120 $11,9320 No Calc 122 $16,4850 No Calc 124 $676,3690 No Calc 128 $1,0650 No Calc 134 $00 No Calc 160 $8400 No Calc 175 $00 No Calc 188 $40,7120 No Calc 211 $97,9250 No Calc 213 $30,1020 No Calc 225 $818,8130 No Calc 242 $00 No Calc 243 $00 No Calc 245 $00 No Calc 246 $351,1400 No Calc 247 $511,1740 No Calc 248 $1,096,0480 No Calc 249 $777,8920 No Calc 263 $00 No Calc 273 $4390 No Calc 283 $30,9530 No Calc 320 $1,3400 No Calc 321 $612,6290 No Calc 324 $613,5700 No Calc 325 $1110 No Calc 326 $12,4760 No Calc 328 $6590 No Calc 329 $115,2840 No Calc 331 $626,2440 No Calc 332 $65,0560 No Calc 333 $1,026,7370 No Calc 336 $1,801,6130 No Calc 337 $26,2420 No Calc 341 $12,4640 No Calc 428 $398,0070 No Calc 483 $143,613
Package Page 17 AMP Workhour Costs - Proposed

(1) (2) (3) (4) (5) (6) (7) (8) (9) (10) (11) (12)Proposed Proposed Proposed Proposed Proposed Proposed Proposed Proposed Proposed Proposed Proposed ProposedOperation Annual FHP Annual TPH or Annual Productivity Annual Operation Annual FHP Annual TPH or Annual Productivity AnnualNumbers Volume NATPH Volume Workhours (TPH or NATPH) Workhour Costs Numbers Volume NATPH Volume Workhours (TPH or NATPH) Workhour Costs
0 No Calc 491 $00 No Calc 530 $3,301,8160 No Calc 538 $1,688,2380 No Calc 547 $4430 No Calc 563 $68,5660 No Calc 564 $64,3030 No Calc 586 $25,5810 No Calc 588 $37,6670 No Calc 628 $296,5790 No Calc 629 $8,6390 No Calc 630 $7880 No Calc 649 $00 No Calc 677 $7,9960 No Calc 798 $46,0180 No Calc 893 $1,456,0840 No Calc 895 $966,4010 No Calc 897 $10,2850 No Calc 898 $00 No Calc 899 $00 No Calc 0 No Calc0 No Calc 0 No Calc0 No Calc 0 No Calc0 No Calc 0 No Calc0 No Calc 0 No Calc0 No Calc 0 No Calc0 No Calc 0 No Calc0 No Calc 0 No Calc0 No Calc 0 No Calc0 No Calc 0 No Calc0 No Calc 0 No Calc0 No Calc 0 No Calc0 No Calc 0 No Calc0 No Calc 0 No Calc0 No Calc 0 No Calc0 No Calc 0 No Calc0 No Calc 0 No Calc0 No Calc 0 No Calc0 No Calc 0 No Calc0 No Calc 0 No Calc0 No Calc 0 No Calc0 No Calc 0 No Calc0 No Calc 0 No Calc0 No Calc 0 No Calc0 No Calc 0 No Calc0 No Calc 0 No Calc0 No Calc 0 No Calc0 No Calc 0 No Calc0 No Calc 0 No Calc0 No Calc 0 No Calc0 No Calc 0 No Calc0 No Calc 0 No Calc0 No Calc 0 No Calc0 No Calc 0 No Calc0 No Calc 0 No Calc0 No Calc 0 No Calc
Package Page 18 AMP Workhour Costs - Proposed

(1) (2) (3) (4) (5) (6) (7) (8) (9) (10) (11) (12)Proposed Proposed Proposed Proposed Proposed Proposed Proposed Proposed Proposed Proposed Proposed ProposedOperation Annual FHP Annual TPH or Annual Productivity Annual Operation Annual FHP Annual TPH or Annual Productivity AnnualNumbers Volume NATPH Volume Workhours (TPH or NATPH) Workhour Costs Numbers Volume NATPH Volume Workhours (TPH or NATPH) Workhour Costs
0 No Calc 0 No Calc0 No Calc 0 No Calc0 No Calc 0 No Calc0 No Calc 0 No Calc0 No Calc 0 No Calc0 No Calc 0 No Calc0 No Calc 0 No Calc0 No Calc 0 No Calc0 No Calc 0 No Calc0 No Calc 0 No Calc0 No Calc 0 No Calc0 No Calc 0 No Calc0 No Calc 0 No Calc0 No Calc 0 No Calc0 No Calc 0 No Calc0 No Calc 0 No Calc0 No Calc 0 No Calc0 No Calc 0 No Calc0 No Calc 0 No Calc0 No Calc 0 No Calc0 No Calc 0 No Calc0 No Calc 0 No Calc0 No Calc 0 No Calc0 No Calc 0 No Calc0 No Calc 0 No Calc0 No Calc 0 No Calc0 No Calc 0 No Calc0 No Calc 0 No Calc0 No Calc 0 No Calc0 No Calc 0 No Calc0 No Calc 0 No Calc0 No Calc 0 No Calc0 No Calc 0 No Calc0 No Calc 0 No Calc0 No Calc 0 No Calc0 No Calc 0 No Calc0 No Calc 0 No Calc0 No Calc 0 No Calc0 No Calc 0 No Calc0 No Calc 0 No Calc0 No Calc 0 No Calc0 No Calc 0 No Calc0 No Calc 0 No Calc0 No Calc 0 No Calc0 No Calc 0 No Calc0 No Calc 0 No Calc0 No Calc 0 No Calc0 No Calc 0 No Calc0 No Calc 0 No Calc0 No Calc 0 No Calc0 No Calc 0 No Calc0 No Calc 0 No Calc0 No Calc 0 No Calc0 No Calc 0 No Calc0 No Calc 0 No Calc
Package Page 19 AMP Workhour Costs - Proposed
(1) (2) (3) (4) (5) (6) (7) (8) (9) (10) (11) (12)Proposed Proposed Proposed Proposed Proposed Proposed Proposed Proposed Proposed Proposed Proposed ProposedOperation Annual FHP Annual TPH or Annual Productivity Annual Operation Annual FHP Annual TPH or Annual Productivity AnnualNumbers Volume NATPH Volume Workhours (TPH or NATPH) Workhour Costs Numbers Volume NATPH Volume Workhours (TPH or NATPH) Workhour Costs
0 No Calc 0 No Calc0 No Calc 0 No Calc0 No Calc 0 No Calc0 No Calc 0 No Calc0 No Calc 0 No Calc0 No Calc 0 No Calc0 No Calc 0 No Calc0 No Calc 0 No Calc0 No Calc 0 No Calc0 No Calc 0 No Calc0 No Calc 0 No Calc0 No Calc 0 No Calc0 No Calc 0 No Calc0 No Calc 0 No Calc0 No Calc 0 No Calc0 No Calc 0 No Calc0 No Calc 0 No Calc0 No Calc 0 No Calc0 No Calc 0 No Calc0 No Calc 0 No Calc0 No Calc 0 No Calc0 No Calc 0 No Calc0 No Calc 0 No Calc0 No Calc 0 No Calc0 No Calc 0 No Calc0 No Calc 0 No Calc0 No Calc 0 No Calc0 No Calc 0 No Calc0 No Calc 0 No Calc0 No Calc 0 No Calc0 No Calc 0 No Calc0 No Calc 0 No Calc0 No Calc 0 No Calc0 No Calc 0 No Calc0 No Calc 0 No Calc0 No Calc 0 No Calc0 No Calc 0 No Calc0 No Calc 0 No Calc0 No Calc 0 No Calc0 No Calc 0 No Calc0 No Calc 0 No Calc
Moved to Gain 0 0 0 No Calc $0 Impact to Gain 1,222,468,955 4,286,126,063 1,281,640 3,344 $49,891,557Impact to Lose 0 0 0 No Calc $0 Moved to Lose 0 0 0 No Calc $0Total Impact 0 0 0 No Calc $0 Total Impact 1,222,468,955 4,286,126,063 1,281,640 3,344 $49,891,557Non Impacted 0 0 0 No Calc $0 Non Impacted 0 0 0 No Calc $0
Gain Only 821,914,599 1,005,477,843 506,095 1,987 $20,040,277All 0 0 0 No Calc $0 All 2,044,383,554 5,291,603,906 1,787,735 2,960 $69,931,835
Package Page 20 AMP Workhour Costs - Proposed

(1) (2) (3) (4) (5) (6) (7) (8) (9) (10) (11) (12)Proposed Proposed Proposed Proposed Proposed Proposed Proposed Proposed Proposed Proposed Proposed ProposedOperation Annual FHP Annual TPH or Annual Productivity Annual Operation Annual FHP Annual TPH or Annual Productivity AnnualNumbers Volume NATPH Volume Workhours (TPH or NATPH) Workhour Costs Numbers Volume NATPH Volume Workhours (TPH or NATPH) Workhour Costs
Op# FHP TPH/NATPH Workhours Productivity Workhour Cost Op# Workhour Cost892 ($4,662) 1 892 ($146,610)
2
3
4
5
6
7
8
9
10
11
12
13
14
15
16
17
18
19
20
21
22
23
24
25
26
27
28
29
30
Totals 0 (7,560,626) (129) 58,793 ($4,662) Totals 0 (44826524) (3899) 11498 ($146,610)
Impact to Gain 1,222,468,955 4,286,126,063 1,281,640 3,344 $49,891,557Combined Current Annual Workhour Cost : Impact to Lose 0 0 0 No Calc $0
Total Impact 1,222,468,955 4,286,126,063 1,281,640 3,344 $49,891,557Non-impacted 0 0 0 No Calc $0
Gain Only 821,914,599 1,005,477,843 506,095 1,987 $20,040,277Tot Before Adj 2,044,383,554 5,291,603,906 1,787,735 2,960 $69,931,835
Lose Adj 0 -7,560,626 -129 58,793 -$4,662Gain Adj 0 -44,826,524 -3,899 11,498 -$146,610
All 2,044,383,554 5,239,216,756 1,783,708 2,937 $69,780,563
Comb Current 2,044,383,554 5,291,603,906 1,845,072 2,868 $71,967,904Proposed 2,044,383,554 5,239,216,756 1,783,708 2,937 $69,780,563Change 0 52,387,150 (61,364) ($2,187,340)
Change % 0.0% 1.0% -3.3% -3.0%
Com
b To
tals
Cost Impact(This number equals the difference in the current and proposed workhour costs
above and is carried forward to the Executive Summary )
(This number brought forward from Workhour Costs - Current )
Function 1 Workhour Savings : $2,187,340
Minimum Function 1 Workhour Savings : ($13,929)(This number represents proposed workhour savings with no productivity improvements
applied to operations at the gaining facility)
(13) New Flow Adjustments at Losing Facility
$71,967,904
Proposed Annual Workhour Cost :(Total of Columns 6 and 12 on this page)
$69,780,563
rev 04/02/2009
(14) New Flow Adjustments at Gaining Facility
Package Page 21 AMP Workhour Costs - Proposed

Last Saved:
to
581 0.0% 100.0% $49,767 \ ] 581 $468,334 TGp 581 $0 581 $468,334582 0.0% 100.0% $631 \ ] 582 $219,970 TGp 582 $0 582 $219,970616 0.0% 100.0% $1,225 \ ] 616 $41,862 TGp 616 $0 616 $41,862624 100.0% $1,032 \ ] 624 $48,654 TG 624 $0 624 $49,706634 100.0% $76 \ ] 634 $2,601 TG 634 $0 634 $2,678665 0.0% 100.0% $19,471 \ ] 665 $0 TGp 665 $0 665 $0666 0.0% 100.0% $21,376 \ ] 666 $71,884 TGp 666 $0 666 $71,884679 100.0% $49,942 \ ] 679 $503,322 TG 679 $0 679 $559,313750 63.0% $932,260 \ ] 750 $12,082,920 TGp 750 $344,936 750 $12,658,810765 100.0% $446,767 \ ] 765 $0 TG 765 $0 765 $446,767745 $111,857 \ ] 745 $1,069,327 NI 745 $111,857 745 $1,069,327747 $442,850 \ ] 747 $5,515,420 NI 747 $442,850 747 $5,515,420751 $56,515 \ ] 751 $0 NI 751 $56,515 751 $0753 $236,145 \ ] 753 $2,468,116 NI 753 $236,145 753 $2,468,116
\ ] 470 $136,098 GO 470 $136,098\ ] 515 $1,246 GO 515 $1,246\ ] 571 $79,472 GO 571 $79,472\ ] 617 $733 GO 617 $733\ ] 673 $771,265 GO 673 $771,265\ ] 676 $149,794 GO 676 $149,794\ ] 680 $79,826 GO 680 $79,826\ ] 691 $37,944 GO 691 $37,944\ ] 752 $171,882 GO 752 $171,882\ ] 754 $676,125 GO 754 $676,125\ ] 999 $2,962 GO 999 $2,962\ ]\ ]\ ]\ ]\ ]\ ]\ ]\ ]\ ]\ ]\ ]\ ]\ ]\ ]\ ]\ ]\ ]\ ]\ ]\ ]\ ]\ ]\ ]\ ]\ ]\ ]\ ]\ ]\ ]\ ]\ ]\ ]\ ]\ ]\ ]
Gaining FacilityCurrent MODS
Operation Number
Percent Moved to
Losing (%)
Current Annual Workhour Cost ($)
Proposed MODS
Operation Number
Proposed Annual Workhour Cost ($)
Gaining Facility Losing FacilityLosing FacilityCurrent Other Craft Workhours
Current Annual Workhour Cost ($)
Current MODS
Operation Number
Percent Moved to Gaining
(%)
Current Annual Workhours
Current Annual Workhours
Reduction Due to EoS
(%)
Reduction Due to EoS
(%)
Proposed MODS
Operation Number
Proposed Annual Workhours
Other Workhour Move Analysis
Toledo P&DCLosing Facility: Gaining Facility: Columbus P&DC Date Range of Data: 06/30/1107/01/10
February 18, 2012
Proposed Other Craft Workhours
Proposed Annual Workhours
Proposed Annual Workhour Cost ($)
Package Page 22 AMP Other Curr vs Prop

\ ]\ ]\ ]\ ]\ ]\ ]\ ]\ ]\ ]\ ]\ ]\ ]\ ]\ ]\ ]\ ]\ ]\ ]\ ]\ ]\ ]\ ]\ ]\ ]\ ]\ ]\ ]\ ]\ ]\ ]\ ]\ ]\ ]\ ]\ ]\ ]\ ]\ ]\ ]\ ]\ ]\ ]\ ]\ ]\ ]\ ]\ ]\ ]\ ]\ ]\ ]\ ]\ ]\ ]\ ]\ ]\ ]\ ]\ ]\ ]\ ]\ ]\ ]\ ]\ ]\ ]\ ]\ ]\ ]\ ]\ ]\ ]\ ]\ ]
Package Page 23 AMP Other Curr vs Prop

\ ]\ ]\ ]\ ]\ ]\ ]\ ]\ ]\ ]\ ]\ ]\ ]\ ]\ ]\ ]\ ]\ ]
33,600 $1,522,546 0 $0 Ops-Red 7,163 $344,936 Ops-Red 0 $00 $0 285,639 $13,439,548 Ops-Inc 0 $0 Ops-Inc 310,017 $14,519,325
19,649 $847,367 262,447 $11,160,210 Ops-Stay 19,649 $847,367 Ops-Stay 262,447 $11,160,21053,250 $2,369,912 548,086 $24,599,757 AllOps 26,812 $1,192,303 AllOps 572,465 $25,679,535
565 0.0% 100.0% $571 \ ] 565 $0 TGp 565 $0 565 $0593 0.0% 100.0% $24,947 \ ] 593 $0 TGp 593 $0 593 $0679 0.0% 100.0% $25,267 \ ] 679 $0 TGp 679 $0 679 $0698 0.0% 100.0% $115,772 \ ] 698 $862,842 TGp 698 $0 698 $862,842699 0.0% 100.0% $111,612 \ ] 699 $262,203 TGp 699 $0 699 $262,203700 0.0% 100.0% $105,757 \ ] 700 $901,861 TGp 700 $0 700 $901,861701 0.0% 100.0% $34,952 \ ] 701 $3,696,858 TGp 701 $0 701 $3,696,858759 0.0% 100.0% $64,345 \ ] 759 $197,849 TGp 759 $0 759 $197,849927 0.0% 100.0% $1,359 \ ] 927 $282,099 TGp 927 $0 927 $282,099933 0.0% 100.0% $27,491 \ ] 933 $236,494 TGp 933 $0 933 $236,494951 0.0% 100.0% $194,082 \ ] 951 $1,912,974 TGp 951 $0 951 $1,912,974953 0.0% 100.0% $8,782 \ ] 953 $179,699 TGp 953 $0 953 $179,699671 $38,093 \ ] 671 $206,945 NI 671 $38,093 671 $206,945
\ ] 455 $2,982 GO 455 $2,982\ ] 458 $93 GO 458 $93\ ] 477 $46 GO 477 $46\ ] 624 $1,568 GO 624 $1,568\ ] 702 $33,218 GO 702 $33,218\ ] 758 $84,247 GO 758 $84,247\ ] 922 $130,143 GO 922 $130,143\ ] 928 $7,318 GO 928 $7,318\ ]\ ]\ ]\ ]\ ]\ ]\ ]\ ]\ ]\ ]\ ]\ ]\ ]\ ]\ ]\ ]\ ]\ ]\ ]\ ]\ ]\ ]\ ]
Gaining FacilityCurrent MODS
Operation Number
TotalsOps-ReducingOps-Increasing
Ops-StayingAll Operations
Percent (%) Moved to Losing
(%) Reduction
Due to EoS
Percent (%) Moved to Gaining
(%) Reduction
Due to EoS
Current Annual Workhours
TotalsOps-ReducingOps-Increasing
Ops-StayingAll Operations
Current All Supervisory Workhours
Current Annual Workhour Cost ($)
Current Annual Workhours
Current MODS
Operation Number
Losing Facility Gaining Facility
Current Annual Workhour Cost ($)
Proposed Annual Workhour Cost ($)
Proposed MODS
Operation Number
Proposed Annual Workhours
Proposed Annual Workhour Cost ($)
Losing FacilityProposed
MODS Operation Number
Proposed Annual Workhours
Proposed All Supervisory Workhours
Package Page 24 AMP Other Curr vs Prop

\ ]\ ]\ ]\ ]\ ]\ ]\ ]\ ]\ ]\ ]\ ]\ ]\ ]\ ]\ ]\ ]\ ]\ ]\ ]\ ]\ ]\ ]\ ]\ ]\ ]\ ]\ ]\ ]\ ]\ ]\ ]\ ]\ ]\ ]\ ]\ ]\ ]\ ]\ ]\ ]\ ]\ ]\ ]\ ]\ ]\ ]\ ]\ ]\ ]\ ]\ ]\ ]\ ]\ ]\ ]\ ]\ ]\ ]\ ]\ ]\ ]\ ]\ ]\ ]\ ]\ ]\ ]\ ]\ ]\ ]\ ]\ ]\ ]\ ]
Package Page 25 AMP Other Curr vs Prop
\ ]\ ]\ ]\ ]\ ]\ ]\ ]\ ]\ ]\ ]\ ]\ ]\ ]
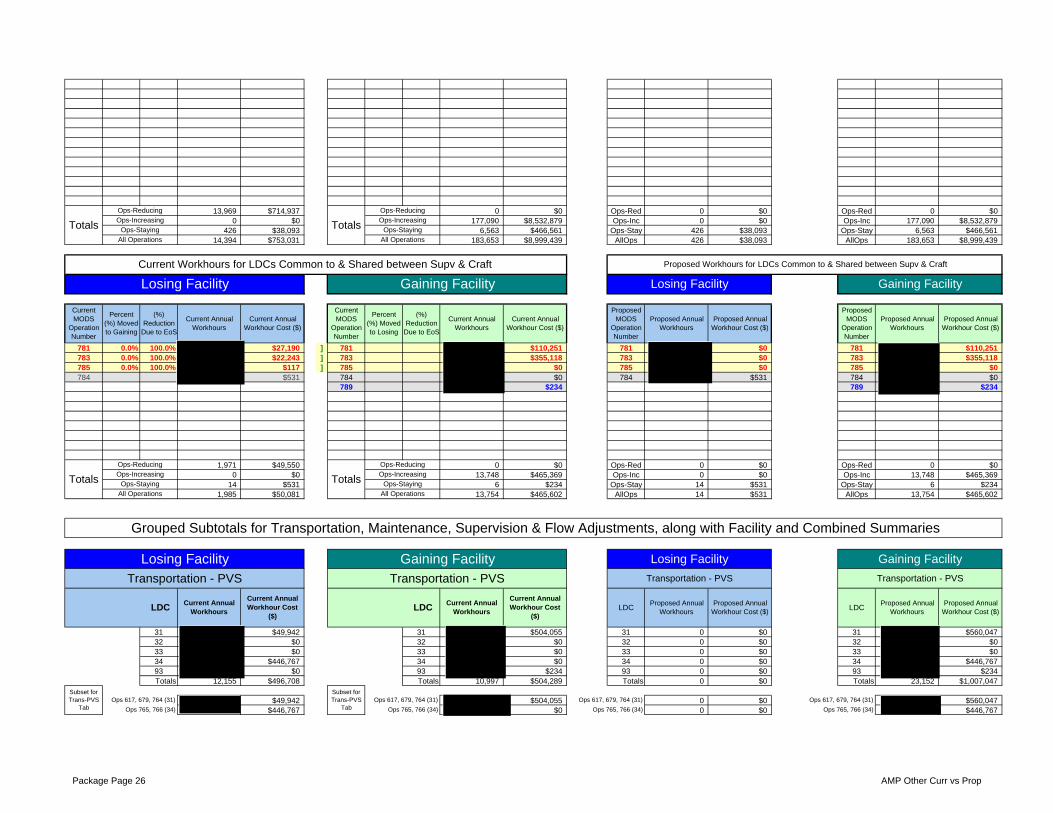
13,969 $714,937 0 $0 Ops-Red 0 $0 Ops-Red 0 $00 $0 177,090 $8,532,879 Ops-Inc 0 $0 Ops-Inc 177,090 $8,532,879
426 $38,093 6,563 $466,561 Ops-Stay 426 $38,093 Ops-Stay 6,563 $466,56114,394 $753,031 183,653 $8,999,439 AllOps 426 $38,093 AllOps 183,653 $8,999,439
781 0.0% 100.0% $27,190 \ ] 781 $110,251 TGp 781 $0 781 $110,251783 0.0% 100.0% $22,243 \ ] 783 $355,118 TGp 783 $0 783 $355,118785 0.0% 100.0% $117 \ ] 785 $0 TGp 785 $0 785 $0784 $531 \ ] 784 $0 NI 784 $531 784 $0
\ ] 789 $234 GO 789 $234\ ]\ ]\ ]\ ]\ ]\ ]\ ]
1,971 $49,550 0 $0 Ops-Red 0 $0 Ops-Red 0 $00 $0 13,748 $465,369 Ops-Inc 0 $0 Ops-Inc 13,748 $465,369
14 $531 6 $234 Ops-Stay 14 $531 Ops-Stay 6 $2341,985 $50,081 13,754 $465,602 AllOps 14 $531 AllOps 13,754 $465,602
31 $49,942 31 $504,055 31 0 $0 31 $560,04732 $0 32 $0 32 0 $0 32 $033 $0 33 $0 33 0 $0 33 $034 $446,767 34 $0 34 0 $0 34 $446,76793 $0 93 $234 93 0 $0 93 $234Totals 12,155 $496,708 Totals 10,997 $504,289 Totals 0 $0 Totals 23,152 $1,007,047
$49,942 $504,055 0 $0 $560,047$446,767 $0 0 $0 $446,767
Subset for Trans-PVS
TabOps 617, 679, 764 (31)
Transportation - PVS
LDC Current Annual Workhours
Current Annual Workhour Cost
($)
Ops 765, 766 (34)
LDC Current Annual Workhours
Current Annual Workhour Cost
($)
Current MODS
Operation Number
(%) Reduction
Due to EoS
Grouped Subtotals for Transportation, Maintenance, Supervision & Flow Adjustments, along with Facility and Combined Summaries
Ops-IncreasingOps-Staying
All Operations
Current Annual Workhours
All Operations
Percent (%) Moved to Losing
Gaining Facility Losing Facility
Current Annual Workhour Cost ($)
Gaining Facility
Ops 617, 679, 764 (31)Ops 765, 766 (34)
Ops 617, 679, 764 (31)Ops 765, 766 (34)
Ops-Reducing
All Operations
Current Workhours for LDCs Common to & Shared between Supv & Craft Proposed Workhours for LDCs Common to & Shared between Supv & Craft
Current MODS
Operation Number
Gaining Facility
Totals
Losing Facility
Losing Facility Gaining Facility
Totals Ops-IncreasingOps-Staying
Losing Facility
Ops 617, 679, 764 (31)Subset for Trans-PVS
Tab
(%) Reduction
Due to EoS
Current Annual Workhours
Current Annual Workhour Cost ($)
Transportation - PVS
TotalsOps-ReducingOps-Increasing
Ops-Staying
Ops-Reducing
Percent (%) Moved to Gaining
TotalsOps-ReducingOps-Increasing
Ops-StayingAll Operations
Proposed Annual Workhour Cost ($)
Proposed MODS
Operation Number
Proposed Annual Workhours
Proposed Annual Workhour Cost ($)
LDC
Proposed MODS
Operation Number
Proposed Annual Workhours
Ops 765, 766 (34)
Proposed Annual Workhour Cost ($)
Transportation - PVS
Proposed Annual Workhours
Proposed Annual Workhour Cost ($)
Transportation - PVS
LDC Proposed Annual Workhours
Package Page 26 AMP Other Curr vs Prop
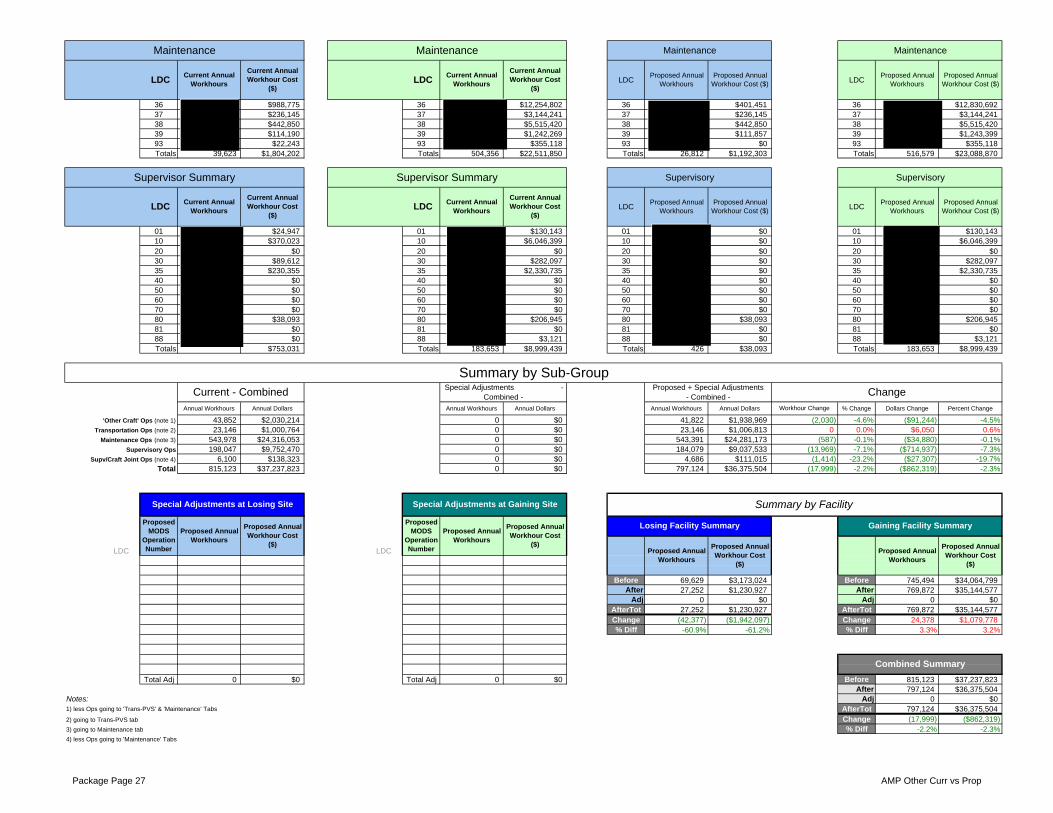
36 $988,775 36 $12,254,802 36 $401,451 36 $12,830,69237 $236,145 37 $3,144,241 37 $236,145 37 $3,144,24138 $442,850 38 $5,515,420 38 $442,850 38 $5,515,42039 $114,190 39 $1,242,269 39 $111,857 39 $1,243,39993 $22,243 93 $355,118 93 $0 93 $355,118Totals 39,623 $1,804,202 Totals 504,356 $22,511,850 Totals 26,812 $1,192,303 Totals 516,579 $23,088,870
01 $24,947 01 $130,143 01 $0 01 $130,14310 $370,023 10 $6,046,399 10 $0 10 $6,046,39920 $0 20 $0 20 $0 20 $030 $89,612 30 $282,097 30 $0 30 $282,09735 $230,355 35 $2,330,735 35 $0 35 $2,330,73540 $0 40 $0 40 $0 40 $050 $0 50 $0 50 $0 50 $060 $0 60 $0 60 $0 60 $070 $0 70 $0 70 $0 70 $080 $38,093 80 $206,945 80 $38,093 80 $206,94581 $0 81 $0 81 $0 81 $088 $0 88 $3,121 88 $0 88 $3,121Totals $753,031 Totals 183,653 $8,999,439 Totals 426 $38,093 Totals 183,653 $8,999,439
Annual Workhours Annual Dollars Annual Workhours Annual Dollars Annual Workhours Annual Dollars % Change Dollars Change Percent Change
43,852 $2,030,214 0 $0 41,822 $1,938,969 -4.6% ($91,244) -4.5%23,146 $1,000,764 0 $0 23,146 $1,006,813 0.0% $6,050 0.6%
543,978 $24,316,053 0 $0 543,391 $24,281,173 -0.1% ($34,880) -0.1%198,047 $9,752,470 0 $0 184,079 $9,037,533 -7.1% ($714,937) -7.3%
6,100 $138,323 0 $0 4,686 $111,015 -23.2% ($27,307) -19.7%815,123 $37,237,823 0 $0 797,124 $36,375,504 -2.2% ($862,319) -2.3%
LDC LDCChk >>> Chk >>>Chk >>> Chk >>>Chk >>> Chk >>> Before 69,629 $3,173,024 Before 745,494 $34,064,799Chk >>> Chk >>> After 27,252 $1,230,927 After 769,872 $35,144,577Chk >>> Chk >>> Adj 0 $0 Adj 0 $0Chk >>> Chk >>> AfterTot 27,252 $1,230,927 AfterTot 769,872 $35,144,577Chk >>> Chk >>> Change (42,377) ($1,942,097) Change 24,378 $1,079,778Chk >>> Chk >>> % Diff -60.9% -61.2% % Diff 3.3% 3.2%Chk >>> Chk >>>Chk >>> Chk >>>Chk >>> Chk >>>Chk >>> Chk >>>
Total Adj 0 $0 Total Adj 0 $0 Before 815,123 $37,237,823After 797,124 $36,375,504
Adj 0 $0AfterTot 797,124 $36,375,504Change (17,999) ($862,319)% Diff -2.2% -2.3%
(2,030)
4) less Ops going to 'Maintenance' Tabs
'Other Craft' Ops (note 1)
Notes:1) less Ops going to 'Trans-PVS' & 'Maintenance' Tabs
2) going to Trans-PVS tab3) going to Maintenance tab
Supervisory Ops
ChangeProposed + Special Adjustments - Combined -Current - Combined
Workhour Change
0(587)
(13,969)Maintenance Ops (note 3)
Transportation Ops (note 2)
Summary by FacilitySpecial Adjustments at Losing Site
(1,414)Supv/Craft Joint Ops (note 4)Total (17,999)
Supervisory
LDC Proposed Annual Workhours
Proposed Annual Workhour Cost ($)
Supervisor Summary Supervisor Summary
LDC Current Annual Workhours
Current Annual Workhour Cost
($)LDC Current Annual
Workhours
Current Annual Workhour Cost
($)
Maintenance
Current Annual Workhours
Maintenance
Proposed Annual Workhour Cost ($)
Proposed Annual WorkhoursLDCProposed Annual
WorkhoursLDC
Proposed Annual Workhours
Losing Facility Summary
Combined Summary
Proposed Annual Workhours
Proposed Annual Workhour Cost
($)
Proposed Annual Workhour Cost
($)
Proposed Annual Workhours
Proposed MODS
Operation Number
Proposed Annual Workhours
Proposed Annual Workhour Cost
($)
Proposed MODS
Operation Number
Proposed Annual Workhour Cost
($)
Special Adjustments at Gaining Site
Maintenance
Current Annual Workhour Cost
($)
Summary by Sub-GroupSpecial Adjustments -
Combined -
Gaining Facility Summary
Maintenance
LDC LDCCurrent Annual Workhours
Current Annual Workhour Cost
($)
Proposed Annual Workhour Cost ($)
Supervisory
LDC Proposed Annual Workhours
Proposed Annual Workhour Cost ($)
Package Page 27 AMP Other Curr vs Prop

Last Saved:
Losing Facility:Data Extraction Date: 09/19/11
(2) (3) (4) (5) (6)
Level Current Auth Staffing
Current On-Rolls
Proposed Staffing Difference
1 EAS-25 1 1 0 -1
2 EAS-22 1 1 0 -1
3 EAS-21 1 1 0 -1
4 EAS-20 1 1 0 -1
5 EAS-19 2 1 0 -1
6 EAS-19 1 1 0 -1
7 EAS-19 1 1 0 -1
8 EAS-18 1 1 0 -1
9 EAS-17 2 1 0 -1
10 EAS-17 11 8 0 -8
11 EAS-17 5 5 0 -5
12 EAS-17 2 2 0 -2
13 EAS-16 1 1 0 -1
14 EAS-12 1 1 0 -1
1516171819202122232425262728293031323334353637383940414243
Staffing - Management
388261
February 18, 2012
Toledo P&DC
SUPV TRANSPORTATION OPERATIONSNETWORKS SPECIALIST
Line
(1)
Position TitleMGR PROCESSING/DISTRIBUTION
SECRETARY (FLD)
Management Positions
OPERATIONS SUPPORT SPECIALISTOPERATIONS SUPPORT SPECIALISTSUPV DISTRIBUTION OPERATIONSSUPV MAINTENANCE OPERATIONS
Finance Number:
MGR MAINTENANCEMGR IN-PLANT SUPPORTMGR TRANSPORTATION/NETWORKSMGR DISTRIBUTION OPERATIONSMGR MAINTENANCE OPERATIONSMGR MAINTENANCE OPERATIONS SUPPT
Package Page 31 AMP Staffing - PCES/EAS

444546474849505152535455565758596061626364656667686970717273747576777879
31 26 0 (26)
Retirement Eligibles: 5 Position Loss: 26
Totals
Package Page 32 AMP Staffing - PCES/EAS

Gaining Facility:Data Extraction Date: 09/19/11
(13) (14) (15) (16) (17)
Level Current Auth Staffing
Current On-Rolls
Proposed Staffing Difference
1 PCES-01 1 1 1 0
2 EAS-25 1 1 1 0
3 EAS-25 1 1 1 0
4 EAS-24 1 1 1 0
5 EAS-23 3 3 3 0
6 EAS-22 2 2 2 0
7 EAS-22 3 3 3 0
8 EAS-21 1 1 1 0
9 EAS-20 1 1 1 0
10 EAS-20 1 1 1 0
11 EAS-20 1 1 1 0
12 EAS-20 1 1 1 0
13 EAS-19 1 1 1 0
14 EAS-19 2 2 2 0
15 EAS-19 1 1 1 0
16 EAS-18 1 1 1 0
17 EAS-18 2 2 2 0
18 EAS-17 4 4 4 0
19 EAS-17 38 35 35 0
20 EAS-17 15 12 12 0
21 EAS-17 0 2 0 -2
22 EAS-16 2 2 2 0
23 EAS-12 1 1 1 0
2425262728293031323334353637383940414243444546
Finance Number: 381793Columbus P&DC
Line Position Title(12)
Management Positions
PLANT MANAGER (1)MGR IN-PLANT SUPPORTMGR MAINTENANCE (LEAD)MGR DISTRIBUTION OPERATIONSMGR MAINTENANCE OPERATIONSMGR DISTRIBUTION OPERATIONSOPERATIONS INDUSTRIAL ENGINEER (FIMGR TRANSPORTATION/NETWORKSMGR DISTRIBUTION OPERATIONSMGR MAINT ENGINEERING SUPPORTMGR MAINTENANCE OPERATIONS SUPPTOPERATIONS SUPPORT SPECIALISTMAINTENANCE ENGINEERING SPECIALISTMGR DISTRIBUTION OPERATIONSMGR FIELD MAINT OPRNS (LEAD)MGR MAINTENANCEOPERATIONS SUPPORT SPECIALISTOPERATIONS SUPPORT SPECIALISTSUPV DISTRIBUTION OPERATIONSSUPV MAINTENANCE OPERATIONSSUPV TRANSPORTATION OPERATIONSNETWORKS SPECIALISTSECRETARY (FLD)
Package Page 33 AMP Staffing - PCES/EAS
474849505152535455565758596061626364656667686970717273747576777879
84 80 78 (2)
Retirement Eligibles: 27 Position Loss: 2
28
Total
rev 11/05/2008
Total PCES/EAS Position Loss: (This number carried forward to the Executive Summary )
Package Page 34 AMP Staffing - PCES/EAS

Losing Facility: 388261
(1) (2) (3) (4) (5) (6)Craft Positions
Function 1 - Clerk 31 0 155 186 0 (186)Function 4 - Clerk 0 0 0 0 0Function 1 - Mail Handler 9 3 72 84 0 (84)Function 4 - Mail Handler 0 0 0 0 0
Function 1 & 4 Sub-Total 40 3 227 270 0 (270)Function 3A - Vehicle Service 2 0 16 18 0 (18)Function 3B - Maintenance 0 0 84 84 0 (84)Functions 67-69 - Lmtd/Rehab/WC 0 4 4 0 (4)Other Functions 0 0 2 2 0 (2)
Total 42 3 333 378 0 (378)
Retirement Eligibles: 96
Gaining Facility: 381793
(7) (8) (9) (10) (11) (12)Craft Positions
Function 1 - Clerk 85 0 489 574 599 25Function 1 - Mail Handler 32 40 289 361 377 16
Function 1 Sub-Total 117 40 778 935 975 40Function 3A - Vehicle Service 0 0 3 3 3 0Function 3B - Maintenance 0 0 278 278 283 5Functions 67-69 - Lmtd/Rehab/WC 0 21 21 21 0Other Functions 0 0 8 8 8 0
Total 117 40 1,088 1,245 1,290 45
Retirement Eligibles: 380
333
(13) Notes:
rev 11/05/20085 Maintenance E.T.'s needed to support mail processing equipment for the additional 458 volume to Columbus.
Finance Number:
Columbus P&DC Finance Number:
41 F1 Employees to supplement staffing shortage (requirements) for all other volumes into Columbus for Network Optimization
Total Craft Position Loss:
Total Proposed
Part Time On-Rolls
Full Time On-Rolls
Total On-Rolls
Staffing - Craft
Difference
Difference
Last Saved: February 18, 2012
Data Extraction Date: 09/19/11
Casuals/PSEs On-Rolls
09/19/11
Total Proposed
Data Extraction Date:
Toledo P&DC
Part Time On-Rolls
Full Time On-Rolls
Total On-Rolls
(This number carried forward to the Executive Summary )
42 F-1 Employees are proposed for additional 458 workload to Columbus
Casuals/PSEs On-Rolls
Package Page 35 AMP Staffing - Craft
Losing Facility: Gaining Facility:
Date Range of Data: :
(1) (2) (3) (4) (5) (6)
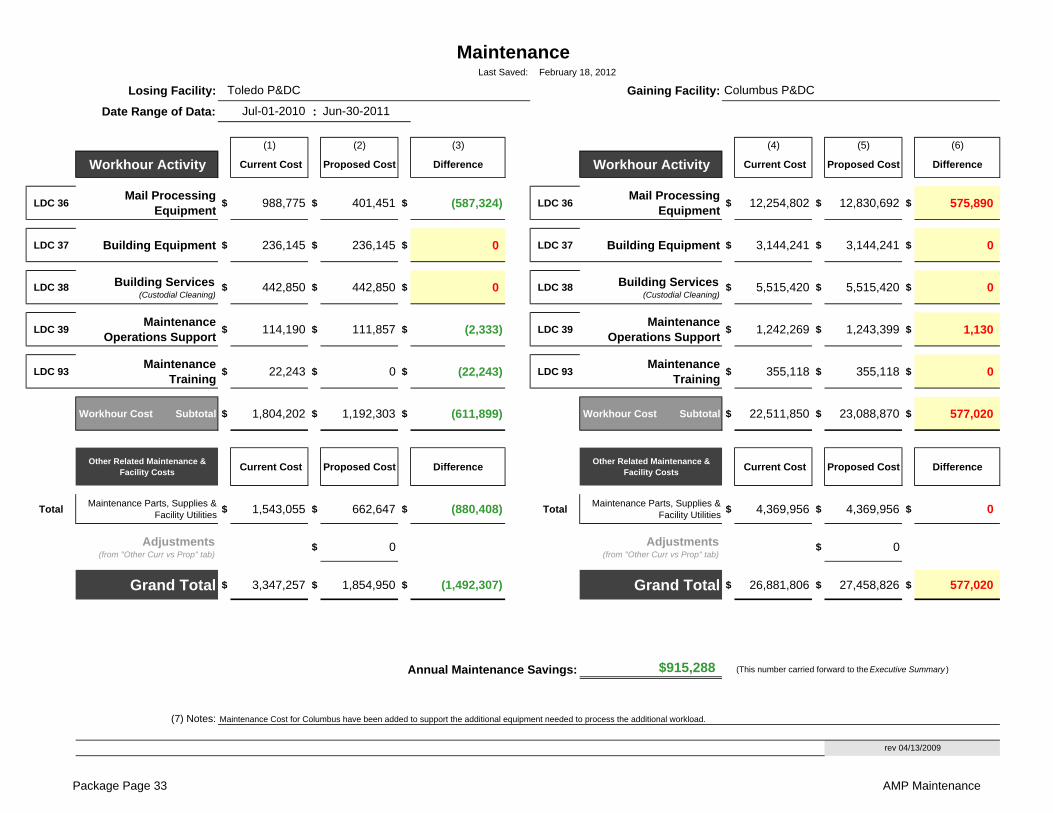
Workhour Activity Current Cost Proposed Cost Difference Workhour Activity Current Cost Proposed Cost Difference
LDC 36 Mail Processing Equipment $ 988,775 $ 401,451 $ (587,324) LDC 36 Mail Processing
Equipment $ 12,254,802 $ 12,830,692 $ 575,890
LDC 37 Building Equipment $ 236,145 $ 236,145 $ 0 LDC 37 Building Equipment $ 3,144,241 $ 3,144,241 $ 0
LDC 38 Building Services (Custodial Cleaning)
$ 442,850 $ 442,850 $ 0 LDC 38 Building Services (Custodial Cleaning)
$ 5,515,420 $ 5,515,420 $ 0
LDC 39 Maintenance Operations Support $ 114,190 $ 111,857 $ (2,333) LDC 39 Maintenance
Operations Support $ 1,242,269 $ 1,243,399 $ 1,130
LDC 93 Maintenance Training $ 22,243 $ 0 $ (22,243) LDC 93 Maintenance
Training $ 355,118 $ 355,118 $ 0
Workhour Cost Subtotal $ 1,804,202 $ 1,192,303 $ (611,899) Workhour Cost Subtotal $ 22,511,850 $ 23,088,870 $ 577,020
Other Related Maintenance & Facility Costs Current Cost Proposed Cost Difference Other Related Maintenance &
Facility Costs Current Cost Proposed Cost Difference
Total Maintenance Parts, Supplies & Facility Utilities $ 1,543,055 $ 662,647 $ (880,408) Total Maintenance Parts, Supplies &
Facility Utilities $ 4,369,956 $ 4,369,956 $ 0
Adjustments (from "Other Curr vs Prop" tab)
$ 0 Adjustments (from "Other Curr vs Prop" tab)
$ 0
Grand Total $ 3,347,257 $ 1,854,950 $ (1,492,307) Grand Total $ 26,881,806 $ 27,458,826 $ 577,020
$915,288 (This number carried forward to the Executive Summary )
(7) Notes:
Jul-01-2010 Jun-30-2011
Annual Maintenance Savings:
rev 04/13/2009
Maintenance
Maintenance Cost for Columbus have been added to support the additional equipment needed to process the additional workload.
Last Saved:
Toledo P&DC Columbus P&DCFebruary 18, 2012
Package Page 33 AMP Maintenance
Losing Facility: Gaining Facility:Finance Number: Finance Number:
Date Range of Data: 07/01/10 -- to -- 06/30/11
(1) (2) (3) (4) (5) (6)Current Proposed Difference Current Proposed Difference
PVS Owned Equipment PVS Owned EquipmentSeven Ton Trucks 0 Seven Ton Trucks 0Eleven Ton Trucks 0 Eleven Ton Trucks 0Single Axle Tractors 0 Single Axle Tractors 0Tandem Axle Tractors 0 Tandem Axle Tractors 0Spotters 0 Spotters 0
PVS Transportation PVS TransportationTotal Number of Schedules 0 Total Number of Schedules 0Total Annual Mileage 0 Total Annual Mileage 0
Total Mileage Costs $0 Total Mileage Costs $0
PVS Leases PVS LeasesTotal Vehicles Leased 0 Total Vehicles Leased 0
Total Lease Costs $0 Total Lease Costs $0
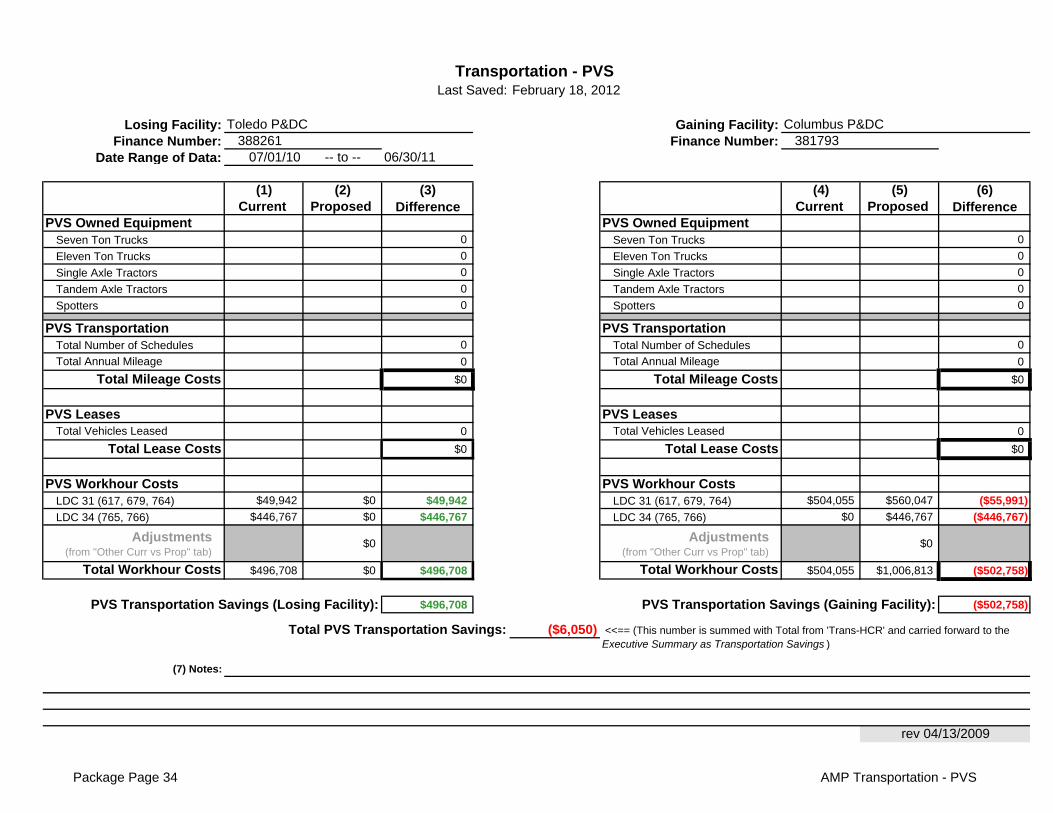
PVS Workhour Costs PVS Workhour CostsLDC 31 (617, 679, 764) $49,942 $0 $49,942 LDC 31 (617, 679, 764) $504,055 $560,047 ($55,991)LDC 34 (765, 766) $446,767 $0 $446,767 LDC 34 (765, 766) $0 $446,767 ($446,767)
Adjustments (from "Other Curr vs Prop" tab)
$0 Adjustments (from "Other Curr vs Prop" tab)
$0
Total Workhour Costs $496,708 $0 $496,708 Total Workhour Costs $504,055 $1,006,813 ($502,758)
PVS Transportation Savings (Losing Facility): $496,708 PVS Transportation Savings (Gaining Facility): ($502,758)
($6,050)
(7) Notes:
rev 04/13/2009
Total PVS Transportation Savings:
388261 381793
<<== (This number is summed with Total from 'Trans-HCR' and carried forward to the Executive Summary as Transportation Savings )
Transportation - PVS
Toledo P&DC Columbus P&DC
Last Saved: February 18, 2012
Package Page 34 AMP Transportation - PVS
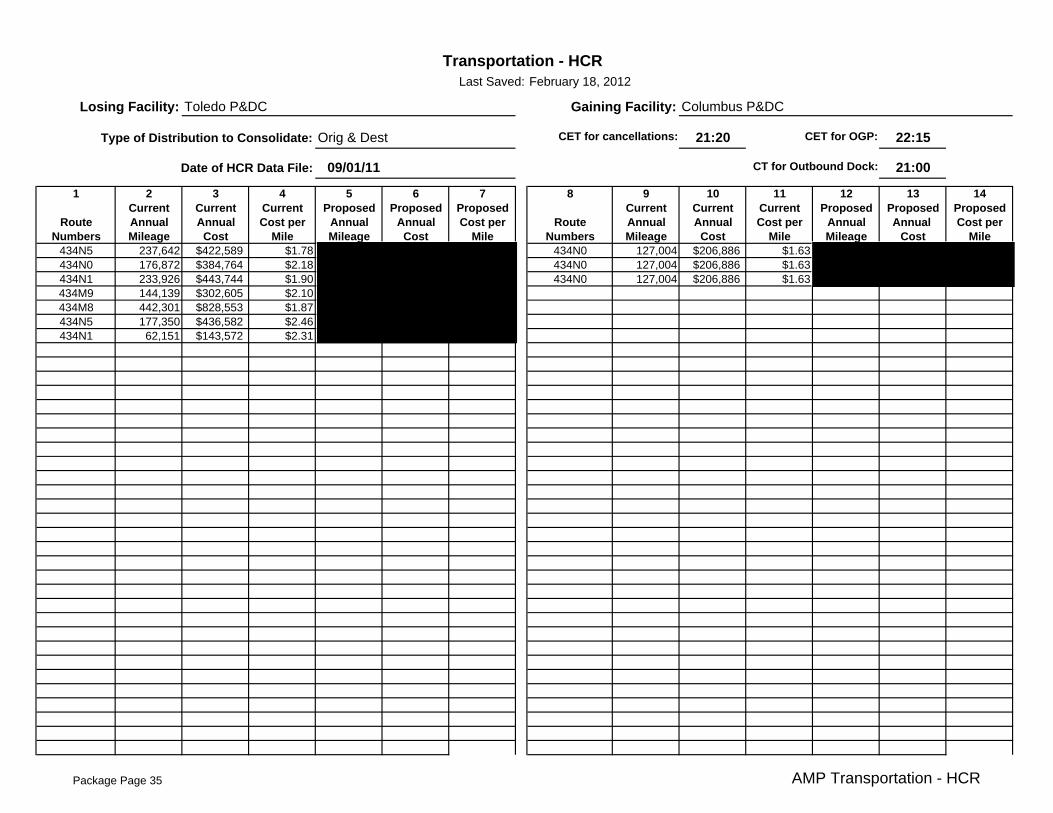
21:20 22:15
21:00
1 2 3 4 5 6 7 8 9 10 11 12 13 14Current Current Current Proposed Proposed Proposed Current Current Current Proposed Proposed Proposed
Route Annual Annual Cost per Annual Annual Cost per Route Annual Annual Cost per Annual Annual Cost perNumbers Mileage Cost Mile Mileage Cost Mile Numbers Mileage Cost Mile Mileage Cost Mile
434N5 237,642 $422,589 $1.78 434N0 127,004 $206,886 $1.63434N0 176,872 $384,764 $2.18 434N0 127,004 $206,886 $1.63434N1 233,926 $443,744 $1.90 434N0 127,004 $206,886 $1.63434M9 144,139 $302,605 $2.10434M8 442,301 $828,553 $1.87434N5 177,350 $436,582 $2.46434N1 62,151 $143,572 $2.31
Type of Distribution to Consolidate:
Date of HCR Data File:
CET for cancellations:
Last Saved: February 18, 2012
Losing Facility: Toledo P&DC Columbus P&DCGaining Facility:
Orig & Dest
09/01/11
CET for OGP:
CT for Outbound Dock:
Transportation - HCR
Package Page 35 AMP Transportation - HCR
1 2 3 4 5 6 7 8 9 10 11 12 13 14Current Current Current Proposed Proposed Proposed Current Current Current Proposed Proposed Proposed
Route Annual Annual Cost per Annual Annual Cost per Route Annual Annual Cost per Annual Annual Cost perNumbers Mileage Cost Mile Mileage Cost Mile Numbers Mileage Cost Mile Mileage Cost Mile
Package Page 36 AMP Transportation - HCR
1 2 3 4 5 6 7 8 9 10 11 12 13 14Current Current Current Proposed Proposed Proposed Current Current Current Proposed Proposed Proposed
Route Annual Annual Cost per Annual Annual Cost per Route Annual Annual Cost per Annual Annual Cost perNumbers Mileage Cost Mile Mileage Cost Mile Numbers Mileage Cost Mile Mileage Cost Mile
$1,501,808 ($342,352)
Total HCR Transportation Savings:
Trips from Losing
0
Moving to Lose (-)
<<== (This number is summed with Total from 'Trans-PVS' and carried forward to the Executive Summary as Transportation Savings )
rev 11/05/2008
Current Gaining
$1,159,456
220,8780
Proposed Result
HCR Annual Savings (Losing Facility): HCR Annual Savings (Gaining Facility):
Proposed Trip Impacts
114,999 0 0 0 0
Other Changes
(+/-)
114,999 220,878
Moving to Gain (-)
Proposed Trip
Impacts
Current Losing Proposed ResultTrips from
Gaining
Other Changes
(+/-)
Package Page 37 AMP Transportation - HCR
Orig & Dest
(1) (2)
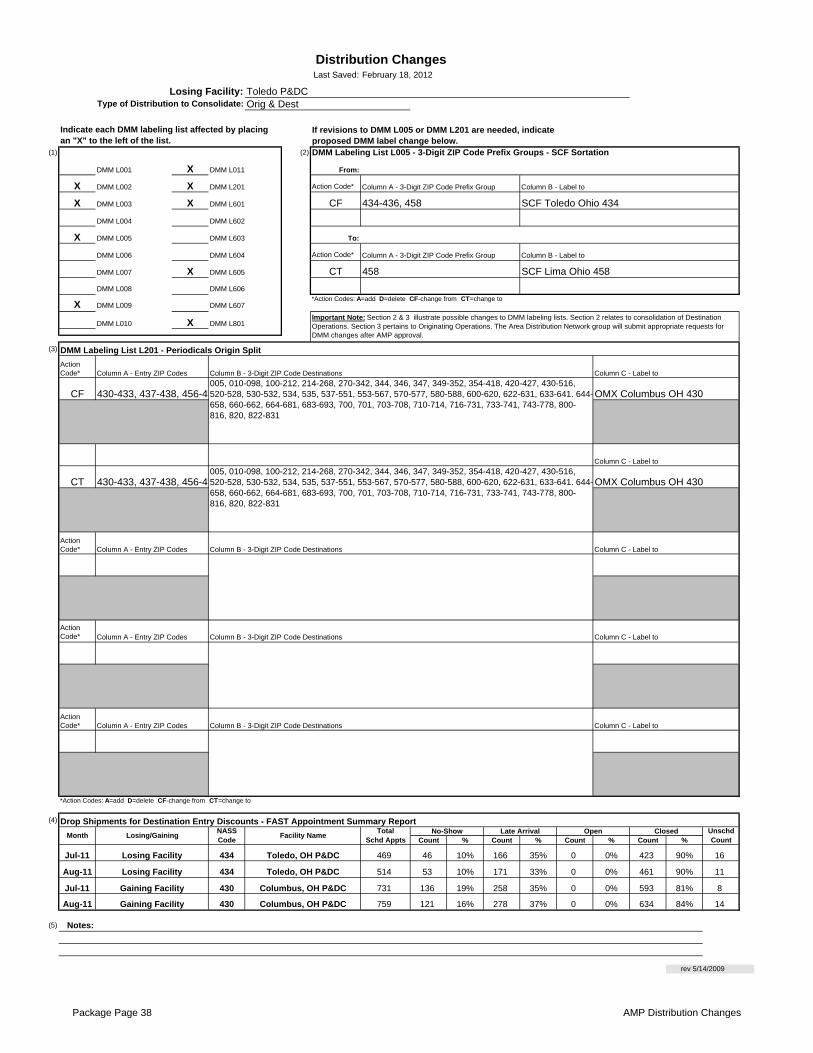
X DMM L011 From:
X X DMM L201 Action Code* Column A - 3-Digit ZIP Code Prefix Group
X X DMM L601 CF
DMM L602
X DMM L603 To:
DMM L604 Action Code* Column A - 3-Digit ZIP Code Prefix Group
X DMM L605 CTDMM L606
X DMM L607
X DMM L801
(3)
Action Code*
CF
CT
Action Code*
Action Code*
Action Code*
(4)
Count % Count % Count % Count %
Jul-11 434 469 46 10% 166 35% 0 0% 423 90% 16
Aug-11 434 514 53 10% 171 33% 0 0% 461 90% 11
Jul-11 430 731 136 19% 258 35% 0 0% 593 81% 8
Aug-11 430 759 121 16% 278 37% 0 0% 634 84% 14
(5) Notes:
*Action Codes: A=add D=delete CF-change from CT=change to
Important Note: Section 2 & 3 illustrate possible changes to DMM labeling lists. Section 2 relates to consolidation of Destination Operations. Section 3 pertains to Originating Operations. The Area Distribution Network group will submit appropriate requests for DMM changes after AMP approval.
Column A - Entry ZIP Codes Column B - 3-Digit ZIP Code Destinations Column C - Label to
Column A - Entry ZIP Codes Column B - 3-Digit ZIP Code Destinations Column C - Label to
SCF Lima Ohio 458
DMM L009
DMM L010
DMM L005
DMM L006
DMM L007
DMM L008
458
DMM L003
DMM L004
DMM L001
DMM L002
Distribution Changes
Indicate each DMM labeling list affected by placing an "X" to the left of the list.
Losing Facility:Type of Distribution to Consolidate:
If revisions to DMM L005 or DMM L201 are needed, indicate proposed DMM label change below.
Last Saved: February 18, 2012
Toledo P&DC
DMM Labeling List L005 - 3-Digit ZIP Code Prefix Groups - SCF Sortation
434-436, 458
Column B - Label to
SCF Toledo Ohio 434
*Action Codes: A=add D=delete CF-change from CT=change to
Column B - Label to
rev 5/14/2009
Drop Shipments for Destination Entry Discounts - FAST Appointment Summary ReportMonth Losing/Gaining NASS
Code Facility Name Total Schd Appts
Unschd Count
Losing Facility Toledo, OH P&DC
Losing Facility Toledo, OH P&DC
No-Show Late Arrival Open Closed
Gaining Facility Columbus, OH P&DC
Gaining Facility Columbus, OH P&DC
DMM Labeling List L201 - Periodicals Origin Split
Column A - Entry ZIP Codes Column B - 3-Digit ZIP Code Destinations Column C - Label to
430-433, 437-438, 456-45005, 010-098, 100-212, 214-268, 270-342, 344, 346, 347, 349-352, 354-418, 420-427, 430-516, 520-528, 530-532, 534, 535, 537-551, 553-567, 570-577, 580-588, 600-620, 622-631, 633-641. 644-658, 660-662, 664-681, 683-693, 700, 701, 703-708, 710-714, 716-731, 733-741, 743-778, 800-816, 820, 822-831
OMX Columbus OH 430
Column C - Label to
430-433, 437-438, 456-45005, 010-098, 100-212, 214-268, 270-342, 344, 346, 347, 349-352, 354-418, 420-427, 430-516, 520-528, 530-532, 534, 535, 537-551, 553-567, 570-577, 580-588, 600-620, 622-631, 633-641. 644-658, 660-662, 664-681, 683-693, 700, 701, 703-708, 710-714, 716-731, 733-741, 743-778, 800-816, 820, 822-831
OMX Columbus OH 430
Column A - Entry ZIP Codes Column B - 3-Digit ZIP Code Destinations Column C - Label to
Package Page 38 AMP Distribution Changes
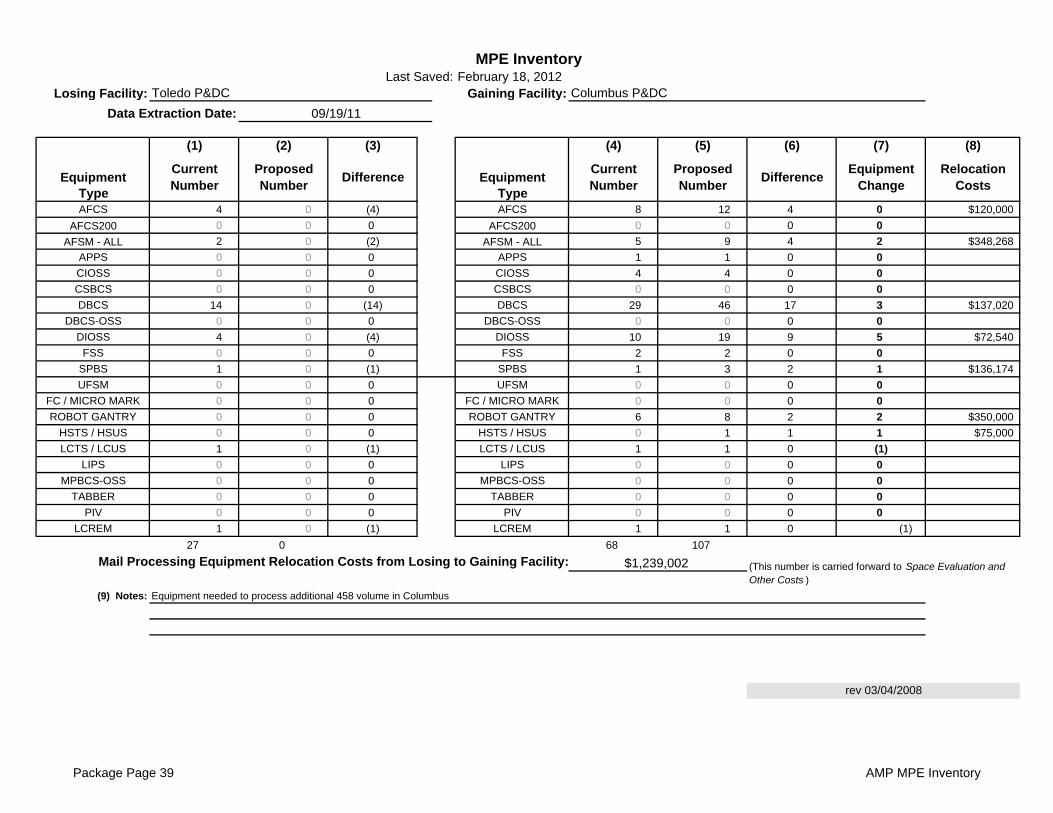
Losing Facility: Gaining Facility:
(1) (2) (3) (4) (5) (6) (7) (8)
Equipment EquipmentType TypeAFCS 4 0 (4) AFCS 8 12 4 0 $120,000
AFCS200 0 0 0 AFCS200 0 0 0 0AFSM - ALL 2 0 (2) AFSM - ALL 5 9 4 2 $348,268
APPS 0 0 0 APPS 1 1 0 0CIOSS 0 0 0 CIOSS 4 4 0 0CSBCS 0 0 0 CSBCS 0 0 0 0DBCS 14 0 (14) DBCS 29 46 17 3 $137,020
DBCS-OSS 0 0 0 DBCS-OSS 0 0 0 0DIOSS 4 0 (4) DIOSS 10 19 9 5 $72,540
FSS 0 0 0 FSS 2 2 0 0SPBS 1 0 (1) SPBS 1 3 2 1 $136,174UFSM 0 0 0 UFSM 0 0 0 0
FC / MICRO MARK 0 0 0 FC / MICRO MARK 0 0 0 0ROBOT GANTRY 0 0 0 ROBOT GANTRY 6 8 2 2 $350,000
HSTS / HSUS 0 0 0 HSTS / HSUS 0 1 1 1 $75,000LCTS / LCUS 1 0 (1) LCTS / LCUS 1 1 0 (1)
LIPS 0 0 0 LIPS 0 0 0 0MPBCS-OSS 0 0 0 MPBCS-OSS 0 0 0 0
TABBER 0 0 0 TABBER 0 0 0 0PIV 0 0 0 PIV 0 0 0 0
LCREM 1 0 (1) LCREM 1 1 0 (1)27 0 68 107
(9) Notes:
rev 03/04/2008
(This number is carried forward to Space Evaluation and Other Costs )
Proposed NumberDifference
Mail Processing Equipment Relocation Costs from Losing to Gaining Facility: $1,239,002
09/19/11
MPE Inventory
Equipment needed to process additional 458 volume in Columbus
Toledo P&DC Columbus P&DC
Current Number Difference Equipment
ChangeRelocation
Costs
Last Saved:
Current Number
Data Extraction Date:
Proposed Number
February 18, 2012
Package Page 39 AMP MPE Inventory
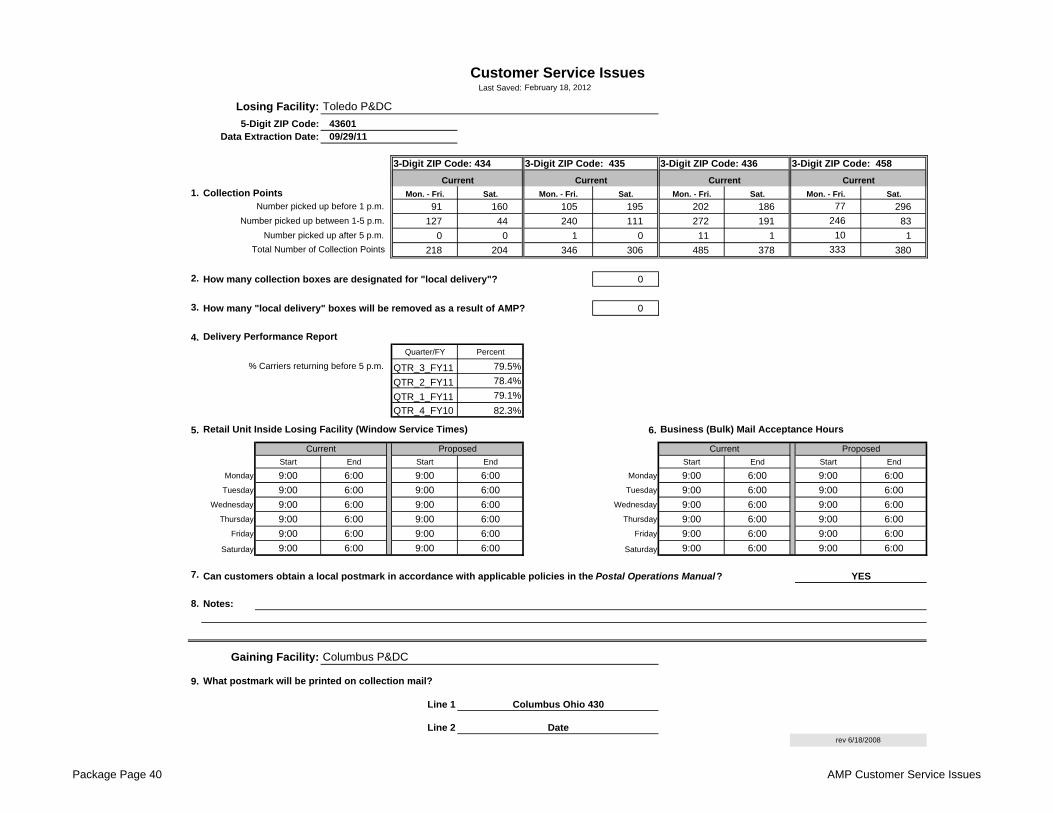
Last Saved:
3-Digit ZIP Code: 435 3-Digit ZIP Code: 436
1. Collection Points Mon. - Fri. Sat. Mon. - Fri. Sat. Mon. - Fri. Sat. Sat.91 160 105 195 202 186 296
127 44 240 111 272 191 830 0 1 0 11 1 1
218 204 346 306 485 378 380
2. How many collection boxes are designated for "local delivery"? 0
3. How many "local delivery" boxes will be removed as a result of AMP? 0
4.Quarter/FY Percent
QTR_3_FY11 79.5%QTR_2_FY11 78.4%QTR_1_FY11 79.1%QTR_4_FY10 82.3%
5. 6.
Start End Start End Start End Start End
Monday 9:00 6:00 9:00 6:00 Monday 9:00 6:00 9:00 6:00Tuesday 9:00 6:00 9:00 6:00 Tuesday 9:00 6:00 9:00 6:00
Wednesday 9:00 6:00 9:00 6:00 Wednesday 9:00 6:00 9:00 6:00Thursday 9:00 6:00 9:00 6:00 Thursday 9:00 6:00 9:00 6:00
Friday 9:00 6:00 9:00 6:00 Friday 9:00 6:00 9:00 6:00Saturday 9:00 6:00 9:00 6:00 Saturday 9:00 6:00 9:00 6:00
7.
8. Notes:
9.
Line 1
Line 2 Date
February 18, 2012
Toledo P&DC
09/29/11
Current CurrentCurrent
Current
Columbus Ohio 430
3-Digit ZIP Code: 458Current
rev 6/18/2008
43601
Can customers obtain a local postmark in accordance with applicable policies in the Postal Operations Manual?
Gaining Facility:
What postmark will be printed on collection mail?
Proposed
% Carriers returning before 5 p.m.
Mon. - Fri.77
Customer Service Issues
Current Proposed
Number picked up after 5 p.m. Number picked up between 1-5 p.m.
Total Number of Collection Points
Delivery Performance Report
Retail Unit Inside Losing Facility (Window Service Times)
Losing Facility:5-Digit ZIP Code:
Data Extraction Date:
3-Digit ZIP Code: 434
Number picked up before 1 p.m.
Business (Bulk) Mail Acceptance Hours
Columbus P&DC
YES
333
24610
Package Page 40 AMP Customer Service Issues
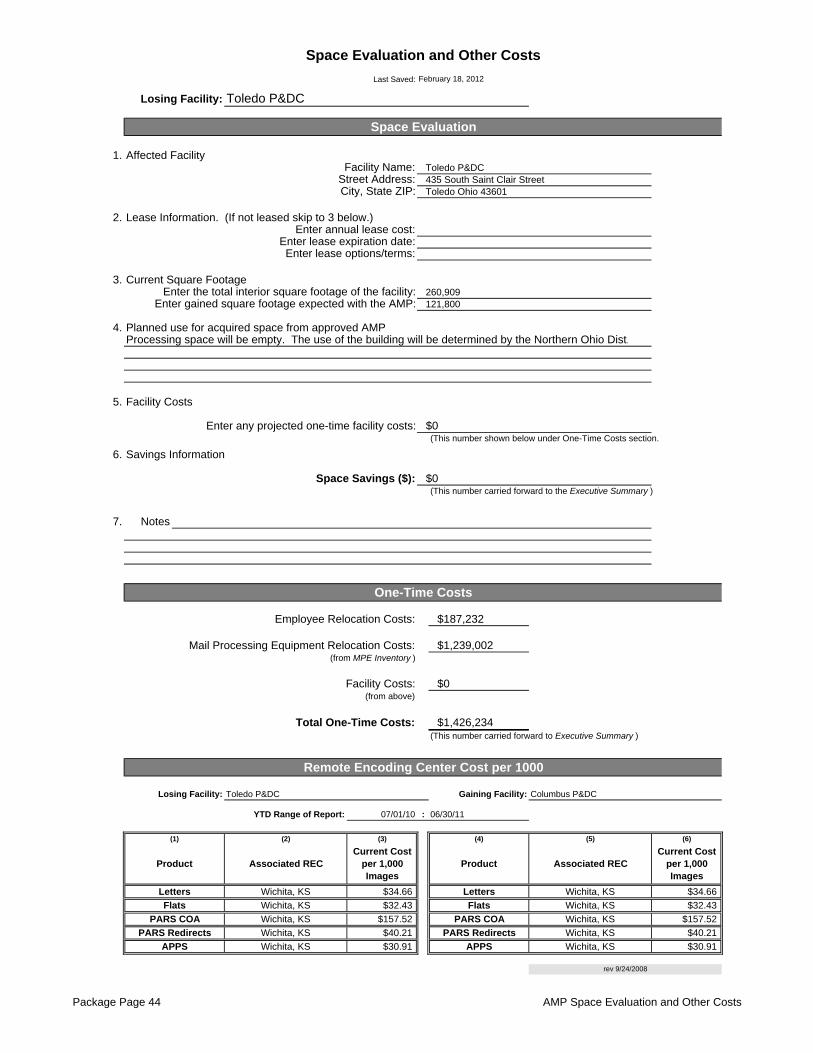
Last Saved:
1.
2. Lease Information. (If not leased skip to 3 below.)
3.
4. Planned use for acquired space from approved AMP
5. Facility Costs
(This number shown below under One-Time Costs section.
6. Savings Information
(This number carried forward to the Executive Summary )
7. Notes
(This number carried forward to Executive Summary )
07/01/10 :
(3) (6)
$34.66 $34.66$32.43 $32.43
$157.52 $157.52$40.21 $40.21$30.91 $30.91
$0
$1,426,234
435 South Saint Clair StreetToledo Ohio 43601
$0
$187,232
Facility Costs:
rev 9/24/2008
Toledo P&DC Columbus P&DC
06/30/11YTD Range of Report:
Wichita, KS
APPS Wichita, KS
Wichita, KSWichita, KS
Space Evaluation and Other Costs
Street Address:City, State ZIP:
Losing Facility:
Space Evaluation
Affected FacilityFacility Name:
February 18, 2012
Toledo P&DC
Toledo P&DC
Mail Processing Equipment Relocation Costs: (from MPE Inventory )
Space Savings ($):
One-Time Costs
Employee Relocation Costs:
$1,239,002
Letters
Gaining Facility:
Current Cost per 1,000 Images
Losing Facility:
(1)
Product
(2)
Wichita, KS
Associated REC
260,909121,800
$0
Processing space will be empty. The use of the building will be determined by the Northern Ohio Dist.
Enter any projected one-time facility costs:
Wichita, KSWichita, KS
Enter annual lease cost:
Enter the total interior square footage of the facility:Enter gained square footage expected with the AMP:
Enter lease options/terms:
Current Square Footage
Enter lease expiration date:
(from above)
(5)
Product Associated REC
(4)
Wichita, KSPARS Redirects
Total One-Time Costs:
Remote Encoding Center Cost per 1000
Current Cost per 1,000 Images
FlatsPARS COA
FlatsLetters
PARS COA
APPS Wichita, KSWichita, KS PARS Redirects
Package Page 44 AMP Space Evaluation and Other Costs

Type of Distribution to Consolidate: Destinating MODS/BPI OfficeFacility Name & Type:
Street Address:City: Toledo
State: OH5D Facility ZIP Code: 43601
District: Northern OhioArea: Eastern
Finance Number: 388261Current 3D ZIP Code(s):
Miles to Gaining Facility: 59 MilesEXFC office: Yes
Plant Manager:Senior Plant Manager:
District Manager:Facility Type after AMP: Post Office
Facility Name & Type:Street Address:
City:State: MI
5D Facility ZIP Code: 48233District: Detroit
Area: Great LakesFinance Number: 252492
Current 3D ZIP Code(s):EXFC office: Yes
Plant Manager:Senior Plant Manager: Jack Watson
District Manager: Charles Howe
Start of Study: 9/15/2011Date Range of Data: Oct-01-2010 : Sep-30-2011
Processing Days per Year: 310Bargaining Unit Hours per Year: 1,745
EAS Hours per Year: 1,822
June 16, 2011
2/18/2012 17:40
Area Vice President:Vice President, Network Operations:
Area AMP Coordinator:HQ AMP Coordinator:
rev 09/21/2011
Bob Roseberry
Date & Time this workbook was last saved:
3. Background Information
Date of HQ memo, DAR Factors/Cost of Borrowing/ New Facility Start-up Costs Update
4. Other Information
Robert Cintron
Detroit
481-482
2. Gaining Facility Information
Monique Packer
434-436
Jordan M. SmallDavid E. Williams
Todd Hawkins
Detroit P&DC1401 W Fort Street
Jack Watson
Toledo P&DC435 S Saint Clair St
Reginald Truss
1. Losing Facility Information
----- AMP Data Entry Page -----
Package Page 1 AMP Data Entry Page

Losing Facility Name and Type:Current 3D ZIP Code(s):
Type of Distribution to Consolidate:
Gaining Facility Name and Type:Current 3D ZIP Code(s):
12/14/2011 13:48
rev 06/10/2009
Summary NarrativeLast Saved:
Toledo P&DC
Detroit P&DC
434-436
February 18, 2012
481-482
Destinating
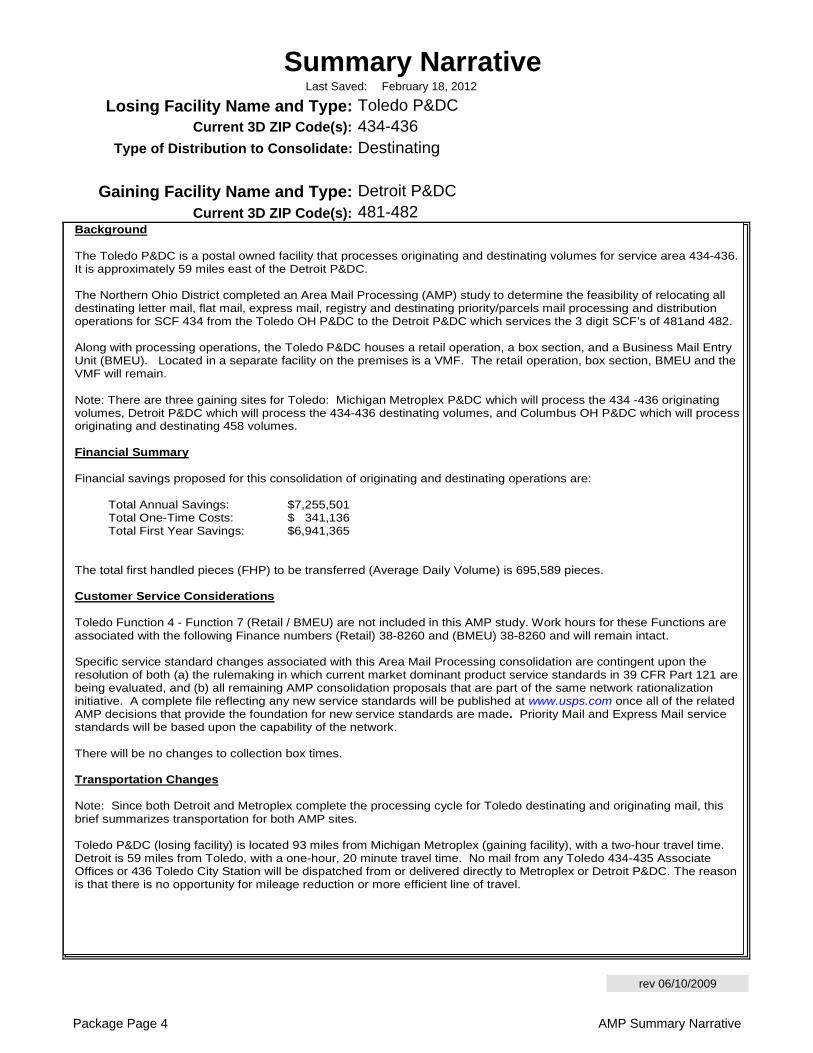
Background The Toledo P&DC is a postal owned facility that processes originating and destinating volumes for service area 434-436. It is approximately 59 miles east of the Detroit P&DC. The Northern Ohio District completed an Area Mail Processing (AMP) study to determine the feasibility of relocating all destinating letter mail, flat mail, express mail, registry and destinating priority/parcels mail processing and distribution operations for SCF 434 from the Toledo OH P&DC to the Detroit P&DC which services the 3 digit SCF’s of 481and 482. Along with processing operations, the Toledo P&DC houses a retail operation, a box section, and a Business Mail Entry Unit (BMEU). Located in a separate facility on the premises is a VMF. The retail operation, box section, BMEU and the VMF will remain.
Note: There are three gaining sites for Toledo: Michigan Metroplex P&DC which will process the 434 -436 originating volumes, Detroit P&DC which will process the 434-436 destinating volumes, and Columbus OH P&DC which will process originating and destinating 458 volumes. Financial Summary Financial savings proposed for this consolidation of originating and destinating operations are: Total Annual Savings: $7,255,501 Total One-Time Costs: $ 341,136
Total First Year Savings: $6,941,365 The total first handled pieces (FHP) to be transferred (Average Daily Volume) is 695,589 pieces. Customer Service Considerations Toledo Function 4 - Function 7 (Retail / BMEU) are not included in this AMP study. Work hours for these Functions are associated with the following Finance numbers (Retail) 38-8260 and (BMEU) 38-8260 and will remain intact. Specific service standard changes associated with this Area Mail Processing consolidation are contingent upon the resolution of both (a) the rulemaking in which current market dominant product service standards in 39 CFR Part 121 are being evaluated, and (b) all remaining AMP consolidation proposals that are part of the same network rationalization initiative. A complete file reflecting any new service standards will be published at www.usps.com once all of the related AMP decisions that provide the foundation for new service standards are made. Priority Mail and Express Mail service standards will be based upon the capability of the network.
There will be no changes to collection box times. Transportation Changes Note: Since both Detroit and Metroplex complete the processing cycle for Toledo destinating and originating mail, this brief summarizes transportation for both AMP sites. Toledo P&DC (losing facility) is located 93 miles from Michigan Metroplex (gaining facility), with a two-hour travel time. Detroit is 59 miles from Toledo, with a one-hour, 20 minute travel time. No mail from any Toledo 434-435 Associate Offices or 436 Toledo City Station will be dispatched from or delivered directly to Metroplex or Detroit P&DC. The reason is that there is no opportunity for mileage reduction or more efficient line of travel.
Package Page 4 AMP Summary Narrative
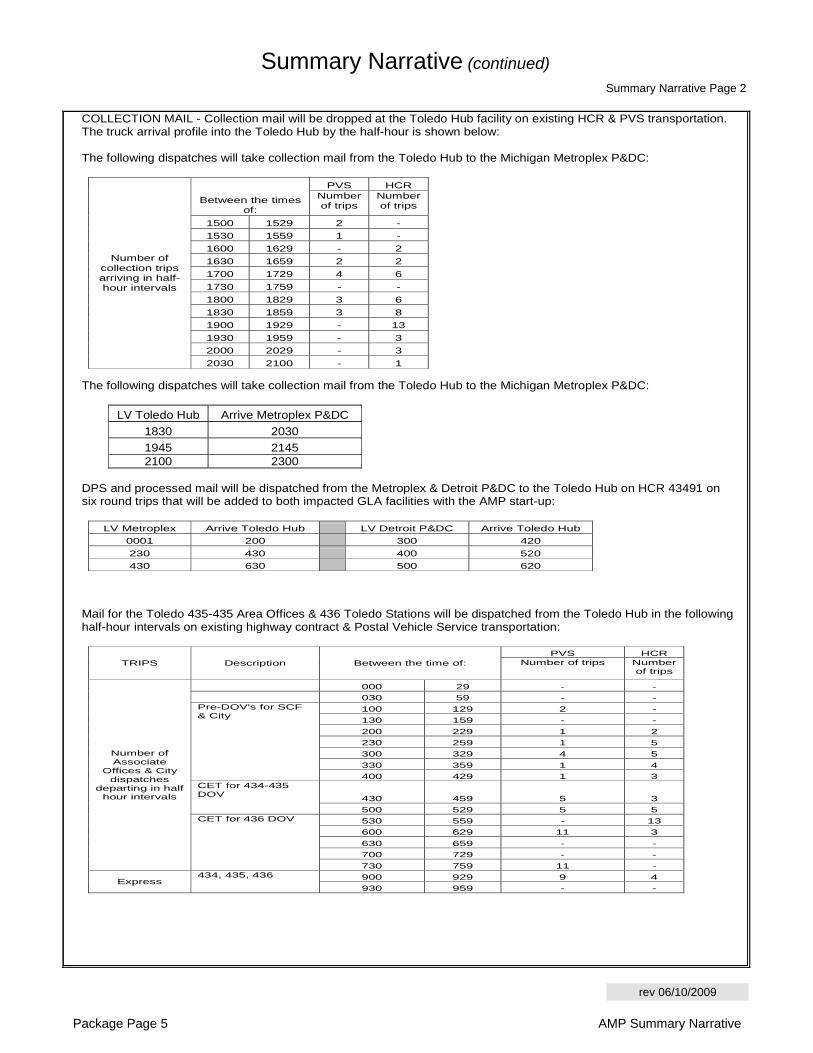
rev 06/10/2009
Summary Narrative (continued)Summary Narrative Page 2
COLLECTION MAIL - Collection mail will be dropped at the Toledo Hub facility on existing HCR & PVS transportation. The truck arrival profile into the Toledo Hub by the half-hour is shown below: The following dispatches will take collection mail from the Toledo Hub to the Michigan Metroplex P&DC:
PVS HCR
Between the times of:
Number of trips
Number of trips
1500 1529 2 - 1530 1559 1 - 1600 1629 - 2 1630 1659 2 2 1700 1729 4 6 1730 1759 - - 1800 1829 3 6 1830 1859 3 8 1900 1929 - 13 1930 1959 - 3 2000 2029 - 3
Number of collection trips arriving in half-hour intervals
2030 2100 - 1
The following dispatches will take collection mail from the Toledo Hub to the Michigan Metroplex P&DC:
LV Toledo Hub Arrive Metroplex P&DC 1830 2030 1945 2145 2100 2300
DPS and processed mail will be dispatched from the Metroplex & Detroit P&DC to the Toledo Hub on HCR 43491 on six round trips that will be added to both impacted GLA facilities with the AMP start-up:
LV Metroplex Arrive Toledo Hub LV Detroit P&DC Arrive Toledo Hub 0001 200 300 420 230 430 400 520 430 630 500 620
Mail for the Toledo 435-435 Area Offices & 436 Toledo Stations will be dispatched from the Toledo Hub in the following half-hour intervals on existing highway contract & Postal Vehicle Service transportation:
PVS HCR TRIPS Description Between the time of: Number of trips Number
of trips
000 29 - - 030 59 - -
100 129 2 - 130 159 - - 200 229 1 2 230 259 1 5 300 329 4 5 330 359 1 4
Pre-DOV's for SCF & City
400 429 1 3
430 459 5 3
CET for 434-435 DOV
500 529 5 5 530 559 - 13 600 629 11 3 630 659 - - 700 729 - -
Number of Associate
Offices & City dispatches
departing in half hour intervals
CET for 436 DOV
730 759 11 - 900 929 9 4 Express
434, 435, 436
930 959 - -
Package Page 5 AMP Summary Narrative

rev 06/10/2009
Summary Narrative Page 3Summary Narrative (continued)
Toledo originating and destinating Express mails will not be affected as a result of this AMP. Express will worked at the Toledo Hub and dispatched directly to the FedEX Ramp at 2045. Originating Priority mail will be dispatched to the Detroit PMC on existing transportation. Destinating priority unsure if it will be processed in Toledo and will arrive from Metroplex sorted to five-digit. Additional transportation was added to move DPS volumes from Detroit P&DC to Toledo Hub & move MTE from Toledo Hub to Metroplex. Lima 458 HCR contracts: 434N0, 434N1, 434N5, 434M8, & 434M9 will be cancelled and rebid going to Columbus City Gate Transportation Savings Resulting from the AMP
TOLEDO AMP SITE HCR PVS TOTAL Metroplex $ 3,452,063 $ 6,099 $ 3,458,162 Detroit $ (2,109,261) $ 32,060 $ (2,077,201) Savings Total $ 1,342,802 $ 38,159 $ 1,380,961
Staffing Impacts Movement of mail will have an impact on staffing and will require movement of personnel. Craft employees currently total 378 at the Toledo P&DC. The total proposed is 38 for a loss of 340 craft positions (Note: The Toledo to Michigan Metroplex AMP workbook shows the retained craft staffing for Toledo). Craft employees currently total 1248 at the Detroit P&DC. The total proposed is 1,269 for a gain of 21 craft employees. The net AMP craft loss is 357 positions. No mail processing EAS positions will be retained at Toledo, losing 26 total. Detroit will increase EAS by 11 positions. EAS position AMP net change is a loss of 15 positions.
Management and Craft Staffing Impacts
Toledo Detroit
Total Current On-
Rolls
Total Proposed
Diff Total Current On-
Rolls
Total Proposed
Diff Net Diff
Craft 1 378 - (378) 1,248 1,269 21 (357) Management 26 - (26) 78 89 11 (15)
1 Craft = FTR+PTR+PTF+Casuals
Mail Processing Management to Craft Ratio
Current Proposed
SDOs to Craft 1 MDOs+SDOs to Craft 1 SDOs to Craft 1 MDOs+SDOs to Craft 1Management to Craft 2 Ratios (1:25 target) (1:22 target) (1:25 target) (1:22 target)
Toledo 1 : 33 1 : 29 #DIV/0! #DIV/0!
Detroit 1 : 26 1 : 23 1 : 27 1 : 22
Package Page 6 AMP Summary Narrative

Summary Narrative (continued)Summary Narrative Page 4
As a matter of policy, the Postal Service follows the Worker Adjustment and Retraining Notification Act’s (“WARN”) notification requirements when the number of employees experiencing an employment loss within the meaning of WARN would trigger WARN’s requirements. Some or all of the impacted employees described above may not experience an employment loss within the meaning of WARN due to transfers or reassignments. Equipment Relocation and Maintenance Impacts Toledo destinating mail will be processed at Detroit. Four DIOSS and two AFSM100 machines will be moved from Toledo to Detroit with a one-time cost of $264,136. . Excess equipment from the Toledo P&DC will be disposed of following all headquarters and area protocols. No cost has been attributed in this workbook for the disposal of equipment. Total annual Maintenance savings is $4,932,493 of which $1,422,913 is attributed to parts and materials. Space Impacts The total interior area gained in Toledo P&DC from this AMP is 121,800 sq-ft. The dock, BMEU, and retail space will be retained. Remaining Operations at Toledo P&DC The remaining Toledo P&DC platform operation will require (11) F-4 clerks. Under the Craft Staffing analysis, (11) mail handlers would be retained, but the positions are to be converted to F-4 clerks. Conclusion Approval of the both the Toledo destinating mail to Detroit P&DC AMP proposal and the concurrent Toledo originating to Michigan Metroplex proposal would result in a reduction of 347 craft employees. The Toledo destinating to Detroit proposal would generate first year savings of $6,941,365 and annual savings of $7,255,501
Package Page 7 AMP Summary Narrative

Losing Facility Name and Type:Current 3D ZIP Code(s):
Type of Distribution to Consolidate:
Gaining Facility Name and Type:Current 3D ZIP Code(s):
rev 04/2/2008
February 18, 2012
481-482
Destinating
24 Hour ClockLast Saved:
Toledo P&DC
Detroit P&DC
434-436
80% 100% 100% 100% Millions 100% 100% 86.9%
Wee
kly
Tren
ds
Beg
inni
ng D
ay
Facility
Can
celle
d by
200
0
Dat
a Sou
rce
= EDW
MCRS
OG
P C
lear
ed b
y 23
00
Dat
a Sou
rce
= EDW
EO
R
OG
S C
lear
ed b
y 24
00
Dat
a Sou
rce
= EDW
EO
R
MM
P C
lear
ed b
y 24
00
Dat
a Sou
rce
= EDW
EO
R
MM
P V
olum
e O
n Han
d at
240
0
Dat
a Sou
rce
= EDW
MCRS
Mai
l Ass
igne
d Com
mer
cial
/
FedE
x By
0230
Dat
a Sou
rce
= EDW
SASS
DPS 2
nd P
ass
Cle
ared
by
0700
Dat
a Sou
rce
= EDW
EO
R
Trip
s O
n-Ti
me
0400
- 09
00
Dat
a Sou
rce
= EDW
TIM
ES
%
2-Apr SAT 4/2 TOLEDO P&DF 67.2% 95.3% 100.0% 0.2 100.0% 96.3% 64.4%9-Apr SAT 4/9 TOLEDO P&DF 74.1% 97.3% 100.0% 0.3 100.0% 97.7% 76.0%
16-Apr SAT 4/16 TOLEDO P&DF 62.7% 94.3% 100.0% 0.2 99.8% 99.0% 81.6%23-Apr SAT 4/23 TOLEDO P&DF 68.6% 93.3% 92.1% 0.2 100.0% 99.0% 87.7%30-Apr SAT 4/30 TOLEDO P&DF 71.0% 97.9% 100.0% 1.5 99.9% 99.6% 85.6%7-May SAT 5/7 TOLEDO P&DF 71.6% 97.6% 100.0% 0.3 100.0% 97.2% 80.7%
14-May SAT 5/14 TOLEDO P&DF 72.1% 98.5% 100.0% 0.2 100.0% 99.4% 92.8%21-May SAT 5/21 TOLEDO P&DF 73.6% 96.5% 100.0% 0.4 100.0% 99.8% 90.5%28-May SAT 5/28 TOLEDO P&DF 66.5% 96.9% 78.2% 0.2 100.0% 99.2% 88.0%
4-Jun SAT 6/4 TOLEDO P&DF 71.5% 97.2% 100.0% 0.4 100.0% 99.4% 93.3%11-Jun SAT 6/11 TOLEDO P&DF 74.1% 97.6% 72.3% 0.2 100.0% 98.8% 96.2%18-Jun SAT 6/18 TOLEDO P&DF 74.6% 97.7% 92.6% 0.3 100.0% 99.5% 93.5%25-Jun SAT 6/25 TOLEDO P&DF 71.8% 97.0% 81.2% 0.3 100.0% 97.9% 91.3%
2-Jul SAT 7/2 TOLEDO P&DF 68.5% 98.0% 100.0% 0.4 100.0% 99.7% 83.0%9-Jul SAT 7/9 TOLEDO P&DF 72.3% 99.0% 100.0% 0.3 100.0% 96.9% 83.0%
16-Jul SAT 7/16 TOLEDO P&DF 71.1% 99.0% 100.0% 0.2 100.0% 98.0% 91.7%23-Jul SAT 7/23 TOLEDO P&DF 71.7% 98.2% 100.0% 0.3 100.0% 98.5% 91.6%30-Jul SAT 7/30 TOLEDO P&DF 70.4% 95.7% 100.0% 0.3 100.0% 97.0% 84.6%6-Aug SAT 8/6 TOLEDO P&DF 72.2% 97.0% 100.0% 0.3 100.0% 97.9% 84.6%
13-Aug SAT 8/13 TOLEDO P&DF 77.5% 98.3% 100.0% 0.3 100.0% 97.8% 72.2%20-Aug SAT 8/20 TOLEDO P&DF 74.7% 97.7% 100.0% 0.2 100.0% 99.5% 85.3%27-Aug SAT 8/27 TOLEDO P&DF 70.8% 90.1% 100.0% 0.5 100.0% 96.8% 91.3%3-Sep SAT 9/3 TOLEDO P&DF 67.4% 89.7% 100.0% 0.3 100.0% 96.7% 75.0%
10-Sep SAT 9/10 TOLEDO P&DF 73.5% 95.1% 100.0% 0.6 100.0% 97.8% 79.9%17-Sep SAT 9/17 TOLEDO P&DF 73.2% 90.7% 100.0% 0.4 100.0% 98.5% 89.9%
24 Hour Indicator Report
Package Page 5 AMP 24 Hour Clock
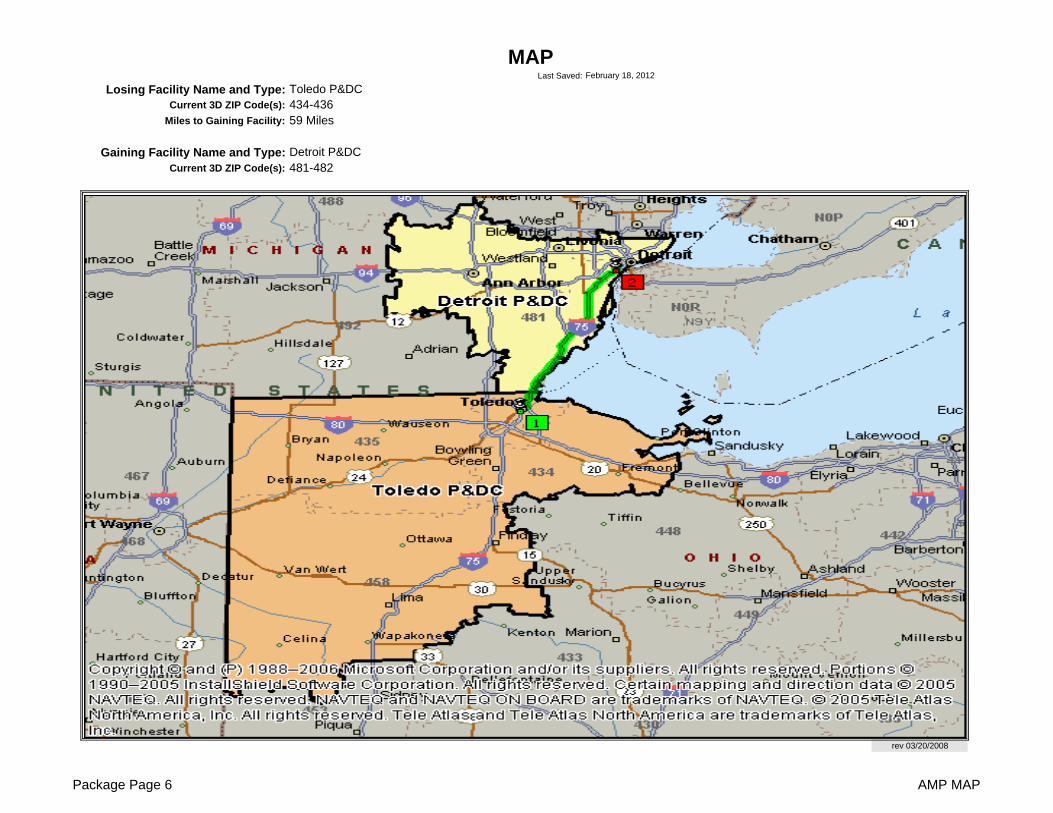
Last Saved:
Losing Facility Name and Type:Current 3D ZIP Code(s):
Miles to Gaining Facility:
Gaining Facility Name and Type:Current 3D ZIP Code(s):
rev 03/20/2008
481-482
MAPToledo P&DC
Detroit P&DC
434-436
February 18, 2012
59 Miles
Package Page 6 AMP MAP

Overnight % Change All Others % Change Total % Change All % Change All % Change All % Change All % Change All % ChangeUPGRADE TBDDOWNGRADE TBDTOTAL TBDNET UP+NO CHNG TBD
VOLUME TOTAL TBD
* - Periodical and Standard mail origin 3-digit ZIP Code to destination 3-digit ZIP Code volume is not available
Overnight % Change All Others % Change Total % Change All % Change All % Change All % Change All % Change All % ChangeUPGRADE TBDDOWNGRADE TBDTOTAL TBDNET TBD
Service Standard Impacts
PRI ALL CLASSESSTD *FCM PER *
Based on report prepared by Network Integration Support dated:
Last Saved:
PER STD
February 18, 2012
Losing Facility:
PSVC ALL CLASSES
rev 10/16/2009
Losing Facility 3D ZIP Code(s):
mm/dd/yyyy
Selected summary fields are transferred to the Executive Summary
Toledo P&DC
434-436481-482Gaining Facility 3D ZIP Code(s):
Service Standard Changes - PairsFCM PRI
PSVC
Service Standard Changes - Average Daily Volume (data obtained from ODIS is derived from sampling and may vary from actual volume)
Package Page 7 AMP Service Standard Impacts

Last Saved: Stakeholder Notification Page 1AMP Event: Start of Study
rev 07/16/2008
Toledo P&DC
Stakeholders Notification Losing Facility:
February 18, 2012(WorkBook Tab Notification - 1)
Package Page 8 AMP Stakeholders Notification
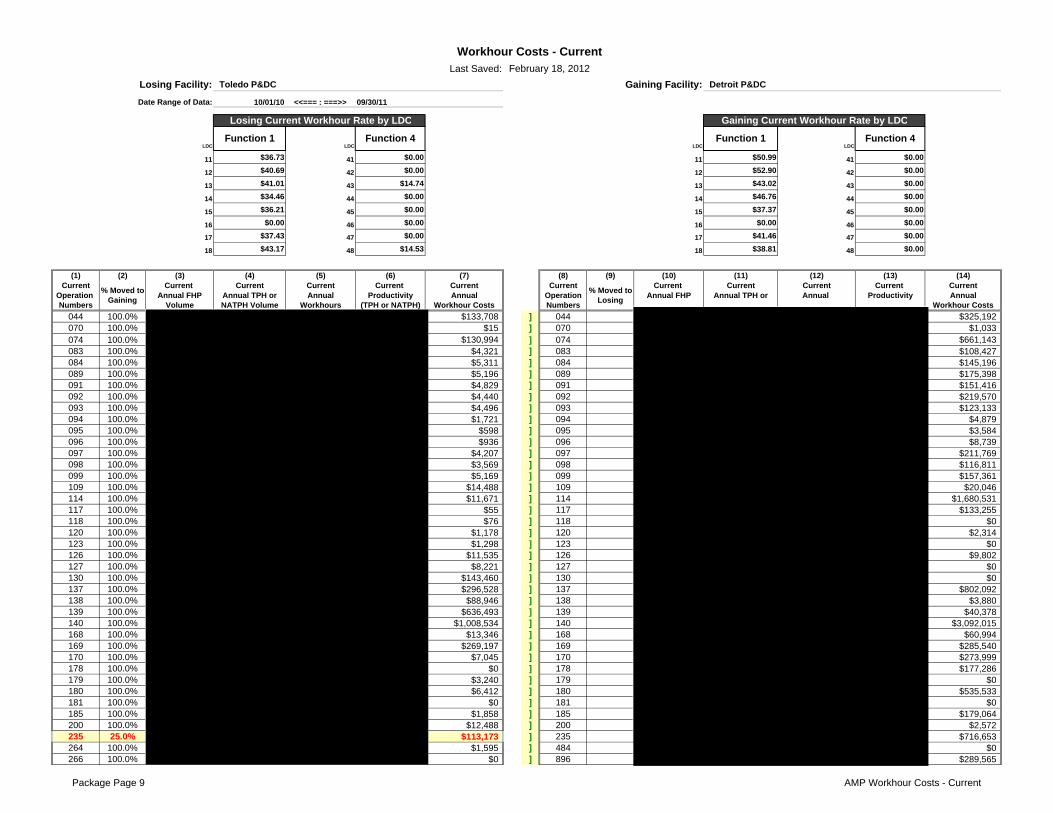
Last Saved:
10/01/10 <<=== : ===>> 09/30/11
LDC LDC LDC LDC
11 $36.73 41 $0.00 11 $50.99 41 $0.00
12 $40.69 42 $0.00 12 $52.90 42 $0.00
13 $41.01 43 $14.74 13 $43.02 43 $0.00
14 $34.46 44 $0.00 14 $46.76 44 $0.00
15 $36.21 45 $0.00 15 $37.37 45 $0.00
16 $0.00 46 $0.00 16 $0.00 46 $0.00
17 $37.43 47 $0.00 17 $41.46 47 $0.00
18 $43.17 48 $14.53 18 $38.81 48 $0.00
(1) (2) (3) (4) (5) (6) (7) (8) (9) (10) (11) (12) (13) (14)Current Current Current Current Current Current Current Current Current Current Current Current
Operation Annual FHP Annual TPH or Annual Productivity Annual Operation Annual FHP Annual TPH or Annual Productivity AnnualNumbers Volume NATPH Volume Workhours (TPH or NATPH) Workhour Costs Numbers Workhour Costs
044 100.0% $133,708 \ ] 044 $325,192070 100.0% $15 \ ] 070 $1,033074 100.0% $130,994 \ ] 074 $661,143083 100.0% $4,321 \ ] 083 $108,427084 100.0% $5,311 \ ] 084 $145,196089 100.0% $5,196 \ ] 089 $175,398091 100.0% $4,829 \ ] 091 $151,416092 100.0% $4,440 \ ] 092 $219,570093 100.0% $4,496 \ ] 093 $123,133094 100.0% $1,721 \ ] 094 $4,879095 100.0% $598 \ ] 095 $3,584096 100.0% $936 \ ] 096 $8,739097 100.0% $4,207 \ ] 097 $211,769098 100.0% $3,569 \ ] 098 $116,811099 100.0% $5,169 \ ] 099 $157,361109 100.0% $14,488 \ ] 109 $20,046114 100.0% $11,671 \ ] 114 $1,680,531117 100.0% $55 \ ] 117 $133,255118 100.0% $76 \ ] 118 $0120 100.0% $1,178 \ ] 120 $2,314123 100.0% $1,298 \ ] 123 $0126 100.0% $11,535 \ ] 126 $9,802127 100.0% $8,221 \ ] 127 $0130 100.0% $143,460 \ ] 130 $0137 100.0% $296,528 \ ] 137 $802,092138 100.0% $88,946 \ ] 138 $3,880139 100.0% $636,493 \ ] 139 $40,378140 100.0% $1,008,534 \ ] 140 $3,092,015168 100.0% $13,346 \ ] 168 $60,994169 100.0% $269,197 \ ] 169 $285,540170 100.0% $7,045 \ ] 170 $273,999178 100.0% $0 \ ] 178 $177,286179 100.0% $3,240 \ ] 179 $0180 100.0% $6,412 \ ] 180 $535,533181 100.0% $0 \ ] 181 $0185 100.0% $1,858 \ ] 185 $179,064200 100.0% $12,488 \ ] 200 $2,572235 25.0% $113,173 \ ] 235 $716,653264 100.0% $1,595 \ ] 484 $0266 100.0% $0 \ ] 896 $289,565
Losing Facility: Gaining Facility:Date Range of Data:
Function 1
Gaining Current Workhour Rate by LDC
Function 4
% Moved to Losing
% Moved to Gaining
Losing Current Workhour Rate by LDC
Function 4Function 1
February 18, 2012Workhour Costs - Current
Toledo P&DC Detroit P&DC
Package Page 9 AMP Workhour Costs - Current

(1) (2) (3) (4) (5) (6) (7) (8) (9) (10) (11) (12) (13) (14)Current Current Current Current Current Current Current Current Current Current Current Current
Operation Annual FHP Annual TPH or Annual Productivity Annual Operation Annual FHP Annual TPH or Annual Productivity AnnualNumbers Volume NATPH Volume Workhours (TPH or NATPH) Workhour Costs Numbers Workhour Costs
% Moved to Losing
% Moved to Gaining
332 100.0% $89 \ ] 142 $8,781464 100.0% $569,801 \ ] 144 $298,167466 100.0% $377,073 \ ] 146 $976,939467 100.0% $151 \ ] 146dup547 100.0% $14,356 \ ] 547 $35549 50.0% $39,466 \ ] 549 $210,158554 100.0% $68,452 \ ] 554 $150,533555 100.0% $108,173 \ ] 555 $0560 50.0% $36,314 \ ] 560 $79,528561 50.0% $8,453 \ ] 561 $0565 100.0% $16,701 \ ] 565 $87,112585 40.0% $126,872 \ ] 585 $517,771607 100.0% $11,926 \ ] 607 $625,588612 100.0% $7,637 \ ] 612 $403,049618 100.0% $105,685 \ ] 618 $1,681,454619 100.0% $681,549 \ ] 619 $645,356620 100.0% $1,131 \ ] 620 $6,955896 100.0% $7,352 \ ] 896dup918 100.0% $1,865,894 \ ] 918 $5,606,979919 100.0% $201,356 \ ] 919 $2,575,611930 100.0% $17,873 \ ] 930 $58,178055 $739 \ ] 055 $1,090232 $84,891 \ ] 232 $0233 $57,361 \ ] 233 $0234 $3,262 \ ] 234 $0340 $1,087 \ ] 340 $329,367
\ ] 002 $22,498\ ] 018 $431,837\ ] 019 $1,389\ ] 020 $116\ ] 021 $0\ ] 022 $0\ ] 030 $22,225\ ] 032 $136\ ] 040 $1,216\ ] 043 $478,812\ ] 047 $250\ ] 060 $115,025\ ] 073 $712,589\ ] 087 $1,540\ ] 088 $3,855\ ] 090 $160,541\ ] 100 $1,146\ ] 102 $888\ ] 103 $7,388\ ] 110 $536,694\ ] 111 $307\ ] 112 $5,272,897\ ] 115 $1,100,260\ ] 116 $427\ ] 121 $2,430\ ] 124 $716,122\ ] 125 $3,297,470\ ] 128 $287,582\ ] 132 $180,169\ ] 134 $616,460\ ] 135 $977\ ] 136 $1,408,231\ ] 141 $6,935\ ] 142dup
Package Page 10 AMP Workhour Costs - Current

(1) (2) (3) (4) (5) (6) (7) (8) (9) (10) (11) (12) (13) (14)Current Current Current Current Current Current Current Current Current Current Current Current
Operation Annual FHP Annual TPH or Annual Productivity Annual Operation Annual FHP Annual TPH or Annual Productivity AnnualNumbers Volume NATPH Volume Workhours (TPH or NATPH) Workhour Costs Numbers Workhour Costs
% Moved to Losing
% Moved to Gaining
\ ] 143 $514,277\ ] 144dup\ ] 145 $218,776\ ] 146dup\ ] 147 $1,582\ ] 150 $413,853\ ] 160 $0\ ] 175 $17,853\ ] 186 $34,046\ ] 208 $25,575\ ] 210 $1,002,597\ ] 211 $1,463,470\ ] 212 $1,457,122\ ] 213 $105,031\ ] 214 $77,043\ ] 225 $1,672,056\ ] 229 $2,104,158\ ] 230 $950,490\ ] 231 $2,695,646\ ] 238 $361\ ] 239 $5,855\ ] 261 $6,475\ ] 263 $1,545\ ] 264 $79,468\ ] 266 $5,252\ ] 267 $66\ ] 273 $5,639\ ] 281 $29,144\ ] 282 $198,849\ ] 283 $337,961\ ] 286 $71\ ] 294 $199\ ] 325 $98\ ] 341 $846\ ] 434 $54,505\ ] 437 $7,644\ ] 438 $0\ ] 448 $5,454\ ] 483 $12,742\ ] 484dup\ ] 487 $0\ ] 563 $60,177\ ] 564 $297,371\ ] 567 $291\ ] 603 $677,114\ ] 630 $362,193\ ] 677 $633,778\ ] 776 $62,092\ ] 891 $41,819\ ] 892 $3,544\ ] 893 $1,907,841\ ] 894 $63,377\ ] 895 $1,499\ ] 898 $1,215,639\ ] 899 $8,770\ ] 961 $14,750\ ] 963 $36,068\ ] 966 $2,672\ ]\ ]
Package Page 11 AMP Workhour Costs - Current

(1) (2) (3) (4) (5) (6) (7) (8) (9) (10) (11) (12) (13) (14)Current Current Current Current Current Current Current Current Current Current Current Current
Operation Annual FHP Annual TPH or Annual Productivity Annual Operation Annual FHP Annual TPH or Annual Productivity AnnualNumbers Volume NATPH Volume Workhours (TPH or NATPH) Workhour Costs Numbers Volume NATPH Volume Workhours (TPH or NATPH) Workhour Costs
% Moved to Losing
% Moved to Gaining
\ ]\ ]\ ]\ ]\ ]\ ]\ ]\ ]\ ]\ ]\ ]\ ]\ ]\ ]\ ]\ ]\ ]\ ]\ ]\ ]\ ]\ ]\ ]\ ]\ ]\ ]\ ]\ ]\ ]\ ]\ ]\ ]\ ]\ ]\ ]\ ]\ ]\ ]\ ]\ ]\ ]\ ]\ ]\ ]\ ]\ ]\ ]\ ]\ ]\ ]\ ]\ ]\ ]\ ]\ ]\ ]\ ]\ ]\ ]\ ]
Package Page 12 AMP Workhour Costs - Current

(1) (2) (3) (4) (5) (6) (7) (8) (9) (10) (11) (12) (13) (14)Current Current Current Current Current Current Current Current Current Current Current Current
Operation Annual FHP Annual TPH or Annual Productivity Annual Operation Annual FHP Annual TPH or Annual Productivity AnnualNumbers Volume NATPH Volume Workhours (TPH or NATPH) Workhour Costs Numbers Volume NATPH Volume Workhours (TPH or NATPH) Workhour Costs
% Moved to Losing
% Moved to Gaining
\ ]\ ]\ ]\ ]\ ]\ ]\ ]\ ]\ ]\ ]\ ]\ ]\ ]\ ]\ ]\ ]\ ]\ ]\ ]\ ]\ ]\ ]\ ]\ ]\ ]\ ]\ ]\ ]\ ]\ ]\ ]\ ]\ ]\ ]\ ]\ ]\ ]\ ]\ ]\ ]\ ]\ ]\ ]\ ]\ ]\ ]\ ]\ ]\ ]\ ]\ ]\ ]\ ]\ ]\ ]\ ]\ ]\ ]\ ]\ ]
Package Page 13 AMP Workhour Costs - Current
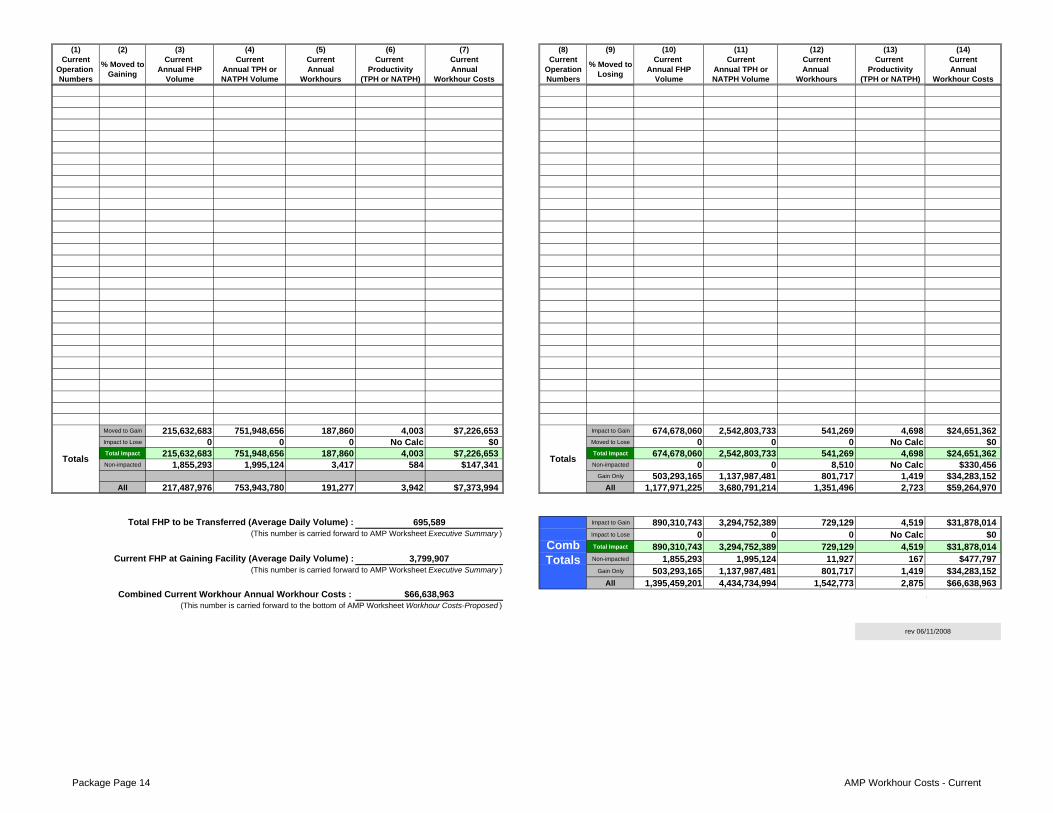
(1) (2) (3) (4) (5) (6) (7) (8) (9) (10) (11) (12) (13) (14)Current Current Current Current Current Current Current Current Current Current Current Current
Operation Annual FHP Annual TPH or Annual Productivity Annual Operation Annual FHP Annual TPH or Annual Productivity AnnualNumbers Volume NATPH Volume Workhours (TPH or NATPH) Workhour Costs Numbers Volume NATPH Volume Workhours (TPH or NATPH) Workhour Costs
% Moved to Losing
% Moved to Gaining
\ ]\ ]\ ]\ ]\ ]\ ]\ ]\ ]\ ]\ ]\ ]\ ]\ ]\ ]\ ]\ ]\ ]\ ]\ ]\ ]\ ]\ ]\ ]\ ]\ ]\ ]\ ]\ ]\ ]\ ]
Moved to Gain 215,632,683 751,948,656 187,860 4,003 $7,226,653 Impact to Gain 674,678,060 2,542,803,733 541,269 4,698 $24,651,362Impact to Lose 0 0 0 No Calc $0 Moved to Lose 0 0 0 No Calc $0Total Impact 215,632,683 751,948,656 187,860 4,003 $7,226,653 Total Impact 674,678,060 2,542,803,733 541,269 4,698 $24,651,362Non-impacted 1,855,293 1,995,124 3,417 584 $147,341 Non-impacted 0 0 8,510 No Calc $330,456
Gain Only 503,293,165 1,137,987,481 801,717 1,419 $34,283,152All 217,487,976 753,943,780 191,277 3,942 $7,373,994 All 1,177,971,225 3,680,791,214 1,351,496 2,723 $59,264,970
Impact to Gain 890,310,743 3,294,752,389 729,129 4,519 $31,878,014Impact to Lose 0 0 0 No Calc $0Total Impact 890,310,743 3,294,752,389 729,129 4,519 $31,878,014Non-impacted 1,855,293 1,995,124 11,927 167 $477,797
Gain Only 503,293,165 1,137,987,481 801,717 1,419 $34,283,152All 1,395,459,201 4,434,734,994 1,542,773 2,875 $66,638,963
.
(This number is carried forward to the bottom of AMP Worksheet Workhour Costs-Proposed )$66,638,963
Current FHP at Gaining Facility (Average Daily Volume) : 3,799,907 (This number is carried forward to AMP Worksheet Executive Summary )
(This number is carried forward to AMP Worksheet Executive Summary )
Combined Current Workhour Annual Workhour Costs :
695,589 Total FHP to be Transferred (Average Daily Volume) :
Totals
rev 06/11/2008
Comb Totals
Totals
Package Page 14 AMP Workhour Costs - Current
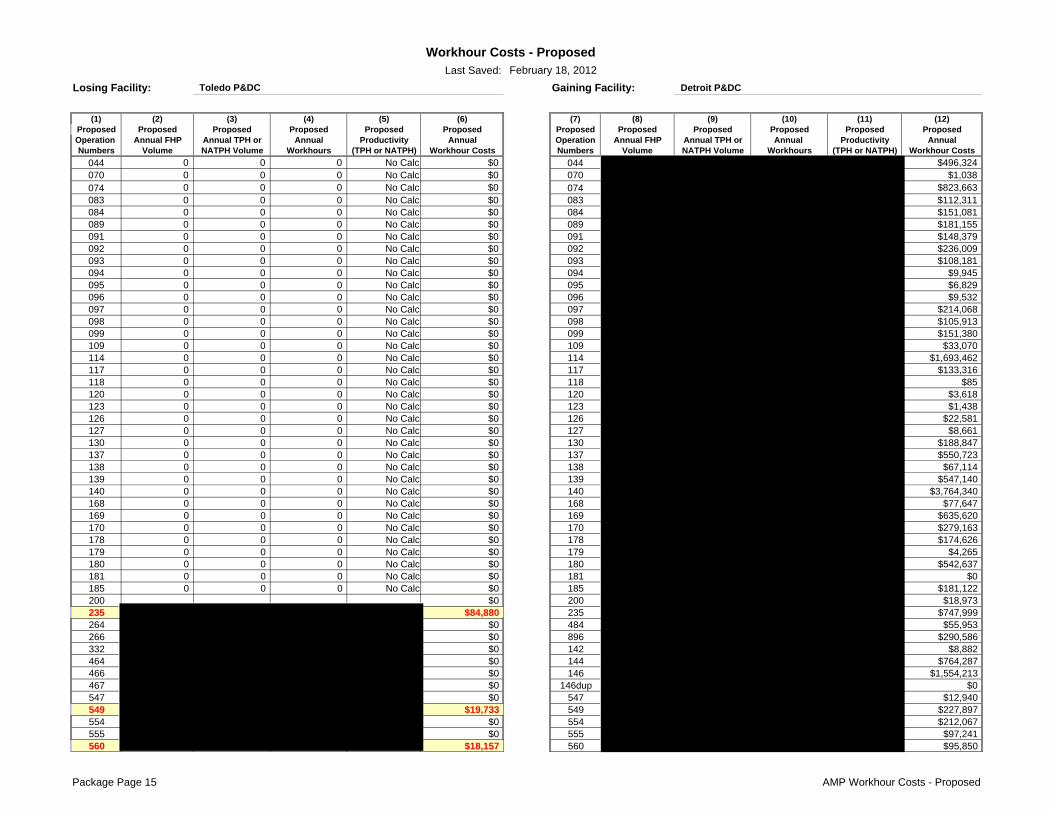
Last Saved:Losing Facility: Gaining Facility:
(1) (2) (3) (4) (5) (6) (7) (8) (9) (10) (11) (12)Proposed Proposed Proposed Proposed Proposed Proposed Proposed Proposed Proposed Proposed Proposed ProposedOperation Annual FHP Annual TPH or Annual Productivity Annual Operation Annual FHP Annual TPH or Annual Productivity AnnualNumbers Volume NATPH Volume Workhours (TPH or NATPH) Workhour Costs Numbers Volume NATPH Volume Workhours (TPH or NATPH) Workhour Costs
044 0 0 0 No Calc $0 044 $496,324070 0 0 0 No Calc $0 070 $1,038074 0 0 0 No Calc $0 074 $823,663083 0 0 0 No Calc $0 083 $112,311084 0 0 0 No Calc $0 084 $151,081089 0 0 0 No Calc $0 089 $181,155091 0 0 0 No Calc $0 091 $148,379092 0 0 0 No Calc $0 092 $236,009093 0 0 0 No Calc $0 093 $108,181094 0 0 0 No Calc $0 094 $9,945095 0 0 0 No Calc $0 095 $6,829096 0 0 0 No Calc $0 096 $9,532097 0 0 0 No Calc $0 097 $214,068098 0 0 0 No Calc $0 098 $105,913099 0 0 0 No Calc $0 099 $151,380109 0 0 0 No Calc $0 109 $33,070114 0 0 0 No Calc $0 114 $1,693,462117 0 0 0 No Calc $0 117 $133,316118 0 0 0 No Calc $0 118 $85120 0 0 0 No Calc $0 120 $3,618123 0 0 0 No Calc $0 123 $1,438126 0 0 0 No Calc $0 126 $22,581127 0 0 0 No Calc $0 127 $8,661130 0 0 0 No Calc $0 130 $188,847137 0 0 0 No Calc $0 137 $550,723138 0 0 0 No Calc $0 138 $67,114139 0 0 0 No Calc $0 139 $547,140140 0 0 0 No Calc $0 140 $3,764,340168 0 0 0 No Calc $0 168 $77,647169 0 0 0 No Calc $0 169 $635,620170 0 0 0 No Calc $0 170 $279,163178 0 0 0 No Calc $0 178 $174,626179 0 0 0 No Calc $0 179 $4,265180 0 0 0 No Calc $0 180 $542,637181 0 0 0 No Calc $0 181 $0185 0 0 0 No Calc $0 185 $181,122200 $0 200 $18,973235 $84,880 P 235 $747,999264 $0 484 $55,953266 $0 896 $290,586332 $0 142 $8,882464 $0 144 $764,287466 $0 146 $1,554,213467 $0 146dup $0547 $0 547 $12,940549 $19,733 P 549 $227,897554 $0 554 $212,067555 $0 555 $97,241560 $18,157 P 560 $95,850
Detroit P&DC
Workhour Costs - Proposed
Toledo P&DC
February 18, 2012
Package Page 15 AMP Workhour Costs - Proposed

(1) (2) (3) (4) (5) (6) (7) (8) (9) (10) (11) (12)Proposed Proposed Proposed Proposed Proposed Proposed Proposed Proposed Proposed Proposed Proposed ProposedOperation Annual FHP Annual TPH or Annual Productivity Annual Operation Annual FHP Annual TPH or Annual Productivity AnnualNumbers Volume NATPH Volume Workhours (TPH or NATPH) Workhour Costs Numbers Volume NATPH Volume Workhours (TPH or NATPH) Workhour Costs
561 $4,226 P 561 $3,799565 $0 565 $102,125585 $76,123 P 585 $563,391607 $0 607 $636,309612 $0 612 $409,914618 $0 618 $1,358,464619 $0 619 $1,746,174620 $0 620 $7,972896 $0 896dup $0918 $0 918 $5,891,559919 $0 919 $5,551,899930 $0 930 $74,245055 $739 055 $1,073232 $84,891 232 $0233 $57,361 233 $0234 $3,262 234 $0340 $1,087 340 $329,367
0 No Calc 002 $22,4980 No Calc 018 $431,8370 No Calc 019 $1,3890 No Calc 020 $1160 No Calc 021 $00 No Calc 022 $00 No Calc 030 $21,8920 No Calc 032 $1340 No Calc 040 $1,1980 No Calc 043 $471,6300 No Calc 047 $00 No Calc 060 $113,2990 No Calc 073 $701,9000 No Calc 087 $3,6700 No Calc 088 $00 No Calc 090 $158,1330 No Calc 100 $1,1280 No Calc 102 $8750 No Calc 103 $7,2770 No Calc 110 $536,6940 No Calc 111 $3070 No Calc 112 $5,272,8970 No Calc 115 $1,100,2600 No Calc 116 $4270 No Calc 121 $2,4300 No Calc 124 $716,1220 No Calc 125 $3,297,4700 No Calc 128 $287,5820 No Calc 132 $180,1690 No Calc 134 $869,8390 No Calc 135 $00 No Calc 136 $1,160,3130 No Calc 141 $5,7780 No Calc 142dup $00 No Calc 143 $543,4530 No Calc 144dup $00 No Calc 145 $00 No Calc 146dup $0
Package Page 16 AMP Workhour Costs - Proposed

(1) (2) (3) (4) (5) (6) (7) (8) (9) (10) (11) (12)Proposed Proposed Proposed Proposed Proposed Proposed Proposed Proposed Proposed Proposed Proposed ProposedOperation Annual FHP Annual TPH or Annual Productivity Annual Operation Annual FHP Annual TPH or Annual Productivity AnnualNumbers Volume NATPH Volume Workhours (TPH or NATPH) Workhour Costs Numbers Volume NATPH Volume Workhours (TPH or NATPH) Workhour Costs
0 No Calc 147 $790 No Calc 150 $407,6460 No Calc 160 $00 No Calc 175 $17,5850 No Calc 186 $34,0460 No Calc 208 $25,5750 No Calc 210 $1,002,5970 No Calc 211 $1,463,4700 No Calc 212 $1,457,1220 No Calc 213 $105,0310 No Calc 214 $77,0430 No Calc 225 $1,672,0560 No Calc 229 $2,104,1580 No Calc 230 $950,4900 No Calc 231 $2,695,6460 No Calc 238 $00 No Calc 239 $00 No Calc 261 $00 No Calc 263 $1,2110 No Calc 264 $62,6460 No Calc 266 $770 No Calc 267 $00 No Calc 273 $2,2480 No Calc 281 $00 No Calc 282 $00 No Calc 283 $409,5200 No Calc 286 $00 No Calc 294 $00 No Calc 325 $970 No Calc 341 $8460 No Calc 434 $185,6410 No Calc 437 $200,6520 No Calc 438 $4,0660 No Calc 448 $00 No Calc 483 $84,9660 No Calc 484dup $00 No Calc 487 $3,7390 No Calc 563 $60,1770 No Calc 564 $297,3710 No Calc 567 $00 No Calc 603 $00 No Calc 630 $362,1930 No Calc 677 $633,7780 No Calc 776 $00 No Calc 891 $36,5320 No Calc 892 $5,2410 No Calc 893 $1,894,6620 No Calc 894 $67,5740 No Calc 895 $1020 No Calc 898 $00 No Calc 899 $00 No Calc 961 $14,0410 No Calc 963 $32,6300 No Calc 966 $2,3630 No Calc 0 No Calc
Package Page 17 AMP Workhour Costs - Proposed

(1) (2) (3) (4) (5) (6) (7) (8) (9) (10) (11) (12)Proposed Proposed Proposed Proposed Proposed Proposed Proposed Proposed Proposed Proposed Proposed ProposedOperation Annual FHP Annual TPH or Annual Productivity Annual Operation Annual FHP Annual TPH or Annual Productivity AnnualNumbers Volume NATPH Volume Workhours (TPH or NATPH) Workhour Costs Numbers Volume NATPH Volume Workhours (TPH or NATPH) Workhour Costs
0 No Calc 0 No Calc0 No Calc 0 No Calc0 No Calc 0 No Calc0 No Calc 0 No Calc0 No Calc 0 No Calc0 No Calc 0 No Calc0 No Calc 0 No Calc0 No Calc 0 No Calc0 No Calc 0 No Calc0 No Calc 0 No Calc0 No Calc 0 No Calc0 No Calc 0 No Calc0 No Calc 0 No Calc0 No Calc 0 No Calc0 No Calc 0 No Calc0 No Calc 0 No Calc0 No Calc 0 No Calc0 No Calc 0 No Calc0 No Calc 0 No Calc0 No Calc 0 No Calc0 No Calc 0 No Calc0 No Calc 0 No Calc0 No Calc 0 No Calc0 No Calc 0 No Calc0 No Calc 0 No Calc0 No Calc 0 No Calc0 No Calc 0 No Calc0 No Calc 0 No Calc0 No Calc 0 No Calc0 No Calc 0 No Calc0 No Calc 0 No Calc0 No Calc 0 No Calc0 No Calc 0 No Calc0 No Calc 0 No Calc0 No Calc 0 No Calc0 No Calc 0 No Calc0 No Calc 0 No Calc0 No Calc 0 No Calc0 No Calc 0 No Calc0 No Calc 0 No Calc0 No Calc 0 No Calc0 No Calc 0 No Calc0 No Calc 0 No Calc0 No Calc 0 No Calc0 No Calc 0 No Calc0 No Calc 0 No Calc0 No Calc 0 No Calc0 No Calc 0 No Calc0 No Calc 0 No Calc0 No Calc 0 No Calc0 No Calc 0 No Calc0 No Calc 0 No Calc0 No Calc 0 No Calc0 No Calc 0 No Calc0 No Calc 0 No Calc
Package Page 18 AMP Workhour Costs - Proposed
(1) (2) (3) (4) (5) (6) (7) (8) (9) (10) (11) (12)Proposed Proposed Proposed Proposed Proposed Proposed Proposed Proposed Proposed Proposed Proposed ProposedOperation Annual FHP Annual TPH or Annual Productivity Annual Operation Annual FHP Annual TPH or Annual Productivity AnnualNumbers Volume NATPH Volume Workhours (TPH or NATPH) Workhour Costs Numbers Volume NATPH Volume Workhours (TPH or NATPH) Workhour Costs
0 No Calc 0 No Calc0 No Calc 0 No Calc0 No Calc 0 No Calc0 No Calc 0 No Calc0 No Calc 0 No Calc0 No Calc 0 No Calc0 No Calc 0 No Calc0 No Calc 0 No Calc0 No Calc 0 No Calc0 No Calc 0 No Calc0 No Calc 0 No Calc0 No Calc 0 No Calc0 No Calc 0 No Calc0 No Calc 0 No Calc0 No Calc 0 No Calc0 No Calc 0 No Calc0 No Calc 0 No Calc0 No Calc 0 No Calc0 No Calc 0 No Calc0 No Calc 0 No Calc0 No Calc 0 No Calc0 No Calc 0 No Calc0 No Calc 0 No Calc0 No Calc 0 No Calc0 No Calc 0 No Calc0 No Calc 0 No Calc0 No Calc 0 No Calc0 No Calc 0 No Calc0 No Calc 0 No Calc0 No Calc 0 No Calc0 No Calc 0 No Calc0 No Calc 0 No Calc0 No Calc 0 No Calc0 No Calc 0 No Calc0 No Calc 0 No Calc0 No Calc 0 No Calc0 No Calc 0 No Calc0 No Calc 0 No Calc0 No Calc 0 No Calc0 No Calc 0 No Calc0 No Calc 0 No Calc0 No Calc 0 No Calc0 No Calc 0 No Calc0 No Calc 0 No Calc0 No Calc 0 No Calc0 No Calc 0 No Calc0 No Calc 0 No Calc0 No Calc 0 No Calc0 No Calc 0 No Calc0 No Calc 0 No Calc0 No Calc 0 No Calc0 No Calc 0 No Calc0 No Calc 0 No Calc0 No Calc 0 No Calc0 No Calc 0 No Calc
Package Page 19 AMP Workhour Costs - Proposed

(1) (2) (3) (4) (5) (6) (7) (8) (9) (10) (11) (12)Proposed Proposed Proposed Proposed Proposed Proposed Proposed Proposed Proposed Proposed Proposed ProposedOperation Annual FHP Annual TPH or Annual Productivity Annual Operation Annual FHP Annual TPH or Annual Productivity AnnualNumbers Volume NATPH Volume Workhours (TPH or NATPH) Workhour Costs Numbers Volume NATPH Volume Workhours (TPH or NATPH) Workhour Costs
0 No Calc 0 No Calc0 No Calc 0 No Calc0 No Calc 0 No Calc0 No Calc 0 No Calc0 No Calc 0 No Calc0 No Calc 0 No Calc0 No Calc 0 No Calc0 No Calc 0 No Calc0 No Calc 0 No Calc0 No Calc 0 No Calc0 No Calc 0 No Calc0 No Calc 0 No Calc0 No Calc 0 No Calc0 No Calc 0 No Calc0 No Calc 0 No Calc0 No Calc 0 No Calc0 No Calc 0 No Calc0 No Calc 0 No Calc0 No Calc 0 No Calc0 No Calc 0 No Calc0 No Calc 0 No Calc0 No Calc 0 No Calc0 No Calc 0 No Calc0 No Calc 0 No Calc0 No Calc 0 No Calc0 No Calc 0 No Calc0 No Calc 0 No Calc0 No Calc 0 No Calc0 No Calc 0 No Calc0 No Calc 0 No Calc0 No Calc 0 No Calc0 No Calc 0 No Calc0 No Calc 0 No Calc0 No Calc 0 No Calc0 No Calc 0 No Calc0 No Calc 0 No Calc0 No Calc 0 No Calc0 No Calc 0 No Calc0 No Calc 0 No Calc0 No Calc 0 No Calc0 No Calc 0 No Calc
Moved to Gain 0 60,512 5,007 12 $203,119 Impact to Gain 890,310,743 3,294,691,877 697,593 4,723 $32,098,022Impact to Lose 0 0 0 No Calc $0 Moved to Lose 0 0 0 No Calc $0Total Impact 0 60,512 5,007 12 $203,119 Total Impact 890,310,743 3,294,691,877 697,593 4,723 $32,098,022Non Impacted 1,855,293 1,995,124 3,417 584 $147,341 Non Impacted 0 0 8,509 No Calc $330,440
Gain Only 503,293,165 1,137,987,481 759,229 1,499 $32,285,627All 1,855,293 2,055,636 8,424 244 $350,460 All 1,393,603,908 4,432,679,358 1,465,332 3,025 $64,714,089
Package Page 20 AMP Workhour Costs - Proposed
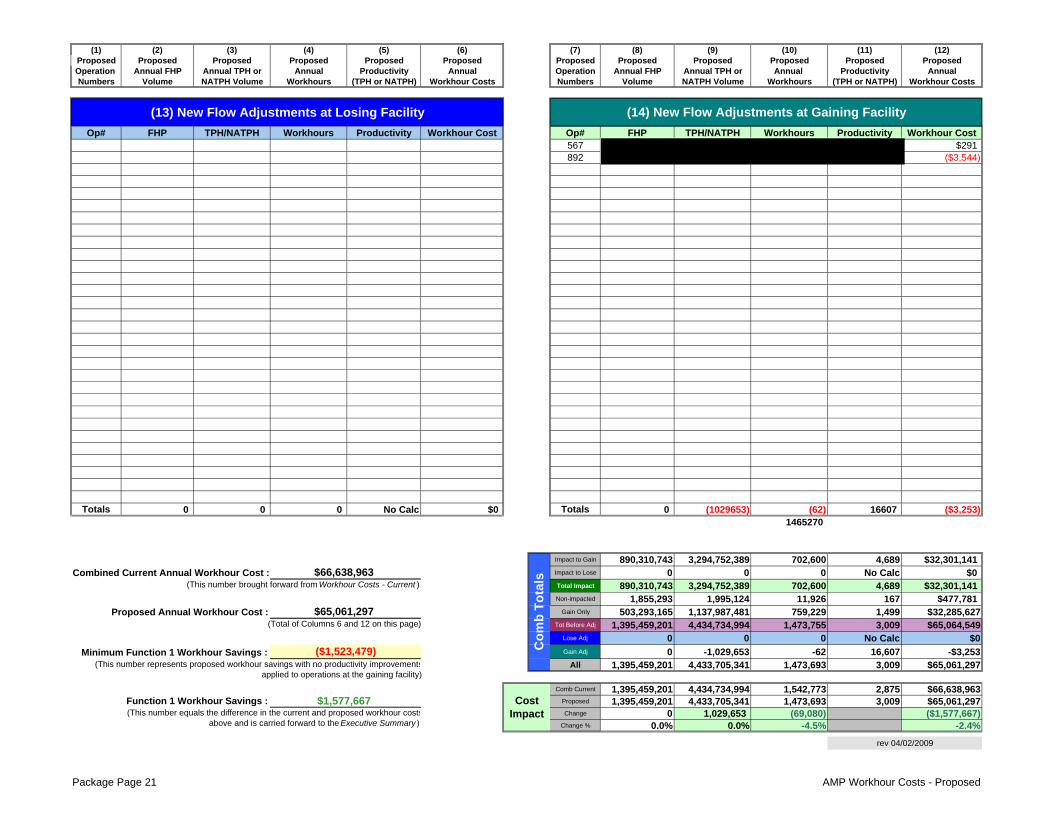
(1) (2) (3) (4) (5) (6) (7) (8) (9) (10) (11) (12)Proposed Proposed Proposed Proposed Proposed Proposed Proposed Proposed Proposed Proposed Proposed ProposedOperation Annual FHP Annual TPH or Annual Productivity Annual Operation Annual FHP Annual TPH or Annual Productivity AnnualNumbers Volume NATPH Volume Workhours (TPH or NATPH) Workhour Costs Numbers Volume NATPH Volume Workhours (TPH or NATPH) Workhour Costs
Op# FHP TPH/NATPH Workhours Productivity Workhour Cost Op# FHP TPH/NATPH Workhours Productivity Workhour Cost1 567 $2912 892 ($3,544)3
4
5
6
7
8
9
10
11
12
13
14
15
16
17
18
19
20
21
22
23
24
25
26
27
28
29
30
Totals 0 0 0 No Calc $0 Totals 0 (1029653) (62) 16607 ($3,253)1465270
Impact to Gain 890,310,743 3,294,752,389 702,600 4,689 $32,301,141Combined Current Annual Workhour Cost : Impact to Lose 0 0 0 No Calc $0
Total Impact 890,310,743 3,294,752,389 702,600 4,689 $32,301,141Non-impacted 1,855,293 1,995,124 11,926 167 $477,781
Gain Only 503,293,165 1,137,987,481 759,229 1,499 $32,285,627Tot Before Adj 1,395,459,201 4,434,734,994 1,473,755 3,009 $65,064,549
Lose Adj 0 0 0 No Calc $0Gain Adj 0 -1,029,653 -62 16,607 -$3,253
All 1,395,459,201 4,433,705,341 1,473,693 3,009 $65,061,297
Comb Current 1,395,459,201 4,434,734,994 1,542,773 2,875 $66,638,963Proposed 1,395,459,201 4,433,705,341 1,473,693 3,009 $65,061,297Change 0 1,029,653 (69,080) ($1,577,667)
Change % 0.0% 0.0% -4.5% -2.4%
rev 04/02/2009
(14) New Flow Adjustments at Gaining Facility(13) New Flow Adjustments at Losing Facility
$66,638,963
Proposed Annual Workhour Cost :(Total of Columns 6 and 12 on this page)
$65,061,297
Com
b To
tals
Cost Impact(This number equals the difference in the current and proposed workhour costs
above and is carried forward to the Executive Summary )
(This number brought forward from Workhour Costs - Current )
Function 1 Workhour Savings : $1,577,667
Minimum Function 1 Workhour Savings : ($1,523,479)(This number represents proposed workhour savings with no productivity improvements
applied to operations at the gaining facility)
Package Page 21 AMP Workhour Costs - Proposed

Last Saved:
to
581 70.0% 30.0% $111,690 \ ] 581 $226,256 TGp 581 $0 581 $307,222582 0.0% 100.0% $1,043 \ ] 582 $172,217 TGp 582 $0 582 $172,217616 0.0% 100.0% $2,211 \ ] 616 $87,194 TGp 616 $0 616 $87,194624 0.0% 100.0% $1,224 \ ] 624 $2,956 TGp 624 $0 624 $2,956634 0.0% 100.0% $151 \ ] 634 $0 TGp 634 $0 634 $0665 0.0% 100.0% $43,881 \ ] 665 $0 TGp 665 $0 665 $0666 0.0% 100.0% $47,428 \ ] 666 $79,787 TGp 666 $0 666 $79,787679 65.0% 35.0% $109,887 \ ] 679 $169,099 TGp 679 $0 679 $248,477745 30.0% 13.0% $241,864 \ ] 745 $783,439 TGp 745 $137,863 745 $855,555750 30.0% 58.0% $2,026,856 \ ] 750 0.0% 29.8% $8,318,540 TGp 750 $243,223 750 $6,458,450751 50.0% 50.0% $113,459 \ ] 751 $0 TGp 751 $0 751 $57,735753 10.0% $532,541 \ ] 753 $2,219,397 TGp 753 $479,287 753 $2,273,829747 $965,689 \ ] 747 $5,421,098 NI 747 $965,689 747 $5,421,098765 $979,494 \ ] 765 $4,474,937 NI 765 $979,494 765 $4,474,937
\ ] 571 $81,867 GO 571 $81,867\ ] 614 $185 GO 614 $185\ ] 615 $87 GO 615 $87\ ] 653 $7,053 GO 653 $7,053\ ] 668 $1,113,429 GO 668 $1,113,429\ ] 691 $120 GO 691 $120\ ] 763 $81,538 GO 763 $81,538\ ] 764 $129,690 GO 764 $129,690\ ] 766 $5,142,260 GO 766 $5,142,260\ ] 900 $373 GO 900 $373\ ]\ ]\ ]\ ]\ ]\ ]\ ]\ ]\ ]\ ]\ ]\ ]\ ]\ ]\ ]\ ]\ ]\ ]\ ]\ ]\ ]\ ]\ ]\ ]\ ]\ ]\ ]\ ]\ ]\ ]\ ]\ ]\ ]\ ]\ ]\ ]
Proposed Other Craft Workhours
Proposed Annual Workhours
Proposed Annual Workhour Cost ($)
Other Workhour Move Analysis
Toledo P&DCLosing Facility: Gaining Facility: Detroit P&DC Date Range of Data: 09/30/1110/01/10
February 18, 2012
Proposed MODS
Operation Number
Proposed Annual Workhours
Current Other Craft Workhours
Current Annual Workhour Cost ($)
Current MODS
Operation Number
Percent Moved to Gaining
(%)
Current Annual Workhours
Current Annual Workhours
Reduction Due to EoS
(%)
Reduction Due to EoS
(%)
Proposed Annual Workhour Cost ($)
Gaining Facility Losing FacilityLosing Facility Gaining FacilityCurrent MODS
Operation Number
Percent Moved to
Losing (%)
Current Annual Workhour Cost ($)
Proposed MODS
Operation Number
Package Page 22 AMP Other Curr vs Prop

\ ]\ ]\ ]\ ]\ ]\ ]\ ]\ ]\ ]\ ]\ ]\ ]\ ]\ ]\ ]\ ]\ ]\ ]\ ]\ ]\ ]\ ]\ ]\ ]\ ]\ ]\ ]\ ]\ ]\ ]\ ]\ ]\ ]\ ]\ ]\ ]\ ]\ ]\ ]\ ]\ ]\ ]\ ]\ ]\ ]\ ]\ ]\ ]\ ]\ ]\ ]\ ]\ ]\ ]\ ]\ ]\ ]\ ]\ ]\ ]\ ]\ ]\ ]\ ]\ ]\ ]\ ]\ ]\ ]\ ]\ ]\ ]\ ]\ ]
Package Page 23 AMP Other Curr vs Prop

\ ]\ ]\ ]\ ]\ ]\ ]\ ]\ ]\ ]\ ]\ ]\ ]\ ]\ ]\ ]\ ]\ ]
69,334 $3,232,236 0 $0 Ops-Red 19,117 $860,372 Ops-Red 0 $00 $0 253,076 $12,058,885 Ops-Inc 0 $0 Ops-Inc 222,722 $10,543,422
46,302 $1,945,182 373,605 $16,452,636 Ops-Stay 46,302 $1,945,182 Ops-Stay 373,605 $16,452,636115,636 $5,177,419 626,680 $28,511,521 AllOps 65,419 $2,805,555 AllOps 596,327 $26,996,058
565 0.0% 100.0% $1,280 \ ] 565 $0 TGp 565 $0 565 $0593 0.0% 100.0% $44,293 \ ] 593 $0 TGp 593 $0 593 $0671 0.0% 100.0% $90,001 \ ] 671 $159,219 TGp 671 $0 671 $159,219679 100.0% 0.0% $53,471 \ ] 679 $107,174 TG 679 $0 679 $162,142698 50.0% 50.0% $229,861 \ ] 698 $1,498,506 TGp 698 $0 698 $1,625,039699 50.0% 50.0% $244,295 \ ] 699 $764,564 TGp 699 $0 699 $899,042700 50.0% 50.0% $216,475 \ ] 700 $685,966 TGp 700 $0 700 $805,130701 50.0% 50.0% $75,118 \ ] 701 $390,544 TGp 701 $0 701 $431,895759 55.0% 45.0% $143,634 \ ] 759 $679,088 TGp 759 $0 759 $760,298920 0.0% 100.0% $11,565 \ ] 920 $0 TGp 920 $0 920 $0927 100.0% 0.0% $10,382 \ ] 927 $532,157 TG 927 $0 927 $543,588928 100.0% 0.0% $11,184 \ ] 928 $331,109 TG 928 $0 928 $343,423933 100.0% 0.0% $63,172 \ ] 933 $379,019 TG 933 $0 933 $438,563951 25.0% 58.0% $437,271 \ ] 951 $2,005,898 TGp 951 $74,336 951 $2,108,937953 0.0% 100.0% $19,924 \ ] 953 $148,773 TGp 953 $0 953 $148,773
\ ] 478 $0 GO 478 $0\ ] 630 $1,053 GO 630 $1,053\ ] 758 $100,642 GO 758 $100,642\ ] 922 $108,939 GO 922 $108,939\ ] 932 $227 GO 932 $227\ ] 952 $34,055 GO 952 $34,055\ ]\ ]\ ]\ ]\ ]\ ]\ ]\ ]\ ]\ ]\ ]\ ]\ ]\ ]\ ]\ ]\ ]\ ]\ ]\ ]\ ]\ ]\ ]
Proposed MODS
Operation Number
Proposed Annual Workhours
Proposed All Supervisory WorkhoursLosing Facility
Current Annual Workhour Cost ($)
Proposed Annual Workhour Cost ($)
Proposed MODS
Operation Number
Proposed Annual Workhours
Proposed Annual Workhour Cost ($)
Current All Supervisory Workhours
Current Annual Workhour Cost ($)
Current Annual Workhours
Current MODS
Operation Number
Losing Facility Gaining Facility
TotalsOps-ReducingOps-Increasing
Ops-StayingAll Operations
Percent (%) Moved to Losing
(%) Reduction
Due to EoS
Percent (%) Moved to Gaining
(%) Reduction
Due to EoS
Current Annual Workhours
TotalsOps-ReducingOps-Increasing
Ops-StayingAll Operations
Gaining FacilityCurrent MODS
Operation Number
Package Page 24 AMP Other Curr vs Prop

\ ]\ ]\ ]\ ]\ ]\ ]\ ]\ ]\ ]\ ]\ ]\ ]\ ]\ ]\ ]\ ]\ ]\ ]\ ]\ ]\ ]\ ]\ ]\ ]\ ]\ ]\ ]\ ]\ ]\ ]\ ]\ ]\ ]\ ]\ ]\ ]\ ]\ ]\ ]\ ]\ ]\ ]\ ]\ ]\ ]\ ]\ ]\ ]\ ]\ ]\ ]\ ]\ ]\ ]\ ]\ ]\ ]\ ]\ ]\ ]\ ]\ ]\ ]\ ]\ ]\ ]\ ]\ ]\ ]\ ]\ ]\ ]\ ]\ ]
Package Page 25 AMP Other Curr vs Prop

\ ]\ ]\ ]\ ]\ ]\ ]\ ]\ ]\ ]\ ]\ ]\ ]\ ]
30,965 $1,651,927 0 $0 Ops-Red 1,322 $74,336 Ops-Red 0 $00 $0 141,063 $7,682,017 Ops-Inc 0 $0 Ops-Inc 154,804 $8,426,0480 $0 3,967 $244,916 Ops-Stay 0 $0 Ops-Stay 3,967 $244,916
30,965 $1,651,927 145,030 $7,926,933 AllOps 1,322 $74,336 AllOps 158,771 $8,670,965
781 100.0% 100.0% $69,452 \ ] 781 $397,699 TG 781 ($69,452) 781 $527,777783 100.0% 100.0% $64,191 \ ] 783 $108,539 TG 783 ($64,191) 783 $173,807785 100.0% 100.0% $256 \ ] 785 $0 TG 785 ($256) 785 $256784 $4,542 \ ] 784 $0 NI 784 $4,542 784 $170
\ ] 780 $2,847 GO 780 $2,847\ ] 789 $122 GO 789 $122\ ]\ ]\ ]\ ]\ ]\ ]
5,222 $133,899 0 $0 Ops-Red (5,222) ($133,899) Ops-Red 0 $00 $0 13,700 $506,239 Ops-Inc 0 $0 Ops-Inc 18,922 $701,840
120 $4,542 86 $2,969 Ops-Stay 120 $4,542 Ops-Stay 86 $3,1395,342 $138,441 13,786 $509,208 AllOps (5,102) ($129,357) AllOps 19,008 $704,979
31 $109,887 31 $380,414 31 $0 31 $459,79232 $0 32 $0 32 $0 32 $033 $0 33 $0 33 $0 33 $034 $979,494 34 $9,617,383 34 $979,494 34 $9,617,38393 $0 93 $122 93 $0 93 $122Totals 26,422 $1,089,381 Totals 226,259 $9,997,918 Totals 23,743 $979,494 Totals 228,000 $10,077,296
$109,887 $298,789 $0 $378,167$979,494 $9,617,197 $979,494 $9,617,197
Proposed Annual Workhours
Proposed Annual Workhour Cost ($)
Transportation - PVS
LDC Proposed Annual Workhours LDC
Proposed MODS
Operation Number
Proposed Annual Workhours
Ops 765, 766 (34)
Proposed Annual Workhour Cost ($)
Transportation - PVS
Proposed Annual Workhour Cost ($)
Proposed MODS
Operation Number
Proposed Annual Workhours
Proposed Annual Workhour Cost ($)
TotalsOps-ReducingOps-Increasing
Ops-StayingAll Operations
(%) Reduction
Due to EoS
Current Annual Workhours
Current Annual Workhour Cost ($)
Transportation - PVS
TotalsOps-ReducingOps-Increasing
Ops-Staying
Ops-Reducing
Percent (%) Moved to Gaining
Losing Facility
Ops 617, 679, 764 (31)Subset for Trans-PVS
Tab
Losing Facility
Losing Facility Gaining Facility
Totals Ops-IncreasingOps-Staying
Totals
Ops 765, 766 (34)
Ops-Reducing
All Operations
Current Workhours for LDCs Common to & Shared between Supv & Craft Proposed Workhours for LDCs Common to & Shared between Supv & Craft
Current MODS
Operation Number
Gaining Facility
Gaining Facility
Ops 617, 679, 764 (31)Ops 765, 766 (34)
Ops 617, 679, 764 (31)
All Operations
Percent (%) Moved to Losing
Gaining Facility Losing Facility
Current Annual Workhour Cost ($)
LDC Current Annual Workhours
Current Annual Workhour Cost
($)
Current MODS
Operation Number
(%) Reduction
Due to EoS
Grouped Subtotals for Transportation, Maintenance, Supervision & Flow Adjustments, along with Facility and Combined Summaries
Ops-IncreasingOps-Staying
All Operations
Current Annual Workhours
Subset for Trans-PVS
TabOps 617, 679, 764 (31)
Transportation - PVS
LDC Current Annual Workhours
Current Annual Workhour Cost
($)
Ops 765, 766 (34)
Package Page 26 AMP Other Curr vs Prop

36 $2,140,315 36 $8,318,540 36 $243,223 36 $6,516,18537 $532,541 37 $2,219,397 37 $479,287 37 $2,273,82938 $965,689 38 $5,421,098 38 $965,689 38 $5,421,09839 $245,451 39 $873,589 39 $137,863 39 $945,70693 $64,191 93 $108,539 93 ($64,191) 93 $173,807Totals 86,331 $3,948,186 Totals 366,906 $16,941,164 Totals 40,066 $1,761,870 Totals 334,783 $15,330,625
01 $55,858 01 $108,939 01 $0 01 $108,93910 $788,597 10 $4,204,127 10 $0 10 $4,649,39820 $0 20 $0 20 $0 20 $030 $197,105 30 $886,903 30 $0 30 $1,023,08235 $520,366 35 $2,567,746 35 $74,336 35 $2,730,32840 $0 40 $0 40 $0 40 $050 $0 50 $0 50 $0 50 $060 $0 60 $0 60 $0 60 $070 $0 70 $0 70 $0 70 $080 $90,001 80 $159,219 80 $0 80 $159,21981 $0 81 $0 81 $0 81 $088 $0 88 $0 88 $0 88 $0Totals 30,965 $1,651,927 Totals $7,926,933 Totals 1,322 $74,336 Totals $8,670,965
Annual Workhours Annual Dollars Annual Workhours Annual Dollars Annual Workhours Annual Dollars % Change Dollars Change Percent Change
42,482 $1,966,953 0 $0 39,627 $1,843,876 -6.7% ($123,077) -6.3%250,884 $11,005,367 0 $0 249,946 $10,974,858 -0.4% ($30,509) -0.3%453,237 $20,889,350 0 $0 374,849 $17,092,495 -17.3% ($3,796,854) -18.2%175,995 $9,578,861 0 $0 160,093 $8,745,301 -9.0% ($833,560) -8.7%
14,842 $474,918 0 $0 11,230 $466,006 -24.3% ($8,912) -1.9%937,439 $43,915,449 0 $0 835,744 $39,122,536 -10.8% ($4,792,913) -10.9%
LDC LDCChk >>> Chk >>>Chk >>> Chk >>>Chk >>> Chk >>> Before 151,943 $6,967,787 Before 785,496 $36,947,662Chk >>> Chk >>> After 61,639 $2,750,534 After 774,105 $36,372,002Chk >>> Chk >>> Adj 0 $0 Adj 0 $0Chk >>> Chk >>> AfterTot 61,639 $2,750,534 AfterTot 774,105 $36,372,002Chk >>> Chk >>> Change (90,305) ($4,217,253) Change (11,390) ($575,660)Chk >>> Chk >>> % Diff -59.4% -60.5% % Diff -1.5% -1.6%Chk >>> Chk >>>Chk >>> Chk >>>Chk >>> Chk >>>Chk >>> Chk >>>
Total Adj 0 $0 Total Adj 0 $0 Before 937,439 $43,915,449After 835,744 $39,122,536
Adj 0 $0AfterTot 835,744 $39,122,536Change (101,695) ($4,792,913)% Diff -10.8% -10.9%
Supervisory
LDC Proposed Annual Workhours
Proposed Annual Workhour Cost ($)
Proposed Annual Workhour Cost ($)LDC LDCCurrent Annual
Workhours
Current Annual Workhour Cost
($)
Maintenance
Proposed Annual Workhour Cost
($)
Special Adjustments at Gaining Site
Maintenance
Current Annual Workhour Cost
($)
Summary by Sub-GroupSpecial Adjustments -
Combined -
Gaining Facility SummaryProposed Annual Workhour Cost
($)
Proposed MODS
Operation Number
Combined Summary
Proposed Annual Workhours
Proposed Annual Workhour Cost
($)
Proposed Annual Workhour Cost
($)
Proposed Annual Workhours
Proposed MODS
Operation Number
Proposed Annual Workhours
LDC
Proposed Annual Workhours
Losing Facility Summary
Current Annual Workhours
Maintenance
Proposed Annual Workhour Cost ($)
Proposed Annual WorkhoursLDCProposed Annual
Workhours
Maintenance
Supervisor Summary Supervisor Summary
LDC Current Annual Workhours
Current Annual Workhour Cost
($)LDC Current Annual
Workhours
Current Annual Workhour Cost
($)
Supervisory
LDC Proposed Annual Workhours
Proposed Annual Workhour Cost ($)
Summary by FacilitySpecial Adjustments at Losing Site
(3,612)Supv/Craft Joint Ops (note 4)Total (101,695)
(938)(78,388)(15,902)
Maintenance Ops (note 3)Transportation Ops (note 2)
ChangeProposed + Special Adjustments - Combined -Current - Combined
Workhour Change
(2,855)
4) less Ops going to 'Maintenance' Tabs
'Other Craft' Ops (note 1)
Notes:1) less Ops going to 'Trans-PVS' & 'Maintenance' Tabs
2) going to Trans-PVS tab3) going to Maintenance tab
Supervisory Ops
Package Page 27 AMP Other Curr vs Prop
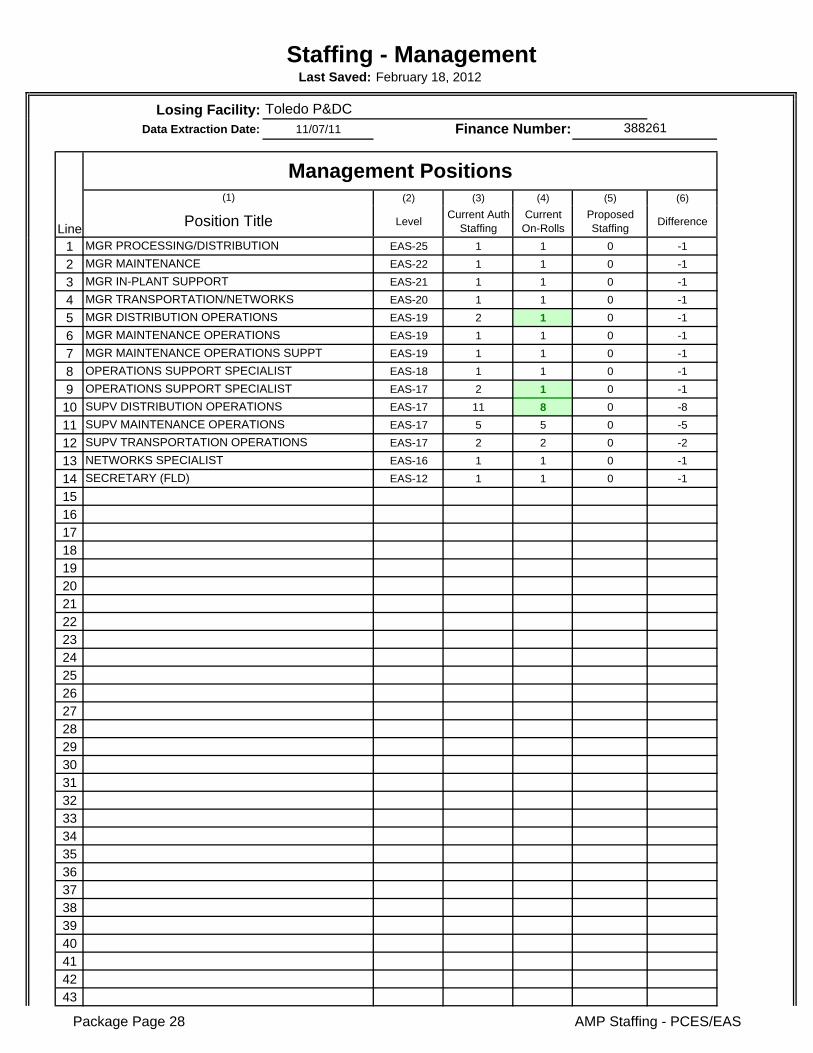
Last Saved:
Losing Facility:Data Extraction Date: 11/07/11
(2) (3) (4) (5) (6)
Level Current Auth Staffing
Current On-Rolls
Proposed Staffing Difference
1 EAS-25 1 1 0 -1
2 EAS-22 1 1 0 -1
3 EAS-21 1 1 0 -1
4 EAS-20 1 1 0 -1
5 EAS-19 2 1 0 -1
6 EAS-19 1 1 0 -1
7 EAS-19 1 1 0 -1
8 EAS-18 1 1 0 -1
9 EAS-17 2 1 0 -1
10 EAS-17 11 8 0 -8
11 EAS-17 5 5 0 -5
12 EAS-17 2 2 0 -2
13 EAS-16 1 1 0 -1
14 EAS-12 1 1 0 -1
1516171819202122232425262728293031323334353637383940414243
Finance Number:
MGR MAINTENANCEMGR IN-PLANT SUPPORTMGR TRANSPORTATION/NETWORKSMGR DISTRIBUTION OPERATIONSMGR MAINTENANCE OPERATIONSMGR MAINTENANCE OPERATIONS SUPPT
SECRETARY (FLD)
Management Positions
OPERATIONS SUPPORT SPECIALISTOPERATIONS SUPPORT SPECIALISTSUPV DISTRIBUTION OPERATIONSSUPV MAINTENANCE OPERATIONS
Line
(1)
Position TitleMGR PROCESSING/DISTRIBUTION
Staffing - Management
388261
February 18, 2012
Toledo P&DC
SUPV TRANSPORTATION OPERATIONSNETWORKS SPECIALIST
Package Page 28 AMP Staffing - PCES/EAS

444546474849505152535455565758596061626364656667686970717273747576777879
31 26 0 (26)
Retirement Eligibles: 5 Position Loss: 26
Totals
Package Page 29 AMP Staffing - PCES/EAS

Gaining Facility:Data Extraction Date: 11/08/11
(13) (14) (15) (16) (17)
Level Current Auth Staffing
Current On-Rolls
Proposed Staffing Difference
1 PCES-01 1 1 1 0
2 EAS-25 1 0 1 1
3 EAS-25 1 1 1 0
4 EAS-25 1 0 1 1
5 EAS-24 2 1 1 0
6 EAS-23 3 3 3 0
7 EAS-23 1 1 1 0
8 EAS-22 2 1 2 1
9 EAS-22 1 1 1 0
10 EAS-21 2 2 2 0
11 EAS-20 1 1 1 0
12 EAS-20 1 1 1 0
13 EAS-20 1 1 1 0
14 EAS-19 1 1 1 0
15 EAS-19 3 3 3 0
16 EAS-19 1 1 1 0
17 EAS-19 1 0 1 1
18 EAS-18 1 1 1 0
19 EAS-18 3 3 3 0
20 EAS-17 6 3 6 3
21 EAS-17 35 34 35 1
22 EAS-17 12 11 12 1
23 EAS-17 1 0 1 1
24 EAS-17 8 5 6 1
25 EAS-16 1 1 1 0
26 EAS-12 1 1 1 0
2728293031323334353637383940414243444546
SECRETARY (FLD)
SUPV MAINTENANCE OPERATIONSSUPV MAINTENANCE OPERATIONS SUPPORSUPV TRANSPORTATION OPERATIONSNETWORKS SPECIALIST
NETWORKS SPECIALISTOPERATIONS SUPPORT SPECIALISTOPERATIONS SUPPORT SPECIALISTSUPV DISTRIBUTION OPERATIONS
MAINTENANCE ENGINEERING SPECIALISTMGR DISTRIBUTION OPERATIONSMGR FIELD MAINT OPRNS (LEAD)MGR PVS OPERATIONS
OPERATIONS INDUSTRIAL ENGINEER (FIMGR MAINT ENGINEERING SUPPORTMGR MAINTENANCE OPERATIONS SUPPTOPERATIONS SUPPORT SPECIALIST
MGR MAINTENANCE OPERATIONSMGR TRANSPORTATION/NETWORKSMGR DISTRIBUTION OPERATIONSOPERATIONS INDUSTRIAL ENGINEER (FI
MGR IN-PLANT SUPPORTMGR MAINTENANCE (LEAD)SR MGR DISTRIBUTION OPERATIONSMGR DISTRIBUTION OPERATIONS
SR PLANT MANAGER (1)Line Position Title
(12)
Management Positions
Finance Number: 252492Detroit P&DC
Package Page 30 AMP Staffing - PCES/EAS
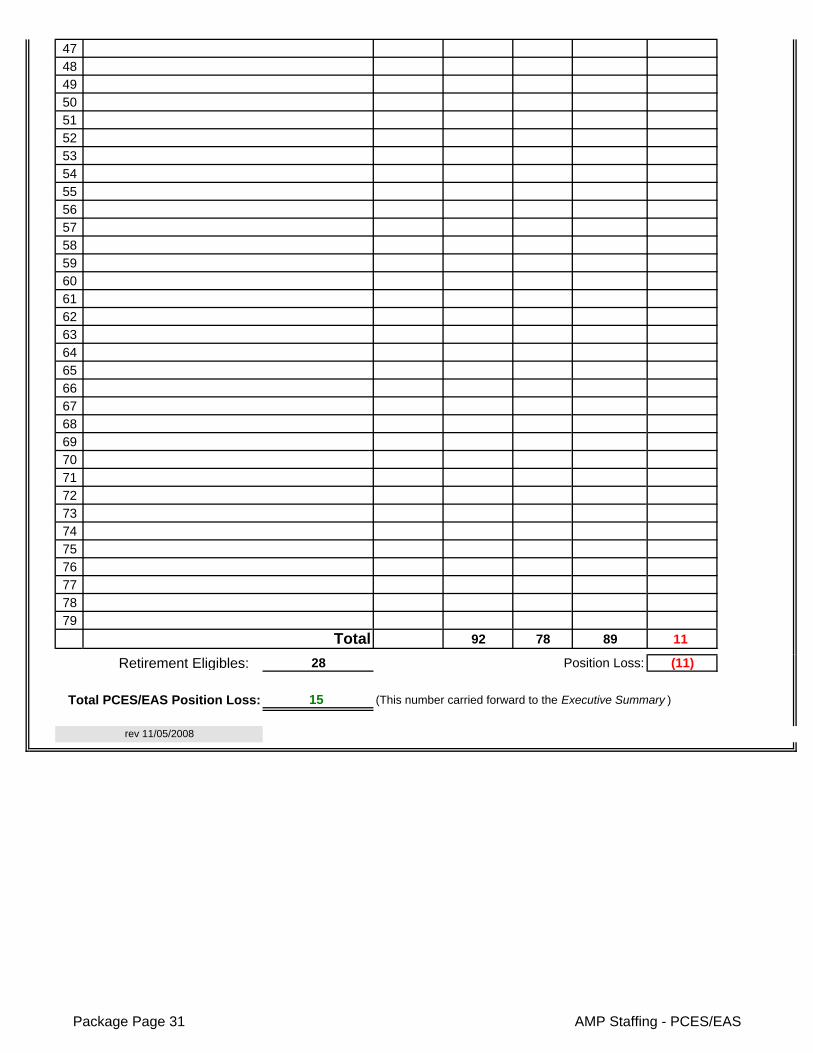
474849505152535455565758596061626364656667686970717273747576777879
92 78 89 11
Retirement Eligibles: 28 Position Loss: (11)
15
Total
rev 11/05/2008
Total PCES/EAS Position Loss: (This number carried forward to the Executive Summary )
Package Page 31 AMP Staffing - PCES/EAS
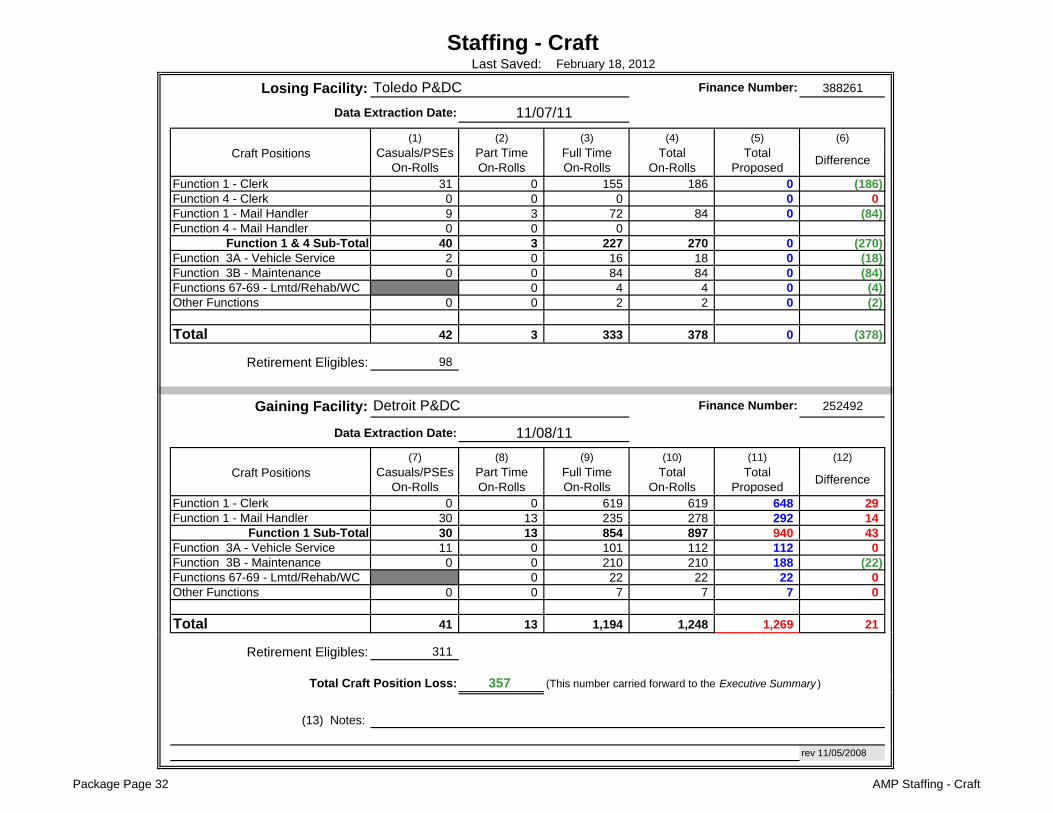
Losing Facility: 388261
(1) (2) (3) (4) (5) (6)Craft Positions
Function 1 - Clerk 31 0 155 186 0 (186)Function 4 - Clerk 0 0 0 0 0Function 1 - Mail Handler 9 3 72 84 0 (84)Function 4 - Mail Handler 0 0 0
Function 1 & 4 Sub-Total 40 3 227 270 0 (270)Function 3A - Vehicle Service 2 0 16 18 0 (18)Function 3B - Maintenance 0 0 84 84 0 (84)Functions 67-69 - Lmtd/Rehab/WC 0 4 4 0 (4)Other Functions 0 0 2 2 0 (2)
Total 42 3 333 378 0 (378)
Retirement Eligibles: 98
Gaining Facility: 252492
(7) (8) (9) (10) (11) (12)Craft Positions
Function 1 - Clerk 0 0 619 619 648 29Function 1 - Mail Handler 30 13 235 278 292 14
Function 1 Sub-Total 30 13 854 897 940 43Function 3A - Vehicle Service 11 0 101 112 112 0Function 3B - Maintenance 0 0 210 210 188 (22)Functions 67-69 - Lmtd/Rehab/WC 0 22 22 22 0Other Functions 0 0 7 7 7 0
Total 41 13 1,194 1,248 1,269 21
Retirement Eligibles: 311
357
(13) Notes:
rev 11/05/2008
Total On-Rolls
(This number carried forward to the Executive Summary )
Casuals/PSEs On-Rolls
Data Extraction Date:
Toledo P&DC
Part Time On-Rolls
Full Time On-Rolls
Staffing - Craft
Difference
Difference
Last Saved: February 18, 2012
Data Extraction Date: 11/07/11
Casuals/PSEs On-Rolls
11/08/11
Total Proposed
Finance Number:
Detroit P&DC Finance Number:
Total Craft Position Loss:
Total Proposed
Part Time On-Rolls
Full Time On-Rolls
Total On-Rolls
Package Page 32 AMP Staffing - Craft
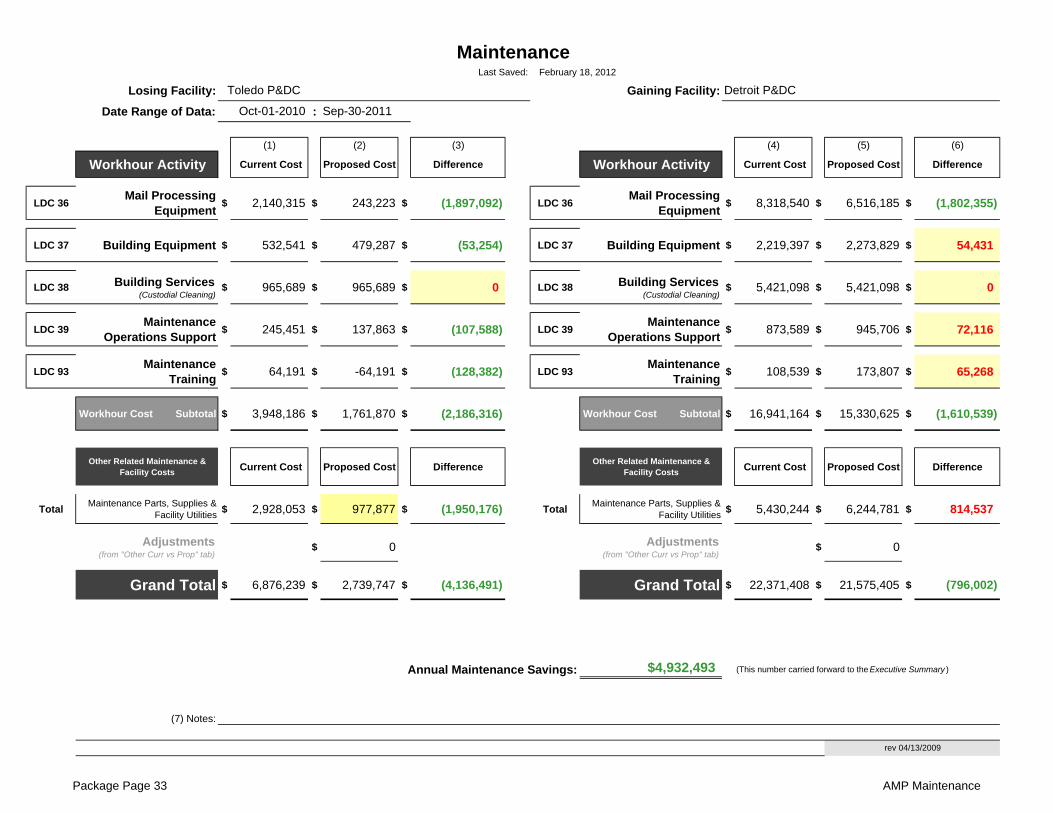
Losing Facility: Gaining Facility:
Date Range of Data: :
(1) (2) (3) (4) (5) (6)
Workhour Activity Current Cost Proposed Cost Difference Workhour Activity Current Cost Proposed Cost Difference
LDC 36 Mail Processing Equipment $ 2,140,315 $ 243,223 $ (1,897,092) LDC 36 Mail Processing
Equipment $ 8,318,540 $ 6,516,185 $ (1,802,355)
LDC 37 Building Equipment $ 532,541 $ 479,287 $ (53,254) LDC 37 Building Equipment $ 2,219,397 $ 2,273,829 $ 54,431
LDC 38 Building Services (Custodial Cleaning)
$ 965,689 $ 965,689 $ 0 LDC 38 Building Services (Custodial Cleaning)
$ 5,421,098 $ 5,421,098 $ 0
LDC 39 Maintenance Operations Support $ 245,451 $ 137,863 $ (107,588) LDC 39 Maintenance
Operations Support $ 873,589 $ 945,706 $ 72,116
LDC 93 Maintenance Training $ 64,191 $ -64,191 $ (128,382) LDC 93 Maintenance
Training $ 108,539 $ 173,807 $ 65,268
Workhour Cost Subtotal $ 3,948,186 $ 1,761,870 $ (2,186,316) Workhour Cost Subtotal $ 16,941,164 $ 15,330,625 $ (1,610,539)
Other Related Maintenance & Facility Costs Current Cost Proposed Cost Difference Other Related Maintenance &
Facility Costs Current Cost Proposed Cost Difference
Total Maintenance Parts, Supplies & Facility Utilities $ 2,928,053 $ 977,877 $ (1,950,176) Total Maintenance Parts, Supplies &
Facility Utilities $ 5,430,244 $ 6,244,781 $ 814,537
Adjustments (from "Other Curr vs Prop" tab)
$ 0 Adjustments (from "Other Curr vs Prop" tab)
$ 0
Grand Total $ 6,876,239 $ 2,739,747 $ (4,136,491) Grand Total $ 22,371,408 $ 21,575,405 $ (796,002)
$4,932,493 (This number carried forward to the Executive Summary )
(7) Notes:
Annual Maintenance Savings:
rev 04/13/2009
MaintenanceLast Saved:
Toledo P&DC Detroit P&DCFebruary 18, 2012
Oct-01-2010 Sep-30-2011
Package Page 33 AMP Maintenance

Losing Facility: Gaining Facility:Finance Number: Finance Number:
Date Range of Data: 10/01/10 -- to -- 09/30/11
(1) (2) (3) (4) (5) (6)Current Proposed Difference Current Proposed Difference
PVS Owned Equipment PVS Owned EquipmentSeven Ton Trucks 7 7 0 Seven Ton Trucks 17 17Eleven Ton Trucks 7 7 0 Eleven Ton Trucks 15 15Single Axle Tractors 0 Single Axle Tractors 7 7Tandem Axle Tractors 0 Tandem Axle Tractors 31 31Spotters 0 Spotters 4 4
PVS Transportation PVS TransportationTotal Number of Schedules 36 36 0 Total Number of Schedules 115 115Total Annual Mileage 325,048 325,048 0 Total Annual Mileage 1,770,042 1,770,042
Total Mileage Costs $403,059 $403,059 $0 Total Mileage Costs $1,858,544 $1,858,544
PVS Leases PVS LeasesTotal Vehicles Leased 0 Total Vehicles Leased 0
Total Lease Costs $0 Total Lease Costs $0
PVS Workhour Costs PVS Workhour CostsLDC 31 (617, 679, 764) $109,887 $0 $109,887 LDC 31 (617, 679, 764) $298,789 $378,167 ($79,378)LDC 34 (765, 766) $979,494 $979,494 $0 LDC 34 (765, 766) $9,617,197 $9,617,197 $0
Adjustments (from "Other Curr vs Prop" tab)
$0 Adjustments (from "Other Curr vs Prop" tab)
$0
Total Workhour Costs $1,089,381 $979,494 $109,887 Total Workhour Costs $9,915,986 $9,995,365 ($79,378)
PVS Transportation Savings (Losing Facility): $109,887 PVS Transportation Savings (Gaining Facility): $1,779,166
$1,889,053
(7) Notes:
Transportation - PVS
Toledo P&DC Detroit P&DC
Last Saved: February 18, 2012
Total PVS Transportation Savings:
388261 252492
<<== (This number is summed with Total from 'Trans-HCR' and carried forward to the Executive Summary as Transportation Savings )
rev 04/13/2009
Package Page 34 AMP Transportation - PVS
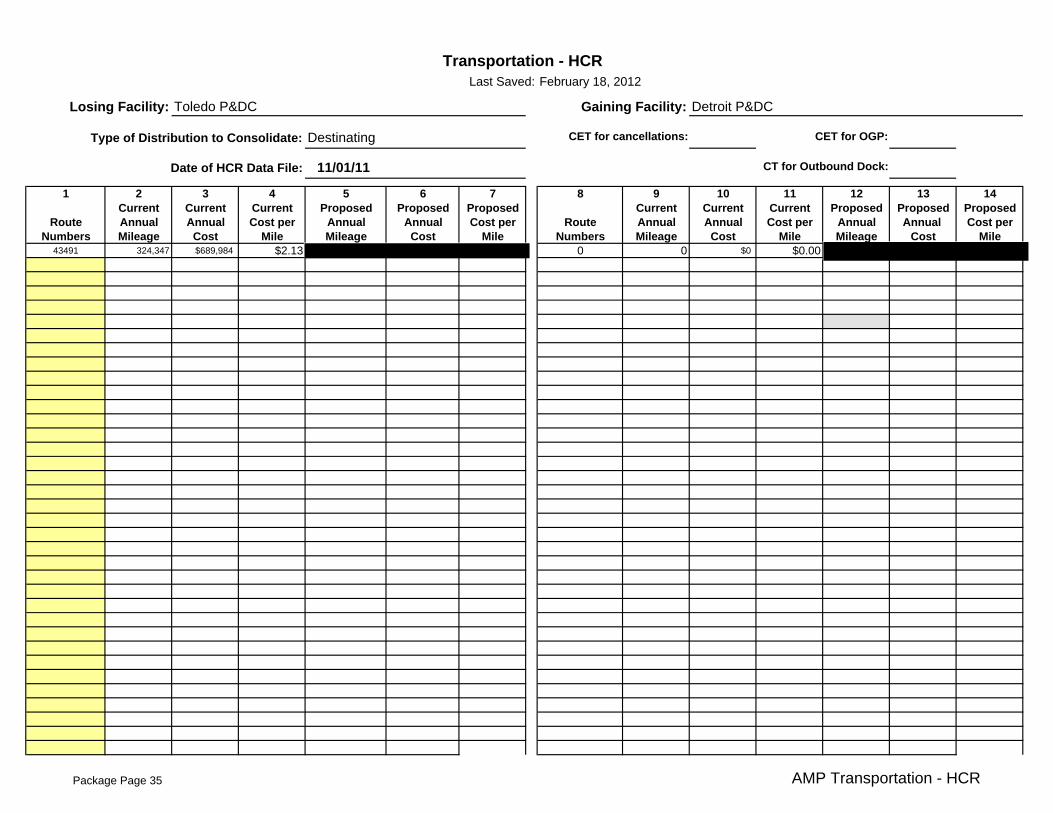
1 2 3 4 5 6 7 8 9 10 11 12 13 14Current Current Current Proposed Proposed Proposed Current Current Current Proposed Proposed Proposed
Route Annual Annual Cost per Annual Annual Cost per Route Annual Annual Cost per Annual Annual Cost perNumbers Mileage Cost Mile Mileage Cost Mile Numbers Mileage Cost Mile Mileage Cost Mile
43491 324,347 $689,984 $2.13 0 0 $0 $0.00
Transportation - HCR
Destinating
11/01/11
CET for OGP:
CT for Outbound Dock:
Type of Distribution to Consolidate:
Date of HCR Data File:
CET for cancellations:
Last Saved: February 18, 2012
Losing Facility: Toledo P&DC Detroit P&DCGaining Facility:
Package Page 35 AMP Transportation - HCR

1 2 3 4 5 6 7 8 9 10 11 12 13 14Current Current Current Proposed Proposed Proposed Current Current Current Proposed Proposed Proposed
Route Annual Annual Cost per Annual Annual Cost per Route Annual Annual Cost per Annual Annual Cost perNumbers Mileage Cost Mile Mileage Cost Mile Numbers Mileage Cost Mile Mileage Cost Mile
Package Page 36 AMP Transportation - HCR

1 2 3 4 5 6 7 8 9 10 11 12 13 14Current Current Current Proposed Proposed Proposed Current Current Current Proposed Proposed Proposed
Route Annual Annual Cost per Annual Annual Cost per Route Annual Annual Cost per Annual Annual Cost perNumbers Mileage Cost Mile Mileage Cost Mile Numbers Mileage Cost Mile Mileage Cost Mile
($1,604,445) ($504,816)
Total HCR Transportation Savings:
Other Changes
(+/-)
114,999 214,887
Moving to Gain (-)
Proposed Trip
Impacts
Current Losing Proposed ResultTrips from
Gaining
Other Changes
(+/-)
HCR Annual Savings (Losing Facility): HCR Annual Savings (Gaining Facility):
Proposed Trip Impacts
114,999 0 0 0 0
rev 11/05/2008
Current Gaining
($2,109,261)
214,8870
Proposed ResultTrips from Losing
0
Moving to Lose (-)
<<== (This number is summed with Total from 'Trans-PVS' and carried forward to the Executive Summary as Transportation Savings )
Package Page 37 AMP Transportation - HCR
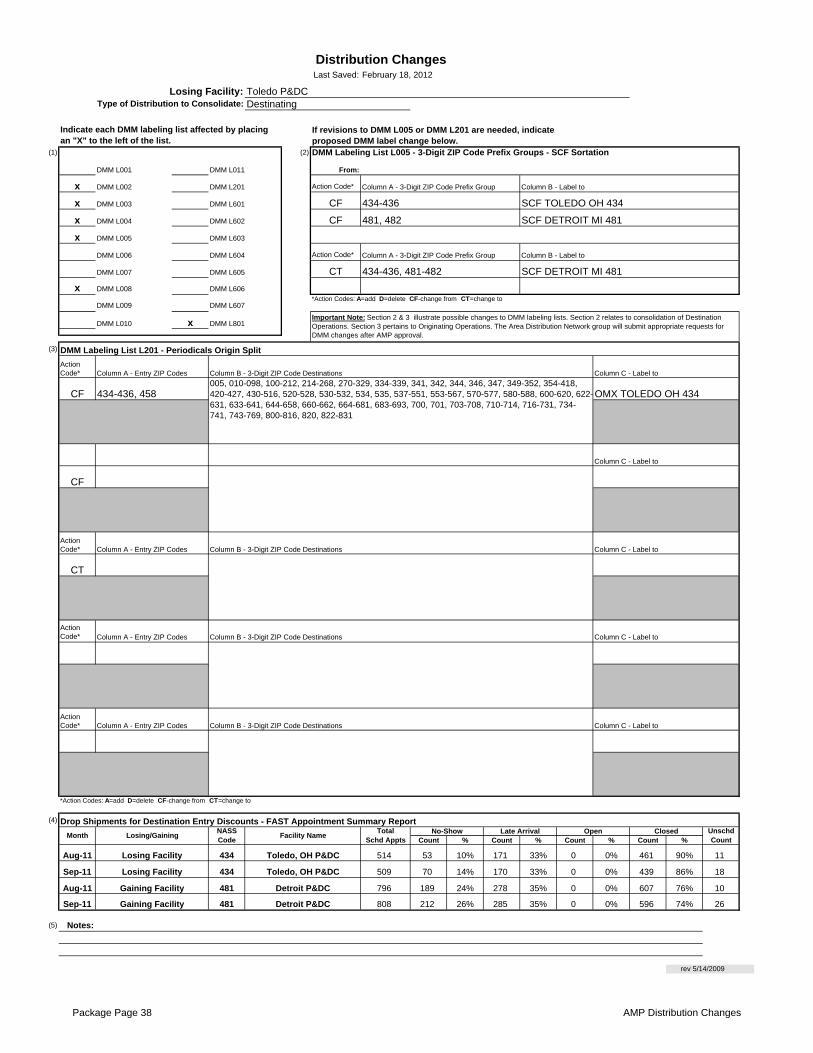
Destinating
(1) (2)
DMM L011 From:
x DMM L201 Action Code* Column A - 3-Digit ZIP Code Prefix Group
x DMM L601 CF
x DMM L602 CF
x DMM L603
DMM L604 Action Code* Column A - 3-Digit ZIP Code Prefix Group
DMM L605 CTx DMM L606
DMM L607
x DMM L801
(3)
Action Code*
CF
CF
Action Code*
CT
Action Code*
Action Code*
(4)
Count % Count % Count % Count %
Aug-11 434 514 53 10% 171 33% 0 0% 461 90% 11
Sep-11 434 509 70 14% 170 33% 0 0% 439 86% 18
Aug-11 481 796 189 24% 278 35% 0 0% 607 76% 10
Sep-11 481 808 212 26% 285 35% 0 0% 596 74% 26
(5) Notes:
Column A - Entry ZIP Codes Column B - 3-Digit ZIP Code Destinations Column C - Label to
434-436, 458005, 010-098, 100-212, 214-268, 270-329, 334-339, 341, 342, 344, 346, 347, 349-352, 354-418, 420-427, 430-516, 520-528, 530-532, 534, 535, 537-551, 553-567, 570-577, 580-588, 600-620, 622-631, 633-641, 644-658, 660-662, 664-681, 683-693, 700, 701, 703-708, 710-714, 716-731, 734-741, 743-769, 800-816, 820, 822-831
OMX TOLEDO OH 434
Column C - Label to
DMM Labeling List L201 - Periodicals Origin Split
Column A - Entry ZIP Codes Column B - 3-Digit ZIP Code Destinations Column C - Label to
Gaining Facility Detroit P&DC
Gaining Facility Detroit P&DC
Unschd Count
Losing Facility Toledo, OH P&DC
Losing Facility Toledo, OH P&DC
No-Show Late Arrival Open Closed
*Action Codes: A=add D=delete CF-change from CT=change to
Column B - Label to
rev 5/14/2009
Drop Shipments for Destination Entry Discounts - FAST Appointment Summary ReportMonth Losing/Gaining NASS
Code Facility Name Total Schd Appts
DMM Labeling List L005 - 3-Digit ZIP Code Prefix Groups - SCF Sortation
434-436
Column B - Label to
SCF TOLEDO OH 434
Distribution Changes
Indicate each DMM labeling list affected by placing an "X" to the left of the list.
Losing Facility:Type of Distribution to Consolidate:
If revisions to DMM L005 or DMM L201 are needed, indicate proposed DMM label change below.
Last Saved: February 18, 2012
Toledo P&DC
DMM L003
DMM L004 SCF DETROIT MI 481
DMM L001
DMM L002
481, 482
SCF DETROIT MI 481
DMM L009
DMM L010
DMM L005
DMM L006
DMM L007
DMM L008
434-436, 481-482
Column C - Label to
*Action Codes: A=add D=delete CF-change from CT=change to
Important Note: Section 2 & 3 illustrate possible changes to DMM labeling lists. Section 2 relates to consolidation of Destination Operations. Section 3 pertains to Originating Operations. The Area Distribution Network group will submit appropriate requests for DMM changes after AMP approval.
Column A - Entry ZIP Codes Column B - 3-Digit ZIP Code Destinations Column C - Label to
Column A - Entry ZIP Codes Column B - 3-Digit ZIP Code Destinations
Package Page 38 AMP Distribution Changes
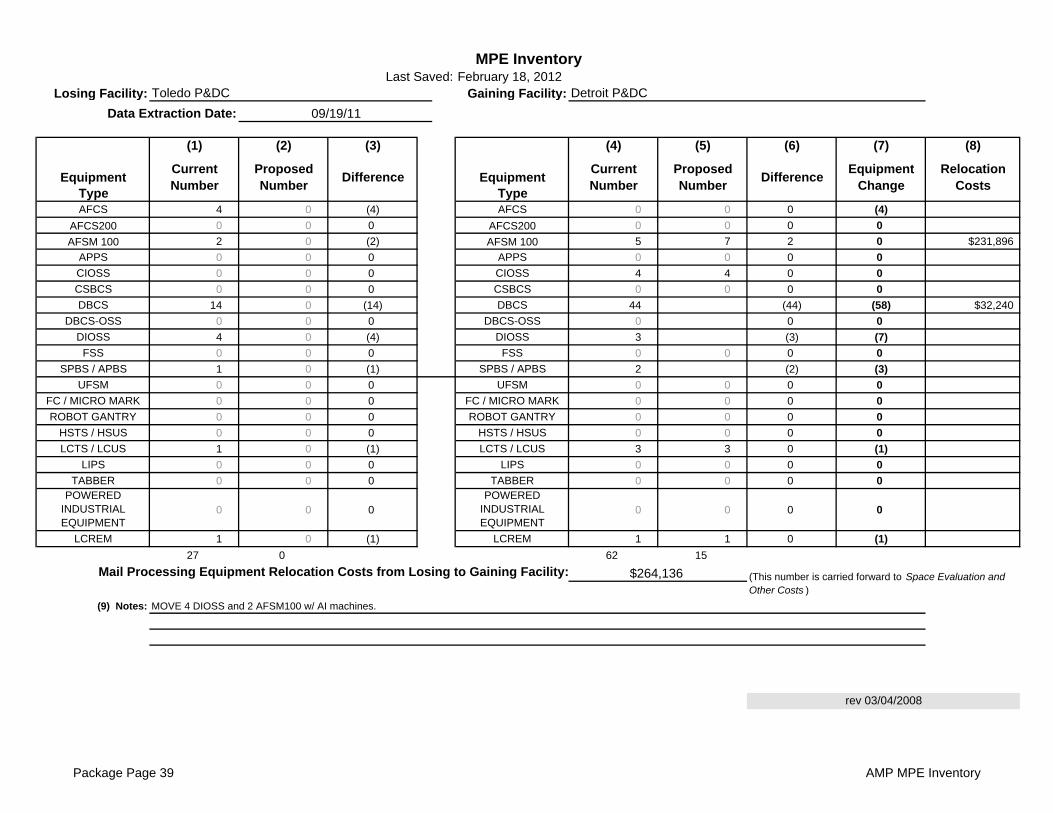
Losing Facility: Gaining Facility:
(1) (2) (3) (4) (5) (6) (7) (8)
Equipment EquipmentType TypeAFCS 4 0 (4) AFCS 0 0 0 (4)
AFCS200 0 0 0 AFCS200 0 0 0 0AFSM 100 2 0 (2) AFSM 100 5 7 2 0 $231,896
APPS 0 0 0 APPS 0 0 0 0CIOSS 0 0 0 CIOSS 4 4 0 0CSBCS 0 0 0 CSBCS 0 0 0 0DBCS 14 0 (14) DBCS 44 (44) (58) $32,240
DBCS-OSS 0 0 0 DBCS-OSS 0 0 0DIOSS 4 0 (4) DIOSS 3 (3) (7)
FSS 0 0 0 FSS 0 0 0 0SPBS / APBS 1 0 (1) SPBS / APBS 2 (2) (3)
UFSM 0 0 0 UFSM 0 0 0 0FC / MICRO MARK 0 0 0 FC / MICRO MARK 0 0 0 0ROBOT GANTRY 0 0 0 ROBOT GANTRY 0 0 0 0
HSTS / HSUS 0 0 0 HSTS / HSUS 0 0 0 0LCTS / LCUS 1 0 (1) LCTS / LCUS 3 3 0 (1)
LIPS 0 0 0 LIPS 0 0 0 0TABBER 0 0 0 TABBER 0 0 0 0
POWERED INDUSTRIAL EQUIPMENT
0 0 0POWERED
INDUSTRIAL EQUIPMENT
0 0 0 0
LCREM 1 0 (1) LCREM 1 1 0 (1)27 0 62 15
(9) Notes:
Data Extraction Date:
Proposed Number
February 18, 2012MPE Inventory
MOVE 4 DIOSS and 2 AFSM100 w/ AI machines.
Toledo P&DC Detroit P&DC
Current Number Difference Equipment
ChangeRelocation
Costs
Last Saved:
Current Number
rev 03/04/2008
(This number is carried forward to Space Evaluation and Other Costs )
Proposed NumberDifference
Mail Processing Equipment Relocation Costs from Losing to Gaining Facility: $264,136
09/19/11
Package Page 39 AMP MPE Inventory
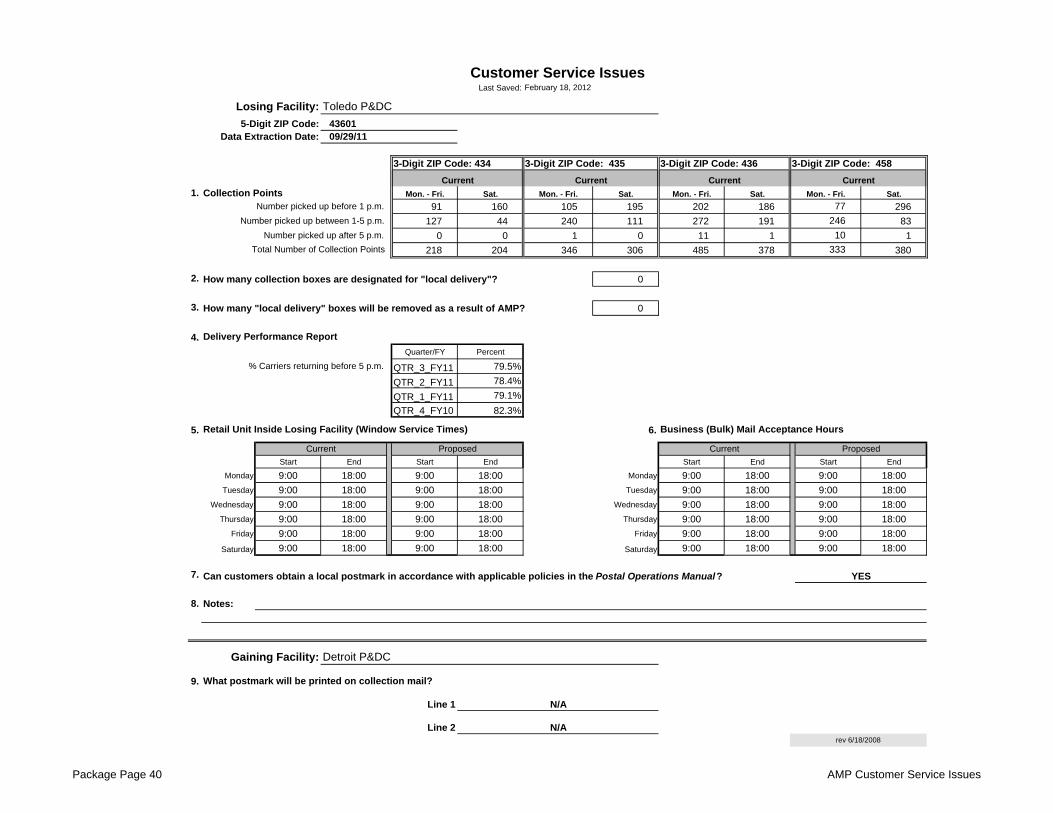
Last Saved:
3-Digit ZIP Code: 435 3-Digit ZIP Code: 436
1. Collection Points Mon. - Fri. Sat. Mon. - Fri. Sat. Mon. - Fri. Sat. Sat.91 160 105 195 202 186 296
127 44 240 111 272 191 830 0 1 0 11 1 1
218 204 346 306 485 378 380
2. How many collection boxes are designated for "local delivery"? 0
3. How many "local delivery" boxes will be removed as a result of AMP? 0
4.Quarter/FY Percent
QTR_3_FY11 79.5%QTR_2_FY11 78.4%QTR_1_FY11 79.1%QTR_4_FY10 82.3%
5. 6.
Start End Start End Start End Start End
Monday 9:00 18:00 9:00 18:00 Monday 9:00 18:00 9:00 18:00Tuesday 9:00 18:00 9:00 18:00 Tuesday 9:00 18:00 9:00 18:00
Wednesday 9:00 18:00 9:00 18:00 Wednesday 9:00 18:00 9:00 18:00Thursday 9:00 18:00 9:00 18:00 Thursday 9:00 18:00 9:00 18:00
Friday 9:00 18:00 9:00 18:00 Friday 9:00 18:00 9:00 18:00Saturday 9:00 18:00 9:00 18:00 Saturday 9:00 18:00 9:00 18:00
7.
8. Notes:
9.
Line 1
Line 2
Number picked up before 1 p.m.
Business (Bulk) Mail Acceptance Hours
Detroit P&DC
YES
333
24610
Losing Facility:5-Digit ZIP Code:
Data Extraction Date:
3-Digit ZIP Code: 434
Mon. - Fri.77
Customer Service Issues
Current Proposed
Number picked up after 5 p.m. Number picked up between 1-5 p.m.
Total Number of Collection Points
Delivery Performance Report
Retail Unit Inside Losing Facility (Window Service Times)
3-Digit ZIP Code: 458Current
rev 6/18/2008
43601
Can customers obtain a local postmark in accordance with applicable policies in the Postal Operations Manual?
Gaining Facility:
What postmark will be printed on collection mail?
Proposed
% Carriers returning before 5 p.m.
N/A
February 18, 2012
Toledo P&DC
09/29/11
Current CurrentCurrent
Current
N/A
Package Page 40 AMP Customer Service Issues

Last Saved:
1.
2. Lease Information. (If not leased skip to 3 below.)
3.
4. Planned use for acquired space from approved AMP
5. Facility Costs
(This number shown below under One-Time Costs section.
6. Savings Information
(This number carried forward to the Executive Summary )
7. Notes
(This number carried forward to Executive Summary )
10/01/10 :
(3) (6)
$32.09 $32.09$32.66 $32.66
$173.05 $173.05$36.86 $36.86$31.38 $31.38APPS Wichita, KS
Wichita, KS PARS Redirects Wichita, KSPARS Redirects
Total One-Time Costs:
Remote Encoding Center Cost per 1000
Current Cost per 1,000 Images
FlatsPARS COA
FlatsLetters
PARS COA
(5)
Product Associated REC
(4)
Wichita, KSWichita, KS
Enter annual lease cost:
Enter the total interior square footage of the facility:Enter gained square footage expected with the AMP:
Enter lease options/terms:
Current Square Footage
Enter lease expiration date:
(from above)
260,909121,800
$50,000Enter any projected one-time facility costs:
Letters
Gaining Facility:
Current Cost per 1,000 Images
Losing Facility:
(1)
Product
(2)
Wichita, KS
Associated REC
Mail Processing Equipment Relocation Costs: (from MPE Inventory )
Space Savings ($):
One-Time Costs
Employee Relocation Costs:
$264,136
Space Evaluation and Other Costs
Street Address:City, State ZIP:
Losing Facility:
Space Evaluation
Affected FacilityFacility Name:
February 18, 2012
Toledo P&DC
Toledo P & DC
rev 9/24/2008
Toledo P&DC Detroit P&DC
09/30/11YTD Range of Report:
Wichita, KS
APPS Wichita, KS
Wichita, KSWichita, KS
$50,000
$314,136
435 South Saint Clair StreetToledo OH 43601
$0
Facility Costs:
Package Page 41 AMP Space Evaluation and Other Costs
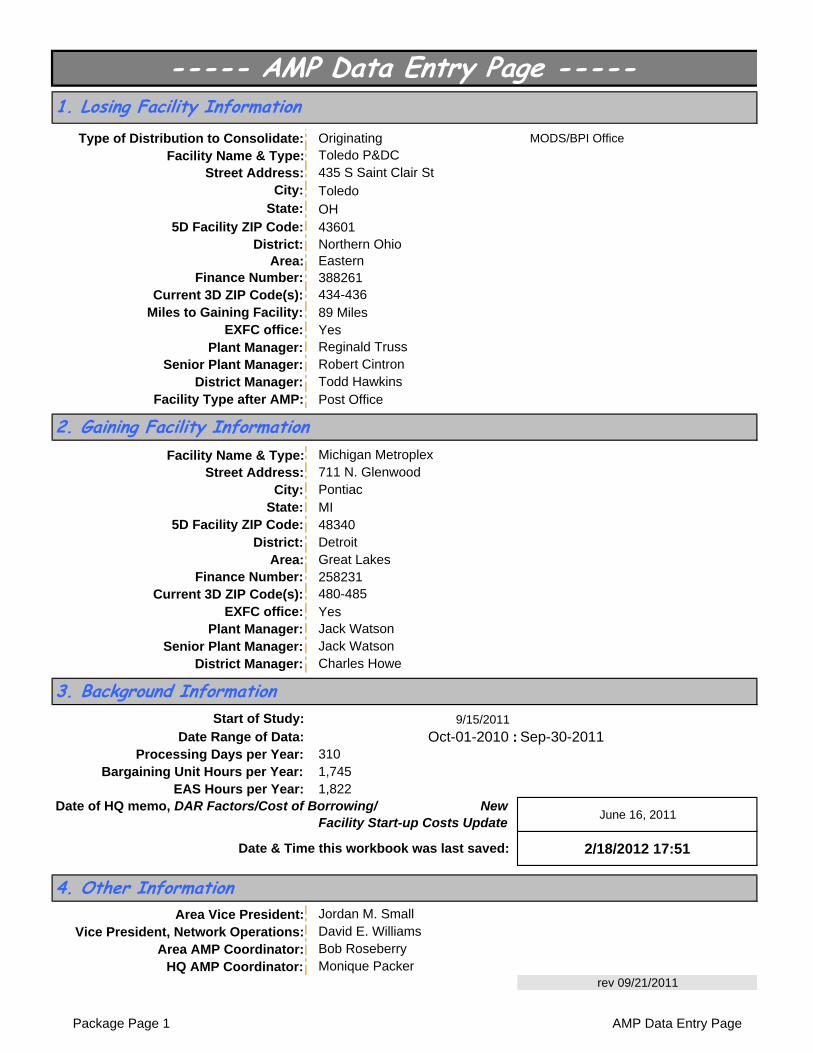
Type of Distribution to Consolidate: Originating MODS/BPI OfficeFacility Name & Type:
Street Address:City: Toledo
State: OH5D Facility ZIP Code: 43601
District: Northern OhioArea: Eastern
Finance Number: 388261Current 3D ZIP Code(s):
Miles to Gaining Facility: 89 MilesEXFC office: Yes
Plant Manager:Senior Plant Manager:
District Manager:Facility Type after AMP: Post Office
Facility Name & Type:Street Address:
City:State: MI
5D Facility ZIP Code: 48340District: Detroit
Area: Great LakesFinance Number: 258231
Current 3D ZIP Code(s):EXFC office: Yes
Plant Manager:Senior Plant Manager:
District Manager:
Start of Study: 9/15/2011Date Range of Data: Oct-01-2010 : Sep-30-2011
Processing Days per Year: 310Bargaining Unit Hours per Year: 1,745
EAS Hours per Year: 1,822
June 16, 2011
2/18/2012 17:51
Area Vice President:Vice President, Network Operations:
Area AMP Coordinator:HQ AMP Coordinator:
rev 09/21/2011
Bob Roseberry
Date & Time this workbook was last saved:
3. Background Information
Date of HQ memo, DAR Factors/Cost of Borrowing/ New Facility Start-up Costs Update
4. Other Information
Robert Cintron
Pontiac
480-485
2. Gaining Facility Information
Monique Packer
434-436
Jack WatsonCharles Howe
Jordan M. SmallDavid E. Williams
Todd Hawkins
Michigan Metroplex711 N. Glenwood
Jack Watson
Toledo P&DC435 S Saint Clair St
Reginald Truss
1. Losing Facility Information
----- AMP Data Entry Page -----
Package Page 1 AMP Data Entry Page

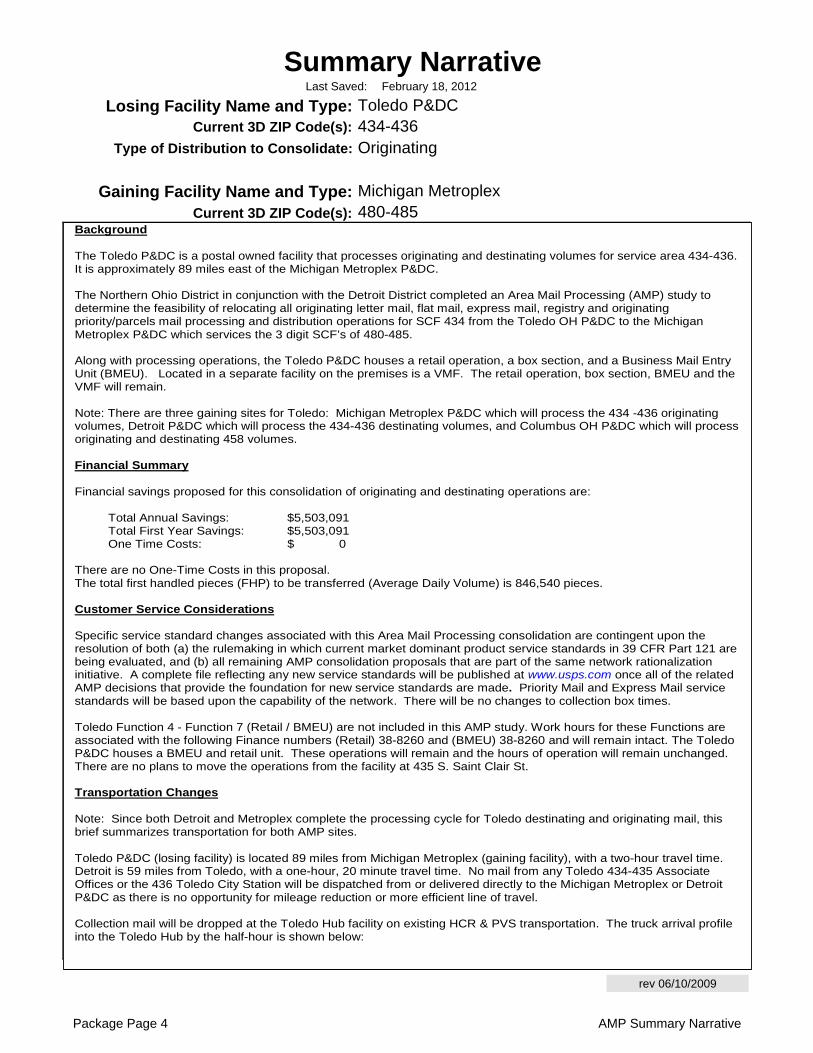
Losing Facility Name and Type:Current 3D ZIP Code(s):
Type of Distribution to Consolidate:
Gaining Facility Name and Type:Current 3D ZIP Code(s):
rev 06/10/2009
Summary NarrativeLast Saved:
Toledo P&DC
Michigan Metroplex
434-436
February 18, 2012
480-485
Originating
Background The Toledo P&DC is a postal owned facility that processes originating and destinating volumes for service area 434-436. It is approximately 89 miles east of the Michigan Metroplex P&DC. The Northern Ohio District in conjunction with the Detroit District completed an Area Mail Processing (AMP) study to determine the feasibility of relocating all originating letter mail, flat mail, express mail, registry and originating priority/parcels mail processing and distribution operations for SCF 434 from the Toledo OH P&DC to the Michigan Metroplex P&DC which services the 3 digit SCF’s of 480-485. Along with processing operations, the Toledo P&DC houses a retail operation, a box section, and a Business Mail Entry Unit (BMEU). Located in a separate facility on the premises is a VMF. The retail operation, box section, BMEU and the VMF will remain. Note: There are three gaining sites for Toledo: Michigan Metroplex P&DC which will process the 434 -436 originating volumes, Detroit P&DC which will process the 434-436 destinating volumes, and Columbus OH P&DC which will process originating and destinating 458 volumes. Financial Summary Financial savings proposed for this consolidation of originating and destinating operations are: Total Annual Savings: $5,503,091 Total First Year Savings: $5,503,091 One Time Costs: $ 0 There are no One-Time Costs in this proposal. The total first handled pieces (FHP) to be transferred (Average Daily Volume) is 846,540 pieces. Customer Service Considerations Specific service standard changes associated with this Area Mail Processing consolidation are contingent upon the resolution of both (a) the rulemaking in which current market dominant product service standards in 39 CFR Part 121 are being evaluated, and (b) all remaining AMP consolidation proposals that are part of the same network rationalization initiative. A complete file reflecting any new service standards will be published at www.usps.com once all of the related AMP decisions that provide the foundation for new service standards are made. Priority Mail and Express Mail service standards will be based upon the capability of the network. There will be no changes to collection box times. Toledo Function 4 - Function 7 (Retail / BMEU) are not included in this AMP study. Work hours for these Functions are associated with the following Finance numbers (Retail) 38-8260 and (BMEU) 38-8260 and will remain intact. The Toledo P&DC houses a BMEU and retail unit. These operations will remain and the hours of operation will remain unchanged. There are no plans to move the operations from the facility at 435 S. Saint Clair St. Transportation Changes Note: Since both Detroit and Metroplex complete the processing cycle for Toledo destinating and originating mail, this brief summarizes transportation for both AMP sites. Toledo P&DC (losing facility) is located 89 miles from Michigan Metroplex (gaining facility), with a two-hour travel time. Detroit is 59 miles from Toledo, with a one-hour, 20 minute travel time. No mail from any Toledo 434-435 Associate Offices or the 436 Toledo City Station will be dispatched from or delivered directly to the Michigan Metroplex or Detroit P&DC as there is no opportunity for mileage reduction or more efficient line of travel. Collection mail will be dropped at the Toledo Hub facility on existing HCR & PVS transportation. The truck arrival profile into the Toledo Hub by the half-hour is shown below:
Package Page 4 AMP Summary Narrative

Summary Narrative (continued)
Summary Narrative Page 2
PVS HCR
Between the times of:
Number of trips
Number of trips
1500 1529 2 - 1530 1559 1 - 1600 1629 - 2 1630 1659 2 2 1700 1729 4 6 1730 1759 - - 1800 1829 3 6 1830 1859 3 8 1900 1929 - 13 1930 1959 - 3 2000 2029 - 3
Number of collection trips arriving in half-hour intervals
2030 2100 - 1
The following dispatches will take collection mail from the Toledo Hub to the Michigan Metroplex P&DC:
LV Toledo Hub Arrive Metroplex
P&DC 1830 2030 1945 2145 2100 2300
DPS and processed mail will be dispatched from the Metroplex & Detroit P&DC to the Toledo Hub on HCR 43491 on six round trips that will be added to both impacted GLA facilities with the AMP start-up:
LV Metroplex Arrive Toledo Hub LV Detroit P&DC Arrive Toledo Hub 0001 200 300 420 230 430 400 520 430 630 500 620
Mail for the Toledo 435-435 Area Offices & 436 Toledo Stations will be dispatched from the Toledo Hub in the following half-hour intervals on existing highway contract & Postal Vehicle Service transportation
PVS HCR TRIPS Description Between the time of: Number of trips Number
of trips
000 29 - - 030 59 - -
100 129 2 - 130 159 - - 200 229 1 2 230 259 1 5 300 329 4 5 330 359 1 4
Pre-DOV's for SCF & City
400 429 1 3
430 459 5 3
CET for 434-435 DOV
500 529 5 5 530 559 - 13 600 629 11 3 630 659 - - 700 729 - -
Number of Associate
Offices & City dispatches
departing in half hour intervals
CET for 436 DOV
730 759 11 - 900 929 9 4 Express
434, 435, 436
930 959 - -
Package Page 5 AMP Summary Narrative
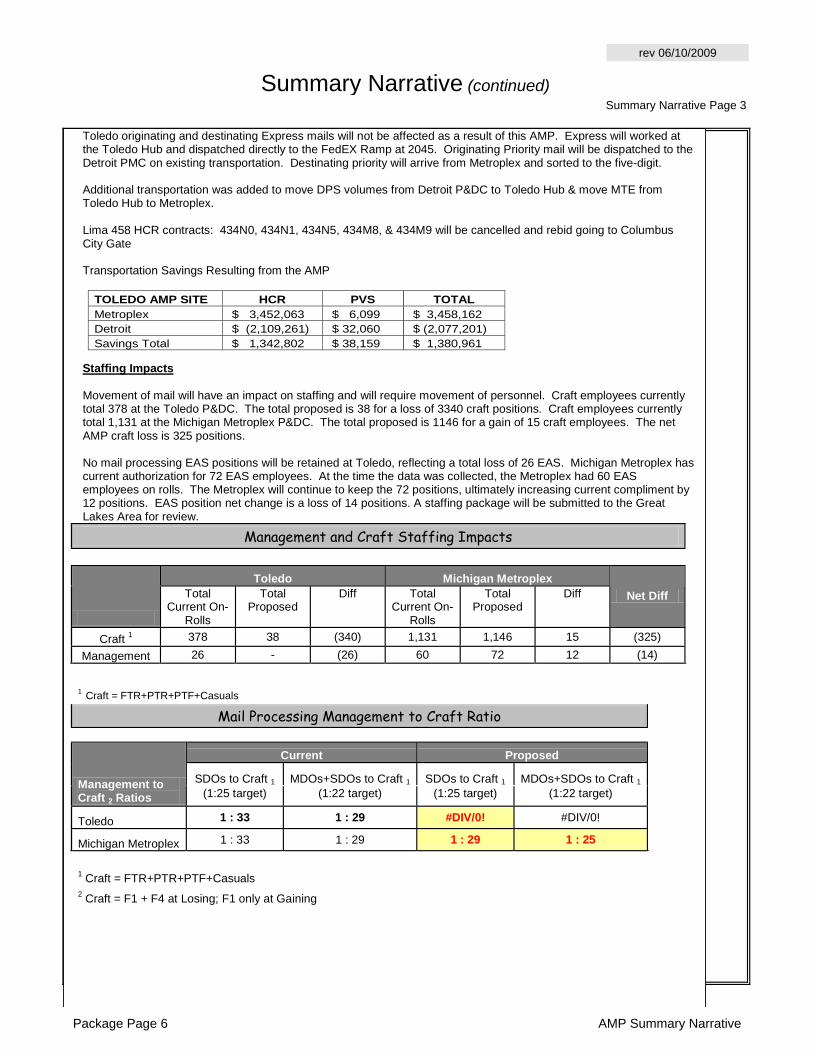
rev 06/10/2009
Summary Narrative Page 3Summary Narrative (continued)
Toledo originating and destinating Express mails will not be affected as a result of this AMP. Express will worked at the Toledo Hub and dispatched directly to the FedEX Ramp at 2045. Originating Priority mail will be dispatched to the Detroit PMC on existing transportation. Destinating priority will arrive from Metroplex and sorted to the five-digit. Additional transportation was added to move DPS volumes from Detroit P&DC to Toledo Hub & move MTE from Toledo Hub to Metroplex. Lima 458 HCR contracts: 434N0, 434N1, 434N5, 434M8, & 434M9 will be cancelled and rebid going to Columbus City Gate Transportation Savings Resulting from the AMP
TOLEDO AMP SITE HCR PVS TOTAL Metroplex $ 3,452,063 $ 6,099 $ 3,458,162 Detroit $ (2,109,261) $ 32,060 $ (2,077,201) Savings Total $ 1,342,802 $ 38,159 $ 1,380,961
Staffing Impacts Movement of mail will have an impact on staffing and will require movement of personnel. Craft employees currently total 378 at the Toledo P&DC. The total proposed is 38 for a loss of 3340 craft positions. Craft employees currently total 1,131 at the Michigan Metroplex P&DC. The total proposed is 1146 for a gain of 15 craft employees. The net AMP craft loss is 325 positions. No mail processing EAS positions will be retained at Toledo, reflecting a total loss of 26 EAS. Michigan Metroplex has current authorization for 72 EAS employees. At the time the data was collected, the Metroplex had 60 EAS employees on rolls. The Metroplex will continue to keep the 72 positions, ultimately increasing current compliment by 12 positions. EAS position net change is a loss of 14 positions. A staffing package will be submitted to the Great Lakes Area for review.
Management and Craft Staffing Impacts
Toledo Michigan Metroplex
Total Current On-
Rolls
Total Proposed
Diff Total Current On-
Rolls
Total Proposed
Diff Net Diff
Craft 1 378 38 (340) 1,131 1,146 15 (325) Management 26 - (26) 60 72 12 (14)
1 Craft = FTR+PTR+PTF+Casuals
Mail Processing Management to Craft Ratio
Current Proposed
SDOs to Craft 1 MDOs+SDOs to Craft 1 SDOs to Craft 1 MDOs+SDOs to Craft 1 Management to Craft 2 Ratios (1:25 target) (1:22 target) (1:25 target) (1:22 target)
Toledo 1 : 33 1 : 29 #DIV/0! #DIV/0!
Michigan Metroplex 1 : 33 1 : 29 1 : 29 1 : 25 1 Craft = FTR+PTR+PTF+Casuals 2 Craft = F1 + F4 at Losing; F1 only at Gaining
Package Page 6 AMP Summary Narrative
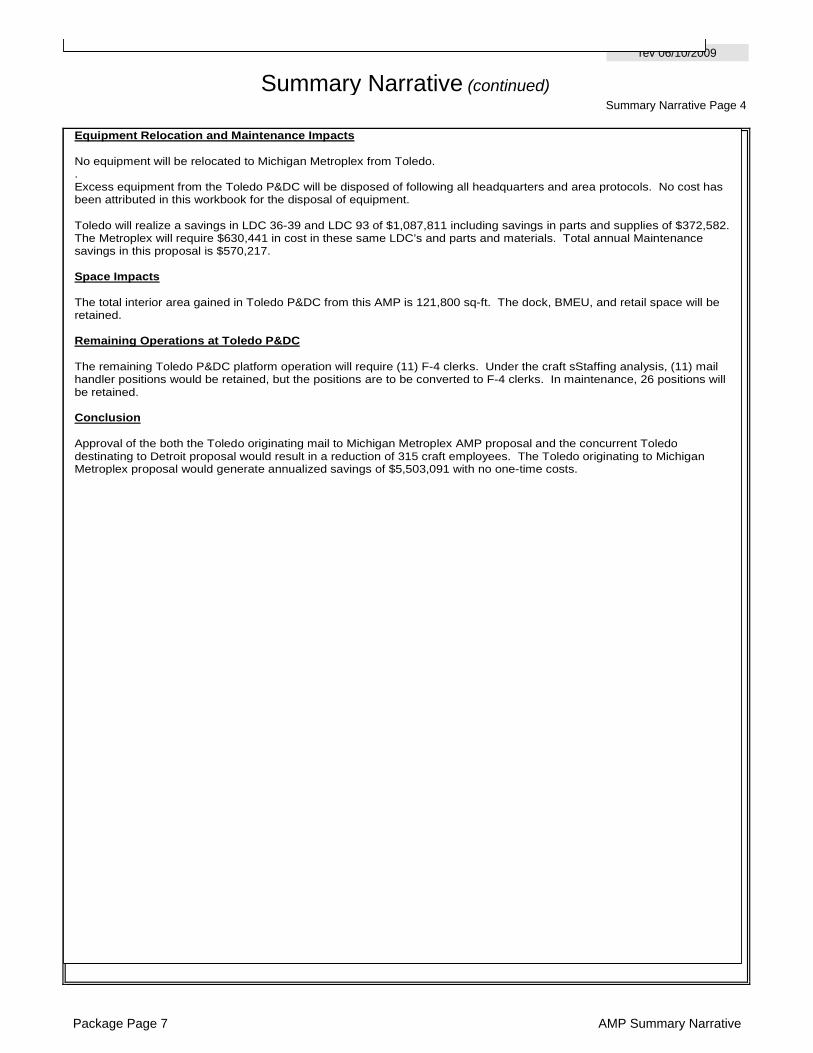
rev 06/10/2009
Summary Narrative (continued)Summary Narrative Page 4
Equipment Relocation and Maintenance Impacts No equipment will be relocated to Michigan Metroplex from Toledo. . Excess equipment from the Toledo P&DC will be disposed of following all headquarters and area protocols. No cost has been attributed in this workbook for the disposal of equipment. Toledo will realize a savings in LDC 36-39 and LDC 93 of $1,087,811 including savings in parts and supplies of $372,582. The Metroplex will require $630,441 in cost in these same LDC’s and parts and materials. Total annual Maintenance savings in this proposal is $570,217. Space Impacts The total interior area gained in Toledo P&DC from this AMP is 121,800 sq-ft. The dock, BMEU, and retail space will be retained. Remaining Operations at Toledo P&DC The remaining Toledo P&DC platform operation will require (11) F-4 clerks. Under the craft sStaffing analysis, (11) mail handler positions would be retained, but the positions are to be converted to F-4 clerks. In maintenance, 26 positions will be retained. Conclusion Approval of the both the Toledo originating mail to Michigan Metroplex AMP proposal and the concurrent Toledo destinating to Detroit proposal would result in a reduction of 315 craft employees. The Toledo originating to Michigan Metroplex proposal would generate annualized savings of $5,503,091 with no one-time costs.
Package Page 7 AMP Summary Narrative
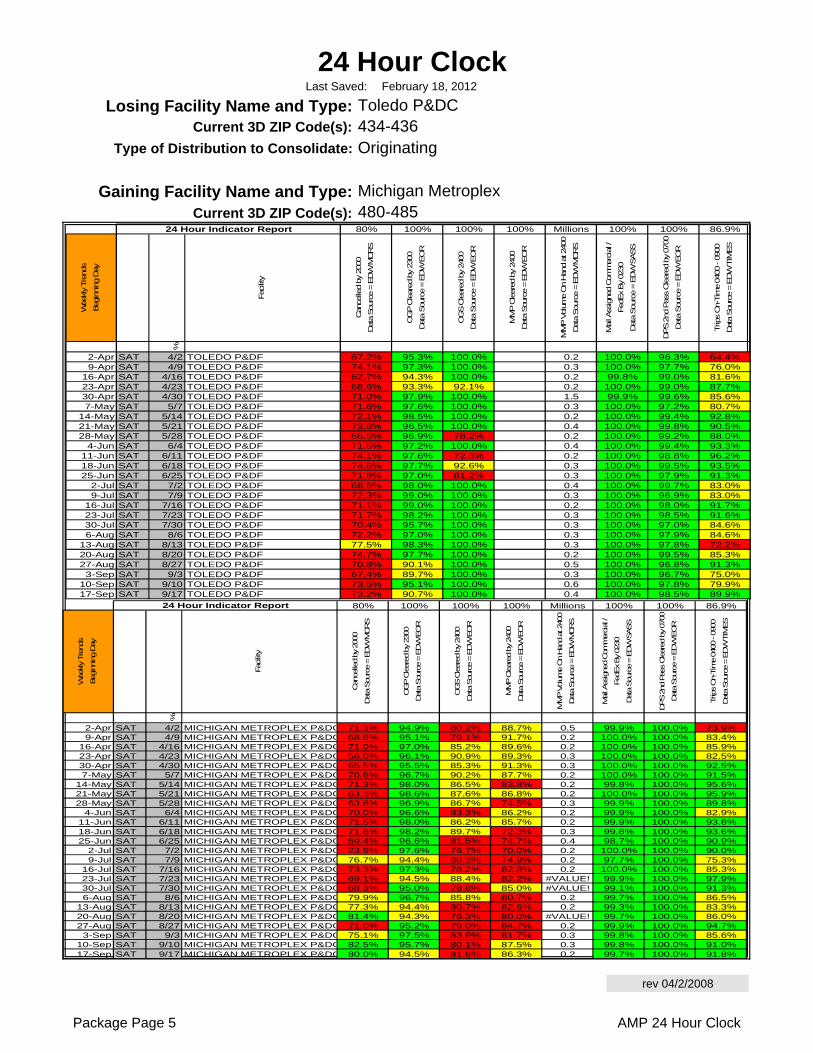
Losing Facility Name and Type:Current 3D ZIP Code(s):
Type of Distribution to Consolidate:
Gaining Facility Name and Type:Current 3D ZIP Code(s):
rev 04/2/2008
February 18, 2012
480-485
Originating
24 Hour ClockLast Saved:
Toledo P&DC
Michigan Metroplex
434-436
80% 100% 100% 100% Millions 100% 100% 86.9%
Wee
kly
Tren
ds
Beg
inni
ng D
ay
Facility
Can
celle
d by
200
0
Dat
a Sou
rce
= EDW
MCRS
OG
P C
lear
ed b
y 23
00
Dat
a Sou
rce
= EDW
EO
R
OG
S C
lear
ed b
y 24
00
Dat
a Sou
rce
= EDW
EO
R
MM
P C
lear
ed b
y 24
00
Dat
a Sou
rce
= EDW
EO
R
MM
P V
olum
e O
n Han
d at
240
0
Dat
a Sou
rce
= EDW
MCRS
Mai
l Ass
igne
d Com
mer
cial
/
FedE
x By
0230
Dat
a Sou
rce
= EDW
SASS
DPS 2
nd P
ass
Cle
ared
by
0700
Dat
a Sou
rce
= EDW
EO
R
Trip
s O
n-Ti
me
0400
- 09
00
Dat
a Sou
rce
= EDW
TIM
ES
%
2-Apr SAT 4/2 TOLEDO P&DF 67.2% 95.3% 100.0% 0.2 100.0% 96.3% 64.4%9-Apr SAT 4/9 TOLEDO P&DF 74.1% 97.3% 100.0% 0.3 100.0% 97.7% 76.0%
16-Apr SAT 4/16 TOLEDO P&DF 62.7% 94.3% 100.0% 0.2 99.8% 99.0% 81.6%23-Apr SAT 4/23 TOLEDO P&DF 68.6% 93.3% 92.1% 0.2 100.0% 99.0% 87.7%30-Apr SAT 4/30 TOLEDO P&DF 71.0% 97.9% 100.0% 1.5 99.9% 99.6% 85.6%7-May SAT 5/7 TOLEDO P&DF 71.6% 97.6% 100.0% 0.3 100.0% 97.2% 80.7%
14-May SAT 5/14 TOLEDO P&DF 72.1% 98.5% 100.0% 0.2 100.0% 99.4% 92.8%21-May SAT 5/21 TOLEDO P&DF 73.6% 96.5% 100.0% 0.4 100.0% 99.8% 90.5%28-May SAT 5/28 TOLEDO P&DF 66.5% 96.9% 78.2% 0.2 100.0% 99.2% 88.0%
4-Jun SAT 6/4 TOLEDO P&DF 71.5% 97.2% 100.0% 0.4 100.0% 99.4% 93.3%11-Jun SAT 6/11 TOLEDO P&DF 74.1% 97.6% 72.3% 0.2 100.0% 98.8% 96.2%18-Jun SAT 6/18 TOLEDO P&DF 74.6% 97.7% 92.6% 0.3 100.0% 99.5% 93.5%25-Jun SAT 6/25 TOLEDO P&DF 71.8% 97.0% 81.2% 0.3 100.0% 97.9% 91.3%
2-Jul SAT 7/2 TOLEDO P&DF 68.5% 98.0% 100.0% 0.4 100.0% 99.7% 83.0%9-Jul SAT 7/9 TOLEDO P&DF 72.3% 99.0% 100.0% 0.3 100.0% 96.9% 83.0%
16-Jul SAT 7/16 TOLEDO P&DF 71.1% 99.0% 100.0% 0.2 100.0% 98.0% 91.7%23-Jul SAT 7/23 TOLEDO P&DF 71.7% 98.2% 100.0% 0.3 100.0% 98.5% 91.6%30-Jul SAT 7/30 TOLEDO P&DF 70.4% 95.7% 100.0% 0.3 100.0% 97.0% 84.6%6-Aug SAT 8/6 TOLEDO P&DF 72.2% 97.0% 100.0% 0.3 100.0% 97.9% 84.6%
13-Aug SAT 8/13 TOLEDO P&DF 77.5% 98.3% 100.0% 0.3 100.0% 97.8% 72.2%20-Aug SAT 8/20 TOLEDO P&DF 74.7% 97.7% 100.0% 0.2 100.0% 99.5% 85.3%27-Aug SAT 8/27 TOLEDO P&DF 70.8% 90.1% 100.0% 0.5 100.0% 96.8% 91.3%3-Sep SAT 9/3 TOLEDO P&DF 67.4% 89.7% 100.0% 0.3 100.0% 96.7% 75.0%
10-Sep SAT 9/10 TOLEDO P&DF 73.5% 95.1% 100.0% 0.6 100.0% 97.8% 79.9%17-Sep SAT 9/17 TOLEDO P&DF 73.2% 90.7% 100.0% 0.4 100.0% 98.5% 89.9%
24 Hour Indicator Report
80% 100% 100% 100% Millions 100% 100% 86.9%
Wee
kly
Tren
ds
Beginn
ing
Day
Facility
Can
celle
d by
200
0
Dat
a Sou
rce
= ED
W M
CRS
OGP C
lear
ed b
y 23
00
Dat
a Sou
rce
= EDW
EOR
OGS C
lear
ed b
y 24
00
Dat
a Sou
rce
= EDW
EOR
MM
P C
lear
ed b
y 24
00
Dat
a Sou
rce
= EDW
EOR
MM
P V
olum
e On
Han
d at
240
0
Dat
a Sou
rce
= ED
W M
CRS
Mail A
ssigne
d Com
mer
cial /
FedE
x By
0230
Dat
a Sou
rce
= ED
W S
ASS
DPS
2nd
Pass
Clear
ed b
y 07
00
Dat
a Sou
rce
= EDW
EOR
Trips
On-
Tim
e 04
00 -
0900
Dat
a Sou
rce
= EDW
TIM
ES
%
2-Apr SAT 4/2 MICHIGAN METROPLEX P&DC 71.3% 94.9% 80.2% 88.7% 0.5 99.9% 100.0% 73.9%9-Apr SAT 4/9 MICHIGAN METROPLEX P&DC 68.6% 95.1% 79.1% 91.7% 0.2 100.0% 100.0% 83.4%
16-Apr SAT 4/16 MICHIGAN METROPLEX P&DC 71.0% 97.0% 85.2% 89.6% 0.2 100.0% 100.0% 85.9%23-Apr SAT 4/23 MICHIGAN METROPLEX P&DC 56.0% 96.1% 90.9% 89.3% 0.3 100.0% 100.0% 82.5%30-Apr SAT 4/30 MICHIGAN METROPLEX P&DC 65.5% 95.5% 85.3% 91.3% 0.3 100.0% 100.0% 92.5%7-May SAT 5/7 MICHIGAN METROPLEX P&DC 70.6% 96.7% 90.2% 87.7% 0.2 100.0% 100.0% 91.5%
14-May SAT 5/14 MICHIGAN METROPLEX P&DC 71.3% 98.0% 86.5% 83.8% 0.2 99.8% 100.0% 95.6%21-May SAT 5/21 MICHIGAN METROPLEX P&DC 63.3% 98.6% 87.6% 86.8% 0.2 100.0% 100.0% 95.9%28-May SAT 5/28 MICHIGAN METROPLEX P&DC 63.8% 96.9% 86.7% 74.5% 0.3 99.9% 100.0% 89.8%
4-Jun SAT 6/4 MICHIGAN METROPLEX P&DC 70.0% 96.6% 83.3% 86.2% 0.2 99.9% 100.0% 82.9%11-Jun SAT 6/11 MICHIGAN METROPLEX P&DC 71.5% 98.0% 86.2% 85.7% 0.2 99.9% 100.0% 93.8%18-Jun SAT 6/18 MICHIGAN METROPLEX P&DC 71.8% 98.2% 89.7% 72.3% 0.3 99.8% 100.0% 93.6%25-Jun SAT 6/25 MICHIGAN METROPLEX P&DC 69.4% 96.6% 81.5% 74.7% 0.4 98.7% 100.0% 90.9%
2-Jul SAT 7/2 MICHIGAN METROPLEX P&DC 23.9% 97.6% 76.7% 70.0% 0.2 100.0% 100.0% 90.0%9-Jul SAT 7/9 MICHIGAN METROPLEX P&DC 76.7% 94.4% 80.3% 74.9% 0.2 97.7% 100.0% 75.3%
16-Jul SAT 7/16 MICHIGAN METROPLEX P&DC 73.3% 97.3% 78.2% 82.8% 0.2 100.0% 100.0% 85.3%23-Jul SAT 7/23 MICHIGAN METROPLEX P&DC 69.1% 94.5% 88.4% 82.2% #VALUE! 99.9% 100.0% 97.9%30-Jul SAT 7/30 MICHIGAN METROPLEX P&DC 68.3% 95.0% 78.8% 85.0% #VALUE! 99.1% 100.0% 91.3%6-Aug SAT 8/6 MICHIGAN METROPLEX P&DC 79.9% 96.7% 85.8% 80.7% 0.2 99.7% 100.0% 86.5%
13-Aug SAT 8/13 MICHIGAN METROPLEX P&DC 77.3% 94.4% 80.7% 82.6% 0.2 99.3% 100.0% 83.3%20-Aug SAT 8/20 MICHIGAN METROPLEX P&DC 81.4% 94.3% 76.3% 80.0% #VALUE! 99.7% 100.0% 86.0%27-Aug SAT 8/27 MICHIGAN METROPLEX P&DC 71.0% 95.2% 79.0% 84.7% 0.2 99.9% 100.0% 94.7%3-Sep SAT 9/3 MICHIGAN METROPLEX P&DC 75.1% 97.5% 83.9% 81.7% 0.3 99.8% 100.0% 85.6%
10-Sep SAT 9/10 MICHIGAN METROPLEX P&DC 82.5% 95.7% 80.1% 87.5% 0.3 99.8% 100.0% 91.0%17-Sep SAT 9/17 MICHIGAN METROPLEX P&DC 80.0% 94.5% 81.6% 86.3% 0.2 99.7% 100.0% 91.8%
24 Hour Indicator Report
Package Page 5 AMP 24 Hour Clock

Last Saved:
Losing Facility Name and Type:Current 3D ZIP Code(s):
Miles to Gaining Facility:
Gaining Facility Name and Type:Current 3D ZIP Code(s):
rev 03/20/2008
480-485
MAPToledo P&DC
Michigan Metroplex
434-436
February 18, 2012
89 Miles
Package Page 6 AMP MAP

Last Saved: Stakeholder Notification Page 1AMP Event: Start of Study
rev 07/16/2008
Toledo P&DC
Stakeholders Notification Losing Facility:
February 18, 2012(WorkBook Tab Notification - 1)
Package Page 8 AMP Stakeholders Notification

Overnight % Change All Others % Change Total % Change All % Change All % Change All % Change All % Change All % ChangeUPGRADE TBDDOWNGRADE TBDTOTAL TBDNET UP+NO CHNG TBD
VOLUME TOTAL TBD
* - Periodical and Standard mail origin 3-digit ZIP Code to destination 3-digit ZIP Code volume is not available
Overnight % Change All Others % Change Total % Change All % Change All % Change All % Change All % Change All % ChangeUPGRADE TBDDOWNGRADE TBDTOTAL TBDNET TBD
Service Standard Impacts
PRI ALL CLASSESSTD *FCM PER *
Based on report prepared by Network Integration Support dated:
Last Saved:
PER STD
February 18, 2012
Losing Facility:
PSVC ALL CLASSES
rev 10/16/2009
Losing Facility 3D ZIP Code(s):
mm/dd/yyyy
Selected summary fields are transferred to the Executive Summary
Toledo P&DC
434-436480-485Gaining Facility 3D ZIP Code(s):
Service Standard Changes - PairsFCM PRI
PSVC
Service Standard Changes - Average Daily Volume (data obtained from ODIS is derived from sampling and may vary from actual volume)
Package Page 7 AMP Service Standard Impacts

Last Saved:
10/01/10 <<=== : ===>> 09/30/11
LDC LDC LDC LDC
11 $36.73 41 $0.00 11 $40.24 41 $0.00
12 $40.69 42 $0.00 12 $40.16 42 $0.00
13 $41.01 43 $14.74 13 $43.82 43 $0.00
14 $34.46 44 $0.00 14 $44.55 44 $0.00
15 $36.21 45 $0.00 15 $51.33 45 $0.00
16 $0.00 46 $0.00 16 $0.00 46 $0.00
17 $37.43 47 $0.00 17 $42.94 47 $0.00
18 $43.17 48 $14.53 18 $38.40 48 $0.00
(1) (2) (3) (4) (5) (6) (7) (8) (9) (10) (11) (12) (13) (14)Current Current Current Current Current Current Current Current Current Current Current Current
Operation Annual FHP Annual TPH or Annual Productivity Annual Operation Annual FHP Annual TPH or Annual Productivity AnnualNumbers Volume NATPH Volume Workhours (TPH or NATPH) Workhour Costs Numbers Workhour Costs
002 100.0% $265,148 \ ] 002 $0010 100.0% $10,417 \ ] 010 $577,283012 100.0% $14,652 \ ] 012 $0014 100.0% $3,068 \ ] 012dup015 100.0% $180,473 \ ] 004 $15,513017 100.0% $141,461 \ ] 018 $642,248018 100.0% $198,802 \ ] 018dup020 100.0% $5,576 \ ] 020 $12,310021 100.0% $0 \ ] 021 $18,463022 100.0% $0 \ ] 022 $0030 100.0% $262,859 \ ] 030 $3,914,073040 100.0% $7,239 \ ] 040 $370,451066 100.0% $0 \ ] 004dup067 100.0% $0 \ ] 004dup070 100.0% $15 \ ] 070 $0117 100.0% $55 \ ] 117 $1,078118 100.0% $76 \ ] 118 $0120 100.0% $1,178 \ ] 120 $86,408121 100.0% $114,567 \ ] 121 $79,778134 100.0% $952 \ ] 134 $0136 100.0% $227,212 \ ] 136 $2,582,344208 100.0% $96 \ ] 124 $2,257,016209 100.0% $25,425 \ ] 124dup210 35.0% $929,003 \ ] 210 $3,247,273229 100.0% $724,521 \ ] 229 $2,485,740230 100.0% $305,574 \ ] 230 $1,188,075231 100.0% $132,631 \ ] 231 $1,201,519271 100.0% $93,160 \ ] 481 $364,261281 100.0% $20,674 \ ] 481dup282 100.0% $1,917 \ ] 481dup284 100.0% $418 \ ] 284 $6,607332 100.0% $89 \ ] 462 $4,643334 100.0% $98 \ ] 464 $213,621461 100.0% $85,594 \ ] 461 $277,675462 100.0% $59 \ ] 462dup468 100.0% $0 \ ] 468 $0481 100.0% $191,482 \ ] 481dup484 100.0% $1,370 \ ] 484 $32,470487 100.0% $156 \ ] 487 $0488 100.0% $933 \ ] 488 $169
Losing Facility: Gaining Facility:Date Range of Data:
Function 1
Gaining Current Workhour Rate by LDC
Function 4
% Moved to Losing
% Moved to Gaining
Losing Current Workhour Rate by LDC
Function 4Function 1
February 18, 2012Workhour Costs - Current
Toledo P&DC Michigan Metroplex
Package Page 9 AMP Workhour Costs - Current
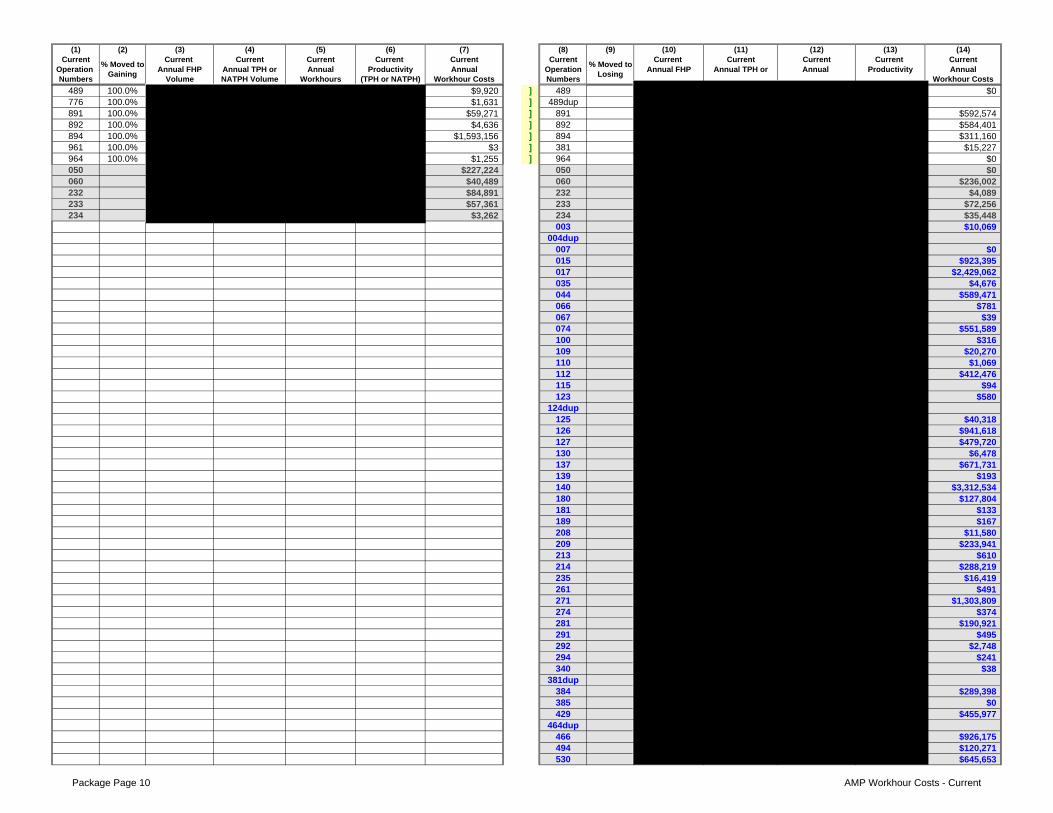
(1) (2) (3) (4) (5) (6) (7) (8) (9) (10) (11) (12) (13) (14)Current Current Current Current Current Current Current Current Current Current Current Current
Operation Annual FHP Annual TPH or Annual Productivity Annual Operation Annual FHP Annual TPH or Annual Productivity AnnualNumbers Volume NATPH Volume Workhours (TPH or NATPH) Workhour Costs Numbers Workhour Costs
% Moved to Losing
% Moved to Gaining
489 100.0% $9,920 \ ] 489 $0776 100.0% $1,631 \ ] 489dup891 100.0% $59,271 \ ] 891 $592,574892 100.0% $4,636 \ ] 892 $584,401894 100.0% $1,593,156 \ ] 894 $311,160961 100.0% $3 \ ] 381 $15,227964 100.0% $1,255 \ ] 964 $0050 $227,224 \ ] 050 $0060 $40,489 \ ] 060 $236,002232 $84,891 \ ] 232 $4,089233 $57,361 \ ] 233 $72,256234 $3,262 \ ] 234 $35,448
\ ] 003 $10,069\ ] 004dup\ ] 007 $0\ ] 015 $923,395\ ] 017 $2,429,062\ ] 035 $4,676\ ] 044 $589,471\ ] 066 $781\ ] 067 $39\ ] 074 $551,589\ ] 100 $316\ ] 109 $20,270\ ] 110 $1,069\ ] 112 $412,476\ ] 115 $94\ ] 123 $580\ ] 124dup\ ] 125 $40,318\ ] 126 $941,618\ ] 127 $479,720\ ] 130 $6,478\ ] 137 $671,731\ ] 139 $193\ ] 140 $3,312,534\ ] 180 $127,804\ ] 181 $133\ ] 189 $167\ ] 208 $11,580\ ] 209 $233,941\ ] 213 $610\ ] 214 $288,219\ ] 235 $16,419\ ] 261 $491\ ] 271 $1,303,809\ ] 274 $374\ ] 281 $190,921\ ] 291 $495\ ] 292 $2,748\ ] 294 $241\ ] 340 $38\ ] 381dup\ ] 384 $289,398\ ] 385 $0\ ] 429 $455,977\ ] 464dup\ ] 466 $926,175\ ] 494 $120,271\ ] 530 $645,653
Package Page 10 AMP Workhour Costs - Current
(1) (2) (3) (4) (5) (6) (7) (8) (9) (10) (11) (12) (13) (14)Current Current Current Current Current Current Current Current Current Current Current Current
Operation Annual FHP Annual TPH or Annual Productivity Annual Operation Annual FHP Annual TPH or Annual Productivity AnnualNumbers Volume NATPH Volume Workhours (TPH or NATPH) Workhour Costs Numbers Volume NATPH Volume Workhours (TPH or NATPH) Workhour Costs
% Moved to Losing
% Moved to Gaining
\ ] 538 $1,015,629\ ] 549 $83,971\ ] 554 $53,783\ ] 560 $198,237\ ] 562 $879\ ] 585 $102,467\ ] 588 $159,326\ ] 607 $265,314\ ] 612 $68,524\ ] 618 $903,216\ ] 619 $6,645,845\ ] 620 $14,080\ ] 630 $28,145\ ] 677 $204,204\ ] 776 $51,663\ ] 793 $69,799\ ] 893 $3,977,509\ ] 896 $8,080\ ] 918 $5,565,902\ ] 919 $360,768\ ] 961 $5,424\ ] 966 $169\ ]\ ]\ ]\ ]\ ]\ ]\ ]\ ]\ ]\ ]\ ]\ ]\ ]\ ]\ ]\ ]\ ]\ ]\ ]\ ]\ ]\ ]\ ]\ ]\ ]\ ]\ ]\ ]\ ]\ ]\ ]\ ]\ ]\ ]\ ]\ ]\ ]\ ]
Package Page 11 AMP Workhour Costs - Current

(1) (2) (3) (4) (5) (6) (7) (8) (9) (10) (11) (12) (13) (14)Current Current Current Current Current Current Current Current Current Current Current Current
Operation Annual FHP Annual TPH or Annual Productivity Annual Operation Annual FHP Annual TPH or Annual Productivity AnnualNumbers Volume NATPH Volume Workhours (TPH or NATPH) Workhour Costs Numbers Volume NATPH Volume Workhours (TPH or NATPH) Workhour Costs
% Moved to Losing
% Moved to Gaining
\ ]\ ]\ ]\ ]\ ]\ ]\ ]\ ]\ ]\ ]\ ]\ ]\ ]\ ]\ ]\ ]\ ]\ ]\ ]\ ]\ ]\ ]\ ]\ ]\ ]\ ]\ ]\ ]\ ]\ ]\ ]\ ]\ ]\ ]\ ]\ ]\ ]\ ]\ ]\ ]\ ]\ ]\ ]\ ]\ ]\ ]\ ]\ ]\ ]\ ]\ ]\ ]\ ]\ ]\ ]\ ]\ ]\ ]\ ]\ ]
Package Page 12 AMP Workhour Costs - Current

(1) (2) (3) (4) (5) (6) (7) (8) (9) (10) (11) (12) (13) (14)Current Current Current Current Current Current Current Current Current Current Current Current
Operation Annual FHP Annual TPH or Annual Productivity Annual Operation Annual FHP Annual TPH or Annual Productivity AnnualNumbers Volume NATPH Volume Workhours (TPH or NATPH) Workhour Costs Numbers Volume NATPH Volume Workhours (TPH or NATPH) Workhour Costs
% Moved to Losing
% Moved to Gaining
\ ]\ ]\ ]\ ]\ ]\ ]\ ]\ ]\ ]\ ]\ ]\ ]\ ]\ ]\ ]\ ]\ ]\ ]\ ]\ ]\ ]\ ]\ ]\ ]\ ]\ ]\ ]\ ]\ ]\ ]\ ]\ ]\ ]\ ]\ ]\ ]\ ]\ ]\ ]\ ]\ ]\ ]\ ]\ ]\ ]\ ]\ ]\ ]\ ]\ ]\ ]\ ]\ ]\ ]\ ]\ ]\ ]\ ]\ ]\ ]
Package Page 13 AMP Workhour Costs - Current
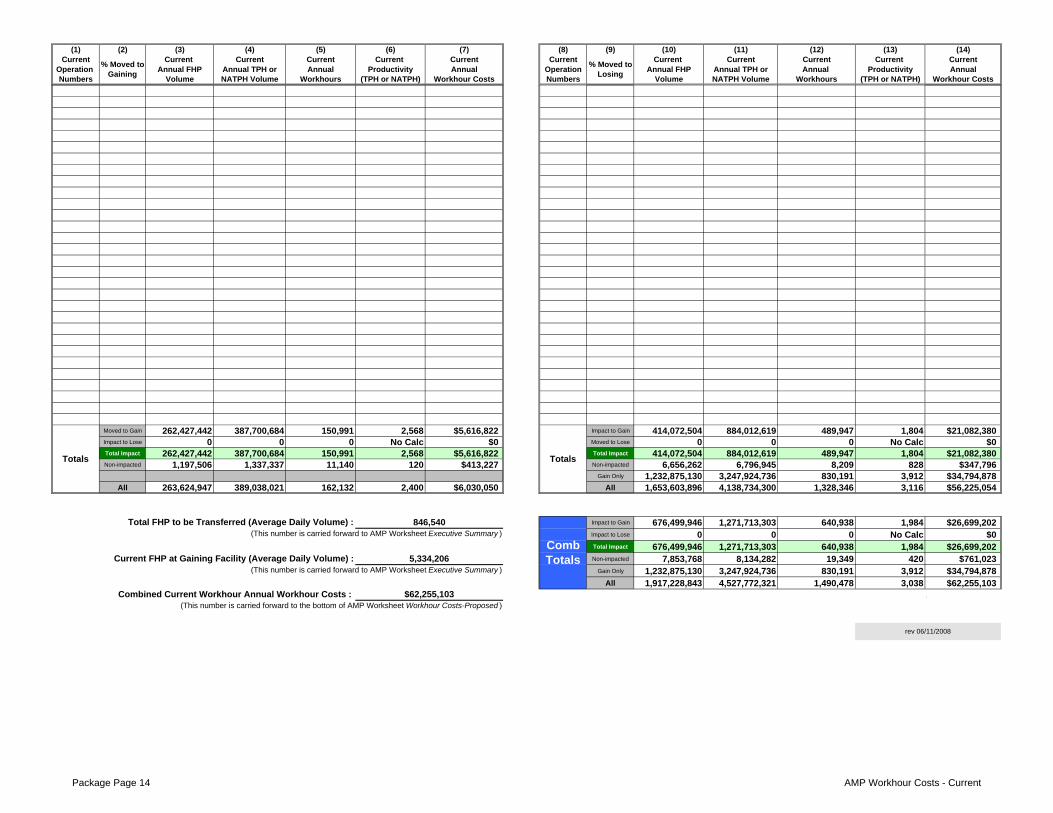
(1) (2) (3) (4) (5) (6) (7) (8) (9) (10) (11) (12) (13) (14)Current Current Current Current Current Current Current Current Current Current Current Current
Operation Annual FHP Annual TPH or Annual Productivity Annual Operation Annual FHP Annual TPH or Annual Productivity AnnualNumbers Volume NATPH Volume Workhours (TPH or NATPH) Workhour Costs Numbers Volume NATPH Volume Workhours (TPH or NATPH) Workhour Costs
% Moved to Losing
% Moved to Gaining
\ ]\ ]\ ]\ ]\ ]\ ]\ ]\ ]\ ]\ ]\ ]\ ]\ ]\ ]\ ]\ ]\ ]\ ]\ ]\ ]\ ]\ ]\ ]\ ]\ ]\ ]\ ]\ ]\ ]\ ]
Moved to Gain 262,427,442 387,700,684 150,991 2,568 $5,616,822 Impact to Gain 414,072,504 884,012,619 489,947 1,804 $21,082,380Impact to Lose 0 0 0 No Calc $0 Moved to Lose 0 0 0 No Calc $0Total Impact 262,427,442 387,700,684 150,991 2,568 $5,616,822 Total Impact 414,072,504 884,012,619 489,947 1,804 $21,082,380Non-impacted 1,197,506 1,337,337 11,140 120 $413,227 Non-impacted 6,656,262 6,796,945 8,209 828 $347,796
Gain Only 1,232,875,130 3,247,924,736 830,191 3,912 $34,794,878All 263,624,947 389,038,021 162,132 2,400 $6,030,050 All 1,653,603,896 4,138,734,300 1,328,346 3,116 $56,225,054
Impact to Gain 676,499,946 1,271,713,303 640,938 1,984 $26,699,202Impact to Lose 0 0 0 No Calc $0Total Impact 676,499,946 1,271,713,303 640,938 1,984 $26,699,202Non-impacted 7,853,768 8,134,282 19,349 420 $761,023
Gain Only 1,232,875,130 3,247,924,736 830,191 3,912 $34,794,878All 1,917,228,843 4,527,772,321 1,490,478 3,038 $62,255,103
.
(This number is carried forward to the bottom of AMP Worksheet Workhour Costs-Proposed )$62,255,103
Current FHP at Gaining Facility (Average Daily Volume) : 5,334,206 (This number is carried forward to AMP Worksheet Executive Summary )
(This number is carried forward to AMP Worksheet Executive Summary )
Combined Current Workhour Annual Workhour Costs :
846,540 Total FHP to be Transferred (Average Daily Volume) :
Totals
rev 06/11/2008
Comb Totals
Totals
Package Page 14 AMP Workhour Costs - Current
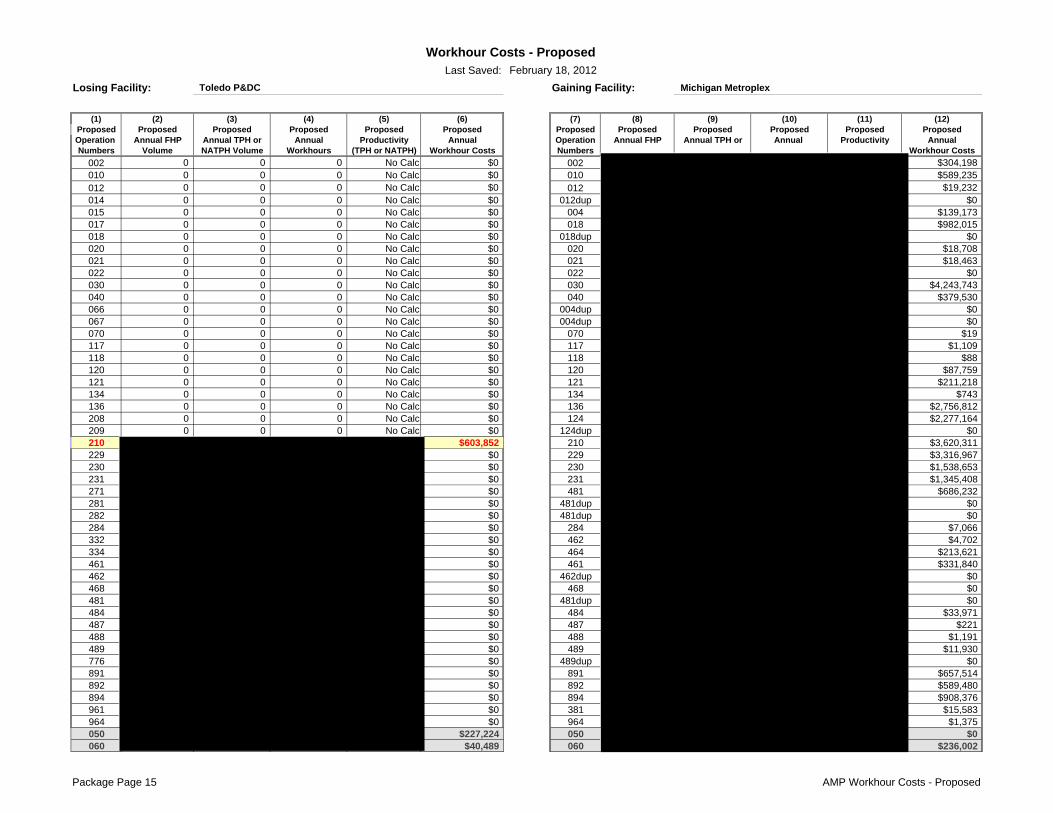
Last Saved:Losing Facility: Gaining Facility:
(1) (2) (3) (4) (5) (6) (7) (8) (9) (10) (11) (12)Proposed Proposed Proposed Proposed Proposed Proposed Proposed Proposed Proposed Proposed Proposed ProposedOperation Annual FHP Annual TPH or Annual Productivity Annual Operation Annual FHP Annual TPH or Annual Productivity AnnualNumbers Volume NATPH Volume Workhours (TPH or NATPH) Workhour Costs Numbers Workhour Costs
002 0 0 0 No Calc $0 002 $304,198010 0 0 0 No Calc $0 010 $589,235012 0 0 0 No Calc $0 012 $19,232014 0 0 0 No Calc $0 012dup $0015 0 0 0 No Calc $0 004 $139,173017 0 0 0 No Calc $0 018 $982,015018 0 0 0 No Calc $0 018dup $0020 0 0 0 No Calc $0 020 $18,708021 0 0 0 No Calc $0 021 $18,463022 0 0 0 No Calc $0 022 $0030 0 0 0 No Calc $0 030 $4,243,743040 0 0 0 No Calc $0 040 $379,530066 0 0 0 No Calc $0 004dup $0067 0 0 0 No Calc $0 004dup $0070 0 0 0 No Calc $0 070 $19117 0 0 0 No Calc $0 117 $1,109118 0 0 0 No Calc $0 118 $88120 0 0 0 No Calc $0 120 $87,759121 0 0 0 No Calc $0 121 $211,218134 0 0 0 No Calc $0 134 $743136 0 0 0 No Calc $0 136 $2,756,812208 0 0 0 No Calc $0 124 $2,277,164209 0 0 0 No Calc $0 124dup $0210 $603,852 P 210 $3,620,311229 $0 229 $3,316,967230 $0 230 $1,538,653231 $0 231 $1,345,408271 $0 481 $686,232281 $0 481dup $0282 $0 481dup $0284 $0 284 $7,066332 $0 462 $4,702334 $0 464 $213,621461 $0 461 $331,840462 $0 462dup $0468 $0 468 $0481 $0 481dup $0484 $0 484 $33,971487 $0 487 $221488 $0 488 $1,191489 $0 489 $11,930776 $0 489dup $0891 $0 891 $657,514892 $0 892 $589,480894 $0 894 $908,376961 $0 381 $15,583964 $0 964 $1,375050 $227,224 050 $0060 $40,489 060 $236,002
Michigan Metroplex
Workhour Costs - Proposed
Toledo P&DC
February 18, 2012
Package Page 15 AMP Workhour Costs - Proposed

(1) (2) (3) (4) (5) (6) (7) (8) (9) (10) (11) (12)Proposed Proposed Proposed Proposed Proposed Proposed Proposed Proposed Proposed Proposed Proposed ProposedOperation Annual FHP Annual TPH or Annual Productivity Annual Operation Annual FHP Annual TPH or Annual Productivity AnnualNumbers Volume NATPH Volume Workhours (TPH or NATPH) Workhour Costs Numbers Volume NATPH Volume Workhours (TPH or NATPH) Workhour Costs
232 $84,891 232 $4,089233 $57,361 233 $72,256234 $3,262 234 $35,448
0 No Calc 003 $10,0690 No Calc 004dup $00 No Calc 007 $00 No Calc 015 $923,3950 No Calc 017 $2,591,3580 No Calc 035 $00 No Calc 044 $589,4710 No Calc 066 $7810 No Calc 067 $390 No Calc 074 $551,5890 No Calc 100 $3160 No Calc 109 $20,2700 No Calc 110 $1,0690 No Calc 112 $412,4760 No Calc 115 $940 No Calc 123 $5800 No Calc 124dup $00 No Calc 125 $40,3180 No Calc 126 $941,6180 No Calc 127 $479,7200 No Calc 130 $6,4780 No Calc 137 $671,7310 No Calc 139 $1930 No Calc 140 $3,312,5340 No Calc 180 $127,8040 No Calc 181 $1330 No Calc 189 $1670 No Calc 208 $11,6900 No Calc 209 $263,1100 No Calc 213 $6100 No Calc 214 $288,2190 No Calc 235 $16,4190 No Calc 261 $4910 No Calc 271 $1,303,8090 No Calc 274 $3740 No Calc 281 $190,9210 No Calc 291 $4950 No Calc 292 $2,7480 No Calc 294 $2410 No Calc 340 $380 No Calc 381dup $00 No Calc 384 $289,3980 No Calc 385 $00 No Calc 429 $455,9770 No Calc 464dup $00 No Calc 466 $926,1750 No Calc 494 $120,2710 No Calc 530 $645,6530 No Calc 538 $1,015,6290 No Calc 549 $83,9710 No Calc 554 $53,7830 No Calc 560 $198,237
Package Page 16 AMP Workhour Costs - Proposed
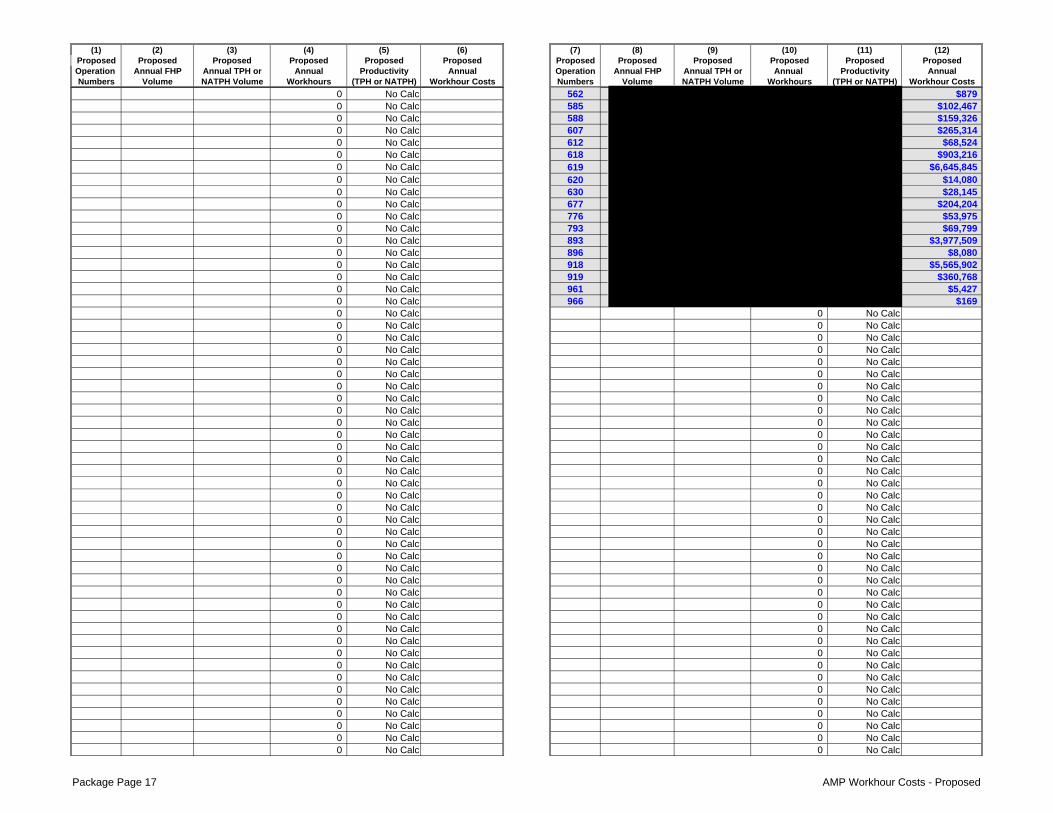
(1) (2) (3) (4) (5) (6) (7) (8) (9) (10) (11) (12)Proposed Proposed Proposed Proposed Proposed Proposed Proposed Proposed Proposed Proposed Proposed ProposedOperation Annual FHP Annual TPH or Annual Productivity Annual Operation Annual FHP Annual TPH or Annual Productivity AnnualNumbers Volume NATPH Volume Workhours (TPH or NATPH) Workhour Costs Numbers Volume NATPH Volume Workhours (TPH or NATPH) Workhour Costs
0 No Calc 562 $8790 No Calc 585 $102,4670 No Calc 588 $159,3260 No Calc 607 $265,3140 No Calc 612 $68,5240 No Calc 618 $903,2160 No Calc 619 $6,645,8450 No Calc 620 $14,0800 No Calc 630 $28,1450 No Calc 677 $204,2040 No Calc 776 $53,9750 No Calc 793 $69,7990 No Calc 893 $3,977,5090 No Calc 896 $8,0800 No Calc 918 $5,565,9020 No Calc 919 $360,7680 No Calc 961 $5,4270 No Calc 966 $1690 No Calc 0 No Calc0 No Calc 0 No Calc0 No Calc 0 No Calc0 No Calc 0 No Calc0 No Calc 0 No Calc0 No Calc 0 No Calc0 No Calc 0 No Calc0 No Calc 0 No Calc0 No Calc 0 No Calc0 No Calc 0 No Calc0 No Calc 0 No Calc0 No Calc 0 No Calc0 No Calc 0 No Calc0 No Calc 0 No Calc0 No Calc 0 No Calc0 No Calc 0 No Calc0 No Calc 0 No Calc0 No Calc 0 No Calc0 No Calc 0 No Calc0 No Calc 0 No Calc0 No Calc 0 No Calc0 No Calc 0 No Calc0 No Calc 0 No Calc0 No Calc 0 No Calc0 No Calc 0 No Calc0 No Calc 0 No Calc0 No Calc 0 No Calc0 No Calc 0 No Calc0 No Calc 0 No Calc0 No Calc 0 No Calc0 No Calc 0 No Calc0 No Calc 0 No Calc0 No Calc 0 No Calc0 No Calc 0 No Calc0 No Calc 0 No Calc0 No Calc 0 No Calc0 No Calc 0 No Calc
Package Page 17 AMP Workhour Costs - Proposed

(1) (2) (3) (4) (5) (6) (7) (8) (9) (10) (11) (12)Proposed Proposed Proposed Proposed Proposed Proposed Proposed Proposed Proposed Proposed Proposed ProposedOperation Annual FHP Annual TPH or Annual Productivity Annual Operation Annual FHP Annual TPH or Annual Productivity AnnualNumbers Volume NATPH Volume Workhours (TPH or NATPH) Workhour Costs Numbers Volume NATPH Volume Workhours (TPH or NATPH) Workhour Costs
0 No Calc 0 No Calc0 No Calc 0 No Calc0 No Calc 0 No Calc0 No Calc 0 No Calc0 No Calc 0 No Calc0 No Calc 0 No Calc0 No Calc 0 No Calc0 No Calc 0 No Calc0 No Calc 0 No Calc0 No Calc 0 No Calc0 No Calc 0 No Calc0 No Calc 0 No Calc0 No Calc 0 No Calc0 No Calc 0 No Calc0 No Calc 0 No Calc0 No Calc 0 No Calc0 No Calc 0 No Calc0 No Calc 0 No Calc0 No Calc 0 No Calc0 No Calc 0 No Calc0 No Calc 0 No Calc0 No Calc 0 No Calc0 No Calc 0 No Calc0 No Calc 0 No Calc0 No Calc 0 No Calc0 No Calc 0 No Calc0 No Calc 0 No Calc0 No Calc 0 No Calc0 No Calc 0 No Calc0 No Calc 0 No Calc0 No Calc 0 No Calc0 No Calc 0 No Calc0 No Calc 0 No Calc0 No Calc 0 No Calc0 No Calc 0 No Calc0 No Calc 0 No Calc0 No Calc 0 No Calc0 No Calc 0 No Calc0 No Calc 0 No Calc0 No Calc 0 No Calc0 No Calc 0 No Calc0 No Calc 0 No Calc0 No Calc 0 No Calc0 No Calc 0 No Calc0 No Calc 0 No Calc0 No Calc 0 No Calc0 No Calc 0 No Calc0 No Calc 0 No Calc0 No Calc 0 No Calc0 No Calc 0 No Calc0 No Calc 0 No Calc0 No Calc 0 No Calc0 No Calc 0 No Calc0 No Calc 0 No Calc0 No Calc 0 No Calc
Package Page 18 AMP Workhour Costs - Proposed

(1) (2) (3) (4) (5) (6) (7) (8) (9) (10) (11) (12)Proposed Proposed Proposed Proposed Proposed Proposed Proposed Proposed Proposed Proposed Proposed ProposedOperation Annual FHP Annual TPH or Annual Productivity Annual Operation Annual FHP Annual TPH or Annual Productivity AnnualNumbers Volume NATPH Volume Workhours (TPH or NATPH) Workhour Costs Numbers Volume NATPH Volume Workhours (TPH or NATPH) Workhour Costs
0 No Calc 0 No Calc0 No Calc 0 No Calc0 No Calc 0 No Calc0 No Calc 0 No Calc0 No Calc 0 No Calc0 No Calc 0 No Calc0 No Calc 0 No Calc0 No Calc 0 No Calc0 No Calc 0 No Calc0 No Calc 0 No Calc0 No Calc 0 No Calc0 No Calc 0 No Calc0 No Calc 0 No Calc0 No Calc 0 No Calc0 No Calc 0 No Calc0 No Calc 0 No Calc0 No Calc 0 No Calc0 No Calc 0 No Calc0 No Calc 0 No Calc0 No Calc 0 No Calc0 No Calc 0 No Calc0 No Calc 0 No Calc0 No Calc 0 No Calc0 No Calc 0 No Calc0 No Calc 0 No Calc0 No Calc 0 No Calc0 No Calc 0 No Calc0 No Calc 0 No Calc0 No Calc 0 No Calc0 No Calc 0 No Calc0 No Calc 0 No Calc0 No Calc 0 No Calc0 No Calc 0 No Calc0 No Calc 0 No Calc0 No Calc 0 No Calc0 No Calc 0 No Calc0 No Calc 0 No Calc0 No Calc 0 No Calc0 No Calc 0 No Calc0 No Calc 0 No Calc0 No Calc 0 No Calc0 No Calc 0 No Calc0 No Calc 0 No Calc0 No Calc 0 No Calc0 No Calc 0 No Calc0 No Calc 0 No Calc0 No Calc 0 No Calc0 No Calc 0 No Calc0 No Calc 0 No Calc0 No Calc 0 No Calc0 No Calc 0 No Calc0 No Calc 0 No Calc0 No Calc 0 No Calc0 No Calc 0 No Calc0 No Calc 0 No Calc
Package Page 19 AMP Workhour Costs - Proposed

(1) (2) (3) (4) (5) (6) (7) (8) (9) (10) (11) (12)Proposed Proposed Proposed Proposed Proposed Proposed Proposed Proposed Proposed Proposed Proposed ProposedOperation Annual FHP Annual TPH or Annual Productivity Annual Operation Annual FHP Annual TPH or Annual Productivity AnnualNumbers Volume NATPH Volume Workhours (TPH or NATPH) Workhour Costs Numbers Volume NATPH Volume Workhours (TPH or NATPH) Workhour Costs
0 No Calc 0 No Calc0 No Calc 0 No Calc0 No Calc 0 No Calc0 No Calc 0 No Calc0 No Calc 0 No Calc0 No Calc 0 No Calc0 No Calc 0 No Calc0 No Calc 0 No Calc0 No Calc 0 No Calc0 No Calc 0 No Calc0 No Calc 0 No Calc0 No Calc 0 No Calc0 No Calc 0 No Calc0 No Calc 0 No Calc0 No Calc 0 No Calc0 No Calc 0 No Calc0 No Calc 0 No Calc0 No Calc 0 No Calc0 No Calc 0 No Calc0 No Calc 0 No Calc0 No Calc 0 No Calc0 No Calc 0 No Calc0 No Calc 0 No Calc0 No Calc 0 No Calc0 No Calc 0 No Calc0 No Calc 0 No Calc0 No Calc 0 No Calc0 No Calc 0 No Calc0 No Calc 0 No Calc0 No Calc 0 No Calc0 No Calc 0 No Calc0 No Calc 0 No Calc0 No Calc 0 No Calc0 No Calc 0 No Calc0 No Calc 0 No Calc0 No Calc 0 No Calc0 No Calc 0 No Calc0 No Calc 0 No Calc0 No Calc 0 No Calc0 No Calc 0 No Calc0 No Calc 0 No Calc
Moved to Gain 0 54,800 16,135 3 $603,852 Impact to Gain 676,499,946 1,271,658,503 589,780 2,156 $25,313,651Impact to Lose 0 0 0 No Calc $0 Moved to Lose 0 0 0 No Calc $0Total Impact 0 54,800 16,135 3 $603,852 Total Impact 676,499,946 1,271,658,503 589,780 2,156 $25,313,651Non Impacted 1,197,506 1,337,337 11,140 120 $413,227 Non Impacted 6,656,262 6,796,945 8,209 828 $347,796
Gain Only 1,232,875,130 3,247,924,736 834,588 3,892 $34,984,091All 1,197,506 1,392,137 27,275 51 $1,017,079 All 1,916,031,338 4,526,380,184 1,432,577 3,160 $60,645,538
Package Page 20 AMP Workhour Costs - Proposed
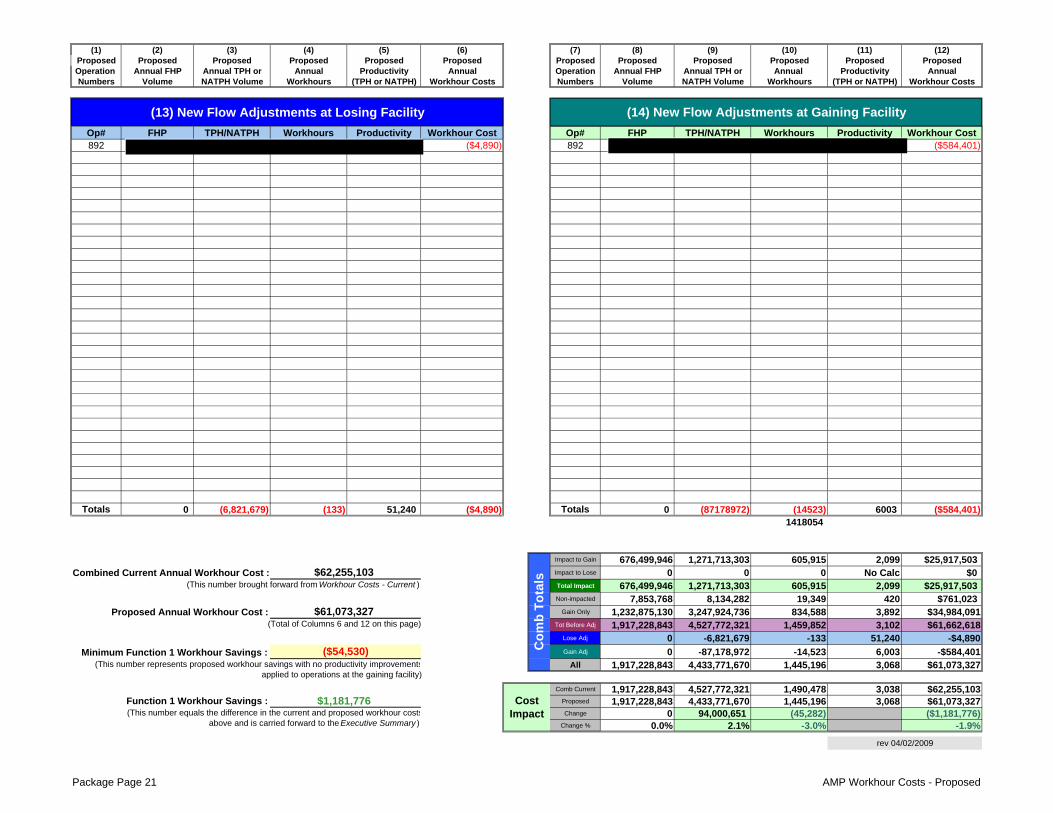
(1) (2) (3) (4) (5) (6) (7) (8) (9) (10) (11) (12)Proposed Proposed Proposed Proposed Proposed Proposed Proposed Proposed Proposed Proposed Proposed ProposedOperation Annual FHP Annual TPH or Annual Productivity Annual Operation Annual FHP Annual TPH or Annual Productivity AnnualNumbers Volume NATPH Volume Workhours (TPH or NATPH) Workhour Costs Numbers Volume NATPH Volume Workhours (TPH or NATPH) Workhour Costs
Op# FHP TPH/NATPH Workhours Productivity Workhour Cost Op# FHP TPH/NATPH Workhours Productivity Workhour Cost892 ($4,890) 1 892 ($584,401)
2
3
4
5
6
7
8
9
10
11
12
13
14
15
16
17
18
19
20
21
22
23
24
25
26
27
28
29
30
Totals 0 (6,821,679) (133) 51,240 ($4,890) Totals 0 (87178972) (14523) 6003 ($584,401)1418054
Impact to Gain 676,499,946 1,271,713,303 605,915 2,099 $25,917,503Combined Current Annual Workhour Cost : Impact to Lose 0 0 0 No Calc $0
Total Impact 676,499,946 1,271,713,303 605,915 2,099 $25,917,503Non-impacted 7,853,768 8,134,282 19,349 420 $761,023
Gain Only 1,232,875,130 3,247,924,736 834,588 3,892 $34,984,091Tot Before Adj 1,917,228,843 4,527,772,321 1,459,852 3,102 $61,662,618
Lose Adj 0 -6,821,679 -133 51,240 -$4,890Gain Adj 0 -87,178,972 -14,523 6,003 -$584,401
All 1,917,228,843 4,433,771,670 1,445,196 3,068 $61,073,327
Comb Current 1,917,228,843 4,527,772,321 1,490,478 3,038 $62,255,103Proposed 1,917,228,843 4,433,771,670 1,445,196 3,068 $61,073,327Change 0 94,000,651 (45,282) ($1,181,776)
Change % 0.0% 2.1% -3.0% -1.9%
rev 04/02/2009
(14) New Flow Adjustments at Gaining Facility(13) New Flow Adjustments at Losing Facility
$62,255,103
Proposed Annual Workhour Cost :(Total of Columns 6 and 12 on this page)
$61,073,327
Com
b To
tals
Cost Impact(This number equals the difference in the current and proposed workhour costs
above and is carried forward to the Executive Summary )
(This number brought forward from Workhour Costs - Current )
Function 1 Workhour Savings : $1,181,776
Minimum Function 1 Workhour Savings : ($54,530)(This number represents proposed workhour savings with no productivity improvements
applied to operations at the gaining facility)
Package Page 21 AMP Workhour Costs - Proposed
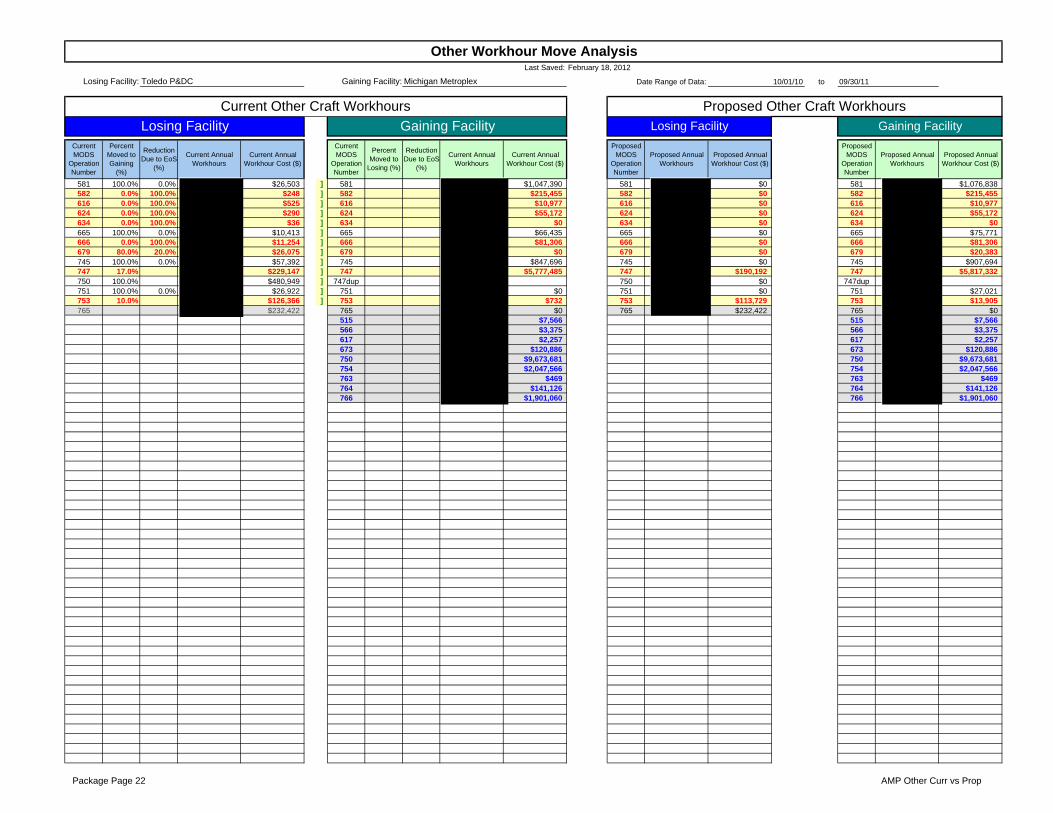
Last Saved:
to
581 100.0% 0.0% $26,503 \ ] 581 $1,047,390 TG 581 $0 581 $1,076,838582 0.0% 100.0% $248 \ ] 582 $215,455 TGp 582 $0 582 $215,455616 0.0% 100.0% $525 \ ] 616 $10,977 TGp 616 $0 616 $10,977624 0.0% 100.0% $290 \ ] 624 $55,172 TGp 624 $0 624 $55,172634 0.0% 100.0% $36 \ ] 634 $0 TGp 634 $0 634 $0665 100.0% 0.0% $10,413 \ ] 665 $66,435 TG 665 $0 665 $75,771666 0.0% 100.0% $11,254 \ ] 666 $81,306 TGp 666 $0 666 $81,306679 80.0% 20.0% $26,075 \ ] 679 $0 TGp 679 $0 679 $20,383745 100.0% 0.0% $57,392 \ ] 745 $847,696 TG 745 $0 745 $907,694747 17.0% $229,147 \ ] 747 $5,777,485 TGp 747 $190,192 747 $5,817,332750 100.0% $480,949 \ ] 747dup TG 750 $0 747dup751 100.0% 0.0% $26,922 \ ] 751 $0 TG 751 $0 751 $27,021753 10.0% $126,366 \ ] 753 $732 TGp 753 $113,729 753 $13,905765 $232,422 \ ] 765 $0 NI 765 $232,422 765 $0
\ ] 515 $7,566 GO 515 $7,566\ ] 566 $3,375 GO 566 $3,375\ ] 617 $2,257 GO 617 $2,257\ ] 673 $120,886 GO 673 $120,886\ ] 750 $9,673,681 GO 750 $9,673,681\ ] 754 $2,047,566 GO 754 $2,047,566\ ] 763 $469 GO 763 $469\ ] 764 $141,126 GO 764 $141,126\ ] 766 $1,901,060 GO 766 $1,901,060\ ]\ ]\ ]\ ]\ ]\ ]\ ]\ ]\ ]\ ]\ ]\ ]\ ]\ ]\ ]\ ]\ ]\ ]\ ]\ ]\ ]\ ]\ ]\ ]\ ]\ ]\ ]\ ]\ ]\ ]\ ]\ ]\ ]\ ]\ ]\ ]\ ]
Proposed Other Craft Workhours
Proposed Annual Workhours
Proposed Annual Workhour Cost ($)
Other Workhour Move Analysis
Toledo P&DCLosing Facility: Gaining Facility: Michigan Metroplex Date Range of Data: 09/30/1110/01/10
February 18, 2012
Proposed MODS
Operation Number
Proposed Annual Workhours
Current Other Craft Workhours
Current Annual Workhour Cost ($)
Current MODS
Operation Number
Percent Moved to Gaining
(%)
Current Annual Workhours
Current Annual Workhours
Reduction Due to EoS
(%)
Reduction Due to EoS
(%)
Proposed Annual Workhour Cost ($)
Gaining Facility Losing FacilityLosing Facility Gaining FacilityCurrent MODS
Operation Number
Percent Moved to
Losing (%)
Current Annual Workhour Cost ($)
Proposed MODS
Operation Number
Package Page 22 AMP Other Curr vs Prop

\ ]\ ]\ ]\ ]\ ]\ ]\ ]\ ]\ ]\ ]\ ]\ ]\ ]\ ]\ ]\ ]\ ]\ ]\ ]\ ]\ ]\ ]\ ]\ ]\ ]\ ]\ ]\ ]\ ]\ ]\ ]\ ]\ ]\ ]\ ]\ ]\ ]\ ]\ ]\ ]\ ]\ ]\ ]\ ]\ ]\ ]\ ]\ ]\ ]\ ]\ ]\ ]\ ]\ ]\ ]\ ]\ ]\ ]\ ]\ ]\ ]\ ]\ ]\ ]\ ]\ ]\ ]\ ]\ ]\ ]\ ]\ ]\ ]\ ]
Package Page 23 AMP Other Curr vs Prop

\ ]\ ]\ ]\ ]\ ]\ ]\ ]\ ]\ ]\ ]\ ]\ ]\ ]\ ]\ ]\ ]\ ]
21,805 $996,118 0 $0 Ops-Red 7,002 $303,921 Ops-Red 0 $00 $0 181,154 $8,102,647 Ops-Inc 0 $0 Ops-Inc 195,548 $8,301,852
5,634 $232,422 292,540 $13,897,986 Ops-Stay 5,634 $232,422 Ops-Stay 292,540 $13,897,98627,439 $1,228,540 473,694 $22,000,633 AllOps 12,636 $536,343 AllOps 488,088 $22,199,838
565 0.0% 100.0% $304 \ ] 565 $0 TGp 565 $0 565 $0593 0.0% 100.0% $10,510 \ ] 593 $0 TGp 593 $0 593 $0671 0.0% 100.0% $21,356 \ ] 671 $248,750 TGp 671 $0 671 $248,750679 100.0% 0.0% $12,688 \ ] 679 $0 TG 679 $0 679 $12,704698 100.0% 0.0% $54,543 \ ] 698 $1,052,771 TG 698 $0 698 $1,109,082699 100.0% 0.0% $57,968 \ ] 699 $501,005 TG 699 $0 699 $560,853700 100.0% 0.0% $51,367 \ ] 700 $1,293,945 TG 700 $0 700 $1,346,978701 100.0% 0.0% $17,825 \ ] 701 $198,014 TG 701 $0 701 $216,417759 100.0% 0.0% $34,083 \ ] 759 $371,623 TG 759 $0 759 $405,749920 0.0% 100.0% $2,744 \ ] 920 $0 TGp 920 $0 920 $0927 100.0% 0.0% $2,464 \ ] 927 $640,181 TG 927 $0 927 $642,725928 100.0% 0.0% $2,654 \ ] 928 $9,445 TG 928 $0 928 $12,185933 100.0% 0.0% $14,990 \ ] 933 $420,148 TG 933 $0 933 $434,332951 80.0% 3.0% $103,759 \ ] 951 $1,533,341 TGp 951 $17,639 951 $1,611,888953 0.0% 100.0% $4,728 \ ] 953 $0 TGp 953 $0 953 $0
\ ] 620 $52 GO 620 $52\ ] 702 $7,615 GO 702 $7,615\ ] 922 $116,696 GO 922 $116,696\ ] 952 $188,480 GO 952 $188,480\ ]\ ]\ ]\ ]\ ]\ ]\ ]\ ]\ ]\ ]\ ]\ ]\ ]\ ]\ ]\ ]\ ]\ ]\ ]\ ]\ ]\ ]\ ]\ ]\ ]
Proposed MODS
Operation Number
Proposed Annual Workhours
Proposed All Supervisory WorkhoursLosing Facility
Current Annual Workhour Cost ($)
Proposed Annual Workhour Cost ($)
Proposed MODS
Operation Number
Proposed Annual Workhours
Proposed Annual Workhour Cost ($)
Current All Supervisory Workhours
Current Annual Workhour Cost ($)
Current Annual Workhours
Current MODS
Operation Number
Losing Facility Gaining Facility
TotalsOps-ReducingOps-Increasing
Ops-StayingAll Operations
Percent (%) Moved to Losing
(%) Reduction
Due to EoS
Percent (%) Moved to Gaining
(%) Reduction
Due to EoS
Current Annual Workhours
TotalsOps-ReducingOps-Increasing
Ops-StayingAll Operations
Gaining FacilityCurrent MODS
Operation Number
Package Page 24 AMP Other Curr vs Prop

\ ]\ ]\ ]\ ]\ ]\ ]\ ]\ ]\ ]\ ]\ ]\ ]\ ]\ ]\ ]\ ]\ ]\ ]\ ]\ ]\ ]\ ]\ ]\ ]\ ]\ ]\ ]\ ]\ ]\ ]\ ]\ ]\ ]\ ]\ ]\ ]\ ]\ ]\ ]\ ]\ ]\ ]\ ]\ ]\ ]\ ]\ ]\ ]\ ]\ ]\ ]\ ]\ ]\ ]\ ]\ ]\ ]\ ]\ ]\ ]\ ]\ ]\ ]\ ]\ ]\ ]\ ]\ ]\ ]\ ]\ ]\ ]\ ]\ ]
Package Page 25 AMP Other Curr vs Prop

\ ]\ ]\ ]\ ]\ ]\ ]\ ]\ ]\ ]\ ]\ ]\ ]\ ]
7,348 $391,983 0 $0 Ops-Red 314 $17,639 Ops-Red 0 $00 $0 118,177 $6,269,224 Ops-Inc 0 $0 Ops-Inc 124,562 $6,601,6620 $0 5,626 $312,843 Ops-Stay 0 $0 Ops-Stay 5,626 $312,843
7,348 $391,983 123,802 $6,582,067 AllOps 314 $17,639 AllOps 130,188 $6,914,505
781 100.0% 0.0% $16,480 \ ] 781 $276,802 TG 781 $0 781 $301,900783 100.0% 0.0% $15,232 \ ] 783 $709,571 TG 783 $0 783 $724,269785 100.0% 0.0% $61 \ ] 785 $0 TG 785 $0 785 $61784 $1,078 \ ] 784 $0 NI 784 $1,078 784 $0
\ ] 789 $135 GO 789 $135\ ]\ ]\ ]\ ]\ ]\ ]\ ]
1,239 $31,773 0 $0 Ops-Red 0 $0 Ops-Red 0 $00 $0 27,873 $986,373 Ops-Inc 0 $0 Ops-Inc 29,112 $1,026,230
28 $1,078 4 $135 Ops-Stay 28 $1,078 Ops-Stay 4 $1351,268 $32,850 27,876 $986,507 AllOps 28 $1,078 AllOps 29,115 $1,026,364
31 $26,075 31 $143,852 31 $0 31 $164,23532 $0 32 $0 32 $0 32 $033 $0 33 $0 33 $0 33 $034 $232,422 34 $1,901,060 34 $232,422 34 $1,901,06093 $0 93 $135 93 $0 93 $135Totals 6,270 $258,497 Totals 46,274 $2,045,047 Totals $232,422 Totals $2,065,430
$26,075 $143,383 $0 $163,766$232,422 $1,901,060 $232,422 $1,901,060
Proposed Annual Workhours
Proposed Annual Workhour Cost ($)
Transportation - PVS
LDC Proposed Annual Workhours LDC
Proposed MODS
Operation Number
Proposed Annual Workhours
Ops 765, 766 (34)
Proposed Annual Workhour Cost ($)
Transportation - PVS
Proposed Annual Workhour Cost ($)
Proposed MODS
Operation Number
Proposed Annual Workhours
Proposed Annual Workhour Cost ($)
TotalsOps-ReducingOps-Increasing
Ops-StayingAll Operations
(%) Reduction
Due to EoS
Current Annual Workhours
Current Annual Workhour Cost ($)
Transportation - PVS
TotalsOps-ReducingOps-Increasing
Ops-Staying
Ops-Reducing
Percent (%) Moved to Gaining
Losing Facility
Ops 617, 679, 764 (31)Subset for Trans-PVS
Tab
Losing Facility
Losing Facility Gaining Facility
Totals Ops-IncreasingOps-Staying
Totals
Ops 765, 766 (34)
Ops-Reducing
All Operations
Current Workhours for LDCs Common to & Shared between Supv & Craft Proposed Workhours for LDCs Common to & Shared between Supv & Craft
Current MODS
Operation Number
Gaining Facility
Gaining Facility
Ops 617, 679, 764 (31)Ops 765, 766 (34)
Ops 617, 679, 764 (31)
All Operations
Percent (%) Moved to Losing
Gaining Facility Losing Facility
Current Annual Workhour Cost ($)
LDC Current Annual Workhours
Current Annual Workhour Cost
($)
Current MODS
Operation Number
(%) Reduction
Due to EoS
Grouped Subtotals for Transportation, Maintenance, Supervision & Flow Adjustments, along with Facility and Combined Summaries
Ops-IncreasingOps-Staying
All Operations
Current Annual Workhours
Subset for Trans-PVS
TabOps 617, 679, 764 (31)
Transportation - PVS
LDC Current Annual Workhours
Current Annual Workhour Cost
($)
Ops 765, 766 (34)
Package Page 26 AMP Other Curr vs Prop

36 $507,871 36 $9,673,681 36 $0 36 $9,700,70237 $126,366 37 $2,048,298 37 $113,729 37 $2,061,47238 $229,147 38 $5,777,485 38 $190,192 38 $5,817,33239 $58,242 39 $913,844 39 $0 39 $973,84293 $15,232 93 $709,571 93 $0 93 $724,269Totals 20,485 $936,858 Totals 415,040 $19,122,880 Totals 7,002 $303,921 Totals 418,546 $19,277,617
01 $13,255 01 $116,696 01 $0 01 $116,69610 $187,125 10 $3,703,029 10 $0 10 $3,895,90620 $0 20 $0 20 $0 20 $030 $46,771 30 $371,623 30 $0 30 $418,45335 $123,477 35 $2,141,969 35 $17,639 35 $2,234,70140 $0 40 $0 40 $0 40 $050 $0 50 $0 50 $0 50 $060 $0 60 $0 60 $0 60 $070 $0 70 $0 70 $0 70 $080 $21,356 80 $248,750 80 $0 80 $248,75081 $0 81 $0 81 $0 81 $088 $0 88 $0 88 $0 88 $0Totals 7,348 $391,983 Totals 123,802 $6,582,067 Totals 314 $17,639 Totals 130,188 $6,914,505
Annual Workhours Annual Dollars Annual Workhours Annual Dollars Annual Workhours Annual Dollars % Change Dollars Change Percent Change
31,898 $1,591,297 0 $0 41,593 $1,581,665 30.4% ($9,633) -0.6%52,529 $2,302,940 0 $0 52,402 $2,297,248 -0.2% ($5,692) -0.2%
435,525 $20,059,738 0 $0 425,548 $19,581,538 -2.3% ($478,200) -2.4%131,150 $6,974,050 0 $0 130,502 $6,932,144 -0.5% ($41,905) -0.6%
10,325 $294,555 0 $0 10,325 $303,173 0.0% $8,618 2.9%661,427 $31,222,581 0 $0 660,370 $30,695,768 -0.2% ($526,813) -1.7%
LDC LDCChk >>> Chk >>>Chk >>> Chk >>>Chk >>> Chk >>> Before 36,054 $1,653,373 Before 625,372 $29,569,208Chk >>> Chk >>> After 12,978 $555,060 After 647,391 $30,140,708Chk >>> Chk >>> Adj 0 $0 Adj 0 $0Chk >>> Chk >>> AfterTot 12,978 $555,060 AfterTot 647,391 $30,140,708Chk >>> Chk >>> Change (23,076) ($1,098,313) Change 22,019 $571,501Chk >>> Chk >>> % Diff -64.0% -66.4% % Diff 3.5% 1.9%Chk >>> Chk >>>Chk >>> Chk >>>Chk >>> Chk >>>Chk >>> Chk >>>
Total Adj 0 $0 Total Adj 0 $0 Before 661,427 $31,222,581After 660,370 $30,695,768
Adj 0 $0AfterTot 660,370 $30,695,768Change (1,057) ($526,813)% Diff -0.2% -1.7%
Supervisory
LDC Proposed Annual Workhours
Proposed Annual Workhour Cost ($)
Proposed Annual Workhour Cost ($)LDC LDCCurrent Annual
Workhours
Current Annual Workhour Cost
($)
Maintenance
Proposed Annual Workhour Cost
($)
Special Adjustments at Gaining Site
Maintenance
Current Annual Workhour Cost
($)
Summary by Sub-GroupSpecial Adjustments -
Combined -
Gaining Facility SummaryProposed Annual Workhour Cost
($)
Proposed MODS
Operation Number
Combined Summary
Proposed Annual Workhours
Proposed Annual Workhour Cost
($)
Proposed Annual Workhour Cost
($)
Proposed Annual Workhours
Proposed MODS
Operation Number
Proposed Annual Workhours
LDC
Proposed Annual Workhours
Losing Facility Summary
Current Annual Workhours
Maintenance
Proposed Annual Workhour Cost ($)
Proposed Annual WorkhoursLDCProposed Annual
Workhours
Maintenance
Supervisor Summary Supervisor Summary
LDC Current Annual Workhours
Current Annual Workhour Cost
($)LDC Current Annual
Workhours
Current Annual Workhour Cost
($)
Supervisory
LDC Proposed Annual Workhours
Proposed Annual Workhour Cost ($)
Summary by FacilitySpecial Adjustments at Losing Site
0Supv/Craft Joint Ops (note 4)Total (1,057)
(127)(9,978)
(648)Maintenance Ops (note 3)
Transportation Ops (note 2)
ChangeProposed + Special Adjustments - Combined -Current - Combined
Workhour Change
9,696
4) less Ops going to 'Maintenance' Tabs
'Other Craft' Ops (note 1)
Notes:1) less Ops going to 'Trans-PVS' & 'Maintenance' Tabs
2) going to Trans-PVS tab3) going to Maintenance tab
Supervisory Ops
Package Page 27 AMP Other Curr vs Prop

Last Saved:
Losing Facility:Data Extraction Date: 11/07/11
(2) (3) (4) (5) (6)
Level Current Auth Staffing
Current On-Rolls
Proposed Staffing Difference
1 EAS-25 1 1 0 -1
2 EAS-22 1 1 0 -1
3 EAS-21 1 1 0 -1
4 EAS-20 1 1 0 -1
5 EAS-19 2 1 0 -1
6 EAS-19 1 1 0 -1
7 EAS-19 1 1 0 -1
8 EAS-18 1 1 0 -1
9 EAS-17 2 1 0 -1
10 EAS-17 11 8 0 -8
11 EAS-17 5 5 0 -5
12 EAS-17 2 2 0 -2
13 EAS-16 1 1 0 -1
14 EAS-12 1 1 0 -1
1516171819202122232425262728293031323334353637383940414243
Finance Number:
MGR MAINTENANCEMGR IN-PLANT SUPPORTMGR TRANSPORTATION/NETWORKSMGR DISTRIBUTION OPERATIONSMGR MAINTENANCE OPERATIONSMGR MAINTENANCE OPERATIONS SUPPT
SECRETARY (FLD)
Management Positions
OPERATIONS SUPPORT SPECIALISTOPERATIONS SUPPORT SPECIALISTSUPV DISTRIBUTION OPERATIONSSUPV MAINTENANCE OPERATIONS
Line
(1)
Position TitleMGR PROCESSING/DISTRIBUTION
Staffing - Management
388261
February 18, 2012
Toledo P&DC
SUPV TRANSPORTATION OPERATIONSNETWORKS SPECIALIST
Package Page 28 AMP Staffing - PCES/EAS
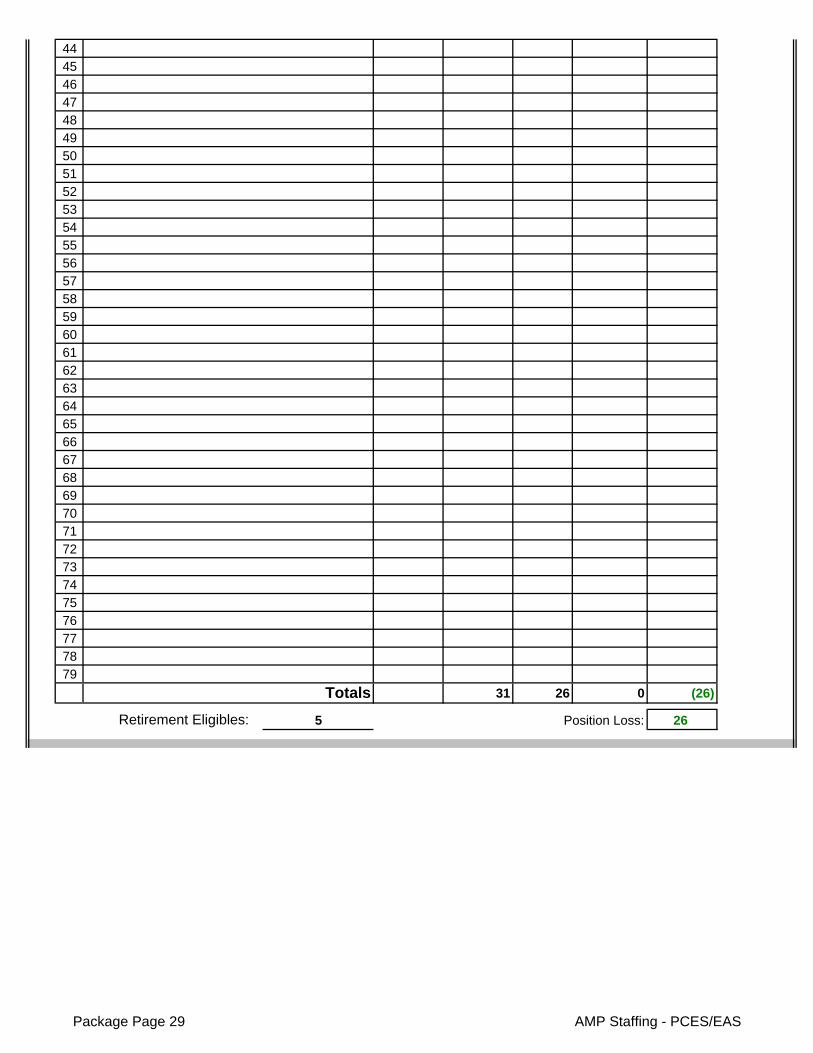
444546474849505152535455565758596061626364656667686970717273747576777879
31 26 0 (26)
Retirement Eligibles: 5 Position Loss: 26
Totals
Package Page 29 AMP Staffing - PCES/EAS
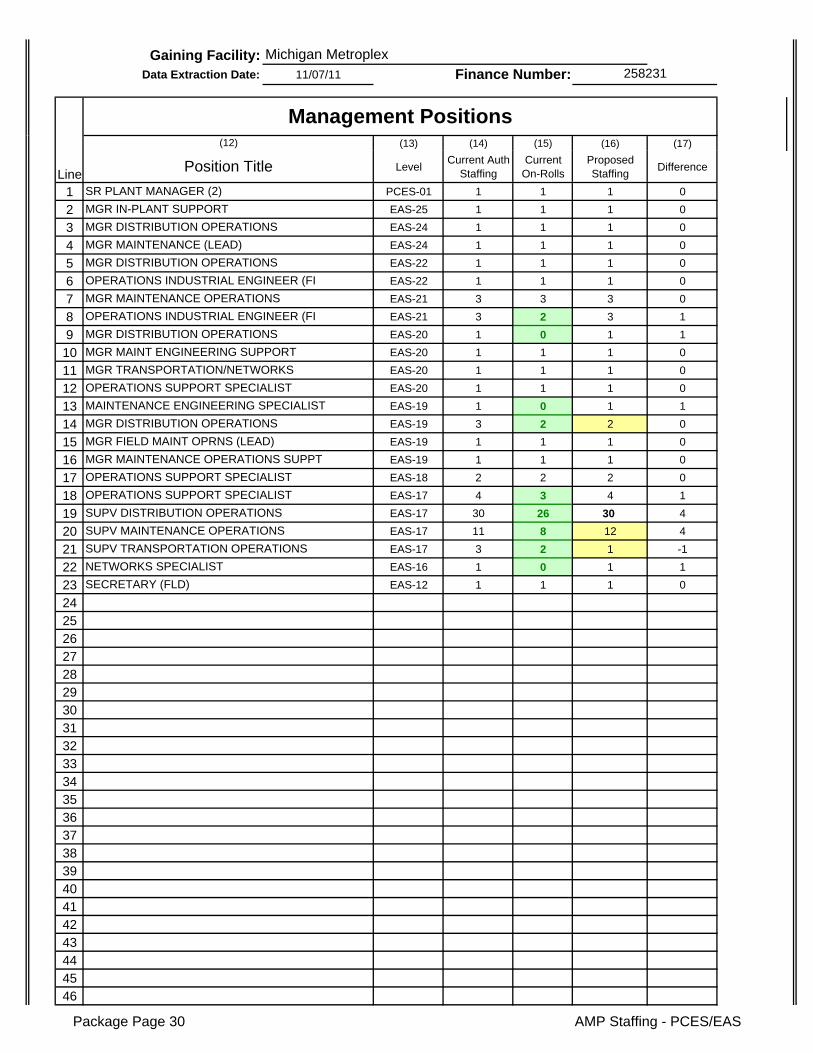
Gaining Facility:Data Extraction Date: 11/07/11
(13) (14) (15) (16) (17)
Level Current Auth Staffing
Current On-Rolls
Proposed Staffing Difference
1 PCES-01 1 1 1 0
2 EAS-25 1 1 1 0
3 EAS-24 1 1 1 0
4 EAS-24 1 1 1 0
5 EAS-22 1 1 1 0
6 EAS-22 1 1 1 0
7 EAS-21 3 3 3 0
8 EAS-21 3 2 3 1
9 EAS-20 1 0 1 1
10 EAS-20 1 1 1 0
11 EAS-20 1 1 1 0
12 EAS-20 1 1 1 0
13 EAS-19 1 0 1 1
14 EAS-19 3 2 2 0
15 EAS-19 1 1 1 0
16 EAS-19 1 1 1 0
17 EAS-18 2 2 2 0
18 EAS-17 4 3 4 1
19 EAS-17 30 26 30 4
20 EAS-17 11 8 12 4
21 EAS-17 3 2 1 -1
22 EAS-16 1 0 1 1
23 EAS-12 1 1 1 0
2425262728293031323334353637383940414243444546
NETWORKS SPECIALISTSECRETARY (FLD)
OPERATIONS SUPPORT SPECIALISTSUPV DISTRIBUTION OPERATIONSSUPV MAINTENANCE OPERATIONSSUPV TRANSPORTATION OPERATIONS
MGR DISTRIBUTION OPERATIONSMGR FIELD MAINT OPRNS (LEAD)MGR MAINTENANCE OPERATIONS SUPPTOPERATIONS SUPPORT SPECIALIST
MGR MAINT ENGINEERING SUPPORTMGR TRANSPORTATION/NETWORKSOPERATIONS SUPPORT SPECIALISTMAINTENANCE ENGINEERING SPECIALIST
OPERATIONS INDUSTRIAL ENGINEER (FIMGR MAINTENANCE OPERATIONSOPERATIONS INDUSTRIAL ENGINEER (FIMGR DISTRIBUTION OPERATIONS
MGR IN-PLANT SUPPORTMGR DISTRIBUTION OPERATIONSMGR MAINTENANCE (LEAD)MGR DISTRIBUTION OPERATIONS
SR PLANT MANAGER (2)Line Position Title
(12)
Management Positions
Finance Number: 258231Michigan Metroplex
Package Page 30 AMP Staffing - PCES/EAS
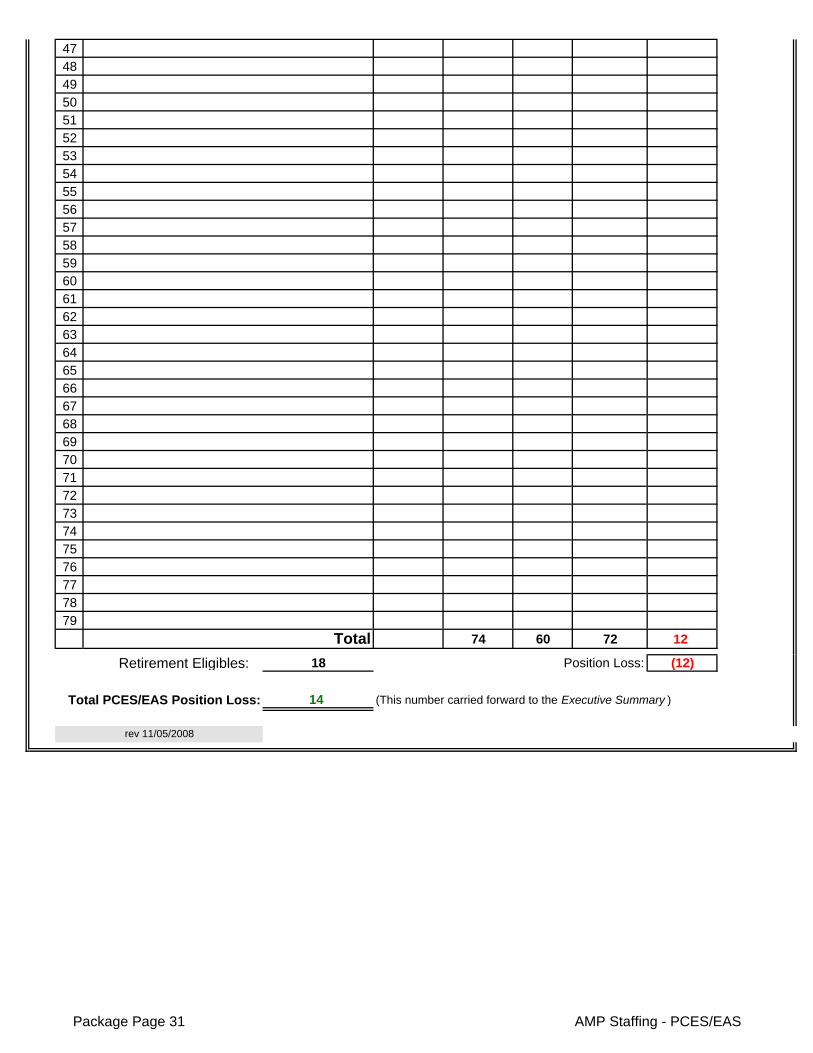
474849505152535455565758596061626364656667686970717273747576777879
74 60 72 12
Retirement Eligibles: 18 Position Loss: (12)
14
Total
rev 11/05/2008
Total PCES/EAS Position Loss: (This number carried forward to the Executive Summary )
Package Page 31 AMP Staffing - PCES/EAS
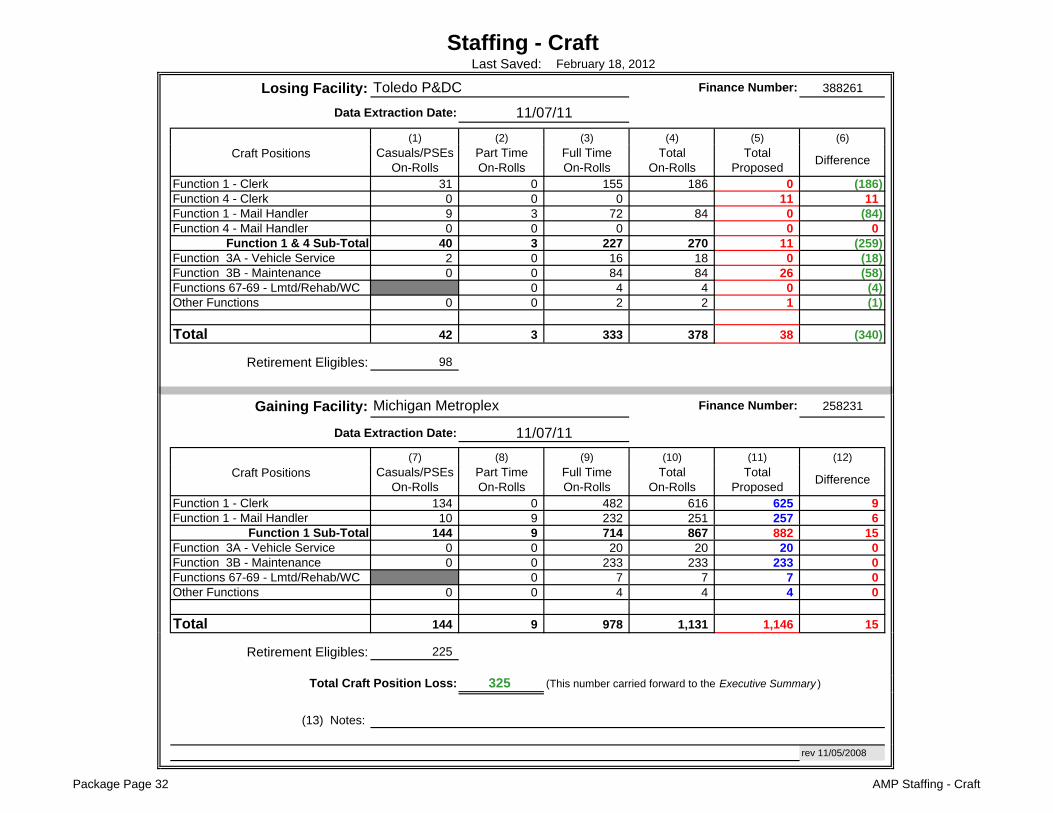
Losing Facility: 388261
(1) (2) (3) (4) (5) (6)Craft Positions
Function 1 - Clerk 31 0 155 186 0 (186)Function 4 - Clerk 0 0 0 11 11Function 1 - Mail Handler 9 3 72 84 0 (84)Function 4 - Mail Handler 0 0 0 0 0
Function 1 & 4 Sub-Total 40 3 227 270 11 (259)Function 3A - Vehicle Service 2 0 16 18 0 (18)Function 3B - Maintenance 0 0 84 84 26 (58)Functions 67-69 - Lmtd/Rehab/WC 0 4 4 0 (4)Other Functions 0 0 2 2 1 (1)
Total 42 3 333 378 38 (340)
Retirement Eligibles: 98
Gaining Facility: 258231
(7) (8) (9) (10) (11) (12)Craft Positions
Function 1 - Clerk 134 0 482 616 625 9Function 1 - Mail Handler 10 9 232 251 257 6
Function 1 Sub-Total 144 9 714 867 882 15Function 3A - Vehicle Service 0 0 20 20 20 0Function 3B - Maintenance 0 0 233 233 233 0Functions 67-69 - Lmtd/Rehab/WC 0 7 7 7 0Other Functions 0 0 4 4 4 0
Total 144 9 978 1,131 1,146 15
Retirement Eligibles: 225
325
(13) Notes:
rev 11/05/2008
Total On-Rolls
(This number carried forward to the Executive Summary )
Casuals/PSEs On-Rolls
Data Extraction Date:
Toledo P&DC
Part Time On-Rolls
Full Time On-Rolls
Staffing - Craft
Difference
Difference
Last Saved: February 18, 2012
Data Extraction Date: 11/07/11
Casuals/PSEs On-Rolls
11/07/11
Total Proposed
Finance Number:
Michigan Metroplex Finance Number:
Total Craft Position Loss:
Total Proposed
Part Time On-Rolls
Full Time On-Rolls
Total On-Rolls
Package Page 32 AMP Staffing - Craft

Losing Facility: Gaining Facility:
Date Range of Data: :
(1) (2) (3) (4) (5) (6)
Workhour Activity Current Cost Proposed Cost Difference Workhour Activity Current Cost Proposed Cost Difference
LDC 36 Mail Processing Equipment $ 507,871 $ 0 $ (507,871) LDC 36 Mail Processing
Equipment $ 9,673,681 $ 9,700,702 $ 27,021
LDC 37 Building Equipment $ 126,366 $ 113,729 $ (12,637) LDC 37 Building Equipment $ 2,048,298 $ 2,061,472 $ 13,173
LDC 38 Building Services (Custodial Cleaning)
$ 229,147 $ 190,192 $ (38,955) LDC 38 Building Services (Custodial Cleaning)
$ 5,777,485 $ 5,817,332 $ 39,846
LDC 39 Maintenance Operations Support $ 58,242 $ 0 $ (58,242) LDC 39 Maintenance
Operations Support $ 913,844 $ 973,842 $ 59,998
LDC 93 Maintenance Training $ 15,232 $ 0 $ (15,232) LDC 93 Maintenance
Training $ 709,571 $ 724,269 $ 14,698
Workhour Cost Subtotal $ 936,858 $ 303,921 $ (632,937) Workhour Cost Subtotal $ 19,122,880 $ 19,277,617 $ 154,737
Other Related Maintenance & Facility Costs Current Cost Proposed Cost Difference Other Related Maintenance &
Facility Costs Current Cost Proposed Cost Difference
Total Maintenance Parts, Supplies & Facility Utilities $ 694,792 $ 232,038 $ (462,754) Total Maintenance Parts, Supplies &
Facility Utilities $ 3,707,373 $ 4,078,110 $ 370,737
Adjustments (from "Other Curr vs Prop" tab)
$ 0 Adjustments (from "Other Curr vs Prop" tab)
$ 0
Grand Total $ 1,631,650 $ 535,959 $ (1,095,691) Grand Total $ 22,830,253 $ 23,355,727 $ 525,474
$570,217 (This number carried forward to the Executive Summary )
(7) Notes:
Annual Maintenance Savings:
rev 04/13/2009
MaintenanceLast Saved:
Toledo P&DC Michigan MetroplexFebruary 18, 2012
Oct-01-2010 Sep-30-2011
Package Page 33 AMP Maintenance
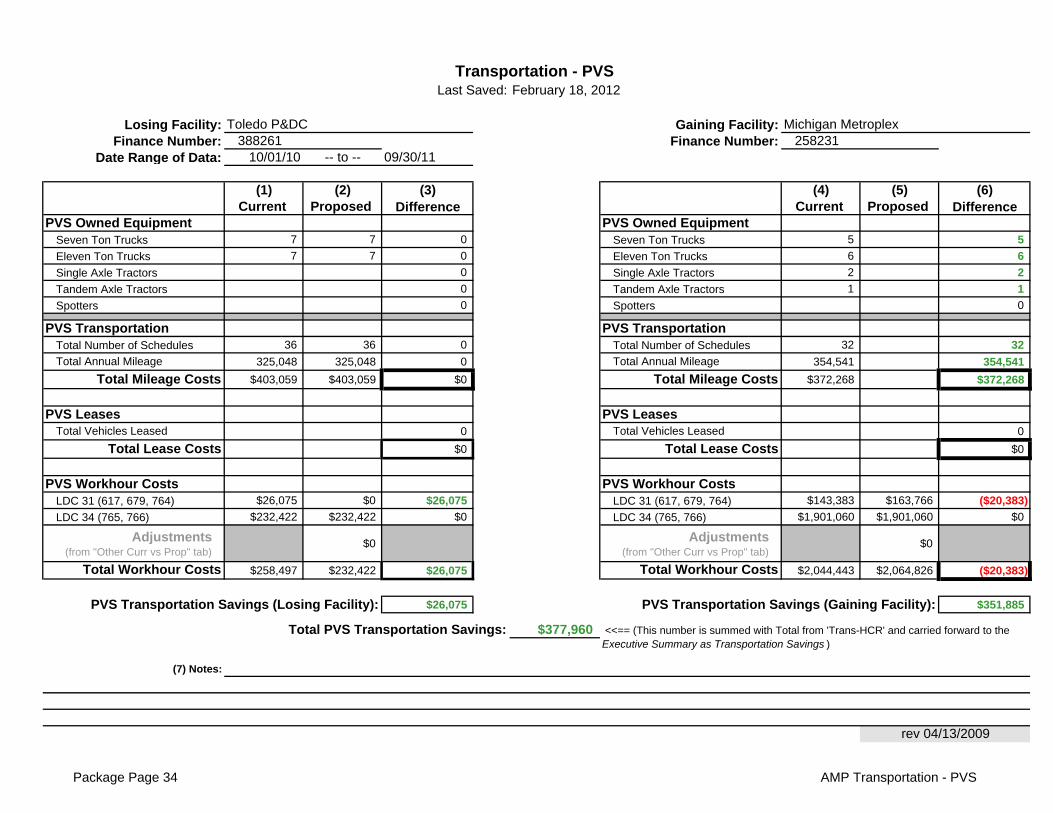
Losing Facility: Gaining Facility:Finance Number: Finance Number:
Date Range of Data: 10/01/10 -- to -- 09/30/11
(1) (2) (3) (4) (5) (6)Current Proposed Difference Current Proposed Difference
PVS Owned Equipment PVS Owned EquipmentSeven Ton Trucks 7 7 0 Seven Ton Trucks 5 5Eleven Ton Trucks 7 7 0 Eleven Ton Trucks 6 6Single Axle Tractors 0 Single Axle Tractors 2 2Tandem Axle Tractors 0 Tandem Axle Tractors 1 1Spotters 0 Spotters 0
PVS Transportation PVS TransportationTotal Number of Schedules 36 36 0 Total Number of Schedules 32 32Total Annual Mileage 325,048 325,048 0 Total Annual Mileage 354,541 354,541
Total Mileage Costs $403,059 $403,059 $0 Total Mileage Costs $372,268 $372,268
PVS Leases PVS LeasesTotal Vehicles Leased 0 Total Vehicles Leased 0
Total Lease Costs $0 Total Lease Costs $0
PVS Workhour Costs PVS Workhour CostsLDC 31 (617, 679, 764) $26,075 $0 $26,075 LDC 31 (617, 679, 764) $143,383 $163,766 ($20,383)LDC 34 (765, 766) $232,422 $232,422 $0 LDC 34 (765, 766) $1,901,060 $1,901,060 $0
Adjustments (from "Other Curr vs Prop" tab)
$0 Adjustments (from "Other Curr vs Prop" tab)
$0
Total Workhour Costs $258,497 $232,422 $26,075 Total Workhour Costs $2,044,443 $2,064,826 ($20,383)
PVS Transportation Savings (Losing Facility): $26,075 PVS Transportation Savings (Gaining Facility): $351,885
$377,960
(7) Notes:
Transportation - PVS
Toledo P&DC Michigan Metroplex
Last Saved: February 18, 2012
Total PVS Transportation Savings:
388261 258231
<<== (This number is summed with Total from 'Trans-HCR' and carried forward to the Executive Summary as Transportation Savings )
rev 04/13/2009
Package Page 34 AMP Transportation - PVS
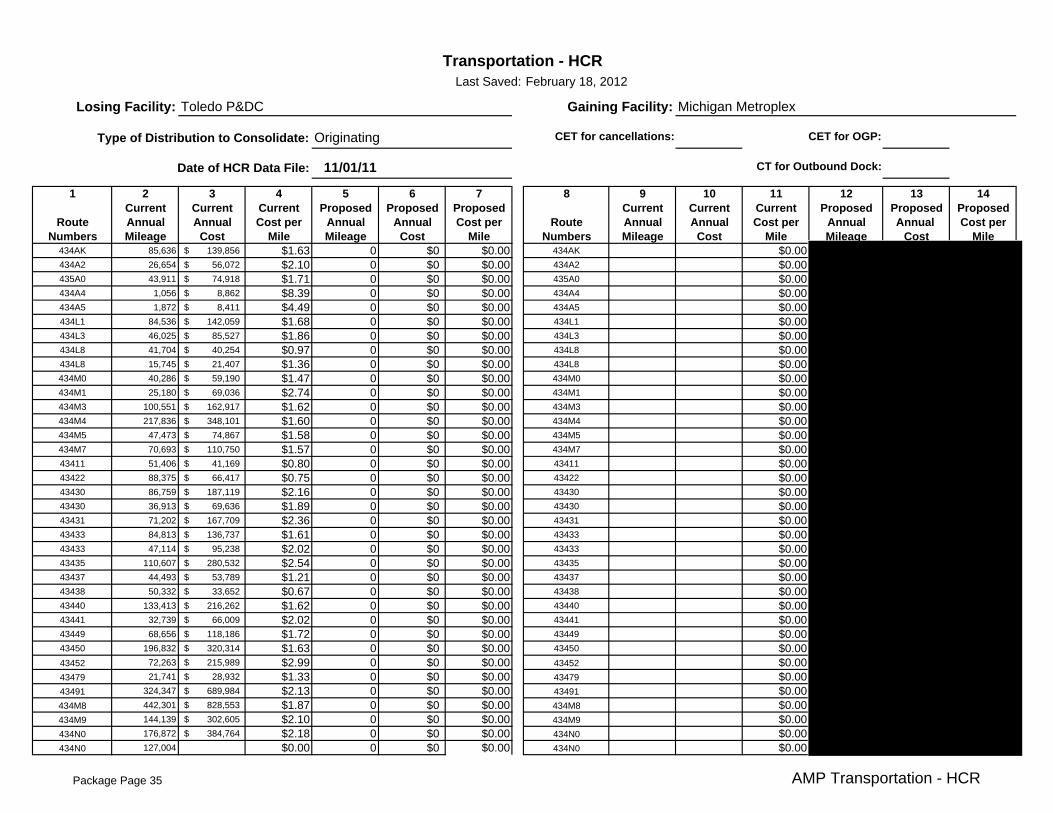
1 2 3 4 5 6 7 8 9 10 11 12 13 14Current Current Current Proposed Proposed Proposed Current Current Current Proposed Proposed Proposed
Route Annual Annual Cost per Annual Annual Cost per Route Annual Annual Cost per Annual Annual Cost perNumbers Mileage Cost Mile Mileage Cost Mile Numbers Mileage Cost Mile Mileage Cost Mile
434AK 85,636 139,856$ $1.63 0 $0 $0.00 434AK $0.00434A2 26,654 56,072$ $2.10 0 $0 $0.00 434A2 $0.00435A0 43,911 74,918$ $1.71 0 $0 $0.00 435A0 $0.00434A4 1,056 8,862$ $8.39 0 $0 $0.00 434A4 $0.00434A5 1,872 8,411$ $4.49 0 $0 $0.00 434A5 $0.00434L1 84,536 142,059$ $1.68 0 $0 $0.00 434L1 $0.00434L3 46,025 85,527$ $1.86 0 $0 $0.00 434L3 $0.00434L8 41,704 40,254$ $0.97 0 $0 $0.00 434L8 $0.00434L8 15,745 21,407$ $1.36 0 $0 $0.00 434L8 $0.00434M0 40,286 59,190$ $1.47 0 $0 $0.00 434M0 $0.00434M1 25,180 69,036$ $2.74 0 $0 $0.00 434M1 $0.00434M3 100,551 162,917$ $1.62 0 $0 $0.00 434M3 $0.00434M4 217,836 348,101$ $1.60 0 $0 $0.00 434M4 $0.00434M5 47,473 74,867$ $1.58 0 $0 $0.00 434M5 $0.00434M7 70,693 110,750$ $1.57 0 $0 $0.00 434M7 $0.0043411 51,406 41,169$ $0.80 0 $0 $0.00 43411 $0.0043422 88,375 66,417$ $0.75 0 $0 $0.00 43422 $0.0043430 86,759 187,119$ $2.16 0 $0 $0.00 43430 $0.0043430 36,913 69,636$ $1.89 0 $0 $0.00 43430 $0.0043431 71,202 167,709$ $2.36 0 $0 $0.00 43431 $0.0043433 84,813 136,737$ $1.61 0 $0 $0.00 43433 $0.0043433 47,114 95,238$ $2.02 0 $0 $0.00 43433 $0.0043435 110,607 280,532$ $2.54 0 $0 $0.00 43435 $0.0043437 44,493 53,789$ $1.21 0 $0 $0.00 43437 $0.0043438 50,332 33,652$ $0.67 0 $0 $0.00 43438 $0.0043440 133,413 216,262$ $1.62 0 $0 $0.00 43440 $0.0043441 32,739 66,009$ $2.02 0 $0 $0.00 43441 $0.0043449 68,656 118,186$ $1.72 0 $0 $0.00 43449 $0.0043450 196,832 320,314$ $1.63 0 $0 $0.00 43450 $0.0043452 72,263 215,989$ $2.99 0 $0 $0.00 43452 $0.0043479 21,741 28,932$ $1.33 0 $0 $0.00 43479 $0.0043491 324,347 689,984$ $2.13 0 $0 $0.00 43491 $0.00434M8 442,301 828,553$ $1.87 0 $0 $0.00 434M8 $0.00434M9 144,139 302,605$ $2.10 0 $0 $0.00 434M9 $0.00434N0 176,872 384,764$ $2.18 0 $0 $0.00 434N0 $0.00434N0 127,004 $0.00 0 $0 $0.00 434N0 $0.00
Transportation - HCR
Originating
11/01/11
CET for OGP:
CT for Outbound Dock:
Type of Distribution to Consolidate:
Date of HCR Data File:
CET for cancellations:
Last Saved: February 18, 2012
Losing Facility: Toledo P&DC Michigan MetroplexGaining Facility:
Package Page 35 AMP Transportation - HCR

1 2 3 4 5 6 7 8 9 10 11 12 13 14Current Current Current Proposed Proposed Proposed Current Current Current Proposed Proposed Proposed
Route Annual Annual Cost per Annual Annual Cost per Route Annual Annual Cost per Annual Annual Cost perNumbers Mileage Cost Mile Mileage Cost Mile Numbers Mileage Cost Mile Mileage Cost Mile
434N1 233,926 443,744$ $1.90 434N1 $0.00 0 $0 $0.00434N1 62,151 $0.00 434N1 $0.00 0 $0 $0.00434N5 237,642 420,015$ $1.77 434N5 $0.00 0 $0 $0.00434N5 177,350 434,696$ $2.45 434N5 $0.00 0 $0 $0.0043015 367,980 694,773$ $1.8943028 542,492 1,128,470$ $2.08430Q0 130,658 193,141$ $1.4811737 442,795 853,674$ $1.93150Y0 607,047 1,245,735$ $2.05303YE 2,038,532 3,187,818$ $1.56448B1 61,414 81,508$ $1.3345018 332,699 658,003$ $1.98453M3 108,698 167,718$ $1.54465Y0 468,698 770,490$ $1.64467Y0 354,160 564,905$ $1.6046790 337,777 612,716$ $1.81486Y0 221,241 350,283$ $1.58480L0 214,954 335,732$ $1.56481L1 724,889 1,194,823$ $1.65530L7 798,014 1,393,341$ $1.75
Package Page 36 AMP Transportation - HCR
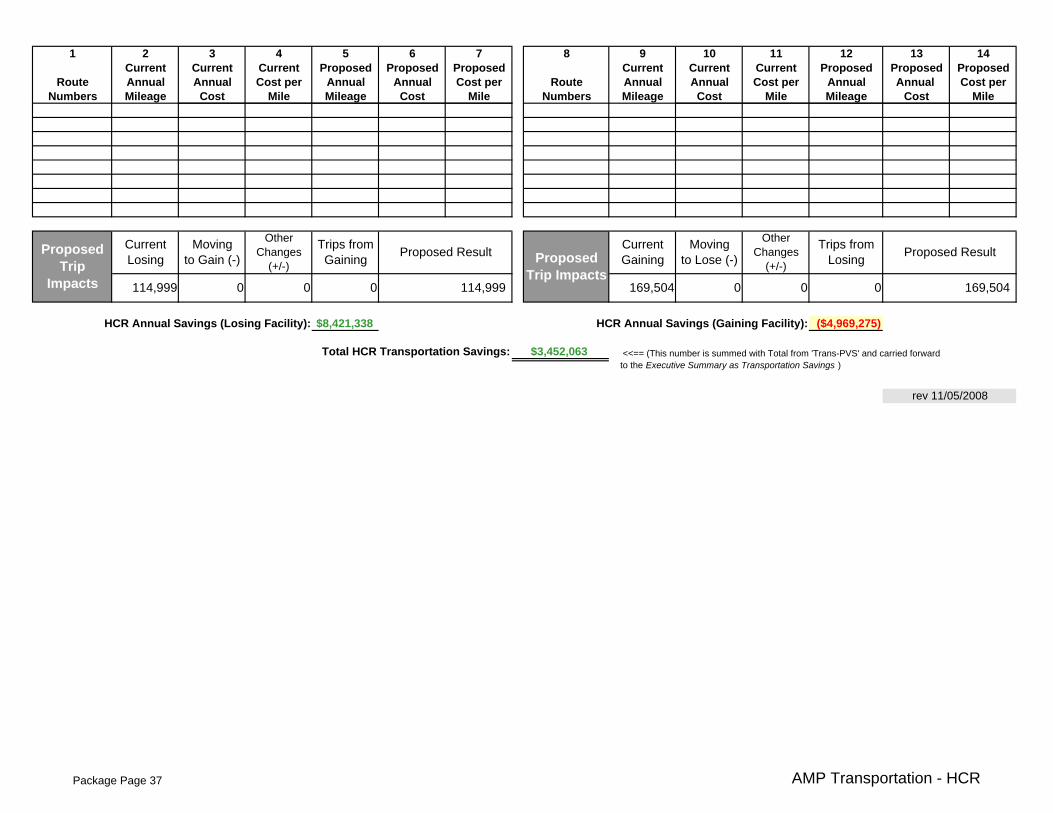
1 2 3 4 5 6 7 8 9 10 11 12 13 14Current Current Current Proposed Proposed Proposed Current Current Current Proposed Proposed Proposed
Route Annual Annual Cost per Annual Annual Cost per Route Annual Annual Cost per Annual Annual Cost perNumbers Mileage Cost Mile Mileage Cost Mile Numbers Mileage Cost Mile Mileage Cost Mile
$8,421,338 ($4,969,275)
Total HCR Transportation Savings:
Other Changes
(+/-)
114,999 169,504
Moving to Gain (-)
Proposed Trip
Impacts
Current Losing Proposed ResultTrips from
Gaining
Other Changes
(+/-)
HCR Annual Savings (Losing Facility): HCR Annual Savings (Gaining Facility):
Proposed Trip Impacts
114,999 0 0 0 0
rev 11/05/2008
Current Gaining
$3,452,063
169,5040
Proposed ResultTrips from Losing
0
Moving to Lose (-)
<<== (This number is summed with Total from 'Trans-PVS' and carried forward to the Executive Summary as Transportation Savings )
Package Page 37 AMP Transportation - HCR
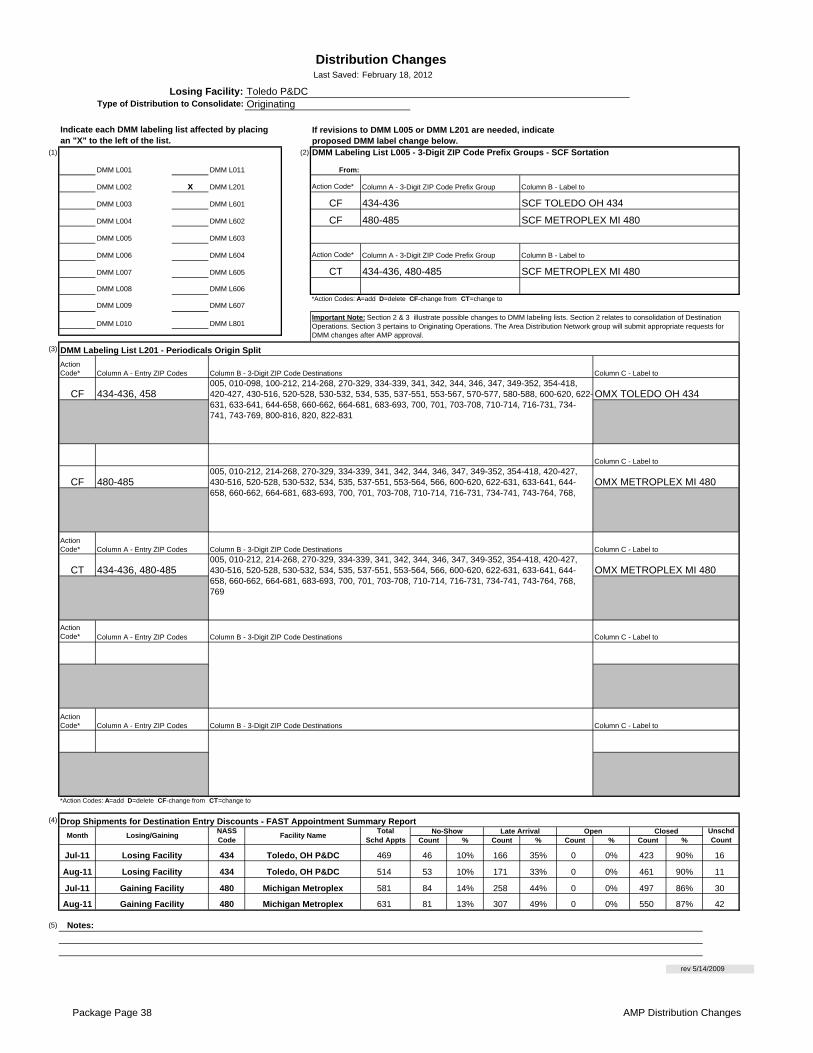
Originating
(1) (2)
DMM L011 From:
x DMM L201 Action Code* Column A - 3-Digit ZIP Code Prefix Group
DMM L601 CF
DMM L602 CF
DMM L603
DMM L604 Action Code* Column A - 3-Digit ZIP Code Prefix Group
DMM L605 CTDMM L606
DMM L607
DMM L801
(3)
Action Code*
CF
CF
Action Code*
CT
Action Code*
Action Code*
(4)
Count % Count % Count % Count %
Jul-11 434 469 46 10% 166 35% 0 0% 423 90% 16
Aug-11 434 514 53 10% 171 33% 0 0% 461 90% 11
Jul-11 480 581 84 14% 258 44% 0 0% 497 86% 30
Aug-11 480 631 81 13% 307 49% 0 0% 550 87% 42
(5) Notes:
434-436, 480-485005, 010-212, 214-268, 270-329, 334-339, 341, 342, 344, 346, 347, 349-352, 354-418, 420-427, 430-516, 520-528, 530-532, 534, 535, 537-551, 553-564, 566, 600-620, 622-631, 633-641, 644-658, 660-662, 664-681, 683-693, 700, 701, 703-708, 710-714, 716-731, 734-741, 743-764, 768, 769
OMX METROPLEX MI 480
480-485005, 010-212, 214-268, 270-329, 334-339, 341, 342, 344, 346, 347, 349-352, 354-418, 420-427, 430-516, 520-528, 530-532, 534, 535, 537-551, 553-564, 566, 600-620, 622-631, 633-641, 644-658, 660-662, 664-681, 683-693, 700, 701, 703-708, 710-714, 716-731, 734-741, 743-764, 768,
OMX METROPLEX MI 480
Column A - Entry ZIP Codes Column B - 3-Digit ZIP Code Destinations Column C - Label to
434-436, 458005, 010-098, 100-212, 214-268, 270-329, 334-339, 341, 342, 344, 346, 347, 349-352, 354-418, 420-427, 430-516, 520-528, 530-532, 534, 535, 537-551, 553-567, 570-577, 580-588, 600-620, 622-631, 633-641, 644-658, 660-662, 664-681, 683-693, 700, 701, 703-708, 710-714, 716-731, 734-741, 743-769, 800-816, 820, 822-831
OMX TOLEDO OH 434
Column C - Label to
DMM Labeling List L201 - Periodicals Origin Split
Column A - Entry ZIP Codes Column B - 3-Digit ZIP Code Destinations Column C - Label to
Gaining Facility Michigan Metroplex
Gaining Facility Michigan Metroplex
Unschd Count
Losing Facility Toledo, OH P&DC
Losing Facility Toledo, OH P&DC
No-Show Late Arrival Open Closed
*Action Codes: A=add D=delete CF-change from CT=change to
Column B - Label to
rev 5/14/2009
Drop Shipments for Destination Entry Discounts - FAST Appointment Summary ReportMonth Losing/Gaining NASS
Code Facility Name Total Schd Appts
DMM Labeling List L005 - 3-Digit ZIP Code Prefix Groups - SCF Sortation
434-436
Column B - Label to
SCF TOLEDO OH 434
Distribution Changes
Indicate each DMM labeling list affected by placing an "X" to the left of the list.
Losing Facility:Type of Distribution to Consolidate:
If revisions to DMM L005 or DMM L201 are needed, indicate proposed DMM label change below.
Last Saved: February 18, 2012
Toledo P&DC
DMM L003
DMM L004 SCF METROPLEX MI 480
DMM L001
DMM L002
480-485
SCF METROPLEX MI 480
DMM L009
DMM L010
DMM L005
DMM L006
DMM L007
DMM L008
434-436, 480-485
Column C - Label to
*Action Codes: A=add D=delete CF-change from CT=change to
Important Note: Section 2 & 3 illustrate possible changes to DMM labeling lists. Section 2 relates to consolidation of Destination Operations. Section 3 pertains to Originating Operations. The Area Distribution Network group will submit appropriate requests for DMM changes after AMP approval.
Column A - Entry ZIP Codes Column B - 3-Digit ZIP Code Destinations Column C - Label to
Column A - Entry ZIP Codes Column B - 3-Digit ZIP Code Destinations
Package Page 38 AMP Distribution Changes
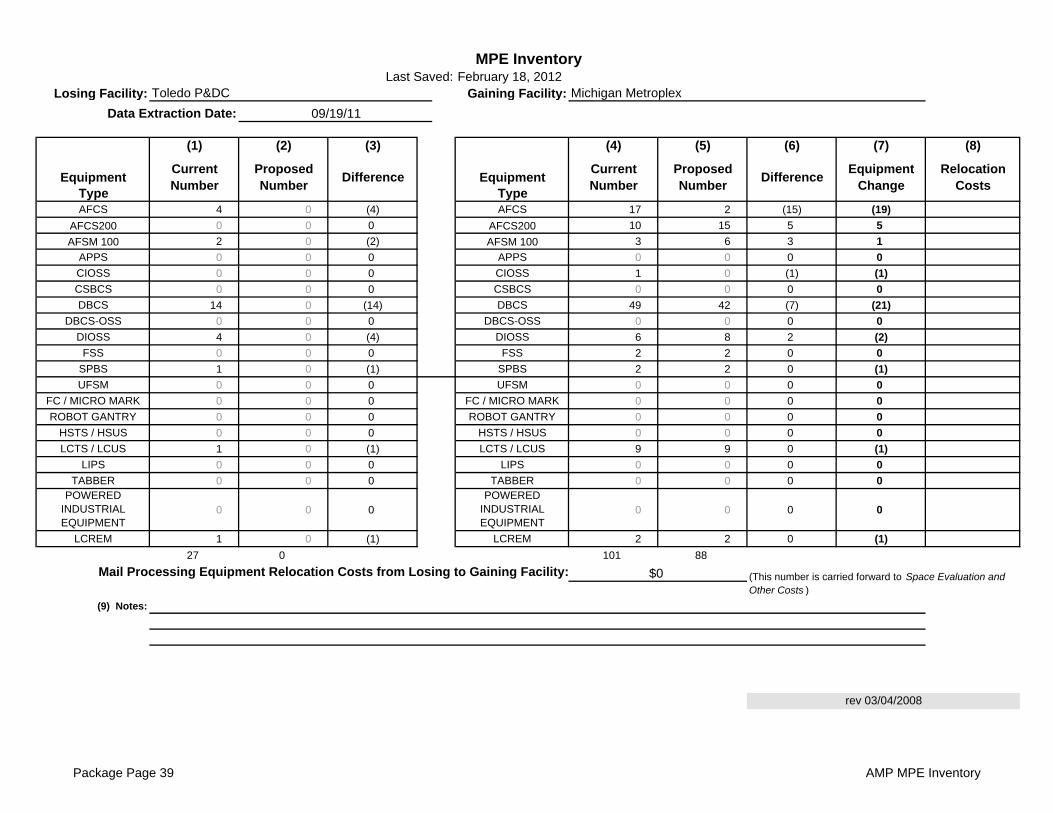
Losing Facility: Gaining Facility:
(1) (2) (3) (4) (5) (6) (7) (8)
Equipment EquipmentType TypeAFCS 4 0 (4) AFCS 17 2 (15) (19)
AFCS200 0 0 0 AFCS200 10 15 5 5AFSM 100 2 0 (2) AFSM 100 3 6 3 1
APPS 0 0 0 APPS 0 0 0 0CIOSS 0 0 0 CIOSS 1 0 (1) (1)CSBCS 0 0 0 CSBCS 0 0 0 0DBCS 14 0 (14) DBCS 49 42 (7) (21)
DBCS-OSS 0 0 0 DBCS-OSS 0 0 0 0DIOSS 4 0 (4) DIOSS 6 8 2 (2)
FSS 0 0 0 FSS 2 2 0 0SPBS 1 0 (1) SPBS 2 2 0 (1)UFSM 0 0 0 UFSM 0 0 0 0
FC / MICRO MARK 0 0 0 FC / MICRO MARK 0 0 0 0ROBOT GANTRY 0 0 0 ROBOT GANTRY 0 0 0 0
HSTS / HSUS 0 0 0 HSTS / HSUS 0 0 0 0LCTS / LCUS 1 0 (1) LCTS / LCUS 9 9 0 (1)
LIPS 0 0 0 LIPS 0 0 0 0TABBER 0 0 0 TABBER 0 0 0 0
POWERED INDUSTRIAL EQUIPMENT
0 0 0POWERED
INDUSTRIAL EQUIPMENT
0 0 0 0
LCREM 1 0 (1) LCREM 2 2 0 (1)27 0 101 88
(9) Notes:
Data Extraction Date:
Proposed Number
February 18, 2012MPE Inventory
Toledo P&DC Michigan Metroplex
Current Number Difference Equipment
ChangeRelocation
Costs
Last Saved:
Current Number
rev 03/04/2008
(This number is carried forward to Space Evaluation and Other Costs )
Proposed NumberDifference
Mail Processing Equipment Relocation Costs from Losing to Gaining Facility: $0
09/19/11
Package Page 39 AMP MPE Inventory
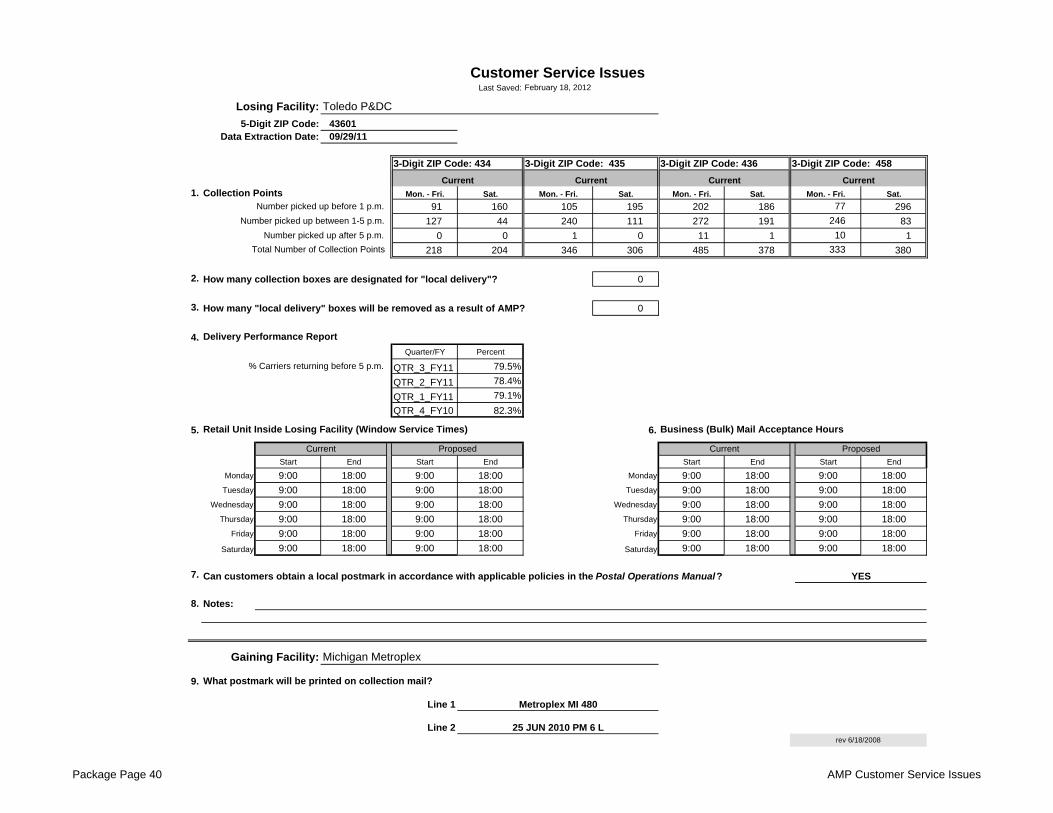
Last Saved:
3-Digit ZIP Code: 435 3-Digit ZIP Code: 436
1. Collection Points Mon. - Fri. Sat. Mon. - Fri. Sat. Mon. - Fri. Sat. Sat.91 160 105 195 202 186 296
127 44 240 111 272 191 830 0 1 0 11 1 1
218 204 346 306 485 378 380
2. How many collection boxes are designated for "local delivery"? 0
3. How many "local delivery" boxes will be removed as a result of AMP? 0
4.Quarter/FY Percent
QTR_3_FY11 79.5%QTR_2_FY11 78.4%QTR_1_FY11 79.1%QTR_4_FY10 82.3%
5. 6.
Start End Start End Start End Start End
Monday 9:00 18:00 9:00 18:00 Monday 9:00 18:00 9:00 18:00Tuesday 9:00 18:00 9:00 18:00 Tuesday 9:00 18:00 9:00 18:00
Wednesday 9:00 18:00 9:00 18:00 Wednesday 9:00 18:00 9:00 18:00Thursday 9:00 18:00 9:00 18:00 Thursday 9:00 18:00 9:00 18:00
Friday 9:00 18:00 9:00 18:00 Friday 9:00 18:00 9:00 18:00Saturday 9:00 18:00 9:00 18:00 Saturday 9:00 18:00 9:00 18:00
7.
8. Notes:
9.
Line 1
Line 2
Number picked up before 1 p.m.
Business (Bulk) Mail Acceptance Hours
Michigan Metroplex
YES
333
24610
Losing Facility:5-Digit ZIP Code:
Data Extraction Date:
3-Digit ZIP Code: 434
Mon. - Fri.77
Customer Service Issues
Current Proposed
Number picked up after 5 p.m. Number picked up between 1-5 p.m.
Total Number of Collection Points
Delivery Performance Report
Retail Unit Inside Losing Facility (Window Service Times)
3-Digit ZIP Code: 458Current
rev 6/18/2008
43601
Can customers obtain a local postmark in accordance with applicable policies in the Postal Operations Manual?
Gaining Facility:
What postmark will be printed on collection mail?
Proposed
% Carriers returning before 5 p.m.
25 JUN 2010 PM 6 L
February 18, 2012
Toledo P&DC
09/29/11
Current CurrentCurrent
Current
Metroplex MI 480
Package Page 40 AMP Customer Service Issues
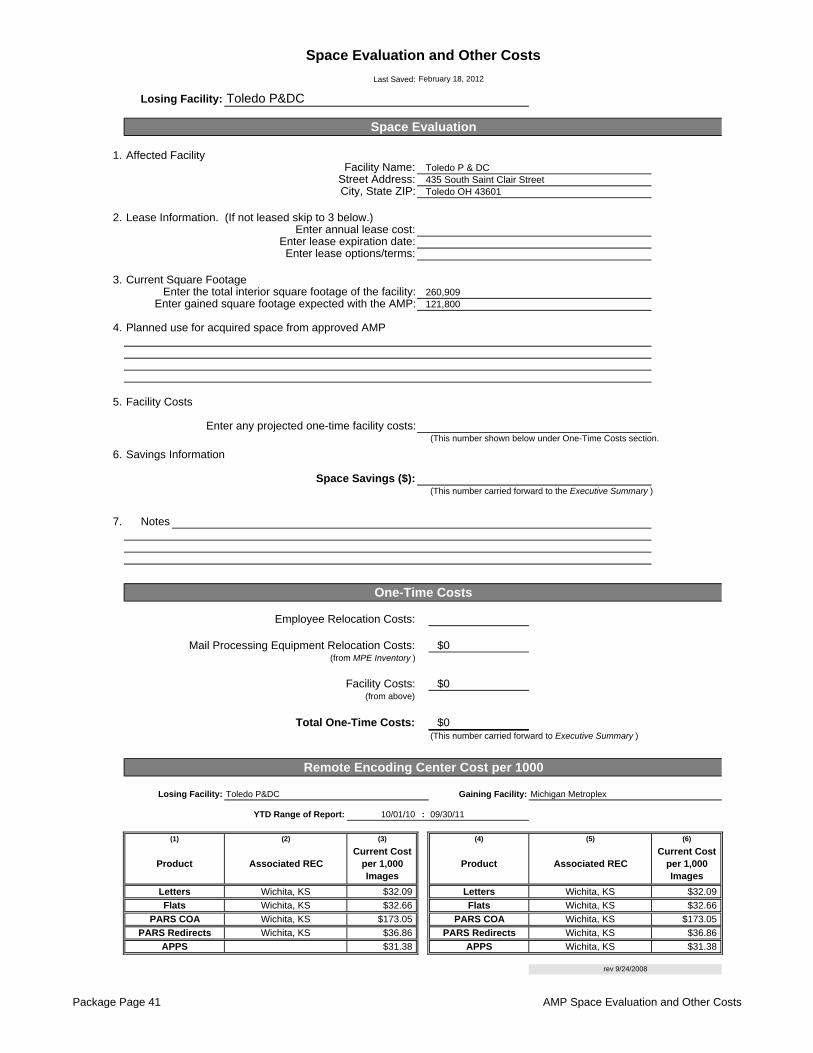
Last Saved:
1.
2. Lease Information. (If not leased skip to 3 below.)
3.
4. Planned use for acquired space from approved AMP
5. Facility Costs
(This number shown below under One-Time Costs section.
6. Savings Information
(This number carried forward to the Executive Summary )
7. Notes
(This number carried forward to Executive Summary )
10/01/10 :
(3) (6)
$32.09 $32.09$32.66 $32.66
$173.05 $173.05$36.86 $36.86$31.38 $31.38APPS
Wichita, KS PARS Redirects Wichita, KSPARS Redirects
Total One-Time Costs:
Remote Encoding Center Cost per 1000
Current Cost per 1,000 Images
FlatsPARS COA
FlatsLetters
PARS COA
(5)
Product Associated REC
(4)
Wichita, KSWichita, KS
Enter annual lease cost:
Enter the total interior square footage of the facility:Enter gained square footage expected with the AMP:
Enter lease options/terms:
Current Square Footage
Enter lease expiration date:
(from above)
260,909121,800
Enter any projected one-time facility costs:
Letters
Gaining Facility:
Current Cost per 1,000 Images
Losing Facility:
(1)
Product
(2)
Wichita, KS
Associated REC
Mail Processing Equipment Relocation Costs: (from MPE Inventory )
Space Savings ($):
One-Time Costs
Employee Relocation Costs:
$0
Space Evaluation and Other Costs
Street Address:City, State ZIP:
Losing Facility:
Space Evaluation
Affected FacilityFacility Name:
February 18, 2012
Toledo P&DC
Toledo P & DC
rev 9/24/2008
Toledo P&DC Michigan Metroplex
09/30/11YTD Range of Report:
Wichita, KS
APPS Wichita, KS
Wichita, KSWichita, KS
$0
$0
435 South Saint Clair StreetToledo OH 43601
Facility Costs:
Package Page 41 AMP Space Evaluation and Other Costs