executive summary widget corporation erie, pennsylvannia · executive summary widget corporation...
TRANSCRIPT
EXECUTIVE SUMMARY
WIDGET CORPORATION ERIE, PENNSYLVANNIA
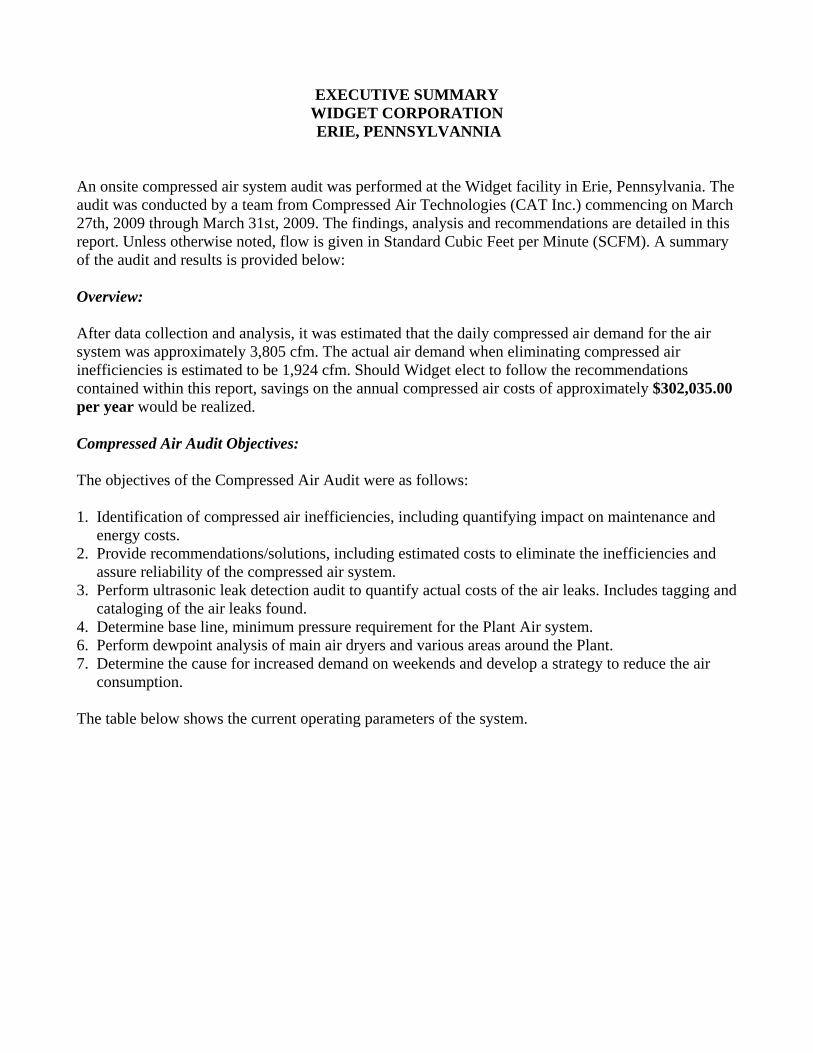
An onsite compressed air system audit was performed at the Widget facility in Erie, Pennsylvania. The audit was conducted by a team from Compressed Air Technologies (CAT Inc.) commencing on March 27th, 2009 through March 31st, 2009. The findings, analysis and recommendations are detailed in this report. Unless otherwise noted, flow is given in Standard Cubic Feet per Minute (SCFM). A summary of the audit and results is provided below: Overview: After data collection and analysis, it was estimated that the daily compressed air demand for the air system was approximately 3,805 cfm. The actual air demand when eliminating compressed air inefficiencies is estimated to be 1,924 cfm. Should Widget elect to follow the recommendations contained within this report, savings on the annual compressed air costs of approximately $302,035.00 per year would be realized. Compressed Air Audit Objectives: The objectives of the Compressed Air Audit were as follows: 1. Identification of compressed air inefficiencies, including quantifying impact on maintenance and energy costs. 2. Provide recommendations/solutions, including estimated costs to eliminate the inefficiencies and assure reliability of the compressed air system. 3. Perform ultrasonic leak detection audit to quantify actual costs of the air leaks. Includes tagging and cataloging of the air leaks found. 4. Determine base line, minimum pressure requirement for the Plant Air system. 6. Perform dewpoint analysis of main air dryers and various areas around the Plant. 7. Determine the cause for increased demand on weekends and develop a strategy to reduce the air consumption. The table below shows the current operating parameters of the system.
2
Current vs. Proposed Air System Costs From Appendix 6 Current Compressed Proposed Air System (106 psig) Air System (80) Total Compressors Online 2 - 3 1 - 2 Dryers Online 17 2 Compressor Hp Available 950 950 Total Hp Consumed: Electric 858 544 Average SCFM Consumed 3,805 1,862 Electric Cost (cents/kwh) $0.119 $0.119 Comp/Dryer Elec Cost/Year $702,981.58 $445,946.15 Maintenance Cost $145,000.00 $100,000.00 Total Direct Annual Cost $847,981.58 $545,946.15 Annual Yearly Savings $302,035.43 Cost of Compressed Air per Day $2,323.23 $1,495.74 Note: The above table averages the weekday and weekend compressed air consumption and BHP. Inefficiencies: The main inefficiencies as determined by the air audit are as follows:
1. Point of uses applications of compressed air, such as blow-offs and cooling consume the majority of the compressed air produced.
2. Compressed air is left on to production line equipment when not in use. 3. Widget uses compressed air for clean-up operations. This is especially true on weekends. Blow-
off guns run on a continuous basis for up to 10 hours on Saturdays. 4. Main header dewpoint was measured at +43F. ISO8573.1 suggest a –40F dewpoint for some of
the more specific uses of air at Widget, like control valves and air that may come in contact with product.
5. Air leaks consume approximately 7% of total air produced at the Plant. 6. Artificial demand, whereby the plant air pressure is high then require constitutes approximately
11% of the total compressed air costs. 7. Purge losses from the satellite dryers consume 2% of the compressed air produced. 8. Lack of adequate useful storage in the Plant contributes to pressure fluctuations, which results in
an increase in the artificial demand of both the Plant air-lines. Individual inefficiency costs can be viewed below. Details of the inefficiencies can be located in the Engineering Report. It should be noted, that by simply repairing one of the inefficiencies, may not necessarily translate into energy savings immediately upon implementation. By simply repairing air leaks for example, without addressing storage and intermediate pressure controls, would have a minimal affect on reducing compressed air demand. The end result would be an increase in the Plant air pressure. This would actually lead to an
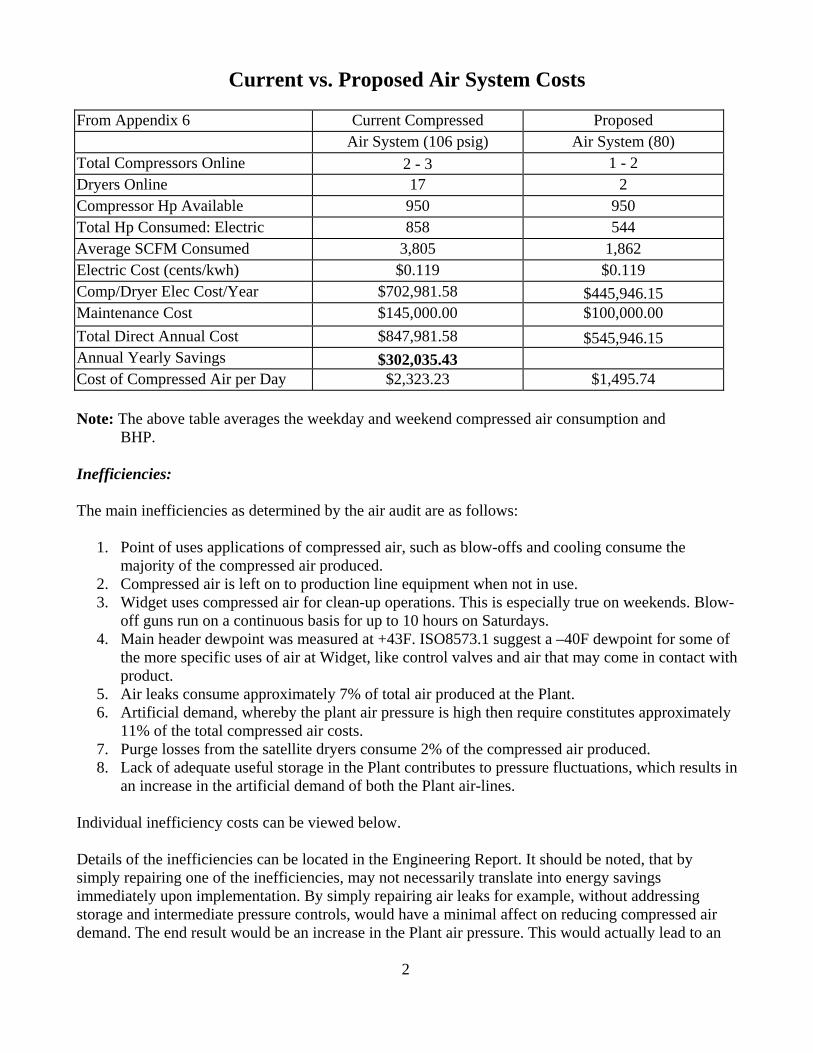
increase in the bhp consumed by the compressors and increase electrical consumption. The resultant projects, explained below, fully capitalize on the implementation of the cost savings measures. Compressed Air Costs/Inefficiencies
Compressed Air Cost BreakdownYearly Operating Cost: $847,981.00
$49,442.13$78,553.66
$245,232.97
$145,000.00
$79,107.41
$14,326.35
$236,319.05
Air Leaks
Artificial Demand
Point Of Use Reduction
Maintenance
Vortex CoolingCabinets
Dryer Purge Loss
Real Demand
See Appendix 15 for inefficiency summary
3
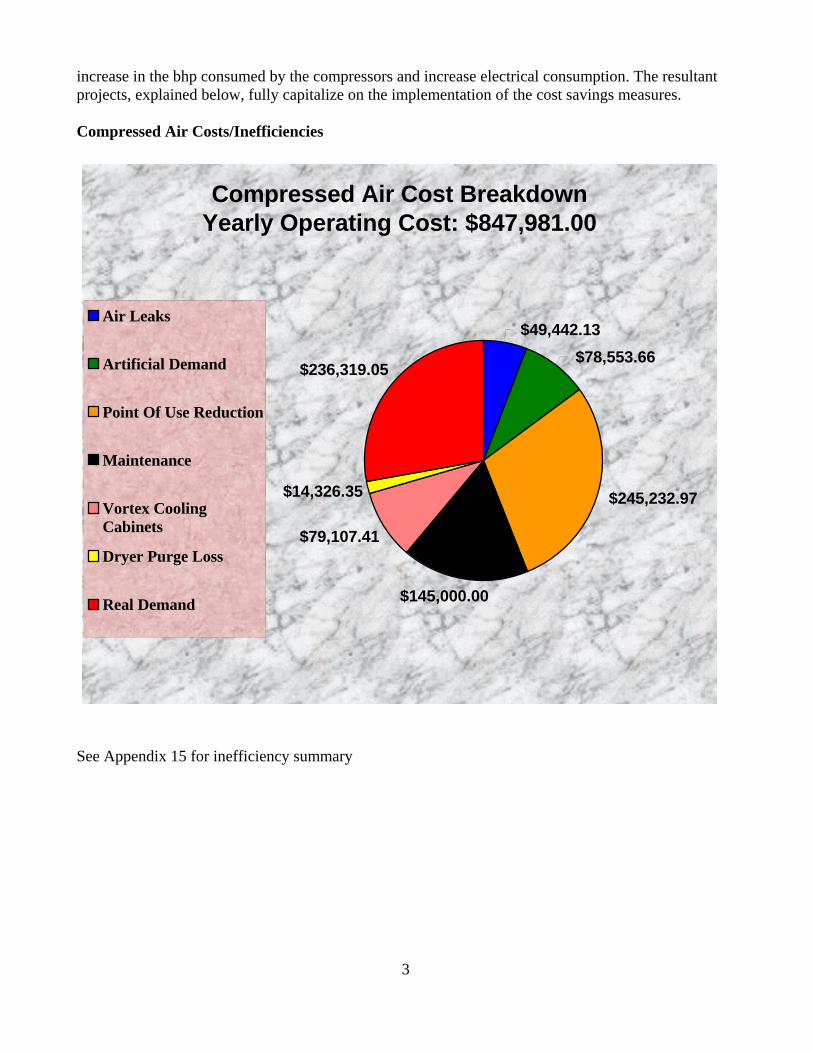
Main Project Summary Chart The following table contains the scope of supply required to maximize the savings at Widget:
(See Appendix 14) Note: Above table +/-15% and is based on past experience with similar sized systems and equipment. By following the recommendations listed in the Engineering Report, Widget can realize the following benefits: • Elimination of point-of-use dryers. • Reduction of on-line horsepower. • Substantial increase in compressed air system quality and reliability. • Pressure stabilization throughout the entire facility. • Reduction in maintenance costs for the compressed air system. • Reduction in air leaks. • Reduction in overall compressed air demand. • Increase in storage capacity. • Increase in compressed air system efficiency will allow Widget to produce air at the lowest cost
possible. • Compressed air savings of over $302,035.00 per year.
4
5
Summary The findings presented in this report suggest conclusively, that most of the compressed air costs can be attributed to the point of use blow-off, cooling, clean-up and air leaks. Also contributing to the inefficiencies are compressor inefficiency and satellite regenerative air dryers. A system upgrade project will include the following:
1. Replacement of inefficient dryers. 2. Drying of all compressed air to –40F at primary locations. 3. Addition of a 2 regenerative air dryers (one at 150-450 & 350 DC). 4. Addition of Demand Flow Stabilizer valves. 5. Adding storage at primary compressor areas. 6. Addressing point of use issues (free blowing of compressed air for cooling/clean-up). 7. Reduction of compressed air demand for product blow off on production equipment with air
knives and Hi-E nozzles. 8. Reduction in compressed air demand for clean-up in the Plant with Hi-E nozzles.
More description and detail of the above can be located in the Engineering Report. Based on the facts presented in this report, a compressed air system upgrade project is warranted. Should Widget elect to implement CAT’s recommendations, the problems identified in this report will dissipate. The end result will be considerable savings on energy and maintenance costs. Additionally, and most important, compressed air quality and reliability will increase dramatically, allowing Widget to operate the air system as efficiently as possible, providing production with a clean and reliable air supply at the proper pressure and lowest cost.
6
COMPRESSED AIR AUDIT REPORT WIDGET, ERIE, PENNSYLVANNIA
ENGINEERING REPORT An onsite compressed air system audit was performed at the Widget facility in Erie, Pennsylvania. The audit was conducted by a team from Compressed Air Technologies (CAT Inc.) commencing on March 27th, 2009 through March 31st, 2009. The findings, analysis and recommendations are detailed in this report. Unless otherwise noted, flow is given in Standard Cubic Feet per Minute (SCFM). A summary of the audit and results is provided below: Overview: After data collection and analysis, it was estimated that the daily compressed air demand for the air system was approximately 3,805 cfm. The actual air demand when eliminating compressed air inefficiencies is estimated to be 1,924 cfm. Should Widget elect to follow the recommendations contained within this report, savings on the annual compressed air costs of approximately $302,035.00 per year would be realized. Compressed Air Audit Objectives: The objectives of the Compressed Air Audit were as follows: 1. Identification of compressed air inefficiencies, including quantifying impact on maintenance and energy costs. 2. Provide recommendations/solutions, including estimated costs to eliminate the inefficiencies and assure reliability of the compressed air system. 3. Perform ultrasonic leak detection audit to quantify actual costs of the air leaks. Includes tagging and cataloging of the air leaks found. 4. Determine base line, minimum pressure requirement for the Plant Air system. 6. Perform dewpoint analysis of main air dryers and various areas around the Plant. 7. Determine the cause for increased demand on weekends and develop a strategy to reduce the air consumption. Compressed Air System Descriptions: There are currently 3 air compressors and 17 air dryers used throughout the Plant. The compressed air production locations and terminology to be used to describe the main systems are as follows:
1. 150 – 450 Area (2 Compressors, 2 Refrigerated Dryers) 2. 350 DC Area (1 Compressor, 1 Refrigerated Dryer)
A brief description of the two main air production areas for the Widget facility, are listed as follows:
7
150 – 450 - Compressed Air Station At this location, compressed air is produced by two, Sullair, oil-flooded, water-cooled, rotary screw air compressors. Compressor #1 is a Sullair model 32-450H WCAC, rated at a design flow of 2000 Acfm at 115 psig. This unit utilizes a 450 Hp, 460 volt, electric motor. The current discharge pressure from this compressor is 107 psig. After compression, air is sent through a 6” pipe that feed into a coalescing filter. The air then travels into a particulate filter, which leads into an Ingersoll-Rand 2400 cfm refrigerated air dryer, with a dewpoint of 37F. After drying the air is sent through an afterfilter which feeds into a 1000 gallon air receiver. From the air receiver the air feeds into two 3” lines, that supplies the Plant. (See Appendix #3 for locations of dryers and compressors). The second compressor in this area is a Sullair Model 25L-150 WCAC rated at a published design flow of 750 Acfm at 100 psig. This unit utilizes a 150 Hp, 460 volt, electric motor. The current discharge pressure from this compressor is 106 psig. After compression, air is sent through a 3” pipe that feed into a coalescing filter. The air then travels into a particulate filter, which leads into a Sullair PSII, 800 cfm refrigerated air dryer. This dryer was offline at the time of the audit. The air is then sent into a common header with the first compressor and sent through the afterfilter and into a 1000 gallon air receiver. From the air receiver the air feeds into two 3” lines, that supplies the Plant. (See Appendix #3 for locations of dryers and compressors).
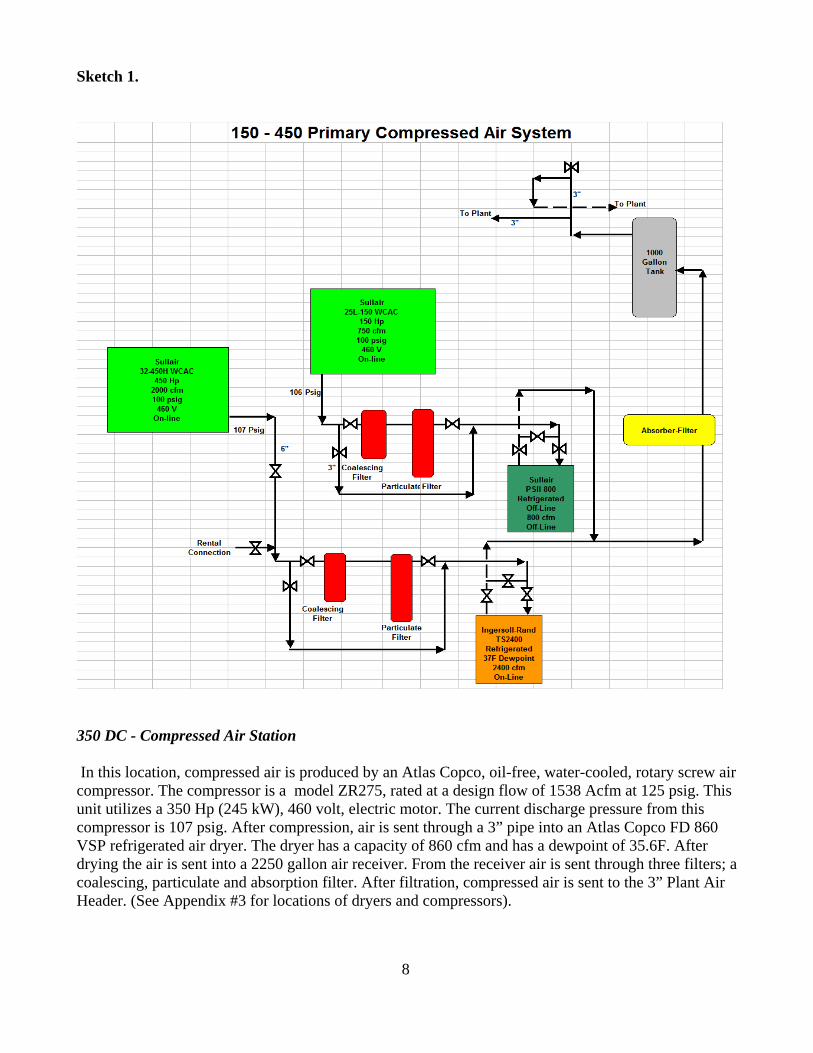
Sketch 1.
8
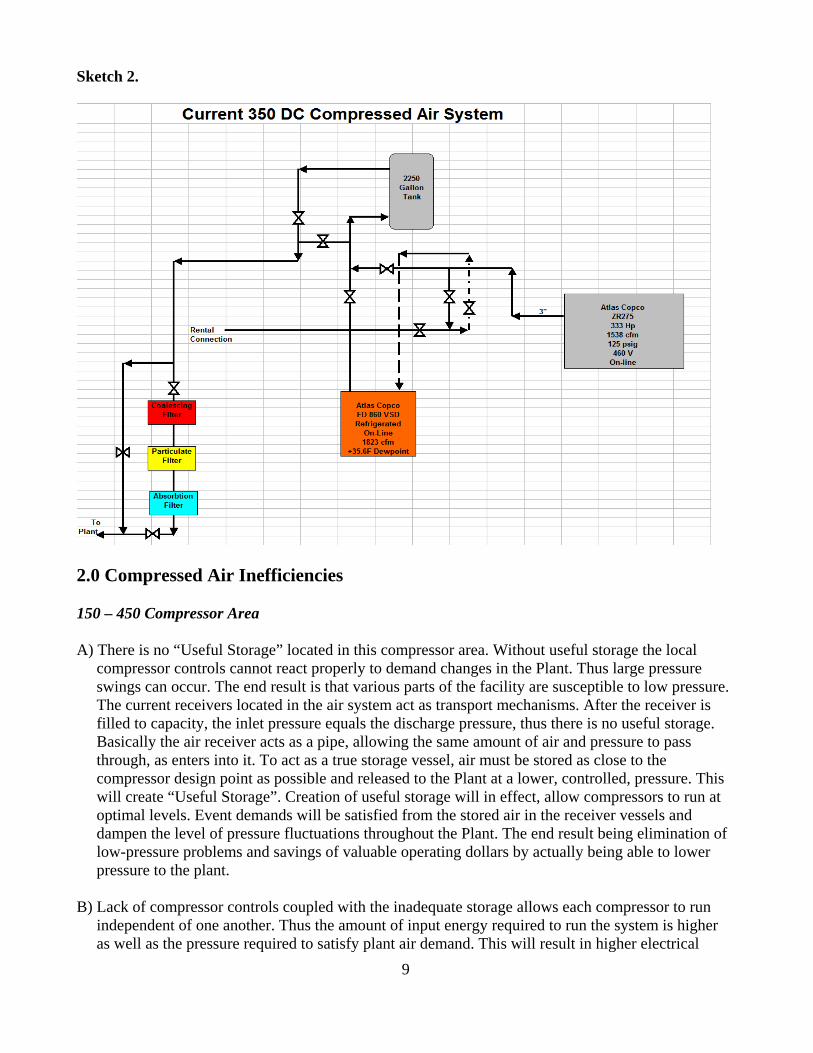
50 DC - Compressed Air Station
n this location, compressed air is produced by an Atlas Copco, oil-free, water-cooled, rotary screw air
s; a
3 Icompressor. The compressor is a model ZR275, rated at a design flow of 1538 Acfm at 125 psig. This unit utilizes a 350 Hp (245 kW), 460 volt, electric motor. The current discharge pressure from this compressor is 107 psig. After compression, air is sent through a 3” pipe into an Atlas Copco FD 860VSP refrigerated air dryer. The dryer has a capacity of 860 cfm and has a dewpoint of 35.6F. After drying the air is sent into a 2250 gallon air receiver. From the receiver air is sent through three filtercoalescing, particulate and absorption filter. After filtration, compressed air is sent to the 3” Plant Air Header. (See Appendix #3 for locations of dryers and compressors).
9
ketch 2.
.0 Compressed Air Inefficiencies
e” located in this compressor area. Without useful storage the local compressor controls cannot react properly to demand changes in the Plant. Thus large pressure
re.
his run at
r
ith the inadequate storage allows each compressor to run independent of one another. Thus the amount of input energy required to run the system is higher
S
2 150 – 450 Compressor Area A) There is no “Useful Storag swings can occur. The end result is that various parts of the facility are susceptible to low pressu The current receivers located in the air system act as transport mechanisms. After the receiver is filled to capacity, the inlet pressure equals the discharge pressure, thus there is no useful storage. Basically the air receiver acts as a pipe, allowing the same amount of air and pressure to pass through, as enters into it. To act as a true storage vessel, air must be stored as close to the compressor design point as possible and released to the Plant at a lower, controlled, pressure. T will create “Useful Storage”. Creation of useful storage will in effect, allow compressors to optimal levels. Event demands will be satisfied from the stored air in the receiver vessels and dampen the level of pressure fluctuations throughout the Plant. The end result being elimination of low-pressure problems and savings of valuable operating dollars by actually being able to lowe pressure to the plant. B) Lack of compressor controls coupled w as well as the pressure required to satisfy plant air demand. This will result in higher electrical
10
nce between the plant minimum air pressure requirement and the actual plant air pressure. The two compressors
here is no “Useful Storage” located anywhere within the compressed air
system. Without useful storage the local compressor controls cannot react properly to demand
e
lant is 20 psig. Artificial demand is the difference between the plant minimum air pressure requirement and the actual plant air pressure. The two
an
a substantial amount of air leaks throughout the entire Plant. A conservative estimate puts the total leak loss at approximately 250 cfm This equates to
in the Plant. They include the following:
Guns 2. Straight Pipe (½” – ¼”)
pe pipe)
w) used throughout the Plant for clean-up and blow-off. he air guns were flow tested and it was found that each gun consumes 50 cfm at line pressure
costs, increased maintenance intervals and decrease in compressor longevity. C) Current artificial demand of the plant is 20 psig. Artificial demand is the differe discharge at 104 psig and the minimum pressure monitored was 84 psig. 104 psig – 84 psig = 20 psig artificial demand. This equates to an additional 10% more input energy required than is necessary to run the plant. This equates to approximately 61.6 BHP or $48,730.00 per year. 350 DC Compressor Area
A) As was the case above, t
changes in the Plant. Thus large pressure swings can occur. The end result is that various parts of the facility are susceptible to low pressure. The current receivers located in the air system act as transport mechanisms. After the receiver is filled to capacity, the inlet pressure equals the discharge pressure, thus there is no useful storage. Basically the air receiver acts as a pipe, allowing the sam amount of air and pressure to pass through, as enters into it. To act as a true storage vessel, air must be stored as close to the compressor design point as possible and released to the Plant at a lower, controlled, pressure. This will create “Useful Storage”. Creation of useful storage will in effect, allow compressors to run at optimal levels. Event demands will be satisfied from the stored air in the receiver vessels and dampen the level of pressure fluctuations throughout the Plant. The end result being elimination of low-pressure problems and savings of valuable operating dollars by actually being able to lower pressure to the plant. B) Current artificial demand of the compressor area p compressors discharge at 104 psig and the minimum pressure monitored was 84 psig. 104 psig – 84 psig = 20 psig artificial demand. This equates to an additional 10% more input energy required th is necessary to run the plant. This equates to approximately 37.7 BHP or $29,823.00 per year. General Plant Inefficiencies A) It was apparent that there is approximately 62.5 Bhp or $49,442.00 per year in lost energy. B) There are several types of blow-off nozzles/cooling devices used
1. Air
3. Crimped Pi4. Air Lances (straight long
There are over 100 air guns (ex. #1, belo T when activated. The straight pipe air lances (ex. #2, below) consume over 100 cfm. In addition when these devices are implemented it will cause the air system pressure to fluctuate do to the

11
e 15
full
relatively small storage volume the pipe system offers and lack of useful storage. The air guns ar predominantly used on Saturday, day shifts. During this clean-up period there are approximately guns online at any one time. Thus for 8 hours per week, 750 cfm of compressed air is used consuming 187.5 Bhp. Thus the cost of clean-up based on 416 hours per year equates to $7,043.00 or $17.00 per hour. Though the air guns are used at various times and are not employed on a time basis, it is conservatively estimated that there are at least two air guns on, at any given time. Thus 100 cfm or 25 Bhp is consumed constantly, equating to $19,776.00 per year in lost energy. 1: Air Gun Example
2: Air Lance Example

12
: Air Lance Example (2nd Floor Bakery) 3
It should be noted that open pipes (pic. #2 & #3, above) connected to compressed air lines must have a self relieving mechanism such that if the pipe is pressed against a body, the air will be able
where machinery has the following sign posted on the production lines. The result is that even when there is no production, compressed air remains on-
to be expelled from the sides. Picture #1, above has this relief, while picture #2 & #3 are an OSHA violation and could be subject to a fine. E) There are several places within the plant line and is allowed to escape to atmosphere (see item F, below).
13
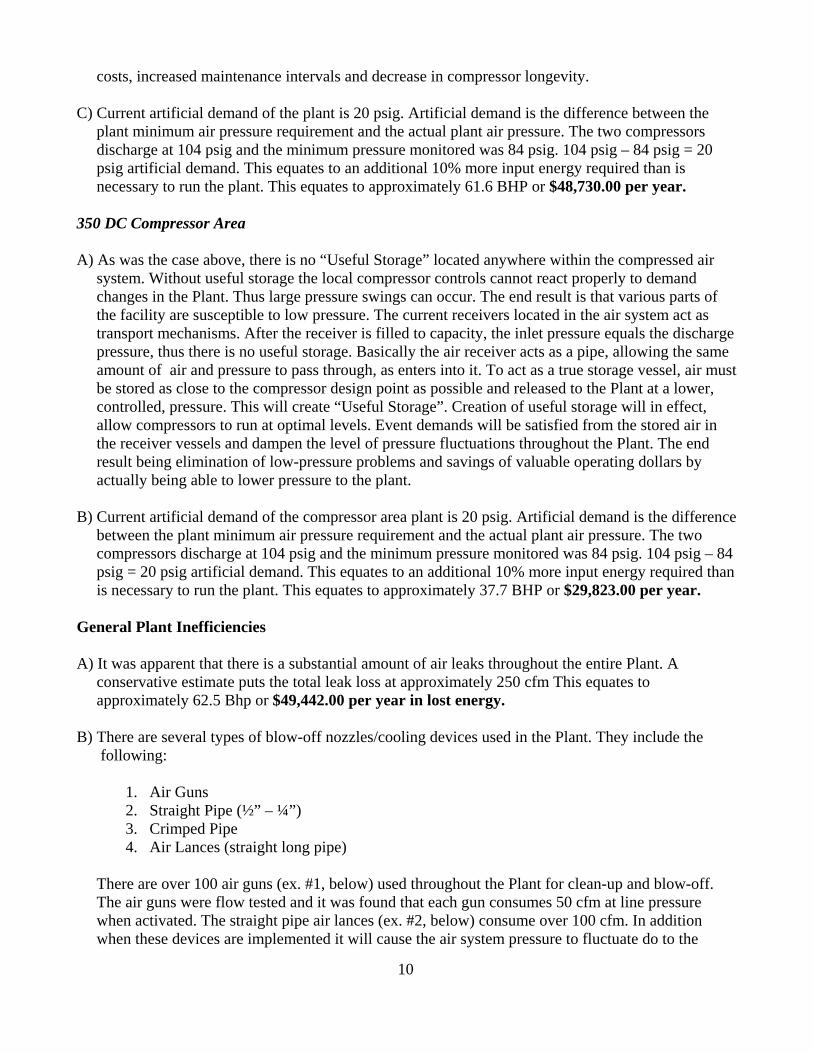
F) At the second floor bakery, column I-5 Line uses two ¼” air lines for debris blow-off. This consumes approximately 50 cfm, which equates to 12.5 Bhp or $9,888.00 per year in lost energy.
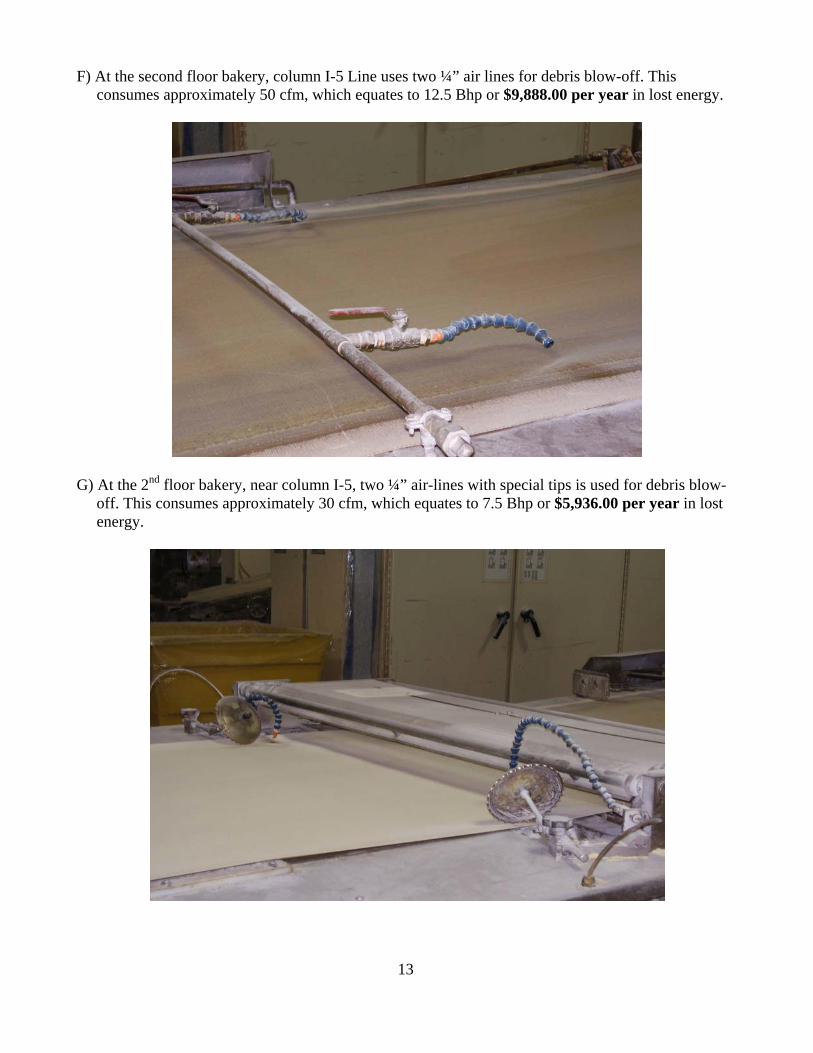
G) At the 2nd floor bakery, near column I-5, two ¼” air-lines with special tips is used for debris blow- off. This consumes approximately 30 cfm, which equates to 7.5 Bhp or $5,936.00 per year in lost energy.

14
H) In the 2nd floor bakery, by the L-5 and K-5 Lines use a perforated pipe for blow-off. The blow-off device has thirty, 1/32nd holes, with two sides, for a total of sixty 1/32nd holes. The total cfm consumed is 1.3 cfm per hole or 78 cfm total. There are two of these devices. Thus the overall consumption is 156 cfm. This equates to 39 Bhp or $30,851.00 per year to operate.
I) Widget - has several dryer/filtration locations. Utilizing satellite compressed air dryers has several distinct disadvantages as follows:
1. Induced pressure drop resulting in lost energy. 2. Elevated overall cost to maintain the system. 3. Operating costs are elevated due to purge losses on the regenerative dryers and power cost
to operate refrigerant compressor. Warehouse Ceiling 1st Floor
15
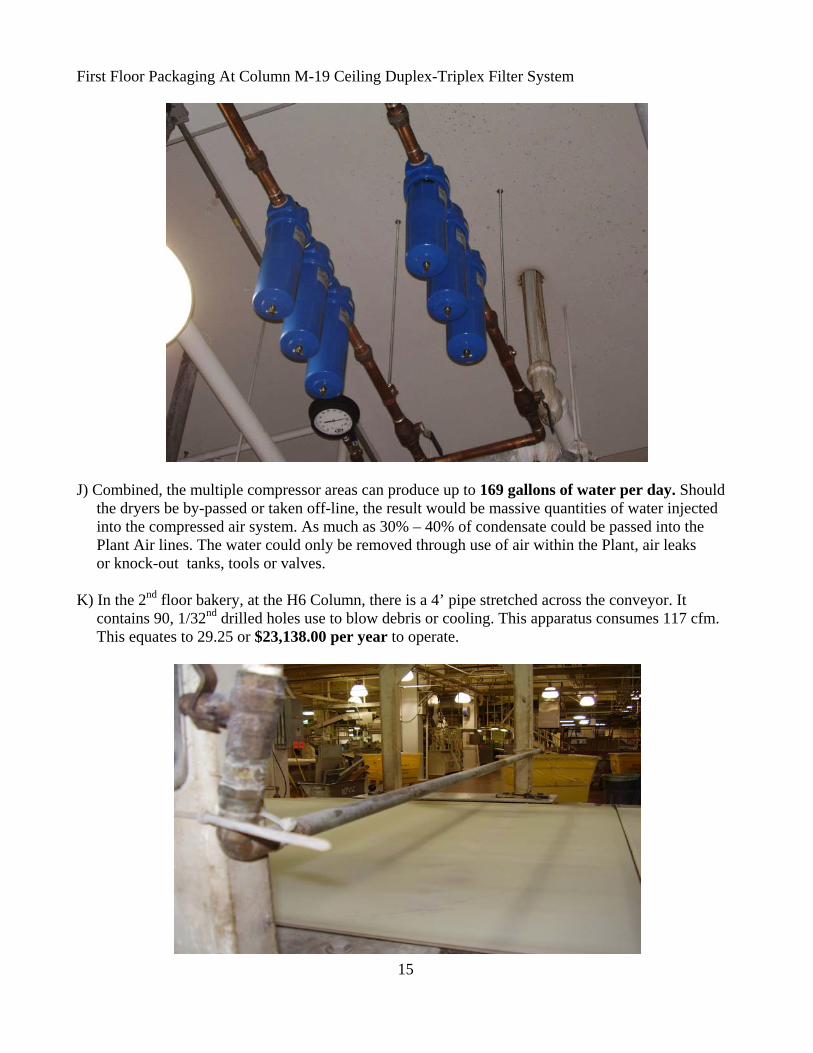
Triplex Filter System First Floor Packaging At Column M-19 Ceiling Duplex-
) Combined, the multiple compressor areas can produce up to 169 gallons of wJ
ater per day. Should
the dryers be by-passed or taken off-line, the result would be massive quantities of water injected into the compressed air system. As much as 30% – 40% of condensate could be passed into the Plant Air lines. The water could only be removed through use of air within the Plant, air leaks or knock-out tanks, tools or valves. K) In the 2nd floor bakery, at the H6 Column, there is a 4’ pipe stretched across the conveyor. It contains 90, 1/32nd drilled holes use to blow debris or cooling. This apparatus consumes 117 cfm. This equates to 29.25 or $23,138.00 per year to operate.
16
s used for cooling/debris blow-off, of the infra-red sensors. They use of ¼” blow-offs regulated to 35 psig. There are a total of eight cameras, thus this process
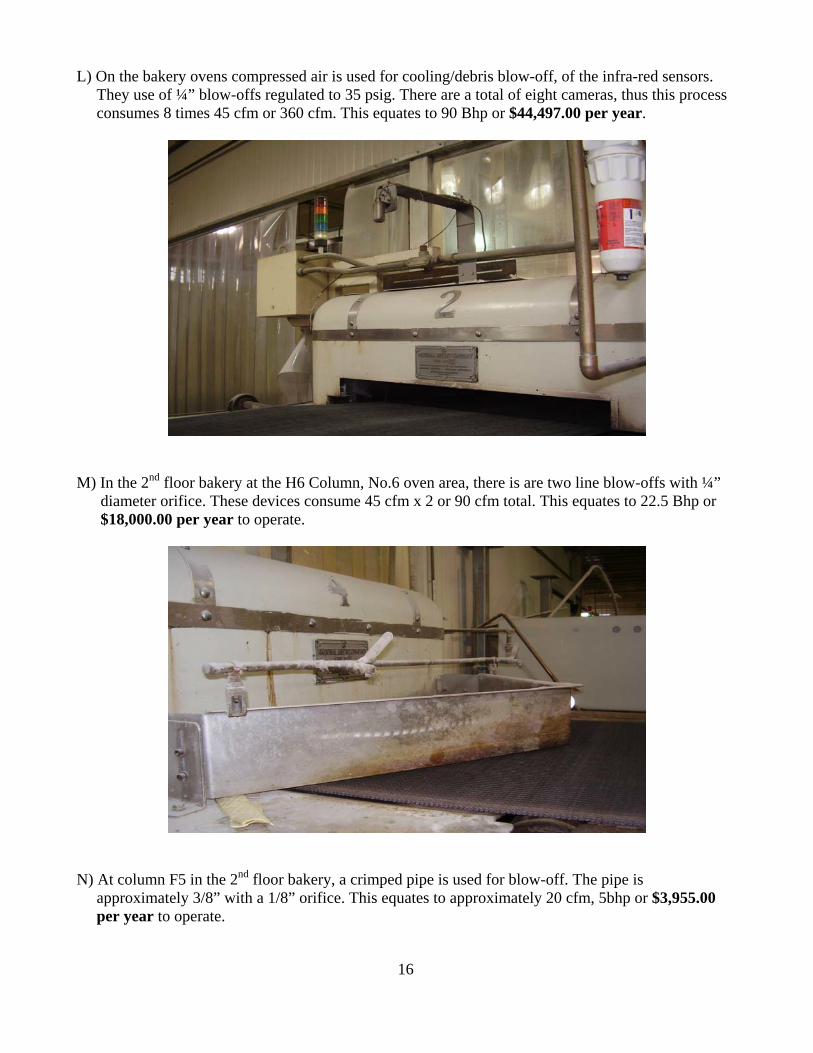
L) On the bakery ovens compressed air i consumes 8 times 45 cfm or 360 cfm. This equates to 90 Bhp or $44,497.00 per year.
M) In the 2nd floor bakery at the H6 Column, No.6 oven area, there is are two line blow-offs with ¼” diameter orifice. These devices consume 45 cfm x 2 or 90 cfm total. This equates to 22.5 Bhp or $18,000.00 per year to operate.
N) At column F5 in the 2nd floor bakery, a crimped pipe is used for blow-off. The pipe is approximately 3/8” with a 1/8” orifice. This equates to approximately 20 cfm, 5bhp or $3,955.00 per year to operate.

) In the first floor packaging at column J20, Rovena Machines, there is a 1/8” blow-off orifice on 8 of these machines. Each orifice consumes 15 cfm for a total 120 cfm. This totals 30 Bhp or $23,772.00
O per year.
P) In the Packaging are at column K20 there are two ¼” blow-offs consuming approximately 60 cfm. This equates to 15 Bhp or $11,866.00 per year to operate.
17

Q) Bakery cabinets are vortex cooled to keep electrical components from overheating. The smallest vortex cooler offered by Grainger for this task, consumes 8 cfm. This would equate to 2.0 Bhp. There are an estimated 50 of these units scattered around the Plant, thus conservatively Widget is consuming 100 Bhp costing $79,107.00 per year in lost energy.
R) In the first floor packaging area, a ¼” line is used to pressurize a tank. The majority of the air was leaking back to atmosphere at a rate of 25 cfm. This equates to 6.25 Bhp or $4,994.00 per year to operate.
18
19
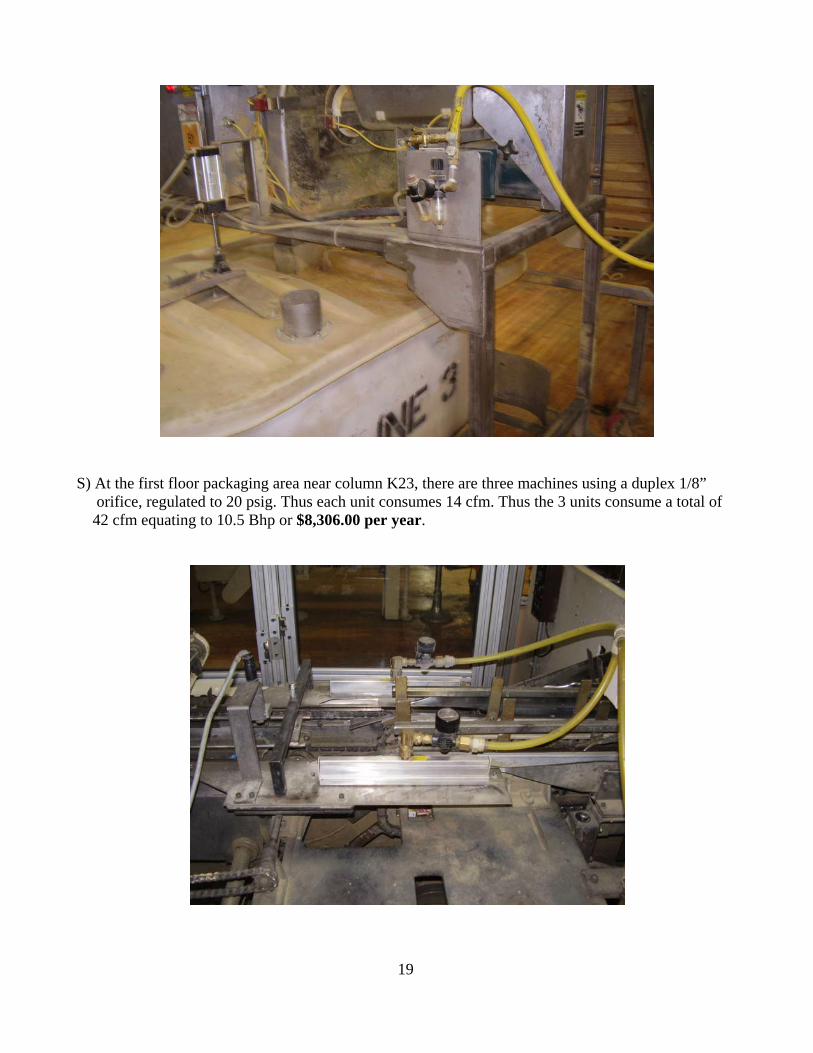
S) At the first floor packaging area near column K23, there are three machines using a duplex 1/8” orifice, regulated to 20 psig. Thus each unit consumes 14 cfm. Thus the 3 units consume a total of
42 cfm equating to 10.5 Bhp or $8,306.00 per year.

20
) In the Packaging Area near column K23, there are two ¼” nozzles used for blow-off. Combined they consume 15 cfm, 3.75 Bhp or $2,966.00 per year.
T
) In the first floor packaging area, a pipe with seven 1/32nd inch holes is used for blow-off. There are U two of these devices per unit, with a total of two units. Thus the entire system consumes 30 cfm equating to 7.5 Bhp or $5,993.00 per year.
V) Lack of compressor controls does not allow communication between compressors or compressor sites. Thus in times of high or low demand, Widget personnel have to add or remove the appropriate amount of horsepower. Generally, to protect against the instantaneous event demands, more compressors are on-line then required.

21
W) There are 17 satellite dryers within the air system. The desiccant dryers consume 72 cfm of Air for dryer purge purposes. This equates to 18 Bhp or $7,127.00 per year in lost energy. 3. 0 Compressed Air System Efficiency (CFM Delivered Per BHP Input) The Widget compressed air system produces a certain amount of compressed air or SCFM for every 1 BHP of input energy. This is commonly called the CFM/BHP ratio. The compressor type and its design discharge pressure, will determine the cfm./ bhp ratio as listed below:
1. Two Stage Oil-Free Rotary Screw Compressors @ 100 psig: 4.0 cfm/bhp (3.8 cfm/Bhp @ 125 Psig)
2. Single Stage Oil Flooded Rotary Screw Compressor @ 100 psig: 4.5 cfm/bhp (4.2 cfm/Bhp @ 125 Psig)
3. Two Stage Oil Flooded Rotary Screw Compressor @ 100 psig: 4.8 cfm/bhp (4.4 cfm/Bhp @ 125 Psig)
4. Three Stage Centrifugal (oil free) Compressor @ 100 psig: 4.5 cfm/bhp (4.2 cfm/Bhp @ 125 Psig)
w for calculation of the amount of cfm produced per he
g the
this
cfm is used in the design criteria of positive displacement compressors such as
ia, 68F, 36% RH and is typically used as the basis for rating centrifugal
e,
For rotary screw compressors (oil free & oil flooded), the cfm/bhp ratio is irregardless of the size of the compressors.
ach system has individual characteristics that alloEBhp input or Cfm/Bhp. The actual demand was measured using a mass flow insertion probe for tstationary Ingersoll-Rand and Atlas Copco. The remaining compressor’s flow was derived usin
anufacturer published data, amp draw and over 22 years of performance testing of equivalent mcompressors. 3.1 450H – 150L Compressors The two Sullair compressors discharge into a common header. The mass flow probe was placed inline and measured the total flow from the two compressors. According to the compressor manufacturer’s published data, the 32-450H, oil-flooded rotary screw compressor in this area will produce 2000 cfm at 115 psig, at a full load Bhp of 495. Thus the manufacturers stated Cfm/Bhp ratio is 2000 cfm / 464 Bhp = 4.31 Cfm/Bhp.
5L-150, oil- The 2 flooded rotary screw compressor in this area will produce 750 cfm at 100 psig, at a full load Bhp of 165. Thus the manufacturers stated Cfm/Bhp ratio is 750 cfm / 165 Bhp = 4.54 Cfm/Bhp. Both ratings are based on Acfm. The design inlet conditions are 14.4 psia, inlet pressure, 60% relative humidity and 95F inlet air temperature. Acfm is the amount of Volume of air drawn into he compressor. At
reciprocating and rotary screw compressors. SCFM is defined as the amount of Mass drawn from the compressor based on actual ambient conditions. The standard SCFM conditions, as called for by
SME are 14.4 psAcompressors. Based on the SCFM and Bhp recorded during the audit (see Appendix 5), the compressors, on averagproduced 2,418 cfm, consuming 616 Bhp at 106 psig discharge pressure. The amp draws were

22
is llows:
418 Cfm / 616 Bhp = 3.92 Cfm/Bhp
y 15% below published industry standard. is 24.6% less efficient then centrifugals and single stage oil-flooded rotary screw compressors and
1,538
on average, 7 cfm, consuming 377 Bhp at 104 psig discharge pressure. The amp draws were
onitored by, CAT using micro data loggers and converted to Bhp. The resultant Cfm/Bhp ratio is
he above Cfm/Bhp ratio is below satisfactory. The current system should at minimum, achieve a 4.0 cfm/bhp ration. Thus the system nameplate performance. It is 0% less efficient then centrifugals and 25 less efficient than two stage oil-flooded rotary screw
he resultant metered system Cfm/Bhp is 3,805 Cfm /993 bhp = 3.83 Cfm/Bhp.
ased on published data of the compressors currently on-line, the Cfm/Bhp should be 4,128 Cfm / 942
.0 Current Plant & Instrument System Air Pressures
ressure fluctuated between 116.9 psig (350 DC Air Receiver) and 69 psig olumn L-19). This excludes the low pressure experienced over the weekend, on Sunday, March 29th
at 8:00 am. The only compressor online was the Sullair 25-150L and the pressure dropped to 24 Psig. he large pressure swings occur due to lack of useful storage as described above and frequent event
monitored by, CAT using micro data loggers and converted to Bhp. The resultant Cfm/Bhp ratiocalculated as fo
2, The above Cfm/Bhp ratio is below satisfactory. The current system should at minimum, achieve a 4.0 cfm/bhp ration. Thus the system is operating at approximatelIt29% less efficient than two stage oil-flooded rotary screw compressors. 3.2 – 350 DC Compressor According to the compressor manufacturer literature, the Atlas Copco compressor, will produce cfm at 125 psig, at a full load Bhp of 350. Thus the manufacturers stated Cfm/Bhp ratio is 1,538 cfm/350 Bhp = 4.4 Cfm/Bhp. This rating is based on Acfm. According to CAGI/PNEUROP, Acfm is measured at the discharge terminal point of the compressor package. Based on the recorded data obtained by CAT during the audit, the actual average flow of this unit is to 1387 Acfm. Based on the SCFM and Bhp recorded during the audit (see Appendix 5), the compressors,produced 1,38mcalculated as follows:
1,387 Cfm / 377 Bhp = 3.7 Cfm/Bhp T
is operating at approximately 20% below2compressors. 3.3– Overall Compressed Air System Efficiency T BBhp or 4.38 Cfm/Bhp. Thus the current system is operating at 3.83/4.38 or 12.6% below current compressor performance design. 4 4.1 Plant Air Pressure The Plant System air p(C
T

23
erage Plant pressure as determined by the results of the data logging was 87.3 psig. he following graph depicts the pressure differential.
raph 1:
demands such as air gun usage and production lines being brought on-line. Thus the pipe header and air receivers are the sole storage volume, which is not sufficient enough to satisfy the event demands. The Plant pressure recordings from each logged area were charted and tabulated in Appendix 4 for review. The avT G
Max vs Min Pressure 350 DC Tank & L-19
120
110
100
90
PSIG
60
70
80
1 38 75 112
149
186
223
260
297
334
371
408
445
482
519
556
593
630
667
704
741
778
815
852
889
926
963
1000
1037
1074
1111
1148
350 Tank psig Column L-19
l Plant Pressure The following chart represents how the air distribution system is interconnected throughout the plant. The graph clearly shows that without useful storage, event demands or large air use will affect the entire system in a uniform fashion.
4.2 Overal

24
Graph 2:
Overall Plant Air Pressure
70
75
80
85
90
95
100
105
110
115
12012
:22
13:5
9
15:3
6
17:1
3
18:5
0
20:2
7
22:0
4
23:4
1
1:18
2:55
4:32
6:09
7:46
9:23
11:0
0
12:3
7
14:1
4
15:5
1
17:2
8
19:0
5
20:4
2
22:1
9
23:5
6
1:33
3:10
4:47
6:24
Mar 29 - Mar 31
PSIG
I26 2nd Flr H2 2nd Flr 450 -350 Tank 350 DC
4.3 Ceiling Filter Delta P A test to measure the pressure drop across the ceiling filters was undertaken. The results of this test canbe viewed in the following chart. The pressure drop across the filters, on average, is approximately 1 psig. These filters have not been cha
nged in some time. Thus the conclusion is that the air is cleaned pstream of these filters and they are not necessary to the operation of the system. Their only purpose to drain the system of 0.5% energy.
raph 3:
uis G
Column N20 vs Column L-19Celing Filter Delta P
70
71
72
73
74
75
76
77
17:3
7
17:5
3
18:0
9
18:2
5
18:4
1
18:5
7
19:1
3
19:2
9
19:4
5
20:0
1
20:1
7
20:3
3
20:4
9
21:0
5
21:2
1
21:3
7
21:5
3
22:0
9
22:2
5
22:4
1
22:5
7
23:1
3
23:2
9
23:4
5
0:01
0:17
0:33
0:49
1:05
1:21
1:37
1:53
2:09
2:25
2:41
2:57
3:13
3:29
3:45
4:01
4:17
4:33
4:49
5:05
5:21
5:37
5:53
6:09
6:25
6:41
Mar 28th - 29th
Psig
Column N-20 Column L19
25
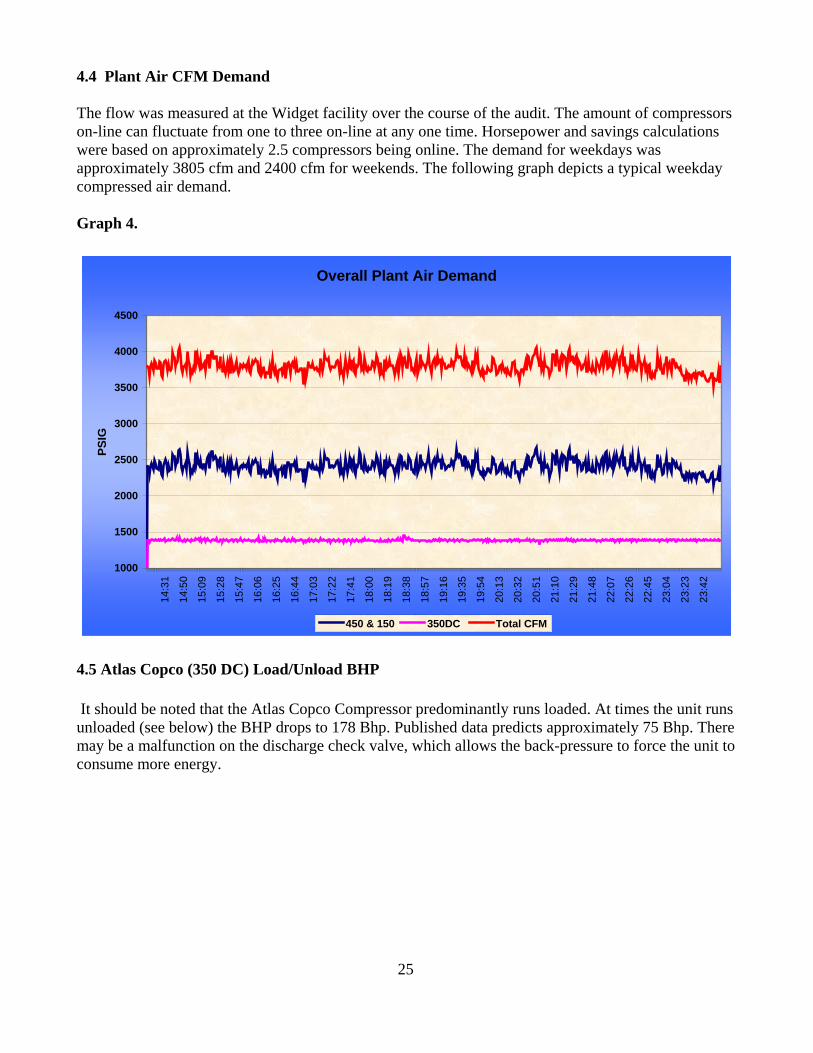
4.4 Plant Air CFM Demand The flow was measured at the Widget facility over the course of the audit. The amount of compressors on-line can fluctuate from one to three on-line at any one time. Horsepower and savings calculations were based on approximately 2.5 compressors being online. The demand for weekdays was approximately 3805 cfm and 2400 cfm for weekends. The following graph depicts a typical weekday compressed air demand. Graph 4.
Overall Plant Air Demand
2500
1000
1500
2000
3000
3500
4000
4500
14:3
1
14:5
0
15:0
9
15:2
8
15:4
7
16:0
6
16:2
5
16:4
4
17:0
3
17:2
2
17:4
1
18:0
0
18:1
9
18:3
8
18:5
7
19:1
6
19:3
5
19:5
4
20:1
3
20:3
2
20:5
1
21:1
0
21:2
9
21:4
8
22:0
7
22:2
6
22:4
5
23:0
4
23:2
3
23:4
2
PSIG
450 & 150 350DC Total CFM
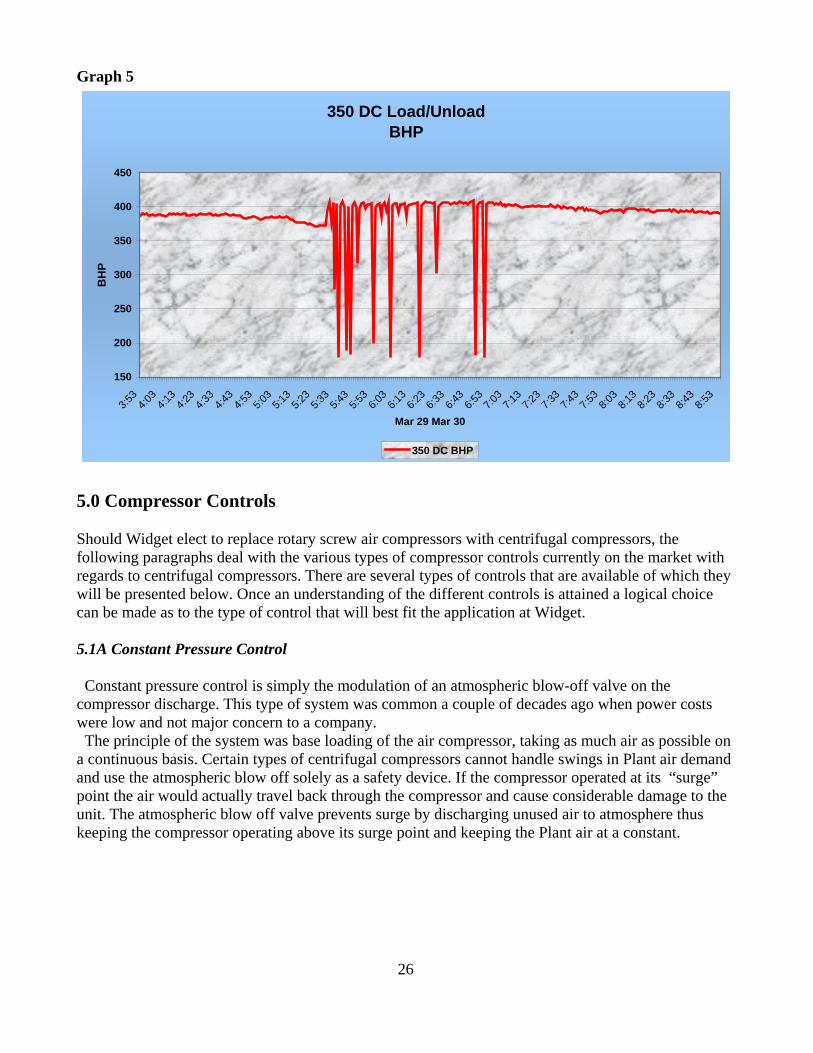
4.5 Atlas Copco (350 DC) Load/Unload BHP It should be noted that the Atlas Copco Compressor predominantly runs loaded. At times the unit runs unloaded (see below) the BHP drops to 178 Bhp. Published data predicts approximately 75 Bhp. There may be a malfunction on the discharge check valve, which allows the back-pressure to force the unit to consume more energy.
26
raph 5 G
350 DC Load/UnloadBHP
450
400
150
200
250
300
350
3:53
4:03
4:13
4:23
4:33
4:43
4:53
5:03
5:13
5:23
5:33
5:43
5:53
6:03
6:13
6:23
6:33
6:43
6:53
7:03
7:13
7:23
7:33
7:43
7:53
8:03
8:13
8:23
8:33
8:43
8:53
Mar 29 Mar 30
BH
P
350 DC BHP
5.0 Compressor Controls Should Widget elect to replace rotary screw air compressors with centrifugal compressors, the following paragraphs deal with the various types of compressor controls currently on the market with regards to centrifugal compressors. There are several types of controls that are available of which they will be presented below. Once an understanding of the different controls is attained a logical choice can be made as to the type of control that will best fit the application at Widget.
tain types of centrifugal compressors cannot handle swings in Plant air demand nd use the atmospheric blow off solely as a safety device. If the compressor operated at its “surge” oint the air would actually travel back through the compressor and cause considerable damage to the nit. The atmospheric blow off valve prevents surge by discharging unused air to atmosphere thus eeping the compressor operating above its surge point and keeping the Plant air at a constant.
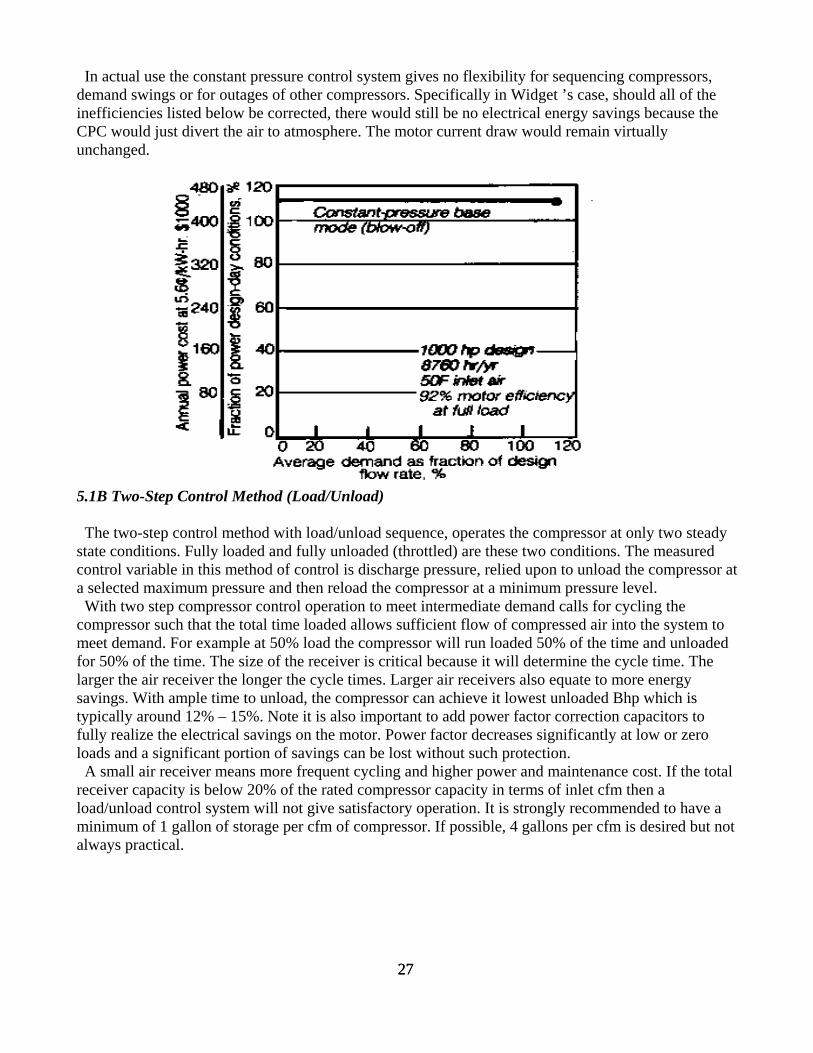
5.1A Constant Pressure Control Constant pressure control is simply the modulation of an atmospheric blow-off valve on the compressor discharge. This type of system was common a couple of decades ago when power costs were low and not major concern to a company. The principle of the system was base loading of the air compressor, taking as much air as possible on continuous basis. Cera
apuk
27 27
use the constant pressure control system gives no flexibility for sequencing compressors, demand swings or for outages of other compressors. Specifically in Widget ’s case, should all of the inefficiencies listed below be corrected, there would still be no electrical energy savings because the CPC would just divert the air to atmosphere. The motor current draw would remain virtually unchanged.
(Load/Unload)
steady
to load the compressor will run loaded 50% of the time and unloaded
itical because it will determine the cycle time. The y
not
In actual
5.1B Two-Step Control Method The two-step control method with load/unload sequence, operates the compressor at only two state conditions. Fully loaded and fully unloaded (throttled) are these two conditions. The measured control variable in this method of control is discharge pressure, relied upon to unload the compressor ata selected maximum pressure and then reload the compressor at a minimum pressure level. With two step compressor control operation to meet intermediate demand calls for cycling the ompressor such that the total time loaded allows sufficient flow of compressed air into the systemc
meet demand. For example at 50%r 50% of the time. The size of the receiver is crfo
larger the air receiver the longer the cycle times. Larger air receivers also equate to more energsavings. With ample time to unload, the compressor can achieve it lowest unloaded Bhp which is typically around 12% – 15%. Note it is also important to add power factor correction capacitors to fully realize the electrical savings on the motor. Power factor decreases significantly at low or zero loads and a significant portion of savings can be lost without such protection. A small air receiver means more frequent cycling and higher power and maintenance cost. If the total receiver capacity is below 20% of the rated compressor capacity in terms of inlet cfm then a load/unload control system will not give satisfactory operation. It is strongly recommended to have a minimum of 1 gallon of storage per cfm of compressor. If possible, 4 gallons per cfm is desired butalways practical.
28
ing with a butterfly valve on the inlet of the compressor is another way of regulating a compressor’s mass flow to meet the varying demand of the Plant air system. This device modulates open or closed to give a constant discharge while making use of both the turndown and the pressure rise to surge of the centrifugal compressor. Inlet Guide Vanes Inlet guide vanes as a throttling device on the inlet of a centrifugal compressor stage give capacity modulation and provide power savings. In essence, the inlet guide vanes permit efficient reduction of the extra pressure creating capacity at off design operating conditions. The vanes do this by introducing pre swirl of the air in front of the impeller blade, reducing total momentum (hp/lb of air) imparted to the air during compression. The amount of power reduction available with inlet guide vanes depends on several operating characteristics of the actual compression stage The operational efficiency of either the Butterfly or Inlet guide vanes is limited. All manufacturers tout a 1:1 turndown ratio for up to the first 25%. For example a 1,000 cfm compressor could turn down 25% to 750 cfm and the reduction in BHP would also be 25%. Beyond this turndown of 25% the atmospheric blow-off valve open. In reality the Inlet guide vanes to help but are not as efficient as manufacturers make them out to be. A safe estimate is that the turndown is efficient for the first 10%.
erably. On some machines it make no difference at ll. The turndown is so low it barely affects the amp draw readings.
down s the
ally
m, the control reloads the compressor.
5.1C Inlet Throttling Control Butterfly Control Inlet throttl
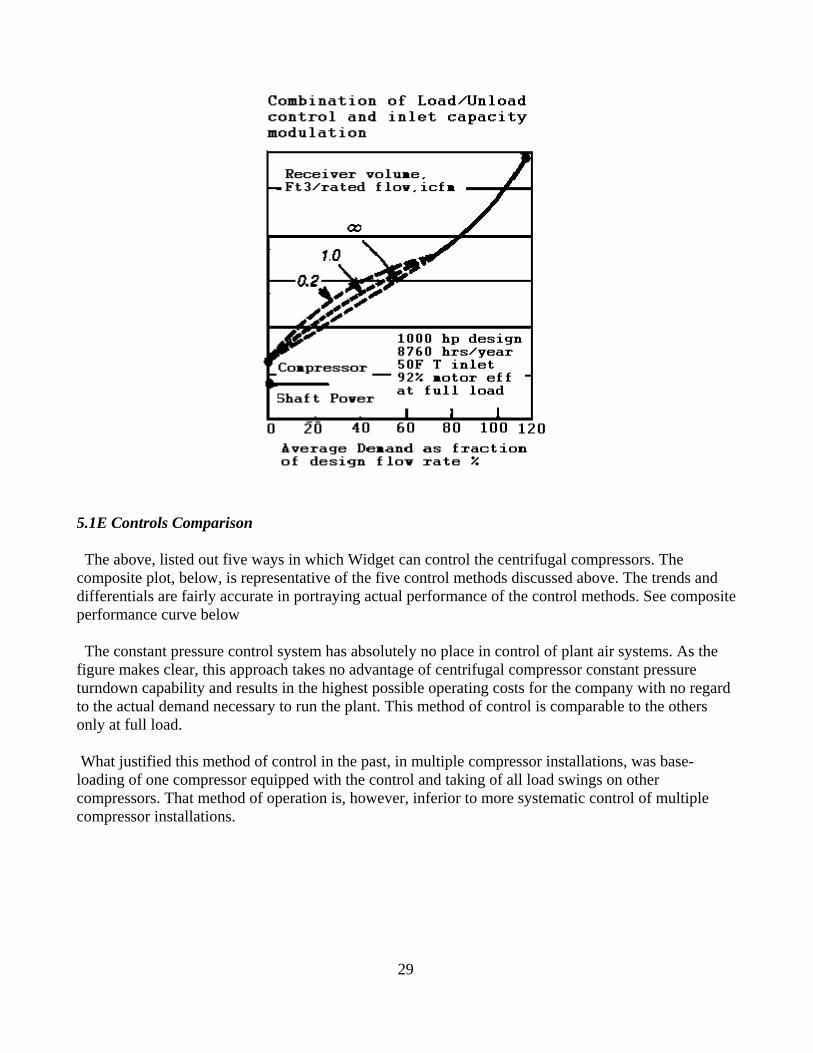
After that figure the BHP savings drops of consida Another aspect on compressor turndown is the style of the impeller blades themselves. There are basically two types; backward leaning and radial. These two highly different design criteria serve to demonstrate how slight is the variation in power requirement for a given mass flow condition. Although the backward leaning blade machine does give an increase in constant pressure turnversus the radial impeller, it requires more specific power consumption to get the turndown. Thusavings is negated. 5.1D Auto Dual Control Auto dual control with inlet guide vanes is a logical combination of load/unload and capacity modulation control. The curve depicted below illustrates inlet guide vane application for throttling compressor output as demand decreases down to the surge protection control point. Demand below that point of minimum steady state supply causes the control to switch to load/unload control where demands are met by alternatively operating near minimum turndown or in a totthrottled condition. The load/unload method for low demand conditions operates by unloading the compressor when air demand is below the minimum turndown point. When the system air pressure falls to the minimu
5.1E Controls Comparison
29
e
ntrol system has absolutely no place in control of plant air systems. As the proach takes no advantage of centrifugal compressor constant pressure
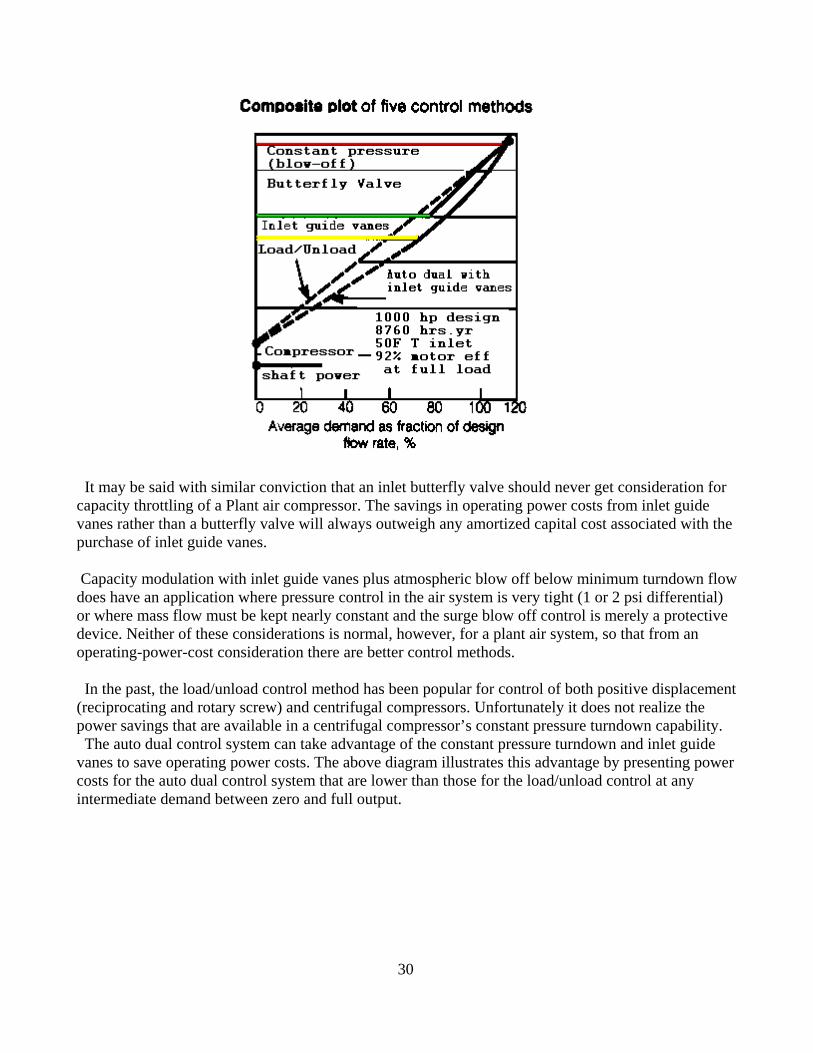
The above, listed out five ways in which Widget can control the centrifugal compressors. The composite plot, below, is representative of the five control methods discussed above. The trends anddifferentials are fairly accurate in portraying actual performance of the control methods. See compositperformance curve below The constant pressure cofigure makes clear, this apturndown capability and results in the highest possible operating costs for the company with no regard to the actual demand necessary to run the plant. This method of control is comparable to the others only at full load. What justified this method of control in the past, in multiple compressor installations, was base-loading of one compressor equipped with the control and taking of all load swings on other compressors. That method of operation is, however, inferior to more systematic control of multiplecompressor installations.
30
It may be said with similar conviction that an inlet butterfly valve should never get consideration for apacity throttling of a Plant air compressor. The savings in operating power costs from inlet guide
valve will always outweigh any amortized capital cost associated with the urchase of inlet guide vanes.
w
e kept nearly constant and the surge blow off control is merely a protective evice. Neither of these considerations is normal, however, for a plant air system, so that from an
are available in a centrifugal compressor’s constant pressure turndown capability. The auto dual control system can take advantage of the constant pressure turndown and inlet guide
ower any
cvanes rather than a butterfly p Capacity modulation with inlet guide vanes plus atmospheric blow off below minimum turndown flodoes have an application where pressure control in the air system is very tight (1 or 2 psi differential) or where mass flow must bdoperating-power-cost consideration there are better control methods. In the past, the load/unload control method has been popular for control of both positive displacement (reciprocating and rotary screw) and centrifugal compressors. Unfortunately it does not realize the power savings that vanes to save operating power costs. The above diagram illustrates this advantage by presenting pcosts for the auto dual control system that are lower than those for the load/unload control atintermediate demand between zero and full output.
31
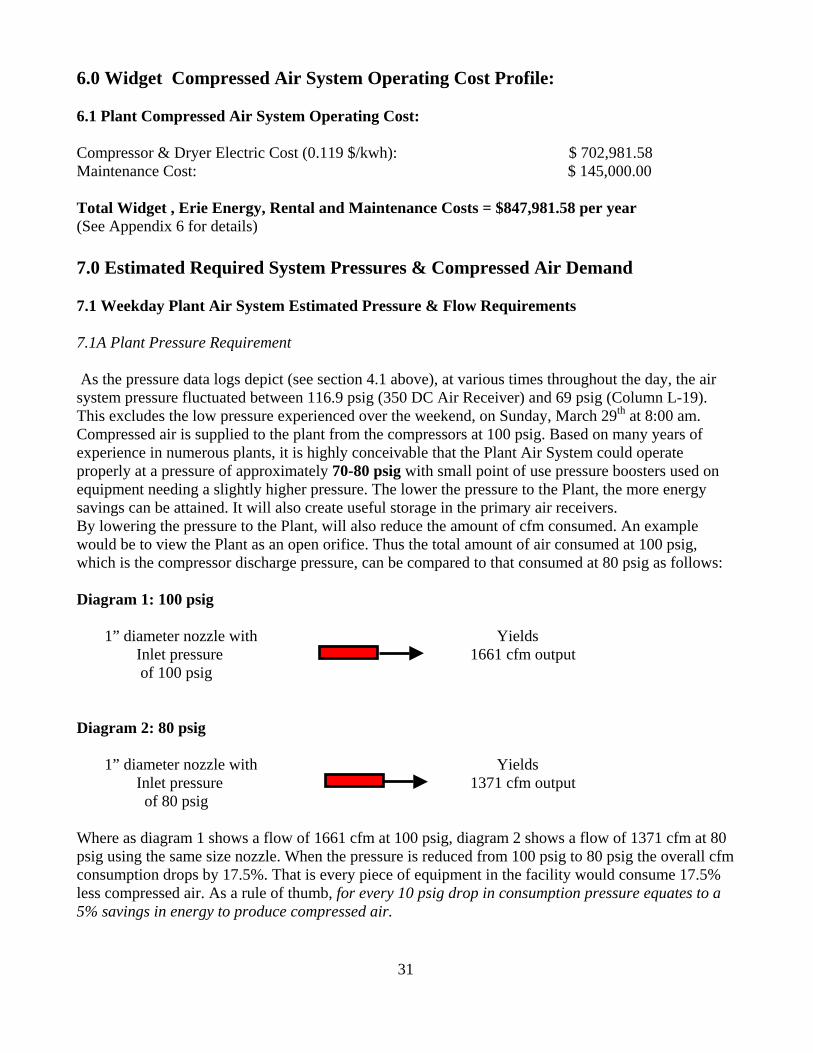
.0 Widget Compressed Air System Operating Cost Profile: 6.1 Plant Compressed Air System Operating Cost: Compressor & Dryer Electric Cost (0.119 $/kwh): $ 702,981.58 Maintenance Cost: $ 145,000.00 Total Widget , Erie Energy, Rental and Maintenance Costs = $847,981.58 per year (See Appendix 6 for details) 7.0 Estimated Required System Pressures & Compressed Air Demand 7.1 Weekday Plant Air System Estimated Pressure & Flow Requirements 7.1A Plant Pressure Requirement As the pressure data logs depict (see section 4.1 above), at various times throughout the day, the air system pressure fluctuated between 116.9 psig (350 DC Air Receiver) and 69 psig (Column L-19). This excludes the low pressure experienced over the weekend, on Sunday, March 29th at 8:00 am. Compressed air is supplied to the plant from the compressors at 100 psig. Based on many years of experience in numerous plants, it is highly conceivable that the Plant Air System could operate
roperly at a pressure of approximately 70-80 psig with small point of use pressure boosters used on
n open orifice. Thus the total amount of air consumed at 100 psig, hich is the compressor discharge pressure, can be compared to that consumed at 80 psig as follows:
output of 100 psig
here as diagram 1 shows a flow of 1661 cfm at 100 psig, diagram 2 shows a flow of 1371 cfm at 80 sig using the same size nozzle. When the pressure is reduced from 100 psig to 80 psig the overall cfm nsumption drops by 17.5%. That is every piece of equipment in the facility would consume 17.5% ss compressed air. As a rule of thumb, for every 10 psig drop in consumption pressure equates to a % savings in energy to produce compressed air.
6
pequipment needing a slightly higher pressure. The lower the pressure to the Plant, the more energy savings can be attained. It will also create useful storage in the primary air receivers. By lowering the pressure to the Plant, will also reduce the amount of cfm consumed. An example would be to view the Plant as aw Diagram 1: 100 psig 1” diameter nozzle with Yields Inlet pressure 1661 cfm Diagram 2: 80 psig 1” diameter nozzle with Yields Inlet pressure 1371 cfm output of 80 psig Wpcole5
32
o the Plant after the dryers (regulation), air onsumption will also decrease. This will affect the operation/performance of the air compressors.
ing t
ompressors in use are designed for 100 psig. Should the air system operate properly at the estimated and drops to
llowing computation depicts the savings in mass flow input cfm.
,805 cfm x 0.483 lb/cu.ft.
ous
rgy savings can be attained. It will also create useful storage in the primary air
med in 7.1B can also be applied in this case:
Plant Air demand is 2,400 cfm at 100 psig. Based on a pressure requirement of equivalent is calculated below.
” cfm
7.1B Compressed Air Demand Requirement The above examples shows that by lowering pressure tcDealing with Mass Flow, a computation can be performed to show the positive effect reducpressure to the Plant can have on the required compressor cfm input. In addition the currenc3,805 cfm @ 80 psig (before removal of inefficiencies), the compressor’s input cfm dem3,141 cfm @ 100 psig. The fo Weight of Air @ 100 psig = 0.585 lb/cu.ft. @ 70F
eight of Air @ 80 psig = 0.483 lb/cu.ft. @ 70F WCFM @ 100 psig = “X” cfm
FM @ 80 psig = 3,805 cfm (estimated demand) C
hus: “X” cfm x 0.585 lb/cu.ft. = 3T Thus Solving for “X” = 3,141 cfm @ 100 psig is required to produce 3,805 cfm at 80 psig Combining the pressure reduction with the reduction in point of use inefficiency will yield tremendoperating and maintenance cost savings. 7.2 Weekend Air System Estimated Pressure & Flow Requirements 7.2A Plant Pressure Requirement On the weekends where typical production is not on-line and compressed air is mainly used as clean-
p, the pressure and demand of the system could be reduced dramatically. The lower the pressure to uthe Plant, the more eneeceivers. r
7.2B Weekend Air Demand Requirement to 40 Psig
he calculation perforT The current weekend
0 psig the mass flow4 Weight of Air @ 100 psig = 0.585 lb/cu.ft. @ 70F
sig = 0.279 lb/cu.ft. @ 70F Weight of Air @ 40 pFM @ 90 psig = “XC
CFM @ 70 psig = 2,400 cfm (estimated demand) Thus: “X” cfm x 0.5085 lb/cu.ft. = 2,400 cfm x 0.279 lb/cu.ft Thus Solving for “X” = 1,144 cfm @ 100 psig is required to produce 2,400 cfm at 40 psig
33
nts 7.3 Proposed Flow and Pressure Requireme
Air Current Current Proposed Proposed
System Flow Pressure Flow (100 Psig) Pressure SCFM PSIG (max) SCFM PSIG
Weekday 3,805 100.00 3,141 80.00
Weekend 2,400 85.00 1,144 40.00
Note: Computations do not take into account Inefficiency removal. 8.0 Leak Management There were 77 air leaks found at the Widget facility. This equated to conservatively, 250 cfm. See Appendix 7 for the complete table. The following information may be useful to Widget in the future in determining leak rates:
fm.
all leaks do not. Short of implementing a full program, leak losses can be mitigated by ption savings approximate 1% per psig.
sults in 10% savings in the air consumed, by a
ns located downstream of the main
* Hear and feel a leak: it's over 5 sc* Felt but not heard: Its leaking 2 - 5 scfm. * Can't be detected by human senses: It still can leak 1 - 2 scfm. Leaks represent a real demand that must be satisfied or production will suffer. Large leaks tend to get fixed, but smfeeding them at the lowest possible pressure. The air consumFor every 10-psig reduction in the supply pressure, releak. Addressing point of use issues by applying pressure regulation will also lower leak losses since most of the small insidious leaks are associated with the work statiopiping header.
34
ncy Costs
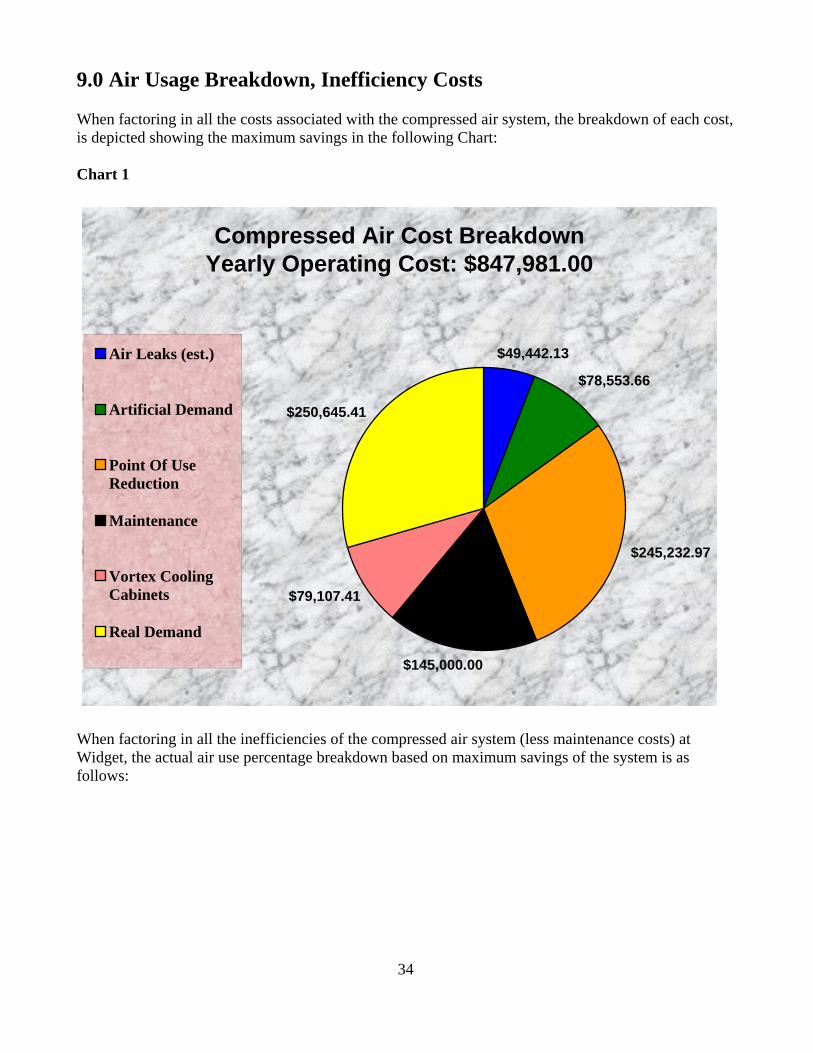
When factoring in all the costs associated with the compressed air system he breakdown of e ch cost, is depicted showing the ma ngs in the Chart: Chart 1
9.0 Air Usage Breakdown, Inefficie
, t aximum savi following
Compressed Air Cost BreakdownYearly Operating Cost: $847,981.00
Air Leaks (est.) $49,442.13
$78,553.66
$245,232.97
$250,645.41Artificial Demand
Point Of UseReduction
Maintenance
Vortex CoolingCabinets
Real Demand
$145,000.00
$79,107.41
hen factoring in all the inefficiencies of the compressed air system (less maintenance costs) at idget, the actual air use percentage breakdown based on maximum savings of the system is as llows:
WWfo
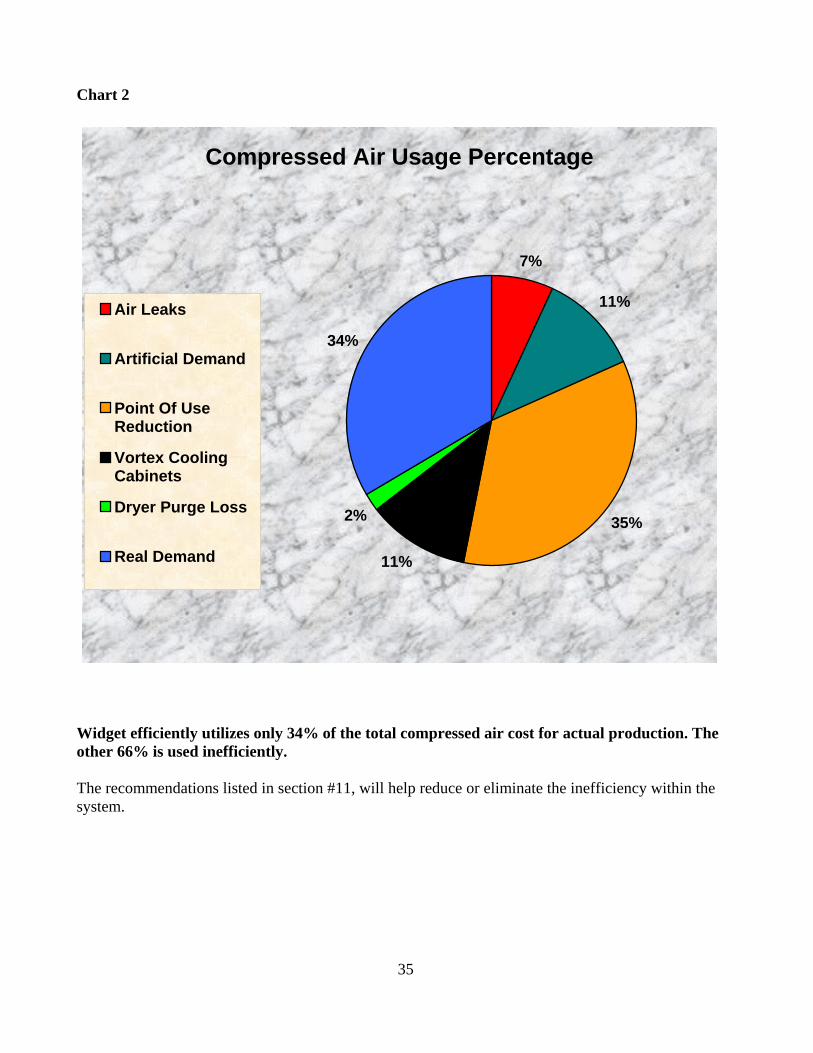
hart 2 C
Compressed Air Usage Percentage
7%
11%
35%
11%
2%
34%
Air Leaks
Artificial Demand
Point Of UseReduction
Vortex CoolingCabinets
Dryer Purge Loss
Real Demand
he
mmendations listed in section #11, will help reduce or eliminate the inefficiency within the ystem.
Widget efficiently utilizes only 34% of the total compressed air cost for actual production. Tother 66% is used inefficiently.
he recoTs
35
36
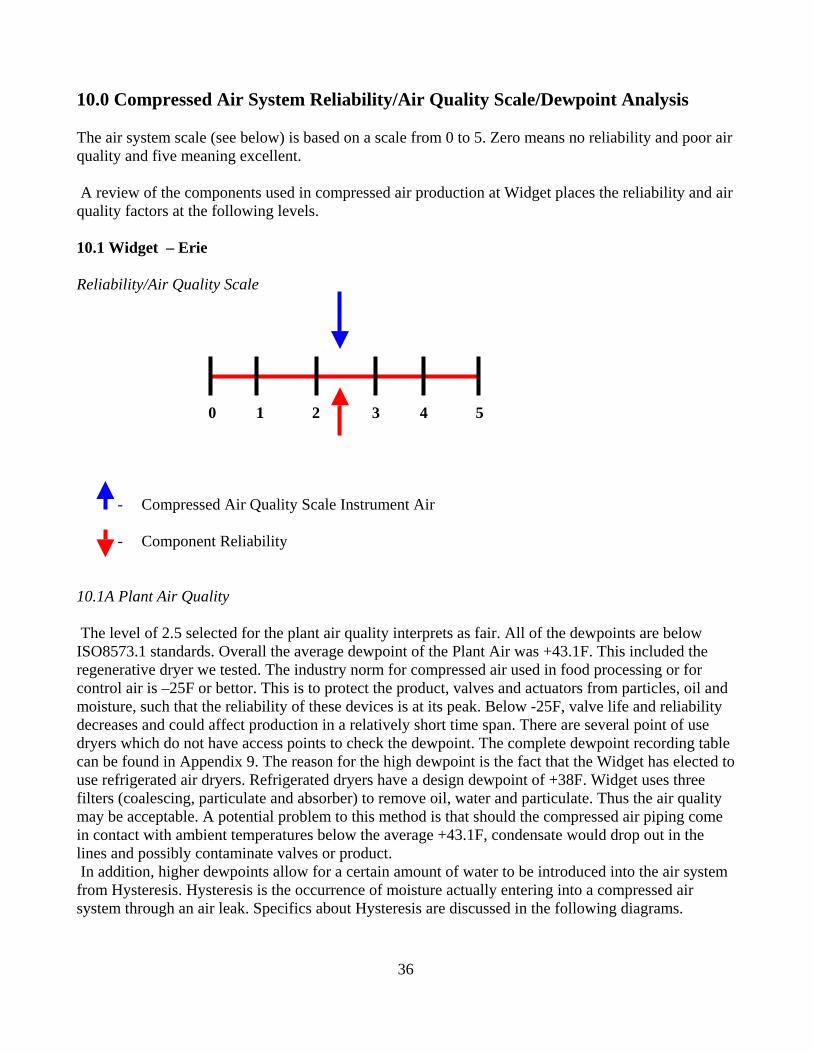
mpressed Air System Reliability/Air Quality Scale/Dewpoint Analysis
The air system scale (see below) is based on a scale from 0 to 5. Zero means no reliability and poor air quality and five meaning excellent. A review of the components used in compressed air production at Widget places the reliability and air quality factors at the following levels. 10.1 Widget – Erie Reliability/Air Quality Scale 0 1 2 3 4 5
- Compressed Air Quality Scale Instrument Air - Component Reliability
10.1A Plant Air Quality The level of 2.5 selected for the plant air quality interprets as fair. All of the dewpoints are below ISO8573.1 standards. Overall the average dewpoint of the Plant Air was +43.1F. This included the regenerative dryer we tested. The industry norm for compressed air used in food processing or for ontrol air is –25F or bettor. This is to protect the p duct, valves and actuators from particles, oil and oisture, such that the reliability of these devices is at its peak. Below -25F, valve life and reliability
eason for the high dewpoint is the fact that the Widget has elected to
ceptable. A potential problem to this method is that should the compressed air piping come
contact with ambient temperatures below the average +43.1F, condensate would drop out in the nes and possibly contaminate valves or product. n addition, higher dewpoints allow for a certain amount of water to be introduced into the air system om Hysteresis. Hysteresis is the occurrence of moisture actually entering into a compressed air stem through an air leak. Specifics about Hysteresis are discussed in the following diagrams.
10.0 Co
c romdecreases and could affect production in a relatively short time span. There are several point of use dryers which do not have access points to check the dewpoint. The complete dewpoint recording tablean be found in Appendix 9. The rc
use refrigerated air dryers. Refrigerated dryers have a design dewpoint of +38F. Widget uses three filters (coalescing, particulate and absorber) to remove oil, water and particulate. Thus the air quality
ay be acminli Ifrsy

Diagram 1
-40 0F DEW POINT AIR AT 100 PSI
Pin Hole Leak
WET AIR
Vapor Condensation and the Venturi Effect
• As 100 psi air rushes out of the pin hole leak, the line air pressure drops to atmospheric pressure.
• The area around the pin hole is cooled by the Joules Thompson effect. Any water vapor in the area is condensed to a liquid.
• Any condensed liquid around the pin hole is drawn f the air
rushing through the pipe.• This intrusion of the liquid into the dry air causes
the dew
37
into the pipe by the Venturi effect o
point to be increased
0 psi air rushes out of the pin hole leak, the line air pressure drops to atmospheric pressure.
• The area around the pin hole is cooled by the Joules Thompson effect. Any water vapor in the area is condensed to a liquid.
• Any condensed liquid around the pin hole is drawn f the air
• This intrusion of the liquid into the dry air causes the dew
• As 10
into the pipe by the Venturi effect orushing through the pipe.
point to be increased
Diagram 2: Cooling Affect
Pin Hole Close-upArea Cooled By
100 psi Air @ - 40°F Dew Point
Joules Thompson Effect
CONDENSED WATER
AIR FLOW
38
enturi Affect
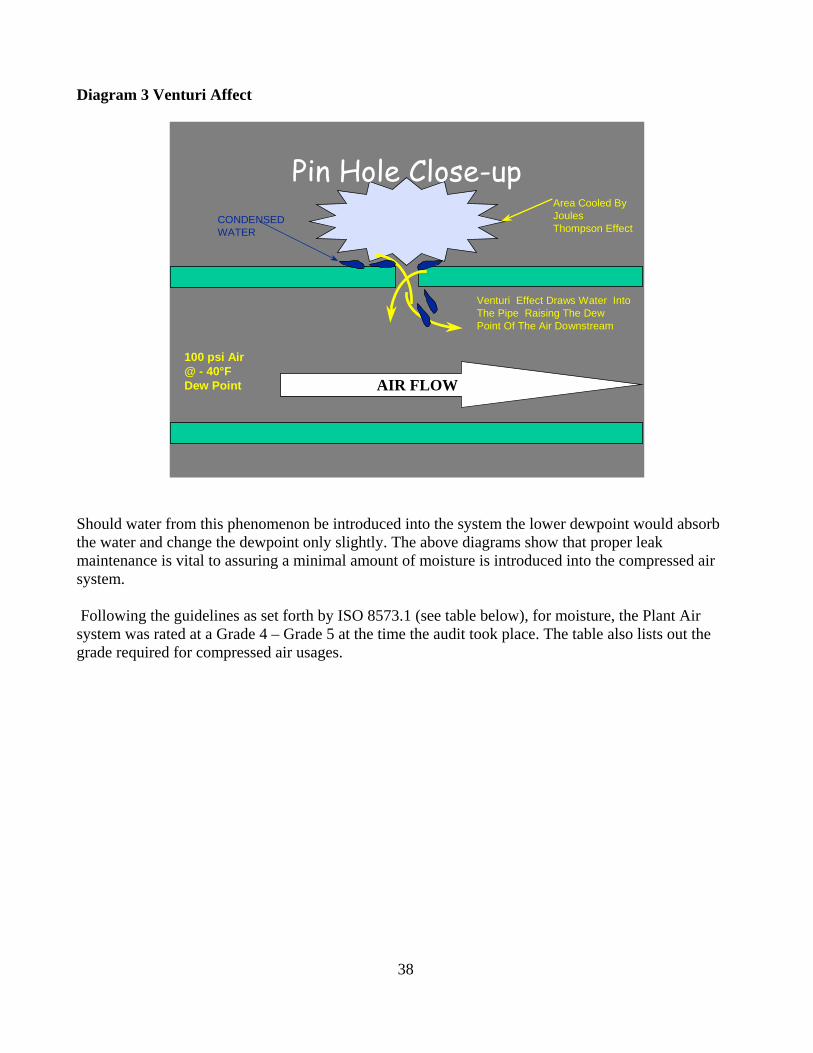
Diagram 3 V
100 psi Air @ - 40°F Dew
Area Cooled By Joules Thompson Effect
CONDENSED WATER
AIR FLOWPoint
Venturi Effect Draws Water Into The Pipe Raising The Dew Point Of The Air Downstream
Pin Hole Close-up
hould water from this phenomenon be introduced into the system the lower dewpoint would absorb the water and change the dewpoint only slightly. The above diagrams show that proper leak maintenance is vital to assuring a minimal amount of moisture is introduced into the compressed air system. Following the guidelines as set forth by ISO 8573.1 (see table below), for moisture, the Plant Air system was rated at a Grade 4 – Grade 5 at the time the audit took place. The table also lists out the grade required for compressed air usages.
S
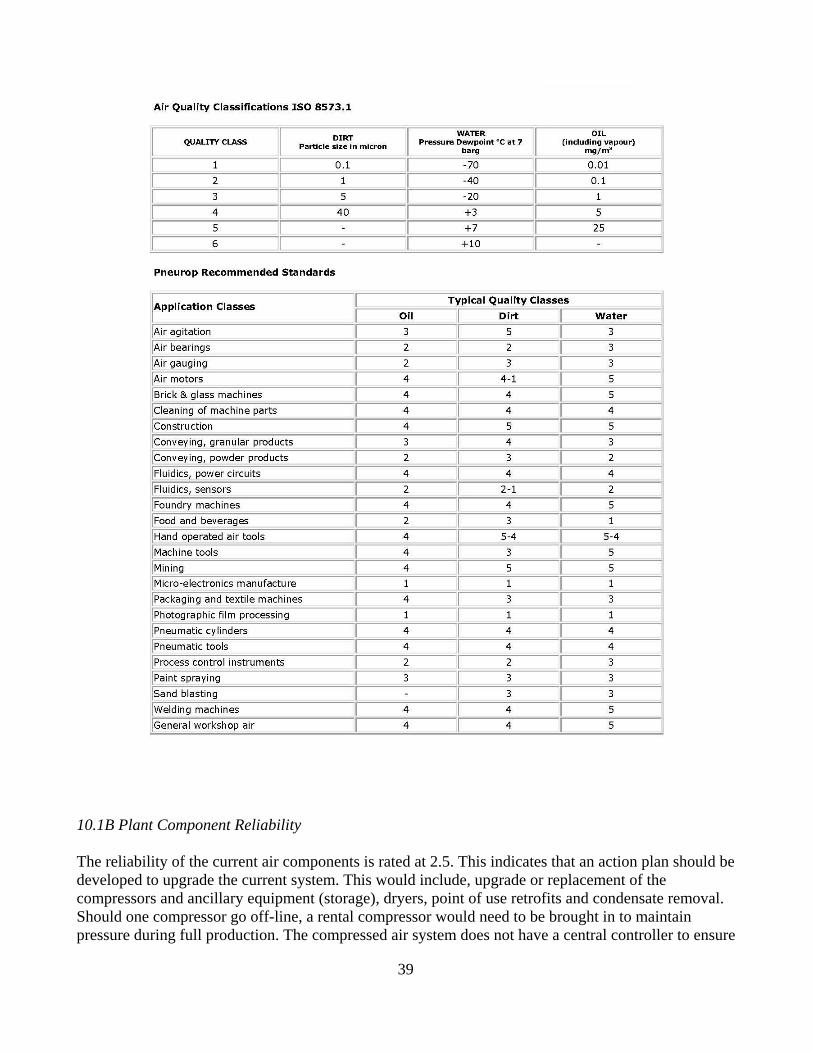
10.1B Plant Component Reliability The reliability of the current air components is rated at 2.5. This indicates that an action plan should be developed to upgrade the current system. This would include, upgrade or replacement of the compressors and ancillary equipment (storage), dryers, point of use retrofits and condensate removal. Should one compressor go off-line, a rental compressor would need to be brought in to maintain pressure during full production. The compressed air system does not have a central controller to ensure
39

40
the proper number of compressors are on line, minimizing Bhp, to satisfy Plant air demand. In addition, the Sullair compressors are antiquated and do not possess the latest capacity controls or high efficiency airends. The Atlas Copco is inherently inefficient as section 3 above clearly shows. There is also insufficient storage capacity to adequately supply the system with compressed air, such that pressure fluctuations can be kept to a minimum and artificial demand can be reduced. This lack of storage is most evident when a production line is brought on-line, where-by plant air pressure throughout the entire Plant collapses and forces Widget to have more compressors on-line than necessary. The extra compressors are on-line as a precautionary measure to prevent the pressure drop should an event demand occur (i.e. four or more air hoses being turned on at once). Based on these facts and the age and efficiency of the equipment and advances in new compressor and dryer technology, the reliability of 2.5 was selected. 11.0 Recommendations 11.1. Reduce Compressed Air Drying Locations It is recommended to consolidating air production (compressors, primary air receivers, filters and dryers) to the following areas:
a. 150 – 450 Compressor Area b. 350 DC Compressor Area
Both of theses areas have power, cooling water, space for ease of maintenance repairs and good ventilation. Both areas are currently the main air production areas. Consolidating compressed air operations in these areas will have several benefits, as listed below:
1. Increase the efficiency and reliability of the system. 2. Reduce maintenance time and cost. 3. Increase in the control of the air quality. 4. Increase in the control of pressure distributed to the facility. 5. Reduction or elimination of satellite air dryers and purge air losses. 6. Elimination of in-plant filter pressure drop. 7. Reduction in on-line hp/operating costs. 8. Increase in useful storage.
The remaining satellite dryers around the Plant, can be shut off and by-passed to act as back up to the primary compressor areas. 11.2 Add New Centrifugal or Two Stage Rotary Screw Compressor (150 – 450 Area)
cement of the two Sullair compressors in the 150 – 450 state of the art compressors and controls will increase efficiency
Future planning should include replaompressor area. Replacement with c
by 16% at full loads and at minimum 25% at part load demand. It is recommended to install either two 300 Hp centrifugals or two 300 Hp, two stage oil flooded rotary screw compressors (with VFD control). A provision to move one of the compressors to the DC350 Area for back-up should also be considered. This would eliminate any need for rental compressors should one of the primary compressors go off-line.
41
e
nstall zed
for
a erative
own to 2% – 3%. Utilizing the vacuum pump will use nsiderably less energy than either a standard regenerative or blower/heated dryer currently offered
uld be an oil-less rotary vane.
ain Lines to Replace Time Drains
will
thus eliminates valve malfunction. The drains should have a signal arn if there is a problem with the drain operation. In addition
tion to alert maintenance that will be performing daily
and works in pressors at approximately
he storage battery will have two outlet FS) dedicated to the Plant and Instrument air system
es will be at each compressor ould have a multi-valve
lti-valve design will in place. The following sections will give a more
s.
aintain it within 2-3 psig throughout the entire plant. in nges
act
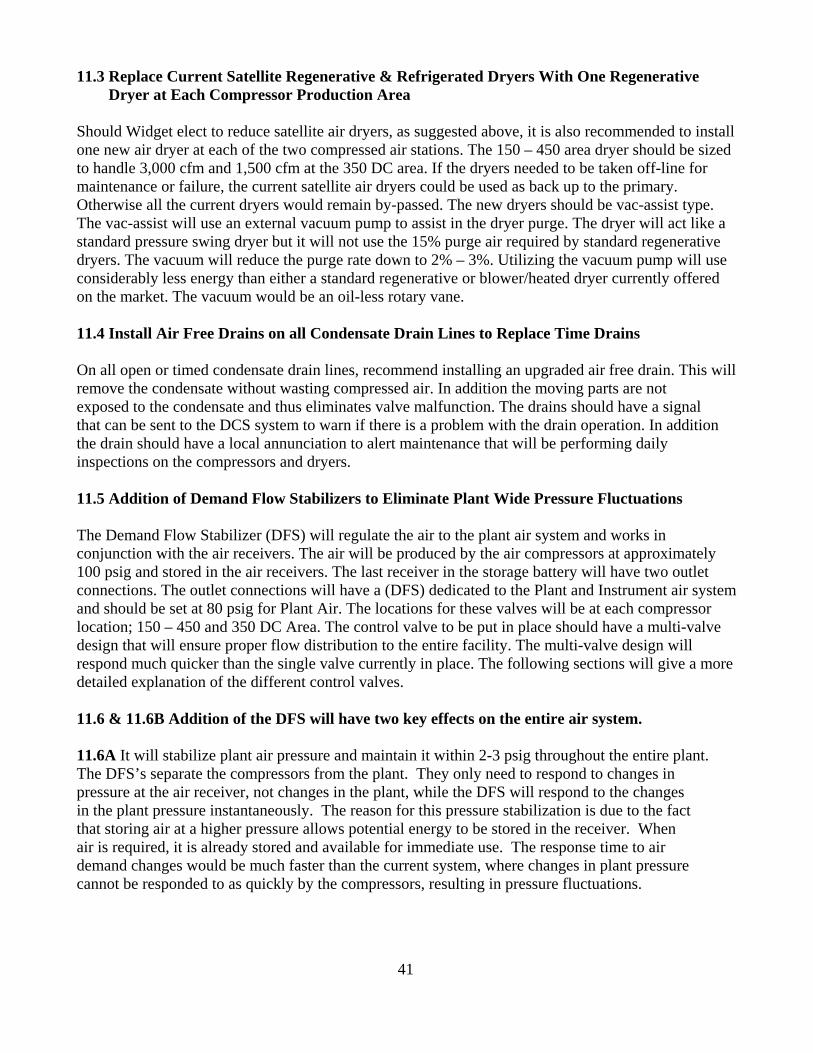
11.3 Replace Current Satellite Regenerative & Refrigerated Dryers With One Regenerativ Dryer at Each Compressor Production Area Should Widget elect to reduce satellite air dryers, as suggested above, it is also recommended to ione new air dryer at each of the two compressed air stations. The 150 – 450 area dryer should be sito handle 3,000 cfm and 1,500 cfm at the 350 DC area. If the dryers needed to be taken off-linemaintenance or failure, the current satellite air dryers could be used as back up to the primary. Otherwise all the current dryers would remain by-passed. The new dryers should be vac-assist type. The vac-assist will use an external vacuum pump to assist in the dryer purge. The dryer will act likestandard pressure swing dryer but it will not use the 15% purge air required by standard regendryers. The vacuum will reduce the purge rate dcoon the market. The vacuum wo 11.4 Install Air Free Drains on all Condensate Dr On all open or timed condensate drain lines, recommend installing an upgraded air free drain. Thisremove the condensate without wasting compressed air. In addition the moving parts are not xposed to the condensate and e
that can be sent to the DCS system to wiathe drain should have a local annunc
spections on the compressors and dryers. in 11.5 Addition of Demand Flow Stabilizers to Eliminate Plant Wide Pressure Fluctuations
he Demand Flow Stabilizer (DFS) will regulate the air to the plant air systemTconjunction with the air receivers. The air will be produced by the air com100 psi and stored in the air receivers. The lg ast receiver in tconnections. The outlet connections will have a (Dand should be set at 80 psig for Plant Air. The locations for these valvlocation; 150 – 450 and 350 DC Area. The control valve to be put in place sh
entire facility. The mudesign that will ensure proper flow distribution to thentlyrespond much quicker than the single valve curre
control valvedetailed explanation of the different 11.6 & 11.6B Addition of the DFS will have two key effects on the entire air system. 1.6A It will stabilize plant air pressure and m1
The DFS’s separate the compressors from the plant. They only need to respond to changesressure at the air receiver, not changes in the plant, while the DFS will respond to the chap
in the plant pressure instantaneously. The reason for this pressure stabilization is due to the fthat storing air at a higher pressure allows potential energy to be stored in the receiver. When air is required, it is already stored and available for immediate use. The response time to air demand changes would be much faster than the current system, where changes in plant pressure cannot be responded to as quickly by the compressors, resulting in pressure fluctuations.

42
S rs to less than 1,497 cfm @ 100 psig, which
cludes removal of inefficiencies.
hy r
critical to keeping the air system under ontrol.
here are two important goals:
es.
lly a constant balance point pressure. A typical regulator
an not accomplish this task.
egulators control by changing the differential pressure across the valve to maintain a set outlet ntrol the
of
ntrol best at 53 psig out. Since the regulator spring lance is non-linear, the further the actual outlet pressure is from the designed 53%, the poorer the
such as oint of use, where the air is being expanded to atmosphere. At the intermediate point of an air
let pressure om storage is 100 psig and the regulator requires 15 psi differential force pressure to operate, it can
only “begin” to control at a pressure of 85 psig. The storage resulting from the 15-psi differential must always remain in the receiver or the system pressure will collapse.
11.6B Air will be stored at 100 psig and distributed at approximately 80 psig. Installation of the DFhas the potential for reducing output of the compressoin 11.6C Demand Flow Stabilizers (DFS) vs. Regulators The most frequently asked question concerning the application of demand flow stabilizers is "wcan't a regulator be used?" An understanding of the performance required of a demand flow stabilizeand the capabilities of a standard pressure regulator would provide the answer. Any device that imposes a differential pressure across a vessel will create storage. Applied in this manner, a regulator can be used to create storage in a receiver tank. But creating storage is not the same as utilizing storage. It is the utilization of storage that is c T 1. Provide production with a stable, consistent, reliable supply of compressed air at all tim 2. Satisfy all load demands with the minimum amount of expended energy. To achieve these goals, the air system must be configured using a demand flow stabilizer to fuutilize all available storage while maintainingc Rpressure. Flow becomes a consequence of the changing differential. The force required to codifferential adds to the total pressure drop and subtracts from usable storage. The demand flow stabilizer maintains the set outlet pressure by changing flow. Differential pressure is a consequencethe change in flow and can be designed to a minimum, even to the point of approaching a zero pressure drop. Standard regulators are designed using what is called the "53 Rule". The "53 Rule" design criteriadefines the optimum operating point for a regulator as 53% of the inlet pressure. For example, with a 100-psig inlet pressure, a regulator is designed to cobaregulator will perform. The 53% design criteria is fine for instrument air and applications psystem, however, the controlled outlet pressure is usually 60-80% of inlet. The "53 Rule" severely limits the overall performance of a standard regulator when applied as a demand flow stabilizer. Regulators typically require a force load pressure of 12 - 18 psi to move the internal spring before they can even begin to control. This counterbalance force pressure is unavailable for controlling the outlet pressure and is lost energy. While it will create a differential pressure and add air to storage, the reserve energy created by the force pressure is unusable. The highest initial controlled outlet pressure of the regulator is equal to the inlet pressure less the force pressure. For example: If the infr

43
ge, pacts on the outlet pressure. It also subtracts from the inlet
ressure. As flow from storage increases, the total pressure drop across the regulator becomes higher. al is required before a stable balance point
n be established through utilization of storage.
ing differential creates hat is termed "primary storage" upstream. The air released from the primary storage continuously
hich in reality, is a fixed volume vessel. At the other end of the piping distribution system re the points of use where the air is expanded from a fixed pressure to atmosphere to produce work.
n the outlet of the demand flow stabilizer and the end pressure prior to oing work creates system storage in the connecting piping distribution system. This is termed
ond he storage.
all conditions to assure production will always have available a constant, table source of compressed air and the system will not draw down and collapse. The demand flow
point
re will fall off as the flow through the regulator increases. A regulator set to control at a fixed ressure will control at an ever decreasing outlet pressure as the flow increases. A regulator set at 100
n.
es, urge
e. In large system with long runs of big diameter header pipe, the replenishment of secondary storage can
n
The word “begin” must be emphasized because as demand calls for air to be released from the storaa pressure differential due to flow impWith a typical regulator, as much as a 20-30 psi differentica It is important to understand what is actually occurring with the pressure and flow at the intermediate point of the air system. The demand flow stabilizer impedes flow and the resultwsatisfies the instantaneous cumulative demand of the entire system. The downstream side of the demand flow stabilizer is connected to a lengthy piping distribution system, waThe differential pressure betweed"sec ary" storage and is used to stabilize the pressure at the production points of use. Note also taddition of a storage tank at or near the point of use is also included as secondary In a properly configured system, air used by production first cascades from primary storage into secondary storage in a manner directed by the demand flow stabilizer. Secondary storage must be adequately replenished under sstabilizer must be very responsive to the dynamic changes in flow while holding a steady balancepressure. Standard pressure regulators cannot address secondary storage adequately because they have a characteristic known as droop. Droop is the term used to quantify the degree the controlled outlet pressuppsig at low flow condition might droop to a critical point pressure of 85 psig at its full flow conditioDepending upon the characteristics of the specific valve and the design criteria used in its selection, droop can range from 10% - 45%. Flow at the intermediate point in the system will vary as a function of demand. When the load surgthe demand flow stabilizer must open quickly to increase the flow to satisfy the demand. If the soccurs at the same time as a secondary storage is depleted, the total flow peaks even higher as the demand flow stabilizer must replenish secondary storage at the same time it satisfies the load surgaactually exceed demand flow by double and more. The demand flow stabilizer must be capable of handling this flow or the system pressure will collapse. The outlet pressure of a regulator selected to handle the full range of flows will wander as it droops when it has to satisfy the peak flow and thecreeps back up during steady flow conditions. The intermediate point is the aorta of the air system. Relying on a single control valve jeopardizes the entire production facility in the event it fails or become erratic in its operation. Multiple regulators installed in parallel will interfere with one anotherresulting in a lead-lag operation.

44
summary, a demand flow stabilizer offers the following advantages to a standard regulator. Requires
sive
nt artificial demand of the plant as described
bove. The DFS is placed after the air receivers. The air will be stored in the receivers at 100 psig
l demand, reduce operating costs
nd create “Useful Storage” correctly utilizing air receivers.
ng
Equating is to stored air is as follows: (20 psi/14.7) * (4,000 gal / 7.48) = 727 cu. ft. of useful storage.
erential. Equating this to stored air is as follows: (20 psi/14.7) * (2,250 gal / 7.48) = 409 cu. . of useful storage.
r
e ine
e time/cost 3. Reduction in electrical consumption
Inless than 3 psi differential force load pressure to operate, uses a mechanically amplified bias signal to eliminate droop, will operate in parallel with other demand flow stabilizers and allows for responcontrol at both high and low flow conditions. A flow control valve or Demand Flow Stabilizers (DFS) should be added to the air system. This valve will be used to eliminate or reduce the curreaand released to the plant via the DFS at 80 psig. The DFS will respond quicker, more efficiently to plant air demands, than the current compressors. It will also maintain a stable plant air pressure, eliminating unacceptable pressure fluctuations and stabilize plant air pressure in all parts of plant. Asan added benefit, the Demand Flow Stabilizer will eliminate artificiaa 11.7A Add 3,000 gallons (401 Cu. Ft) Storage At The 150 - 450 Compressor Area The addition of 3,000 gallons of storage at the 150 – 450 Area is to ensure there is ample, "useful storage". Useful storage is defined as the differential pressure between stored pressure and workipressure. This would be in addition to the 1000 gallon tank currently in place. In this case, if a Plant Air demand of 80 psig is used, the useful storage is 100 psig - 80 psig = 20 psi differential.th 11.7B Convert 2250 Gallon (300 Cu.Ft.) at 350 DC To Useful Storage The conversion of the 2,250 gallon tank at the 350 DC Area will increase "useful storage". As in the above case, if a Plant Air demand of 80 psig is used as above, the useful storage is 100 psig - 80 psig = 20 psi diffft To simplify, a good rule of thumb is to have at least 3 gallons of storage for every scfm of demand.This will ensure that if there is an instantaneous demand of up to 1136 cu.ft (727 cu.ft + 409 cu.ft.) foair in the Plant, the air receivers will be able to handle the load in lieu of starting another air compressor to keep the plant air pressure from falling. 11.8 Compressor Controls Recommend installing a master control for all the air compressors, dryers and DFS valves for the two recommended compressor locations. The master controller would automatically bring online or off-linthe compressors and dryers as needed to ensure the minimum amount of horsepower would be on-lto supply the facility. A compressor controller would ensure that if the demand fell, a compressor would automatically shut down. The controller would also rotate equipment to ensure even runtime among the compressors and dryers. The master controller should also be connected to allow maintenance to remote monitor the compressor functions from a desktop. Consolidating compressors will accomplish the following: a. Overall benefits 1. Elimination of satellite compressors & dryers. 2. Reduction in maintenanc

45
with automatic change over should a compressor fail.
d increasing reliability and quality of the air released to the plant.
4. Dryer dewpoint (optional)
other words, there will be single source reliability for the compressed air system as depicted below.
4. Constant dewpoint (-25F minimum) 5. Reduction of online horsepower b. Compressor Control 1. Automatically control compressors and dryers 2. Automatically turn compressor and dryers on or off depending on system air demand 3. Automatically rotate compressors and dryers for even wear 4. Control system discharge pressure to the plant c. Reliability/Backup 1. Reliability will increase. 2. Compressed air system will have 100% redundancy 3. Satellite dryers and compressors will be eliminated reducing maintenance an
d. Remote Monitoring 1. Plant CFM demand 2. Plant Air Pressure 3. Compressor maintenance items (optional)
In
150 – 450 Compressor Area
46
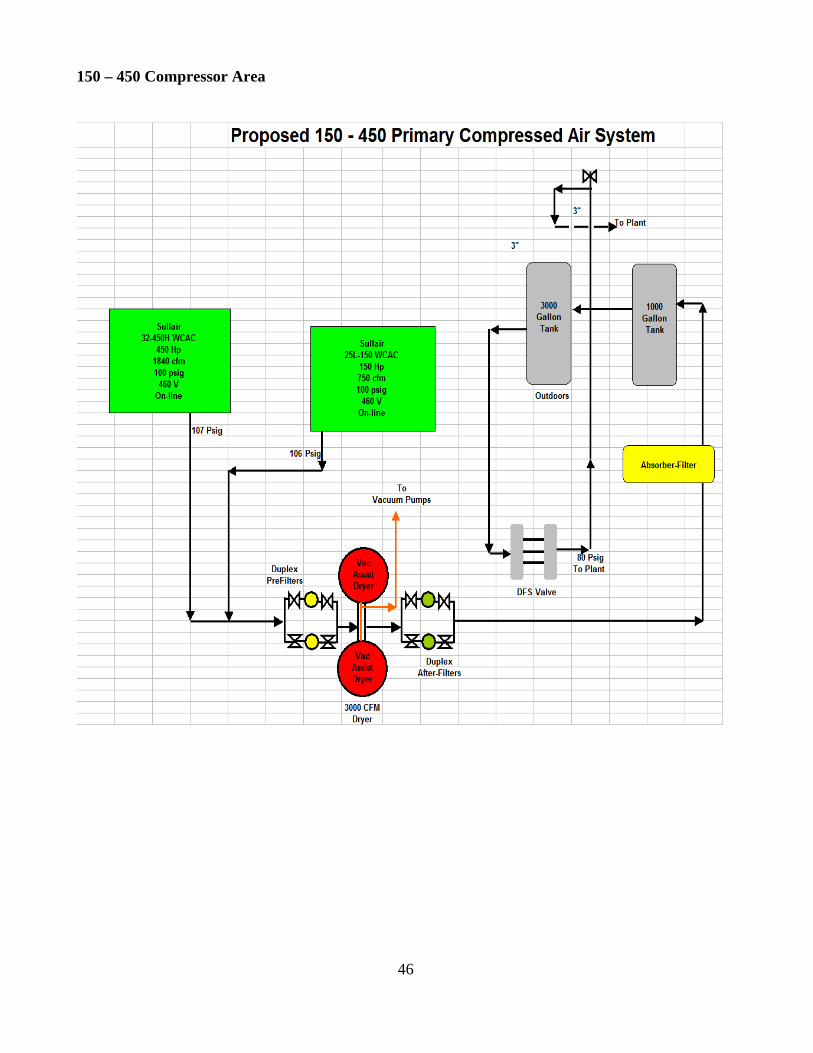
350 DC Area
47
11.9 Repair Plant Air Leaks
sing the leak audit table in Appendix 7, Widget should institute a program to repair all the leaks sted in the table.
1.10 Air Leak Management
fter repairing air leaks it is recommended that Widget continue to institute an air leak program hereby a leak audit is performed no less than once per year.
Uli 1 Aw
48
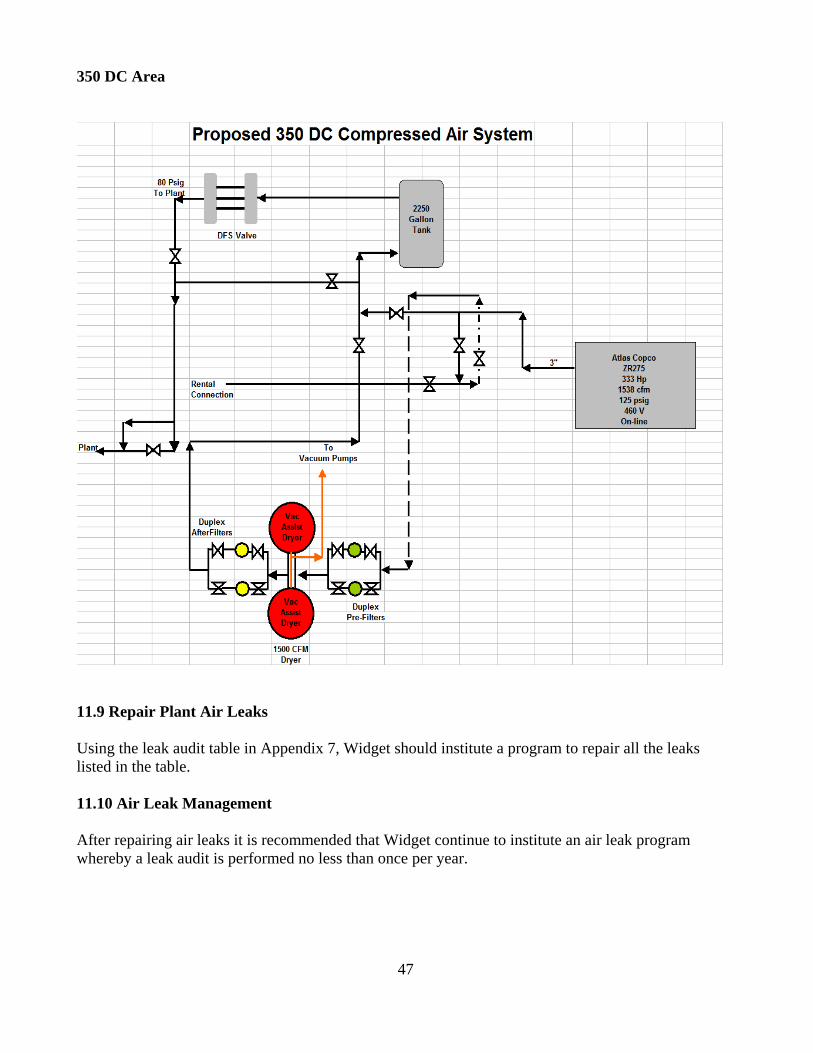
1.11 Cooling Air/ Blow-Off / Clean-Up Wands
idget uses, open jets or crimped pipe for cleanup, cooling or blowing off debris. By replacing the current nozzles with a high efficiency type nozzle, flow requirements can be drastically reduced. There are numerous manufacturers of these devices. The chart below depicts the savings in cfm that can be attained by incorporating said device.
For example, assume Widget needs approximately 50 cfm per open jet. According to this chart an input of 6.1 scfm at 80 psig will deliver 73 cfm. This is a savings of 44 scfm per nozzle. Thus the cooling of any device can be done at a fraction of the cost. In addition to cfm savings, these types of devices also reduce the noise associated with open-air jets. In most cases the Dba drops to the low 70’s range. 11.12 Replace Blow-Off Pipes With Air Knives
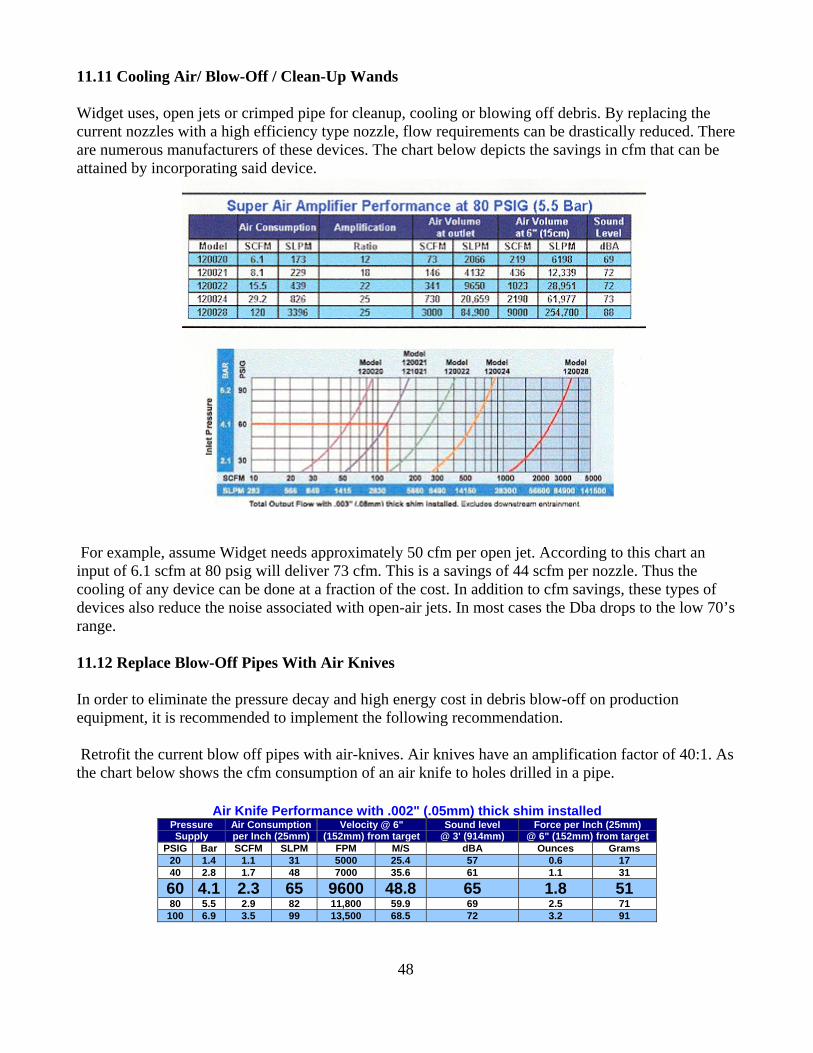
order to eliminate the pressure decay and high energy cost in debris blow-off on production quipment, it is recommended to implement the following recommendation.
pes with air-knives. Air knives have an amplification factor of 40:1. As
Air Knife Performance with .002" (.05mm) thick shim installed
1 W
Ine Retrofit the current blow off pithe chart below shows the cfm consumption of an air knife to holes drilled in a pipe.
Pressure Supply
Air Consumption per Inch (25mm)
Velocity @ 6" (152mm) from target
Sound level Force per Inch (25mm) @ 3' (914mm) @ 6" (152mm) from target
PSIG Bar SCFM SLPM FPM M/S dBA Ounces Grams 20 1.4 1.1 31 5000 25.4 57 0.6 17 40 2.8 1.7 48 7000 35.6 61 1.1 31 60 4.1 2.3 65 9600 48.8 65 1.8 51 80 5.5 2.9 82 11,800 59.9 69 2.5 71
100 6.9 3.5 99 13,500 68.5 72 3.2 91
49
Holes Drilled in Pipe Pressure Supply
Air Consumption
1/16" (1.59mm) dia. hole
Air Consumption
3/32" (2.38mm)dia. hole
Air Consumption1/8" (3.18mm)
dia. hole
Air Consumption
3/16" (4.76mm)dia.hole
Air Consumption 1/4" (6.35mm)
dia.hole PSIG Bar SCFM SLPM SCFM SLPM SCFM SLPM SCFM SLPM SCFM SLPM
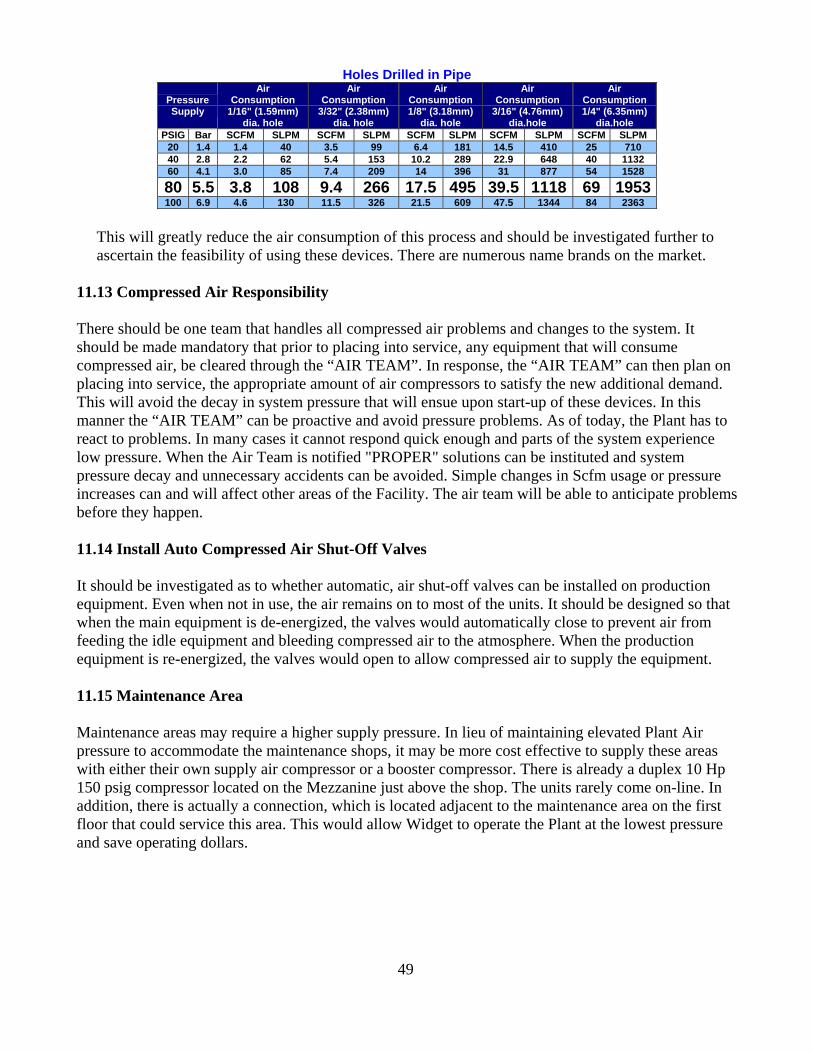
20 1.4 1.4 40 3.5 99 6.4 181 14.5 410 25 710 40 2.8 2.2 62 5.4 153 10.2 289 22.9 648 40 1132 60 4.1 3.0 85 7.4 209 14 396 31 877 54 1528 80 5.5 3.8 108 9.4 266 17.5 495 39.5 1118 69 1953 100 6.9 4.6 130 11.5 326 21.5 609 47.5 1344 84 2363
This will greatly reduce the air consumption of this process and should be investigated further to ascertain the feasibility of using these devices. There are numerous name brands on the market. 11.13 Compressed Air Responsibility There should be one team that handles all compressed air problems and changes to the system. It should be made mandatory that prior to placing into service, any equipment that will consume compressed air, be cleared through the “AIR TEAM”. In response, the “AIR TEAM” can then plan on placing into service, the appropriate amount of air compressors to satisfy the new additional demand. This will avoid the decay in system pressure that will ensue upon start-up of these devices. In this manner the “AIR TEAM” can be proactive and avoid pressure problems. As of today, the Plant has to react to problems. In many cases it cannot respond quick enough and parts of the system experience low pressure. When the Air Team is notified "PROPER" solutions can be instituted and system pressure decay and unnecessary accidents can be avoided. Simple changes in Scfm usage or pressure increases can and will affect other areas of the Facility. The air team will be able to anticipate problems before they happen. 11.14 Install Auto Compressed Air Shut-Off Valves
hat
ent is re-energized, the valves would open to allow compressed air to supply the equipment.
ir e to supply these areas
ith either their own supply air compressor or a booster compressor. There is already a duplex 10 Hp
nd save operating d
It should be investigated as to whether automatic, air shut-off valves can be installed on production equipment. Even when not in use, the air remains on to most of the units. It should be designed so twhen the main equipment is de-energized, the valves would automatically close to prevent air from feeding the idle equipment and bleeding compressed air to the atmosphere. When the production equipm 11.15 Maintenance Area Maintenance areas may require a higher supply pressure. In lieu of maintaining elevated Plant Apressure to accommodate the maintenance shops, it may be more cost effectivw150 psig compressor located on the Mezzanine just above the shop. The units rarely come on-line. In addition, there is actually a connection, which is located adjacent to the maintenance area on the first
oor that could service this area. This would allow Widget to operate the Plant at the lowest pressure fla ollars.

50
11.16 Retrofit Infra-Red Sensor Blow-O It is recommen re ra-red sensors with either Hi-“E” nozzles. This will reduce the amount of co 45 cfm f implex blower unit on each machine. 11.17 Retrof l in i n
lieu of using the vortex coolers to maintain temperature in control boxes, it is proposed to replace
ff
ded to trofit the infdmpressed air use from to 6 c m. A second option would be to put a s
it Contro Cab ets W th Fa s
Inthe vortex coolers with box fans. These units would most likely perform satisfactorily on all the boxes except those between the two ovens. In this region, ambient temperature may be too great to keep theboxes from overheating using just a fan. In all cases, air to the vortex coolers was still on, even when production equipment was off-line. 12.0 Equipment Required/Costs/Payback: 12.1 Project 1: Compressed Air Upgrade Project Project I Project description: This project will entail the installation of storage, vac-assist dryers, air free drains, demand flow stabilizers, compressor controls (optional) and monitoring equipment (optional). It includes retrofit of he production equipmt ent air cooling or blow-off mechanisms, nozzles and air lances with High “E”
ir knives and, air shut-off valves. It also
of back-up compressors and dryers.
devices and regulators. Retrofitting of equipment with ancludes air leak repair. i
End Result: The end result of the project will be the reduction in compressors on-line. It will also reduce compressed air demand and stabilize plant air pressure. It includes a reduction in satellite air dryers nd increase in efficiency/reliability of compressed air production. It will also lead to a reduction in a
maintenance costs, creation
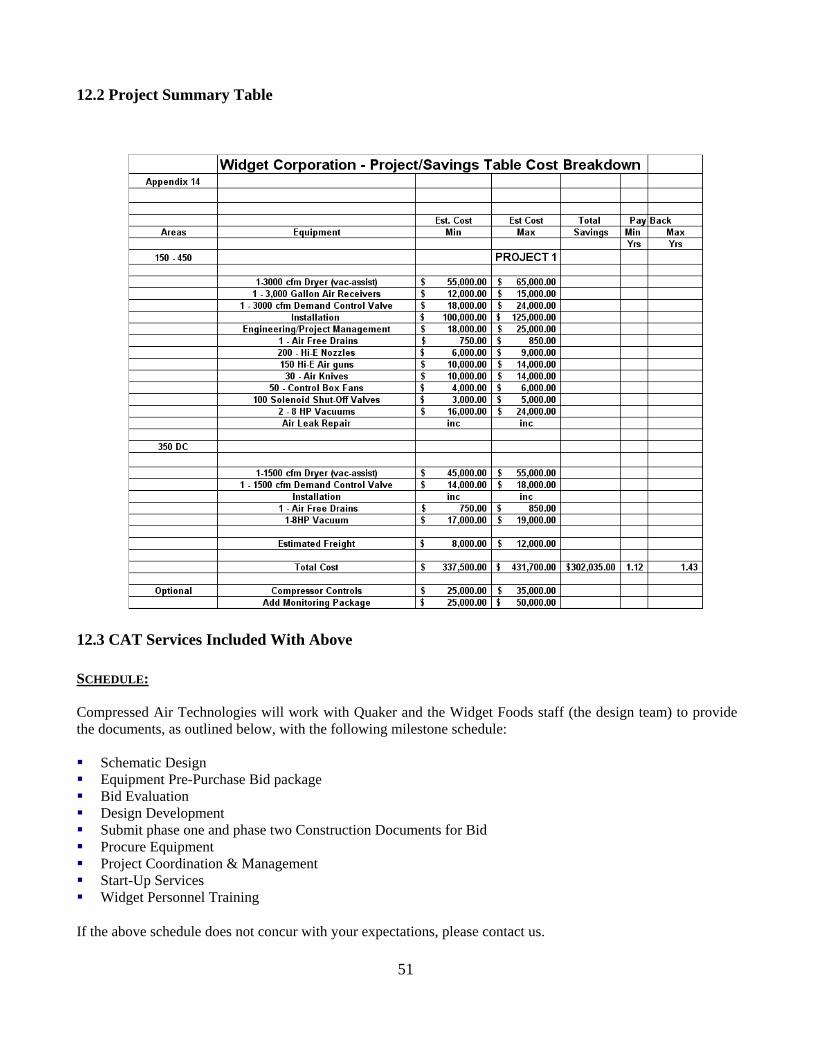
51
2.2 Project Summary Table 1
12.3 CAT Services Included With Above SCHEDULE: Compressed Air Technologies will work with Quaker and the Widget Foods staff (the design team) to provide
e documents, as outlined below, with the following milestone schedule:
Schematic Design Equipment Pre-Purchase Bid package Bid Evaluation Design Development Submit phase one and phase two Construction Documents for Bid Procure Equipment Project Coordination & Management Start-Up Services Widget Personnel Training
the above schedule does not concur with your expectations, please contact us.
th
If
52
S PROJECT WILL BE AS FOLLOWS: OUR SCOPE OF SERVICES FOR THI
chematic Design: S
This phase will include major component selections and conclusions of all system types and locations, electrical requirements, service locations and other required physical space requirements and support spaces. At the completion of this phase, based on a specific final scope, a revised/specific cost estimate will be generated. At the completion of this phase, the equipment bid package will be submitted for bid. Design Development Phase:
This phase will include more detailed design information. Weights and sizes of equipment will be provided to structural disciplines. Room level details will begin to be identified. General specifications will be available at the completion of this phase, if required, for submittal. The probable cost estimate will be reviewed comparing the schematic cost estimated to include any additional work identified as part of the detailing of the work, to the scope outline.
Bidding Phase:
Compressed Air Technologies will provide bidding support services for required clarifications associated with the presentation of their disciplines work on the contract documents. Required addendum will be issued. Construction Services: Compressed Air Technologies have included construction services in the design cost listed above. Construction Services will be limited to meeting attendance, system installation review for installation compliance to project specifications and offsite factory performance testing including compliance sign off. These services will be provided to the Widget to facilitate the construction process. They also include construction management services such as day-to-day scheduling, phasing and/or mediation between contractors. Onsite time capped at 10 days.
SERVICES PROVIDED BY THE WIDGET:
A. Electrical wiring of dryers, vacuum pumps, drains, DFS valves.
B. Retrofit of air nozzles, guns, knives and control box fans.
AYMENT/TERMS:P CAT Inc. will invoice against the completion of the project net thirty (30) days of the date of our invoice.

53
.0 Conclusion
ct viable, the following preliminary action items must be implemented:
Determine equipment layout and pipe tie-ins Check availability of utility connections (electric, water, sewer)
c. Engineering of Equipment/Piping
f. Specification Issuance to Vendors aluation
stall new equipment and controls at primary compressor area. 6. Perform new system Start-Up.
. Turn off all satellite compressors.
Set discharge pressure on the com ressors to 100 psig.
the items listed above, the following operating strategy should be implemented:
the lant Air System. Every two days, the base pressure should be lowered by 2 psig. This turn down eriod will allow a gradual decrease in system air pressure and allow equipment that may require igher pressure to be identified. For example, the requirements for impact wrenches, which are esigned for 450 ft lbs., torque at 90 psig. As the Plant air pressure is decreased, these tools would be e first to drop out. At that point a decision can be made to hold the base pressure at a slightly higher
ressure to accommodate the impact wrenches, add special booster compressors or use the high ressure air from the compressors located on the Mezzanine. If this course of action is chosen, then the ase pressure can be further reduced. If another piece of equipment drops out, follow the same
14 14.1 Action Plan Widget must first decide if a compressed air project is feasible. Given the facts as presented in this report, a compressed air project will elevate the systems reliability, air quality and reduce operating costs with respect to maintenance and electric cost. In order to achieve these goals, the system should be treated as a whole to attain the highest results. Should it be decided that the compressed air projeis 14.2 Compressed Air Upgrade Project 1. Finalize project components, locations for compressor, dryers and ancillary equipment 2. Begin Engineering phase of the projects Includes:
a. b.
d. Equipment Specification Write-Up e. Installation Specification Write-Up
g. Bid Evh. Equipment Selection i. Release of PO j. Drawings (Compressor Area Layout)
3. Repair air leaks. 4. Replace blow off nozzles with high efficiency nozzles air knives and amplifiers (by Widget). 5. In
78. By-Pass all satellite dryers. 9. p10. Set the discharge pressure on DFS controller to 90 psig.
14.3 Sequence Order of Events/Operating Strategy
After completion ofFirst, Widget’s base set point pressure for the demand flow control valve should be set at a pproximately 90 psig for release to the Plant. This is currently the approximate supply pressure toa
Pphdthppb
54
rocess. This process should be repeated until a minimum base pressure is reached that satisfies the quirements for the entire plant. The lower the pressure, the higher the savings, that can be
mary
e process. Their help was e many complex issues. Please extend our thanks to ing the findings or subsequent recommendations should be
Mark J. Marino Com
prerealized. 14.4 Final Sum An effective approach necessitates that the supply and demand side issues, as well as point of use practices be reviewed in terms of a complete system. The audit process performed at Widget deals with the Plant Compressed Air System as a whole and this report provides a guide for developing a long term operating plan for achieving the goal of delivering reliable, quality compressed air to production at the least possible cost. The success of the audit is due to the people at Widget who assisted in th essential in understanding and resolving thveryone involved. Any questions concerne
addressed to Mark J. Marino. Please feel free to call anytime. Sincerely,
pressed Ai Systems Specialist r