exercise – 9...if the median of the distribution given below is 28.5, find the values of x and y....
TRANSCRIPT

Statistics
393
NCERT Textual Exercises and Assignm
entsEXERCISE – 9.1
1. A survey was conducted by a group of students as a part of their environment awareness programme, in which they collected the following data regarding the number of plants in 20 houses in a locality. Find the mean number of plants per house.
Number of plants 0–2 2–4 4–6 6–8 8–10 10–12 12–14Number of houses 1 2 1 5 6 2 3
Which method did you use for finding the mean, and why ? 2. Consider the following distribution of daily wages of 50 workers of a factory.
Daily Wages (in `)
100–120 120–140 140–160 160–180 180–200
Number of Workers
12 14 8 6 10
Find the mean daily wages of the workers of the factory by using an appropriate method.
3. The following distribution shows the daily pocket allowance of children of a locality. The mean pocket allowance is ` 18. Find the missing frequency f.Daily Pocket Allowance (in `)
11–13 13–15 15–17 17–19 19–21 21–23 23–25
Number of Children
7 6 9 13 f 5 4
4. Thirty women were examined in a hospital by a doctor and the number of heart beats per minute were recorded and summarised as follows.Number of Heart Beats per Minute
65–68 68–71 71–74 74–77 77–80 80–83 83–86
Number of Women 2 4 4 8 7 4 2
Find the mean heart beats per minute for these women, choosing a suitable method.
5. In a retail market, fruit vendors were selling mangoes kept in packing boxes. These boxes contained varying number of mangoes. The following was the distribution of mangoes according to the number of boxes.
Number of Mangoes 50–52 53–55 56–58 59–61 62–64Number of Boxes 15 110 135 115 25
Find the mean number of mangoes kept in a packing box. Which method of finding the mean did you choose?

Statistics
394
NCERT Textual Exercises and Assignm
ents 6. The table below shows the daily expenditure on food of 25 households in a
locality.
Daily expenditure (in `)
100–150 150–200 200–250 250–300 300–350
Number of Households
4 5 12 2 2
Find the mean daily expenditure on food by a suitable method. 7. To find out the concentration of SO2 in the air (in parts per million, i.e., ppm),
the data was collected for 30 localities in a certain city and is presented below:
Concentration of SO2 (in ppm) Frequency0.00–0.04 40.04–0.08 90.08–0.12 90.12–0.16 20.16–0.20 40.20–0.24 2
Find the mean concentration of SO2 in the air. 8. A class teacher has the following absentee record of 40 students of a class
for the whole term. Find the mean number of days a student was absent.
Number of Days
0–6 6–10 10–14 14–20 20–28 28–38 38–40
Number of Students
11 10 7 4 4 3 1
9. The following table gives the literacy rate (in percentage) of 35 cities. Find the mean literacy rate.
Literacy Rate (in %) 45–55 55–65 65–75 75–85 85–95Number of Cities 3 10 11 8 3
Test Yourself – STS 1
1. Find the mean of the following frequency distribution.
Class Interval 0–20 20–40 40–60 60–80 80–100Frequency 3 2 5 4 1

Statistics
395
NCERT Textual Exercises and Assignm
ents 2. Find the mean of the following frequency distribution by step-deviation
method.
Class Interval
0–50 50–100 100–150 150–200 200–250 250–300
Frequency 8 15 32 26 12 7 3. Find the mean from the following data.
Class Interval 18–24 24–30 30–36 36–42 42–48 48–54Frequency 6 8 12 8 4 2
4. If mean is 166 926
, find the values of p and q.
Class Interval
140–150 150–160 160–170 170–180 180–190 190–200 Total
Frequency 5 p 20 q 6 2 52
5. Using step deviation method, calculate the mean of the following data :Height (in cm)
135–140
140–145
145–150
150–155
155–160
160–165
165–170
170–175
No. of Boys 4 7 20 28 24 10 4 3 6. The following table shows the marks secured by 140 students in an
examination.
Marks 0–10 10–20 20–30 30–40 40–50No. of Students 20 36 40 28 16
Calculate the mean marks by using all the three methods. 7. Find the mean of the following frequency distribution.
Monthly Wages (in `)
4000–5000 5000–6000 6000–7000 7000–8000 8000–9000
No. of Workers 2 22 19 14 3
8. If the mean of the following frequency distribution is 50, find the value of f1.Class 0–20 20–40 40–60 60–80 80–100Frequency 17 28 31 f1 19
9. The mean of the following frequency distribution is 57.6 and the sum of observations is 50. Find the missing frequencies f1 and f2.Class 0–20 20–40 40–60 60–80 80–100 100–120Frequency 7 f1 12 f2 8 5

Statistics
396
NCERT Textual Exercises and Assignm
ents 10. Find the mean of the following frequency distribution.
Class Interval 81–83 78–80 75–77 72–74 69–71 66–68 63–65Frequency 3 4 6 8 7 3 4
EXERCISE – 9.2 1. The following table shows the ages of the patients admitted in a hospital during
a year.
Age (in years) 5–15 15–25 25–35 35–45 45–55 55–65Number of Patients
6 11 21 23 14 5
Find the mode and the mean of the data given above. Compare and interpret the two measures of central tendency.
2. The following data gives the information on the observed lifetimes (in hours) of 225 electrical components.
Lifetimes (in hours)
0–20 20–40 40–60 60–80 80–100 100–120
Frequency 10 35 52 61 38 29 Determine the modal lifetimes of the components. 3. The following data gives the distribution of total monthly household
expenditure of 200 families of a village. Find the modal monthly expenditure of the families. Also, find the mean monthly expenditure.
Expenditure (in `) Number of Families 1000–1500 24
1500–2000 40 2000–2500 33 2500–3000 28
3000–3500 303500–4000 22
4000–4500 164500–5000 7

Statistics
397
NCERT Textual Exercises and Assignm
ents 4. The following distribution gives the state-wise teacher-student ratio in higher
secondary schools of India. Find the mode and mean of this data. Interpret the two measures.
Number of Students per Teacher Number of States/ U.T. 15–20 3
20–25 8 25–30 9 30–35 10
35–40 3 40–45 0 45–50 0
50–55 2 5. The given distribution shows the number of runs scored by some top batsmen
of the world in one-day international cricket matches.
Runs Scored Number of Batsmen 3000–4000 4
4000–5000 18 5000–6000 9 6000–7000 7
7000–8000 6 8000–9000 3 9000–10000 1
10000–11000 1 Find the mode of the data. 6. A student noted the number of cars passing through a spot on a road for 100
periods each of 3 minutes and summarised it in the given table. Find the mode of the data.Number of Cars
0–10 10–20 20–30 30–40 40–50 50–60 60–70 70–80
Frequency 7 14 13 12 20 11 15 8

Statistics
398
NCERT Textual Exercises and Assignm
entsTest Yourself – STS 2
1. Find the mode from the following table.Class Interval 1–3 3–5 5–7 7–9 9–11Frequency 4 5 8 7 6
2. Find the mode of the following frequency distribution :Class 25–30 30–35 35–40 40–45 45–50 50–55Frequency 25 34 50 42 28 24
3. The following distribution table gives the weight of 50 students of Vector Institute, Delhi.Weight (in kg)
37–41 42–46 47–51 52–56 57–61 62–66 67–71
Frequency 3 7 11 14 7 6 2 Find the modal weight. 4. Find the mode of the following frequency distribution.
Class Interval 12–15 15–18 18–21 21–24 24–27 27–30 30–33Frequency 2 5 10 23 21 12 3
5. Find mode from the following table.Class Interval
200–210
210–220
220–230
230–240
240–250
250–260
260–270
Frequency 4 6 20 32 33 8 2
EXERCISE – 9.3 1. The following frequency distribution gives the monthly consumption of
electricity of 68 consumers of a locality. Find the median, mean and mode of the data and compare them. Monthly Consumption (in Units) No. of Consumers of Electricity 65–85 4
85–105 5 105–125 13 125–145 20
145–165 14 165–185 8 185–205 4

Statistics
399
NCERT Textual Exercises and Assignm
ents 2. If the median of the distribution given below is 28.5, find the values of x
and y.
Class interval Frequency 0–10 5
10–20 x 20–30 20 30–40 15
40–50 y 50–60 5 Total 60
3. A life insurance agent found the following data for distribution of ages of 100 policy holders. Calculate the median age, if policies are given only to persons having age 18 years onwards but less than 60 years.
Age (in years) Number of Policy Holders Below 20 2 Below 25 6
Below 30 24Below 35 45Below 40 78Below 45 89Below 50 92Below 55 98Below 60 100
4. The lengths of 40 leaves of a plant are measured correct to the nearest millimetre, and the data obtained is represented in the following table.
Length (in mm) Number of Leaves 118–126 3
127–135 5136–144 9145–153 12154–162 5163–171 4172–180 2

Statistics
400
NCERT Textual Exercises and Assignm
ents Find the median length of the leaves. (Hint: The data needs to be converted to continuous classes for finding the
median, since the formula assumes continuous classes. The classes then change to 117.5–126.5, 126.5–135.5, ...171.5–180.5.)
5. The following table gives the distribution of the life time of 400 neon lamps:
Life Time (in hours) Number of Lamps 1500–2000 14
2000–2500 562500–3000 603000–3500 863500–4000 744000–4500 624500–5000 48
Find the median life time of a neon lamp. 6. 100 surnames were randomly picked up from a local telephone directory and
the frequency distribution of the number of letters in the English alphabets in the surnames was obtained as follows.
Number of Letters 1–4 4–7 7–10 10–13 13–16 16–19Number of Surnames 6 30 40 16 4 4
Determine the median number of letters in the surnames. Find the mean number of letters in the surnames? Also, find the modal size of the surnames.
7. The distribution below gives the weights of 30 students of a class. Find the median weight of the students.Weight (in kg) 40–45 45–50 50–55 55–60 60–65 65–70 70–75Number of Students
2 3 8 6 6 3 2
Test Yourself – STS 3 1. Find the median from the following data.
Class Interval 0–10 10–20 20–30 30–40 40–50Frequency 3 4 6 4 3
Statistics
401
NCERT Textual Exercises and Assignm
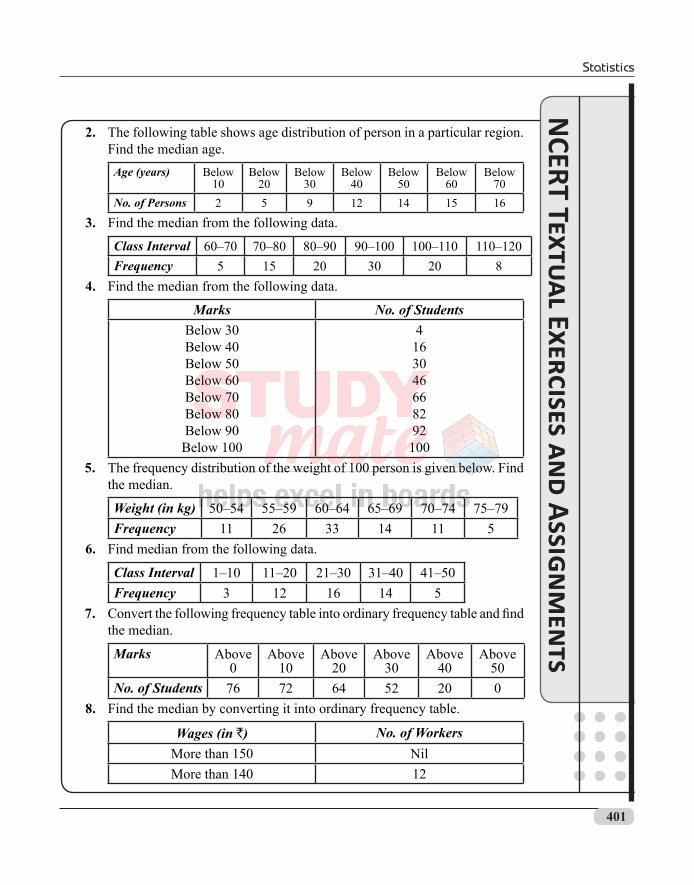
ents 2. The following table shows age distribution of person in a particular region.
Find the median age.Age (years) Below
10Below
20Below
30Below
40Below
50Below
60Below
70No. of Persons 2 5 9 12 14 15 16
3. Find the median from the following data.
Class Interval 60–70 70–80 80–90 90–100 100–110 110–120Frequency 5 15 20 30 20 8
4. Find the median from the following data.
Marks No. of StudentsBelow 30Below 40Below 50Below 60Below 70Below 80Below 90Below 100
4163046668292100
5. The frequency distribution of the weight of 100 person is given below. Find the median.
Weight (in kg) 50–54 55–59 60–64 65–69 70–74 75–79Frequency 11 26 33 14 11 5
6. Find median from the following data.
Class Interval 1–10 11–20 21–30 31–40 41–50Frequency 3 12 16 14 5
7. Convert the following frequency table into ordinary frequency table and find the median.
Marks Above 0
Above 10
Above 20
Above 30
Above 40
Above 50
No. of Students 76 72 64 52 20 0 8. Find the median by converting it into ordinary frequency table.
Wages (in `) No. of WorkersMore than 150 NilMore than 140 12

Statistics
402
NCERT Textual Exercises and Assignm
entsMore than 130 27More than 120 60More than 110 105More than 100 124More than 90 141More than 80 150
9. Given below is a frequency distribution with median 46. In this distribution, some of the frequencies are missing. Find x and y.
Marks 10–20 20–30 30–40 40–50 50–60 60–70 70–80 TotalNo. of Students
12 30 x 65 y 25 18 229
10. Find the values of p and q, if the median of the distribution given below is 38.5.
Class Interval 10–20 20–30 30–40 40–50 50–60 60–70 TotalFrequency 5 p 20 15 q 5 60
EXERCISE – 9.4 1. The following distribution table gives the daily income of 50 workers of a
factory.
Daily Income (in `) 100–120 120–140 140–160 160–180 180–200Number of Workers 12 14 8 6 10
Convert the distribution above to a 'less than type' cumulative frequency distribution, and draw its ogive.
2. During the medical check-up of 35 students of a class, their weights were recorded as follows:
Weight (in kg) No. of Students Less than 38 Less than 40 Less than 42 Less than 44 Less than 46 Less than 48 Less than 50 Less than 52
035914283235

Statistics
403
NCERT Textual Exercises and Assignm
ents Draw a 'less than type' ogive for the given data. Hence obtain the median
weight from the graph and verify the result by using the formula. 3. The following table gives production yield per hectare of wheat of 100 farms
of a village.Production Yield (in kg/ha)
50–55 55–60 60–65 65–70 70–75 75–80
Number of Farms 2 8 12 24 38 16 Change the distribution to a 'more than type' distribution, and draw its ogive.
Test Yourself – STS 4 1. From the following data, draw the 'less than type' ogive.
Class 5–10 10–15 15–20 20–25 25–30 30–35 35–40Frequency 2 12 2 4 3 4 3
2. From the following data, draw the 'more than type' ogive.Class 0–10 10–
2020–30
30–40
40–50
50–60
60–70
70–80
80–90
90–100
Frequency 5 3 4 3 3 4 7 9 7 8
3. The following is the data obtained from the maternity ward of a hospital during a certain period.Weight of Children at the Time of Birth (in gms)
2000–2500
2500–3000
3000–3500
3500–4000
4000–4500
4500–5000
5000–5500
5500–6000
Number of Children
10 15 25 30 52 16 7 3
Construct ‘less than type’ ogive for the data. 4. An agricultural research officer measured the heights (to the nearest
centimetre) of 100 test plants after 2 months growth. The distribution of the heights is shown below.
Height (in cm) 1–5 6–10 11–15 16–20 21–25 26–30Number of Plants 3 5 9 31 38 14
Construct both (a) 'less than type' ogive and (b) 'more than type' ogive for these data on different graph papers.
[Hint: Convert the classes into continuous classes.]

Statistics
404
NCERT Textual Exercises and Assignm
ents 5. The annual profits earned by 30 shops of a shopping complex in a locality
give rise to the following distribution.
Profits (in lakhs `) No. of ShopsMore than or equal to 5More than or equal to 10More than or equal to 15More than or equal to 20More than or equal to 25More than or equal to 30More than or equal to 35
302816141073
Draw both ogives for the above data on the same graph paper. Hence obtain the median profit.

Statistics
408
NCERT Textual Exercises and Assignments
Exercise – 9.11.
Class Frequency (fi ) Class Mark (xi) fixi
0–2
2–4
4–6
6–8
8–10
10–12
12–14
1
2
1
5
6
2
3
1
3
5
7
9
11
13
1
6
5
35
54
22
39∑ƒi = 20 ∑ƒixi = 162
Now Mean, x f xfi i
i
=ΣΣ
=16220
∴ Mean = 8.1 plants We have used direct method because numerical values of xi and fi are small.2. Let assumed mean, a = 150. Also, h = 20
Class Frequency (fi )
Class Mark (xi)u
xi
i==−− 15020
fiui
100–120
120–140
140–160
160–180
180–200
12
14
8
6
10
110
130
150
170
190
– 2
– 1
0
1
2
– 24
– 14
0
6
20Σfi = 50 Σfiui = –12
Statistics
409
By step-deviation method,
x a f uf
hi i
i
= +
ΣΣ
= +−
150 12
5020
= 150 – 4.8
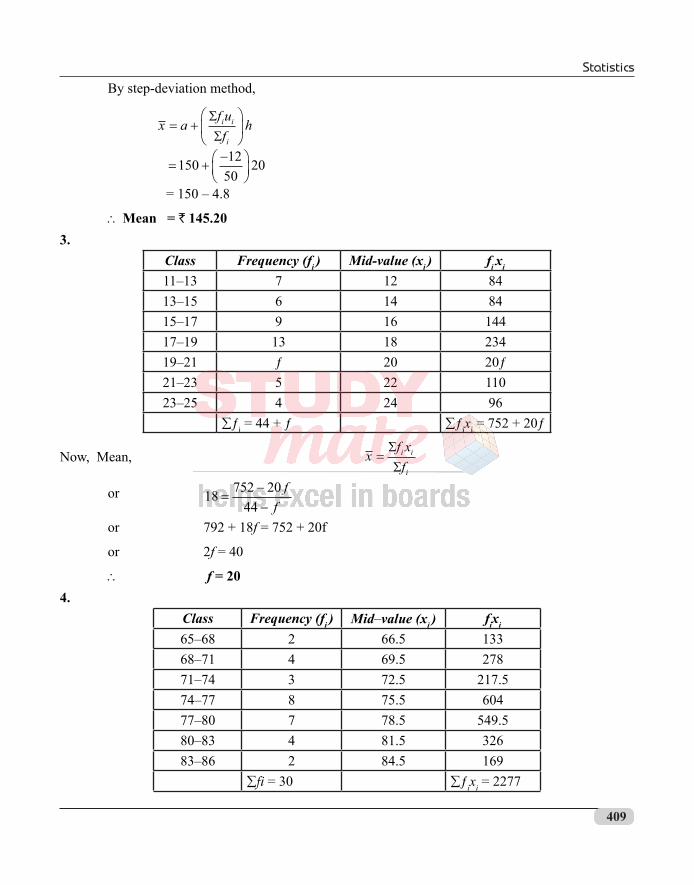
∴Mean = ` 145.203.
Class Frequency (fi ) Mid-value (xi ) fi xi
11–13 7 12 8413–15 6 14 8415–17 9 16 14417–19 13 18 23419–21 ƒ 20 20ƒ21–23 5 22 11023–25 4 24 96
∑ƒi = 44 + ƒ ∑ƒixi = 752 + 20ƒ
Now, Mean, x f xfi i
i
=ΣΣ
or 18 752 2044
=−−
ff
or 792 + 18f = 752 + 20f
or 2f = 40
∴ f = 204.
Class Frequency (fi ) Mid–value (xi ) fixi
65–68 2 66.5 13368–71 4 69.5 27871–74 3 72.5 217.574–77 8 75.5 60477–80 7 78.5 549.580–83 4 81.5 32683–86 2 84.5 169
∑fi = 30 ∑ƒixi = 2277

Statistics
410
Mean, x f xfi i
i
=ΣΣ
=227730
∴Mean = 75.9 hearts beats
5. Let assumed mean, a = 57.
Also, h = 3
Class Frequency (fi ) Class Mark (xi ) u xi
i=− 573
fiui
50–52 15 51 –2 –3053–55 110 54 –1 –11056–58 135 57 0 059–61 115 60 1 11562–64 25 63 2 50
Σfi = 400 Σfiui = 25 By step-deviation method,
x a f u
fhi i
i
= +
ΣΣ
= +
×57 25
4003
= +57 316
= 57 + 0.1875 ∴Mean = 57.19 (approx.)
6. Let assumed mean, a = 225,
Also, h = 50
Class Frequency (fi ) Class Mark (xi ) u xi
i=− 22550
fiui
100–150 4 125 – 2 – 8150–200 5 175 – 1 – 5200–250 12 225 0 0250–300 2 275 1 2300–350 2 325 2 4
Σfi = 25 Σfiui = –7

Statistics
411
By step-deviation method,
x a f u
fhi i
i
= +
ΣΣ
= +
−
×225 7
2550
= 225 – 14 ∴Mean = 2117.
Class Frequency (fi ) Class Mark (xi ) fixi
0.00–0.04 4 0.02 0.080.04–0.08 9 0.06 0.540.08–0.12 9 0.10 0.900.12–0.16 2 0.14 0.280.16–0.20 4 0.18 0.720.20–0.24 2 0.22 0.44
Σfi = 30 Σfixi = 2.96
Now, Mean, xf xfi i
i
=ΣΣ
x =2 9630.
∴Mean = 0.099 (approx.)
8. Let assumed mean, a = 17
Class (No. of days)
No. of Students (fi )
Class Mark (xi )
di = xi – 17 fidi
0–6 11 3 – 14 – 1546–10 10 8 – 9 – 9010–14 7 12 – 5 – 3514–20 4 17 0 020–28 4 24 7 2828–38 3 33 16 4838–40 1 39 22 22
Σfi = 40 Σfidi = – 181 By assumed mean method,
x a f d
fi i
i
= +ΣΣ

Statistics
412
= +
−
17 181
40
= 17.000 – 4.525 = 12.475 ∴Mean = 12.48 days9.
Class Frequency (fi ) Class Mark (xi ) fixi
45–55 3 50 15055–65 10 60 60065–75 11 70 77075–85 8 80 64085–95 3 90 270
Σfi = 35 Σfixi = 2430
Mean, x f xfi i
i
=ΣΣ
=243035
∴Mean = 69.43%
Test Yourself – STS 1
1. 47.3
2. 145
3. 33.3
4. p = 10, q = 9
[Hint: 166 926
5525 155 175= + +p q ⇒ 155p + 175q = 3125 ......(i)
5 + p + 20 + q + 6 + 2 = 52 ⇒ p + q = 19 .....(ii)]
5. 153.6 cm
6. 23.9 marks (approx.)
7. ` 6400
8. f1 = 24
9. f1 = 8, f2 = 10
10. 72.8

Statistics
413
Exercise – 9.21.
Age in years No. of patients5–15 615–25 1125–35 21 ← f0
35–45 23 ← f1
45–55 14 ← f2
55–65 5
Maximum frequency is 23 which lies in the class 35–45. ∴ Modal class is 35–45. and l = 35, h = 10, f1 = 23, f0 = 21, f2 = 14
∴ Mode = lf ff f f
h+−
− −
×1 0
1 0 22
= +−− −
×35 23 21
2 23 21 1410
( )
= +35 2011
= 35 + 1.82 ∴ Mode = 36.82 years Calculation of Mean Let assumed mean, a = 40. also, h = 10
Age Class Mark (xi ) Frequency (fi ) u xi
i=− 4010
fiui
5 – 15 10 6 – 3 – 1815 – 25 20 11 – 2 – 2225 – 35 30 21 – 1 – 2135 – 45 40 23 0 045 – 55 50 14 1 1455 – 65 60 5 2 10
Σfi = 80 Σfiui = – 37

Statistics
414
By step-deviation method,
Mean, x a f uf
hi i
i
= +
ΣΣ
= +−
×40 37
8010
= −40 378
= 40 – 4.625 = 40 – 4.63 ∴ Mean = 35.37 yearsMaximum number of patients admitted in the hospital are of the age 36.82 years while on an average the age of a patient admitted to the hospital is 35.37 years.2.
Class Frequency (f )0–20 1020–40 3540–60 52 ← ƒ0
60–80 61 ← ƒ1
80–100 38 ← ƒ2
100–120 29
Maximum frequency is 61 which lies in the class 60–80. ∴ Modal class is 60–80. and l = 60, h = 20, f1 = 61, f0 = 52, f2 = 38
Now, Mode = +−
− −
×l f f
f f fh1 0
1 0 22
= +
−− −
×60 61 52
2 61 52 3820
( )
= +
−
×60 9
122 9020
= +60 180
32 = 60 + 5.625 ∴ Mode = 65.625 hours

Statistics
415
3. Expenditure (in `) Manual Workers (Frequency)
1000–1500 24 ← f0
1500–2000 40 ← f1
2000–2500 33 ← f2
2500–3000 283000–3500 303500–4000 224000–4500 164500–5000 7
Maximum frequency is 40 which lies in the class 1500–2000. ∴ Modal class is 1500–2000 and l = 1500, h = 500, f1 = 40, f0 = 24, f2 = 33
Mode = l f ff f f
h+−
− −
×1 0
1 0 22
= +−− −
×1500 40 24
2 40 24 33500
( )
= + ×1500 1623
500
= 1500 + 347.83 ∴ Mode = ` 1847.83 Calculation of Mean Let assumed mean, a = 2750. also h = 500
Class Class Mark (xi ) Frequency (fi ) u xi
i=− 2750500
fiui
1000–1500 1250 24 – 3 – 721500–2000 1750 40 – 2 – 802000–2500 2250 33 – 1 – 332500–3000 2750 28 0 03000–3500 3250 30 1 303500–4000 3750 22 2 444000–4500 4250 16 3 484500–5000 4750 7 4 28
Σfi = 200 Σfiui = – 35

Statistics
416
By step-deviation method,
x a f uf
hi i
i
= +
ΣΣ
= +−
×2750 35
200500
= 2750 – 87.50 ∴ Mean = ` 2662.50
4. Let assumed mean, a = 32.5,
Also, h = 5
Class Class Mark (xi ) Frequency (fi ) u xi
i=− 32 55
. fiui
15–20 17.5 3 – 3 – 920–25 22.5 8 – 2 – 1625–30 27.5 9 ←ƒ0 – 1 – 930–35 32.5 10 ← ƒ1 0 035–40 37.5 3 ← ƒ2 1 340–45 42.5 0 2 045–50 47.5 0 3 050–55 52.5 2 4 8
Σfi = 35 Σfiui = – 23 Maximum frequency is 10 which lies in the class 30–35. ∴ Modal class is 30–35. and l = 30, h = 5, f1 = 10, f0 = 9, f2 = 3
Now, Mode = lf ff f f
h+−
− −
×1 0
1 0 22
= +−− −
×30 10 9
2 10 9 35
( )
= +
30 5
8 = 30 + 0.625 ∴ Mode = 30.6

Statistics
417
And, Mean, x a f uf
hi i
i
= +
×
ΣΣ
= +−
×32 5 23
355.
= 32.5 – 3.3 ∴ Mean = 29.2 Thus, most states/U.T. have a student teacher ratio of 30.6 and on an average, this ratio is 29.2.5.
Runs Scored Number of Batsmen3000–4000 4 ← f0
4000–5000 18 ← f1
5000–6000 9 ← f2
6000–7000 77000–8000 68000–9000 39000–10000 110000–11000 1
Maximum frequency is 18 which lies in the class 4000–5000. ∴ Modal class is 4000–5000. and l = 4000, h = 1000, f1 = 18, f0 = 4, f2 = 9
Now, Mode = l f ff f f
h+−
− −
×1 0
1 0 22
= +−− −
×4000 18 4
2 18 4 91000
( )
= +4000 1400023
= 4000 + 608.7 ∴ Mode = 4608.7 runs

Statistics
418
6. Class Frequency0–10 710–20 1420–30 1330–40 12 ← f0
40–50 20 ← f1
50–60 11 ← f2
60–70 1570–80 8
Maximum frequency is 20 which lies in the class 40–50. ∴ Modal class is 40–50. and l = 40, h = 10, f1 = 20, f0 = 12, f2 = 11
Now, Mode = l f ff f f
h+−
− −
×1 0
1 0 22
= +−− −
×40 20 12
2 20 12 1110
( )
= +40 8017
= 40 + 4.7 ∴ Mode = 44.7 cars
Test Yourself – STS 2
1. 6.5
2. 38.33
3. 53 kg
4. 23.6
5. 243.33

Statistics
419
Exercise – 9.31.
Class Frequency c.ƒ 65–85 4 485–105 5 4 + 5 = 9105–125 13 9 + 13 = 22 ← c.f125–145 20 ← f 22 + 20 = 42145–165 14 42 + 14 = 56165–185 8 56 + 8 = 64185–205 4 64 + 4 = 68
Here n2
682
34= =
= 34 which lies in the class 125–145.
∴ Median class is 125–145 and l = 125, h = 20, f = 20, cf = 22
Median = l
n cf
fh+
−
×2
= +
−
×125 34 22
2020
= 125 + 12 ∴ Median = 137 units Determination of Mean and Mode Let assumed mean, a = 135. also h = 20

Statistics
420
Class Class Mark (xi ) Frequency (fi ) u x
ii=−13520
fiui
65–85 75 4 – 3 – 1285–105 95 5 – 2 – 10105–125 115 13 ← f0 – 1 – 13125–145 135 20 ← f1 0 0145–165 155 14 ← f2 1 14165–185 175 8 2 16185–205 195 4 3 12
Σfi = 68 Σfiui = 7 By Step-deviation method,
x a f u
fhi i
i
= +
×
ΣΣ
= +
×135 7
6820
= + = +135 3517
135 2 05.
∴ Mean = 137.05 units Maximum frequency is 20 which lies in the class 125–145. ∴ Modal class is 125–145. and l = 125, h = 20, f1 = 20, f0 = 13, f2 = 14 Now,Mode = l f f
f f fh+
−− −
×1 0
1 0 22
= +
−− −
×125 20 13
2 20 13 1420
( )
= +
−
×125 7
40 2720
= +125 14013
= 125 + 10.76 ∴ Mode = 135.76 units The three measures are approximately the same in this case.

Statistics
421
2. Class Frequency c.ƒ 0–10 5 510–20 x 5 + x ← c.f20–30 20 ← f 25 + x30–40 15 40 + x40–50 y 40 + x + y50–60 5 45 + x + y
60 Here, 45 + x + y = 60 ∴ x + y = 15 .......(i) Since the median is 28.5 which lies in the class 20 - 30 ∴ Median class is 20–30. and n = 60, l = 20, h = 10, f = 20, cf = (5 + x)
Median = l
n cf
fh+
−
×2
∴ 28 5 20 30 520
10. ( )= +
− +
×
x
∴ 28 5 20 30 52
. ( )− =
− − x
∴ 2 (8.5) = 25 – x ∴ 17 = 25 – x ∴ x = 8 units. Substituting x = 8 in equation (1) ⇒8 + y = 15 ⇒y = 7 Hence, x = 8 and y = 7

Statistics
422
3. Class Frequency Cumulative frequency (cf) 15–20 2 220–25 6–2 = 4 625–30 24–6 = 18 24 30–35 45–24 = 21 45 ← c. f.35–40 78–45 = 33 ← f 7840–45 89–78 = 11 8945–50 92–89 = 3 9250–55 98–92 = 6 9855–60 100–98 = 2 100
Here n2
1002
50= = which lies in the class 35–40.
∴ Median class is 35–40. and l = 35, h = 5, f = 33, cf = 45
Median = l
n cf
fh+
−
×2
= +−
×35 50 45
335
= +35 2533
= 35 + 0.76 Median = 35.76 years
4. Changing the data in continuous form
Class ƒ cƒ 117.5–126.5 3 3126.5–135.5 5 8135.5–144.5 9 17 ← cf144.5–153.5 12 ← f 29153.5–162.5 5 34162.5–171.5 4 38171.5–180.5 2 40

Statistics
423
Here n2
402
20= = which lies in the class 144.5–153.5.
∴ Median class is 144.5–153.5. and l = 144.5, h = 9, f = 12, cf = 17
Median = l
n cf
fh+
−
×2
= +−
×144 5 20 17
129.
= +144 5 94
.
= 144.5 + 2.25 ∴ Median = 146.75 mm5.
Class Frequency cƒ 1500–2000 14 142000–2500 56 702500–3000 60 130 ← cf3000–3500 86 ← f 2163500–4000 74 2904000–4500 62 3524500–5000 48 400
Here n2
4002
200= = which lies in the class 3000–3500.
∴ Median class is 3000–3500. and l = 3000, h = 500, f = 86, cf = 130
Median = l
n cf
fh+
−
×2
= +−
×3000 200 130
86500

Statistics
424
= +3000 1750043
= 3000 + 406.98 ∴ Median = 3406.98 hour
6. (i) Determination of Median
Class Frequency cƒ 1–4 6 64–7 30 36 ← cf7–10 40 ← f 7610–13 16 9213–16 4 9616–19 4 100
Here n2
1002
50= = which lies in the class 7–10.
∴ Median class is 7–10 and l = 7, h = 3, f = 40, cf = 36
Median = l
n cf
fh+
−
×2
= +
−
×7 50 36
403
= + = +7 42
407 1 05.
∴ Median = 8.05 (ii) Determination of Mean and Mode
Class Frequency (fi ) Class Mark (xi ) fixi
1–4 6 2.5 154–7 30 ← f0 5.5 1657–10 40 ← f1 8.5 34010–13 16 ← f2 11.5 18413–16 4 14.5 5816–19 4 17.5 70
Σfi = 100 Σfixi = 832

Statistics
425
Mean, x f xfi i
i
=ΣΣ
=832100
∴ Mean = 8.32 Maximum frequency is 40 which lies in the class 7–10. ∴ Modal class is 7–10. and l = 7, h = 3, f1 = 40, f0 = 30, f2 = 16
Now,Mode = l f ff f f
h+−
− −
×1 0
1 0 22
= +
−− −
×7 40 30
2 40 30 163
( )
= + × = +7 1034
3 7 3034
= 7 + 0.88 ∴Mode = 7.887.
Class Frequency cƒ 40–45 2 245–50 3 5 50–55 8 13 ← cf55–60 6 ← f 1960–65 6 2565–70 3 2870–75 2 30
Here n2
302
15= = which lies in the class 55–60.
∴ Median class is 55–60. and l = 55, h = 5, f = 6, cf = 13
Statistics
426
Median = l
n cf
fh+
−
×2
= +
−
×55 15 13
65
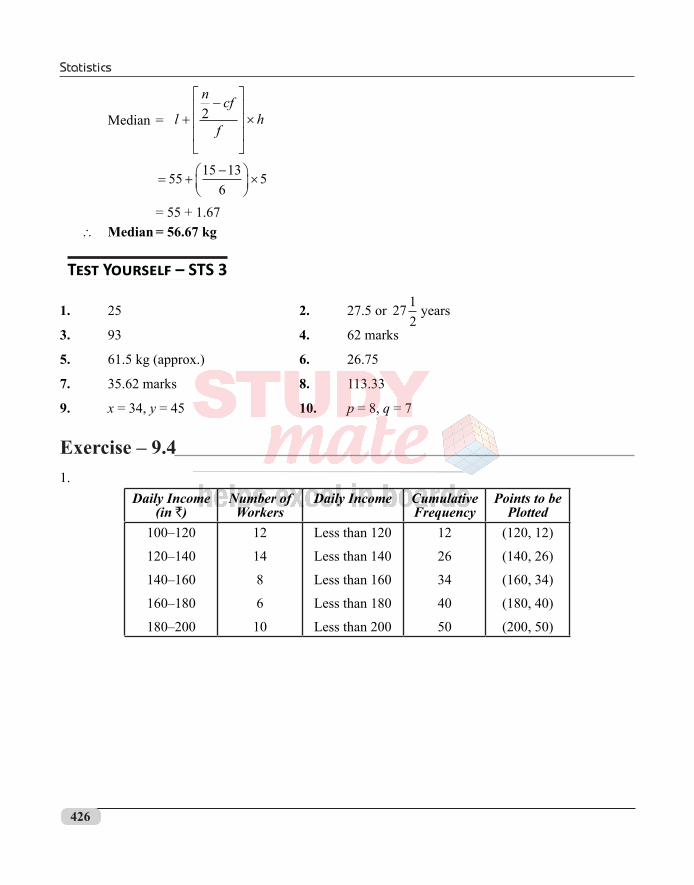
= 55 + 1.67 ∴ Median = 56.67 kg
Test Yourself – STS 3
1. 25 2. 27.5 or 27 12
years
3. 93 4. 62 marks
5. 61.5 kg (approx.) 6. 26.75
7. 35.62 marks 8. 113.33
9. x = 34, y = 45 10. p = 8, q = 7
Exercise – 9.41.
Daily Income (in `)
Number of Workers
Daily Income Cumulative Frequency
Points to be Plotted
100–120
120–140
140–160
160–180
180–200
12
14
8
6
10
Less than 120
Less than 140
Less than 160
Less than 180
Less than 200
12
26
34
40
50
(120, 12)
(140, 26)
(160, 34)
(180, 40)
(200, 50)

Statistics
427
To draw the ogive, first convert the data into less than or more than type according to the requirement of Questions.
Fig. 6.6
2. Weight (in kg) Number of
StudentsWeight (in kg) Cumulative
FrequencyPoints to be
Plotted36–3838–4040–4242–4444–4646–4848–5050–52
03 – 0 = 35 – 3 = 29 – 5 = 414 – 9 = 5
28 – 14 = 14 ← f32 – 28 = 435 – 32 = 3
Less than 38Less than 40Less than 42Less than 44Less than 46Less than 48Less than 50Less than 52
0359
14 ← cf283235
(38, 0)(40, 3)(42, 5)(44, 9)(46, 14)(48, 28)(50, 32)(52, 35)

Statistics
428
∴ Median from the graph is 46.5 kg.
Now, n2
352
17 5= = . which lies in the class 46–48. (from table)
∴ Median class is 46–48. and l = 46, h = 2, f = 14, cf = 14
Now, Median = l
n c f
fh+
−
×2
. .
= +
−
×46 17 5 14
142.
= +46 3 57.
= 46 + 0.5
∴ Median = 46.5 kg Hence the median is same as obtained from the graph.

Statistics
429
3. Production
Yield (in kg/ha.)Number of
FarmsProduction Yield Cumulative
FrequencyPoints to be
Plotted50 - 5555 - 6060 - 6565 - 7070 - 7575 - 80
2812243816
50 or more than 5055 or more than 5560 or more than 6065 or more than 6570 or more than 7075 or more than 75
1009890785416
(50, 100)(55, 98)(60, 90)(65, 78)(70, 54)(75, 16)