exhibit l: prevention of significant deterioration permit...
TRANSCRIPT
Exhibit L: Prevention of Significant DeteriorationPermit for Pioneer Valley Energy Center,EPA Final PSD Permit Number 052-042-MA15

United StatesE PA Environmental ProtectionAgency New England
Prevention of Significant Deterioration Permitfor
Pioneer Valley Energy CenterAmpad RoadWestfield, MA
431 MW Combustion TurbineCombined Cycle Generating Unit
EPA Final PSD Permit Number052-042-MA15
Pursuant to the provisions of the Clean Air Act, Subchapter 1, Part C (42 U.S.C. Section
7470, et. seq) and the regulations found at the Code of Federal Regulations Title 40, Section
52.21, the United States Environmental Protection Agency New England (EPA) is issuing aPrevention of Significant Deterioration (PSD) air quality permit to Pioneer Valley Energy
Center, Ampad Road, Westfield, MA (PVEC) to install and operate a new 431 megawatt (MW)
combined cycle generating facility at this location.
The design, construction and operation of the Facility shall be subject to the attached
permit conditions and permit limitations. This Permit is valid only for the equipment described
herein and as submitted to EPA in the November 8, 2008 application for a New Source Review
(NSR)/Prevention of Significant Deterioration (PSD) permit under 40 CFR 52.21 and subsequent
application submittals. This permit shall become effective 33 days after the date of signature
unless review is requested on the permit under 40 C.F.R. § 124.19, in which case the permit shall
be effective when provided by 40 C.F.R. § 124.19(f). The permit shall remain in effect until it is
surrendered to EPA. This permit becomes invalid if PVEC does not commence construction
within 18 months after the date of signature. EPA may extend the 18-month period upon a
satisfactory showing that an extension is justified.
This permit does not relieve PVEC from the obligation to comply with applicable state
and federal air pollution control rules and regulations.
Stephen S. Perkins, Director Date of Issuance

Pioneer Valley Energy CenterPrevention of Significant Deterioration Air PermitFinal PSD Permit Number 052-042-MA15
Office of Ecosystem Protection
Table of Contents
Definitions 3
I. Emission Limits 4
Operational Conditions 7
III. Monitoring Requirements 9
IV. Testing Requirements 11
V. Recordkeeping Requirements 12
VI. Reporting 14
VII. Right of Entry 15
VIII. Transfer of Ownership 15
IX. Severab ility 15
X. Credible Evidence 15
XI. Other Applicable Regulations 16
XII. Agency Address 16

Pioneer Valley Energy CenterPrevention of Significant Deterioration Air PermitFinal PSD Permit Number 052-042-MA15
Definitions
1. ASTM: This reference means a monitoring device that meets American Society for Testingand Materials (ASTM) standards for the specific measuring activity.
2. Carbon dioxide equivalent (CO2e): This represents an amount of GHGs emitted, and shall becomputed as follows:
a. Multiply the mass amount of emissions (tpy) for each of the six greenhouse gases in thepollutant GHGs by the gas's associated global warming potential published at Table A-1to subpart A of 40 C.F.R. part 98.
b. Sum the resultant value from the above paragraph for each gas to compute a tpy CO2e.
3. Combined cycle turbine (CCT): This term includes the combustion turbine and heat recoverysteam generator.
4. GHGs: The aggregate group of six greenhouse gases: carbon dioxide, nitrous oxide, methane,hydrofluorocarbons, perfluorocarbons, and sulfur hexafluoride.
5. MWhgrid: Amount of electricity delivered to the grid in one hour.
6. Startup: Unit startup commences when fuel is first ignited. Cold startups are defined asoccurring after a period of greater than 24 hours of turbine shutdown, and warm startups aredefined as occurring 24 hours or less since turbine shutdown. The time period for a warmstartup is limited to 2.0 hours. The time period for a cold startup is limited to 5.0 hours.
7. Shutdown: Shutdown is defined as the time when the turbine operation is between minimumsustained operating load and flame-out in the turbine combustor occurs. The time period fora shutdown is limited to 1.0 hour.
8. ULSD: Transportation diesel or biodiesel (containing no more than 20 % non fossil fuel) with asulfur content of 15 ppm by weight or less.
3

Pioneer Valley Energy CenterPrevention of Significant Deterioration Air PermitFinal PSD Permit Number 052-042-MA15
Project Description (For Informational Purposes)
Pioneer Valley Energy Center (PVEC) is proposing to construct and operate a 431 MW electricalgenerating facility (the Facility) at a site on Ampad Road in Westfield, Massachusetts. Themajor system components will consist of a combined cycle turbine, an auxiliary boiler, anemergency diesel engine/generator, a diesel engine/fire pump, and a mechanical draft wetcooling tower.
On April 11, 2011, EPA and the Massachusetts Department of Environmental Protection(MassDEP) entered into an "Agreement for Delegation of the Federal Prevention of SignificantDeterioration (PSD) Program by the United States Environmental Protection Agency, Region 1to the Massachusetts Department of Environmental Protection" (Delegation Agreement).Pursuant to the Delegation Agreement and to 40 CFR 52.21(u), EPA delegated to MassDEP fullresponsibility for implementing and enforcing the federal PSD regulations for sources located inthe Commonwealth of Massachusetts. Under Section IV.K of that Delegation Agreement,however, EPA retained responsibility for issuance and, if necessary, defense on appeal of thePSD permit for PVEC. After this permit has taken final effect, MassDEP may implement thePSD program with respect to this permit and this facility to the same extent as any other facilityin Massachusetts, and where this permit refers to communications to or approval by EPA,MassDEP may act on EPA's behalf.
Permit Terms and Conditions
I. Emission Limits
1. The owner/operator shall not discharge or cause to discharge into the atmosphere emissionsfrom the combined cycle turbine (CCT) in excess of any of the emission limits in Tables 1-IV.
The emission limits contained in Tables 1 and II shall apply at all times, except that for COand NOx only, the alternate emission limits contained in Tables 111 and Table IV shall applyduring startup and shutdown, after which the limits in Tables I and H shall apply. Theemission limits for ULSD shall apply when transitioning between natural gas and ULSD.
Table IEmission Limits — Natural Gas
Pollutant Concentration Limit Mass Limit
Nitrogen Oxides (averagedover 1 hr)
2.0 ppmvd @ 15%02 20.2 lb/hr
Sulfuric Acid Mist 0.0019 lb/MMBtu 4.9 lb/hr
PMin0.0040 lb/MMEctu
filterable + condensables9.8 lb/hr
filterable + condensables
PM2.50.0040 lb/MMBtu
filterable + condensables9.8 lb/hr
filterable + condensables
Carbon Monoxide(averaged over 1 hr)
2.0 ppmvd @ 15%02 12.3 lb/fir
4

Pioneer Valley Energy CenterPrevention of Significant Deterioration Air PermitFinal PSD Permit Number 052-042-MA15
Table IIEmission Limits —ULSD
Pollutant Concentration Limit Mass Limit
Nitrogen Oxides (averagedover 1 hr)
5.0 ppmvd @ 15%02 43.0 lb/hr
Sulfuric Acid Mist 0.0018 Ib/MMBtu 3.6 lb/hr
PM lo0.014 lb/MMBtu
filterable + condensables26.8 lb/hr
filterable + condensables
PM2.50.014 lb/MMBtu
filterable + condensables26.8 lb/hr
filterable + condensablesCarbon Monoxide(averaged over 1 hr)
6.0 ppmvd @ 15%0231.5 lb/hr
Table IIIStartup and Shutdown Emission Limits — Natural Gas
(Averaging time is 1 hour)
Pollutant Concentration Limit Mass Limit
Nitrogen Oxides 40 ppmvd @ 15%02 62.0 lb/hr
Carbon Monoxide1,100 ppmvd @ 15%02for first 60 minutes of
startup and for shutdowns2000 lb/hr
Carbon Monoxide100 ppmvd @ 15%02after first 60 minutes of
startup400 lb/hr
Table IVStartup and Shutdown Emission Limits — ULSD
(Averaging time is 1 hour)
Pollutant Concentration Limit Mass Limit
Nitrogen Oxides 60 ppmvd @ 15%02 99 lb/hr
Carbon Monoxide4,000 ppmvd @ 15%02for first 60 minutes of
startup and for shutdowns6000 lb/hr
Carbon Monoxide250 ppmvd @ 15%02after first 60 minutes of
startup800 lb/hr
2. To ensure the owner/operator has designed and installed an energy efficient CCT, theowner/operator shall conduct an initial emission test for CO2 and use emission factors from40 CFR part 98 for all other components of greenhouse gases, within 180 days from initialstartup. The owner/operator shall ensure that GHG emissions from the CCT do not exceed825 lbs of CO2e MWhgrid (the "design emissions limit") during the test. The test shall beconducted when the CCT is operating above 90 % of its design capacity on natural gas and
the results shall be corrected to ISO conditions (59 °F, 14.7 psia, and 60% humidity). If the
CCT does not meet the design emissions limit, then the owner/operator shall remedy the
CCT's failure to meet the design emissions limit, and shall not combust any fuel in the CCT
5

Pioneer Valley Energy CenterPrevention of Significant Deterioration Air PermitFinal PSD Permit Number 052-042-MA15
until the owner/operator has shown compliance with that limit during a subsequent emissiontest.
3. Starting 365 calendar days after initial startup, the owner/operator shall not discharge orcause to discharge into the atmosphere GHG emissions from the combined cycle turbine(CCT) in excess of 895 lbs of CO2e/MWhgrid on a 365-day rolling average. A new 365-dayrolling average emission rate is calculated each day by calculating the arithmetic average ofall hourly emission rates (sum of measured lbs CO2/MWhgrid with the emission factors from40 CFR part 98 for all other all components of greenhouse gases and excluding hours in
which the CCT was not operating) for the 365 preceding days.
4. The owner/operator shall not discharge or cause to discharge into the atmosphere emissionsfrom the 270 hp fire pump in excess of any of the following emission limits:
a. 4.0 g/KW-hour of nitrogen oxides and non-methane hydrocarbon combinedb. 0.20 g/KW-hour of PM toc. 0.20 g/KW-hour of PM25
5. The owner/operator shall not discharge or cause to discharge into the atmosphere emissions
from the 1500 KW emergency generator in excess of any of the following emission limits:
a. 6.4 g/KW-hour of nitrogen oxides and non-methane hydrocarbon combinedb. 3.5 g/KW-hour of carbon monoxidec. 0.20 g/KW-hour of PMiod. 0.20 g/KW-hour of PM2 s
6. The owner/operator shall not discharge or cause to discharge into the atmosphere emissionsfrom the auxiliary boiler in excess of any of the following emission limits:
Table VEmission Limits — Natural Gas
Pollutant Concentration Limit Mass Limit
Nitrogen Oxides 0.0291bs/MN4Btu 0.58 lb/hr
Sulfuric Acid Mist 0.0005 Ib/MMBtu nla
PMill0.0048 lb/MMBtu
filterable + condensables0.1 lb/hr
filterable + condensables
1,M25 0.0048 lb/lVLMBtufilterable + condensables
0.1 lb/hrfilterable + condensables
Carbon Monoxide 0.037 lbs/MMBtu 0.74 lb/hr
6

Pioneer Valley Energy CenterPrevention of Significant Deterioration Air PermitFinal PSD Permit Number 052-042-MA15
II. Operational Conditions
A. Emergency Generator and Fire Pump
1. The owner/operator shall only burn ULSD in the emergency generator and fire pump. Theowner/operator shall limit the operating hours of each of these emission units to 300 hours inany 12 consecutive month period. The owner/operator shall only operate the emergencygenerator during power loss from the electrical grid or as needed for required monitoring,testing, or maintenance. The owner/operator shall not operate the emergency generatorduring combustion turbine startup or shutdown.
2. The owner/operator shall only conduct readiness testing on the emergency generator and fire
pump between 12:00 pm and 3:00 pm.
3. The owner/operator shall not conduct readiness testing on the emergency generator and firepump during days when the hourly ambient NO2 level measured just before testing at thenearest ambient NO2 air quality monitor in Hampden County operated by the MassDEP andavailable at http://public.dep.state.ma.us/MassAir (or its successor) is 54 ppb or higher.Notwithstanding the preceding, the owner/operator may conduct readiness testing if thescheduled testing has been delayed due to previous NO2 measurements for five consecutivecalendar days.
4. The owner/operator shall install, maintain, and operate the emergency generator and fire
pump in accordance with the manufacturer's specification.
B. Combined Cycle Turbine
1. The owner or operator shall only burn either natural gas or ULSD in the combined cycle
turbine.
2. The owner/operator shall not burn ULSD in the combined cycle turbine for more than 1440
hours in any 12 consecutive month period. Note: Any fractional hour burning ULSD will be
rounded up to I hour. For example, 1 hour and 20 minutes on ULSD will be considered 2
hours using ULSD.
3. In addition to the ULSD combustion limitations imposed by Condition 11.B.2, theowner/operator shall only burn ULSD in the combined cycle turbine during hours when one
or more of the conditions in subparagraphs (a)-(f) below is true.
a. The interruptible natural gas supply is curtailed at the Tennessee No. 6 gas terminal hub.
A curtailment begins when the owner/operator receives a communication from the owner
of the hub stating the natural gas supply will be curtailed, and ends when the
owner/operator receives a communication from the owner of the hub stating that the
7

Pioneer Valley Energy CenterPrevention of Significant Deterioration Air PermitFinal PSD Permit Number 052-042-MA15
curtailment has ended.
b. A blockage or breakage in the gas line delivery system limits or prohibits the use ofnatural gas.
c. The owner/operator is commissioning the combined cycle turbine and, pursuant to theturbine manufacturer's written instructions, the owner/operator is required by themanufacturer to fire ULSD during the commissioning process.
d. The firing of ULSD is required for emission testing purposes as specified in Section IVof this permit or as required by the Commonwealth of Massachusetts.
e. Routine maintenance of any equipment requires the owner/operator to fire ULSD.
f. In order to maintain an appropriate turnover of the on-site fuel oil inventory, theowner/operator can fire ULSD when the last delivery of the oil to the tank was more thansix months ago.
4. In addition to the ULSD combustion limitations imposed by Condition 11.B.3, theowner/operator may not burn ULSD under subparagraphs Condition II.B.3.d-f on any day
when the Air Quality Index (AQI) for the area that includes Westfield, MA, as made
available through the AIRNow web site athttp://airnow.gov/index.cfm?action=airnow.local_city&cityid=74 (or its successor) is, or is
forecasted to be, 101 or more (or, if the AQI is re-scaled, to an equivalent value indicating air
quality Unhealthy for Sensitive Groups or worse). This provision does not apply to
Conditions 1I.B.3.a-c.
5. For purposes of Conditions 11.13.3.a and V.2.o, the owner/operator may designate an alternate
gas terminal hub in lieu of the Tennessee No. 6 hub. Such an alternate designation willbecome effective when EPA receives the owner/operator's written communication specifying
the owner/operator's alternate hub designation and shall remain effective until replaced by
another alternate hub designation.
6. The owner/operator shall not discharge or cause to discharge into the atmosphere from thecombined cycle turbine any gases, excluding water vapor, that exhibit greater than 10 percent
opacity (6-minute average). This operational restriction shall apply at all times, except when
firing ULSD during periods of startup or shutdown.
C. Auxiliary Boiler
1. The owner/operator shall not operate the auxiliary boiler for more than 1100 hours in any 12
consecutive month period.
2. The owner/operator shall only burn natural gas in the auxiliary boiler.
8

Pioneer Valley Energy CenterPrevention of Significant Deterioration Air PermitFinal PSD Permit Number 052-042-MA15
3. The owner/operator shall tune-up the auxiliary boiler within 14 days after commencement ofoperations, and at least once every year thereafter, including the following:
a. Inspect the burner, and clean or replace any components of the burner as necessary.
b. Inspect the flame pattern, and adjust the burner as necessary to optimize the flamepattern. The adjustment should be consistent with the manufacturer's specifications.
c. Inspect the system controlling the air-to-fuel ratio, and ensure that it is correctlycalibrated and functioning properly.
d. Optimize total emissions of carbon monoxide, consistent with the manufacturer'sspecifications.
e. Measure the concentrations in the effluent stream of carbon monoxide in parts permillion, by volume, and oxygen in volume percent, before and after the adjustments aremade (measurements may be either on a dry or wet basis, as long as it is the same basis
before and after the adjustments are made).
D. Cooling Tower
1. The owner/operator shall install high efficiency drift eliminators in accordance withmanufacturer's specifications and limit the amount of escaped water droplets to 0.0005 % ofthe total recirculating water.
III. Monitoring Requirements
1. The owner/operator shall install, operate, and maintain a continuous emission monitoringsystem (CEMS) to monitor carbon monoxide (CO), carbon dioxide (CO2), oxygen (02), andnitrogen oxides (NO,) emissions, and a continuous opacity monitoring system (COMS) forthe combined cycle turbine. The systems shall be operational prior to the initial stack testingrequired by Section IV.1 of this permit.
2. Except as specified in paragraphs a and b, the installation of the CO monitor shall meet theperformance specifications of 40 CFR Part 60 Appendix B, Performance Specifications 4 and
4A. After installation, the owner/operator shall conduct quality assurance procedures in
accordance with 40 CFR Part 60, Appendix F.
a. The CO monitoring system will have two ranges for measuring CO emissions:i. 0-12 ppm for steady state operations
0-10,000 ppm for startup/shutdown operations
b. The relative accuracy of the CO monitoring system shall be:i. For the 0-12 ppm range, the relative accuracy must be within +/-0.5 ppm.ii. For the 0-10,000 ppm range, the relative accuracy must be within +/- 125 ppm.
9

Pioneer Valley Energy CenterPrevention of Significant Deterioration Air PermitFinal PSD Permit Number 052-042-MA15
3. Except as specified in paragraphs a and b, the installation of the NO), monitor shall meet theperformance specifications of 40 CFR Part 75. After the installation the owner/operator shall
conduct quality assurance procedures in accordance with 40 CFR Part 75.
a. The NO), monitoring system will have two ranges for measuring NO„:i. 0-10 ppm for steady state operationsii. 0-120 ppm for startup/shutdown operations
b. The relative accuracy of the NO, monitoring system shall bei. For the 0-10 ppm range, the relative accuracy must be within +/-0.5 ppm.ii. For the 0-120 ppm range, the relative accuracy must be within +/- 6 ppm.
4. The installation of the CO2 and 02 monitors shall meet the performance specifications of 40
CFR Part 60, Appendix B, Performance Specification No. 3.
5. The installation of the continuous opacity monitoring system shall meet the performance
specifications of 40 CFR Part 60, Appendix B, Performance Specification No. 1.
6. The owner/operator shall install and operate a single, dedicated ASTM certified natural gas
flow meter for the combined cycle turbine.
7. The owner/operator shall install and operate a single, dedicated ASTM certified ULSD flow
meter for the combined cycle turbine.
8. The owner/operator shall calculate the heat input to the combined cycle turbine for each hour
of operation by using the fuel flow meters and the corresponding fuel's heat content.
9. The owner/operator shall provide fuel supplier certifications for each fuel delivery that
documents the sulfur content of the ULSD is 15 ppm sulfur by weight or less. Fuel suppliercertification shall include the following information:
a. The name of the oil supplier;b. The sulfur content of the oil;c. The method used to determine the sulfur content of the oil;d. The location of the oil when the sample was drawn for analysis to determine the sulfur
content of the oil; specifically including whether the oil was sampled as delivered to PVEC,
or whether the sample was drawn from oil in storage at the oil supplier's or oil refiner's
facility or another location;e. If the oil was not sampled as delivered, a statement that the sampling was performed
according to either the single tank composite sampling procedure or the all-levels sampling
procedure in ASTM D4057-88, "Standard Practice for Manual Sampling of Petroleum and
Petroleum Products" and that no additions have been made to the supplier's tank since
sampling.
10
Pioneer Valley Energy CenterPrevention of Significant Deterioration Air PermitFinal PSD Permit Number 052-042-MA15
10. As an alternative to fuel supplier certification, the owner/operator may elect to take a manualsample after each addition of oil to the storage tank in accordance with the samplingprocedure in ASTM D4057-88, "Standard Practice for Manual Sampling of Petroleum andPetroleum Products."
11. The owner/operator shall install and maintain a non-resettable operating hour meter or theequivalent software to accurately indicate the elapsed operating time of the turbine, includingperiods of when the unit is in startup and shutdown operations.
12. For the emergency generator, the owner/operator shall install and maintain a non-resettableoperating hour meter or the equivalent software to accurately indicate the elapsed operatingtime.
1.3. For the fire pump, the owner/operator shall install and maintain a non-resettable operatinghour meter or the equivalent software to accurately indicate the elapsed operating time.
14. For the auxiliary boiler, the owner/operator shall install and maintain a non-resettableoperating hour meter or the equivalent software to accurately indicate the elapsed operating
time.
Iv. Testing Requirements
The owner/operator shall:
Ensure that all emissions tests are completed within 180 days after initial "startup," as thatterm is defined in 40 C.F.R. § 60.2, of the CCT.
2. Submit a proposed emission test protocol(s) (including testing for startup and shutdown
emissions) for EPA review and approval at least 60 days prior to the date of actual testing.EPA may revise the proposed emission test protocol or request that the owner/operator reviseand re-submit.
3. Submit the final emission test report(s) to the EPA within 60 days after the completion ofeach of the tests.
4. Ensure that all stacks are constructed so as to accommodate the emissions testingrequirements as stipulated in 40 CFR Part 60, Appendix A.
5. Ensure that all emissions testing is conducted in accordance with the EnvironmentalProtection Agency test requirements as specified in the 40 CFR Part 60, Appendix A, or by amethodology approved by the EPA.
6. Conduct volumetric flow rate and velocity testing in accordance with 40 CFR Part 60,Appendix A, Method 1 and 2 and either Method 2F (3 dimensional probe) or Method 2G(two dimensional probe).
11

Pioneer Valley Energy CenterPrevention of Significant Deterioration Air PermitFinal PSD Permit Number 052-042-MA15
7. Measure PM1o/PM2 5 emissions using 40 CFR 51, Appendix M, Test Method 201 or 201a,and Test Method 202, or another test method approved by EPA.
8. Conduct initial compliance emission tests at maximum load to determine compliance withthe emission limits (lb/hr, lb/MMBtu, and ppmvd) established in Section 1 for the CCT forthe following:
a. ULSD: NO,, CO, P1141 0/PM2 5, Sulfuric Acid Mist
b. Natural Gas: NO„ , CO, PM1o/PM25, Sulfuric Acid Mist, GHG
c. Conduct initial compliance tests for the duration of start-up and shut down periods for theCCT for NO„., and CO. Testing shall be done for both ULSD and natural gas.
V. Recordkeeping Requirements
The owner/operator shall maintain records of emergency engine operation that show it operatedaccording to the allowable operating conditions listed in Conditions 11.A.1-4 of this permit.
2. The owner/operator shall maintain records of all information used to show compliance with theterms and conditions of this permit. The owner/operator shall maintain the records for five yearsin a location accessible to staff personnel from EPA and MassDEP. At a minimum, the recordsshall contain in either paper or electronic format, the following information:
a. Date and hours of operation of the combined cycle turbine.
b. Amount of electricity delivered to the grid for each operating hour.
c. Date and hours of operation of the emergency generator.
d. Date and hours of operation of the fire pump.
e. Date and hours of operation of the auxiliary boiler.
f. Date and time of start-up and shutdown of the combined cycle turbine.
g. Date, time and specifications of all maintenance performed on the combined cycleturbine and continuous monitoring devices and the type or a description of themaintenance performed and the date and time the work was completed.
h. Date, time and specifications of all maintenance performed on all pollution controlequipment including dry low NO„ combustors, water injection, and selective catalystreduction for controlling NO, and the catalytic oxidation system for controlling CO.
12
Pioneer Valley Energy CenterPrevention of Significant Deterioration Air PermitFinal PSD Permit Number 052-042-MA15
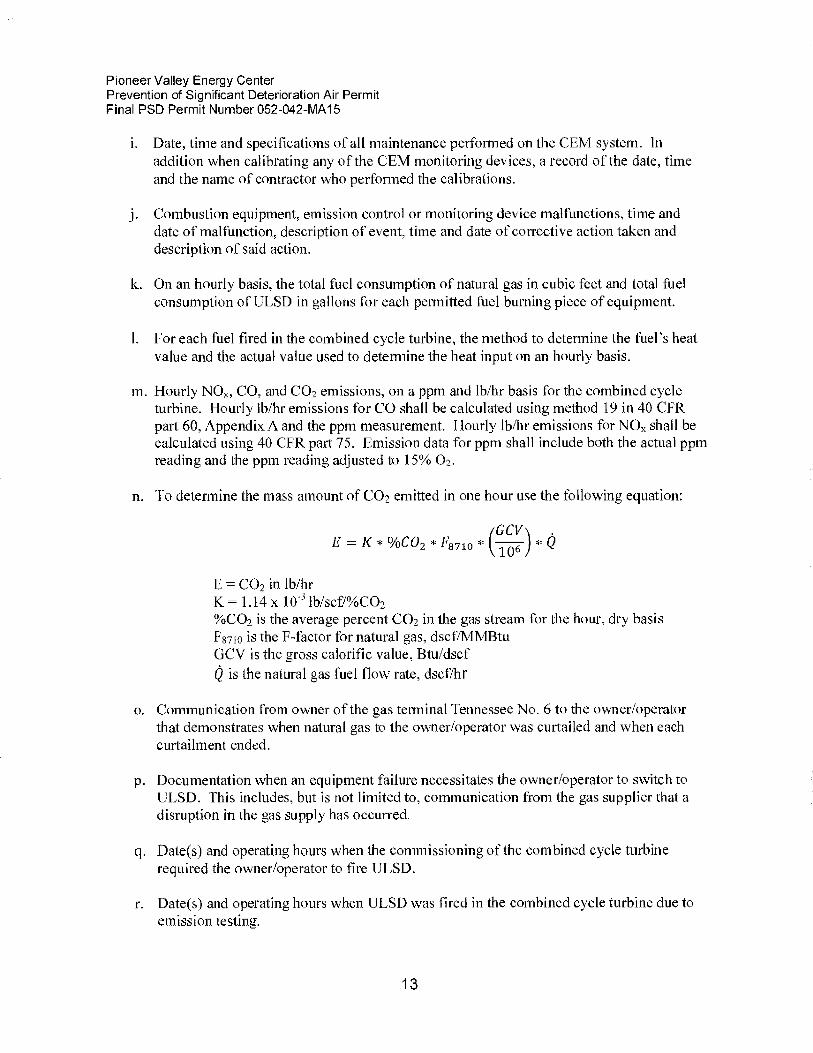
i. Date, time and specifications of all maintenance performed on the CEM system. Inaddition when calibrating any of the CEM monitoring devices, a record of the date, timeand the name of contractor who performed the calibrations.
j. Combustion equipment, emission control or monitoring device malfunctions, time anddate of malfunction, description of event, time and date of corrective action taken anddescription of said action.
k. On an hourly basis, the total fuel consumption of natural gas in cubic feet and total fuelconsumption of ULSD in gallons for each permitted fuel burning piece of equipment.
1. For each fuel fired in the combined cycle turbine, the method to determine the fuel's heatvalue and the actual value used to determine the heat input on an hourly basis.
m. Hourly NO,„ CO, and CO2 emissions, on a ppm and lb/hr basis for the combined cycleturbine. Hourly lb/hr emissions for CO shall be calculated using method 19 in 40 CFRpart 60, Appendix A and the ppm measurement. Hourly lb/hr emissions for NO), shall becalculated using 40 CFR part 75. Emission data for ppm shall include both the actual ppmreading and the ppm reading adjusted to 15% 02.
n. To determine the mass amount of CO2 emitted in one hour use the following equation:
(GCE = K * VoCO2 * -P871° * 10V\6 )
*Q
E = CO2 in lb/hrK = 1.14 x 10⁻³ lb/scf/%CO2%CO2 is the average percent CO2 in the gas stream for the hour, dry basisF8710 is the F-factor for natural gas, dscf/MMBtuGCV is the gross calorific value, Btu/dscf
is the natural gas fuel flow rate, dscf/hr
o. Communication from owner of the gas terminal Tennessee No. 6 to the owner/operatorthat demonstrates when natural gas to the owner/operator was curtailed and when eachcurtailment ended.
P.
q.
Documentation when an equipment failure necessitates the owner/operator to switch toULSD. This includes, but is not limited to, communication from the gas supplier that adisruption in the gas supply has occurred.
Date(s) and operating hours when the commissioning of the combined cycle turbinerequired the owner/operator to fire ULSD.
r. Date(s) and operating hours when ULSD was fired in the combined cycle turbine due toemission testing.
13

Pioneer Valley Energy CenterPrevention of Significant Deterioration Air PermitFinal PSD Permit Number 052-042-MA15
s. Date(s), operating hours, and maintenance logs when routine maintenance of anyequipment required the owner/operator to fire ULSD.
t. The date and amount in gallons when ULSD was delivered to the storage tank that is usedfor the combined cycle turbine. Sum the deliveries for each calendar month.
u. Date(s) and operating hours when ULSD was fired in the combined cycle turbine inaccordance with permit Condition 11.B.3. Sum the usage for each calendar month.
3. The owner/operator shall display copies of this permit in reasonably accessible locations asnear to the subject equipment as is practical.
4. The owner/operator shall establish a maintenance procedure for ensuring the integrity of thedrift eliminators.
5. The owner/operator shall keep a record of all hourly ambient NO2 levels used by theowner/operator in determining readiness testing of the fire pump and/or emergency generatorcould proceed.
VI. Reportinu Requirements
1. The owner/operator shall notify EPA in writing within 30 days after construction has been"commenced" as that term is defined in 40 C.F.R. § 52.21(b)(9), and, if construction isdiscontinued, then within 30 days after construction has been discontinued and again within30 days after construction has been re-commenced.
2. The owner/operator shall notify EPA in writing within 15 days after the actual date of initial"startup" as that term is defined in 40 C.F.R. § 60.2.
3. The owner/operator shall submit quarterly CEMS and COMS reports in writing to EPA andMassDEP. The reports will be submitted by January 30th, April 30th, July 30th and October30th of each year and will contain at least the following information:
a. The reports from the facility CEMS and COMS shall identify any periods of excessemissions; and
b. For each period of excess emissions or excursions from allowable operating conditions,PVEC shall list the duration, cause, the response taken, and the amount of excessemissions. Periods of excess emissions shall include periods of start-up, shutdown,malfunction, emergency, equipment cleaning, and upsets or failures associated with theemission control system or CEMS and COMS.
4. Within 48 hours of receiving a shipment of ULSD with a sulfur content by weight in excess of 15ppm, the owner/operator shall notify EPA and MassDEP in writing of such receipt, including theinformation in Condition 111.9 above, and shall not combust that fuel.
14

Pioneer Valley Energy CenterPrevention of Significant Deterioration Air PermitFinal PSD Permit Number 052-042-MA15
5. After the occurrence of any violation of any emission limitation, the owner/operator must notifyEPA New England, Office of Environmental Stewardship, attention Compliance and EnforcementChief, by FAX at (617) 918-1810 within two business days, and subsequently in writing to theaddress listed in Section XII below within seven calendar days.
6. Compliance with Condition V1.5 or any other condition of this permit requiring theowner/operator to notify EPA of excess emissions or of any other violation of the permit shallnot excuse or otherwise constitute a defense to any violation of the permit or of anyapplicable law or regulation.
VII. Right of Entry
The owner/operator shall allow all authorized representatives of EPA, upon presentation ofcredentials, to enter upon or through the facility where records required under this permit arekept. The owner/operator shall allow such authorized representatives, at reasonable times:
1. To access and copy any records that must be kept under this permit
2. To inspect any facilities, equipment (including monitoring and air pollution controlequipment), practices, or operations regulated or required under this permit; and
3. To monitor substances or parameters for purposes of assuring compliance with this permit.
VIII. Transfer of Ownership
In the event of any changes in control or ownership of the PVEC facility, this permit shall bebinding on all subsequent owners and operators. The owner/operator shall notify the succeedingowner and operator of the existence of this permit and its conditions before such change ifpossible, but in no case later than 14 days after such change. Notification shall be sent by letterwith a copy forwarded within 5 days to EPA.
IX. Severability
The provisions of this permit are severable, and if any provision of the permit is held invalid, theremainder of this permit will not be affected thereby.
X. Credible Evidence
For the purpose of submitting compliance certifications or establishing whether or not theowner/operator has violated or is in violation of any provision of this permit, the methods used inthis permit shall be used, as applicable. However, nothing in this permit shall preclude the use,including the exclusive use, of any credible evidence or information, relevant to whether theowner/operator would have been in compliance with applicable requirements if the appropriateperformance or compliance test procedures or methods had been performed.
I5

Pioneer Valley Energy CenterPrevention of Significant Deterioration Air PermitFinal PSD Permit Number 052-042-MA15
XI. Other Applicable Re2ulations
The owner/operator shall construct and operate all equipment regulated herein in compliancewith all other applicable provisions of federal and state air regulations.
XII. A2encv Address
Subject to change, all correspondence required by this permit shall be forwarded to:
Air Compliance ClerkU.S. EPA New England5 Post Office SquareSuite 100, OESO4-2Boston MA 02109-3912
l6

I p

SrgrFiP
,00
"II CD-z
0-;•19,44 PACO('
UNITED STATES ENVIRONMENTAL PROTECTION AGENCYREGION 1
5 POST OFFICE SQUARE, SUITE 100BOSTON, MA 02109-3912
FACT SHEET
Pioneer Valley Energy CenterAmpad RoadWestfield, MA
EPA Draft Permit (Revised)Permit Number 052-042-MA14
1

Table of Contents
I. GeneralInforrnation 3
IL Project Location 4
III. Proposed Project 5
IV. P SD Program Applicability and Review 6
V. PS D Applicab it ity 7
VI. BACT Analysis 9
V11. Monitoring and Testing 30
VIII. Endangered Species Act/ESA 30
IX, Impact Analysis Based on Modeling 31
X. Mass Based Emission Limits 37
XI. Environmental Justice (EJ) 38
XLI. National Historic Preservation Act 46
XIII. Comment Period, Hearings and Procedures for Final Decisions 46
XIV. EPA Contacts 47

L General Information
Name of source: Pioneer Valley Energy Center
Location: Westfield, Massachusetts
Applicant's name and address: Ampad RoadWestfield, MA01803
Application Prepared by: ESS Group, Inc.888 Worcester Street, Suite 240Wellesley, MA 02482
Draft PSD permit number: 052-042-MA14
EPA contact: Donald DahlAir Permits, Toxics, and Indoor Air Program UnitEPA-New England5 Post Office SquareSuite 100 (0EP05-2)Boston, MA 02109-3912Telephone: (617) [email protected]
In November 2008, Pioneer Valley Energy Center (PVEC) submitted an initial application toEPA-New England (EPA) requesting a prevention of significant deterioration (PSD) permit for anew 431 MW combined cycle electric generating facility in Westfield, Massachusetts("Facility"). PVEC submitted additional information on March 10, 2010, July 12, 2010, andOctober 27, 2010. OnNovember 5, 2010, EPA issued a draft PSD permit fora 30 day publiccomment period.
As ofJanuary 2, 2011, any source required to obtain a PSD permit must assess greenhouse gas(GHG) emissions to determine if GHG emissions are subject to regulation under the PSDpermitting program. Since greenhouse gas emissions for this project are estimated to be over75,000 tons per year on a carbon dioxide equivalent basis (CO2e), PVEC determined theproject's GHG emissions would be subject to PSD. On March 9, 2011 and July 12, 2011, PVECsubmitted additional information to support its request for a PSD permit, including a BACTanalyses for GHG emissions. On September 22.2011 and October 14, 2011, PVEC submittedmodeling analysis using meteorological data from Barnes Airport. EPA considers the receipt ofthe additional information on October 14, 2011 as completing the application for this draftpermit.
After reviewing the November 2008 PSD application and additional information, EPA preparedthis Fact Sheet and draft PSD permit for the proposed PVEC project as required by 40 CFR Part124-Procedures for Decision Making.
3

EPA's permit decisions are based on the information and analysis provided by the applicant andEPA's own technical expertise. This Fact Sheet documents the information and analysis EPAused to support the PSD permit decisions. It includes a description of the proposed facility, theapplicable PSD regulations, and an analysis demonstrating how the applicant complied with therequirements.
Based on all submittals, EPA has concluded PVEC's application is complete and provides thenecessary information showing the project meets federal PSD regulations. EPA is makingPVEC's submitted information part of the official record for this Fact Sheet and PSD permit.The initial application and supplemental information for this permit are available on-line at EPANew England's Web Site http://www.epa.gov/ne /CO MM.! nities/nsemissions.html.
Please note this project is also subject to the Massachusetts Department of EnvironmentalProtection's (MassDEP) Comprehensive Plan Approval (CPA) requirements under theCommonwealth's regulations at 310 Code of Massachusetts Regulations (CMR) 7.02. OnDecember 31, 2010, the Commonwealth issued the CPA. The CPA regulates all pollutantsaffected by the proposed project, including the pollutants regulated under the PSD permit,1 andalso implements MassDEP's nonattainmentNew Source Review (NSR) program regulations at310 CMR 7.00: Appendix A. PVEC must comply with both the federal PSD permit and theMassDEP's CPA, as well as other applicable federal and state requirernents.2
H. Project Location
The proposed plant site is located in an industrial land-use area of Westfield, Massachusettsbounded by Servistar Industrial Way toward the south and east, Ampad Road toward the west,and an undeveloped wooded area toward the north.
This new facility will be located in an area which is classified as either "attaitunent" or"unclassifiable" for sulfur dioxide (SO2), nitrogen dioxide (NO2), carbon monoxide (CO),particulate matter with diameters less than 10 microns (PMio) and 2.5 microns (PM25), and lead.Therefore, the facility is located in a PSD area for these pollutants. EPA has also designatedwestern Massachusetts as a moderate non-attainment area under the 8-hour ground level ozoneNAAQS. See 40 CFR 81.322.
For greenhouse gases, the CPA only regulates carbon dioxide (CO2), not the full suite of GHGs regulated by thisPSD permit.2 It is also possible that the facility may become subject to Section 112(r) of the Clean Air Act. Section 112(r)provides in relevant part:
It shall be the objective of the regulations and programs authorized under this subsection to prevent theaccidental release and to minimize the consequences of any such release of any substance listed [underCAA 112(r)(3)] or any other extremely hazardous substance. The owners and operators of stationarysources producing, processing, handling or storing such substances have a general duty ... to identifyhazards which may result from such releases using appropriate hazard assessment techniques, to design andmaintain a safe facility taking such steps as are necessary to prevent releases, and to minimize theconsequences of accidental releases which do occur.
42 US C 7412(r)(1). For more information regarding Section 112(r) requirements, seefittp://www.epa.goviosweroel/docs/chetn/gdc-fact.pdf.
4

In Proposed Project
PVEC proposes to construct a 431 MW (gross) electrical generating facility located on anundeveloped site offofAmpad Road in Westfield, Massachusetts. The major systemcomponents will consist of a Mitsubishi M501G air-cooled combined cycle turbine, an auxiliaryboiler, an emergency diesel engine/generator and emergency diesel engine/fire pump, amechanical draft wet cooling tower, and tanks for the storage of ultra low sulfur distillate oil(ULSD) or a blend of 20% biodiesel oil and 80% ULSD (B20).
The combustion turbine will fire natural gas as a primary fuel and ULSD/B20 oil as a backupfuel. The combustion turbine will have a maximum heat input rate of 2,542 million Britishthermal units per hour (MMBtu/hr) at ISO conditions and a maximum gross power output(including the steam turbine) of 431 MW while firing natural gas. The maximum heat input rateand gross power output will be 2,016 MMBtu/hr and 306 MW, respectively, when firingULSD/B20 oil.
The heat recovery steam generator (HRSG) will house a Selective Catalytic Reduction (SCR)emissions control system to minimize emissions of nitrogen oxides (N0x) and an oxidationcatalyst to minimize emissions of carbon monoxide (CO) and volatile organic compounds(VOC). Exhaust gases from the combustion turbine/HRSG will be discharged through anexhaust stack 23 feet in diameter and 180 feet tall.
The auxiliary boiler and emergency diesel engine/generator will be housed within the main plantbuilding. The auxiliary boiler will have a maximum heat input rate of approximately 21MMBtu/hr and will be fired by natural gas. The emergency diesel engine/generator will have apower output of approximately 2,174 horsepower (hp) and 1500 KWe-shaft. The emergencydiesel fire put-rip is a 270 hp engine that will be housed in a separate, small building located to thenorth of the main plant building. Both diesel engines will be fueled with ULSD/B20.
PVEC has requested the combined cycle turbine be permitted for unrestricted operation onnatural gas and for the usage of up to 1440 hours (equivalent to 60 days) per 12-month period onULSD/B20. Assuming an ULSD/B20 oil heating value of 138,000 Btu/gallon, this is equivalentto approximately 14,609 gallons per hour fuel use rate or 21.0 million gallons per 12-monthperiod.
The auxiliary boiler will be limited to the equivalent of no more than 1,100 hours of operationper rolling 12-month period. The emergency die selengine/generator and fire pump will each belimited to no more than 300 hours of operation per rolling 12-month period. The emergencydiesel engine/generator and fire pump will not operate concurrently with the combustionturbine/HRSG except for sometime between the hours of 12:00 pm and 3:00 pm for maintenanceand testing.
5

Iv. PSD Program Applicability and Review
As stated earlier, EPA currently classifies Western Massachusetts as a moderate nonattainmentarea for ground level ozone and attainment/unclassifiable for all other criteria pollutants. Underthese classifications, MassDEP administers the nonattainment NSR program to regulateemissions of Volatile Organic Compounds (VOC) and Nitrogen Oxides as a precursor to groundlevel ozone. EPA administers the PSD program that applies to the emissions of all otherregulated criteria pollutants, includ ing NO2. NO2 is a constituent of NOx.
Before March 2003, under a delegation agreement with the EPA, Massachusetts administered thefederal PSD program at 40 CFR 52.21 and issued PSD permits to sources in Massachusetts.However, in March 2003, Massachusetts returned the PSD program to EPA. In April 2011,Massachusetts once again became the PSD permitting authority under a new delegationagreement with EPA. However, Section IV.K. ofthe delegation agreement specifies that EPAwould retain the responsibility in issuing the PSD permit for PVEC. After this permit has takenfinal effect, MassDEP may implement the PSD program with respect to this permit and thisfacility to the same extent as any other facility in Massachusetts, and where this permit refers tocommunications to or approval by EPA, MassDEP may act on EPA's behalf.
The MassDEP continues to administer its state permitting regulations and to issuecomprehensive plan approvals to sources in Massachusetts. Typically, sources that are subject tothe federal PSD program are also subject to the state permitting program.
The PSD regulations require major new stationary sources or major modifications to an existingmajor stationary source to undergo a PSD review and to receive a PSD permit beforecommencement of construction.
40 CFR 52.21 (b)(1) ofthe federal PSD regulations defines a "major stationary source" as either(a) any of 28 designated stationary source categories with potential emissions of 100 tons peryear or more of any regulated NSR pollutant, or (b) any other stationary source with potentialemissions of 250 tons per year or more of any regulated NSR pollutant. Combined cyclegenerating facilities like PVEC are part of the 28 designated stationary source categories forwhich 100 tons per year ofpotential emissions qualifies the source as "major."3
In addition, once a new stationary source has been determined to be a "major" source, it issubject to PSD review for each regulated NSR pollutant that the source would have the potentialto emit in "significant" amounts, which in some cases are lower than the "major" thresholds.Forty CFR 52.21(b)(50)(iv) includes pollutants "subject to regulation" as defined in 40 CFR52.21(b)(49) as regulated NSR pollutants. For this project, GHG emissions become a regulatedNSR pollutant if the project's total GHG emissions on a CO2e basis equal or exceed 75,000 tonsper year.
3 "Determining Prevention of Significant Deterioration (PSD) Applicability Thresholds for Gas Turbine BasedFacilities," memo from Edward J, Lillis, dated February 2, 1993.
6

If EPA determines a new stationary source or new modification is subject to the PS D program,the source must apply for and obtain a PSD permit that meets regulatory requirements including:
• Best Available Control Technology (BACT) requiring sources to minimize emissions tothe greatest extent possible;
• An ambient air quality analysis to ensure all the emission increases do not cause orcontribute to a violation of any applicable PSD increments or NAAQS;
• An additional impact analysis to determine direct and indirect effects o f the proposedsource on industrial growth in the area, soil, vegetation and visibility; and
• Public comment including an opportunity for a public hearing.
V. PSD Applicability
The Facility is considered a major source of air pollution as defined by EPA's PSD program.Potential emissions from the new turbine are significant for six different pollutants; PM10, FM25,CO, NOx, sulfuric acid mist and GHG. Table 1 lists the significance level threshold for severalpollutants and the potential emissions from the proposed new equipment at the site.
7

Table 1Facility Potential Emissions (tons per year)
Pollutant
CombustionTurbine(8,215hr/yr)
AuxiliaryBoiler(1,100hr/yr)
EmergencyGenerator(300 hr/yr)
FirePump
(300 hr/yr)
PTE-NormalOperation (')
CT Startup/Shutdovvn 12)
(545 hr/yr)
FacilitypTE(3)PSD Sig.
Emission Rates(TPY)
P SD?
NOx 91.9 0.3 5.6 0.5 98.4 12.6 110.9 40 yesCO 59.9 0.4 1.8 0.3 62.5 487.4 549.9 100 yesSO2 16.7 0.0 0.5 0.1 17.2 0.8 18.0 40 noH2SO4 mist 17.2 0.0 0.0 0.0 17.2 0.8 18.0 7.0 yesPM].0/PM2.5(Total)
49.1 0.1 0.1 0.0 49.4 1.7 51.015 Plvlia10 PM.25
yes
PMio/PM25(F ilterab le)
24.6 0.0 0.1 0.0 24.7 0.8 25.5 -
PM/PM1o/PM2 5(Condensible)
24.6 0.0 0.1 0.0 24.7 0.8 25.5 - -
VOC 23.8 0.0 0.3 0.1 24.2 0.6 24.8 40 noLead 0.0 0.0 0.0 0.0 0.0 0.0 0.0 0.6 no
GI1G (C Olebasis)4 1,480,786 1,394 383 47 1,482,610
75,000 CO2e andany amount of
GHG yes
1. Total emissions represent maximum potential o f all equipment operating independently in normal operation, and are based on theoperation of the combustion turbine for 8,215 hr/yr, the auxiliary boiler for 1.100 hr/yr, the emergency generator and fire pump for 300hr/yr each, and on 545 hr/yr spent in startup or shutdown
The combustion turbine may operate in excess of 8,215 hours per year which would result in decreased startup and shutdown hours anddecreased overall emissions.
2. Startup/shutdown emissions are estimated based on 141 warm starts (2 hrs each), 35 cold starts (5 hours each) and 176 shutdowns peryear.
3. The Facility PTE is the sum o f the PTE during normal operation and during startup/shutdown of the combustion turbine.
4. GHG emissions are calculated assuming 7,320 hours on natural gas and 1440 hours on ULSD. The value of75,000 TPY CO2e under "PSDSig. Emission Rate(s)" represents the "subject to regulation' threshold for GHG, per 40 CFR 52.21 (b)(49).
8

VI. BACT Analysis
As required by the federal PSD program at 40 CFR 52.21(j)(2) and (3), PVEC is required toapply BACT to the NO,, PM10, PM2.5, CO, GHG, and H2SO4 mist emissions from the newturbine and other emission units. BACT is defined as, an emissions limitation ... based on themaximum degree of reduction for each pollutant subject to regulation under [the Clean Air] Actwhich would be emittedfrom any proposed major stationary source or major modification whichthe Administrator, on a case-by-case basis, taking into account energy, environmental, andeconomic impacts and other costs, determines is achievable for such source or modificationthrough application of production processes or available methods, ,systems and techniques .„ forcontrol of such pollutant. 40 CFR 52.21(b)(12); Clean Air Act (CAA) 169(3).
In making its BACT determinations, EPA follows the following five step "top-down"methodology as outlined in several EPA po licy memoranda.
1. Identify all control technologies. Identify all possible control options, includinginherently lower emitting processes and practices, add-on control equipment, orcombination of inherently lower emitting processes and practices and add-on controlequipment.
2. Eliminate technically infeasible options. Eliminate technically infeasible options basedon physical, chemical, and engineering principles.
3. Rank remaining control technologies by control effectiveness. Rank the remainingcontrol options by control effectiveness, expected emission reduction, energy impacts,environmental impacts, and economic impacts.
4. Evaluate most effective controls and document results. Determine the economic,energy, and environmental impacts ofthe control technology on a case-by-case basis.
5. Select the BACT. Select the most effective option not rejected as the BACT.
Combined Cycle Turbine
Clean Fuels
Background
For the turbine, a major element of the BACT analysis is the use of clean fuels. This Fact Sheetdiscusses the BACT analysis for fuels here, rather than repeating it for each individual pollutant.
PVEC has proposed to burn primarily natural gas, which is a clean-burning fuel. However, as analternate fuel, PVEC has requested permission to burn ultra low sulfur distillate oil (ULSD) or a
9

blend of ULSD and 20% biodiesel oil (B20) for up to 1440 hours per year.4 While ULSD and1320 are the cleanest-burning fossil fuels other than natural gas, for several regulated NSRpollutants, air emissions from burning ULSD/B20 are higher than from burning natural gas.
Step 1: Identify all control technologies.
Since this section is focusing on fuels, the identified control technologies are:
1. use of natural gas only2. primarily natural gas with ULSD as a backup fuel3. primarily natural gas with B20 as a backup fuel4. primarily natural gas with either ULSD or B20 as a backup fuel
Step 2: Eliminate technically infeasible options
None ofthe above fuel options are technically infeasible.
Step 3: Rank remaining control technologies by control effectiveness.
With respect to pollutant emissions, natural gas is the cleanest fuel identified. ULSD and B20have higher emissions than natural gas, but their emissions are essentially identical. Theadditional daily emissions from burning ULSD/B20 are 0.27 tons of NO„, 0.23 tons of CO, 0.20
tons ofPM10/25 (totaling 0.7 tons/day, or 42 tons/year), and 962 tons/year of GliGs (measured inCO2e).
Since natural gas is a cleaner fuel than ULSD/B20, it ranks higher in terms of controleffectiveness. However, as noted above, in determining the BACT, EPA is required to considerenergy impacts, environmental impacts, and economic impacts. This section discusses theenergy, environmental, and economic impacts of natural gas as opposed to ULSD/B20. 5
Step 4: Evaluate most effective controls and document results.
1. Energy impacts- In order to understand the energy impacts associated with natural gas, abrief background on the New England energy market is helpful. Under extremeconditions, the Independent System Operator-New England ("ISO-NE"), which regulatesthe New England electricity market, may declare an "Energy Emergency" if there may besustained national or regional shortages in fuel availability or deliverability to the NewEngland region's generation resources. Such shortages of fuel may come in many forms,including, but not limited to: severe drought, or interruption to availability ortransportation of natural gas, liquefied natural gas, oil, or coal.6 In such circumstances,
4 On October 19, 2009, the Commonwealth of Massachusetts Energy Facilities Siting Board (EFSB) issued its ruling
limiting the amount of ULSD that PVEC can bum to this amount.5 As noted above, the emissions of ULSD and B20 are essentially identical, and EPA is unaware of any significant
differences between ULSD and B20 with respect to energy, economic, or environmental impacts. Consequently,
having no reason to prefer ULSD or B20, the rest of this analysis focuses on ULSD/B20 vs. natural gas.6 See 1SO New England Operating Procedure No. 21, "Action During an Energy Emergency" (June 1, 2010), at
http://www.iso-ne.com/rules_proceds/operating/isone/op21/op21 rto final.pdf.
10

ISO-NE may ask dual-fuel units to voluntarily switch to operation on the fuel source thatis not in short supply. While the natural gas transportation capacity in New England hasimproved in recent years, the possibility of a temporary gas shortage has not beencompletely eliminated.
Short of a declared energy emergency, there may also be practical constraints on a powerplant's ability to obtain natural gas on a given day. It is important to distinguish twodifferent types of natural gas service. "Firm" or "non-interruptible" service customerspurchase, in advance, a right to a guaranteed supply. Pipeline companies must beprepared to provide daily service up to the maximum specified volume or service levelunder firm contracts or tariffs even though the firm customers may not actually purchaseor request transportation of that volume of gas on any given day. In return for this serviceguarantee, firm customers pay rates that allow pipeline companies to recover most of thefixed costs associated with the firm load, e.g., constructing, maintaining, and operatingthe pipeline system. By contrast, "interruptible" gas service, which is generally pricedsubstantially lower than firm service, does not guarantee supply, and the availability ofcapacity to serve interruptible customers is often limited during periods of peak gasdemand.7 Due to bottlenecks in distribution, there may be days when interruptibleservice customers simply cannot obtain sufficient natural gas at any price. There mayalso be extremely local disruptions where, for various reasons, natural gas is generallyavailable in New England, but it cannot be delivered to a specific site due to a localsystem failure.
2. Economic impacts - Even when natural gas is available, under certain market conditions,natural gas may be so much more expensive than ULSD that natural gas becomes cost-ineffective as a means of pollution control, or, put another way, the economic impacts ofnatural gas make it no longer BACT. To the best of EPA's knowledge, this is determinedby two factors: (1) whether the facility uses an 'interruptible or firm contract, and (2)whether there is a natural gas shortage. In simple terms, with a firm contract, the price ofnatural gas is always high but always available; with an interruptible contract, the price ofgas is almost always lower than under a firm contract, but in rare events the spot marketprice could exceed the firm contract price. Since the primary reason that the spot marketprice could exceed the firm price is a curtailment, the economic impact analysis beginswith a discussion of contract mechanisms. On March 10, 2010, PVEC supplemented itsBACT analysis by including the cost differential between the two types of natural gascontracts. A non-interruptible contract for PVEC (which would enable it to burn 100%natural gas) would cost an additional $13,900,000 dollars per year. As noted above, thisfacility is already subject to an EFSB limitation that prevents it from burning more than1440 hours of ULSD/B20. Since the totalpollution (all non-GHG pollutants combined)avoided by burning 100% natural gas as opposed to 1440 hours' ULSD/B20 is 42tons/year, use of 100% natural gas via a non-interruptible contract would involve a costper ton ofcriteria pollutants avoided of $330,952/ton and $14,499/ton of GHG (measuredin CO2e). This is well outside the range of controls or fuels determined to be cost-effective in previous BACT determinations.
7 For more background information, see httpi/wwwl.eere.energy.gov/cleancities/pdfs/glossary ng_purchasing.pdf.
11

One fmal possibility deserves discussion. Since EPA (through BACT) regulates controltechnologies (including available clean fuels), not market mechanisms for purchasingsuch technologies, it is conceivable that an appropriate BACT determination would stillbe to require 100% natural gas, but to leave the facility to purchase natural gas on thespot market (if it so desired) through interruptible contracts, rather than commit to a non-interruptible contract. However, if PVEC were only authorized to burn natural gas and itproceeded with interruptible contracts, then there could be times when a curtailment innatural gas supply would sufficiently affect the cost and availability in such a manner thatrequiring natural gas only would have unacceptable energy impacts (because gas is notavailable to interruptible customers) or unacceptable economic impacts (because the spotmarket price of gas is not cost-effective as a means ofpollution control). As a practicalmatter, the occasions on which gas is not available to interruptible customers or the spotmarket price of gas is not cost-effective as a means ofpollution control are only likely tooccur when there is a curtailment of supply. This means that the economic impacts ofthis option (i.e., the permit allowing only natural gas, but the facility pursuinginterruptible contracts) are largely the same as the energy impacts (discussed onpage 11).
3. Environmental impacts - When the turbine burns ULSD, water is injected into thecombustion area to control the formation of thermal NO,. This increase in water usage isapproximately 410,000 gallons per day. Over a 60-day period, this would mean24,600,000 excess gallons of water for burning ULSD/1320 as opposed to gas. The waterused to control NO, emissions represents 18% of the facility's water needs. PioneerValley will obtain its water from two municipal water sources, Westfield and Holyoke.
According to EPA's Water Sense program, an average family of four can use 400 gallonsof water per day.8 This means the water used to control NO, emissions when burningULSD is the equivalent of how much water 1025 households would use on a daily basis.
As previously discussed, EPA has limited Pioneer Valley's ability to burn ULSD tocircumstances when the ability to burn natural gas is curtailed. During these times,PVEC may not be able to generate electricity if it is not capable of burning ULSD. Theshutdown of PVEC would result in a loss of 306 MW per hour, or a total o f 7344MW/day. According to data obtained from the Massachusetts Department of Energy andEnvironmental Affairs,9 the average household in Massachusetts uses 700 kw per monthwhich equates to about 23 kw per day. Based on these numbers, preventing PVEC fromgenerating electricity would remove enough electricity to power over 300,000 homes.
Within this step of the BACT analysis, EPA weighs the all of the environmental, energy,and economic impacts. Since the energy impact of requiring 100% natural gas (loss ofelectricity) outweighs the collateral environmental impact of allowing ULSD/B20(additional water usage) by a factor of300 on a per household basis, EPA concludes thatthe burning of ULSD under restricted circumstances is allowable even though the burningof ULSD uses more water.
8 See http://vv vv w.epa.gov/WaterSens e/pubs/indoor.html.9 See http://www.mass .go v/eea/energy -c lean-tech/electric-power/electric -ma rket-info/electric -cu s tomer-migrat ion -d ata.html
12

As noted above, natural gas is the most effective fuel for pollution reduction and also haslower collateral environmental impacts (water usage), but on the other hand, allowingonly natural gas combustion could have adverse energy and/or economic impacts.
EPA finds that allowing only natural gas would not be BACT because of these potentialadverse 'impacts. Rather, BACT includes burning ULSD/B20 as a backup fuel.However, EPA also finds that allowing unrestricted burning of ULSD/B20 for 1440 hoursper year (as PVEC has requested) is not BACT, because it would allow the facility toburn the dirtier fuel beyond the point that may be justified by the need to avoidunacceptable energy and/or economic impacts.
Step 5: Select BACT
EPA is proposing to allow PVEC to burn ULSD/B20 as a backup fuel, but only underspecifically defined circumstances that constrain its usage to those situations where not allowingULSD/B20 would impair the facility's ability to generate at all. These situations include: acurtailment in the natural gas supply; commissioning the turbine (which may require firing withoil); government-required emissions testing; equipment maintenance; and maintainingappropriate turnover of the on-site oil inventory. €°
To address these events, EPA is limiting the use of ULSD to the following circumstances:
1. The interruptible natural gas supply is curtailed at the Tennessee No. 6 gas terminal hub.A curtailment begins when the owner/operator receives a communication from the ownerof the hub informing the owner/operator stating that the natural gas supply will becurtailed, and ends when the owner/operator receives a communication from the owner ofthe hub stating that the curtailment has ended.
2. Any equipment (whether on-site or off-site) required to allow the turbine to utilize naturalgas has failed;
3. The owner/operator is commissioning the combined cycle turbine and, pursuant to theturbine manufacturer's written instructions, the owner/operator is required by themanufacturer to fire ULSD during the commissioning process;
4. The firing of ULSD is required for emission testing purposes as specified in the PSDpermit or as required by the Commonwealth of Massachusetts;
5. Routine maintenance of any equipment requires the owner/operator to fire ULSD;
6. In order to maintain an appropriate turnover of the on-site fuel oil inventory, theowner/operator can fire ULSD when the age of the oil in the tank is greater than six
10 Stored oil becomes less usable with time, and thus the facility may wish to combust oil at a certain point to avoid
wastage.
13
months. A new waiting period for when oil can be used pursuant to this condition willcommence once oil firing is stopped.
Finally, the total number of hours (including partial hours) of firing ULSD/B20 cannot exceed1440 per year.
NO,
NO„ emissions from the combustion of fossil fuels are largely the result of fuel-bound nitrogencontent of the fuel and high combustion temperatures.
Natural gas has negligible fuel-bound nitrogen, and ULSD has lower levels of fuel boundnitrogen than other liquid fossil fuel. The majority of the NO, emitted from the turbine isthermal.
Several design and add-on technologies have been developed to minimize NO, emissions, andhave been identified in Step 1 of the BACT analysis:
Step 1
1. Dry Low-NO, Combustors
In dry low-NO„ (DLN) burners, air and fuel are mixed before entering the combustor toprovide more homogeneous charge. To achieve low NO, emission levels, the mixture offuel and air should be near the lean flammability limit of the mixture. However, atreduced load conditions, lean premixed combustors may lead to some combustioninstability and increased CO emissions (which, as discussed below, will be controlled byan oxidation catalyst as part of the BACT for CO).
PVEC proposed using DLN burners as part of its BACT determination for controlling NO,emissions when burning natural gas.
2. Water Injection
Water injection involves injection of water or steam into the immediate vicinity of thecombustor burner flame. Instantaneous cooling reduces the NO, formation in thecombustion chamber. However water or steam injection may also lead to increases inemissions of CO and hydrocarbons (HC) resulting from incomplete fuel combustion. Thereis also a decrease in efficiency due to heat loss, resulting in an increase in greenhouse gasesper megawatt of electricity.
The technology of using water injection was proposed by PVEC as part of its BACTdetermination for controlling NO, emissions when burning ULSD/B20.
14

3. Catalytic Co mb us tio n/XON ON
Instead of burning the fuel with an open flame, a catalyst bed is first used to oxidize the fuelmixture. The use of the catalyst lowers the combustion temperature helping to minimize the
formation of thermal NO„ during combustion.
4. SCON0,1 I
SCONOXTM uses a potassium carbonate (K2CO3) coated catalyst to reduce oxide of
nitrogen emissions from natural gas fired, water injected, turbines. The catalyst oxidizescarbon-monoxide (CO) to carbon-dioxide (CO2), and nitric oxide (NO) to nitrogen-dioxide (NO2). The CO2 is exhausted while the NO2 absorbs onto the catalyst to form
potassium nitrites (KNO2) and potassium nitrates (KNO3). Dilute hydrogen gas is passedperiodically across the surface of the catalyst to regenerate the K2CO3 coating. The
regeneration cycle converts the KNO2 and KNO3 to K2CO3, water, and elementalnitrogen. The K2CO3 is thereby made available for further absorption and the water andnitrogen are exhausted.12
5. Selective Catalytic Reduction (SCR)
An SCR control system is a method for converting NO), generated from the combustionturbine to nitrogen (N2) and water by reaction with ammonia (NH3) in the presence of a
catalyst. NH3 is vaporized and injected in the flue gas upstream of the catalyst, which, whenpassing over the catalyst, results in the following dominant chemical reactions.
4N0 + 4NH3 + 02 —> 4N2 + 6H202NO2 + 4NH3 + 02 3N2 + 6H20
NH3 is added in slight excess in order to minimize the NO, emissions. The excess NH3 thatremains unreacted is emitted from the stack and is referred to as "ammonia slip." In this
application, NH3 slip is expected to be 5 2 ppm at 15% 02 while firing either natural gas or
ULS D/B20.
Step 2
Under this step, EPA reviews all of the technologies identified in step 1 and eliminates anytechnology the Agency determines is technologically infeasible for this project.
1. Catalytic Co mbustio n/XONON
EPA conducted a search to determine if this technology can be used for this project. Theonly literature the Agency was able to find in its search is the application of this technology
on a 1.4 MW gas turbine. The literature further states multiple combustors would be
S CONO,, has since been renamed Eivfxby its manufacturer. We use the more widely known name for consistency
with earlier documents.12 Excerpt fro m the California Env iron mental Technology Certification Program
15

needed for larger turbines such as a 6.5 MW unit. The Agency did not find any evidencethis technology is technically feasible for this project and we concur with the Applicant'sfindings which eliminated this technology in step 2. EPA is eliminating this technologyfrom further analysis.
2. SCONOX
In its November 24, 2008 letter, PVEC states SCONOX is not technically feasible for thisproject since the technology has not been demonstrated for a turbine source as large as thisproject. On December 20, 1999, the Regional Administrator for EPA Region I sent a letterto the Connecticut DEP Commissioner stating SCONOX is technically feasible for largecombined-cycle turbine projects and therefore is subject to a full BACT evaluation.Although PVEC's position regarding the technical feasibility of SCONOX has not changed,PVEC submitted additional information regarding this technology in its July 12, 2011 letterto EPA. For purposes of Step 2 of this BACT analysis, EPA views SCONOx as technicallyfeasible at this project.
3. Use of DLN when burning ULSD
In its July 12, 2011 letter, PVEC submitted information indicating that the DLN technologycannot be used for liquid fuels due to flame instability. EPA concurs with this statementand has eliminated using DLN when burning ULSD from further analysis. (However, DLNremains an option when burning natural gas.)
4. Use of water/steam injection when burning natural gas
The purpose of water/steam injection and DLN is the lowering of the combustiontemperature to minimize formation of NO„. The combination of using both DLN andwater/steam injection is not feasible since the technologies use different mechanisms forreducing the combustion temperature, thereby reducing NO, emissions. EPA concurs withPVEC that the use of water/steam injection in combination of DLN when burning naturalgas is technically infeasible and has eliminated using water injection when burning naturalgas from further analysis..
Sten 3
Under this step, technologies, both individual and combination, are listed in order of the mosteffective to least effective.
1. SCR, in combination with DLN when burning natural gas and water injection when burningULSD, is effective in reducing NO, emission to 2 ppm at 15% 02.
2. SCONOX
There appears to be only one BACT analysis that determined that SCONOX was BACT fora large combined cycle turbine. However, the accompanying permit for the facility, Elk
16

Hills Power in California, allowed the use of SCR or SCONOx to meet a permit limit of 2.5ppm, and the actual technology that was installed in that case was SCR.
A much smaller unit (43 MWh) at Redding Power Plant in California, was permitted with a2.0 ppm demonstration limit using SCONOx. In a letter dated June 23, 2005 from theShasta County Air Quality Management District (Shasta County AQMD) to the ReddingElectric Utility, however, it was determined that the unit could not meet the demonstrationlimit and, as a result, the limit was revised to 2.5 ppm. Based on these two examples, itappears SCONOX has been demonstrated to achieve only 2.5 ppm and we are thereforeevaluating it at this limit.
Step 4
EPA must consider the economic, environmental, and energy impacts between the technologies.
1. Energy Impact — The parasitic load (i.e., energy wasted operating the control technologyitself) between SCONOX and SCR is virtually the same and therefore has no impact on theBACT selection. DLN and water injection were not analyzed since these technologieswould be used in conjunction with either control technology.
2. Environmental Impact - SCONOX has an environmental benefit when compared to SCRbecause ammonia is not used in the process. In the SCR, ammonia reacts with NO„ tocreate nitrogen. However, as with most chemical reactions, there could be byproducts,including ammonia sulfate and ammonia, due to injecting slightly more ammonia than isrequired for the chemical reaction. In the July 12, 2011 letter, PVEC estimated ammoniumsulfates and ammonium nitrates will contribute to 57 % ofthe PM2.5 emissions when firingnatural gas and 15 % of the PM2.5 emissions when firing ULSD with an SCR. SCONOXavoids this problem. Therefore, EPA determines SCONOX has a smaller environmentalimpact than SCR.
Even with SCR, however, the creation of ammonia sulfate can be limited through the use oflow sulfur containing fuels. Excess ammonia is limited through the use of automaticprocess controllers which inject the rate of ammonia based on the amount ofNOx in theexhaust. PVEC will minimize the sulfur content in the fuels by using only natural gas andULSD. As explained further in the BACT discussion regarding PMio/PM2.5 emissions,ULSD contains the lowest amount of sulfur in commercially available fuel oils. EPA hasconcluded PVEC has minimized the environmental impact from using SCR by using fuelswith low sulfur content and the use of controllers to minimize ammonia emissions.
3. Economic Impact — In this section, EPA takes into account cost differences betweentechnologies. A technology can be eliminated in this section if EPA determines the cost,usually based on a dollar per ton ofpollutant removed, is determined to be outside thenormal cost for controls meeting BACT.
In the July 12, 2011 letter, PVEC stated the installation of SCONOX is at least five timeshigher than SCR. For a similar size project in Florida, it was determined the incremental
17

cost of SCONOX was 21 million dollars. Operational costs are also significantly higherbecause SCONOX uses a catalyst made from platinum versus a base metal catalyst in theSCR system. These statements were supported by the only vendor of the SCONOXtechnology, EmeraChem. Since SCONOX has not beenproven to remove additional NO,versus SCR, the additional cost for installation and operation of SCONOX results in aninfinite incremental cost since the denominator in such a calculation is zero.
Step 5
At this step EPA determines which controls or methods identified through the first 4 stepsconstitute BACT for this project. Further, EPA develops the appropriate permit terms andconditions to ensure BACT is meet during all operational times.
EPA has determined SCR with the use of dry low NO, burners when firing natural gas and the useof SCR with water injection when firing ULSD meet BACT for minimizing NO, emissions for thisproject. The costs for applying SCONOX to reduce the environmental impact of the SCR system iswell outside the range of contro Is determined to be cost-effective in previous BACTdeterminations. Furthermore, the adverse environmental impact of SCR (from excess ammoniabyproduct emissions) will be minimized by use of low sulfur fuels and automatic processcontrollers. With the use of SCR and thermal reducing NO formation technology, EPA isproposing setting the NO, BACT emission limit at the stack at 2.0 ppm @ 15% 02 when firingnatural gas and 5.0 ppm @ 15% 02 when firing ULSD/B20 (except during startup and shutdownoperations which are addressed later in this document).
CO
CO emissions are formed due to incomplete combustion ofthe fuel. These emissions aretypically higher during transient and low load operating conditions. Control technologies used tominimize CO emissions include state-of-the-art combustion technology, add-on oxidationcatalyst systems, and establishing minimum load restrictions.
Step 1
1. SCONOX: In addition to removing NO,, this control also removes CO by converting itinto CO2 through the oxidation process.
2. Optimize combustor design and configuration to minimize the creation of CO.
3. Oxidation catalyst: Located in the HRSG, PVEC proposes to install a catalyst which isexpected to remove greater than 90% of the CO in the exhaust stream.
18

Step 2
All technologies identified in step 1 were deemed technically feasible for this project.
Step 3
The effectiveness in removing CO emissions is the same for SCONOX and the COcatalyst. Optimizing combustor design and configuration will apply regardless of whichadd-on pollution control technology is determined as BACT.
Step 4
1. Environmental Impact — For this facility, there is no difference in collateral adverseimpact on the environment between a CO catalyst and SCONOX technology.
2. Energy Impact - The parasitic load between SCONOX and the CO catalyst is virtuallythe same and therefore has no impact on the BACT selection.
3. Economic Impact— PVEC estimated the cost of SCONOx for removing CO emissionswas $60,000/ton on average and is considered well outside the range of contro lsdetermined to be cost-effective in previous BACT determinations.
Step 5
EPA has determined the use of a CO catalyst and optimizing the unit's design and operations,meets BACT for minimizing CO for this project. With these emission controls, EPA is proposingsetting the CO BACT emission limit at the stack at 2.0 ppm @ 15% 02 when firing natural gasand 6.0 ppm @ 15% 02 when firing ULSD/B20 (except during startup and shutdown operationswhich are addressed later in this document).
P 0/P M2.5
PM10 and PM2.5 from fuel combustion is primarily the result of non-combustible constituents(ash) in the fuel and sulfates. For combustion turbines, all PM is typically less than 10 micronsin diameter (PM10). The emissions of fine particulate matter (PM25) from the turbine have beenconservatively assumed to be equal to the emissions of PM10.
This discussion forgoes specifically identifying each individual step of the BACT process sinceadd-on controls to minimize PM10/PM2.5 emissions are not available. Add-on Control devicesfor controlling PM10/PM2.5 emissions from stationary sources, such as fabric filters, wetscrubbers, or electrostatic precipitators, create back pressure which adversely affects theturbine's operations.
Particulate emission control is achieved at the source by efficiently burning low ash and low sulfurfuel. PVEC proposed using natural gas and being allowed to burn ULSD/B20 for up to 1440 hours attheir discretion. The use of these fuels would be combined with state-of-the-art combustion
19

technology and operating controls, to provide the most stringent degree ofparticulate emissionscontrol available for combustion turbines. As previously discussed in the section ULSD versus natural
gas, EPA has determined to limit PVEC 's ability to burn ULSD to a specific list of conditions and tonever use ULSD for more than 1.440 hours in any 365 consecutive day period.
The use of natural gas as the primary fuel, limited use ofULSD/B20 as the back-up fuel forperiods when natural gas in unavailable or too expensive, and proper combustion are the
proposed controls for PK() and PM2,5 BACT. With these emission controls, EPA is proposingsetting the PYlio and PM2.5 BACT emission limit at 0.0040 lb/MMBtu heat input firing natural gas
and 0.014 lb/MMBtu while firing ULSD/B20. To further control emissions, EPA is limiting theamount of ULSD combustion as discussed above. All of these PK° and PM2.5 emission limitsare based on the applicable stack test since the proposed permit is not requiring a continuous
emission monitor for measuring PM10 and PM2,5 emissions. PMio and PM2.5 emissions are fairlyconsistent when operating a combined cycle turbine. Operators of turbines are very conscious
about particulate emissions since these emissions cause damage to the turbine blades.
Sulfuric Acid Mist
Sulfuric acid mist is formed from oxidation of sulfur in fuel. The only means for controlling sulfuric
acid mist emissions from PVEC is to limit the sulfur content ofthe fuel. Because this is the onlymethod to minimize sulfuric acid mist, EPA is not specifically identifying each step of the BACT
analysis.
Natural gas as the primary fuel, with its natural low sulfur content, is the cleanest, naturally occurring
fossil fuel. To minimize sulfuric acid mist emissions during fuel oil combustion, EPA is proposingto require PVEC to use ULSD/B20 with a sulfur content of 15 ppm by weight or less. These fuelshave the lowest sulfur content commercially available for fuel oil. As stated earlier, EPA is also
proposing to limit the amount of ULSD PVEC can burn. The use of these fuels result in anemission limit of 0.0018 lb/MMBtu when burning ULSD and 0.0019 lbs/MMBtu when burning
natural gas.
Greenhouse Gases
Greenhouse gases for PSD permitting is the aggregate of six pollutants: carbon dioxide,methane, nitrous oxide, hydrofluorocarbons, perfluorocarbons, and sulfur hexafluoride. Sinceeach pollutant has a different effect on global warming, PSD applicability is based on a carbondioxide equivalent (CO2e), determined by multiplying each pollutant by its global warmingpotential. Like other combustion sources, the main constituent of greenhouse gases for acombined cycle turbine is carbon dioxide. For this combined cycle turbine, carbon dioxideconstitutes 98.5% of greenhouse gases on a CO2e basis. Nitrous oxide and methane make up theother 1.5 % of greenhouse gases from the combined cycle turbine on a CO2e basis.
20

Step 1
1. Carbon capture and storage: This technology is available for large fossil-fuel fired powerplants 13 and has been identified in Step 1 as an add-on control for reducing greenhousegas emissions.
2. Energy efficiency: PVEC has proposed the use of a combined cycle gas turbine, which ismore energy efficient than a simple cycle turbine. PVEC's letter dated March 9, 2011identified combined cycle turbines from three of the major vendors. In its July 12, 2011letter, PVEC clarified the turbines identified in the March letter are the most energyefficient models commercially available for a 430 MW size facility at this time fromthese vendors. For combustion units, efficiency can be measured by the heat rate, whichfor an electric generating unit can be expressed as Btu of the fuel combusted divided bykWh of electricity produced (Btu/kWh). The lower the overall numbers the less heatneeded to produce a unit of electricity. PVEC identified the following models:
a. GE model no. MS7001FB, lower heat rate14 of 5,950 Btu/kWh.b. GE model no. MS7001FA, lower heat rate of 6,090 Btu/kWh.c. Siemens model no. SCC6-5000F, lower heat rate of 5,990 Btu/kWh.d. Proposed project using a Mitsubishi model no. 501G and water cooling, lower
heat rate of5,948 Btu/kWh.e. EPA identified Mitsubishi model no. MH1501J. This turbine is expected to have a
heat rate lower than the 501G model.
Since age and ambient conditions will affect efficiency, the heat rate numbers presentedabove are used to compare the efficiency between turbine models and do not translatedirectly into permit limitations.
Step 2
1. Carbon capture and storage: In its letters dated March 9, 2011 and July 12, 2011, PVECstates this control option is not technically feasible due to a number of factors includingthe lack of a nearby storage facility for captured CO2. According to the US Departmentof Energy, the nearest storage site to PVEC's plant is in New York15. The terrain betweenPVEC and a potential storage site is also problematic due to a pipeline having to traversethe Berkshire Mountains, and probably the Hudson River. The offsite logistical barriersof constructing such a pipeline (e.g., land acquisition, permitting, liability, etc.)enormously complicates the technology ofCCS and may arguably eliminate thetechnology because it is technically infeasible for this project. Putting aside the technicalinfeasibility issue, EPA and PVEC continued to include CCS in the GHG BACT analysis.
13 "PSD and Title V Permitting Guidance for Greenhouse Gases", March 2011, available athttp://www.epa.govinsr/ahadocs/ah taermittinuguidance.pdf, page 32.14 Lower heat rate is determined by subtracting the heat of vaporization of the water from the higher heating value.15 Although the map of the Saline formation contained in the docket does not identify specific formations, the stateborder is approximately 40 miles away.
21

2. Energy efficiency: PVEC did not identify any technical feasibility issues between thedifferent turbine models since all identified models are currently available for purchasewithin the United States. In response to EPA's queries regarding another turbine modelfrom Mitsubishi, MHI501 J, PVEC determined that this model is under development and
currently unavailable in this country, and therefore is not technically feasible. EPA agreeswith PVEC's statement regarding Mitsubishi M111501 J availability and has eliminatedthis turbine from further analysis.
Step 3
1. Capture and storage of CO2 emissions is the most effective technology for reducinggreenhouse gas emissions for this project.
2. Regarding energy efficiency, PVEC is requesting a permit for the turbine with the lowestheat rate (the Mitsubishi 501G), and therefore most energy efficient, amongcommercially available turbines in its class. The GE MS7001FB turbine's heat rate isonly slightly less than the Mitsubishi 501G's and can be ranked equivalently for controleffectiveness. The GE MS7001FA and Siemens SCC6-5000F turbine models are notablyless energy efficient.
Step 4
1. Energy and environmental impact - The capture, control, and storage of CO2 emissionswould increase the environmental impact for this project due to the control equipment. Inorder to capture CO2 emissions from a combustion source, a facility in West Virginiaused a chilled ammonium carbonate system to absorb CO2 and create ammoniumbicarbonate. The resulting ammonium bicarbonate is then converted back to ammoniumcarbonate in a regenerator and is reused to repeat the process. The flue gas, cleaned ofCO2, flows back to the stack and the captured CO2 is sent for storage in an undergroundreservoir.
The energy requirement to operate such a system—often referred to as "parasitic load" —is very large. In a June 2010 report, the General Accounting Office estimated theparasitic load to capture and store CO2 emissions is between 21-32%. Electricalgenerating plants similar to PVEC in New England operate on an intermittent basis andusually are not base-loaded. Under the current power structure in New England, it islikely that the electricity used by the CCS system would need to be created by other fossilfuel fired electric generating plants, many of which are less energy efficient (and mayemit higher amounts of conventional pollutants and GHGIMWh) than PVEC's proposedproject.
The installation ofa new pipeline from PVEC to the nearest CO2 storage site would alsohave an environmental impact as the pipeline installation tries to avoid ecologicallysensitive areas. Neither EPA nor PVEC quantified the additional environmental impactfrom the increase of electric generating facilities to power the parasitic load or from theconstruction and operation ofa new pipeline to transfer CO2 emissions to a storage site.
22

2. Economic impact - PVEC estimated the cost to construct a pipeline to carry the capturedCO2 emissions to a storage site at one to three million dollars per mile. PVEC did notestimate any potential economic penalty due to projects delays caused while PVECobtains the rights and land to build a CO2 pipeline. As stated in step 2, the nearest storagesite to PVEC's plant is somewhere in New York which is approximately 40 miles away.Due to the terrain between PVEC's facility and New York State, the cost of the pipelinewould probably be on the higher end of the estimate At $3 million/mile, the cost just toconstruct a pipeline would be at least $120 million dollars, and probably much higherbecause it is very unlikely a storage site is right at the state border. Because PVECcontends that the cost of just the pipeline exceeds what is a reasonable cost for BACT,PVEC did not estimate the cost for the carbon capture system.
In a fact sheet, updated in February 2011, the Department of Energy estimated the cost ofcapturing CO2 at $150/ton of carbon. In another study by the National EnergyTechnology Laboratory, the cost to capture CO2 and compress it is $240 million dollarsfor a combined cycle turbine with a gross electrical output of 564 MWh. Based on thislater study, it is reasonable to assume the capital cost of installing a system for capturingand compressing CO2 emissions is $183 million
Due to the energy, environmental and economic impacts of installing and operating CCS forPVEC's proposed project, EPA has eliminated this technology as greenhouse gas BACT for thisproject.
Step 5
EPA has determined the installation and operation ofPVEC's proposed combined cycle turbineproject as meeting BACT for greenhouse gases.
With determining BACT as an energy efficient model for the combined cycle turbine, permitconditions must be developed to ensure PVEC installs an energy efficient turbine and willcontinue to operate the turbine in an energy efficient manner. To ensure these two goals are met,EPA is proposing two emission limits for greenhouse gases, along with appropriate monitoringrecordkeeping, and reporting.
First, to determine an efficient combined cycle turbine is installed, EPA has developed anemission limit in Ibs of GHG/MWh going to the electrical grid that must be met during the initialstack test. Since weather conditions, which affect efficiency during a stack test, cannot bepredicted at this time, the emission limit is being set using International Organization forStandardization (ISO) conditions. ISO 3977-2 sets the standard conditions at 59 °F, 14.7 psia,and 60 % humidity. The weather conditions during the stack test will be corrected to these ISOvalues.
23
Based on the design low heat release rate of 5,948 Btu/kWhgr,d, a CO2 emission factor of 116Ib/MMBtu, and the fact that 98.5 % of all GHG emissions on a CO2e basis are CO2,16 EPAcalculated an emission rate of 776 lbs CO2e/M-Whgrid. To determine the emission limit whichmust be demonstrated during PVEC's initial stack test, accuracy in measuring CO2 and thecorrection curves used to convert stack tests results to ISO conditions must be taken into account.Based on these factors, which are outside of PVEC's control, EPA has calculated an emissionlimit of 825 lbs CO2e/MWhgrid. Since a turbine's efficiency will degrade with time and fluctuatedue to ambient conditions, the emission limit of 825 lbs CO2eN1Whgrid will only apply duringthe initial stack test.
The greenhouse gas emission limit established for installation cannot feasibly be used forcontinuous operations due to a number of factors such as partial load, startups, shutdowns, andweather conditions which all affect the turbine's efficiency. To ensure PVEC operates its facilityto minimize greenhouse gases, EPA is proposing to establish an ongoing CO2e emissionlimit/MWh to the electric grid. Due to the factors previously listed affecting efficiency, theemission limit shall be determined by averaging the emissions for each day and averaging theday's emissions with the previous 364 days of emissions. These factors, along with systemdegradation, will also cause fluctuations with the combined cycle turbine efficiency.
EPA expects a decrease in efficiency of 2.5% over time even for a well-operated turbine." In itsMarch 9, 2011 application supplement, PVEC claimed a performance margin of 6%. EPAunderstands the performance margin addresses factors affecting the efficiency which cannot becontrolled by PVEC such as ambient temperature. The actual effect of temperature on acombined cycle turbine will vary depending on the turbine's design. The variation can be asmuch as 10%.18 Based on the information PVEC provided and on EPA's own research regardingunavoidable decreases inefficiency and variability ofperformance under a reasonable range ofconditions, EPA has determined that BACT is met by an emissions limit that is 8.5 % higher thanthe corrected value which must be met during the initial test. EPA is proposing an ongoingemission limit of 895 lbs CO2e/MWhgrid averaged over each 365 consecutive day period.
Turbine's startup and shutdown operations
During startup and shutdown operations,19 gas turbines experience operational fluctuationsresulting in increases ofNO„ and CO emissions. In addition, minimum operating temperaturefor the SCR catalyst must be obtained before anunonia can be injected to control NO„ emissions.
16 EPA used emission factors for N20 and CH4 supplied by PVEC instead of AP-42 because the vendor specificemission factors are usually better for estimating emissions. Note, emission factors for these pollutants provided byPVEC are higher than the presumptive emission factors in 40 CFR part 98, subpart C.
17 "Co mb ined -cy cle gas & steam turbine power plants" by Rolf Kehlhofer, Bert Rukcs, Frank Hannemann, i^ranzStirnimann, page 242.
18 "Thermodynamic performance analysis of gas-turbine power-plant" by M. M. Rahman, Thamir K. Ibrahim, and
Ahmed N. Abdalla available at http://www.acad e mic journ als .org/LIP S/PD F/p di201 1/ 1 8.1u I/Rah man %2Oct%20al.pdf19 Unit startup commences when fuel is first ignited and shall not exceed 2.0 hours for a warm start and 5.0 hours fora cold start. Cold startups are defined as occurring after a period of greater than 24 hours of turbine shutdown, andwarm startups are defined as occurring 24 hours or less since turbine shutdown. Shutdown is defined as the time
24
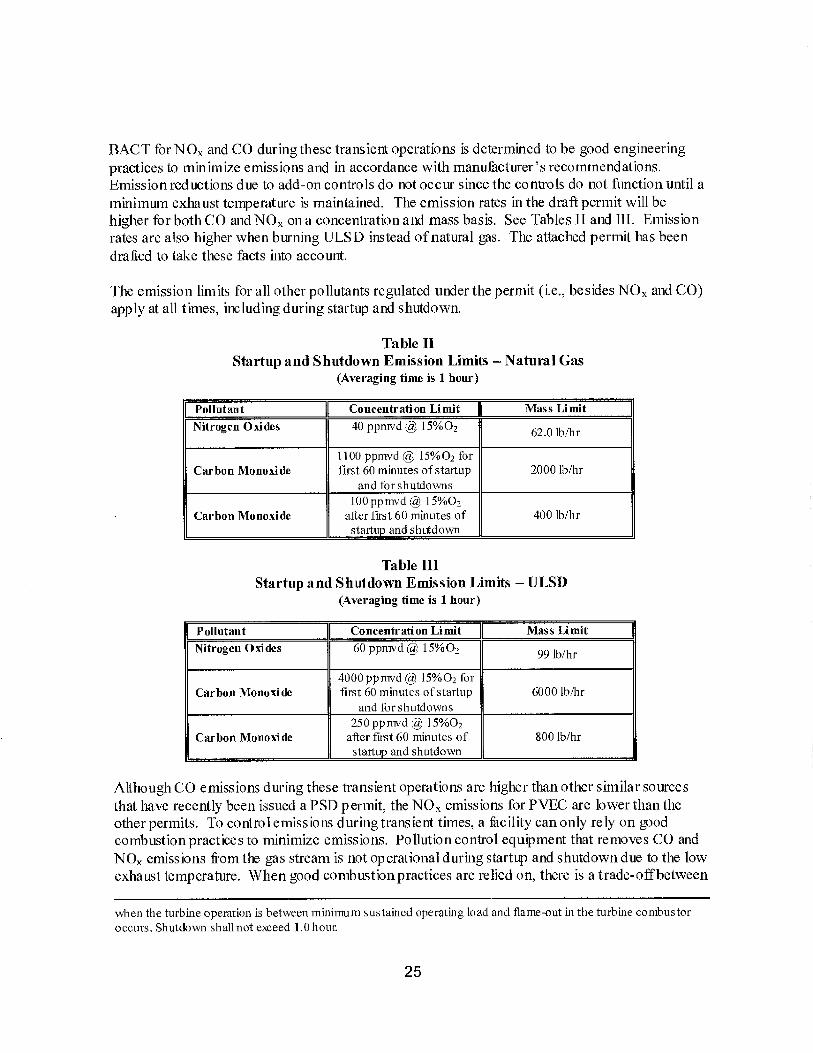
BACT for NOx and CO during these transient operations is determined to be good engineering
practices to minimize emissions and in accordance with manufacturer's recommendations.Emission reductions due to add-on controls do not occur since the controls do not function until aminimum exhaust temperature is maintained. The emission rates in the draft permit will behigher for both CO and NOx on a concentration and mass basis. See Tables 1I and 11I. Emissionrates are also higher when burning ULSD instead of natural gas. The attached permit has been
drafted to take these facts into account.
The emission limits for all other pollutants regulated under the permit (i.e., besides NOx and CO)apply at all times, including during startup and shutdown.
Table IIStartup and Shutdown Emission Limits — Natural Gas
(Averaging time is 1 hour)
Pollutant Concentration Limit Mass Limit
Nitrogen Oxides 40 ppmvd @ 15%0262.0 lb/hr
Carbon Monoxide1100 ppmvd g 15%02 forfirst 60 minutes of startup
and for shutdowns2000 lb/hr
Carbon Monoxide100 ppmvd @ 15%02
after first 60 minutes ofstartup and shutdown
400 lb/hr
Table IIIStartup and Shutdown Emission Limits — ULSD
(Averaging time is 1 hour)
Pollutant Concentration Limit Mass Limit
Nitrogen Oxides 60 ppmvd g 15%0299 lb/hr
Carbon Monoxide4000 ppmvd @ 15%02 forfirst 60 minutes of startup
and for shutdowns6000 lb/hr
Carbon Monoxide250 ppmvd rie. 15%02after first 60 minutes ofstartup and shutdown
800 lb/hr
Although CO emissions during these transient operations are higher than other similar sources
that have recently been issued a PSD permit, the NOx emissions for PVEC are lower than theother permits. To control emissions during transient times, a facility can only rely on goodcombustion practices to minimize emissions. Pollution control equipment that removes CO and
NO, emissions from the gas stream is not operational during startup and shutdown due to the lowexhaust temperature. When good combustion practices are relied on, there is a trade-offbetween
when the turbine operation is between minimum sustained operating load and flame-out in the turbine combustor
occurs. Shutdown shall not exceed 1.0 hour.
25
CO and NO„ emissions. A decrease in one pollutant is usually offset by an increase in the otherpollutant. As noted earlier, PVEC' s proposed location is in a nonattainment area for ozone andattainment for CO. Since NO, contributes to ozone formation, it is more important to controlNO„ emissions than CO emissions.
In an e-mail to EPA dated February 8, 2010, PVEC's consultant proposed CO and NO„ emissionlimits for startup and shutdown. The emission limits proposed by PVEC for CO are higher than
what EPA has proposed in the PSD permit. PVEC proposed CO emission rates when firingnatural gas of3,700 ppmvd at 15% 02 and 7410 lbs/hr. When firing ULSD, PVEC proposed COemission limits of 10,000 ppmvd at 15% 02 and 13,341 Ibs/hr. PVEC did not supply supportinginformation for the proposed emission limits other than stating the limits are based on data fromthe rnanufacturer.2° EPA reviewed the RBLC clearinghouse and a database on combined cycle
turbines maintained by Region IV and found scant information regarding short term emissionlimits during startup and shutdown.
EPA has based its determination for the proposed CO emission limits on two applications formodifications to existing PSD permits. The applications were submitted to EPA on March 31,2009 by Boston Generating, LLC. EPA determined it is appropriate to use the information fromthese applications because the turbines operated by Boston Generating, LLC are similar to themodel proposed for the PVEC facility (different versions of Mitsubishi Heavy Industries Model5016).21 EPA was informed by Boston Generating, LLC, that the proposed emission limits forMystic and Fore River Stations are based on actual operations of its six turbines from 2007 and
2008. EPA has determined that given the information on the record, the emission limits inTables II and III meet BACT during startup and shut down operations.
Cooling Water Tower
Out of the five pollutants regulated by this proposed PSD permit, only PM10/PM2 5 are emittedfrom the cooling water tower. A cooling water tower emits PK° and PM2 5 due to the particleentrainment within escaped water droplets. Therefore, to control PK° and PM2_5 emissions,PVEC will install high efficiency drift eliminators that limit the amount of escaped waterdroplets to 0.0005 % of the total recirculating water. These eliminators will limit the PM10 and
20 Regarding vendor guarantees, In re Masonite Cotp., 5 E.A.D. 551, 562 n.12 (1994), the Environmental AppealsBoard, citing the 1990 Draft= NSR Workshop Manual, has explained:
On the subject of vendor guarantees, EPA's New Source Review Workshop Manual at B-20 states:Vendor guarantees may provide an indication of co mtnercialavailability and the technicalfeasibility of a control technique and could contribute to a determination of technical feasibility or
technical infeasibility, depending on circumstances. However, EPA does not consider a vendorguarantee alone to be sufficient justification that a control option will work. Conversely, lack of avendor guarantee by itself does not present sufficient justification that a control option or
emissions limit is technically infeasible. Generally, decisions about technical feasibility will bebased on chemical and engineering analyses (as discussed above) in conjunction with informationabout vendor guarantees.
21 In an e-mail dated October 27, 2010 from ESS to Donald Dahl, ESS stated the proposed turbine for the Facilityhas been modified by Mitsubishi. F,SS stated that the new model is more efficient and lowers NO, and PMemissions. However, no evidence was provided about the effects these modifications would have on startup and
shutdown emissions for CO compared to the turbines installed by Boston Generating LLC.
26

PM2 5 emissions to 0.01 lbs/hr. This emission rate is consistent with other recent BACTdeterminations. 22
Auxiliary B oile r
As part of this project, PVEC is installing a 21 MIV1Btu boiler, known as the auxiliary boiler.Since this is also a combustion unit, this unit will emit all of the 5 pollutants regulated by thispermit. To minimize emissions, PVEC proposed limiting the boiler's operation to 1100operating hours in any 12 month period and only combust natural gas. Add-on controls forreducing NO,,, H2SO4, PM10/PM2 5, and CO for such an emission unit are not economical sincethe boiler is limited to 0.8 tons per year of all of these CAA pollutants based on the limit onoperations. Given these facts, EPA has not listed out the five step BACT analysis for thesepollutants. EPA is proposing the following emission limits for the auxiliary boiler:
Table IVEmission Limits — Natural Gas
Pollutant Concentration LimitNitrogen Oxide 0.029 lbsN1MBtuSulfuric Acid Mist 0.0005 lb/MMBtu
PM 1 o/PM2.5
0.0048 lb/MMBtufilterable +
conde ns ab les
Carbon Monoxide0.037 lbs/MMBtu
To ensure compliance with the modeling assurnptio DS that PVEC used as part of itsdemonstration that the NAAQS will be attained, EPA is also proposing to limit the heatinput to the auxiliary boiler to 21 MMBtu/hr.
Finally, with respect to GHGs, PVEC researched the feasibility of adding energyefficiency measures to the auxiliary boiler such as an air pi-cheater. As discussed above,CCS is not cost-effective for this facility. Since the auxiliary boiler is only used duringstartups until the HRSG can produce steam, the exhaust gas temperature would not besignificant enough to adequately transfer lost heat to the combustion air system. Airpreheaters are mainly installed on boilers that are intended to be used in a steady-statemode. The auxiliary boiler for this project is not designed nor intended to be operated ina steady state mode. EPA concurs with PVEC and has determined efficient combustioncontrols installed on the auxiliary boiler meets BACT for greenhouse gases.Consequently, EPA is proposing that BACT for GHGs from the auxiliary boiler be theheat and hours-of-operation limits identified above, and an annual boiler tune-up.
22 See PSD permit for the construction ofnew Cooling Towers at Dominion Energy, Brayton Point Facility, April 2,2009. URL: http://www.epa.goviregion 1 /communit ies/pdf/braytonpo int/Coo LingTowerPermit .p d f
27

Emergency Generator and Fire Pump
PVEC has applied to install a 2,174 KWh diesel generator to be used in case of a power outage atthe plant and a 270 hp fire pump.
Unlike other combustion equipment (e.g., C Ts and boilers), new engines are required to becertified in compliance with NSPS requirements, including emission limits, upon purchase.Different types of engines have different emission requirements based on the type of enginebeing purchased (emergency engine, emergency fire pump engine, or non-emergency engine).Engine manufacturers may need to employ some of the control technologies identified above inorder to comply with the NSPS emission limits, depending on the type of engine and theapplicable limits. The applicant is proposing to construct an emergency engine and anemergency fire pump engine. As a result, to comply withNSPS the applicant must purchaseengines that meet the emission requirements for emergency engines and emergency fire pumpengines.
PVEC proposed the requirements of 40 CFR part 60, subpart IIII, the NSPS standard for internalcombustion engines, as BACT. Forty CFR 60.4202(a)(2) requires emergency engines to meetthe model year 2007's emission requirements in 40 CFR 89.112 and 40 CFR 89.113. Table I of40 CFR 89.112 requires the engines to meet Tier 2 requirements which are:
a. 6.4 g/KWhour of NO, and Non-methane Hydrocarbon (NMHC) combined
b. 0.20 g/KWhour of PM10/PM2.5
c. 3.6 g/KWhour of CO
However, EPA has identified the use of a Tier 4 generator set (also known as an engine) as beingcommercially available in 2011. As such the BACT analysis must include a comparisonbetween a TIER 2 and a TIER 4 engine for PVEC intended use.
Emissions are significantly reduced when using a Tier 4 engine versus a Tier 2 engine. Thereduction is almost 90% for NO, and 50 % for fine particulates. To achieve these emissionlimits, a TIER 4 engine must add post combustion controls, such as urea injection. In order forthe post controls to be fully functional, a minimum temperature must be maintained (usuallyaround 650 °F). PVEC is installing its engine for emergency purposes only so it can safely bringthe facility off line in case the plant loses electricity. On most occasions, the emergencygenerator will only be operated for a short period oftime for maintenance checks and readinesstesting. These short operating periods are not conducive to achieving optimum operation of aurea injected control system since the minimum temperature is not achieved.
It is plausible that if the plant loses electricity, the emergency engine is operated for a periodlong enough to reach minimum temperature for the urea injection system to work. Even in thiscase, the urea system will only operate for a short period of time because the purpose of thegenerator is to safely shutdown the plant, which usually takes several hours, not days. Based oninformation from Caterpillar, the cost difference between a Tier 2 engine and a Tier 4 engine isbetween $350,000-400,000. Amortizing the cost over 20 years, assuming an 8 % interest rate,
28

results in an annual cost of $40,000. Although emissions are significantly reduced on apercentage basis when using a Tier 4 engine, the amount o fNO„ and PM 0/25 reduced willprobably be less than one ton per year given the purpose of the emergency generator. Evenwithout estimating the additional operating costs of a Tier 4 engine, costs ofusing a Tier 4 engineto reduce NO, and PIVII 0/25 is well outside the range of controls determined to be cost-effective inprevious BACT determinations. EPA is determining that BACT for the emergency generator isto meet EPA's Tier 2 emission standards for CO, NMHC NO,, and PIVIi 0/25, listed above.
The Fire Purnp will be required to meet the emission limits in Table IV of 40 CFR part 60,subpart IIII.
a. 4.0 g/KWhour of NO„ and NMHC combined
b. 0.20 g/KWhour of PMio/PM25
Although NMHC (non methane hydrocarbon) is not a pollutant required to be reviewed forBACT, the Part 60 standard for emergency generators combines NO„ with NMHC into oneemission limit. A BACT emission limit must be at least as stringent as a 40 CFR parts 60 or 61standard. See the definition of Best Available Control Technology at 40 CFR 52.21(b)(12). Itshould be noted Table 1V does not specify a specific emission limit for CO for fire pump enginesof model year 2009 or later with a horsepower between 175 and 300. EPA has determinedBACT for minimizing CO emissions from the fire pump is implementing the manufacturer'soperating specifications.
A review of EPA's BAC T/LAER Clearinghouse determined that recently permitted emergencygenerators were required to meet emission rates similar to the emission standards found at 40CFR part 60. Since the permitted emission limits are the same as the requirements in 40 CFRparts 60 and part 63, and these emission limits are similar to other BACT determinations, EPAhas concluded the proposed emission limits meet BAC T requirements. Furthermore, operationof the emergency generator is limited to 300 hours in any 12-consecutive month period.
Since only new engines can meet these emissions limits, and these new engines are moreefficient than older models, BACT for GI-1G emissions is met.
Finally, after considering the environmental impact, EPA is proposing operational limits on theemergency generator and fire pump engine:
• Prohibiting operating the emergency generator or fire pump during startup or shutdown. 23
• Prohibiting scheduled testing of the emergency generator or fire pump outside ofthehours of 12:00pm-3:00pm.
23 See page 36, footnote 32.
29

• Prohibiting scheduled testing of the emergency generator or fire pump during days whenthe most recent (before scheduled testing) hourly value for NO2 at the nearest ambientNO2 air quality monitor in Hampden County operated by the MassDEP exceeds 54 ppb.24
VII. Monitoring and Testing
PVEC will install, calibrate, and operate a dedicated continuous emission monitoring system formeasuring CO, CO2 and NO„ emissions from the combined cycle turbine. The system willconsist of a probe, analyzer, and data acquisition system. The NO„ monitoring system shall meetthe specifications and quality assurance procedures o f 40 CFR Part 75. The CO and CO2monitoring systems will meet the specifications and quality assurance procedures of 40 CFR Part60 Appendix B, Performance Specifications 4 and 4A (for CO) and Performance Specification 3for CO2. Emission data for CO and NO), will be measured by the analyzer in ppmvd (parts permillion on a volume and dry basis). This ppmvd data can be directly compared to the permitemission limits to determine compliance.
To obtain NO„, CO2 and CO mass emissions on an hourly basis, PVEC will use EPA methodscontained in 40 CFR part 75 for NO), and 40 CFR part 60, appendix A, method 19 for CO.PVEC will need to measure heat input on an hourly basis and moisture content to convert themeasured ppmvd data to lbs/hr.
For determining CO2 mass emissions, PVEC shall use the following equation:
E = CO2 in lb/hrK = 1.14 x 10⁻³ lb/scf/%CO2%CO2 is the average percent CO2 in the gas stream for the hour, dry basisF8710 is the F-factor for natural gas, dscf/MN/IBtuGCV is the gross calorific value, Btu/dscf
is the natural gas fuel flow rate, dscFhr
PVEC is also required to monitor or keep records ofthe amount of sulfur in the fuel that is usedin the combined cycle turbine.
PVEC is also required to conduct stack tests for PM10 and PM2 5 emissions for both oil andnatural gas within 180 days after initial start-up ofthe combined cycle turbine.
VIII. Endangered Species Act/ESA
Section 7 of the ESA requires that certain federal actions such as federal. PSD permits address theprotection of endangered species in accordance with the ESA. To comply with the ESA, Region1 consulted with the United States Fish and Wildlife Department (FWS)-New England Field
24See Section XI below.
30

Office web site http://www.fws.govinewengland/EndangeredSpec-Consultation.htm to determineif the proposed permit for PVEC posed any risk to endangered species. Our consultation isconsistent with the direction EPA received from the FWS in an e-rnail on another PSD permitEPA drafted. See the file for an e-mail from Anthony Tut. of FWS to Phyllis Nelson of EPAdated November 20, 2007.
The website instructs EPA to review a list of endangered species by county and determine if anendangered species is located in the county for the permitted facility. PVEC is in HampdenCounty. According to the table on the web site, the only listed endangered species (SmallWhorled Pogonia) in Hampden County is located in the Town of Southwick. Therefore, it hasbeen concluded that the proposed permit revisions do not pose a threat to any endangered orproposed endangered species or their habitat in the area subject to FWS jurisdiction, and that nofurther ESA impact analysis is required. The web site directed EPA to print a letter dated January3, 2011 and signed by Thomas R. Chapman, Supervisor, New England field Office of the FWS.The letter states that no further review is warranted. The file contains a copy ofthis letter.
IX. Impact Analysis Based on Modeling
As part of its application, PVEC submitted a modeling analysis that met the requirements of 40CFR part 51, Appendix W.
In determining a project's impact, a source usually conducts a screening model to determine ifthere is a significant ambient impact from the proposed project outside the fence line. For mostNAAQS, EPA has published pollutant levels called significant impact levels (SILs) whereimpacts below the SIL are considered de minimis. The facility's screening modeling (assumingworse case meteorological conditions) from the 2008 application showed all pollutants, exceptCO, were above the SIL at the facility fence line.25 Therefore, PVEC conducted refinedmodeling forNO2, PM to, and PM25. Because CO was below the SIL at the fence line, nofurther modeling was required for CO.
25 PVEC did not submit results from a screening analysis forNO2, instead opting to proceed directly to a refinedmodeling analysis.
31

Table VScreening Model Results
Pollutant Result from screeningmodeling
SIL
NO2 (annual) 32.9 ppb 1 ppbNO2 (1 hour) Not ascertained 4 ppb"CO (1 hour) 461 ng/mi 2000 1.1g/rn3CO (8 hour) 195 µg/m3 500 µg/m'PM10 24 hour 63.5 ng/m3 5.0 µg/m3PM10 annual 16.7 ng/m3 1.0 µg/m3
PM2.5 24 hour 63.5 ng/m3 1.2 µg/m3PM2.5 annual 16.7 pg/m3 0.3 µg/m3
In order to conduct a refined modeling analysis, the applicant is required to input meteorologicaldata relevant to the project area. An applicant can either establish an on-site meteorologicalstation to gather one year's worth of data prior to the application or propose to use five years'worth of meteorological data from a source where the applicant believes data is representative toits proposed site. Proximity and terrain are the two main elements taken into account whenmaking this determination. In its original application in 2008, PVEC used 1991-1995meteorological data from Westover Air Force Base. At the time of the original application thiswas acceptable because in 1996, changes were made to the gathering and coding ofmeteorological data which raised several issues with air dispersion models. Since these changeswere made, EPA has been identifying and solving issues with the new methods for gathering andentering meteorological data. In February 28, 2011, EPA issued a model change bulletin(MCB#4) which addressed the remaining issues. As a result, PVEC has submitted a new airquality impact analysis, using data from years 2006-2010 and from a different site (BarnesAirport in Westfield) which is approximately one mile away from the proposed site.
Terrain is another factor impacting the selection o f representative meteorological data. Based onfigure 2-1 (USGS Locus Map containing elevation information) in the 2008 application, EPA hasdetermined the use of meteorological data from Barnes Airport is acceptable since the terrain issimilar to the proposed project site.
At the time of the original application in 2008, EPA had not developed a SIL for PM2.5 so PVECconducted refined modeling for both the 24-hour and annual PM2.5 standard. The 24-hour andannual SILs EPA promulgated on October 20, 2010 (75 FR 64864) continue the need for PVECto conduct refined modeling. EPA published SILs for both the 24 hour PM2.5 (1.2 ng/m3) andannual PM2.5 (0.3 ng/m3) which still requires PVEC to conduct a refined modeling analysis thatis provided below
26 SUL, is from EPA Guidance titled "Guidance Concerning the implementation of the 1-hour NO2 NAAQS for thePrevention of Significant Deterioration Program" dated June 29, 2010 and is used by EPA until the agencyformalizes a SIL through rulemaking.
32

Results from Refined Modeling
Table VI contains the results from the refined modeling. All modeled pollutants, except for 24-hour PM2.5 and 1-hour NO2 emissions, were below the SI L at the fence line. Since PM2.5 24 hourand one hour NO2 emissions were above the SIL, further analysis is required to determine if thisproject would cause or contribute to a NAAQS or increment violation.
Table VIRefined Model Res ults 27
Pollutant Result from refinedmodeling
SIL
NO2 (annual) 0.68 ppb 1 ppbNO2 (1 hour) 57.4 ppb 4 ppb28PM10 24 hour 3.05 µg/m3 5.0 µg/m3PK() annual 0.106 µg/m3 1.0 µg/m3PM2,5 24 hour 2.07 µg/m3 1.2 µg/m3PM2,5 annual 0.11 µg/m3 0.3 jag/m3
PM2.5
Background concentration
When using results from refined modeling for NAAQS compliance, background concentrationfor the pollutant of concern must be determined either by modeling other sources or monitoringrepresentative pollutant levels. There are two ways of determining the backgroundconcentration. First, the applicant can install an EPA approved ambient monitor to gatheremission data at the site prior to the application. A second method is to use data from an existingambient monitor which is representative of the ambient conditions for the proposed project. Toguide applicants, EPA has published significant monitoring concentration (SMC) values fordifferent pollutants. For PM2,5 averaged over 24 hours the SMC is 4 µg/m3. Forty CFR52.21(i)(5) allows EPA to exempt a stationary source or modification from the requirement togather site specific data [40 CFR 52.21(m)] if the emission increase from the project is less thanthe SMC value listed at 40 CFR 52.21(i)(5). Given the results from refined monitoring of 2.07µg/m3 for PM2,5 averaged over 24 hours and PK°, EPA has determined to exempt this projectfrom preconstruction on-site monitoring for PM2.5 emissions. Forty CFR 52.21(m)(2) allowsEPA to require post construction monitoring as necessary. Since it has been established the
27 The term "refined model" does not apply to the modeling for NO2. The differences between Tables V and V1 forNO2, besides the more updated meteorological data, is Table VI represents model results using hour-by-hourmeteorological data.28 S1L is from EPA Guidance titled "Guidance Concerning the Implementation o ithe 1-hour NO2 NAAQS for thePrevention of Significant Deterioration Program" dated June 29, 2010 and is considered to be used by EPA until theagency formalizes a SIL through mlemaking.
33

highest modeled impact from this project is less than the SMC for PM2.5, EPA has determined notto require post construction ambient monitoring of PM2.5 emissions.29
Now that it has been established that site specific ambient monitoring is not required,background levels of PM2 5 must be determined and a decision must be made whether to requirePVEC to include emissions from nearby sources. Nearby sources are described in 40 CFR part51, Appendix W as follows:
"Nearby Sources: All sources expected to cause a significant concentration gradient inthe vicinity of the source or sources under consideration for emission limit(s) should beexplicitly modeled. The number of such sources is expected to be small except in unusualsituations. Owing to both the uniqueness of each modeling situation and the large numberof variables involved in identifying nearby sources, no attempt is made here tocomprehensively define this term. Rather, identification of nearby sources calls for theexerc ise of professional judgement by the appropriate reviewing authority (paragraph3.0(b)). This guidance is not intended to alter the exercise of that judgement or tocomprehensively define which sources are nearby sources."
The term "sources" in EPA's modeling guidance refers to point sources of air emissions. Airemissions from mobile sources are addressed through the use of ambient air monitors. EPAreviewed the latest compilation (2008) of Massachusetts' emission inventory for all point sourcesof PM2 5 emissions in Hampden County. When determining whether a "nearby source" maycause a "significant concentration gradient" for PM2.5, EPA's modeling reviewer determined itwould be appropriate to look at 100 tpy sources within one mile of the proposed project and1,000 tpy sources within 10 miles.
The largest source of PM2,5 emissions in Hampden County is Mount Tom Generating Station inHolyoke. Mount Tom emitted 44 tons of PM2.5 and 92 tons of PM10 emissions and isapproximately 9 miles away. There is also John S Lane and Son Company locatedapproximately 5 miles away in Westfield which had 12 tons of PM2,5 emissions and 18 tons ofPM10. There are only 8 sources in Hampden County with PM2,5 emissions above 10 tpy and 10sources in Hampden County with PM10 emissions above 10 tons. Based on the emissioninventory EPA has determined there are no nearby sources expected to cause a significantconcentration gradient in the area of the proposed project. Therefore, interactive modeling usingPM2.5 emissions from other sources is not required for this project.
In determining background levels of PM2 5 emissions, PVEC proposed using ambient monitoringdata gathered at the Chicopee site (monitor ID 250130008). In EPA's analysis, the agencyidentified two other ambient monitoring stations, Springfield Liberty Street (monitor ID250130016), Springfield 1860 Main Street (monitor ID 250132009)3°, within the vicinity of theproject and based our analysis using emission data from all three ambient monitoring stations.
29 EPA also compared the model impact of 0.68 ppb NO2 on an annual basis to the SMC of 7.5 ppb and determinednot to require on-site monitoring. The annual standard is used because there is no SMC for the 1-hour NO2 standardat this time. See 40 CFR 52.21(i)(5)(iii).30 Data from an additional continuous emission monitor in Springfield can be obtained from A irNowTech.Org. Thismonitor is not recognized by EPA for determining compliance with the NAAQS. A cursory review in comparing the
34

The results from the refined modeling (using the average ofthe maximum modeled 24-houraverages across 2006-2010) were added to the most recent design value (years 2008-2010) foreach ambient monitoring station to determine if the emissions from PVEC would contribute to aviolation of the PM2.5 NAAQS averaged over 24 hours (35 pg/m3)31. The background level forboth of the Springfield monitoring stations is 27 pg/m3, while the design value for the Chicopeemonitoring station is 25 litg/m3. When the background levels are added to the results from themodeling, the highest level is 29.07 pg/m3 which is below the NAAQS level of 35.0 pg/m3.
In addition to demonstrating compliance with the NAAQS, PVEC is required to demonstrate itsemissions will not exceed available increment. States have the flexibility in how their state isdivided geographically for determining and tracking PSD increment. For PM2.5, increment istracked on the county wide basis in Massachusetts. On October 20, 2010, EPA published anincrement standard for PM2.5, averaged over both annual and 24-hour basis. In this rulemaking,EPA established the major source baseline date of October 20, 2010 and a requirement that allPSD sources required to address PM2.5 emissions demonstrate they will not consume more thanthe available increment. PVEC will be the first major source permitted after these dates andtherefore will consume PM2.5 increment and will need to demonstrate its modeled impact is lessthan the available 'increment. Because there are no other PSD permitted sources withinHampden County after October 20, 2010, and the minor source baseline date is triggered whenEPA deems PVEC's PSD application is complete, 100 % ofthe increment is available to PVEC.The increment for a Class II area (which is the Class Hampden County is currently designated) is9 pg/m3. PVEC's maximum modeled impact is 2.07 µg/m3, consuming 23% of the availableincrement. EPA has determined there is sufficient available increment for this project.
When analyzing the impact of PM2.5 emissions, secondary formation ofthe pollutant should beaddressed. Secondary emissions are formed when pollutants emitted by the source react withother ambient air pollutants. The model used by PVEC to demonstrate impacts from PM2.5emissions cannot address precursor emissions and secondary P M2,5 formation and impacts. Atthis time, no Appendix W point source model can provide this data. EPA does not have a modelwhich can adequately address these complex chemical reactions. That said, secondary PM2.5emissions from PVEC will form well away from the source, not locally, because time is requiredfor the secondary PM2.5 to form. As the plume of direct PM2.5 and precursor emissions fromPVEC moves away from the facility, dispersion results in diluting the pollutants even as theyform.
The impact these secondary emissions would have within the vicinity of the proposed site is deminimis. These particles, if they impact an area within the United States, will be part of thebackground levels measured by existing downwind monitors. In lieu of an available method incalculating the impact of secondary emissions from this facility and the fact that once secondary
PM2.5 emissions do impact the surface, such impacts will be at a considerable distance from thefacility, EPA reviewed the design values of monitors possibly downwind of the proposed project.The highest such value was 25 Kg/m3 in Suffolk County, Massachusetts. Given this information,
data between the EPA reference monitor and the continuous emission monitor showed the continuous emissionmonitor reading 20-30% higher than the EPA reference monitor.31 "Modeling Procedures tor Demonstrating Compliance with PM NAAQS," March 23, 2010
35

EPA believes the secondary formation ofPM2.5 emissions will not cause or contribute to aviolation of the PM2 5 NAAQS.
NO2
In "Guidance Concerning the Implementation of the 1-hour NO2 NAAQS for the Prevention ofSignificant Deterioration Program" issued on J une 29, 2010, EPA explains procedures anapplicant can follow when preliminary model estimates suggest potential violation of the 1-hourNO2 standard. Additional guidance relating to modeling demonstration for the 1—hour NO2standard "Additional C larification Regarding Application of Appe nd ix W Modeling Guidancefor the 1-hour NO2 National Ambient Air Quality Standard" was issued on March 1, 2011. Thesedocuments were used in determining whether the project would cause or contribute to a violationof the 1-hour NO2 NAAQS. There is no increment for the 1-hour NO2 standard at this time.
As allowed by the aforementioned guidance documents, the following assumptions were used inderiving the project's impact from the air model.
1. Assumption that 80% ofNOx exiting the stack is in the form of NO2.
2. Use the results from the controlling receptor. The location of the maximum reading ineach year can vary between receptors. In accordance with our guidance, PVECcalculated maximum impact based on the individual receptor with the highest readingaveraged over 5 years.
3. Use design value of each model year (8th highest reading) and averaging the numbersover a five year period.
The largest impact from NO2 emissions occur when the combined cycle turbine, auxiliary boiler,and firepump are simultaneously operated32. Although the operating hours are limited for boththe auxiliary boiler and firepump, operation of these devices were assumed to be 8760 hours peryear for modeling purposes. Although EPA guidance does allow for different treatment ofintermittent operations such as the auxiliary boiler and firepump,33 PVEC chose the moreconservative approach in estimating the project's impact.
Based on this acceptable approach, PVEC calculated the maximum ambient impact to be 48 ppb.The next step is to make a determination whether a "nearby source" may cause a "significantconcentration gradient" for NO2. Using the latest emission data inNEI (2008), PVEC plotted
32 Although allowable CCT NOx emissions are higher during startup and shutdown operations, PVEC modelingdemonstration showed a smaller impact because they assumed the neither the firepump or emergency generatorwould be operated during these scenarios. EPA has included a permit condition prohibiting PVEC from operatingthe firepump and emergency generator for readiness testing when the combined cycle turbine is in startup orshutdown mode.33 See "Additional Clarification Regarding Applicability of Appendix W Modeling Guidance for the 1 -hour NO2NAAQS" (Mar. 1, 2011), available athttp://www.epa.govittniscram/Additional Clarifications Append ixW Hourly -NO2-NAAOS FINAL 03-01-201 Lpdf, at 8-11.
36

sources ofNOx emissions within Hampden County on a map which included a wind rose andtopography. In its October 14, 2011 supplemental application, PVEC articulated several reasonswhy interactive modeling was not done, including using the information contained in the map.EPA has reviewed PVEC's submittal and concurs with their judgment there are no sourceswithin the project's vicinity to include in the modeling demonstration.
When interactive modeling is not done, an applicant relies on ambient monitoring data indetermining background levels. To determine if emissions fromthis project would violate theNAAQS, the modeled impact was added to the highest design value (from years 2008-2010) ofany EPA approved ambient monitor in the vicinity. The highest monitor design value, 49 ppb,was from a monitor located at Liberty St. in Springfield. When this background level is added tothe results from the modeling, the highest level is 97 ppb which is below the NAAQS level of100 ppb. Therefore, EPA has determined the NO2 emissions from this project will not cause orcontribute to a violation of the NO2 NAAQS.
Impairment to Visibility, Soils, and Vegetation
Forty CFR 52.21(o) requires the applicant to conduct an analysis of the air quality impact andimpairment to visibility, soils, and vegetation that would occur as a result of as a result of theproject and general commercial, residential, industrial and other growth associated with theproject. EPA reviewed the analysis and agrees with PVEC that CO, NO,, PM10, PM2.5, andsulfuric acid mist emission increases from this new project and associated commercial,residential, industrial, and other growth will not result in an impairment to visibility, soils, orvegetation, nor a model exceedance of the National Ambient Air Quality Standards for thesepollutants or increments. In addition, the modeling analysis demonstrated the project's emissionswould not have an adverse visibility impact at the closest Class I area (Lye Brook WildernessArea near Manchester, Vermont).
X. Mass Based Emission Limits
To ensure the NAAQS and increment are not violated, a PSD permit must contain enforceablepermit terms and conditions which ensure the mass flow rates for each modeled pollutant are notexceeded. This is accomplished by establishing mass-based emission limits for each modeledpollutant with or without the use of a CEMS. When a CEMS is used, the PSD permit mustestablish the averaging time for each mass-based emission limit that ensures compliance with theNAAQS. Without a CEMS, the applicable stack test method establishes the averaging time bydefault. PVEC is required to install CEMSs for both CO and NO,;, therefore averaging times forthese pollutants are specified in the permit.
The following table contains the mass-based emission limits PVEC used in demonstratingcompliance with the NAAQS and increment and therefore become emission limits in the PSDpermit.
37

NO. CO PlVlio/PM2 5Combined Cycle Turbine (maximum capacity)
20.2 lbs/hr gas, 43 lbs/hrULSD, one hr average
12.3 lbs/hr gas, 31.5 lbs/hr ULSD,one hr average
9.8 lbs/hr gas, 26.8 lbs/hr oil
Combined Cycle Turbine (startup/shutdown)See tables II and III See tables II and III Not applicable34
Auxiliary Boiler0.58 lbs/hr 0.74 lb s/hr 0.1 lb s/hr
Note: There are no mass-based emission limits for sulfuric acid mist or GHGs since there is noNAAQS or increment to protect. There are no mass-based emission limits for the emergencygenerator because the permit condition limiting maximum size of the generator combined withthe BACT limit is in effect a limit on mass emissions.
XI. Environmental Justice (EJ)
Executive Order 12898, entitled ̀ Federal Actions To Address Environmental Justice inMinority Populations and Low-Income Populations," states in relevant part that "each Federalagency shall make achieving environmental justice part of its mission by identifying andaddressing, as appropriate, disproportionately high and adverse human health or environmentaleffects of its programs, policies, and activities on minority populations and low-incomepopulations." Exec. Order 12898, § 1-101, 59 Fed. Reg. 7,629 (Feb. 16, 1994)."Federal agencies are required to implement this order consistent with, and to the extentpermitted by, existing law." Id. at 7,632. EPA policy further defines environmental justice asthe fair treatment and meaningful involvement of all people regardless of race, color, nationalorigin, or income with respect to the development, implementation and enforcement ofenvironmental laws, regulations and policies.35
The fact sheet for EPA's November 2010 draft permit included the Agency's analysis ofenvironmental justice issues and the basis for the Agency's conclusion that the facility'semissions would not have disproportionately high and adverse human health or environmentaleffects on minority or low-income populations. During the public comment period on last year'sdraft permit, EPA received written comments from Alternatives for Community and theEnvironment (ACE) on behalf of Westfield Concerned Citizens. These comments stated that theenvironmental justice analysis supporting the draft permit was inadequate. EPA also met withACE representatives in EPA's Boston office onAugust 8, 2011 to discuss these concerns. EPAhas considered the comments it received last year and in the August 8 meeting, and is providingadditional analysis and process for today's draft permit.
34 Due to issues with cyclonic flow, stack testing results for PMio and PM25 are not representative ()factualemissions.35 See h tip ://www.ep a.govienv iro nmental justice/ for more information.
38

I. Public Participation
In response to the level of public interest and issues regarding public participation raised in thecomments, EPA has agreed to conduct enhanced public outreach and communication. For thisrevised draft permit, EPA is undertaking the following actions:
• Conducting enhanced outreach to notify the public ofthe draft permit, i.e., beyond theminimum required by EPA regulations.
• Providing an extended comment period that is longer than the 30 days' minimumrequired by EPA regulations.
• Conducting an informal public informational meeting and formal public hearing. At thepublic hearing, people may submit comments on the record orally.
• Providing Spanish, Russian, French, and Polish interpreters at the informational meetingand public hearing.36
• Providing a simplified short-form summary of the permit action (available in English,Spanish, Russian, French, and Polish).
These steps will ensure an opportunity for meaningful involvement for all communities. Formore details on these issues, see the public notice and associated documents.
2. NAAQS Compliance
As noted above, the PSD permitting program applies to pollutants for which westernMassachusetts is classified as attainment or unclassifiable.37 The facility's modeled air impactwill not result in exceedance ofthe NAAQS for any PSD pollutant. The Agency sets theNAAQS using technical and scientific expertise, ensuring that the NAAQS protects the publichealth with an adequate margin of safety. See CAA § 109(b), 42 § 7409(b).
In general, for a PSD permit, compliance with the NAAQS is sufficient to demonstrate thatemissions from a proposed facility will not have disproportionately high and adverse humanhealth or environmental effects on a minority or low-income population. This is because theExecutive Order concerns itself with effects that are "adverse," and air emissions that do notcause an exceedance of the NAAQS do not lead to an adverse impact cognizable under the PSDpermit program. "In the context of an environmental justice analysis, compliance with theNAAQS is emblematic of achieving a level of public health protection that, based on the level ofprotection afforded by a primary NAAQS, demonstrates that minority or low-income populationswill not experience disproportionately high and adverse human health or environmental effectsdue to exposure to relevant criteria pollutants." In re Shell Gulf of Mexico, Inc., OCS AppealNos. 10-01 through 10-04 [hereafter "Shell/P], slip op. at 74 (EAB Dec. 30, 2010); see also Inre Shell Offshore Inc., 13 E.A.D. 357, 404-05 (2007); In re Knauf Fiber Glass, GmbH, 9 E.A.D.
36 The commenters requested Spanish and Russian translators. We added Polish and French on our own initiativebecause our analysis shows that the area surrounding the facility has a number of Polish and French speakers.37 Westem Massachusetts is designated nonattainment for 8-hour ozone. The nonattainment New Source Review(NANSR) permit for this facility's ozone precursor emissions was issued by MassDEP. MassDEP's NANSRanalysis is beyond the scope of this PSD permit.
39

1, 16-17 (EAB 2000); In re Sutter Power Plant, 8 E.A.D. 680, 692 (EAB 1999) (describing theNAAQS as the "bellwether of health protection").
It is true that, by using a conservative methodology, NO2 levels at one site (Liberty St. inSpringfield) are modeled to be 97 ppb, or 97% of the NAAQS of 100 ppb. See Section IX.However, this is not cause for concern. As noted above, NAAQS are set with "an adequatemargin of safety." CAA § 109(b)(1). Moreover, in determining the NAAQS, EPA considers theimpact of the pollutant on sensitive subpopulations, such as children, the elderly, and asthmatics.Shell II, slip op. at 64 n.72; see also Coalition of Battery Recyclers Ass 'n v. EPA, 604 F.3d 613,617-18 (D.C. Cir. 2010); Lead Indus. Ass'n v. EPA, 647 F.2d 1130, 1152-53 (D.C.Cir.1980).Thus, compliance with the NAAQS by any margin means that public health, including that ofsensitive subpopulations, will be protected with an adequate margin of safety. For this reason,emissions from the proposed facility will not have disproportionately high and adverse humanhealth or environmental effects on minority or low-income populations.
3. Additional Analysis of Surrounding Areas
As noted above, the facility's modeled air impact complies with the NAAQS at all points, andtherefore there are no "adverse human health or environmental effects" cognizable under thePSD permit program. Nevertheless, in light of the public interest and comment regardingenvironmental justice issues, EPA further examined the local demographics to determine whetherthe facility's emissions, even at below-NAAQS (i.e. non-"adverse") levels, woulddisproportionately affect minority or low-income populations. In parallel, and as discussed inSection IX above, PVEC has conducted new air quality modeling: revised PM2.5 (annual and 24-hour) air quality modeling using more up-to-date data, and 1-hour NO2 modeling.
To analyze the communities potentially affected by these emissions, EPA examined an areaknown as the Significant Impact Area (SIA). The SIA is the area in which the facility's modeledimpact exceeds the Significant Impact Level (SIL). The SIL, in turn, is a threshold value that, inPSD permitting, is used for modeling screening purposes: impacts below the SIL are not"significant" and do not need to undergo refined modeling.38 It is important to emphasize thatmodeled impacts above the SIL do not necessarily mean a project's emissions would beunhealthy, or would have an "adverse" effect on any population. To the contrary, the SIL istypically set at a very small percentage of the NAAQS. For example, the 1-hour NO2 SIL is setat 4 ppb, which is only 4 % of the NAAQS (100 ppb), which EPA recently promulgated in 2010to protect human health with an adequate margin of safety. Thus, modeled impacts that exceedthe SIL, but are below the NAAQS, do not present health risks. EPA is using the SIA as a basisfor analysis not because of any concern that emissions impacts inside the SIA are adverse—sincethey are below the NAAQS, they are by definition not adverse—but rather because impactsoutside the SIA are so insignificant as to be "de minimis."
38 It also defines the level at which a facility's modeled exceedance of the NAAQS is considered to be "causing orcontributing" to a violation of the NAAQS. See 40 C.F.R. § 51.165(a)(2)(D)(i). That is not an issue here since theNAAQS will not be exceeded.
40

A. Additional PM23 Analysis
With respect to PM2.5, EPA considered the revised modeled SIA for PM2.5 , and examined thedemographics of two areas: (1) a circle around the facility site tightly drawn around the SIA(with a radius of 0.63 miles), and (2) a 1.0-mile circle around the facility site.39 See Figures EJ-1(map for PM2.5 SIA with 0.63-mile and 1.0-mile circles), EJ-2 (demographic analysis of0.63-mile circle), and EJ-3 (demographic analysis of 1.0-mile circle). These analyses reveal thefollowing:
• The SIA itself contains no dwellings. In other words, no persons of any race or incomeare modeled to be exposed to PM2.5 emissions from the facility at significant levels.
• Neither the 0.63-mile circle nor the 1.0-mile circle contains any Census block groupswith high minority or low-income populations.4°
• The 0.63-mile circle contains 0.4%percent persons of minority race (below theMassachusetts average of 15.5%) and 5.5% percent persons below the federal povertyline (below the Massachusetts average of 6.7%).
• The 1.0-mile circle contains 0.5% persons of minority race and 5.7% persons below thefederal poverty line. Again, these values are well below the Massachusetts averages.
• The facility's maximum modeled contribution to ambient PM2.5 levels in an area with asubstantial minority or low-income population is 0.298 µg/m3 (Area 2). This is 25% ofthe SIL and just 1% ofthe N AAQS.
EPA therefore concludes that the facility's PM2,5 emissions will not have disproportionately highhuman health or environmental effects on minority or low-income populations.
B. Additional NO2 Analysis
EPA also examined the impact from increased NO2 emissions since the impact ofthis pollutantis also above the SIL. Current scientific evidence links short-term NO2 exposures, ranging from30 minutes to 24 hours, with adverse respiratory effects including airway inflammation inhealthy people and increased respiratory symptoms in people with asthma.
39 EPA used a one-mile circle because ACE suggested this as a radius of concern in its December 2010 comment.40 For the purpose of this analysis, EPA mapped both EPA Region l's Potential Environmental Justice (EJ) Areasand the Massachusetts Environmental Justice Populations. EPA's Potential EJ A reas are based on the 2000 CensusBlock Group Boundary layer. The methodology used to determine how the areas are coded involved identify ingthose block groups with percentages in the top 1.5% of the six-state New England region for low-income residentsand/or minorities. Low-income is defined as twice the Federal Poverty Level. The Massachusetts ET Populationsare defined by having one or more of the following attributes: a minority population of 25% or more; an averagehousehold income of less than 65% the Massachusetts state median income; a foreign-born population of 25% ormore; and/or a non-English-proficient population of 25% or more.
41

As with other pollutants, PVEC modeled several different operating scenarios to determinewhich scenario represented the project's most significant impact from NO2 emissions. At EPA'srequest, PVEC analyzed the potential impacts of its NO2 emissions on minority and low-incomecommunities. See PVEC October 14, 2011 submission ("Supplemental Information - 1 hourNO2 Impact Analysis") [hereafter "PVEC NO2 Analysis"]. PVEC submitted two very detailedmaps which provide information regarding topography, wind direction, other NO,, emittingsources in the area, and "Areas-of Concern" communities. As the PVEC NO2 Analysisexplained, PVEC used EPA's "Toolkit for Assessing Potential Allegations of EnvironmentalInjustice" to define Areas-of-Concern communities as meeting either of the following twocriteria:
I. The community's minority population percentage is above the statewide minoritypopulation percentage (15.5%), and/or
2. The community's percentage ofpopulation below the poverty level exceeds thestatewide average population percentage below the poverty level (6.7%).
PVEC's conclusions, and EPA's further analyses, are discussed below separately for two differentoperating scenarios.
1. Normal Operations
The first map, Attachment 1 to this Fact Sheet, shows PVEC's modeled analysis of the impact ofNO2 emissions when PVEC is operating the gas turbine on ULSD. Although the use of ULSD isstrictly limited by the permit, for these purposes PVEC mapped the 1-bour NO2 impacts ofULSD rather than natural gas because burning ULSD has a higher impact than burning naturalgas. Attachment 1 demonstrates that NO2 emissions above. the SIL occur only in areas which arenot considered Areas-of-Concern communities. Indeed, the S IA for NO2 from normal turbineoperations is almost entirely west of the facility, whereas the Areas-of-Concern communities arenorth, south, and east ofthe facility.
Based on Attachment 1, EPA concludes that the facility's normal operations (turbine operating atsteady state) will not have will not have disproportionately high human health or environmentaleffects on minority or low-income populations.
2. Weekly testing
At EPA's request, PVEC also modeled NO2 emissions when the turbine is fully operational andwhen PVEC is conducting its weekly maintenance and safety checks on the emergency engineand fire pump. Although the permit limits the operation of the emergency engine and fire pumpto 300 hours per year, and although EPA guidance allows facilities to ignore such "intermittent"sources when conducting modeling,41 EPA asked PVEC to analyze this operating scenario
41 See "Additional Clarification Regarding Applicability of Appendix W Modeling Guidance for the 1-hour NO2NAAQS" (Mar. 1, 2011), available athttp://www.ena.govittrils cram/Add itional Clarifications Amend ixV/ Hourly -NO2-NAAOS FINAL 03 -01 - 2011.pdf, at 8-11.
42
because it has the highest modeled impact from NO2 emissions. Impacts during these times aregreater than the impact occurring when the turbine is in startup or shutdown mode, even thoughthe NO, emission rate is higher during startup and shutdown, because of the smaller volumetricflow from the stack during startup and shutdown. At EPA's suggestion, PVEC furtherinvestigated whether confining the weekly testing of the emergency engine and fire pump to aparticular time of day would limit the spatial extent of the NO2 plume (due to meteorologicalvariability), and determined that the extent of the NO2 plume would be minimized if the testingwas limited to 12:00-3:00pm.
Attachment 2 to this Fact Sheet shows PVEC's modeled analysis of the impact of NO2 emissionswhen PVEC is operating the gas turbine and also conducting its required weekly maintenanceand safety checks on the emergency engine and fire pump. This map does indicate threedifferent Areas-of-Concern communities in which the model results predict the impact ofPVEC's NO2 emissions to be higher than the SIL in at least part of the community.
Based on PVECs analysis, EPA decided to further examine the demographics of the modeledSIA for NO2 under the scenario ofPVEC operating the gas turbine and also conducting itsweekly testing of the emergency engine and fire pump. These analyses reveal the following:
• The SIA does include two Census block groups in Westfield that are both EPA Region 1Potential EJ Areas and Massachusetts EJ Populations. These correspond to Area 1 andArea 2 in PVEC's maps.
• The SIA overlaps a Census block group in West Springfield that is a Massachusetts EJPopulation but not an EPA Region 1 Potential EJ Area. This corresponds in part to Area3 in PVEC's map.
Because of the extremely irregular shape of the modeled Significant Impact Area for 1-hourNO2, EPA does not believe that a demographic analysis based on a circular region is an idealmethod of evaluating the population affected by the NO2 plume from emergency equipmenttesting. However, in the interest of completeness, EPA generated demographic analyses forcircles of three different radii around the facility: 3.5 miles, 6 miles, and 8 miles.
The first two radii were selected so as to include the above-identified block groups. The 3.5-milecircle includes the two identified Westfield block groups (i.e., all ofthe Census block groups thathave modeled NO2 impacts above the SIL and meet the threshold of EPA Region 1 Potential EJAreas) and has been expanded slightly beyond those block groups so as to ensure inclusion ofthree schools just south and west of these two areas. See Figures EJ-4 (map with 3.5-mile circle,NO2 SIA, and locations of interest), EJ-5 (demographic analysis of 3.5-mile circle). The 6-milecircle includes the West Springfield block group as well. Thus, it includes all of Census blockgroups that have modeled NO2 impacts above the SIL and meet the threshold of EPA Region 1Potential EJ Areas or Massachusetts EJ Populations, and has been expanded to include theentirety of the West Springfield block group in question, not just the portion within the SIA. SeeFigures EJ-6 (map with 6-mile circle, NO2 SIA, and locations of interest), EJ-7 (demographicanalysis of 6-mile circle). The third radius (8 miles) was selected because it includes most
43
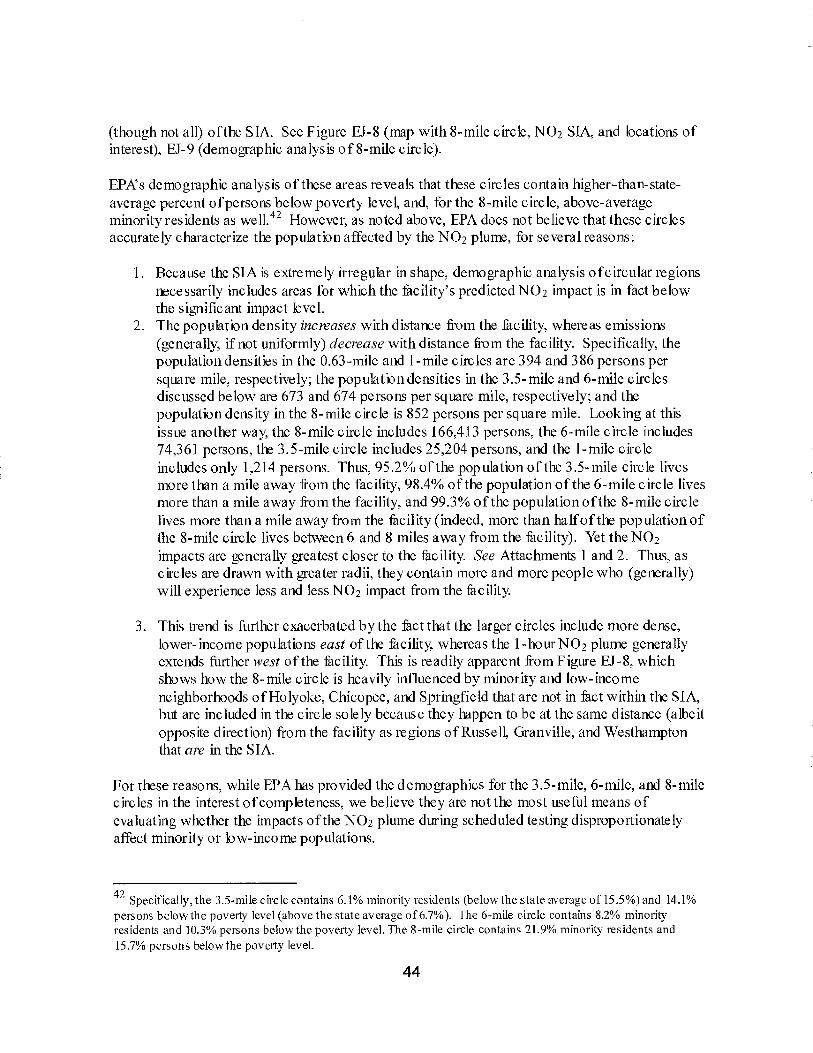
(though not all) ofthe SIA. See Figure EJ-8 (map with 8-mile circle, NO2 SIA, and locations ofinterest), EJ-9 (demographic analysis of 8-mile circle).
EPA's demographic analysis of these areas reveals that these circles contain higher-than-state-average percent ofpersons below poverty level, and, for the 8-mile circle, above-averageminority residents as well:12 However, as noted above, EPA does not believe that these circlesaccurately characterize the population affected by the NO2 plume, for several reasons:
1. Because the SIA is extremely irregular in shape, demographic analysis of circular regionsnecessarily includes areas for which the facility's predicted NO2 impact is in fact belowthe significant impact level.
2. The population density increases with distance from the facility, whereas emissions(generally, if not uniformly) decrease with distance from the facility. Specifically, thepopulation densities in the 0.63-mile and 1-mile circles are 394 and 386 persons persquare mile, respectively; the population densities in the 3.5-mile and 6-mile circlesdiscussed below are 673 and 674 persons per square mile, respectively; and thepopulation density in the 8-mile circle is 852 persons per square mile. Looking at thisissue another way, the 8-mile circle includes 166,413 persons, the 6-mile circle includes74,361 persons, the 3.5-mile circle includes 25,204 persons, and the 1-mile circleincludes only 1,214 persons. Thus, 95.2% of the population of the 3.5-mile circle livesmore than a mile away from the facility, 98.4% of the population of the 6-mile circle livesmore than a mile away from the facility, and 99.3% of the population ofthe 8-mile circlelives more than a mile away from the facility (indeed, more than half of the population ofthe 8-mile circle lives between 6 and 8 miles away from the facility). Yet the NO2impacts are generally greatest closer to the facility. See Attachments 1 and 2. Thus, ascircles are drawn with greater radii, they contain more and more people who (generally)will experience less and less NO2 impact from the facility.
3. This trend is fiirther exacerbated by the fact that the larger circles include more dense,lower-income populations east of the facility, whereas the 1-hour NO2 plume generallyextends further west of the facility. This is readily apparent from Figure EJ-8, whichshows how the 8-mile circle is heavily influenced by minority and low-incomeneighborhoods of Holyoke, Chicopee, and Springfield that are not in fact within the SIA,but are included in the circle solely because they happen to be at the same distance (albeitopposite direction) from the facility as regions of Russell, Granville, and Westhamptonthat are in the SIA.
For these reasons, while EPA has provided the demographics for the 3.5-mile, 6-mile, and 8-milecircles in the interest of completeness, we believe they are not the most useful means ofevaluating whether the impacts of the NO2 plume during scheduled testing disproportionatelyaffect minority or low-income populations.
42Specifically, the 3.5-mile circle contains 6.1% minority residents (below the state average of 15.5%) and 14.1%
persons below the poverty level (above the state average of 6.7%). The 6-mile circle contains 8.2% minorityresidents and 10.3% persons below the poverty level. The 8-mile circle contains 21.9% minority residents and
15.7% persons below the poverty level.
44

Instead, EPA examined the facility's modeled NO2 impact in the three identified Areas-of-Concern communities that are within or overlap the SIA, and compared it to the modeled NO2impact in other, non-Areas of Concern communities. The impacts in the three identified Areas-of-Concern communities are:
Area 1 (Westfield): 4.45 ppbArea 2 (Westfield): 4.66 ppbArea 3 (West Springfield): between 3.66 ppb and 4.12 ppb
Ofthese three Areas-of-Concern communities, the highest NO2 impact fromPVEC occurs inArea 2 with a modeled impact of 4.66 ppb, i.e., very slightly exceeding the SIL of 4.00 ppb.These impacts are in fact quite low, not just in absolute terms but also relative to othercommunities in the Significant Impact Area. EPA confirmed that there are other communitieswithin the SIA that are na Areas-of-Concern communities and which have higher impacts fromNO2 emissions than Area 2. For example, the modeling analysis predicts an impact of 20 ppb(i.e., 20 % of the health-based standard of 100 ppb) in a neighborhood just north of the VictoriaEstates Conservation Area that does not have high percentages of minority or low-incomeres idents.
Since the project's maximum modeled air impact does not occur in Areas-of-Concerncommunities, it actually affects low-income communities less than other communities.Furthermore, as noted above, the project's maximum modeled air impact is not "adverse"because it is well below the NAAQS. For these reasons, EPA concludes that the project's airemissions will not cause disproportionately high and adverse human health or environmentaleffects on minority or low-income populations. See, e.g., In re EcoElectrica, L.P., 7. E.A.D. 56,68 (1997),
C. Actions taken
While the facility's impacts will not cause disproportionately high and adverse human health orenvironmental effects on minority or low-income populations, EPA has decided, out of anabundance of caution, to implement several common-sense measures given the presence ofpotentially sensitive communities near the facility:
1. As discussed above, EPA is providing enhanced public participation to ensure that allmembers ofthe public have an opportunity for meaningful involvement.
2. Because PVEC 's NO2 modeling indicates that the plume from scheduled emergencytesting would have the least impact if conducted between 12:00-3:00pm, the draft permitrequires that testing be conducted only during this window.
3. Finally, to account for any remaining uncertainties in this analysis and for the potentialsensitivity of vulnerable groups to cumulative impacts, the draft permit prohibits thefacility from conducting scheduled testing of the emergency generator and fire pumpduring days when the hourly ambient NO2 level measured just before testing at thenearest ambient NO2 air quality monitor within Hampden County operated by theMassDEP and available at http://oublic.dep.state.ma.us/MassAir is 54 ppb or higher, the
45
starting point for the "moderate" air quality index for NO2.43 This prohibition shall applyexcept for the rare circumstance when this condition would prevent emergencyequipment testing for more than five consecutive days and thereby pose a potential safetyhazard.
The above-discussed analyses and actions fulfill EPA's obligations under Executive Order 12898and EPA environmental justice policy.44
XII. National Historic Preservation Act
On November 5, 2010, EPA sent a letter to Brona Simon, Executive Director for theMassachusetts State Historic Preservation Office, notifying her of the earlier draft permit forPVEC and requesting consultation under Section 106 of the National Historic Preservation Actof1966, as amended. Ms. Simon responded to EPA by a letter recommending that EPA make afinding of "no historic properties affected" under 36 CFR 800.4(d)(1) for this project. Today'sdraft permit does not change the scope of the previous draft permitted project; therefore, EPA ismaking a finding that our action does not affect any historic properties.
XIII. Comment Period, Hearings and Procedures for Final Decisions
All persons, including applicants, who believe any condition of the Draft Permit is inappropriatemust raise all issues and submit all available arguments and all supporting material for theirarguments in full by the close ofthe public comment period, to Donald Dahl (OEP 05-2)U.S. Environmental Protection Agency 5 Post Office Square - Suite 100 Boston MA 02109 -3912. Please note that this new Draft Permit completely replaces and supersedes the November5, 2010 draft permit. Even if you commented on the November 2010 draft permit, if you believethat a condition ofthis new Draft Permit is inappropriate, you must, during the new publiccomment period, submit a comment raising all available issues.
A public hearing will be held during the public comment period. See the public notice fordetails. EPA will consider requests for extending the public comment period for good cause. Inreaching a final decision on the Draft Permit, the EPA will respond to all significant commentsand make these responses available to the public at EPA' s Boston Office.
Following the close ofthe public comment period, and after the public hearing, the EPA willissue a Final Permit decision and forward a copy of the final decision to the applicant and eachperson who has submitted written comments or requested notice. Within 30 days following thenotice of the permit decision, any interested parties may submit a petition for review ofthepermit to EPA's Environmental Appeals Board consistent with 40 CFR 124.19.
43 An air quality indexof "moderate- is defined as: -Air quality is acceptable; however, for some pollutants theremay be a moderate health concern for a very small number o f people. Unusually sensitive people sh ould considerreducing prolonged or heavy exertion outdoors." http://www.mass.govidep/air/aqi/aqi.httri#How AOI_Works.44 EPA's conclusion that this paiticular P SD permit action will not cause disproportionately high and adverse humanhealth or environmental effects on minority or low-income populations is based on the location and modeledenvironmental impact ofthis particular facility. Outside of the scope of this PSD permit, EPA has invested in avariety of environmental justice-related activities in Holyoke, Chicopee, and Springfield. See document entitled"EPA Community Initiative Supporting the Pioneer Valley Knowledge Corridor" in the permit file.
46

XIV. EPA Contacts
Additional information concerning the draft permit may be obtained between the hours of 9:00a.m. and 5:00 p.m., Monday through Friday, excluding holidays from:
Donald Dahl (OEP 05-2)U.S. Environmental Protection Agency5 Post Office Square - Suite 100Boston MA 02109 - 3912Telephone: (617) 918-1657Dahl . Donald ae pa. gov
47

imam: folGIS-0,GIGINGOICO.maJjOrGladJII,GtunulapflOA..el
in
1,1,101.11
Attachment 1
Hampden County SLatiorLary flOm So IJ/P4
0 ..,..91,1ititteekgral 1?..er4rma SIAN NON Total 0nhalowa (TanaProatl
1:21PWC lad 1 *Din in 61,21.45 -4rn. 0.uur NO, Sit , 0 O• a 0 JOG ..
Gfri110107.1.1.G.G. MG. O , So 0 .1.
0 .• to
48
PVEC 1-11aur NO,
modeled Siandican
tropmet Free during
Normal Operation
(No Stamdla y r ng(a.T.AlogRpm 1

!mew ..j45.., N07.1.K..r.41...1.1[0.-1-este.p1.1-1.5470.1.n.4
PIONEER VALLEY [KAM, CENTER
Westfield, Ploaaafi.db.
laigand
Miarrilidnrianna tavnLECau nano,
Mr anaanr
A omant. ma, Pan.A 5r lNo:
Attachme nt 2
Hampden Count, Stallanarg NON Smutea
•tannainalko,mobacaann aoaamp.9ala, NO. TalatEmiartant (Taraffnar)
i=1SÓtOuiaa .51.; 11, 14 440 154
Emazarranal imam I, •
49
IIVEC 1,6oar NO,
Madded Significant
Impact Area during
Standby Englne TastingiLinfiled to nann -
Figure Z

Figure EJ-1 (map for PM2 SlAwith 0.63-mile and 1.0-mile circles)
1 Mile Bufferof Site Location
0.63 Mile Bufferof Site Location
nc.o. — t "c •
Site Location
ihicEisc-t:idsamas
About PoSential Ensiroirsmentalpsace Areas
:gm Region's Potodial EnvircamentaJ justice Can Â. are bami.the Sam Cali. Mad Croup Pounaary layer. The
rrx*hodeior used to dcberrne- how the arm are codali htvIteed
identifying thole biro& grasps wIthp..-ta-Ltaya St the Op 15%431the leg Erm_ 1,:1ente. annilar siaserincs.Cow-smarm is defined as fine the 9ederal Poverty Level.
/ -F. .6. 'IN OA ^ ,
h
MIN A111.
11ll
7- 7= -4111:D=
c
Q. :a147:1DIZIE)=1
• Pre-school
School
• Mobile Horne Community
r PVEC 24-hr P M2.5 Significant Impact AreaMassachusetts EnvironmentalJustice Populations
EPA RegionPotential EnvironmentalJustice (EJ)Areas
Low-Income
0 0.25 Pioneer Valley Energy Facility6EPA
MdP vtged by EPA Reglau 1 6.l0 CeriorMap Tracker ID 11.315 Nova o8 er 36,2011
Aerial Map -Ring Mans, Gang lo Earth, &118010.Schools -MonsGIS, 2006; Mid EJ Areas (]600
CeF1Su 4)- Ma sf.,3 ES, 201.1-3.
50

EJ-2: Demographics analysis of 0.63 mile circle
Total Persons: 492
Population 393.97 /sqDensity: m i
Percent Minority:
Overview
Land Area: i 99.2%
Water Area: 0.8%
PercentUrban:
.4% [Persons Below Poverty [27 (5.5%)Level:
95% Housing Units Built 21%<1970:
Households in Area: 1201
Housing Units in Area: [209
Households on Public Assistance:
Housing Units Built <1950: 7%
Race and Age*
(*Columns that add up to 100% are highlighted)
Persons (%) 1 Age BreakdownRace Breakdown Persons(%)
Whte: 490 (99.6%) Child 5 years or less: 29 (5.9%)
African-American:r 0 (0.0%)F1inors 17 years and younger: 89 (18.1%)
Hispanic-Origin: 2
0
(0.4%) Aduts 18 years and older: r- 403 (81.9%)
Asian/Pacific Islander:[ (0.0%)!Seniors 65 years and older: f 118 (24.0%)
American Indian: 0 (0.0%)
This space intentionally left b lankOther Race: 2 (0.4%)
Multiracial: 0 (0.0%)
Gender Breakdown
Males:
Gender
Persons (%)
240 (48.8%)
Females: 252 (51.2%)
Education
Persons (%)Education Level (Persons 25 & older)
Less than 9th grade: 38 (10.9%)
9th -12th grade: 52 (15.0%)
Hicth School Diploma: 123 (35.6%)
Some College/2 vr: 31 (8.9%)
B.S./B.A. or more: 102 (29.6%)
51
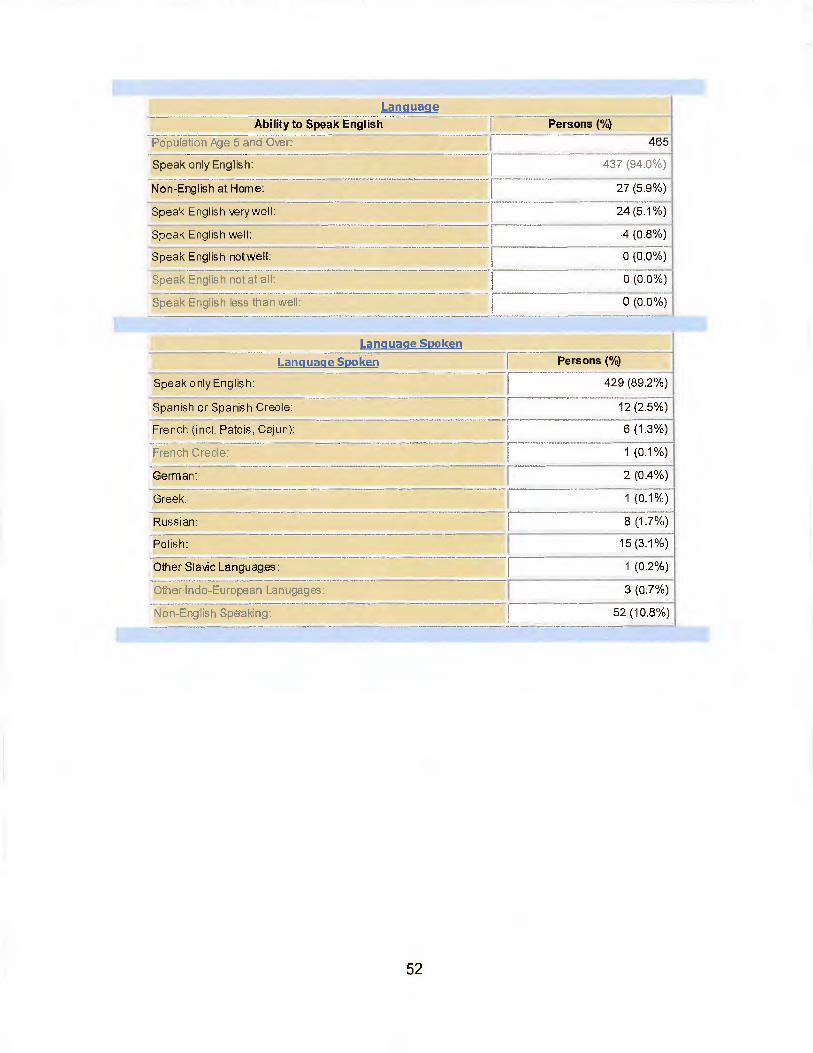
Language
Ability to Speak English Persons (°/0)
Population Age 5 and Over: 465
Speak only English: 437 (94.0%)
Non-English at Home: 27 (5.9%)
Speak English very well: 24 (5.1%)
Speak English well: 4 (0.8%)
Speak English notwell: 0 (0,0%)
Speak English notat all: 0 (0.0%)
Speak English less than well:[
0 (0.0%)
Language Spoken
Language Sixiken Persons (%)
Speak onlyEnglish: 429 (89.2%)
Spanish or Spanish Creole: 12 (2.5%)
French (incl. Patois, Cajun): 6 (1.3%)
French Creole: 1 (0.1%)
German: 2 (0.4%)
Greek: 1 (0.1%)
Russian:
o .
8 (1.7%)
Polish: 15 (3.1%)
Other Slavic Languages: I 1 (0.2%)
Other Indo-European Lanugages: 3 (0.7%)
Non-English Speaking: 52 (10.8%)
52

Place of Birth for the Foreign-Born.
Country 1 Persons
Foreign-Born Population:T[
34
Europe: 123 (67.6%)
Asia: 6 (18.5%)
Americas: rg (13.8%)
United Kingdom:Kingdom: 1 -4 (1 1 .3%)Ireland: F1 (2.6%)
France: I 1 (1.9%)
Italy: 2 (5.6%)
Poland: 8 (23.2%)
Russia: I 1 (1.6%)
Ukraine: 4 (11.5%)
Other Eastern Europe: 3 (9.9%)
Other Central Eastern Asia: f 6 (18.5%)
-EI Sahrad6i:- ..._
1 (4%)
Guatemala: 1 (1.9%)
Chile: 0 (1.2%)
Other South America: 0 (1.4%)
Canada: 2 (5A%)
Income
Income Breakdown Households (%)
Less than $15,000: i 37 (18.3%)
$15,000 -$25,000: 13 (6.4%)
$25,000 - $50,000: I 61 (30.6%)
$50,000 -$75,000: 44 (21.9%)
Greater than $75,000: I 58 (28.8%)
Tenure
Tenure Breakdown Households 0/4
Occupied Housing Units: 201 (100.0%)
Owner Occupied: 183 (91.4%)
Renter Occuoled 17 (8.6%)
53

Ell-3 Demographic Analysis of 1 mile circle
Total Persons:
Population Density:
Percent Minority:
1214 'Land Area:
386.2 lsqm i Water Area:
Overview
99.2% Households in Area: 494
0.8% Housing Units in Area: 1515
.5% Persons Below Poverty 169 (5.7%) Households on Public 11Level: Assistance:
Percent Urban:
94% 1<1970Housing UnitsBuilt <1970:
I 23% Housing Units Built <t950:
Race and Age*
8%
(* Columns that add up to 100% are highlighted)
Race Breakdown
WhLe:
r-- Persons (%)
r--- 1208 (99.5%)
r Age Breakdown Persons(%)
[Child 5 years or less: 72 (5.9%)
African-American: [--- 0 (0.0%) Minors 17 years and younger: 224 (18.5%)
Hispan ic-Origin: 5 (0.4%) Aduts 18 years and older: I 990 (81.5%)
Asian/Pacific Islander: 0 (0-0%) Seniors 65 years and older: 286 (23.5%)
American Indian: 1 (0.1%)
This space intentionally left blankOther Race: 5 (0.4%)
Multiracial: 0 (0.0%)
Males:
Fe males:
Gender
Gender Breakdown
Ed ucation
Education Level (Persons 25 & older)
Persons (%)
Persons (%)
Less than 9th grade: 89 (10.6%)
9th -12th grade: I125 (14.8%)
High School Diploma: 304 (35.9%)
Some College/2 yr: 82 (97%)
B.S./B,A. or more: 245 (29.0%)
54

Language
Ability to Speak English Persons (%)
Population Age 5 and Over: [ 1147
Speak only English: 1080 (94.2%)
Non-English at Home: 67 (5.8%)
Speak English very well: 58 (5.1%)
Speak English well: 9 (0.8%)
Speak English not well: F--- 0 (0.0%)Speak English not at all: r 0 (0.0%)
Speak English less than well:I
0 (0.0%)
Language Spoken
Language Spoken Persons (%)
Speak only English: 1103 (88.9%)
Spanish or Spanish Creole: • 33 (2.7%)
French (incl. Patois, Cajun): 15 (1.2%)
French Creole:T
2 (0.1%)
Portuguese or Portuguese Creole: I 0 (0.0%)
German: 4 (0.4%)
Greek: 2 (0.1%)
Russian: 24 (1.9%)
Polish: 37 (3.0%)
Other Slavic Languages: 3 (0.2%)
Hindi: 1 (0.0%)
Other Indo-European Lanugages: 8 (0.6%)
Japanese: 0 (0.0%)
Korean: 0 (0.0%)
Arabic: 0 (0.0%)
Non-English Speaking: 138 (11.1%)
55

Place of Birth for the Foreign-Born
Cou ntry Persons
Foreign-Born Population: 90
Europe: 161
17
(67.4%)
(18.7%)Asia:
Americas; 13(13.9%)
United Kingdom: 9(10.4%)
Ireland; [2 (2.3%)
Austria: 0 (.1%)
France: 2 (1.7%)
Germany: 0 (.1%)
Greece: 0 (.1%)
Italy: 5 (5.5%)
Portugal: 0 (.1%)
Poland: 120 (21.9%)
r 0 (.1%)Belarus;
Russia: 3 (2.9%)
Ukraine: 11(12.3%)
Other Eastern Europe: 9 (10%)
Japan: 0 (.1%)
Korea: 1 0 (.1%)
India: 0 (.5%)
Other Central Eastern Asia: 16(17.8%)
Lebanon: 0 (.1%)
Barbados: 0 (.1%)
Dominican Republic: 0 (.3%)
El Salvador: r 3 (3.6%)
Guatemala: [ 2 (1.7%)
Chile: r 1 (1.1°20)Other South America: 1 (1.3%)
Canada: 1 5 (5.9%)
Income
Income Breakdown Households (%4)
Lessthan $15,000: 90 (18.1%)
$15,000 - $25,000: 32 (6.5%)
$25,000 - $50,000: 151 (30.7%)
$50,000 - $75,000: 109 (22.0%)
Greater than $75,000: I 140 (28.4%)
56

Tenure
Tenure Breakdown Households (%)
Occupied Housing Units: 494 (10020%)
Owner Occupied: 449 (90.9%)
Renter Occupied 45 (9.1%)
57

EJ-4: Map with 3.5-mile circle, NO2 SIA, and locations of interest
3.5 Mile Bufferof Site Locat on
About Err:ex-rtlel Enrairenertentel Justice Areas
The eesien'a Pot hat Enmarmtentallneda (ED Areas are based
on the 2009 CIFIPLIS ELSA Crati, rouadary layer- Themethodology uxdJ c14,417rsi.le haw the areal arc reeled involvedielanlifying War blodegroup with puetthasta in the op 15% al
the legion Tor "law-ineorle tendertu e.dfor xthoorirt
Low.Incorne la defined as twice the Federal Povc-.•
• orr‘ oval
lL_'...
• Pre-school
• School
▪ Mobile HOMO Community
II Elder Cara Facility
Massachusetts LongTerm Care Residences
• Assisted Living Facility
El Nursing Hame
h Ravi Home
PVEC 1-ht NO2SIgnifieenl Itepact Area
C:3 PVEC 24hr Ph12.5Significant Impact Area
Massachusetts EnvironmentalJustice populations
1222EPA Region 1Potential EnvironmentalJustice (e.4 Alen
Law-Income
Minority
Ruth
ll 1Mlles
Pioneer Valley Energy Facility&EPA
Map created by EPA Region 1 ei5 CenterMap Tracker 10 El 136 linverrber 19 2111
Aorre1 Map Ding Maps, 13oog re Ealth. M1110012.Schnell - elaseNS. 2009: MA EJ Areas Ina
Censusl
58

EJ-5 (demographic analysis of 3.5-mile circle
Overview
Total Persons: 25204 Land Area: 97.2% Households in Area: 9518
Population 673.37 lsg.._mi Water Area.
,2.8% Housing Units in Area: 9994
Density:
PercentPersons9.2% Below • 3398 on Public 466(14.1%)[HouseholdsAssistance:Poverty Level:Minority:
Percent 83% Housing Units Built 63% Housing Units Built 38%<1970: <1950:Urban:
Race and Age*
(* Columns that add up to 100% are highlighted)Race Breakdown Persons (%) • [ Age Breakdown Persons(%)
Whte: 23678 (93.9%) Child 5 years or less: 1957 (7.8%)
African-American: 274 (1.1%).Minors 17 years and younger: f 6190 (24.6%)
Hispanic-Origin: 1689 (6.7%) Aduts 18 years and older: 19014 (75A%)
Asian/Pacific Islander: 114 (0.5%) Seniors 65 years and older: F 3406 (13.5%)
American Indian: 45 (0.2%)
This space intentionally left b lankOther Race: 750 (3.0%)
Multiracial: 343 (1.4%)
Gender
Gender Breakdown Persons (u/G)
Males: 12323 (48.9%)
Females: 12881 (51.1%)
Education
Education Level (Persons 25 & older) Persons (%)
Less than 9th grade: 1047(7.2%)
9th -12th grade: 1780(12.2%)
High School Diploma: 5597(38.5%)
Some College/2 yr: 2798(19.2%)
B.S./B.A. or more: 3322(22.8%)
59

Language
Ability to Speak English
Population Age 5 and Over:
Speak only English:
Persons (%
Non-English at Home: F
23495
20016 (85.2%)
3479 (14.8%)
Speak English very well:
Speak English well:
Speak English not well:
Speak English not at all:
Speak English less than well:
r1651 (7.0%)
874 (3.7%)
Language Spoken
Language Spoken
777 (3.3%)
176 (0.8%)
954 (4.1%)
Persons (%)
Speak only English:1
19766 (85.8%)
Spanish or Spanish Creole: r 1033 (4.5%)
French (incl. Patois, Cajun): 230 (1.0%)
French Creole: 19 (0.1%)
Portuguese or Portuguese Creole: 33 (0.1%)
German: 57 (0.2%)
Other West Germanic Languages: 11 (0.0%)
Scandinavian Languages: 2 (0.0%)
Greek: 62 (0.3%)
Russian: 659 (2.9%)
Polish: 428 (1.9%)
Serbo-Croatian: 90 (0.4%)
Other Slavic Languages: r 317 (1.4%)
Armenian: 2 (0.0%)
Persian: 1 (0.0%)
Hindi: 36 (0.2%)
Other Indo-European Lanugages: 51 (0.2%)
Chinese: 8 (0.0%)
Japanese: 22 (0.1%)
Korean: I- 6 (0.0%)
Mon-Khmer, Cambodian: 10 (0.0%)
Metnamese: I- 6 (0.0%)
Tagalog: 9 (0.0%)
60
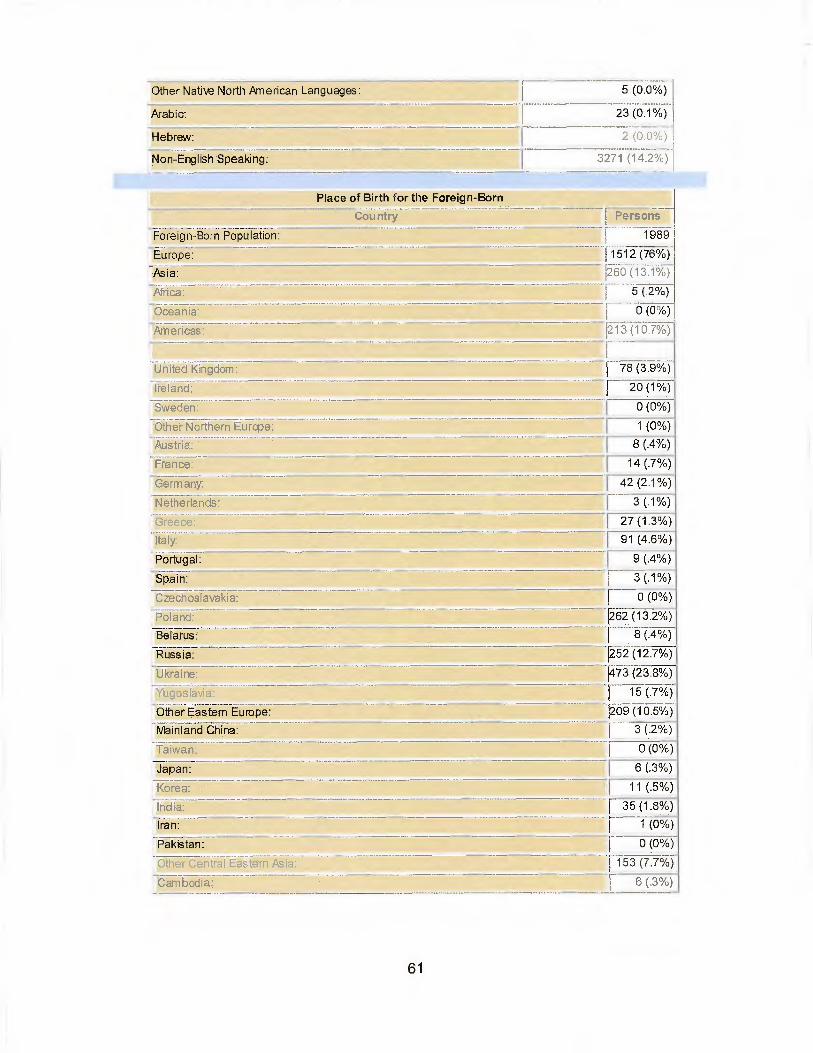
Other Native North American Languages:
Arabic: 23(0 1%)
Hebrew: 2(0.0%)
Non-English Speaking: 3271 (14.2%)
Place of Birth for the Foreign-Born
Country Persons
1989Foreign-Born Population: 1
Europe: 11512 (76%)
Asia: 260 (13.1%)
Africa: 5 (.2%)
Oceania: 0 (0%)
Americas: 13 (10.7%)
United Kingdom: 78 (3.9%)._.
Ireland: 20 (1%)
Sweden: I 0 (0%)
Other Northern Europe: 1 (0%)
Austria: 8 (.4%)
France: 14 (.7%)
Germany. 42 (2.1%)
Netherlands: 3 (.1%)
Greece: 27 (1.3%)
Italy: 91 (4.6%)
Portugal: 9 (.4%)
Spain: 3 (.1%)
Czechoslavakia: 1 0 (0%)
Poland: P52(13.2%)
Belarus: 1 8 (.4%)
Russia: 252 (12.7%)
Ukraine: 1473 (23.8%)
Yugoslavia: 1 15 (.7%)
Other Eastern Europe: 1209 (10.5%)
Mainland China: 1 3 (.2%)
Taiwan: 1 o (0%)Japan: 6 (.3%)
Korea: 11 (.5%)
India:. r35 (1.8%)
Iran: 1 (0%)
Pakistan: 0 (0%)
Other Central Eastern Asia: 153 (7.7°
Cambodia: 6 (3%)
61

Indonesia: 1 11 (.6%)
Philippines: 1 10 (.5%)
Vietnam: 10 (.5%)
Lebanon: I 11 (.6%)
Other Eastern Africa: 0 (0%)
Egypt: 0 (0%)
South Africa: 0 (0%)
Other Western Africa: 2 (.1%)
Australia: 0 (0%)
Other Australian and New Zealand Subregion: 0 (0%)
Micronesia: 0 (0%)
Barbados: 7 (.3%)
Dominican Republic: 16 (,8%)
Jamaica: 14 (.7%)
Mexico: 0 (0%)
Costa Rica: 0 (0%)
El Salvador 17 (.8%)
Guatemala: 8 (.4%)
Argentina: 0 (0%)
Brazil: [ 6 (.3%)
Chile: 5 (.2%)
Colombia: 2 (.1%)
Ecuador: 2 (.1%)
Venezuela: 1 (0%)
Other South America: I 6 (.3%)
Canada: 129 (6.5%)
Income
Income Breakdown Households (%). _Less than $15,000: 1788 (18.8%)
.1.5,000 - $25,000: 1092 (11.5%)
$25,000 - $50,000: 2810 (29.5%)
$50.000 - $75,000: 2065 (21.7%)
Greater t ha n $75,000: I- 1808 (19.0%)
Tenure
Tenure Breakdown I Households (%)
Occupied Housing Units: [ 9518 (100.0%)
Owner Occupied: r 5864 (61.6%)
Renter Occupied r 3655 (38.4%)
62

EJ-6 (map with 6-mile circle, NO2 SIA, and locations of interest)
Hu tmgtonr0171,77
6 Mile Bufferof Site Location
IMitis
v
Woroneuk
teuth Quarter
Ile
UIC
Montgom ry
Aboutrutenlialawironmentallustice &teas
6.nrIamental fttlknx {E1,1Aresa sae bard4. the M CCM. E bac Gnxl, !wand* ry layer- themethalolog negd. determine how the aneas lie coded_ 6nve.I.,1Idgraffpng those block graupsVint percentage* in the toy 15% ofGe repon Jave.inrome seaident* *Anl,ka annoring&Low,tncone <v damn as 1,,,Jce the Peden! remerty travel.
0 2
irHasmer -ri soottv4
Ca ,,rt,,
a`
_011thVi:leks
Grp
fiiA
fillers
Corner
East amp tan
Southampton
outfit rnpton
'ivrarlson
,-,T110FS
Site Location
:dint 7 +.r
Holy ke
kr
Aga.11 'tat 6 011-
Geecling Hilk,,Va.5x-
begr:r;:he sut6.6.
• Pre-school
,t School
Mobile Home Community
al Elder Care Facility
Massachusetts LongTerm Care Residences
,o, Assisted Living Facility
LI Nursing Home
Rest Horne
Pioneer Valley Energy Facility
PVEC 1-hr NO2Significant impact Area
E7.1 PsiV9EniCk2.4-nthirrrvPilt.c2i5Are.
Massathusetts EnvironmentalJustice Populations
EZ3EPA Region 1Potential EnvironmentalJustice IEJ)AreaS
Low- lncome
Mlnority
Both
&EPAMap coaled by EPA Regien I GIS COltMdp TicdserlEi Ell 3E1 Noverrker 19,2611
Au., Map -Sing Maps, Ea ogle Eath, W11/2010,SthaaIs • MassCalS. NU: MA EJ Areas
Cem 14az,Z15. 2ob3,
63
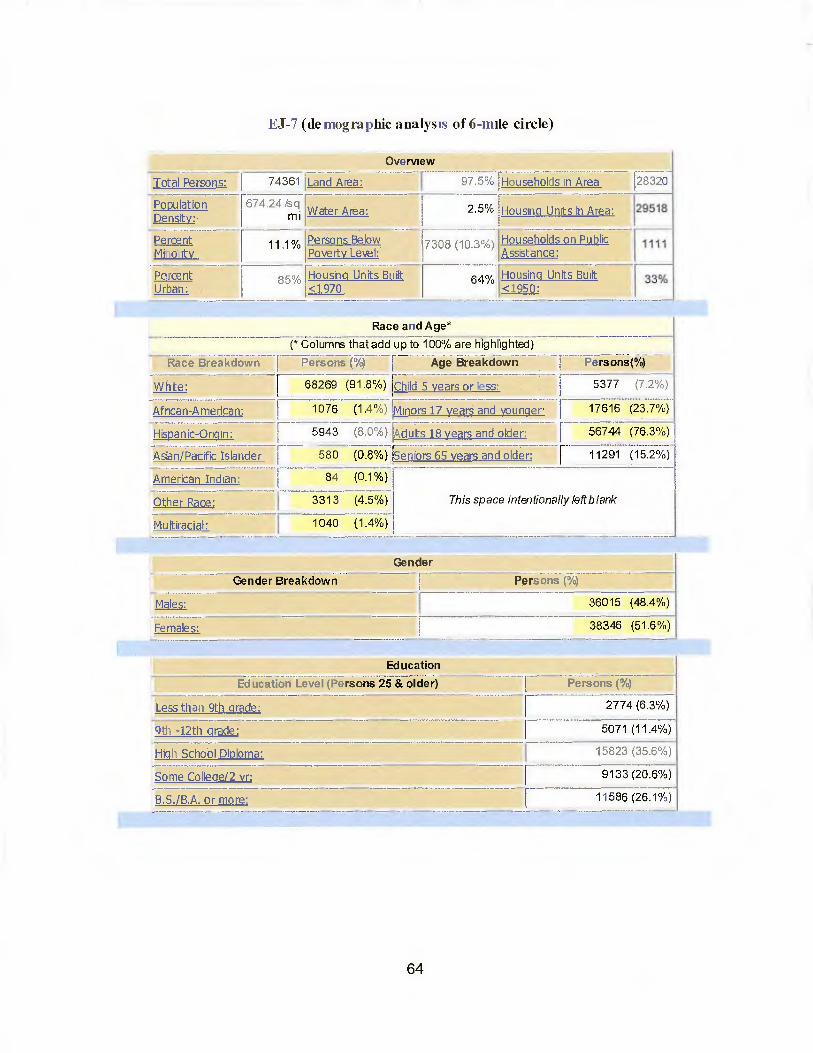
EJ-7 (demographic analysis of 6-mile circle)
Total Persons: I 74361
Population [674.24 Isgm i
Density:
Percent I 11.1%Minority:
Percent f 85%Urban: I
Overview
Land Area: [Households in Area: 2832097.5%
water Area: 2.5% Housing Units in Area: 29518
Persons Below 7308 (10.3%) Households on Public 1111Poverty Level: Assistance:
Housing Units Built 64% Housing Units Built 33%<1970: <1950:
Race and Age*
(* Columns that add up to 100% are highlighted)Race Breakdown Persons (%) 1 Age Breakdown Persons(%)
White: 68269 (91.8%)[Child 5 years or less: 5377
African-American: 1076 (1 .4%) Minors 17 years and younger: 17616
Hispanic-Origin: 5943 (8.0%)kduts 18 years and older: 56744
Asian/Pacific Islander: 580 (0.8%)[Seniors 65 years and older: r 11291
American Indian: 84 (0.1%)
This space intentionally left b lankOther Race: 3313 (4.5%)
Multiracial: 1040 (1.4%)
(7.2%)
(23.7%)
(76.3%)
(15.2%)
Males:
Females:
Gender Breakdown
Gender
T
Education
Education Level (Persons 25 & older)
Persons (%)
36015 (48.4%)
38346 (51.6%)
1 Persons (%)
Less than 9th grade: 2774 (6.3%)
9th -12th grade: 5071 (11.4%)
High School Diploma: 15823 (35.6%)
Some College/2 yr: I 9133 (20.6%)
B.S./B.A. or more: 11586 (26.1%)
64

Language
Ability to Speak English Persons (%)
Population Age 5 and Over: 69850
Speak only English: 59452 (85.1%)
Non-English at Home: 10398 (14.9%)
Speak English verywell:[
6082 (8.7%)
Speak English well: 2212 (3.2%)
Speak English not well: r 1544 (2.2%)
Speak English not at all: 560 (0.8%)
Speak English less than well: 2104 (3.0%)
Language Spoken
Language Spoken Persons (%)
Speak only English:t
59452 (85.1%)
Spanish or Spanish Creole: 4811 (6.9%)
French (incl. Patois, Cajun): 940 (1.3%)
French Creole: I 25 (0.0%)
Portuguese or Portuguese Creole: 242 (0.3%)
German: 152 (0.2%)
Other VVest Germanic Languages: 20 (0.0%)
Scandinavian Languages: 9 (0.0%)
Greek: 143 (0.2%)
Russian: 1037 (1.5%)
Polish: 1274 (1.8%)
Serbo-Croatian: 159 (0.2%)
Other Slavic Languages: 435 (0.6%)
Armenian: 6 (0.0%)
Persian: 15 (0.0%)
Hindi: 155 (0.i%)
Urdu: r 21 (0.0%)
Other Indic Languages: 0 (0.0%)
Other Indo-European Lanugages: 130 (0.2%)
Chinese: r 76 (0.1%)
Japanese:I
51 (0.1%)
Korean: I 24 (0.0%)
Mon-Khmer, Cambodian:[
59 (0.1%)
65

Miao, Hmong:
Vietnamese:
Other As ian Languages:
Tagalog:
Other Native North American Languages:
Hungarian:
Arabic:
Hebrew:
African Languages:
Non-English Speaking:
8 (0.0%)
60 (0.1%)
16 (0.0%)
42 (0.1%)
12 (0.0%)
10 (0.0%)
168 (0.2%)
6 (0.0%)
25 (0.0%)
10398 (14.9%)
Place of Birth for the Foreign-Born
Country i PersonsForeign-Born Population: I 4670
Europe:
Asia:
Africa:
r3046 (65.2%)804 (17.2%)
83 (1.8%)
Oceania: 6 (.1%)
Americas: 730 (15.6%)
United Kingdom: I- 196. (4.2%)
Ireland: 85 (1.8%)
Sweden: 1 (0%)
Other Northern Europe: 7 (.2%)
Austria: 18 (.4%)
France: 33 (.7/07
Germany: 213 (4.6%)
Netherlands: r 7 (.1%)
Other Western Europe: 13 (.3%)
Greece: v 1-----5T-F.-f6/-0-)
Italy: [ 182 (3.9%).Portugal: 115 (2.5%)
Spain: 1 8 (.2%)
Czechoslavakia: l 8 (.2%)
Hungary. 1-10 (.2%)
Poland: 1 695 (14.9%)
---3Belarus: E (.5%)
Russia: r 359 (7.7%)
Ukraine: I 693 (14.8%)
Bosnia and Herzegovina: E 24 (.5%)
Yugoslavia: 23 (.5%)
66

Other Eastern Europe:
Mainland China: [ 33 (.7%) It
nuriy nuily.
Taiwan: 8 (.2%)
Japan: 23 (.5%)
Korea: 73 (1.6%)
India: 65 (1.4%)
Iran: 22 (.5%)
Pakistan: 21 (.5%)
Other Central Eastern Asia: •• 247(5.3%)
Carnbodia: 31 (.7%)
Indonesia: 16 (.4%)
Laos: 8 (.2%)
Philippines: 58 (1.2%)
Vietnarrii [ 76 (1.6%)
Jordan: i---- 22 (.5%)
Lebanon: 39 (.8%)
Syria: r 5 (.1%)
Turkey: 9 (.2°;)
Other Western Asia: 10 (.2%)
Other Eastern Africa: 22 (.5%)
Egypt: 11 (.2%)
South Africa: 0 (0%)
Ghana: 2 (.1%)
Nigelia: 24 (.5%)
Other Western Africa: 1 6 (.1%)
Australia: I 0 (0%)
Other Australian and New Zealand Subregion: I 6 (.1%)
Micronesia: 0 (0%)
Barbados: 13 (.3%)
Cuba: 8 (.2%)
Dominican Republic: r 37 (.8%)
Jamaica: 47 (1%)
Trinidad Tobago: p 4 (.1%)Other Caribbean: 3 (.1%)
Mexico: 8 (.2%)
Costa Rica: 0 (0%)
El Salvador 28 (.6%)
Guatemala: 28 (.6%)
Panama: 3 (.1%)
Argentina: 30 (.6%)
Brazil: 32 (.7%)
Chile: F 5 (.1%)
67

Colombia: 41 (.9%)
Ecuador 10 (.2%)
Guyana: 1— 4 (.1%)
Venezuela: 15 (.3%)
Other South America:
Canada:
32 (.7%)
1 383 (8.2%)
Income
Income Breakdown Households (%)
Less than $15,000: 4337 (15.3%)
$15,000 - $25,000: 3208 (11.3%)
$25,000 - $50,000: 8001 (28.3%)
$50,000 - $75,000: 8450 (22.8%),
Greater than $75,000: 8351 (22.4%)
Tenure
ITenure Breakdown HousehOlds (%)
'Occupied Housing Units: 28320 (100.0%)
Owner Occupied: 19158 (67.6%)
Renter Occupied 9163 (32.4%)
68

EJ-8 (map with 8-mile circle, NO2 SIA, and locations of interest)
About Potential Environmental Instice Areas
11. litegon's PoisnEs1 Envirorimanial Nati iv (En Areal methe 2.960 leavens Kock Groirp Reendaly layer.
methaddogy uxd 00 afters.- thou the avail ere coded involved
identifying diose blob titscr.i with prrn±nuga3 m the top 35% efthe region lee So.-imam,. seMd,suli. inistior
Low-In.axne is deitmed zo twice the l'ederal Faysny Lawel.
0 2
1!,01,9a
. 751rAinptor
9sisinsin
Pre-school
School
Mobile Home Community
Elder Care Facility
Massachusetts LongTerm Care IllesidenceS
• Assisted Living Facility
El Nursing Home
• Rest Home
Pioneer Valley Energy Facility
PVEC ,-hr NO2Significant Impact Area
1:3 AVEC 24-hr Pir125Significant ImpactArea
Massachusetts EnvironmentalJustice Populations
EPA Region 1Potential EnvironmentalJUStite tEJ)Areas
Low-Income
Minority
Both
' E 4Map cleated by EPAPegiori 1215 CenlerMap Traceer IQ 8136 Kaye n-h er it. 1011
Arrldl - Ping Mips. rtry0 Earth. trtiti010,Schools - MeesGIS, 2:10, MA EJ Areas 12000
Censt.is) • !lass[--l5, 701:13
69

EJ-9 (demographic analysis of 8-mile circle)
Overview
Total Persons: 166413 Land Area: 97:1% Households in Area: 64551
Population 852.08 tgmi Water Area: 2.9% Housing Units in Area: 68010
Density:
Percent 21.9% Persons Below 25252 (15.7%) Households on Public 3913Minority: Poverty Level: Assistance:
Percent 91% Housing Units Built69%
Pousing Units Built 39%Urban: <1970: l<1950:
Race and Age*
(*Columns that add up to 100% are highlighted)
Race Breakdown Persons (%) I Age Breakdown Persons(%)
Whte: r 138703 (83.3%) iChild 5 Years or less: 13137 (7.9%)
African-American: 4048 (2.4%) Minors 17 years and younger: 42796 (25.7%)
Hisoan lc-Origin: 29700 (17.8%) Aduts 18 years and older: 123617 (74.3%)
Asian/Pacific Islander: 1648 (1,0%)[Seniors 65 years and older: 23964 (14.4%)
American Indian:• 246 (0.1%)
This space intentionally left blankOther Race: 18319 (11.0%)
Multiracial; 3449 (2.1%)
Gender
Gender Breakdown
Males:
Females:
Persons. (%)
79740 (47.9%)
86673 (52.1%)
Education
Education Level (Persons 25 & older) r Persons (%)
Less than 9th grade: 8877(9.0%)
9th -12th grade: 14279(14.4%)
High School Diploma: 35607(36.0%)
Some College/2 yr: 19293(19.5%)
B.S./B.A. or more:. 20797(21.0%)
70

Language
Ability to Speak English Persons (%)
Population Age 5 and Over. 155611
Speak only English. 118547 (76.2%)
Non-English at Home' 37064 (23.8%)
Speak English very well: 20883 (13A%)
Speak English well:
Speak English not well
8046 (5.2%)
5610 (3.6%)
Speak English not atall. 2525 (1.6%)
Speak English less than well: I 8135 (5.2%)
Language Spoken
Language Spoken r Persons C/0)
Speak only English: 118547 (76.2%)
Spanish or Spanish Creole: 23763 (15.3%)
French (incl. Patois, Cajun): 2817 (1.8%)................_.,....,..French Creole: 45 (0.0%)
Portuguese or Portuguese Creole: 984 (0.6%)
German: f 372 (0.2%)
Yiddish: I 1 (0.0%)
Other West Germanic Languages: I 43 (0,0%)
Scandinavian Languages: r 16 (0.0%)
Greek: I- 265 (0.2%)
Russian: [ 1869 (1.2%)
Polish: F 3456 (2.2%)
Serbo-Croatian: 1----- 198 (0.1%)
Other Slavic Languages: 556 (0.4%)
Armenian: 16 (0.0%)
Persian: 21 (0.0%)
Gujarathi: 16 (0.0%)
Hindi: 73 (0.0%)
Urdu: 101 (0.1%)
Other Indic Languages: 30 (0.0%)
Other Indo-European Lanugages: 222 (0.1%)
Chinese: 324 (0.2%)
Japanese: 1 135 (0.1%)
71

Korean: r 79(0.1%)
Mon-Khmer, Cambodian: r-- 101 (0.1%)Miao, Hmong: 12 (0.0%)
Thai: 9 (0.0%)
Laotian: 12 (0.0%)
Vietnamese: 235 (0.2%)
Other Asian Languages: 80 (0.1%)
Tagalog: 104 (0.1%)
Other Pacific Island Languages: 1 (0.0%)
Other Native North American Languages: 28 (0,0%)
Hungarian: 18 (0.0%)
Arabic: 277 (0.2%)
Hebrew: 15 (0.0%). _
African Languages: 65 (0.0%)
Non-English Speaking: F37064 (23.8%) I
Place of Birth for the Foreign-Born
Country Persons
Foreign-Born Population: 10509
Europe: 6083 (57.9%)
Asia: 1923 (18.3%)
Africa: 149 (1.4%)
Oceania: 10 (.1%)
Americas: (22.3%)
r12343
United Kingdom: f 310 (3%)
Ireland: 163 (1.5%)
Sweden: 7 (.1%)
Other Northern Europe: I 15 (.1%)
Austria: 1 33 (.3%)
France: r 67 (.6%)
Germany. 407 (3.9%)
Netherlands: f 14 (.1%)
Other Western Europe: 35 (.3%)
Greece: 93 (.9%)
Italy f 334 (32%)
Portugal: 645 (6.1%)
Spain: 20 (.2%)
Czechoslavakia: 19 (.2%)
Hungary: F-- 18 (.2%)
72

Poland: 1674 (15.9%)
Belarus: 95 (.9%)
Russia: 667 (6.3%)
Ukraine: 1006 (9.6%)
Bosnia and Herzegovina: 52 (.5%)
Yugoslavia: 42 (.4%)
Other Eastern Europe: 368 (3.5%)
Mainland China: 139 (1.3%)
Hong Kong: ---44 (.4%)
Taiwan: 19 (.2%)
Japan: 96 (.9%)
Korea: 135 (1.3%)
India: 170 (1.6%)
Iran: 32 (.3%)_...
Pgcli-F ------- -- --- -- '- 73 (.7%)
Other Central Eastern. Asia: 416 (4%)
Cambodia: 69 (.7%)
-Indonesia:
Laoi.-------------- _........
29 (.3%)
32 (.3%)
Philippines: 126 (1.2%)
Thailand:. 4 (0%)
Vietnam: 256 (2.4%)
Israel: 0 (0%)
Jordan: 50 (.5%)
Lebanon: 62 (.6%)
Syria: 19 (.2%)
Turkey: 1 37 (.4%)
Other Western Asia: [ 57 (.5%)
Other Eastern Africa: r 43 (.4%)r 11 (.1%)Egypt
South Africa: 1 (0%)
Ghana: 5 (0%)
Nigeria: 49 (.5%)
Sierra Leone: r 5 (0%)
Other Western Africa: I 6 (.1%)
Australia: r 4 MOOther Australian and New Zealand Subregion: r 6 (.1%)
Micronesia: r 0 (°%)Barbados: 1 34 (.3%)
Cuba: 32 (.3%)
Dominican Republic: r 286 (2.7%)
Jamaica: F-- 95 (.9°/0)Trinidad Tobago: I 25 (.2%)
73

Other Caribbean: 13 (.1%)
Mexico: 152 (1.5%)
Costa Rica: 8 (.1%)
El Salvador: 54 (.5%)
Guatemala: 1 43 (.4%)
Honduras: r- 2 (0%)
Panama: 18 (.2%)
Other Central America: 6 (.1%)
Argentina: 59 (.6%)
Brazil: 58 (.6%)
Chile: 5 (0%)
Colombia: I 260 (2.5%)
Ecuador: 42 (.4%)
Guyana: r 15 (.1%7)
Peru: I 12 (.1%)
Venezuela: 52 (.5%)
Other South America: 71 (.7%)
Canada: 1000 (9.5%)
Other North America: 0 (0%)
Income
Income Breakdown Households (%)
Less than $15,000: 13092 (20.3%)
$1.5,000 - $25,000: I 8221 (12.7%)
$25,000 -$50,000: 18658 (28.9%)
$50.000 - $75,000: 12977 (20.1%)
Greater than $75,000: 11691 (18.1%)
Tenure
Tenure Breakdown [ Households (%)
Occupied Housing Units: 64551 (100.0%)
Owner Occupied: 37422 (58.0%)
Re ter Occupied 27129 (42.0%)
74