exiopol deliverable d ii.2.c-2 scoping paper on i/o ... · namely herbicides and insecticides, ......
TRANSCRIPT

PROJECT N. 037033
EXIOPOL
A NEW ENVIRONMENTAL ACCOUNTING FRAMEWORK USING EXTERNALITY DATA AND INPUT-OUTPUT TOOLS FOR POLICY ANALYSIS
EXIOPOL DELIVERABLE D II.2.c-2
Scoping Paper on I/O–Methodology
Authors: Peter Fantke
Institute of Energy Economics and the Rational Use of Energy Universität Stuttgart
Susanne Wagner Institute of Energy Economics and the Rational Use of Energy Universität Stuttgart

Title D II.2.c-2: Scoping Paper on I/O–Methodology
Purpose
Filename DII.2.c-2_Scoping_Paper_on_I-O_Methodology.doc
Authors Peter Fantke, Susanne Wagner
Document history
Current version. 2.0
Changes to previous version.
Date 08 December 2009
Status Final
Target readership EXIOPOL Project Team
General readership
Dissemination level Restricted
Peter Fantke, Susanne Wagner Institute of Energy Economics and the Rational Use of Energy (IER) Universität Stuttgart
Date: December 08
Prepared under contract from the European Commission
Contract no 037033-2 Integrated Project in PRIORITY 6.3 Global Change and Ecosystems in the 6th EU framework programme
Deliverable title: Scoping Paper on I/O–Methodology. Deliverable no. : D II.2.c-2 Due date of deliverable: Month 30 Period covered: from 1st March 2007 to 1st March 2011 Actual submission date: 01 September 2009 Start of the project: 01 March 2007 Duration: 4 years Project coordinator organisation: FEEM

i
Preamble
The present Deliverable D II.2.c-2 contains the scoping of the approach to be used as basis for the impact-pathway analysis of the external costs of plant protection products, namely herbicides and insecticides, as applied in current agricultural practice, carried out in workstream WS II.2 of the EXIOPOL project.
In order to fit into the structure of EE I/O tables as defined to be used throughout the EXIOPOL project, it was decided upon the following boundary conditions, which in particular account for the data availability, level of detail and modelling constraints with respect to the estimation of impacts on human health and the environment due to the direct application of plant protection products across numerous agricultural produces:
As base year the year 2000 has been taken into account.
From the countries recommended being included in the overall impact assessment framework the EU-27 countries have been considered with respect to agricultural use of plant protection products, while all non-EU countries have been disregarded due to lack of data and modelling constraints.
The distinction of which agricultural produces had to be considered for the modelling approach behind the estimation of impacts on human health and the environment due to agricultural practice of plant protection products, is based on a differentiation according to the Global Trade Analysis Project (GTAP), i.e. the agricultural produces Rice, Wheat, Other cereals, Roots and tubers, Sugar crops, Pulses, Nuts, Oil crops, Vegetables, Fruits, Fibres, Other crops, Fodder crops, and Permanent pasture have been taken into account.
Note that biodiversity losses have not been taken into account as part of this work stream as this issue is considered to be of significant importance and, hence, impacts on biodiversity have been elaborated in a separate work stream (WS II.3).
Whereas the methodological framework and implications for the implementation into a modelling approach are described in detail in Deliverable D II.2.a-2B, and the monetary implications by deriving marginal external cost estimates at country level, aggregated over all agricultural commodities are described in detail in Deliverable D II.2.c-1, the present Deliverable focuses on the linkage between the aggregated unit values per country and the commodity-specific unit values per country, i.e. damages expressed in monetary terms (Euro) per kg applied herbicide or insecticide, linked to the economic product categories (commodity) in the EXIOPOL I/O tables. Different scientific publications on a later stage will include more explanations and justifications for the methodology and approaches.
Peter Fantke
December, 2009

ii
Executive Summary
Overview
This report is the scoping paper of the EXIOPOL project on the I/O–Methodology regarding the agricultural use of pesticides in Europe. While according to the DoW of EXIOPOL a lot has been done in the regard of externality estimation from related emissions in the areas of energy production/conversion and transport, there are still significant gaps, e.g. in the agricultural sector. On the basis of a sound gap analysis, EXIOPOL will look at important emission-endpoint pathways for which externalities have not been calculated adequately yet and, thus, is a project of integrated environmental Health Impact Assessment (HIA) using the full chain approach.
In line with the overall objective of EXIOPOL, the purpose of work packages WPII.2.a and WPII.2.c is to conceptually develop and adapt the impact-pathway methodology to the impact chain of nutrients and pesticides and provide, as a result, unit values for both substance groups. With respect to pesticides, hereafter referred to as plant protection products, unit values are presented aggregated over all agricultural commodities in Deliverable D II.2.c-1.
In order to provide a better understanding of the mechanisms and the approach behind the aggregated unit values, which directly link the external costs to the agricultural practice rather than linking the unit values to the agricultural practice related to a particular agricultural produce of interest, this Deliverable links the aggregated unit values to the individual agricultural commodities of concern.
The aggregated unit values are to be further used in Cluster III and Cluster IV of the EXIOPOL project as described in more detail in the subsequent chapters. The EXIOPOL project has started in March 2007 and will run until March 2011.
Approach
For calculating unit values for the agricultural sector, in particular with respect to the use of plant protection products in good agricultural practice in the year 2000, it is necessary to take the various agricultural commodities, such as rice, wheat, fruits, pulses, vegetables, etc. into account. This is due to the fact that substances show a different behaviour when it comes to different deposition surfaces (usually the area of the leaves and fruits of a plant), advection uptake pathways into the crop (e.g. deposit onto leaf surface, xylem driven uptake via the root system), etc. (Trapp, 2007), Trapp and Mc Farlane (1995), Mackova et al., 2006).
Plant uptake models are used for predicting environmental fate and exposure behaviour of a wide range of chemicals including currently used plant protection products and for estimating environmental concentrations, food residues and related impacts on humans and the environment. However, most of the available models are rather generic, run in steady state and usually only take diffuse emissions into account rather than directly applied dosages, as for instance described in the Technical Guidance Documents of the current exposure and risk assessment framework for chemicals in the EU (European Commission, 2003). Furthermore, maximum residue levels in (processed) food products, if available, have mostly been set only according to lower determination limits (European Commission, 2009).

iii
Figure 0-1: Procedural steps in the approach to estimate and evaluate impacts on human health and ecosystems due to direct application of plant protection products onto specific agricultural commodities according to current agricultural practice. 1: environmental fate assessment, 2: exposure assessment, 3: human health and ecosystem impact assessment, 4: Severity and external cost assessment.
A dynamic modelling approach to provide better understanding of the complex behaviour of directly applied plant protection products in the plant-environment system and to estimate residues in a wide range of different common food produces effectively harvested and processed for human consumption has been, thus, developed within the frame of the EXIOPOL project. The basic steps in that approach follow the theoretical construct as shown in Figure 0-1
The focus lays on the evolution of the chemical’s masses in various compartments in each crop-environment system over time, which, with respect to plant protection products is the time from the chemical’s application to the harvest of the agricultural produce of concern. The model accounts for several crops and their specifics, such as paddy water

iv
for rice and the distinction between leaves and fruits for cereals. For further details see foreseen publications and Fantke et al. (2010).
Some of the most important output parameters of the modelling system, i.e. the commodity-specific effective harvest fraction [kgin harvest/kgapplied] and/or the food produce-specific effective intake fraction [kgtaken in/kgapplied], are further used to be combined with the total mass of plant protection products applied in each country and human health as well as ecotoxicity effect information to finally arrive at unit values for each considered country (see following chapters), either as aggregated values over all agricultural commodities as described in Deliverable D II.2.c-1, or as commodity-specific unit values as described in detail in the present Deliverable.

v
Table of contents
Preamble ..................................................................................................................................i
Executive Summary............................................................................................................... ii
1 Definition of the System and its Boundaries.................................................................1
1.1 Temporal Aspects ....................................................................................................2 1.2 Spatial Aspects ........................................................................................................2
2 Assumptions....................................................................................................................3
2.1 Harmonisation of model input at EU level............................................................3 2.2 Harmonisation across different agricultural produces .........................................4
3 Crop-specific Assessment of Fate, Exposure, Impacts and Damages ..........................8
4 Crop-specific Unit Values due to Impacts on Human Health ....................................15
4.1 Crops-specific Unit Values – Overview................................................................15 4.2 Crops-specific Unit Values – Rice ........................................................................18 4.3 Crops-specific Unit Values – Wheat.....................................................................19 4.4 Crops-specific Unit Values – Other Cereals ........................................................20 4.5 Crops-specific Unit Values – Roots and Tubers ..................................................21 4.6 Crops-specific Unit Values – Sugar Crops...........................................................22 4.7 Crops-specific Unit Values – Pulses.....................................................................24 4.8 Crops-specific Unit Values – Nuts .......................................................................25 4.9 Crops-specific Unit Values – Oil Crops................................................................26 4.10 Crops-specific Unit Values – Vegetables .............................................................27 4.11 Crops-specific Unit Values – Fruits .....................................................................28 4.12 Crops-specific Unit Values – Fibres .....................................................................30 4.13 Crops-specific Unit Values – Other Crops ...........................................................31 4.14 Crops-specific Unit Values – Fodder Crops .........................................................32 4.15 Crops-specific Unit Values – Permanent Pasture...............................................33
5 Conclusions and Outlook ..............................................................................................35
List of References..................................................................................................................36
Annex I: Differentiation of Agricultural Produces (NACE 1.1)..........................................41
Annex II: Consumption Distribution of different Agricultural Commodities ...................42
Annex III: Application Distribution to different Agricultural Commodities.....................43
Annex IV: Production Area Distribution of different Agricultural Commodities .............45
Annex V: Crop-specific Unit Values for different Human Health End-points ..................48

Report on Unit Values of Pesticides.
1
List of Figures
Figure 0-1: Procedural steps in the approach to estimate and evaluate impacts on human health and ecosystems due to direct application of plant protection products onto specific agricultural commodities according to current agricultural practice. 1: environmental fate assessment, 2: exposure assessment, 3: human health and ecosystem impact assessment, 4: Severity and external cost assessment. ..............................................................................................................iii
Figure 4-1: Rice crop-specific distribution of unit values [Euro2000·kg–1applied] for human health cancer cases for herbicides and insecticides, respectively, in Europe for the year 2000, compared to country-specific production area [1000 ha]............................................................................................................................ 18
Figure 4-2: Rice crop-specific distribution of unit values [Euro2000·kg–1applied] for human health non-cancer cases for herbicides and insecticides, respectively, in Europe for the year 2000, compared to country-specific production area [1000 ha]............................................................................................................................ 19
Figure 4-3: Wheat crop-specific distribution of unit values [Euro2000·kg–1applied] for human health cancer cases for herbicides and insecticides, respectively, in Europe for the year 2000, compared to counrtry-specific production area [1000 ha]............................................................................................................................ 20
Figure 4-4: Wheat crop-specific distribution of unit values [Euro2000·kg–1applied] for human health non-cancer cases for herbicides and insecticides, respectively, in Europe for the year 2000, compared to counrtry-specific production area [1000 ha]............................................................................................................................ 20
Figure 4-5: Other Cereals crop-specific distribution of unit values [Euro2000·kg–
1applied] for human health cancer cases for herbicides and insecticides, respectively, in Europe for the year 2000, compared to counrtry-specific production area [1000 ha]. ..................................................................................... 21
Figure 4-6: Other Cereals crop-specific distribution of unit values [Euro2000·kg–
1applied] for human health non-cancer cases for herbicides and insecticides, respectively, in Europe for the year 2000, compared to counrtry-specific production area [1000 ha]. ..................................................................................... 21
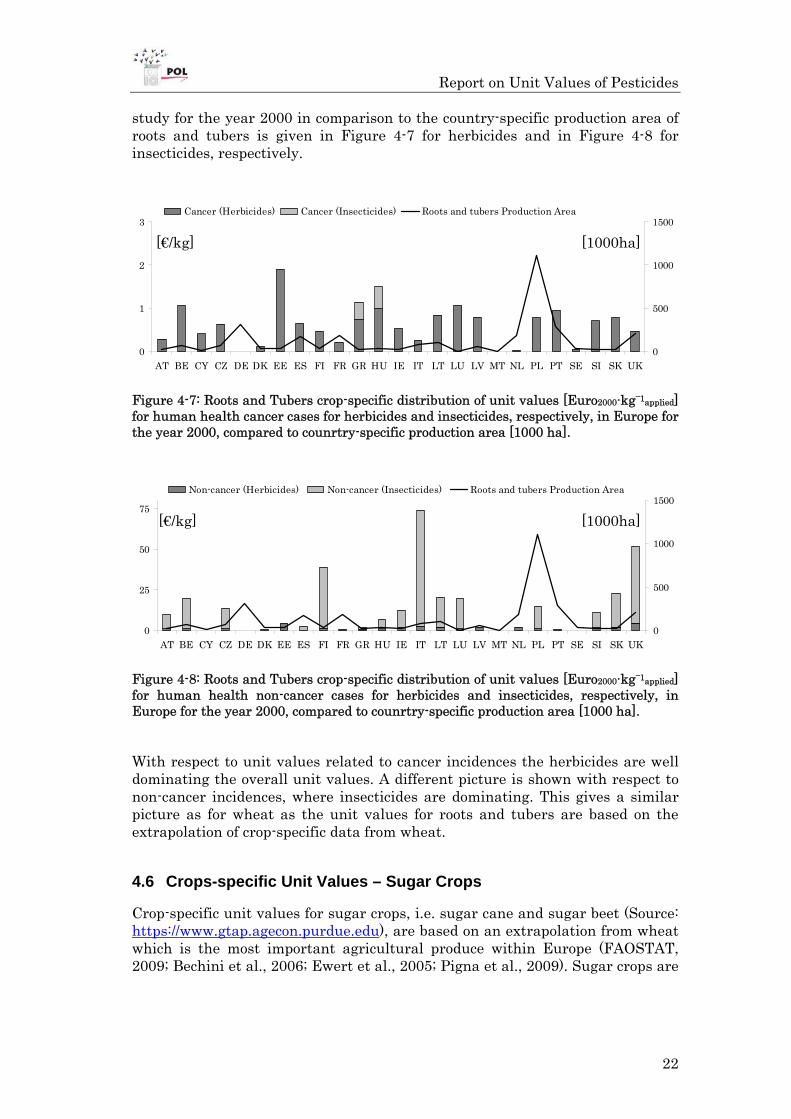
Figure 4-7: Roots and Tubers crop-specific distribution of unit values [Euro2000·kg–1applied] for human health cancer cases for herbicides and insecticides, respectively, in Europe for the year 2000, compared to counrtry-specific production area [1000 ha]. ........................................................................ 22
Figure 4-8: Roots and Tubers crop-specific distribution of unit values [Euro2000·kg–1applied] for human health non-cancer cases for herbicides and insecticides, respectively, in Europe for the year 2000, compared to counrtry-specific production area [1000 ha]. ........................................................................ 22
Figure 4-9: Sugar Crops crop-specific distribution of unit values [Euro2000·kg–
1applied] for human health cancer cases for herbicides and insecticides, respectively, in Europe for the year 2000, compared to counrtry-specific production area [1000 ha]. ..................................................................................... 23

Report on Unit Values of Pesticides.
2
Figure 4-10: Sugar Crops crop-specific distribution of unit values [Euro2000·kg–
1applied] for human health non-cancer cases for herbicides and insecticides, respectively, in Europe for the year 2000, compared to counrtry-specific production area [1000 ha]. ..................................................................................... 23
Figure 4-11: Pulses crop-specific distribution of unit values [Euro2000·kg–1applied] for human health cancer cases for herbicides and insecticides, respectively, in Europe for the year 2000, compared to counrtry-specific production area [1000 ha]............................................................................................................................ 24
Figure 4-12: Pulses crop-specific distribution of unit values [Euro2000·kg–1applied] for human health non-cancer cases for herbicides and insecticides, respectively, in Europe for the year 2000, compared to counrtry-specific production area [1000 ha]............................................................................................................................ 24
Figure 4-13: Nuts crop-specific distribution of unit values [Euro2000·kg–1applied] for human health cancer cases for herbicides and insecticides, respectively, in Europe for the year 2000, compared to counrtry-specific production area [1000 ha]............................................................................................................................ 25
Figure 4-14: Nuts crop-specific distribution of unit values [Euro2000·kg–1applied] for human health non-cancer cases for herbicides and insecticides, respectively, in Europe for the year 2000, compared to counrtry-specific production area [1000 ha]............................................................................................................................ 25
Figure 4-15: Oil Crops crop-specific distribution of unit values [Euro2000·kg–
1applied] for human health cancer cases for herbicides and insecticides, respectively, in Europe for the year 2000, compared to counrtry-specific production area [1000 ha]. ..................................................................................... 26
Figure 4-16: Oil Crops crop-specific distribution of unit values [Euro2000·kg–
1applied] for human health non-cancer cases for herbicides and insecticides, respectively, in Europe for the year 2000, compared to counrtry-specific production area [1000 ha]. ..................................................................................... 27
Figure 4-17: Vegetables crop-specific distribution of unit values [Euro2000·kg–
1applied] for human health cancer cases for herbicides and insecticides, respectively, in Europe for the year 2000, compared to counrtry-specific production area [1000 ha]. ..................................................................................... 28
Figure 4-18: Vegetables crop-specific distribution of unit values [Euro2000·kg–
1applied] for human health non-cancer cases for herbicides and insecticides, respectively, in Europe for the year 2000, compared to counrtry-specific production area [1000 ha]. ..................................................................................... 28
Figure 4-19: Fruits crop-specific distribution of unit values [Euro2000·kg–1applied] for human health cancer cases for herbicides and insecticides, respectively, in Europe for the year 2000, compared to counrtry-specific production area [1000 ha]............................................................................................................................ 29
Figure 4-20: Fruits crop-specific distribution of unit values [Euro2000·kg–1applied] for human health non-cancer cases for herbicides and insecticides, respectively, in Europe for the year 2000, compared to counrtry-specific production area [1000 ha]............................................................................................................................ 29
Report on Unit Values of Pesticides.
3
Figure 4-21: Fibres crop-specific distribution of unit values [Euro2000·kg–1applied] for human health cancer cases for herbicides and insecticides, respectively, in Europe for the year 2000, compared to counrtry-specific production area [1000 ha]............................................................................................................................ 30
Figure 4-22: Fibres crop-specific distribution of unit values [Euro2000·kg–1applied] for human health non-cancer cases for herbicides and insecticides, respectively, in Europe for the year 2000, compared to counrtry-specific production area [1000 ha]............................................................................................................................ 30
Figure 4-23: Other Crops crop-specific distribution of unit values [Euro2000·kg–
1applied] for human health cancer cases for herbicides and insecticides, respectively, in Europe for the year 2000, compared to counrtry-specific production area [1000 ha]. ..................................................................................... 31
Figure 4-24: Other Crops crop-specific distribution of unit values [Euro2000·kg–
1applied] for human health non-cancer cases for herbicides and insecticides, respectively, in Europe for the year 2000, compared to counrtry-specific production area [1000 ha]. ..................................................................................... 32
Figure 4-25: Fodder Crops crop-specific distribution of unit values [Euro2000·kg–
1applied] for human health cancer cases for herbicides and insecticides, respectively, in Europe for the year 2000, compared to counrtry-specific production area [1000 ha]. ..................................................................................... 33
Figure 4-26: Fodder Crops crop-specific distribution of unit values [Euro2000·kg–
1applied] for human health non-cancer cases for herbicides and insecticides, respectively, in Europe for the year 2000, compared to counrtry-specific production area [1000 ha]. ..................................................................................... 33
Figure 4-27: Permanent Pasture crop-specific distribution of unit values [Euro2000·kg–1applied] for human health cancer cases for herbicides and insecticides, respectively, in Europe for the year 2000, compared to counrtry-specific production area [1000 ha]. ........................................................................ 34
Figure 4-28: Permanent Pasture crop-specific distribution of unit values [Euro2000·kg–1applied] for human health non-cancer cases for herbicides and insecticides, respectively, in Europe for the year 2000, compared to counrtry-specific production area [1000 ha]. ........................................................................ 34

Report on Unit Values of Pesticides.
1
List of Tables
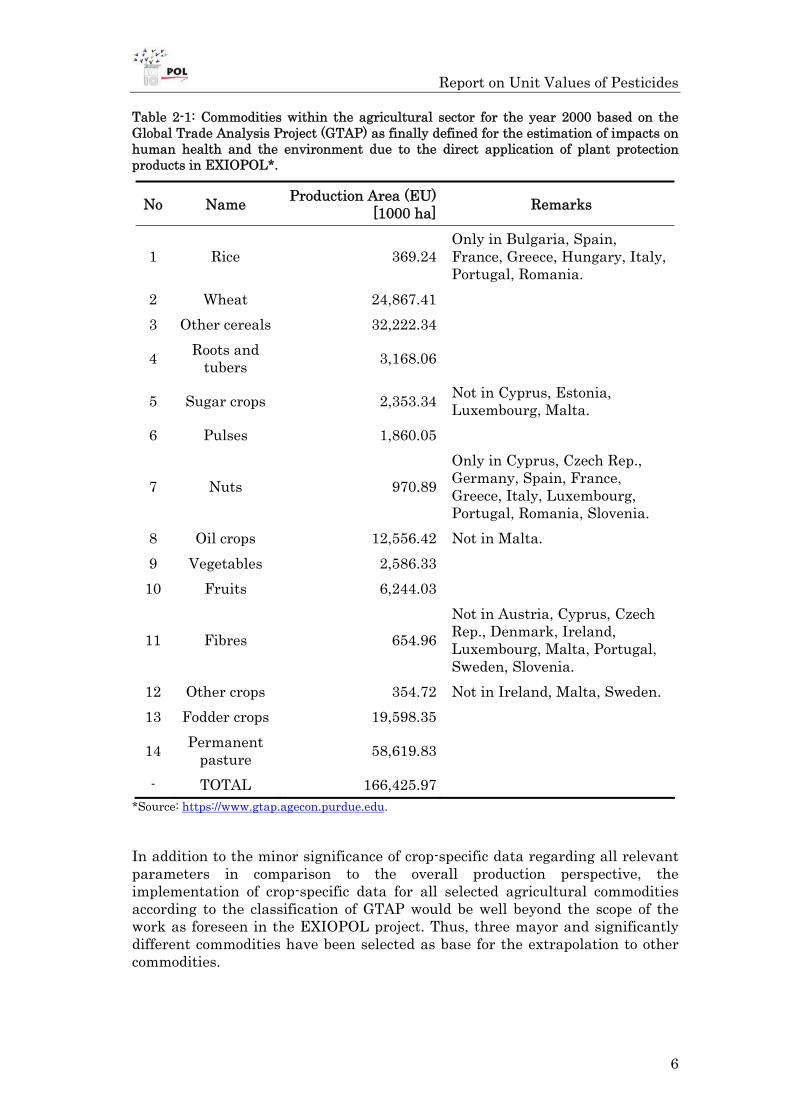
Table 2-1: Commodities within the agricultural sector for the year 2000 based on the Global Trade Analysis Project (GTAP) as finally defined for the estimation of impacts on human health and the environment due to the direct application of plant protection products in EXIOPOL*. ................................................................ 6
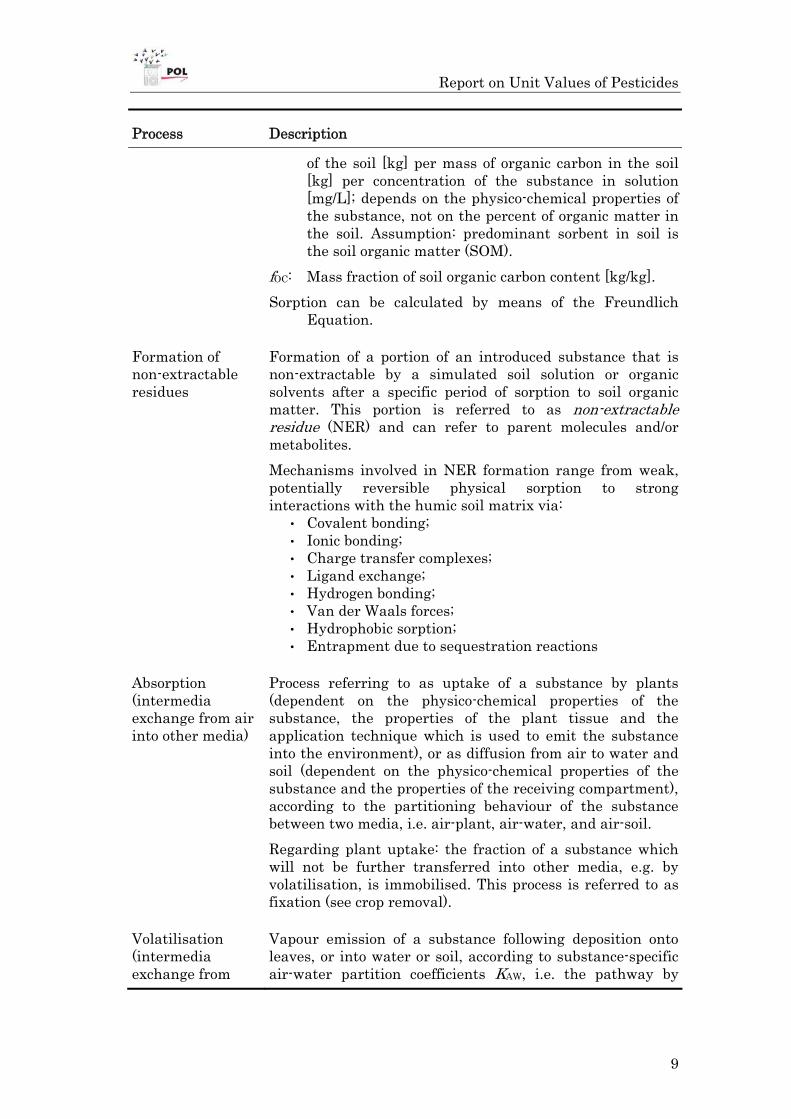
Table 3-1: Environmental fate processes that are considered with respect to a plant protection product’s degradation in and the transfer between environmental and plant compartments................................................................. 8
Table 3-2: Overview of different food processes for wheat as incorporated into the effective food processing factor for the pathway from harvest to intake in the EXIOPOL impact assessment of plant protection products................................. 13
Table 4-1: Crop-specific unit values [Euro2000·kg–1applied·year–1] for human health aggregated over all human health end-points for the year 2000 for herbicides. 15
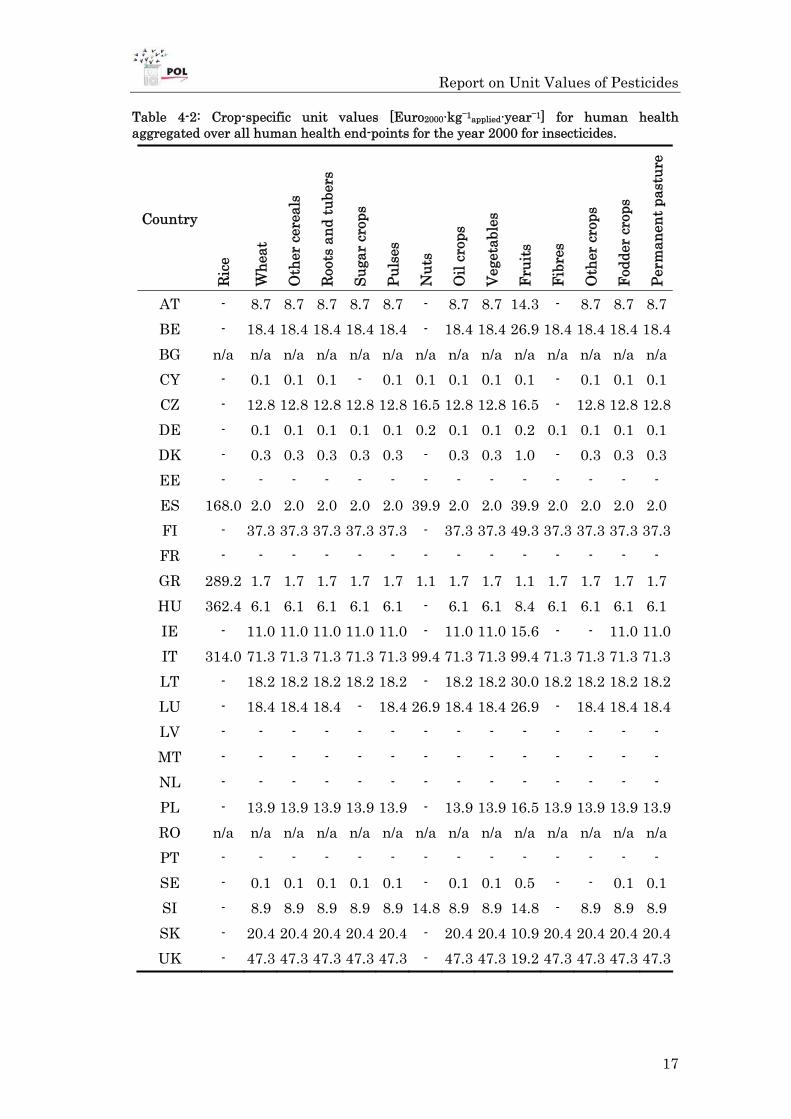
Table 4-2: Crop-specific unit values [Euro2000·kg–1applied·year–1] for human health aggregated over all human health end-points for the year 2000 for insecticides.................................................................................................................................. 17
Table Annex 1: Sectors as defined in Table A III.2 of EXIOPOL Deliverable D III.1.a: Code and level correspond with NACE 1.1; a letter is used if an own sub-classification had to be used. .......................................................................... 41
Table Annex 2: Consumption amount of commodities within the agricultural sector for the year 2000 as used for the estimation of impacts on human health and the environment due to the direct application of plant protection products in EXIOPOL*. ............................................................................................................. 42
Table Annex 3: Fraction of application amount of most important plant protection products as used in this study for the year 2000 to the overall amount applied in the considered countries (sum over herbicides and insecticides). ...... 43
Table Annex 4: Fraction of production area of the agricultural commodities categorised according to GTAP as used in this study for the year 2000 to the overall agricultural production area in each country (Part I).............................. 45
Table Annex 5: Fraction of production area of the agricultural commodities categorised according to GTAP as used in this study for the year 2000 to the overall agricultural production area in each country (Part II). ........................... 46
Table Annex 6: Crop-specific unit values [Euro2000·kg–1applied·year–1] for human health (cancer incidences) for the year 2000 for herbicides for all considered countries.................................................................................................................. 48
Table Annex 7: Crop-specific unit values [Euro2000·kg–1applied·year–1] for human health (non-cancer incidences) for the year 2000 for herbicides for all considered countries.................................................................................................................. 49
Table Annex 8: Crop-specific unit values [Euro2000·kg–1applied·year–1] for human health (cancer incidences) for the year 2000 for insecticides for all considered countries.................................................................................................................. 50

Report on Unit Values of Pesticides.
2
Table Annex 9: Crop-specific unit values [Euro2000·kg–1applied·year–1] for human health (non-cancer incidences) for the year 2000 for insecticides for all considered countries. .............................................................................................. 52
Report on Unit Values of Pesticides.
1
1 Definition of the System and its Boundaries
It is one of the objectives of the EXIOPOL project to set up an environmentally extended (EE) Input-Output (I/O) framework in which as many external cost estimates as possible are included, allowing the estimation of environmental impacts and external costs of different economic sector activities, including agriculture, final consumption activities and resource consumption for countries in the EU. According to the «definition study for EE IO database» Supply and Use Tables (SUT) and Input-Output Tables (IOT) form a key component in national economic accounting systems. Thus, within EXIOPOL, such SUT are provided for each economic sector, e.g. agriculture.
Whereas the concern regarding most other industrial sectors is often only related to diffuse emissions into air as well as direct and/or indirect releases into (fresh-) water, the view is a different one when it comes to agriculture. Here, in particular when considering the use of plant protection products, the main issue is related to substances directly applied onto the phytosphere, i.e. the surface deposits of the crops that are to be protected; the target organisms, i.e. usually other plants, insects or organisms that act as pests against the crop of interest; and last but not least the surrounding environment nearby. Hence, it is not necessary to calculate to what extent the agricultural sector contributes to the overall emissions of plant protection products as it is the only economic sector emitting these substances along with a much smaller amount originating in private households.
Trade of food products at both the national and the international scale significantly influences the distribution pattern of residues in food. However, the focus in this study is rather on the producer’s perspective than on the consumer’s perspective due to the fact that the I/O tables are referring to economic sectors, i.e. in this study to the agricultural sector. Thus, the consumption pattern of the agricultural commodities within the geographical range of the considered countries does not need to be taken into account. Whenever the reader wishes to switch from the producer’s to the consumer’s perspective, for instance when it comes to investigating site-specific differences of individual risks rather than focussing of the externalities of complex economies at the country level as is one of the objectives of the EXIOPOL project, then he finds the consumption amount of various food produces in the annex of this report (see Table Annex 2).
In general, contamination of food products is a mayor public concern (EFSA, 2006), and thus the impacts on human health and the environment due to direct application of plant protection products in Europe may play a significant role in the present EE I/O framework.
As it is of particular importance in the context of the EE I/O framework of the EXIOPOL project, that emissions and, thus, related damages should be connected to industrial sectors rather than to products or commodities, the country-specific unit values with respect to the current agricultural use of plant protection products are aggregated over all agricultural produces in the Deliverable D II.2.c-1. However, as the impacts are originally calculated on the

Report on Unit Values of Pesticides.
2
base of individual agricultural commodities, the present Deliverable aims at linking the aggregated unit values to the dis-aggregated, i.e. product-specific unit values per country.
1.1 Temporal Aspects
In line with the definition study for the EE I/O database of the EXIOPOL project, the base year for the primary data will be 2000, since for later years not sufficient SUT or IOT are available. If, however, resources permit this, a data set for 2005 or later will be constructed via simple extrapolation of SUT, and using trade data for this year, but has so far not been considered for the application of plant protection products.
1.2 Spatial Aspects
Generally, based on criteria like GDP, trade with Europe, and embodied impacts in products, the following countries have been selected to be included in the I/O methodology: EU-27, United States, Japan, China, Canada, South Korea, Brazil, India, Mexico, Russia, Australia, Switzerland, Turkey, Taiwan, Norway, Indonesia and South Africa. However, with respect to the application of plant protection products as part of current agricultural practice, only the EU-27 countries have been agreed of being effectively considered for two reasons:
Whereas within the EU, there exists a harmonised procedure for the authorisation, registration and use of plant protection products through international guidelines, such as the European Council Directive 91/414/EEC (European Commission, 1991), this does not account for countries outside the EU. This means, that in non-EU countries a wide range of plant protection products may be and is used, which may be not allowed on the European market. This makes it particularly difficult to compare substances, which are only officially used in some countries outside the EU with substances, of which the use is authorised within the EU-27.
It is beyond the scope of this project to gather data with respect to application amounts of plant protection products as used in countries outside the EU, e.g. the use of numerous active ingredients in South Korea or Mexico, which may not be used somewhere else. Thus, the estimation of human health and ecosystem damages within the boundaries of the EU due to the import from countries outside the EU, where we have restricted access to information about the application of plant protection products, is based on measurements of residues in e.g. food products. This information is neither available for the most of the countries within the EU, and, in particular, not available at all for countries, such as South Korea.
Among the countries of the EU-27, it might still not be clear, which active ingredient has been used to what extent in which country. But as there exists a harmonised authorisation procedure for all EU countries, a homogenous mix is assumed whenever more detailed information are not available (for more details about assumptions regarding the harmonisation of information among EU-27 countries, please refer to Section 2.1).

Report on Unit Values of Pesticides.
3
2 Assumptions
2.1 Harmonisation of model input at EU level
Compared to most of the currently available approaches to estimate impacts on human health and the environment due to the direct application of plant protection products, which are limited to rather small areas, i.e. river catchments, the present study has been carried out at the pan-European level, taking into account the production areas of various agricultural produces of 27 different countries. This is due to the fact that it is one of the objectives of the EXIOPOL project to synthesise and develop further estimates of the external costs of key environmental impacts of different economic sector activities including agriculture for Europe.
As most data sets that are required for the approach to estimate human health and environmental impacts due to direct application of plant protection products are available for the whole EU-27, if at all, only at a very aggregated level, various assumptions had to be made in order to extrapolate from either smaller geographic regions, such as communal administrative units or river catchments, or from information that is available only for a particular set of countries to cover the whole EU-27. The most important assumptions with respect to input data as required for a pan-European impact pathway approach are as follows:
It has not been distinguished between different formulation types of one and the same plant protection product as used for different purposes, such as use in nursery cabinet or direct soil application in the field. This is due to the fact that on the one hand there is only rarely, if at all, any information available about different formulation types as used for different purposes or at different weather conditions or in different regions.
On the other hand, degradation in the environment and, in particular, in the target agricultural produce, is always so quick that only the final application has been considered to lead to any residue in the finally consumed product. Thus, the formulation type of a plant protection product has per default been set to the standard for each product as given e.g. in Tomlin (2006) or AERU (2009), thereby following the guidelines as described in GCPF (2008).
The application type has per default been set to air (spray) for all applied plant protection products for the following agricultural produces: wheat, other cereals, sugar crops, pulses, nuts, oil crops, vegetables, fruits, fibres, other crops, fodder crops and permanent pasture.
In contrast to that, the application type has per default been set to water (add-on) for all plant protection products for the agricultural produce (paddy) rice, whereas the application type has per default been set to soil (surface) for all plant protection products for the agricultural produces roots and tubers. This goes in line with current agricultural practice and the formulation types of each active ingredient and its particular use for application according to GCPF (2008) and Tomlin (2006).

Report on Unit Values of Pesticides.
4
Plant protection products declared as currently used somewhere in the EU have not been checked against other products with similar modes of action, i.e. some of the modelled compounds may be used as substitute or alternatives for/to each other. Thus, the sum of all impacts for these compounds may so far lead to an overestimation of the overall impacts.
Whenever a plant protection product is declared as currently used somewhere in the EU for a particular agricultural produce, it has been homogenously distributed over the whole production area, thereby disregarding regional disparities in product application due to different environmental conditions, such as temperature and relative air humidity etc.
This is due to the fact that almost no information is available for the geographical range of use of a plant protection product, its dependency on particular climate or other conditions or where one compound is preferred for other reasons, all this at resolutions beyond country-level.
In contrast to the rather rare and/or incomplete data sets related to the use, emissions, application to specific agricultural commodities etc. of plant protection products, the data related to the physicochemical properties of the selected substances, are rather comprehensive. These data were collected from a wide range of available resources, e.g. most importantly from AERU (2009), Tomlin (2006), US-EPA (2008) and Mackay (2006). However, as for some reason, degradation half lives in air are not part of the assessment when one wants to have a new plant protection product authorised under the European guidelines, i.e. Council Directive 91/414/EEC (European Commission, 1991), these values are specifically taken from US-EPA (2008). For more information of physicochemical properties of the selected plant protection products please refer to Deliverable D II.2.c-1.
2.2 Harmonisation across different agricultural produces
According to Trapp and Kulhanek (2006), the environmental fate behaviour of a plant protection product depends on the combination between the product and the environmental system of the agricultural produce where it is applied to.
As an example, if a plant protection product is used in a paddy-rice environment, it undergoes completely different pathways as it would do when sprayed onto a fruit tree or when applied to a wheat soil. In order to meet the requirements for modelling all the considered plant protection products in a crop-specific way, many data are to be gathered with respect to different properties and characteristic parameters of different agricultural produces.
However, some of these parameters and property data are available for some of the agricultural produces as considered in the EXIOPOL project. In contrast, for most of the parameters and property data generic values have been introduced wherever crop-specific values were not available for all agricultural produces, based on best available knowledge or taken from existing data for one or more well investigated agricultural produces of concern. Some of the most important crop-intrinsic parameters are listed in the following:
Life-time data, i.e. the date when a crop starts to grow, datecrop,t0 [date], the date when a particular substance of concern is applied to the crop of concern, datecrop,app [date], and the date when the crop is harvested, datecrop,harv [date];

Report on Unit Values of Pesticides.
5
Average yield of crop, Mcrop,yield [kg/m2];
Crop-specific substance capture coefficient, CSScrop [dimensionless];
Transpiration coefficient, ETH2O,crop [L/kg];
Leaf area index and fruit area index, LAIcrop and FAIcrop [dimensionless];
Density of crop components, ρcrop,compartment [kg/L], e.g. of the root compartment;
Water, lipid, and gas pore content, respectively, of crop components, C[water/lipid/gas],crop,compartment [kg/kg];
Food processing factor, FPcrop [dimensionless];
Etc.
For most of these parameters, an extensive literature review has been conducted in order to implement crop-specific data for at least the most important ones of the agricultural commodities as selected for the present study – for demonstration only, we selected rice and wheat as the two most important commodities throughout the world and give some references for parameters intrinsic to these two commodities in the following:
for instance, life time data for specifically for paddy rice can be found in Capri and Karpouzas (2008), Yoshida (1981) and for wheat e.g. in Charles (2004); average yield for various crops in FAOSTAT (2009), for rice in Capri (2008), Bouman et al. (2007) and for wheat in Charles (2004); substance capture coefficients for various cereals in Charles (2004); transpiration coefficients for rice, wheat and other crops in Willmer and Fricker (1996), Cohen (1996) and Keller et al. (1997); leaf area index for rice in Stroppiana et al. (2006) and for wheat in Bavec et al. (2007); densities of different components of rice in Walker et al. (2009) and for generic crops in Trapp (2002); water, lipid and gas pore content, respectively, for rice in Yoshida (1981), for wheat in Yoshida (1981) and for generic crops in Trapp and Mc Farlane (1995), Trapp (2007); and finally for the food processing factor of rice in Saka et al. (2008), Kaushik et al. (2009) and for wheat in Sharma et al. (2005), Alnaij and Kadoum (1979), Uygun et al. (2005) and in Wilkin and Fishwick (1981). For food processing factors of wheat please also see Table 3-2.
However, from the perspective of the whole agricultural market, the differences between the considered agricultural produces are of minor importance compared to the level of production within a country, which significantly influences the range of the estimated impacts on human health and the environment as mostly only the production of two or three different agricultural produces are predominant in each country. The production areas for the various agricultural produces as used for the EXIOPOL project for each considered country are given in Table 2-1.
Report on Unit Values of Pesticides.
6
Table 2-1: Commodities within the agricultural sector for the year 2000 based on the Global Trade Analysis Project (GTAP) as finally defined for the estimation of impacts on human health and the environment due to the direct application of plant protection products in EXIOPOL*.
No Name Production Area (EU)
[1000 ha]Remarks
1 Rice 369.24Only in Bulgaria, Spain, France, Greece, Hungary, Italy, Portugal, Romania.
2 Wheat 24,867.41
3 Other cereals 32,222.34
4 Roots and
tubers 3,168.06
5 Sugar crops 2,353.34Not in Cyprus, Estonia, Luxembourg, Malta.
6 Pulses 1,860.05
7 Nuts 970.89
Only in Cyprus, Czech Rep., Germany, Spain, France, Greece, Italy, Luxembourg, Portugal, Romania, Slovenia.
8 Oil crops 12,556.42 Not in Malta.
9 Vegetables 2,586.33
10 Fruits 6,244.03
11 Fibres 654.96
Not in Austria, Cyprus, Czech Rep., Denmark, Ireland, Luxembourg, Malta, Portugal, Sweden, Slovenia.
12 Other crops 354.72 Not in Ireland, Malta, Sweden.
13 Fodder crops 19,598.35
14 Permanent
pasture 58,619.83
- TOTAL 166,425.97 *Source: https://www.gtap.agecon.purdue.edu.
In addition to the minor significance of crop-specific data regarding all relevant parameters in comparison to the overall production perspective, the implementation of crop-specific data for all selected agricultural commodities according to the classification of GTAP would be well beyond the scope of the work as foreseen in the EXIOPOL project. Thus, three mayor and significantly different commodities have been selected as base for the extrapolation to other commodities.

Report on Unit Values of Pesticides.
7
In particular, rice has been selected because of its specific growing environment in paddy water (at least in some countries, where paddy rice plays a role).
Secondly, wheat has been chosen and for the modelling process of environmental fate and exposure to agricultural produces served as basis for other commodities; i.e. the calculation of the following commodities has been carried out with data extrapolated from wheat data: other cereals, roots and tubers, sugar crops, pulses, oil crops, vegetables, fibres, other crops, fodder crops and permanent pasture.
Last but not least, a fruit tree (common apple tree) has been chosen as third commodity and serves as basis for nuts and fruits. These choices are reflected in the marginal costs per kg applied plant protection product as these costs, the so-called unit values, are equal for two commodities under the precondition that the same plant protection products are used for both commodities.
However, to get an idea of a crop-specific modelling approach, some aspects reflecting particular steps in the impact pathway approach, are discussed in detail in the following chapter for the case of wheat.

Report on Unit Values of Pesticides.
8
3 Crop-specific Assessment of Fate, Exposure, Impacts and Damages
Despite the fact that the EE I/O tables in the EXIOPOL project take rather complete industrial sectors than specific commodities into account (see Deliverable D II.2.c-1), it is essential to calculate the impacts due to direct application of plant protection products to various agricultural produces in a crop-specific manner. This goes in line with state of the art science in plant uptake modelling and related impact assessment (Trapp and Kulhanek, 2006) and will, thus, performed in the present study as base for the aggregated unit values per each considered country.
In order to demonstrate which kind of crop-specific parameter data are required for the more detailed approach behind the aggregated unit values, some of the most important parameters are discussed in the following for wheat as a representative and important example throughout current European agricultural practice.
The most important parts of the theoretical methodology are quite similar for different agricultural produces, hence, in the following, the representative agricultural produce wheat is chosen as example throughout all assessment steps.
The methodology developed in this study contributes to evaluate the residues of a directly applied plant protection product in the various growing plant parts as well as in the commodity that is effectively harvested after undergoing various considered fate processes in and between the different environmental and plant compartments. All processes that have been considered in the present approach are listed in Table 3-1.
Table 3-1: Environmental fate processes that are considered with respect to a plant protection product’s degradation in and the transfer between environmental and plant compartments.
Process Description
Sorption (adsorption/ desorption)
Attraction of the molecules of a substance in gaseous or liquid form to the surface of a solid (e.g. non-polar pesticides tend to be pushed out of water and onto soils which contain non-polar carbon material; metal ions tend to adsorb at oxide mineral-water interfaces) and its reverse process.
d OC OCK K f
Kd: Sorption coefficient or distribution coefficient or soil-water partition coefficient [L/kg]: ratio of the sorbed concentration of a substance [mg/kg] per concentration of the substance in solution [mg/L].
KOC: Soil organic carbon-water partition coefficient [L/kg]: ratio of the mass of a substance in the organic fraction
Report on Unit Values of Pesticides.
9
Process Description
of the soil [kg] per mass of organic carbon in the soil [kg] per concentration of the substance in solution [mg/L]; depends on the physico-chemical properties of the substance, not on the percent of organic matter in the soil. Assumption: predominant sorbent in soil is the soil organic matter (SOM).
fOC: Mass fraction of soil organic carbon content [kg/kg].
Sorption can be calculated by means of the Freundlich Equation.
Formation of non-extractable residues
Formation of a portion of an introduced substance that is non-extractable by a simulated soil solution or organic solvents after a specific period of sorption to soil organic matter. This portion is referred to as non-extractable residue (NER) and can refer to parent molecules and/or metabolites.
Mechanisms involved in NER formation range from weak, potentially reversible physical sorption to stronginteractions with the humic soil matrix via: • Covalent bonding; • Ionic bonding; • Charge transfer complexes; • Ligand exchange; • Hydrogen bonding; • Van der Waals forces; • Hydrophobic sorption; • Entrapment due to sequestration reactions
Absorption (intermedia exchange from air into other media)
Process referring to as uptake of a substance by plants (dependent on the physico-chemical properties of the substance, the properties of the plant tissue and the application technique which is used to emit the substance into the environment), or as diffusion from air to water and soil (dependent on the physico-chemical properties of the substance and the properties of the receiving compartment), according to the partitioning behaviour of the substance between two media, i.e. air-plant, air-water, and air-soil.
Regarding plant uptake: the fraction of a substance which will not be further transferred into other media, e.g. by volatilisation, is immobilised. This process is referred to as fixation (see crop removal).
Volatilisation (intermedia exchange from
Vapour emission of a substance following deposition onto leaves, or into water or soil, according to substance-specific air-water partition coefficients KAW, i.e. the pathway by

Report on Unit Values of Pesticides.
10
Process Description
other media into air)
which a pesticide moves from plant (transpiration), water or soil surface (evaporation) into the atmosphere.
The volatilisation rate mainly depends on the vapour pressure of a substance, but is also influenced by temperature and the rate of competing processes, i.e. intermedia exchange from air into plants, water and soil, wash-off by rainfall and photo decomposition.
Chemical decomposition (hydrolysis)
Reaction of a substance with water molecules to form a new product. Hydrolysis rates for pesticides are generally expressed as half lives t1/2 [days], i.e. the amount of time it takes for half of an amount of a pesticide to be hydrolysed.
Photo decomposition (photolysis)
As, during application, pesticides mainly deposit on the upper side of leaves, they are subjected to sunlight and may therefore undergo photochemical transformation either by direct or indirect photolysis or photochemical degradation.
Direct photolysis: a substance absorbs light and then undergoes a transformation reaction from an excited state.
Indirect photolysis: naturally occurring compounds absorb energy via sunlight which is then transferred to a substance of concern, to form free OH-radicals or promote redox reactions that result in the transformation of the substance.
Biological degradation (metabolism)
Occurs via enzymatic catalysis by microorganisms and can follow complex pathways involving a variety of interactions among microorganisms, soil constituents, and substances of concern. Thus, biological degradation rates depend on the physico-chemical properties of the substance but also on microbiological and physico-chemical properties of the soil as well as soil temperature and moisture. Note that, aside from biological degradation, also abiotic degradation may result in metabolites.
Biological as well as abiotic degradation of a substance may lead to detoxication, which refers to the metabolic process of a substance by which the parent chemical yields less toxic derivatives which are more soluble in water.
Crop removal Refers to the removal of a pesticide across the boundaries of the Environmental Fate Module of the modelling framework due to uptake by plants (see absorption) followed by harvest.
Regarding fixation: the fraction of a substance which was absorbed via plant uptake and that was not be further

Report on Unit Values of Pesticides.
11
Process Description
transferred into other media, e.g. by volatilisation, has been immobilised only until crop removal.
Water-soil erosion Removal of soil surface material, i.e. wearing away and transport of the soil by running water, glaciers, wind or waves, while water and wind are the agents. The erosion potential of a soil strongly depends on the soil texture.
Most prevalent types of soil erosion by water: • Sheet erosion: combination of downslope movement of
splash and surface water. • Rill/inter-rill erosion: surface water movement to or
between small depressions (ephemeral concentrated flow paths), where the water gains depth and velocity.
• Gully erosion: formation of channels (U-shaped, V-shaped) in soils due to increase in water depth, velocity and volume.
Note that water-soil erosion is relevant only for strongly sorbing substances, i.e. around KOC > 1000 L/kg (cf. sorption).
Surface run-off Refers to the overland flow of a substance, which is the flow of water including the dissolved fraction of a substance over the ground before it enters a definite channel, occurring when the infiltration capacity of a soil, i.e. the saturated hydraulic conductivity of a soil, is exceeded by the rainfall intensity (infiltration excess run-off) or when rain is falling on soil that is already saturated (saturation excess run-off).
Note that surface run-off with respect to assessing the environmental fate behaviour of pesticides does not equal run-off with respect to hydrology in general. The latter refers to the quantity of water that is discharged in surface streams.
Lateral subsurface flow
Precipitation infiltrates and is transported downslope through the soil profile. This transport process can be quite rapid in shallow, well structured soils overlaying clay or bedrock and takes place almost exclusively along paths of preferential flow (cf. leaching). Lateral subsurface flow strongly depends on the antecedent soil-moisture.
Drainage (drain flow)
Refers to the loss of pesticides from fields via removal of excess water from the soil through field drains. The total drainage cannot exceed the saturated hydraulic conductivity of a soil.
Report on Unit Values of Pesticides.
12
Process Description
Leaching
Downward vertical movement of a substance with percolating water in the soil profile and the unsaturated zone towards the groundwater table. Leaching of pesticides usually occurs in dissolved form. It has been shown, however, that colloid-facilitated transport can play an important role for leaching of strongly sorbing pesticides.
Leaching can occur via matrix flow (in the soil matrix, following the Richard’s equation) or via preferential flow of water (e.g. in macropores, cracks, rodent tunnels, root channels).
Advection
All transfer processes that are driven by concentration difference between two relevant media, compartments or sections within a compartment.
Concentration differences may also refer to differences in pH, organic carbon content or other parameters.
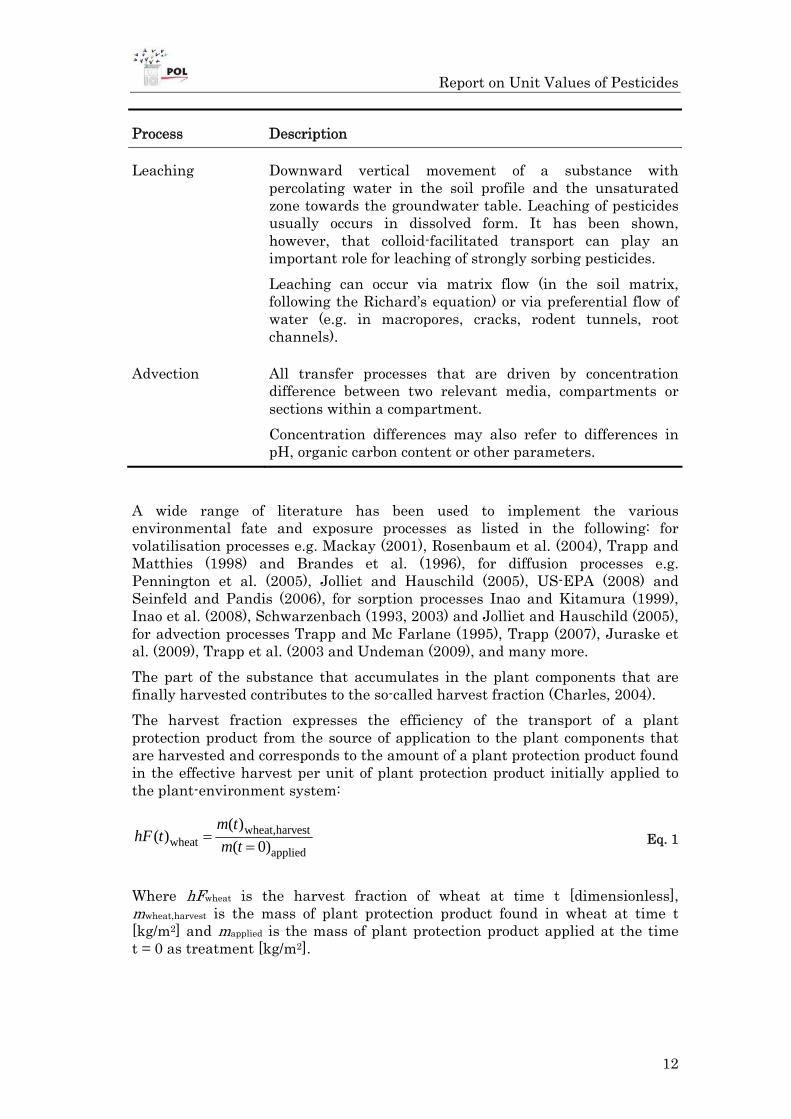
A wide range of literature has been used to implement the various environmental fate and exposure processes as listed in the following: for volatilisation processes e.g. Mackay (2001), Rosenbaum et al. (2004), Trapp and Matthies (1998) and Brandes et al. (1996), for diffusion processes e.g. Pennington et al. (2005), Jolliet and Hauschild (2005), US-EPA (2008) and Seinfeld and Pandis (2006), for sorption processes Inao and Kitamura (1999), Inao et al. (2008), Schwarzenbach (1993, 2003) and Jolliet and Hauschild (2005), for advection processes Trapp and Mc Farlane (1995), Trapp (2007), Juraske et al. (2009), Trapp et al. (2003 and Undeman (2009), and many more.
The part of the substance that accumulates in the plant components that are finally harvested contributes to the so-called harvest fraction (Charles, 2004).
The harvest fraction expresses the efficiency of the transport of a plant protection product from the source of application to the plant components that are harvested and corresponds to the amount of a plant protection product found in the effective harvest per unit of plant protection product initially applied to the plant-environment system:
wheat,harvestwheat
applied
( )( )
( 0)
m thF t
m t
Eq. 1
Where hFwheat is the harvest fraction of wheat at time t [dimensionless], mwheat,harvest is the mass of plant protection product found in wheat at time t [kg/m2] and mapplied is the mass of plant protection product applied at the time t = 0 as treatment [kg/m2].

Report on Unit Values of Pesticides.
13
After some parts of the growing plant are effectively harvested, the agricultural produce undergoes various steps before it can be finally consumed be either humans or domestic animals. This not only includes national and international trade and related packaging and transport, but also different kind of processing stems, such as washing, peeling and/or cooking – depending on the agricultural produce and the finally desired food product on the plate. For wheat, the following food processes are available from literature (see Table 3-2):
Table 3-2: Overview of different food processes for wheat as incorporated into the effective food processing factor for the pathway from harvest to intake in the EXIOPOL impact assessment of plant protection products.
Process Initial
Residue [ppm]
Residue Dissipation[percent]*
Reason Reference
Bread making 4 46-70 Yeast-mediated fermentation and baking
Sharma et al. (2005)
Milling and storage for 365 days
10 8-10 Accumulation in bran fraction
Alnaij and Kadoum (1979)
Milling 8.89 95 n/a Uygun et al. (2005)
Milling and storage for 4-36 weeks
2.6-3.7 2.7-56 n/a Wilkin and Fishwick (1981)
*Varies among different plant protection products.
From the harvest fraction, i.e. the sum of the parts of wheat that are effectively harvested for later consumption by humans, and the food processing factor for wheat, FPwheat [dimensionless], i.e. expressing the fraction of the plant protection product of concern in the harvest fraction that is considered as loss due to various processes an agricultural produce undergoes for finally ending up as product on the food market, the effective intake fraction, iFwheat,effective [dimensionless], can be calculated:
wheat,effective wheat wheat
intake,wheat
applied
( ) ( ) 1
( )
( 0)
iF t hF t FP
m t
m t
Eq. 2
As can be seen from Eq. 2, the effective intake fraction expresses the amount of the plant protection product effectively taken in through the consumption of wheat products per amount of mass of plant protection product applied to wheat in terms of agricultural practice.

Report on Unit Values of Pesticides.
14
The effective intake fraction serves as direct input to the exposure assessment framework, where the amount of plant protection product taken in via consumption of food is directly linked to any information about distribution in the human body and related effects caused by the amount of plant protection product in the body.
The methodology for the exposure assessment of plant protection products and the sub-sequent impact and damage assessments is described in detail in Deliverable D II.2.c.-1 as these parts of the impact pathway approach are not crop-specific and, thus, beyond the scope of the present Deliverable. Whereas the further methodology is equal across the various agricultural produces, the resulting unit values are crop-specific and will be shown in detail in the following chapter.

Report on Unit Values of Pesticides.
15
4 Crop-specific Unit Values due to Impacts on Human Health
4.1 Crops-specific Unit Values – Overview
Based on the total costs due to the direct application of plant protection products to a particular agricultural produce according to agricultural practice in the year 2000 in Europe, it is possible to calculate crop-specific unit values, i.e. the marginal costs per kg applied herbicides and insecticides, respectively, to a particular produce of interest. Unit values, Ucancer,crop and Unon-cancer,crop [Euro2000/kgapplied] can be derived by dividing the total costs per crop, Ecancer,crop and Enon-cancer,crop [Euro2000], by the total amount applied to the crop, Mapplied,crop [kgapplied], according to the following equation:
cancer,cropcancer,crop
applied,crop
non-cancer,cropnon-cancer,crop
applied,crop
EU
M
EU
M
Eq. 3
In the following, crop-specific unit values, aggregated over all considered human health end-points, are presented for herbicides in Table 4-1 and for insecticides in Table 4-2, respectively. As mentioned before, it can be seen that the crop-specific unit values are not different for crops where a country uses the same plant protection products and, in addition, where the crop-specific parameter values are extrapolated from the same agricultural produce, such as from wheat. The latter is due to the fact that not for all agricultural produces crop-specific data were partly or available at all within the frame of the present study. For further details on extrapolation of crop-spcific data see Section 2.2.
Table 4-1: Crop-specific unit values [Euro2000·kg–1applied·year–1] for human health aggregated over all human health end-points for the year 2000 for herbicides.
Country
Ric
e
Wh
eat
Oth
er c
erea
ls
Roo
ts a
nd
tube
rs
Su
gar
crop
s
Pu
lses
Nu
ts
Oil
cro
ps
Veg
etab
les
Fru
its
Fib
res
Oth
er c
rops
Fod
der
crop
s
Per
man
ent
past
ure
AT - 0.9 0.9 0.9 0.9 0.9 - 0.9 0.9 1.5 - 0.9 0.9 0.9
BE - 2.0 2.0 2.0 2.0 2.0 - 2.0 2.0 2.5 2.0 2.0 2.0 2.0
BG n/a n/a n/a n/a n/a n/a n/a n/a n/a n/a n/a n/a n/a n/a
CY - 0.4 0.4 0.4 - 0.4 0.6 0.4 0.4 0.6 - 0.4 0.4 0.4
CZ - 1.3 1.3 1.3 1.3 1.3 1.5 1.3 1.3 1.5 - 1.3 1.3 1.3

Report on Unit Values of Pesticides.
16
Country
Ric
e
Wh
eat
Oth
er c
erea
ls
Roo
ts a
nd
tube
rs
Su
gar
crop
s
Pu
lses
Nu
ts
Oil
cro
ps
Veg
etab
les
Fru
its
Fib
res
Oth
er c
rops
Fod
der
crop
s
Per
man
ent
past
ure
DE - 0.0 0.0 0.0 0.0 0.0 0.0 0.0 0.0 0.0 0.0 0.0 0.0 0.0
DK - 0.1 0.1 0.1 0.1 0.1 - 0.1 0.1 0.2 - 0.1 0.1 0.1
EE - 6.4 6.4 6.4 - 6.4 - 6.4 6.4 10.5 6.4 6.4 6.4 6.4
ES 33.1 0.8 0.8 0.8 0.8 0.8 0.5 0.8 0.8 0.5 0.8 0.8 0.8 0.8
FI - 1.8 1.8 1.8 1.8 1.8 - 1.8 1.8 2.6 1.8 1.8 1.8 1.8
FR 5.7 0.7 0.7 0.7 0.7 0.7 1.2 0.7 0.7 1.2 0.7 0.7 0.7 0.7
GR 40.9 1.0 1.0 1.0 1.0 1.0 0.7 1.0 1.0 0.7 1.0 1.0 1.0 1.0
HU 38.5 1.9 1.9 1.9 1.9 1.9 - 1.9 1.9 2.3 1.9 1.9 1.9 1.9
IE - 1.9 1.9 1.9 1.9 1.9 - 1.9 1.9 2.8 - - 1.9 1.9
IT 11.7 2.6 2.6 2.6 2.6 2.6 3.7 2.6 2.6 3.7 2.6 2.6 2.6 2.6
LT - 2.8 2.8 2.8 2.8 2.8 - 2.8 2.8 4.6 2.8 2.8 2.8 2.8
LU - 2.0 2.0 2.0 - 2.0 2.5 2.0 2.0 2.5 - 2.0 2.0 2.0
LV - 2.9 2.9 2.9 2.9 2.9 - 2.9 2.9 4.5 2.9 2.9 2.9 2.9
MT - - - - - - - - - - - - - -
NL - 2.0 2.0 2.0 2.0 2.0 - 2.0 2.0 0.0 2.0 2.0 2.0 2.0
PL - 1.7 1.7 1.7 1.7 1.7 - 1.7 1.7 1.9 1.7 1.7 1.7 1.7
RO n/a n/a n/a n/a n/a n/a n/a n/a n/a n/a n/a n/a n/a n/a
PT 47.7 1.3 1.3 1.3 1.3 1.3 0.8 1.3 1.3 0.8 1.3 1.3 1.3 1.3
SE - 0.1 0.1 0.1 0.1 0.1 - 0.1 0.1 0.1 - - 0.1 0.1
SI - 2.4 2.4 2.4 2.4 2.4 3.9 2.4 2.4 3.9 - 2.4 2.4 2.4
SK - 2.8 2.8 2.8 2.8 2.8 - 2.8 2.8 1.9 2.8 2.8 2.8 2.8
UK - 4.7 4.7 4.7 4.7 4.7 - 4.7 4.7 2.5 4.7 4.7 4.7 4.7
Report on Unit Values of Pesticides.
17
Table 4-2: Crop-specific unit values [Euro2000·kg–1applied·year–1] for human health aggregated over all human health end-points for the year 2000 for insecticides.
Country R
ice
Wh
eat
Oth
er c
erea
ls
Roo
ts a
nd
tube
rs
Su
gar
crop
s
Pu
lses
Nu
ts
Oil
cro
ps
Veg
etab
les
Fru
its
Fib
res
Oth
er c
rops
Fod
der
crop
s
Per
man
ent
past
ure
AT - 8.7 8.7 8.7 8.7 8.7 - 8.7 8.7 14.3 - 8.7 8.7 8.7
BE - 18.4 18.4 18.4 18.4 18.4 - 18.4 18.4 26.9 18.4 18.4 18.4 18.4
BG n/a n/a n/a n/a n/a n/a n/a n/a n/a n/a n/a n/a n/a n/a
CY - 0.1 0.1 0.1 - 0.1 0.1 0.1 0.1 0.1 - 0.1 0.1 0.1
CZ - 12.8 12.8 12.8 12.8 12.8 16.5 12.8 12.8 16.5 - 12.8 12.8 12.8
DE - 0.1 0.1 0.1 0.1 0.1 0.2 0.1 0.1 0.2 0.1 0.1 0.1 0.1
DK - 0.3 0.3 0.3 0.3 0.3 - 0.3 0.3 1.0 - 0.3 0.3 0.3
EE - - - - - - - - - - - - - -
ES 168.0 2.0 2.0 2.0 2.0 2.0 39.9 2.0 2.0 39.9 2.0 2.0 2.0 2.0
FI - 37.3 37.3 37.3 37.3 37.3 - 37.3 37.3 49.3 37.3 37.3 37.3 37.3
FR - - - - - - - - - - - - - -
GR 289.2 1.7 1.7 1.7 1.7 1.7 1.1 1.7 1.7 1.1 1.7 1.7 1.7 1.7
HU 362.4 6.1 6.1 6.1 6.1 6.1 - 6.1 6.1 8.4 6.1 6.1 6.1 6.1
IE - 11.0 11.0 11.0 11.0 11.0 - 11.0 11.0 15.6 - - 11.0 11.0
IT 314.0 71.3 71.3 71.3 71.3 71.3 99.4 71.3 71.3 99.4 71.3 71.3 71.3 71.3
LT - 18.2 18.2 18.2 18.2 18.2 - 18.2 18.2 30.0 18.2 18.2 18.2 18.2
LU - 18.4 18.4 18.4 - 18.4 26.9 18.4 18.4 26.9 - 18.4 18.4 18.4
LV - - - - - - - - - - - - - -
MT - - - - - - - - - - - - - -
NL - - - - - - - - - - - - - -
PL - 13.9 13.9 13.9 13.9 13.9 - 13.9 13.9 16.5 13.9 13.9 13.9 13.9
RO n/a n/a n/a n/a n/a n/a n/a n/a n/a n/a n/a n/a n/a n/a
PT - - - - - - - - - - - - - -
SE - 0.1 0.1 0.1 0.1 0.1 - 0.1 0.1 0.5 - - 0.1 0.1
SI - 8.9 8.9 8.9 8.9 8.9 14.8 8.9 8.9 14.8 - 8.9 8.9 8.9
SK - 20.4 20.4 20.4 20.4 20.4 - 20.4 20.4 10.9 20.4 20.4 20.4 20.4
UK - 47.3 47.3 47.3 47.3 47.3 - 47.3 47.3 19.2 47.3 47.3 47.3 47.3
Report on Unit Values of Pesticides.
18
In addition to the unit values which are aggregated over the various human health end-points in Table 4-1 and Table 4-2, in the annex of this Deliverable, dis-aggregated unit values according to the distinction between cancer and non-cancer cases can be found, i.e. in Table Annex 6 and Table Annex 7 for herbicides and in Table Annex 8 and Table Annex 9 for insecticides, respectively.
In the following sections, more specifically the unit values for each agricultural produce are given, dis-aggregated according to the effect information as considered in the present approach.
4.2 Crops-specific Unit Values – Rice
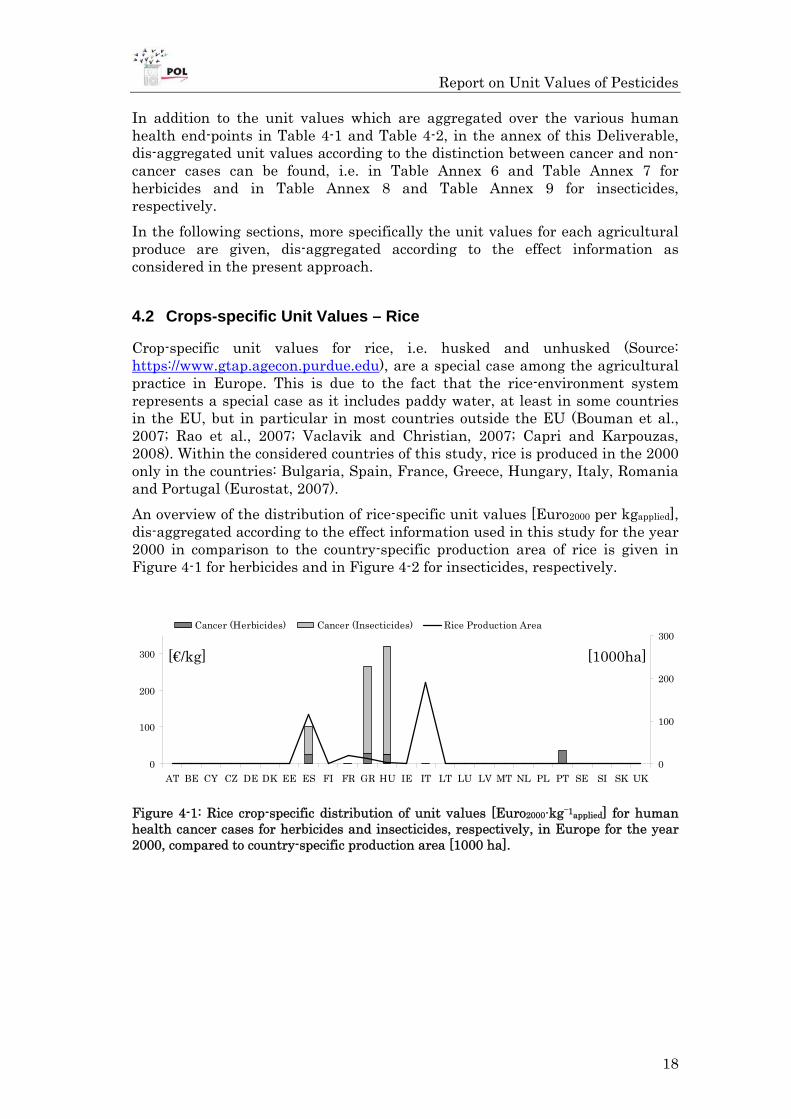
Crop-specific unit values for rice, i.e. husked and unhusked (Source: https://www.gtap.agecon.purdue.edu), are a special case among the agricultural practice in Europe. This is due to the fact that the rice-environment system represents a special case as it includes paddy water, at least in some countries in the EU, but in particular in most countries outside the EU (Bouman et al., 2007; Rao et al., 2007; Vaclavik and Christian, 2007; Capri and Karpouzas, 2008). Within the considered countries of this study, rice is produced in the 2000 only in the countries: Bulgaria, Spain, France, Greece, Hungary, Italy, Romania and Portugal (Eurostat, 2007).
An overview of the distribution of rice-specific unit values [Euro2000 per kgapplied], dis-aggregated according to the effect information used in this study for the year 2000 in comparison to the country-specific production area of rice is given in Figure 4-1 for herbicides and in Figure 4-2 for insecticides, respectively.
0
100
200
300
AT BE CY CZ DE DK EE ES FI FR GR HU IE IT LT LU LV MT NL PL PT SE SI SK UK0
100
200
300Cancer (Herbicides) Cancer (Insecticides) Rice Production Area
Figure 4-1: Rice crop-specific distribution of unit values [Euro2000·kg–1applied] for human health cancer cases for herbicides and insecticides, respectively, in Europe for the year 2000, compared to country-specific production area [1000 ha].
[€/kg] [1000ha]

Report on Unit Values of Pesticides.
19
0
100
200
300
400
AT BE CY CZ DE DK EE ES FI FR GR HU IE IT LT LU LV MT NL PL PT SE SI SK UK0
100
200
300Non-cancer (Herbicides) Non-cancer (Insecticides) Rice Production Area
Figure 4-2: Rice crop-specific distribution of unit values [Euro2000·kg–1applied] for human health non-cancer cases for herbicides and insecticides, respectively, in Europe for the year 2000, compared to country-specific production area [1000 ha].
With respect to unit values related to cancer incidences the insecticides are well dominating the overall unit values. A similar picture is shown with respect to non-cancer incidences.
4.3 Crops-specific Unit Values – Wheat
Crop-specific unit values for wheat, i.e. wheat and meslin (Source: https://www.gtap.agecon.purdue.edu), are an important case among the agricultural practice in Europe. This is due to the fact that wheat is the most important agricultural produce within Europe (FAOSTAT, 2009; Bechini et al., 2006; Ewert et al., 2005; Pigna et al., 2009). Wheat is produced in all considered countries of the present study (Eurostat, 2007). Thus, wheat has been chosen as the basis for extrapolation to agricultural produces where crop-specific data were not and the produces are more similar to wheat than to other produces where crop-specific data were available.
An overview of the distribution of wheat-specific unit values [Euro2000 per kgapplied], dis-aggregated according to the effect information used in this study for the year 2000 in comparison to the country-specific production area of wheat is given in Figure 4-3 for herbicides and in Figure 4-4 for insecticides, respectively.
[€/kg] [1000ha]

Report on Unit Values of Pesticides.
20
0
1
2
3
AT BE CY CZ DE DK EE ES FI FR GR HU IE IT LT LU LV MT NL PL PT SE SI SK UK0
2000
4000
6000Cancer (Herbicides) Cancer (Insecticides) Wheat Production Area
Figure 4-3: Wheat crop-specific distribution of unit values [Euro2000·kg–1applied] for human health cancer cases for herbicides and insecticides, respectively, in Europe for the year 2000, compared to counrtry-specific production area [1000 ha].
0
25
50
75
AT BE CY CZ DE DK EE ES FI FR GR HU IE IT LT LU LV MT NL PL PT SE SI SK UK0
2000
4000
6000Non-cancer (Herbicides) Non-cancer (Insecticides) Wheat Production Area
Figure 4-4: Wheat crop-specific distribution of unit values [Euro2000·kg–1applied] for human health non-cancer cases for herbicides and insecticides, respectively, in Europe for the year 2000, compared to counrtry-specific production area [1000 ha].
With respect to unit values related to cancer incidences the herbicides are well dominating the overall unit values. A different picture is shown with respect to non-cancer incidences, where insecticides are dominating.
4.4 Crops-specific Unit Values – Other Cereals
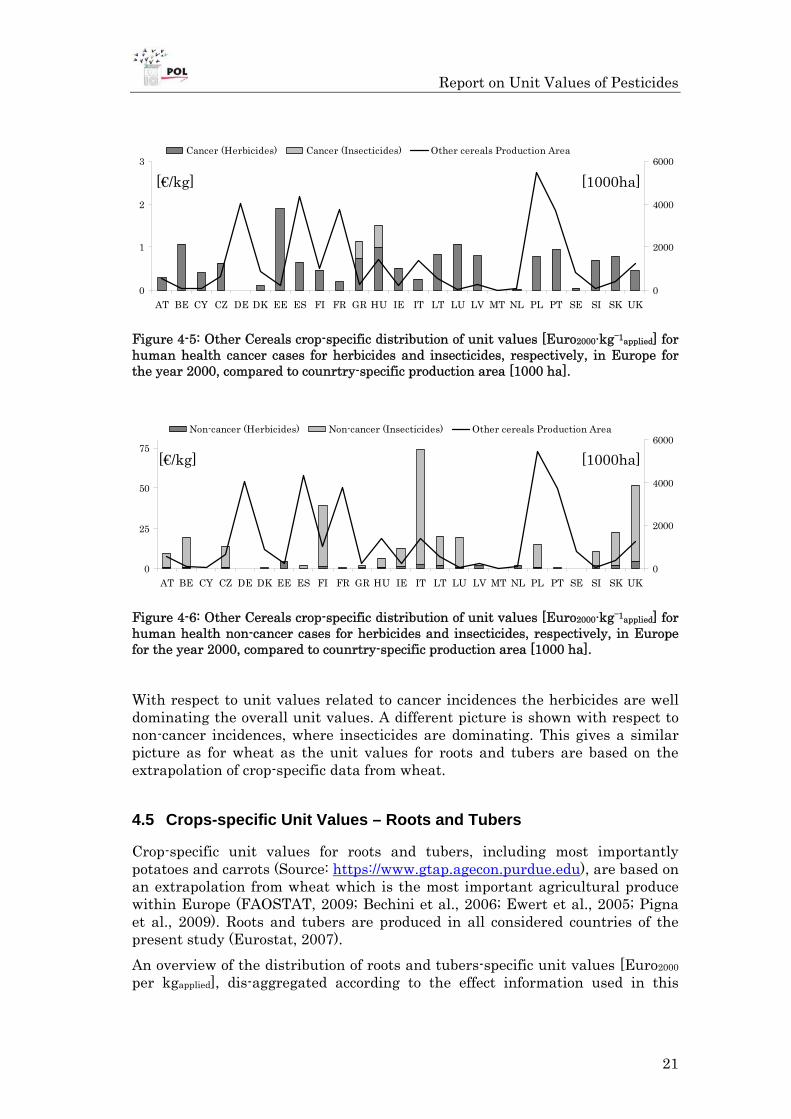
Crop-specific unit values for other cereals, including maize, barley, rye, oats and other cereals (Source: https://www.gtap.agecon.purdue.edu), are based on an extrapolation from wheat which is the most important agricultural produce within Europe (FAOSTAT, 2009; Bechini et al., 2006; Ewert et al., 2005; Pigna et al., 2009). Other cereals are produced in all considered countries of the present study (Eurostat, 2007).
An overview of the distribution of other cereals-specific unit values [Euro2000 per kgapplied], dis-aggregated according to the effect information used in this study for the year 2000 in comparison to the country-specific production area of other cereals is given in Figure 4-5 for herbicides and in Figure 4-6 for insecticides, respectively.
[€/kg] [1000ha]
[€/kg] [1000ha]
Report on Unit Values of Pesticides.
21
0
1
2
3
AT BE CY CZ DE DK EE ES FI FR GR HU IE IT LT LU LV MT NL PL PT SE SI SK UK0
2000
4000
6000Cancer (Herbicides) Cancer (Insecticides) Other cereals Production Area
Figure 4-5: Other Cereals crop-specific distribution of unit values [Euro2000·kg–1applied] for human health cancer cases for herbicides and insecticides, respectively, in Europe for the year 2000, compared to counrtry-specific production area [1000 ha].
0
25
50
75
AT BE CY CZ DE DK EE ES FI FR GR HU IE IT LT LU LV MT NL PL PT SE SI SK UK0
2000
4000
6000Non-cancer (Herbicides) Non-cancer (Insecticides) Other cereals Production Area
Figure 4-6: Other Cereals crop-specific distribution of unit values [Euro2000·kg–1applied] for human health non-cancer cases for herbicides and insecticides, respectively, in Europe for the year 2000, compared to counrtry-specific production area [1000 ha].
With respect to unit values related to cancer incidences the herbicides are well dominating the overall unit values. A different picture is shown with respect to non-cancer incidences, where insecticides are dominating. This gives a similar picture as for wheat as the unit values for roots and tubers are based on the extrapolation of crop-specific data from wheat.
4.5 Crops-specific Unit Values – Roots and Tubers
Crop-specific unit values for roots and tubers, including most importantly potatoes and carrots (Source: https://www.gtap.agecon.purdue.edu), are based on an extrapolation from wheat which is the most important agricultural produce within Europe (FAOSTAT, 2009; Bechini et al., 2006; Ewert et al., 2005; Pigna et al., 2009). Roots and tubers are produced in all considered countries of the present study (Eurostat, 2007).
An overview of the distribution of roots and tubers-specific unit values [Euro2000 per kgapplied], dis-aggregated according to the effect information used in this
[€/kg] [1000ha]
[€/kg] [1000ha]
Report on Unit Values of Pesticides.
22
study for the year 2000 in comparison to the country-specific production area of roots and tubers is given in Figure 4-7 for herbicides and in Figure 4-8 for insecticides, respectively.
0
1
2
3
AT BE CY CZ DE DK EE ES FI FR GR HU IE IT LT LU LV MT NL PL PT SE SI SK UK0
500
1000
1500Cancer (Herbicides) Cancer (Insecticides) Roots and tubers Production Area
Figure 4-7: Roots and Tubers crop-specific distribution of unit values [Euro2000·kg–1applied] for human health cancer cases for herbicides and insecticides, respectively, in Europe for the year 2000, compared to counrtry-specific production area [1000 ha].
0
25
50
75
AT BE CY CZ DE DK EE ES FI FR GR HU IE IT LT LU LV MT NL PL PT SE SI SK UK0
500
1000
1500Non-cancer (Herbicides) Non-cancer (Insecticides) Roots and tubers Production Area
Figure 4-8: Roots and Tubers crop-specific distribution of unit values [Euro2000·kg–1applied] for human health non-cancer cases for herbicides and insecticides, respectively, in Europe for the year 2000, compared to counrtry-specific production area [1000 ha].
With respect to unit values related to cancer incidences the herbicides are well dominating the overall unit values. A different picture is shown with respect to non-cancer incidences, where insecticides are dominating. This gives a similar picture as for wheat as the unit values for roots and tubers are based on the extrapolation of crop-specific data from wheat.
4.6 Crops-specific Unit Values – Sugar Crops
Crop-specific unit values for sugar crops, i.e. sugar cane and sugar beet (Source: https://www.gtap.agecon.purdue.edu), are based on an extrapolation from wheat which is the most important agricultural produce within Europe (FAOSTAT, 2009; Bechini et al., 2006; Ewert et al., 2005; Pigna et al., 2009). Sugar crops are
[€/kg] [1000ha]
[€/kg] [1000ha]

Report on Unit Values of Pesticides.
23
produced in all considered countries of the present study except Cyprus, Estonia, Luxembourg and Malta (Eurostat, 2007).
An overview of the distribution of sugar crops-specific unit values [Euro2000 per kgapplied], dis-aggregated according to the effect information used in this study for the year 2000 in comparison to the country-specific production area of sugar crops is given in Figure 4-9 for herbicides and in Figure 4-10 for insecticides, respectively.
0
1
2
AT BE CY CZ DE DK EE ES FI FR GR HU IE IT LT LU LV MT NL PL PT SE SI SK UK0
200
400
600Cancer (Herbicides) Cancer (Insecticides) Sugar crops Production Area
Figure 4-9: Sugar Crops crop-specific distribution of unit values [Euro2000·kg–1applied] for human health cancer cases for herbicides and insecticides, respectively, in Europe for the year 2000, compared to counrtry-specific production area [1000 ha].
0
25
50
75
AT BE CY CZ DE DK EE ES FI FR GR HU IE IT LT LU LV MT NL PL PT SE SI SK UK0
200
400
600Non-cancer (Herbicides) Non-cancer (Insecticides) Sugar crops Production Area
Figure 4-10: Sugar Crops crop-specific distribution of unit values [Euro2000·kg–1applied] for human health non-cancer cases for herbicides and insecticides, respectively, in Europe for the year 2000, compared to counrtry-specific production area [1000 ha].
With respect to unit values related to cancer incidences the herbicides are well dominating the overall unit values. A different picture is shown with respect to non-cancer incidences, where insecticides are dominating. This gives a similar picture as for wheat as the unit values for sugar crops are based on the extrapolation of crop-specific data from wheat.
[€/kg] [1000ha]
[€/kg] [1000ha]
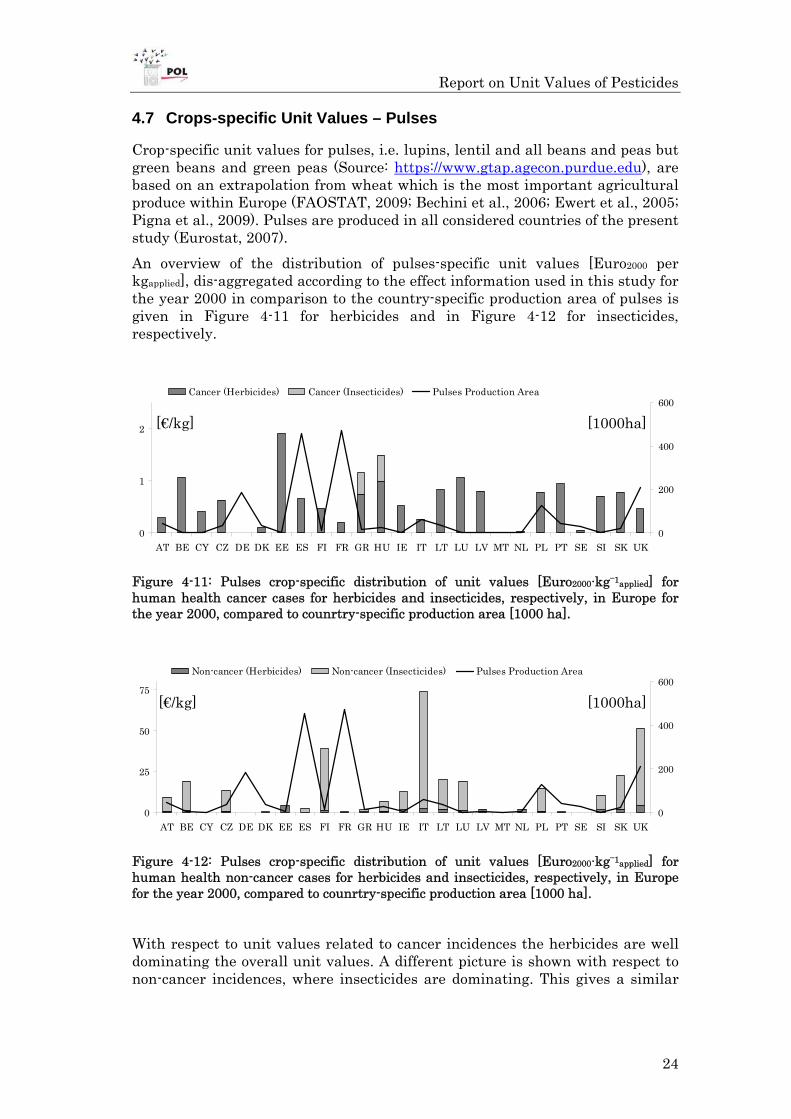
Report on Unit Values of Pesticides.
24
4.7 Crops-specific Unit Values – Pulses
Crop-specific unit values for pulses, i.e. lupins, lentil and all beans and peas but green beans and green peas (Source: https://www.gtap.agecon.purdue.edu), are based on an extrapolation from wheat which is the most important agricultural produce within Europe (FAOSTAT, 2009; Bechini et al., 2006; Ewert et al., 2005; Pigna et al., 2009). Pulses are produced in all considered countries of the present study (Eurostat, 2007).
An overview of the distribution of pulses-specific unit values [Euro2000 per kgapplied], dis-aggregated according to the effect information used in this study for the year 2000 in comparison to the country-specific production area of pulses is given in Figure 4-11 for herbicides and in Figure 4-12 for insecticides, respectively.
0
1
2
AT BE CY CZ DE DK EE ES FI FR GR HU IE IT LT LU LV MT NL PL PT SE SI SK UK0
200
400
600Cancer (Herbicides) Cancer (Insecticides) Pulses Production Area
Figure 4-11: Pulses crop-specific distribution of unit values [Euro2000·kg–1applied] for human health cancer cases for herbicides and insecticides, respectively, in Europe for the year 2000, compared to counrtry-specific production area [1000 ha].
0
25
50
75
AT BE CY CZ DE DK EE ES FI FR GR HU IE IT LT LU LV MT NL PL PT SE SI SK UK0
200
400
600Non-cancer (Herbicides) Non-cancer (Insecticides) Pulses Production Area
Figure 4-12: Pulses crop-specific distribution of unit values [Euro2000·kg–1applied] for human health non-cancer cases for herbicides and insecticides, respectively, in Europe for the year 2000, compared to counrtry-specific production area [1000 ha].
With respect to unit values related to cancer incidences the herbicides are well dominating the overall unit values. A different picture is shown with respect to non-cancer incidences, where insecticides are dominating. This gives a similar
[€/kg] [1000ha]
[€/kg] [1000ha]
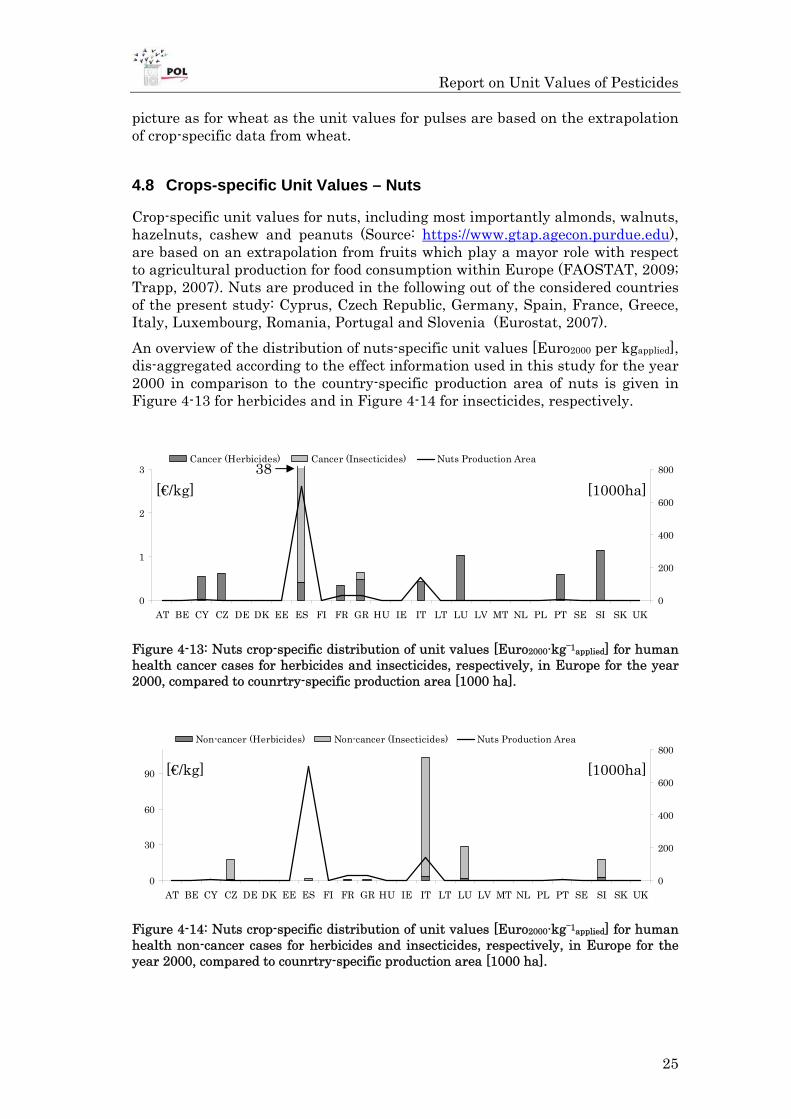
Report on Unit Values of Pesticides.
25
picture as for wheat as the unit values for pulses are based on the extrapolation of crop-specific data from wheat.
4.8 Crops-specific Unit Values – Nuts
Crop-specific unit values for nuts, including most importantly almonds, walnuts, hazelnuts, cashew and peanuts (Source: https://www.gtap.agecon.purdue.edu), are based on an extrapolation from fruits which play a mayor role with respect to agricultural production for food consumption within Europe (FAOSTAT, 2009; Trapp, 2007). Nuts are produced in the following out of the considered countries of the present study: Cyprus, Czech Republic, Germany, Spain, France, Greece, Italy, Luxembourg, Romania, Portugal and Slovenia (Eurostat, 2007).
An overview of the distribution of nuts-specific unit values [Euro2000 per kgapplied], dis-aggregated according to the effect information used in this study for the year 2000 in comparison to the country-specific production area of nuts is given in Figure 4-13 for herbicides and in Figure 4-14 for insecticides, respectively.
0
1
2
3
AT BE CY CZ DE DK EE ES FI FR GR HU IE IT LT LU LV MT NL PL PT SE SI SK UK0
200
400
600
800Cancer (Herbicides) Cancer (Insecticides) Nuts Production Area
Figure 4-13: Nuts crop-specific distribution of unit values [Euro2000·kg–1applied] for human health cancer cases for herbicides and insecticides, respectively, in Europe for the year 2000, compared to counrtry-specific production area [1000 ha].
0
30
60
90
AT BE CY CZ DE DK EE ES FI FR GR HU IE IT LT LU LV MT NL PL PT SE SI SK UK0
200
400
600
800Non-cancer (Herbicides) Non-cancer (Insecticides) Nuts Production Area
Figure 4-14: Nuts crop-specific distribution of unit values [Euro2000·kg–1applied] for human health non-cancer cases for herbicides and insecticides, respectively, in Europe for the year 2000, compared to counrtry-specific production area [1000 ha].
[€/kg] [1000ha]38
[€/kg] [1000ha]

Report on Unit Values of Pesticides.
26
With respect to unit values related to cancer incidences the herbicides are well dominating the overall unit values except for the case of Spain where we find insecticides dominating. A different picture is shown with respect to non-cancer incidences, where insecticides are dominating everywhere. This gives a similar picture as for fruits as the unit values for nuts are based on the extrapolation of crop-specific data from fruits.
4.9 Crops-specific Unit Values – Oil Crops
Crop-specific unit values for oil crops, including most importantly rape seed, sunflowers, soy beans and olives (Source: https://www.gtap.agecon.purdue.edu), are based on an extrapolation from wheat which is the most important agricultural produce within Europe (FAOSTAT, 2009; Bechini et al., 2006; Ewert et al., 2005; Pigna et al., 2009). Oil crops are produced in all considered countries of the present study (Eurostat, 2007), although no data for Malta are available for the year 2000 from Eurostat (2007).
An overview of the distribution of oil crops-specific unit values [Euro2000 per kgapplied], dis-aggregated according to the effect information used in this study for the year 2000 in comparison to the country-specific production area of oil crops is given in Figure 4-15 for herbicides and in Figure 4-16 for insecticides, respectively.
0
1
2
3
AT BE CY CZ DE DK EE ES FI FR GR HU IE IT LT LU LV MT NL PL PT SE SI SK UK0
1000
2000
3000
Cancer (Herbicides) Cancer (Insecticides) Oil crops Production Area
Figure 4-15: Oil Crops crop-specific distribution of unit values [Euro2000·kg–1applied] for human health cancer cases for herbicides and insecticides, respectively, in Europe for the year 2000, compared to counrtry-specific production area [1000 ha].
[€/kg] [1000ha]

Report on Unit Values of Pesticides.
27
0
25
50
75
AT BE CY CZ DE DK EE ES FI FR GR HU IE IT LT LU LV MT NL PL PT SE SI SK UK0
1000
2000
3000
Non-cancer (Herbicides) Non-cancer (Insecticides) Oil crops Production Area
Figure 4-16: Oil Crops crop-specific distribution of unit values [Euro2000·kg–1applied] for human health non-cancer cases for herbicides and insecticides, respectively, in Europe for the year 2000, compared to counrtry-specific production area [1000 ha].
With respect to unit values related to cancer incidences the herbicides are well dominating the overall unit values. A different picture is shown with respect to non-cancer incidences, where insecticides are dominating. This gives a similar picture as for wheat as the unit values for oil crops are based on the extrapolation of crop-specific data from wheat.
4.10 Crops-specific Unit Values – Vegetables
Crop-specific unit values for vegetables, including most importantly green beans and green peas, spinach, lettuce, asparagus, broccoli, cauliflower and many more (Source: https://www.gtap.agecon.purdue.edu), are based on an extrapolation from wheat which is the most important agricultural produce within Europe (FAOSTAT, 2009; Bechini et al., 2006; Ewert et al., 2005; Pigna et al., 2009). Vegetables are produced in all considered countries of the present study (Eurostat, 2007).
An overview of the distribution of vegetables-specific unit values [Euro2000 per kgapplied], dis-aggregated according to the effect information used in this study for the year 2000 in comparison to the country-specific production area of vegetables is given in Figure 4-17 for herbicides and in Figure 4-18 for insecticides, respectively.
[€/kg] [1000ha]

Report on Unit Values of Pesticides.
28
0
1
2
AT BE CY CZ DE DK EE ES FI FR GR HU IE IT LT LU LV MT NL PL PT SE SI SK UK0
250
500
Cancer (Herbicides) Cancer (Insecticides) Vegetables Production Area
Figure 4-17: Vegetables crop-specific distribution of unit values [Euro2000·kg–1applied] for human health cancer cases for herbicides and insecticides, respectively, in Europe for the year 2000, compared to counrtry-specific production area [1000 ha].
0
25
50
75
AT BE CY CZ DE DK EE ES FI FR GR HU IE IT LT LU LV MT NL PL PT SE SI SK UK0
250
500
Non-cancer (Herbicides) Non-cancer (Insecticides) Vegetables Production Area
Figure 4-18: Vegetables crop-specific distribution of unit values [Euro2000·kg–1applied] for human health non-cancer cases for herbicides and insecticides, respectively, in Europe for the year 2000, compared to counrtry-specific production area [1000 ha].
With respect to unit values related to cancer incidences the herbicides are well dominating the overall unit values. A different picture is shown with respect to non-cancer incidences, where insecticides are dominating. This gives a similar picture as for wheat as the unit values for vegetables are based on the extrapolation of crop-specific data from wheat.
4.11 Crops-specific Unit Values – Fruits
Crop-specific unit values for fruits, including most importantly apples, pears, peaches, citrus fruits etc. (Source: https://www.gtap.agecon.purdue.edu), are an important case among the agricultural practice in Europe. This is due to the fact that fruits including the processing of fruit juices etc. are some of the most important agricultural produces within Europe (FAOSTAT, 2009; Trapp, 2007). Fruits are produced in all considered countries of the present study (Eurostat, 2007). Thus, fruits have been chosen as the basis for extrapolation to agricultural produces where crop-specific data were not available and the
[€/kg] [1000ha]
[€/kg] [1000ha]

Report on Unit Values of Pesticides.
29
produces are more similar to fruits than to other produces where crop-specific data were available.
An overview of the distribution of fruits-specific unit values [Euro2000 per kgapplied], dis-aggregated according to the effect information used in this study for the year 2000 in comparison to the country-specific production area of fruits is given in Figure 4-19 for herbicides and in Figure 4-20 for insecticides, respectively.
0
1
2
3
4
AT BE CY CZ DE DK EE ES FI FR GR HU IE IT LT LU LV MT NL PL PT SE SI SK UK0
500
1000
1500
2000Cancer (Herbicides) Cancer (Insecticides) Fruits Production Area
Figure 4-19: Fruits crop-specific distribution of unit values [Euro2000·kg–1applied] for human health cancer cases for herbicides and insecticides, respectively, in Europe for the year 2000, compared to counrtry-specific production area [1000 ha].
0
30
60
90
AT BE CY CZ DE DK EE ES FI FR GR HU IE IT LT LU LV MT NL PL PT SE SI SK UK0
500
1000
1500
2000Non-cancer (Herbicides) Non-cancer (Insecticides) Fruits Production Area
Figure 4-20: Fruits crop-specific distribution of unit values [Euro2000·kg–1applied] for human health non-cancer cases for herbicides and insecticides, respectively, in Europe for the year 2000, compared to counrtry-specific production area [1000 ha].
With respect to unit values related to cancer incidences the herbicides are well dominating the overall unit values except for the case of Spain where we find insecticides dominating. A different picture is shown with respect to non-cancer incidences, where insecticides are dominating everywhere.
[€/kg] [1000ha]40
[€/kg] [1000ha]

Report on Unit Values of Pesticides.
30
4.12 Crops-specific Unit Values – Fibres
Crop-specific unit values for fibres, including most importantly cotton, flax, hemp and sisal (Source: https://www.gtap.agecon.purdue.edu), are based on an extrapolation from wheat which is the most important agricultural produce within Europe (FAOSTAT, 2009; Bechini et al., 2006; Ewert et al., 2005; Pigna et al., 2009). Fibres are not produced in the follwing of the considered countries of the present study: Austria, Cyprus, Czech Republic, Denmark, Ireland, Luxembourg, Malta, Romania, Sweden and Slovenia (Eurostat, 2007).
An overview of the distribution of fibres-specific unit values [Euro2000 per kgapplied], dis-aggregated according to the effect information used in this study for the year 2000 in comparison to the country-specific production area of fibres is given in Figure 4-21 for herbicides and in Figure 4-22 for insecticides, respectively.
0
1
2
AT BE CY CZ DE DK EE ES FI FR GR HU IE IT LT LU LV MT NL PL PT SE SI SK UK0
150
300
Cancer (Herbicides) Cancer (Insecticides) Fibres Production Area
Figure 4-21: Fibres crop-specific distribution of unit values [Euro2000·kg–1applied] for human health cancer cases for herbicides and insecticides, respectively, in Europe for the year 2000, compared to counrtry-specific production area [1000 ha].
0
25
50
75
AT BE CY CZ DE DK EE ES FI FR GR HU IE IT LT LU LV MT NL PL PT SE SI SK UK0
150
300
Non-cancer (Herbicides) Non-cancer (Insecticides) Fibres Production Area
Figure 4-22: Fibres crop-specific distribution of unit values [Euro2000·kg–1applied] for human health non-cancer cases for herbicides and insecticides, respectively, in Europe for the year 2000, compared to counrtry-specific production area [1000 ha].
With respect to unit values related to cancer incidences the herbicides are well dominating the overall unit values. A different picture is shown with respect to
[€/kg] [1000ha]
[€/kg] [1000ha]

Report on Unit Values of Pesticides.
31
non-cancer incidences, where insecticides are dominating. This gives a similar picture as for wheat as the unit values for fibres are based on the extrapolation of crop-specific data from wheat.
4.13 Crops-specific Unit Values – Other Crops
Crop-specific unit values for other crops, including e.g. vegetable seeds, beverage and spice crops, cereal straw and husks (Source: https://www.gtap.agecon.purdue.edu), are based on an extrapolation from wheat which is the most important agricultural produce within Europe (FAOSTAT, 2009; Bechini et al., 2006; Ewert et al., 2005; Pigna et al., 2009). Other crops are not produced in all of the considered countries of the present study except Ireland (Eurostat, 2007). At least no information for Ireland is available from Eurostat (2007) for the year 2000 in this category.
An overview of the distribution of other crops-specific unit values [Euro2000 per kgapplied], dis-aggregated according to the effect information used in this study for the year 2000 in comparison to the country-specific production area of other crops is given in Figure 4-23 for herbicides and in Figure 4-24 for insecticides, respectively.
0
1
2
AT BE CY CZ DE DK EE ES FI FR GR HU IE IT LT LU LV MT NL PL PT SE SI SK UK0
25
50
75
Cancer (Herbicides) Cancer (Insecticides) Other crops Production Area
Figure 4-23: Other Crops crop-specific distribution of unit values [Euro2000·kg–1applied] for human health cancer cases for herbicides and insecticides, respectively, in Europe for the year 2000, compared to counrtry-specific production area [1000 ha].
[€/kg] [1000ha]

Report on Unit Values of Pesticides.
32
0
25
50
75
AT BE CY CZ DE DK EE ES FI FR GR HU IE IT LT LU LV MT NL PL PT SE SI SK UK0
25
50
75
Non-cancer (Herbicides) Non-cancer (Insecticides) Other crops Production Area
Figure 4-24: Other Crops crop-specific distribution of unit values [Euro2000·kg–1applied] for human health non-cancer cases for herbicides and insecticides, respectively, in Europe for the year 2000, compared to counrtry-specific production area [1000 ha].
With respect to unit values related to cancer incidences the herbicides are well dominating the overall unit values. A different picture is shown with respect to non-cancer incidences, where insecticides are dominating. This gives a similar picture as for wheat as the unit values for other crops are based on the extrapolation of crop-specific data from wheat.
4.14 Crops-specific Unit Values – Fodder Crops
Crop-specific unit values for fooder crops, including most importantly hay, alfalfa and clover (Source: https://www.gtap.agecon.purdue.edu), are based on an extrapolation from wheat which is the most important agricultural produce within Europe (FAOSTAT, 2009; Bechini et al., 2006; Ewert et al., 2005; Pigna et al., 2009). Fodder crops are produced in all of the considered countries of the present study (Eurostat, 2007).
An overview of the distribution of fooder crops-specific unit values [Euro2000 per kgapplied], dis-aggregated according to the effect information used in this study for the year 2000 in comparison to the country-specific production area of fodder crops is given in Figure 4-25 for herbicides and in Figure 4-26 for insecticides, respectively.
[€/kg] [1000ha]
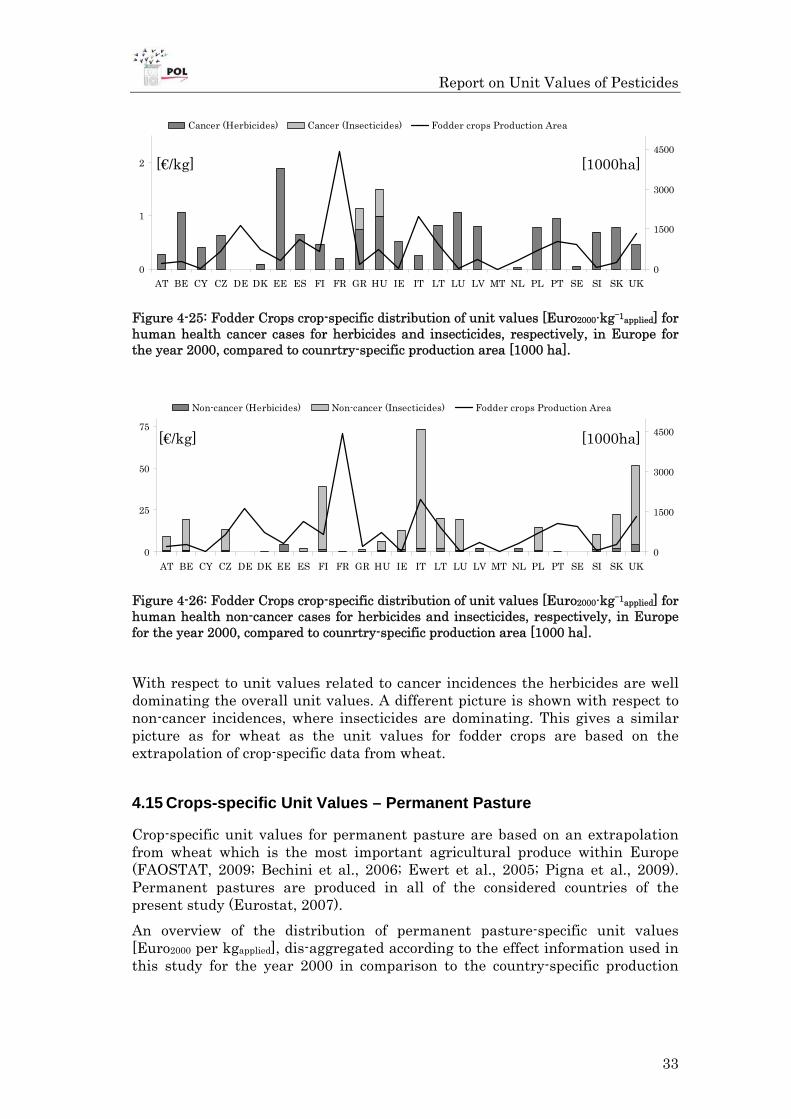
Report on Unit Values of Pesticides.
33
0
1
2
AT BE CY CZ DE DK EE ES FI FR GR HU IE IT LT LU LV MT NL PL PT SE SI SK UK0
1500
3000
4500
Cancer (Herbicides) Cancer (Insecticides) Fodder crops Production Area
Figure 4-25: Fodder Crops crop-specific distribution of unit values [Euro2000·kg–1applied] for human health cancer cases for herbicides and insecticides, respectively, in Europe for the year 2000, compared to counrtry-specific production area [1000 ha].
0
25
50
75
AT BE CY CZ DE DK EE ES FI FR GR HU IE IT LT LU LV MT NL PL PT SE SI SK UK0
1500
3000
4500
Non-cancer (Herbicides) Non-cancer (Insecticides) Fodder crops Production Area
Figure 4-26: Fodder Crops crop-specific distribution of unit values [Euro2000·kg–1applied] for human health non-cancer cases for herbicides and insecticides, respectively, in Europe for the year 2000, compared to counrtry-specific production area [1000 ha].
With respect to unit values related to cancer incidences the herbicides are well dominating the overall unit values. A different picture is shown with respect to non-cancer incidences, where insecticides are dominating. This gives a similar picture as for wheat as the unit values for fodder crops are based on the extrapolation of crop-specific data from wheat.
4.15 Crops-specific Unit Values – Permanent Pasture
Crop-specific unit values for permanent pasture are based on an extrapolation from wheat which is the most important agricultural produce within Europe (FAOSTAT, 2009; Bechini et al., 2006; Ewert et al., 2005; Pigna et al., 2009). Permanent pastures are produced in all of the considered countries of the present study (Eurostat, 2007).
An overview of the distribution of permanent pasture-specific unit values [Euro2000 per kgapplied], dis-aggregated according to the effect information used in this study for the year 2000 in comparison to the country-specific production
[€/kg] [1000ha]
[€/kg] [1000ha]

Report on Unit Values of Pesticides.
34
area of permanent pasture is given in Figure 4-27 for herbicides and in Figure 4-28 for insecticides, respectively.
0
1
2
AT BE CY CZ DE DK EE ES FI FR GR HU IE IT LT LU LV MT NL PL PT SE SI SK UK0
3000
6000
9000
Cancer (Herbicides) Cancer (Insecticides) Permanent pasture Production Area
Figure 4-27: Permanent Pasture crop-specific distribution of unit values [Euro2000·kg–
1applied] for human health cancer cases for herbicides and insecticides, respectively, in Europe for the year 2000, compared to counrtry-specific production area [1000 ha].
0
25
50
75
AT BE CY CZ DE DK EE ES FI FR GR HU IE IT LT LU LV MT NL PL PT SE SI SK UK0
3000
6000
9000
Non-cancer (Herbicides) Non-cancer (Insecticides) Permanent pasture Production Area
Figure 4-28: Permanent Pasture crop-specific distribution of unit values [Euro2000·kg–
1applied] for human health non-cancer cases for herbicides and insecticides, respectively, in Europe for the year 2000, compared to counrtry-specific production area [1000 ha].
With respect to unit values related to cancer incidences the herbicides are well dominating the overall unit values. A different picture is shown with respect to non-cancer incidences, where insecticides are dominating. This gives a similar picture as for wheat as the unit values for permanent pasture are based on the extrapolation of crop-specific data from wheat.
[€/kg]
[1000ha]
[€/kg]
[1000ha]

Report on Unit Values of Pesticides.
35
5 Conclusions and Outlook
Although it was well beyond the scope of the work within the EXIOPOL project to perform a detailed crop-specific impact assessment of directly applied plant protection products with respect to effects on human health and the environment for all of the considered agricultural produces, at least for some of the most important produces, i.e. paddy rice, wheat and fruit trees, crop-specific data for a wide range of required plant properties have been collected and implemented into the modelling system.
However, as other parameters are at least as important as implementing crop-specific properties, e.g. accurate effect information for performing any health and ecosystem effect assessment, for the most agricultural produces of concern the property information has been extrapolated from commodities where specific information has been gathered. For a detailed discussion of the extrapolation from crop-specific data for rice, wheat and fruit trees to all other considered agricultural commodities according to the GTAP classification please see Section 2.2.
This report nevertheless demonstrates the importance of crop-specific data for all agricultural commodities of concern for being able to follow a contaminant’s way along the impact pathway from application to impact in as specific a way as possible.
It remains to say that for future assessments further crop-specific data have to be implemented into existing impact assessment frameworks to further increase the accuracy of results, e.g. unit values related to the application of plant protection products as part of current and future agricultural practice.

References.
36
List of References
AERU Agriculture and Environment Research Unit (2009). The Pesticide Properties Database (PPDB 2.0) of the FOOTPRINT Project (Creating tools for pesticide risk assessment and management in Europe), University of Hertfordshire, UK.
Alnaji, L.K., and Kadoum, A.M. (1979). Residues on methyl phoxim in wheat and milling fractions. Journal of Agricultural Food Chemistry, 27(3): 583-584.
Bavec, M., Vukovic, K., Grobelnik Mlakar, S., Rozman, C. and Bavec, F. (2007). Leaf Area Index in Winter Wheat: Response on Seed Rate and Nitrogen Application by Different Varieties. Journal of Central European Agriculture 8: 337-342.
Bechini, L., Bocchi, S., Maggiore, T. and Confalonieri, R. (2006). Parameterization of a crop growth and development simulation model at sub-model components level. An example for winter wheat (Triticum aestivum L.). Environmental Modelling and Software 21: 1042-1054.
Bouman, B.A.M., Humphreys, E., Tuong, T.P. and Barker, R. (2007). Rice and Water. Advances in Agronomy 92: 187-237.
Brandes, L.J., Hollander, H.d. and Meent, D.v.d. (1996). SimpleBox 2.0: a nested multimedia fate model for evaluating the environmental fate of chemicals. 156. Bilthoven/Netherlands: National Institute for Public Health and the Environment (RIVM).
Capri, E. and Karpouzas, D. (2008). Pesticide Risk Assessment in Rice Paddies: Theory and Practice. Amsterdam: Elsevier.
Charles, R. (2004). Modelling Pesticides Residues. Institut des Sciences et Technologies de L'environment. Lausanne, Ecóle Polytechnique Fédérale de Lausanne: 235 pp.
Cohen, J.E. (1996). How many people can the earth support? New York: Norton, W. W. and Company, Inc.
EFSA European Food Safety Authority (2006). Pesticides are EU citizens’ top food-related health concern. Available online at: http://www.euractiv.com.
European Commission (1991). Council Directive 91/414/EEC of 15 July 1991 concerning the placing of plant protection products on the market, Commission of the European Communities, Brussels: 290 pp.
European Commission (2003). Technical Guidance Document in support of Commission Directive 93/67/EEC on Risk Assessment for new notified substances, Commission Regulation (EC) No 1488/94 on Risk Assessment for existing substances and Directive 98/8/EC of the European Parliament and of the Council concerning the placing of biocidal products on the market, 2nd Edition. E.C. Bureau. Luxembourg, Commission of the European Communities, Joint Research Center. EUR 20418 EN/1-4.
European Commission. 2009. EU pesticide residues database. EC, Brussels.
Eurostat (2007): The use of plant protection products in the European Union. Data 1992-2003. Eurostat Statistical books, 2007 edition.
Ewert, F., Rounsevell, M.D.A., Reginster, I., Metzger, M.J. and Leemans, R. (2005). Future scenarios of European agricultural land use: I. Estimating changes in crop productivity. Agriculture, Ecosystems and Environment 107: 101-116.
Fantke, P., Jolliet, O., Hayashi, K., Charles, R. and Friedrich, R. (2010). Dynamic Modelling of Pesticides in Agricultural Products and related Impacts on Human

References.
37
Health and the Environment. 20th SETAC Europe Annual Meeting, Seville, Spain. (submitted).
FAOSTAT (2009): Food and Agricultural commodities production. Available online at: http://faostat.fao.org/site/567/default.aspx
GCPF Global Crop Protection Federation (2008). Catalogue of pesticide formulation types and international coding system. Technical Monograph No 2 - 6th edition. Brussels, Global Crop Protection Federation.
Inao, K. and Y. Kitamura (1999). Pesticide paddy field model (PADDY) for predicting pesticide concentrations in water and soil in paddy fields. Pesticide Science 55(1): 38-46.
Inao, K., Watanabe, H., Karpouzas, D.G. and Capri, E. (2008). Simulation Models of Pesticide Fate and Transport in Paddy Environment for Ecological Risk Assessment and Management. Japan Agricultural Research Quarterly 42: 13-21.
Jolliet, O. and M.Z. Hauschild (2005). Modeling the Influence of Intermittent Rain Events on Long-Term Fate and Transport of Organic Air Pollutants. Environmental Science and Technology 39(12): 4513-4522.
Juraske, R., F. Castells, A. Vijay, P. Muñoz and A. Antón (2009). Uptake and persistence of pesticides in plants: Measurements and model estimates for imidacloprid after foliar and soil application. Journal of Hazardous Materials 165(1-3): 683-689.
Kaushik, G., Satya, S. and Naik, S.N. (2009). Food processing a tool to pesticide residue dissipation - A review. Food Research International 42: 26-40.
Keller, E.R., Hanus, H. and Heyland, K.-U. (1997). Handbuch des Pflanzenbaus Band 1 - Grundlagen der landwirtschaftlichen Pflanzenproduktion. Stuttgart: Verlag Eugen Ulmer.
Mackay, D. (2001). Multimedia Environmental Models: The Fugacity Approach, Second Edition. CRC Press, Taylor and Francis Group, Chelsea, Michigan.
Mackay, D., W.Y. Shiu, K.-C. Ma and S.C. Lee (2006). Handbook of Physical-Chemical Properties and Environmental Fate for Organic Chemicals, Second Edition. CRC Press, Taylor and Francis Group, Boca Raton, Florida.
Mackova, M., D. Dowling and T. Macek (2006). Phytoremediation and Rhizoremediation. Springer Press, Dordrecht, The Netherlands.
Pennington, D.W., Margni, M.D., Ammann, C. and Jolliet, O. (2005). Multimedia Fate and Human Intake Modeling: Spatial versus Nonspatial Insights for Chemical Emissions in Western Europe. Environmental Science and Technology 39: 1119-1128.
Pigna, M., Cozzolino, V., Violante, A. and Meharg, A.A. (2009). Influence of Phosphate on the Arsenic Uptake by Wheat ( Triticum durum L.) Irrigated with Arsenic Solutions at Three Different Concentrations. Water, Air and Soil Pollution 197: 371-380.
Rao, A.N., D.E. Johnson, B. Sivaprasad, J.K. Ladha, and A.M. Mortimer. (2007). Weed management in direct-seeded rice. Advances in Agronomy 93:153-255.
Rosenbaum, R., M. Margni, R. Charles, J. Payet, O. Jolliet, A.d. Koning, J. Guinée, T.M. Bachmann, S.I. Olsen, H.F. Larsen, M. Birkved, M.Z. Hauschild and S. Molander (2004). Implementation of the OMNIITOX Base Model. Deliverable 41A of the EU 5th Framework Project Operational Models aNd Information tools for Industrial applications of eco/TOXicological impact assessments (OMNIITOX).

References.
38
Saka, M., Iijima, K., Nishida, M., Koma, Y., Hasegawa, N., Sato, K. and Kato, Y. (2008). Effects of Processing and Cooking on the Levels of Pesticide Residues in Rice Samples. Journal of the Food Hygienic Society of Japan (Shokuhin Eiseigaku Zasshi) 49: 141-149.
Sharma, J., Satya, S., Kumar, V., and Tewary, D.K. (2005). Dissipation of pesticides during bread making. Journal of Chemical Health and Food Safety: 17-22.
Schwarzenbach, R.P., Gschwend, P.M. and Imboden, D.M. (1993). Environmental Organic Chemistry. New York: John Wiley and Sons, Inc.
Schwarzenbach, R.P., Gschwend, P.M. and Imboden, D.M. (2003). Environmental Organic Chemistry, 2nd Edition. New York: John Wiley and Sons, Inc.
Seinfeld, J.H. and S.N. Pandis (2006). Atmospheric Chemistry and Physics: from Air Pollution to Climate Change, Second Edition. John Wiley and Sons, New York.
Stroppiana, D., Boschetti, M., Confalonieri, R., Bocchi, S. and Brivio, P.A. (2006). Evaluation of LAI-2000 for leaf area index monitoring in paddy rice. Field Crop Research 99: 167-170.
Tomlin, C. (2006). The Pesticide Manual, Fourteenth Edition. BCPC Publications, British Crop Protection Council, Hampshire, UK.
Trapp, S. and J.C. Mc Farlane (1995). Plant Contamination: Modeling and Simulation of Organic Chemical Processes. Lewis Publishers, Boca Raton.
Trapp, S. and M. Matthies (1998). Chemodynamics and environmental modeling: An introduction. Berlin Heidelberg New York, Springer Press.
Trapp, S. (2002). Dynamic root uptake model for neutral lipoohilic organics. Environmental Toxicology and Chemistry 21: 203-206.
Trapp, S., Rasmussen, D. and Samsøe-Petersen, L. (2003). Fruit tree model for uptake of organic compounds from soil. SAR and QSAR in Environmental Research 14: 17-26.
Trapp, S, Kulhanek, A. (2006). Human Exposure Assessment for Food – One Equation for all Crops is not enough. In: Mackova, M, Dowling, D, Macek, T, editors. Phytoremediation and Rhizoremediation. Dordrecht, The Netherlands: Springer. p. 285-300.
Trapp, S. (2007). Fruit Tree model for uptake of organic compounds from soil and air. SAR and QSAR in Environmental Research 18(3 & 4): 367-387.
Undeman, E., G. Czub and M.S. McLachlan (2009). Addressing Temporal Variability When Modeling Bioaccumulation in Plants. Environmental Science and Technology 43(10): 3751-3756.
US-EPA United States - Environmental Protection Agency (2008). Estimation Programs Interface SuiteTM for Microsoft Windows, v 4.00. Washington, D.C., United States - Environmental Protection Agency.
Uygun, U., Koksel, H., and Atli, A. (2005). Residue levels of malathion and its metabolites and fenitrothion in post-harvest treated wheat during storage, milling and baking. Food Chemistry, 92: 643-647.
Vaclavik, V., and E.W. Christian. (2007). Essentials in food science. Food Science Texts Series. Springer, 3 edition.
Walker, C.H., Hopkin, S.P., Sibly, R.M. and Peakall, D.B. (2005). Principles of Ecotoxicology. Boca Raton, Florida: CRC Press, Taylor and Francis Group.
References.
39
Wilkin, D.R., and Fishwick, F.B. (1981). Residues of organophosphorous pesticides in wholemeal flour and bread produced from treated wheat. In British crop protection conference - pests and diseases, proceedings, 11th (Vol. 1: 183-187).
Willmer, C. and Fricker, M. (1996). Stomata, 2nd Edition. London: Chapman and Hall.
Yoshida, S. (1981). Fundamentals of rice crop science. Los Baños, Philippines: IRRI International Rice Research Institute.

Annex.
40
ANNEX

Annex.
41
Annex I: Differentiation of Agricultural Produces (NACE 1.1)
Originally, the agricultural produces to be considered for an assessment of the impacts on human health and the environment due to the direct application of plant protection products were differentiated according to NACE 1.1 as given in Table Annex 1. However, it has been agreed among the partners of the EXIOPOL project to take the categorisation of agricultural commodities according to the Global Trade Analysis Project (GTAP) as basis for the assessment of impacts related to the direct application of plant protection products as part of current agricultural practice. The classification according to GTAP has been discussed before and the categories are summarised in Table 2-1.
Table Annex 1: Sectors as defined in Table A III.2 of EXIOPOL Deliverable D III.1.a: Code and level correspond with NACE 1.1; a letter is used if an own sub-classification had to be used.
No Code Level Description
1 01.a 4 Cultivation of Paddy rice
2 01.b 4 Cultivation of Wheat
3 01.c 4 Cultivation of Cereal grains n.e.c.
4 01.d 4 Cultivation of Vegetables, fruit, nuts
5 01.e 4 Cultivation of Oil seeds
6 01.f 4 Cultivation of Sugar cane, sugar beet
7 01.g 4 Cultivation of Plant-based fibres
8 01.h 4 Cultivation of Crops n.e.c.
9 01.i 4 Cattle farming
10 01.j 4 Pigs farming
11 01.k 4 Poultry farming
12 01.l 4 Meat animals n.e.c.
13 01.m 4 Animal products n.e.c.
14 01.n 4 Raw milk
15 01.o 4 Wool, silk-worm cocoons
Key: n.e.c. not elsewhere classified (Source: NACE Rev. 1 General Industrial Classification of Economic Activities within the European Communities, Revision 1: http://ec.europa.eu/eurostat/ramon/nomenclatures/index.cfm?TargetUrl=LST_CLS_DLD&StrNom=NACE_1_1)

Annex.
42
Annex II: Consumption Distribution of different Agricultural Commodities
In this section, the consumption pattern of the considered agricultural produces in the whole EU-27, i.e. country-specific consumption amounts, are presented. This reflects an overview of the consumption amount per country for all EU-27 countries as given in Table Annex 2, which may serve as input for an impact assessment from the consumer’s instead of a producer’s perspective. For a discussion of the different perspectives of such an impact assessment of plant protection products in Europe please see Chapter 1.
Table Annex 2: Consumption amount of commodities within the agricultural sector for the year 2000 as used for the estimation of impacts on human health and the environment due to the direct application of plant protection products in EXIOPOL*.
No Code Consumption (EU)
[1000 tonnes]
Fraction on total Consumption of
considered Commodities
1 Rice 2,291.1 1.2%
2 Wheat 52,778.4 27.6%
3 Other cereals 5,262.4 2.7%
4 Roots and tubers 36,439.5 19.0%
5 Sugar crops 15,903.0 8.3%
6 Pulses 1,105.7 0.6%
7 Nuts 1,292.9 0.7%
8 Oil crops 7,419.7 3.9%
9 Vegetables 34,942.7 18.2%
10 Fruits 34,081.5 17.8%
11 Fibres 0.0 0.0%
12 Other crops 0.0 0.0%
13 Fodder crops 0.0 0.0%
14 Permanent pasture 0.0 0.0%
- TOTAL 191,517.0 100.0%*Source: Eurostat (2007).

Annex.
43
Annex III: Application Distribution to different Agricultural Commodities
According to national statistics, the application amount of plant protection products is mostly dis-aggregated not according to either the NACE or the GTAP code, but according to practical issues. Hence, the categorisation differs used in most national statistics differs from the categorisation as used for the estimation of impacts on human health and the environment throughout this study.
This means, that the following Table Annex 3 is not given to be used for a direct comparison with the fraction of the production areas of the different agricultural commodities as presented in the subsequent section. It is rather given as an overview of the distribution of the application of plant protection products in the various countries and to demonstrate the variety among them. However, as sometimes the same aggregation level is used in different categorisation schemes, some of the categories as shown in Table Annex 3 match a category according GTAP.
.
Table Annex 3: Fraction of application amount of most important plant protection products as used in this study for the year 2000 to the overall amount applied in the considered countries (sum over herbicides and insecticides).
Cou
ntr
y
Cer
eals
Mai
ze
Oil
see
ds
Pot
atoe
s
Su
gar
beet
Gra
pe &
vin
e
Fru
it t
rees
Veg
etab
les
AT 42% 13% 5% 7% 5% 20% 6% 1%
BE 28% 9% 1% 32% 12% 0% 9% 9%
BG n/a n/a n/a n/a n/a n/a n/a n/a
CY 0% 0% 0% 0% 0% 75% 0% 25%
CZ 59% 10% 12% 6% 8% 2% 2% 1%
DE 62% 6% 7% 7% 6% 8% 3% 1%
DK 72% 0% 1% 9% 9% 0% 3% 6%
EE 56% 0% 33% 8% 2% 0% 0% 2%
ES 11% 3% 3% 3% 8% 34% 13% 26%
FI 70% 0% 0% 15% 10% 0% 2% 2%
FR 37% 14% 9% 6% 3% 24% 3% 4%
GR 3% 3% 3% 3% 1% 65% 16% 5%
HU 17% 36% 12% 3% 3% 15% 10% 5%
IE 75% 0% 0% 18% 6% 0% 0% 0%
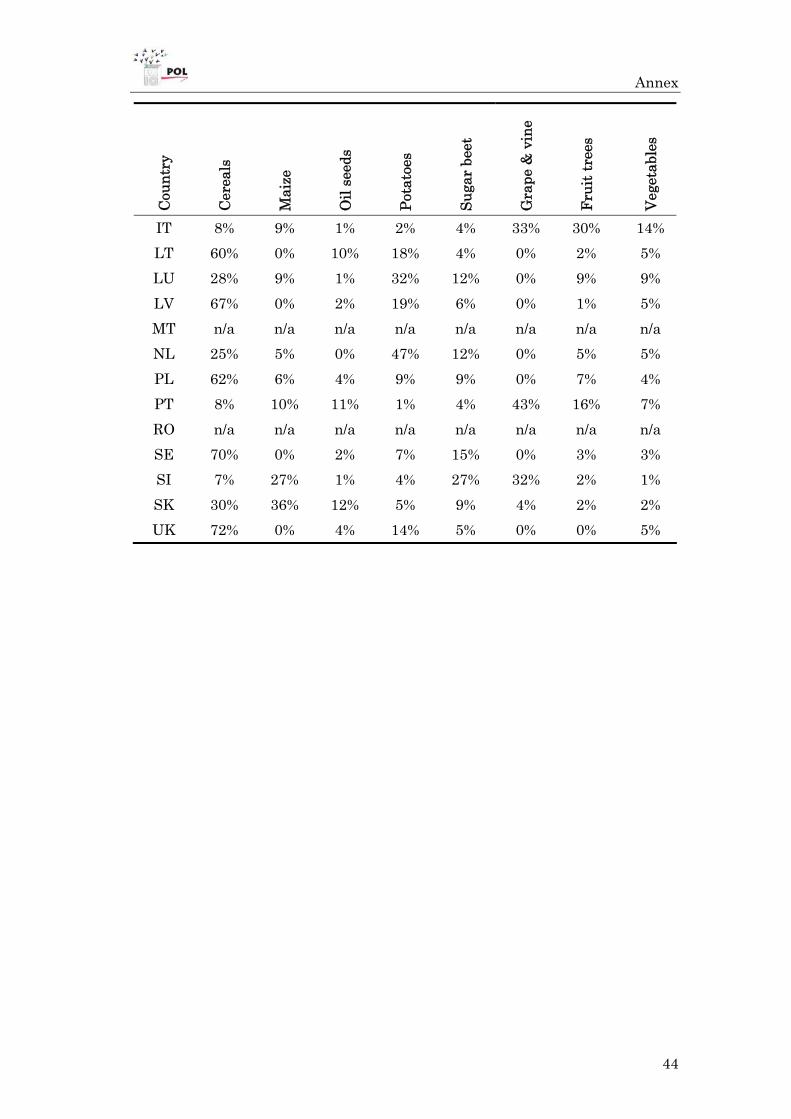
Annex.
44
Cou
ntr
y
Cer
eals
Mai
ze
Oil
see
ds
Pot
atoe
s
Su
gar
beet
Gra
pe &
vin
e
Fru
it t
rees
Veg
etab
les
IT 8% 9% 1% 2% 4% 33% 30% 14%
LT 60% 0% 10% 18% 4% 0% 2% 5%
LU 28% 9% 1% 32% 12% 0% 9% 9%
LV 67% 0% 2% 19% 6% 0% 1% 5%
MT n/a n/a n/a n/a n/a n/a n/a n/a
NL 25% 5% 0% 47% 12% 0% 5% 5%
PL 62% 6% 4% 9% 9% 0% 7% 4%
PT 8% 10% 11% 1% 4% 43% 16% 7%
RO n/a n/a n/a n/a n/a n/a n/a n/a
SE 70% 0% 2% 7% 15% 0% 3% 3%
SI 7% 27% 1% 4% 27% 32% 2% 1%
SK 30% 36% 12% 5% 9% 4% 2% 2%
UK 72% 0% 4% 14% 5% 0% 0% 5%

Annex.
45
Annex IV: Production Area Distribution of different Agricultural Commodities
In the following, the distribution of the production areas, i.e. crop-specific fractions of production areas per country to the overall agricultural production area in the country are given in order to give an impression of the distribution of the importance of the production of the various agricultural produces in Europe.
.
Table Annex 4: Fraction of production area of the agricultural commodities categorised according to GTAP as used in this study for the year 2000 to the overall agricultural production area in each country (Part I).
Cou
ntr
y
Ric
e
Wh
eat
Oth
er c
erea
ls
Roo
ts a
nd
tube
rs
Su
gar
crop
s
Pu
lses
Nu
ts
AT 0.0% 9.1% 16.5% 0.7% 1.3% 1.4% 0.0%
BE 0.0% 15.3% 7.3% 4.8% 6.5% 0.2% 0.0%
BG 0.1% 23.4% 18.3% 1.1% 0.0% 0.9% 0.0%
CY 0.0% 4.5% 32.9% 4.8% 0.0% 0.6% 2.8%
CZ 0.0% 24.5% 17.1% 1.8% 1.5% 1.0% 0.0%
DE 0.0% 18.4% 25.1% 1.9% 2.8% 1.1% 0.0%
DK 0.0% 23.3% 33.1% 1.5% 2.2% 1.3% 0.0%
EE 0.0% 7.2% 27.3% 3.5% 0.0% 0.4% 0.0%
ES 0.5% 10.6% 19.6% 0.8% 0.6% 2.1% 3.1%
FI 0.0% 7.4% 50.5% 1.6% 1.6% 0.6% 0.0%
FR 0.1% 18.6% 13.5% 0.7% 1.5% 1.7% 0.1%
GR 0.4% 14.9% 6.5% 0.6% 0.9% 0.4% 0.8%
HU 0.1% 18.2% 30.8% 0.8% 1.0% 0.6% 0.0%
IE 0.0% 2.1% 5.5% 0.4% 0.9% 0.0% 0.0%
IT 1.5% 15.3% 10.5% 0.5% 1.6% 0.5% 1.1%
LT 0.0% 13.2% 21.6% 3.9% 1.0% 1.4% 0.0%
LU 0.0% 8.1% 13.1% 0.6% 0.0% 0.3% 0.1%
LV 0.0% 10.7% 17.7% 3.5% 0.9% 0.1% 0.0%
MT 0.0% 20.9% 4.4% 16.6% 0.0% 4.5% 0.0%
NL 0.0% 7.4% 4.8% 9.7% 6.0% 0.2% 0.0%
PL 0.0% 16.1% 37.8% 7.7% 2.0% 0.9% 0.0%

Annex.
46
Cou
ntr
y
Ric
e
Wh
eat
Oth
er c
erea
ls
Roo
ts a
nd
tube
rs
Su
gar
crop
s
Pu
lses
Nu
ts
PT 0.7% 6.4% 9.2% 1.9% 0.2% 0.7% 2.0%
RO 0.0% 14.0% 26.8% 2.0% 0.3% 0.3% 0.0%
SE 0.0% 14.9% 29.9% 1.2% 2.1% 1.0% 0.0%
SI 0.0% 7.5% 12.8% 2.4% 1.6% 0.1% 0.0%
SK 0.0% 17.6% 18.7% 1.2% 1.4% 0.9% 0.0%
UK 0.0% 13.4% 8.1% 1.3% 1.1% 1.3% 0.0%
Table Annex 5: Fraction of production area of the agricultural commodities categorised according to GTAP as used in this study for the year 2000 to the overall agricultural production area in each country (Part II).
Cou
ntr
y
Oil
cro
ps
Veg
etab
les
Fru
its
Fib
res
Oth
er c
rops
Fod
der
crop
s
Per
man
ent
past
ure
AT 3.3% 0.4% 1.7% 0.0% 0.1% 6.3% 59.1%
BE 0.3% 3.7% 2.7% 1.0% 1.3% 20.6% 36.3%
BG 12.8% 0.9% 0.3% 0.2% 1.4% 3.2% 37.4%
CY 5.4% 2.8% 23.3% 0.0% 0.1% 21.9% 0.8%
CZ 10.2% 0.8% 0.4% 0.0% 0.3% 18.3% 24.2%
DE 6.9% 0.6% 1.0% 0.6% 0.2% 10.1% 31.3%
DK 3.7% 0.4% 0.3% 0.0% 0.2% 27.8% 6.2%
EE 3.0% 0.4% 1.2% 0.0% 0.0% 43.1% 13.8%
ES 15.3% 2.2% 7.7% 0.5% 0.2% 5.1% 31.8%
FI 2.6% 0.5% 0.4% 0.1% 0.2% 33.3% 1.3%
FR 7.1% 1.0% 3.9% 0.2% 0.2% 15.9% 35.5%
GR 18.9% 4.9% 6.2% 7.2% 1.0% 5.4% 32.0%
HU 8.3% 1.6% 3.6% 0.0% 0.2% 16.2% 18.7%
IE 0.1% 0.2% 0.0% 0.0% 0.0% 0.4% 90.4%
IT 11.0% 3.6% 10.5% 0.0% 0.3% 15.0% 28.7%
LT 2.0% 1.4% 1.5% 0.3% 0.0% 36.1% 17.7%

Annex.
47
Cou
ntr
y
Oil
cro
ps
Veg
etab
les
Fru
its
Fib
res
Oth
er c
rops
Fod
der
crop
s
Per
man
ent
past
ure
LU 2.4% 0.1% 2.6% 0.0% 0.1% 24.4% 48.3%
LV 0.5% 0.7% 0.8% 0.1% 0.1% 24.3% 40.8%
MT 0.0% 0.0% 5.4% 0.0% 0.0% 39.4% 8.8%
NL 0.1% 4.0% 1.2% 0.0% 0.8% 17.3% 48.5%
PL 2.8% 1.5% 2.4% 0.0% 0.2% 4.8% 23.7%
PT 11.5% 1.5% 10.9% 0.0% 0.1% 16.0% 39.0%
RO 7.7% 2.0% 3.3% 0.0% 0.2% 7.5% 35.7%
SE 1.8% 0.2% 0.2% 0.0% 0.0% 34.9% 13.8%
SI 0.4% 0.6% 4.2% 0.0% 0.4% 9.5% 60.5%
SK 7.6% 1.9% 1.1% 0.1% 0.1% 12.5% 36.9%
UK 2.6% 0.8% 0.2% 0.5% 0.0% 8.6% 62.1%

Annex.
48
Annex V: Crop-specific Unit Values for different Human Health End-points
As a more detailed information about the contribution of the considered human health end-points according to the dis-aggregation in Rosenbaum et al. (2008), dis-aggregated unit values are presented for different end-points in the following. In particular, dis-aggregated unit values according to the distinction between cancer and non-cancer cases can be found in Table Annex 6 and Table Annex 7 for herbicides and in Table Annex 8 and Table Annex 9 for insecticides, respectively.
Table Annex 6: Crop-specific unit values [Euro2000·kg–1applied·year–1] for human health (cancer incidences) for the year 2000 for herbicides for all considered countries.
Country
Ric
e
Wh
eat
Oth
er c
erea
ls
Roo
ts a
nd
tube
rs
Su
gar
crop
s
Pu
lses
Nu
ts
Oil
cro
ps
Veg
etab
les
Fru
its
Fib
res
Oth
er c
rops
Fod
der
crop
s
Per
man
ent
past
ure
AT - 0.3 0.3 0.3 0.3 0.3 - 0.3 0.3 0.5 - 0.3 0.3 0.3
BE - 1.1 1.1 1.1 1.1 1.1 - 1.1 1.1 1.0 1.1 1.1 1.1 1.1
BG n/a n/a n/a n/a n/a n/a n/a n/a n/a n/a n/a n/a n/a n/a
CY - 0.4 0.4 0.4 - 0.4 0.5 0.4 0.4 0.5 - 0.4 0.4 0.4
CZ - 0.6 0.6 0.6 0.6 0.6 0.6 0.6 0.6 0.6 - 0.6 0.6 0.6
DE - - - - - - - - - - - - - -
DK - 0.1 0.1 0.1 0.1 0.1 - 0.1 0.1 0.1 - 0.1 0.1 0.1
EE - 1.9 1.9 1.9 - 1.9 - 1.9 1.9 3.1 1.9 1.9 1.9 1.9
ES 24.9 0.6 0.6 0.6 0.6 0.6 0.4 0.6 0.6 0.4 0.6 0.6 0.6 0.6
FI - 0.5 0.5 0.5 0.5 0.5 - 0.5 0.5 0.8 0.5 0.5 0.5 0.5
FR 0.9 0.2 0.2 0.2 0.2 0.2 0.3 0.2 0.2 0.3 0.2 0.2 0.2 0.2
GR 28.4 0.7 0.7 0.7 0.7 0.7 0.5 0.7 0.7 0.5 0.7 0.7 0.7 0.7
HU 27.1 1.0 1.0 1.0 1.0 1.0 - 1.0 1.0 1.0 1.0 1.0 1.0 1.0
IE - 0.5 0.5 0.5 0.5 0.5 - 0.5 0.5 0.8 - - 0.5 0.5
IT 1.2 0.3 0.3 0.3 0.3 0.3 0.4 0.3 0.3 0.4 0.3 0.3 0.3 0.3
LT - 0.8 0.8 0.8 0.8 0.8 - 0.8 0.8 1.4 0.8 0.8 0.8 0.8
LU - 1.1 1.1 1.1 - 1.1 1.0 1.1 1.1 1.0 - 1.1 1.1 1.1
LV - 0.8 0.8 0.8 0.8 0.8 - 0.8 0.8 1.3 0.8 0.8 0.8 0.8

Annex.
49
Country
Ric
e
Wh
eat
Oth
er c
erea
ls
Roo
ts a
nd
tube
rs
Su
gar
crop
s
Pu
lses
Nu
ts
Oil
cro
ps
Veg
etab
les
Fru
its
Fib
res
Oth
er c
rops
Fod
der
crop
s
Per
man
ent
past
ure
MT - - - - - - - - - - - - - -
NL - 0.0 0.0 0.0 0.0 0.0 - 0.0 0.0 0.0 0.0 0.0 0.0 0.0
PL - 0.8 0.8 0.8 0.8 0.8 - 0.8 0.8 0.8 0.8 0.8 0.8 0.8
RO n/a n/a n/a n/a n/a n/a n/a n/a n/a n/a n/a n/a n/a n/a
PT 36.2 0.9 0.9 0.9 0.9 0.9 0.6 0.9 0.9 0.6 0.9 0.9 0.9 0.9
SE - 0.1 0.1 0.1 0.1 0.1 - 0.1 0.1 0.1 - - 0.1 0.1
SI - 0.7 0.7 0.7 0.7 0.7 1.1 0.7 0.7 1.1 - 0.7 0.7 0.7
SK - 0.8 0.8 0.8 0.8 0.8 - 0.8 0.8 0.8 0.8 0.8 0.8 0.8
UK - 0.5 0.5 0.5 0.5 0.5 - 0.5 0.5 0.7 0.5 0.5 0.5 0.5
Table Annex 7: Crop-specific unit values [Euro2000·kg–1applied·year–1] for human health (non-cancer incidences) for the year 2000 for herbicides for all considered countries.
Country
Ric
e
Wh
eat
Oth
er c
erea
ls
Roo
ts a
nd
tube
rs
Su
gar
crop
s
Pu
lses
Nu
ts
Oil
cro
ps
Veg
etab
les
Fru
its
Fib
res
Oth
er c
rops
Fod
der
crop
s
Per
man
ent
past
ure
AT - 0.7 0.7 0.7 0.7 0.7 - 0.7 0.7 1.1 - 0.7 0.7 0.7
BE - 1.0 1.0 1.0 1.0 1.0 - 1.0 1.0 1.4 1.0 1.0 1.0 1.0
BG n/a n/a n/a n/a n/a n/a n/a n/a n/a n/a n/a n/a n/a n/a
CY - 0.0 0.0 0.0 - 0.0 0.1 0.0 0.0 0.1 - 0.0 0.0 0.0
CZ - 0.7 0.7 0.7 0.7 0.7 0.9 0.7 0.7 0.9 - 0.7 0.7 0.7
DE - 0.0 0.0 0.0 0.0 0.0 0.0 0.0 0.0 0.0 0.0 0.0 0.0 0.0
DK - 0.0 0.0 0.0 0.0 0.0 - 0.0 0.0 0.1 - 0.0 0.0 0.0
EE - 4.5 4.5 4.5 - 4.5 - 4.5 4.5 7.4 4.5 4.5 4.5 4.5
ES 8.2 0.2 0.2 0.2 0.2 0.2 0.1 0.2 0.2 0.1 0.2 0.2 0.2 0.2
FI - 1.4 1.4 1.4 1.4 1.4 - 1.4 1.4 1.8 1.4 1.4 1.4 1.4
FR 4.7 0.5 0.5 0.5 0.5 0.5 0.8 0.5 0.5 0.8 0.5 0.5 0.5 0.5

Annex.
50
Country
Ric
e
Wh
eat
Oth
er c
erea
ls
Roo
ts a
nd
tube
rs
Su
gar
crop
s
Pu
lses
Nu
ts
Oil
cro
ps
Veg
etab
les
Fru
its
Fib
res
Oth
er c
rops
Fod
der
crop
s
Per
man
ent
past
ure
GR 12.5 0.3 0.3 0.3 0.3 0.3 0.2 0.3 0.3 0.2 0.3 0.3 0.3 0.3
HU 11.4 1.0 1.0 1.0 1.0 1.0 - 1.0 1.0 1.4 1.0 1.0 1.0 1.0
IE - 1.4 1.4 1.4 1.4 1.4 - 1.4 1.4 2.0 - - 1.4 1.4
IT 10.5 2.4 2.4 2.4 2.4 2.4 3.3 2.4 2.4 3.3 2.4 2.4 2.4 2.4
LT - 2.0 2.0 2.0 2.0 2.0 - 2.0 2.0 3.3 2.0 2.0 2.0 2.0
LU - 1.0 1.0 1.0 - 1.0 1.4 1.0 1.0 1.4 - 1.0 1.0 1.0
LV - 2.1 2.1 2.1 2.1 2.1 - 2.1 2.1 3.2 2.1 2.1 2.1 2.1
MT - - - - - - - - - - - - - -
NL - 2.0 2.0 2.0 2.0 2.0 - 2.0 2.0 0.0 2.0 2.0 2.0 2.0
PL - 0.9 0.9 0.9 0.9 0.9 - 0.9 0.9 1.1 0.9 0.9 0.9 0.9
RO n/a n/a n/a n/a n/a n/a n/a n/a n/a n/a n/a n/a n/a n/a
PT 11.5 0.3 0.3 0.3 0.3 0.3 0.2 0.3 0.3 0.2 0.3 0.3 0.3 0.3
SE - 0.0 0.0 0.0 0.0 0.0 - 0.0 0.0 0.1 - - 0.0 0.0
SI - 1.7 1.7 1.7 1.7 1.7 2.8 1.7 1.7 2.8 - 1.7 1.7 1.7
SK - 2.1 2.1 2.1 2.1 2.1 - 2.1 2.1 1.1 2.1 2.1 2.1 2.1
UK - 4.2 4.2 4.2 4.2 4.2 - 4.2 4.2 1.7 4.2 4.2 4.2 4.2
Table Annex 8: Crop-specific unit values [Euro2000·kg–1applied·year–1] for human health (cancer incidences) for the year 2000 for insecticides for all considered countries.
Country
Ric
e
Wh
eat
Oth
er c
erea
ls
Roo
ts a
nd
tube
rs
Su
gar
crop
s
Pu
lses
Nu
ts
Oil
cro
ps
Veg
etab
les
Fru
its
Fib
res
Oth
er c
rops
Fod
der
crop
s
Per
man
ent
past
ure
AT - - - - - - - - - - - - - -
BE - - - - - - - - - - - - - -
BG n/a n/a n/a n/a n/a n/a n/a n/a n/a n/a n/a n/a n/a n/a
CY - - - - - - - - - - - - - -

Annex.
51
Country
Ric
e
Wh
eat
Oth
er c
erea
ls
Roo
ts a
nd
tube
rs
Su
gar
crop
s
Pu
lses
Nu
ts
Oil
cro
ps
Veg
etab
les
Fru
its
Fib
res
Oth
er c
rops
Fod
der
crop
s
Per
man
ent
past
ure
CZ - - - - - - - - - - - - - -
DE - - - - - - - - - - - - - -
DK - - - - - - - - - - - - - -
EE - - - - - - - - - - - - - -
ES 76.3 - - - - - 38.5 - - 38.5 - - - -
FI - - - - - - - - - - - - - -
FR - - - - - - - - - - - - - -
GR 236.4 0.4 0.4 0.4 0.4 0.4 0.2 0.4 0.4 0.2 0.4 0.4 0.4 0.4
HU 295.5 0.5 0.5 0.5 0.5 0.5 - 0.5 0.5 0.2 0.5 0.5 0.5 0.5
IE - - - - - - - - - - - - - -
IT - - - - - - - - - - - - - -
LT - - - - - - - - - - - - - -
LU - - - - - - - - - - - - - -
LV - - - - - - - - - - - - - -
MT - - - - - - - - - - - - - -
NL - - - - - - - - - - - - - -
PL - - - - - - - - - - - - - -
RO n/a n/a n/a n/a n/a n/a n/a n/a n/a n/a n/a n/a n/a n/a
PT - - - - - - - - - - - - - -
SE - - - - - - - - - - - - - -
SI - - - - - - - - - - - - - -
SK - - - - - - - - - - - - - -
UK - - - - - - - - - - - - - -
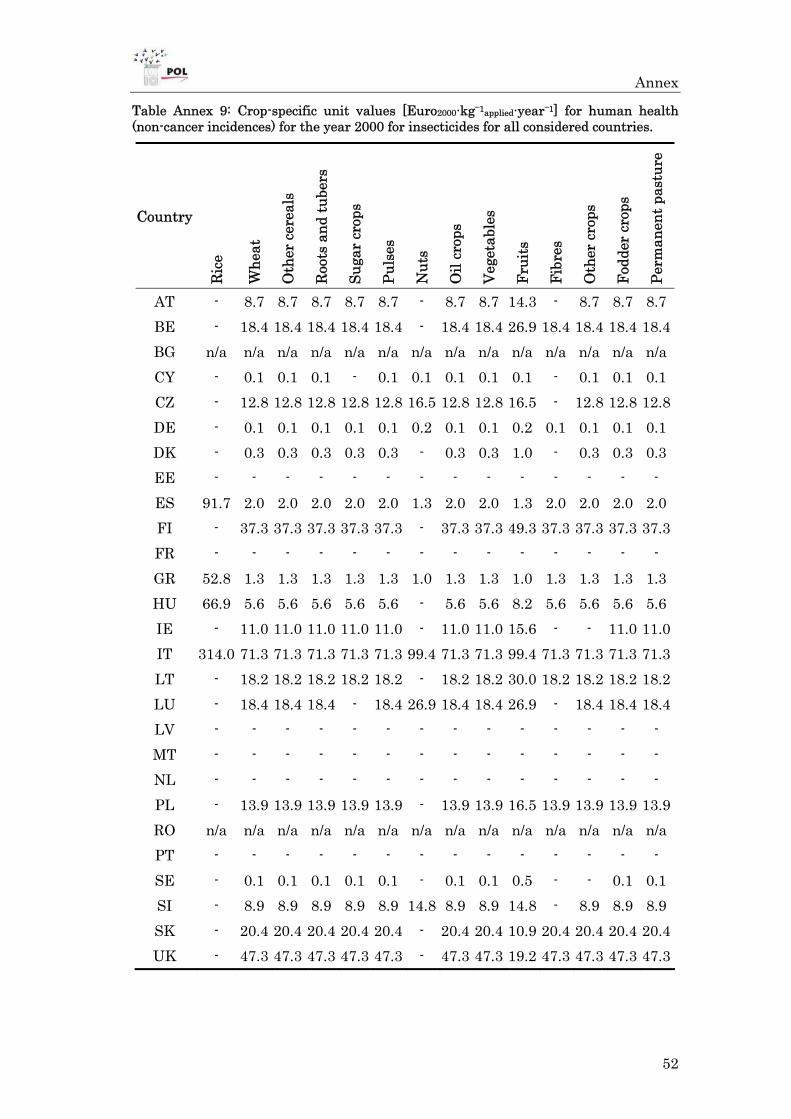
Annex.
52
Table Annex 9: Crop-specific unit values [Euro2000·kg–1applied·year–1] for human health (non-cancer incidences) for the year 2000 for insecticides for all considered countries.
Country R
ice
Wh
eat
Oth
er c
erea
ls
Roo
ts a
nd
tube
rs
Su
gar
crop
s
Pu
lses
Nu
ts
Oil
cro
ps
Veg
etab
les
Fru
its
Fib
res
Oth
er c
rops
Fod
der
crop
s
Per
man
ent
past
ure
AT - 8.7 8.7 8.7 8.7 8.7 - 8.7 8.7 14.3 - 8.7 8.7 8.7
BE - 18.4 18.4 18.4 18.4 18.4 - 18.4 18.4 26.9 18.4 18.4 18.4 18.4
BG n/a n/a n/a n/a n/a n/a n/a n/a n/a n/a n/a n/a n/a n/a
CY - 0.1 0.1 0.1 - 0.1 0.1 0.1 0.1 0.1 - 0.1 0.1 0.1
CZ - 12.8 12.8 12.8 12.8 12.8 16.5 12.8 12.8 16.5 - 12.8 12.8 12.8
DE - 0.1 0.1 0.1 0.1 0.1 0.2 0.1 0.1 0.2 0.1 0.1 0.1 0.1
DK - 0.3 0.3 0.3 0.3 0.3 - 0.3 0.3 1.0 - 0.3 0.3 0.3
EE - - - - - - - - - - - - - -
ES 91.7 2.0 2.0 2.0 2.0 2.0 1.3 2.0 2.0 1.3 2.0 2.0 2.0 2.0
FI - 37.3 37.3 37.3 37.3 37.3 - 37.3 37.3 49.3 37.3 37.3 37.3 37.3
FR - - - - - - - - - - - - - -
GR 52.8 1.3 1.3 1.3 1.3 1.3 1.0 1.3 1.3 1.0 1.3 1.3 1.3 1.3
HU 66.9 5.6 5.6 5.6 5.6 5.6 - 5.6 5.6 8.2 5.6 5.6 5.6 5.6
IE - 11.0 11.0 11.0 11.0 11.0 - 11.0 11.0 15.6 - - 11.0 11.0
IT 314.0 71.3 71.3 71.3 71.3 71.3 99.4 71.3 71.3 99.4 71.3 71.3 71.3 71.3
LT - 18.2 18.2 18.2 18.2 18.2 - 18.2 18.2 30.0 18.2 18.2 18.2 18.2
LU - 18.4 18.4 18.4 - 18.4 26.9 18.4 18.4 26.9 - 18.4 18.4 18.4
LV - - - - - - - - - - - - - -
MT - - - - - - - - - - - - - -
NL - - - - - - - - - - - - - -
PL - 13.9 13.9 13.9 13.9 13.9 - 13.9 13.9 16.5 13.9 13.9 13.9 13.9
RO n/a n/a n/a n/a n/a n/a n/a n/a n/a n/a n/a n/a n/a n/a
PT - - - - - - - - - - - - - -
SE - 0.1 0.1 0.1 0.1 0.1 - 0.1 0.1 0.5 - - 0.1 0.1
SI - 8.9 8.9 8.9 8.9 8.9 14.8 8.9 8.9 14.8 - 8.9 8.9 8.9
SK - 20.4 20.4 20.4 20.4 20.4 - 20.4 20.4 10.9 20.4 20.4 20.4 20.4
UK - 47.3 47.3 47.3 47.3 47.3 - 47.3 47.3 19.2 47.3 47.3 47.3 47.3