existing conditions assessment - crcog · existing conditions assessment also establishes a...
TRANSCRIPT

Route 6 Hop River Corridor Transportation Study
2-1
2
Existing Conditions Assessment The purpose of the existing conditions assessment is to understand and identify issues, deficiencies, and opportunities that will be addressed under subsequent phases of the study. The existing conditions assessment also establishes a baseline to which anticipated future conditions can be measured and various improvement recommendations can be compared.
2.1 Transportation System The transportation system in the Route 6 Hop River Corridor includes the state and local roadway network, pedestrian and bicycle facilities, and public transit services and amenities that facilitate the mobility of people and goods through and around the corridor. Developing an understanding of the extents, interconnectivity, and conditions of the various components of the transportation system, as well as how efficiently and safely these components function, is an important first step towards identifying how the transportation system can and should be improved over the near term and long term planning horizons.
2.1.1 Roadway Characteristics
This section provides a general description of the physical roadway features (such as travel lanes, shoulders, and alignments) that characterize the Route 6 and Route 66 study corridors. Specific descriptions of pedestrian, bicycle, and transit accommodations that also characterize the study corridors are provided in Section 2.1.3.
Route 6/Route 44 Junction
Route 6 overlaps with Route 44 at the western end of the study corridor in Bolton Notch, just west of Notch Road. This section of roadway is a four-lane divided expressway that serves as an extension of I-384 east of the junction of Route 6 and Route 44 at Route 85. The junction of Route 6 and Route 44 in Bolton Notch – the point where the routes merge/diverge just east of Notch Road – was designed and constructed as an interchange where a system of ramps provide free-flow directional moves between the routes. The interchange-type design is an indication of former CTDOT and FHWA plans to continue I-384 easterly to Providence, Rhode Island. With no state or federal commitment to extend I-384 or to construct a Route 6 expressway easterly from this location in the future, the interchange-type ramp system and its associated expressway-sized guide signs are no longer warranted for this area. Because this area serves as a gateway to the Route 6 corridor for eastbound travelers, an adequate transition in roadway character from I-384 and the expressway section of the Route 6 and Route 44 overlay to the two-lane section of Route 6 is necessary to affect driver behavior and to encourage lower travel speeds for vehicles entering the corridor from the west (see Section 2.1.2 for additional information on travel speeds in the vicinity of the Route 6/44 junction).

Route 6 Hop River Corridor Transportation Study
2-2
In addition to interchange-type character of the Route 6/Route 44 junction, other notable concerns for this location include:
No direct connection from westbound Route 6 to eastbound Route 44;
No direct connection from westbound Route 44 to eastbound Route 6;
Notch Road intersection is located within the diverge area of the ramps to eastbound Route 44 and Route 6. The intersection is also located on the inside of the roadway curve and sight lines to the west are obstructed by rock ledge.
Route 6 between Route 44 and Route 66 East
Route 6 between Route 44 and Route 66 East is a two-lane roadway that generally consists of two 12 ft travel lanes with 8 ft shoulders on both sides of the road. Left turn lanes are provided at many side road intersections to more safely accommodate turning vehicles and to help preserve through traffic flow. Right turn lanes are also provided at several side road intersections. In total, there are 22 unsignalized intersections and five signalized intersections along Route 6 in the study corridor. Signalized intersections include Long Hill Road, Route 316, Lake Road, Route 87, and Route 66. See Table A2-1 in Appendix 2.1 for a detailed summary of the characteristics of each intersection.
The alignment and grade of Route 6 generally follow the natural topography of the area and are characterized by many gradual curves with few, long straight sections of roadway between, and some long gradual grades and other generally flat areas. There are no passing zones along this section.
Route 6/Route 66 Intersection
Route 6 intersects with Route 66 at a four-legged signalized intersection in Columbia. The intersection is skewed with Route 6 turning approximately 70 degrees to the left (north) and Route 66 turning approximately 40 degrees to the right (east). Route 6 continues east as the Route 6 Willimantic Bypass, a four-lane divided expressway. Route 66 East continues east as Willimantic Road, a direct continuation from Route 6 west of the intersection. The overall footprint of the intersection is large and includes wide paved medians on the intersection approaches. Channelized right turn lanes are also provided on the approaches allowing right turning vehicles the ability to maneuver through the intersection with little or no delay. Additionally, the channelized right turn lanes for westbound Route 6 and eastbound Route 66 are conducive to high-speed travel. This is of particular concern for westbound Route 6 where motorists can generally continue expressway speeds into the two-lane corridor where the posted speed is 45 mph. Because this area serves as a gateway to the Route 6 corridor for westbound travelers, an adequate transition in roadway character from the Route 6 expressway to the two-lane section of Route 6 is necessary to help affect driver behavior and encourage lower travel speeds for vehicles entering the corridor from the expressway and Route 66 East.
Route 66 East between Route 6 and Windham Town Line
Route 66 East between Route 6 and the Windham Town-Line is a two-lane roadway that generally consists of 11 ft to 13 ft travel lanes with shoulders that vary in width of 4 ft or less. One section of Route 66 East in this segment has been widened to provide a standard shoulder width. There are three unsignalized intersections along Route 66 East in the study corridor, none

Route 6 Hop River Corridor Transportation Study
2-3
of which provide left or right turn lanes. See Table A2-1 in Appendix 2.1 for a detailed summary of the characteristics of each intersection.
Like Route 6, the alignment and grade of Route 66 East generally follow the natural topography of the area and are characterized by several gradual curves with few, long straight sections of roadway between, and some long gradual grades. There are no passing zones along this section.
The area of Route 66 East located just west of the Willimantic River near Cards Mill Road is considered by the Route 6 Regional Economic Development Council (REDC) to be an area of opportunity for a future gateway to the Route 66 East corridor for westbound travelers. The area is currently characterized by auto-oriented development and has no aesthetic enhancements that serve as a gateway. Potential gateway opportunities are detailed in the REDC’s Route 6 Hop River Corridor Economic Development Strategy and Master Plan Study (2010).
Roadway Standards
Route 6 in the study area is classified by CTDOT as a principal arterial roadway and is part of the National Highway System (NHS). Principal arterial roadways generally serve a high level of traffic mobility for through travelers, including statewide and interstate travelers, while providing a lesser degree of access to adjacent land development. Route 66 in the study area is classified as a major collector roadway. Collector roadways generally provide a balance between traffic mobility and access.
Roadway classifications serve to define minimum roadway standards for features such as travel and turning lane widths, shoulder widths, horizontal curvature, and sight distances. Table 2-1 summarizes the roadway standards for Route 6 and Route 66 that were obtained from CTDOT’s Highway Design Manual 2003 Edition (HDM). Standard design values for Route 6 are provided for 55 mph and 60 mph design speeds. The selection of these design speeds was based on the approximate 85th percentile speed data (see Section 2.1.2 for details) recorded in the corridor. From the data, it was assumed that a 55 mph design speed applies to segments of Route 6 that have posted speed limits of 40 and 45 mph; a 60 mph design speed applies to segments that have a posted speed limit of 50 mph. Standard design values for Route 66 are provided for a 55 mph design speed, which applies to a posted speed limit of 45 mph.
Table 2-1. Roadway Standards
Roadway Feature
Route 6 Route 66
Design Valuefor 60 mph
Design Value for 55 mph
Design Value for 55 mph
Lane Widths Travel Lane 12’ 12’ Turning Lane 12’ 11’-12’
Shoulder Widths 4’-8’ 4’-8’
Horizontal Curve Radius 1340’ 1065’ 1065’
Intersection Sight Distance 665’ 610’ 610’
Using a combination of aerial photographs, field observations, and field measurements, the study team assessed the geometric characteristics of Route 6 and Route 66 to determine locations where the existing roadways do not meet CTDOT’s current standards. A summary of deficiencies is provided in Table 2-2 and illustrated in Figure 2-1.
Route 6 Hop River Corridor Transportation Study
2-4
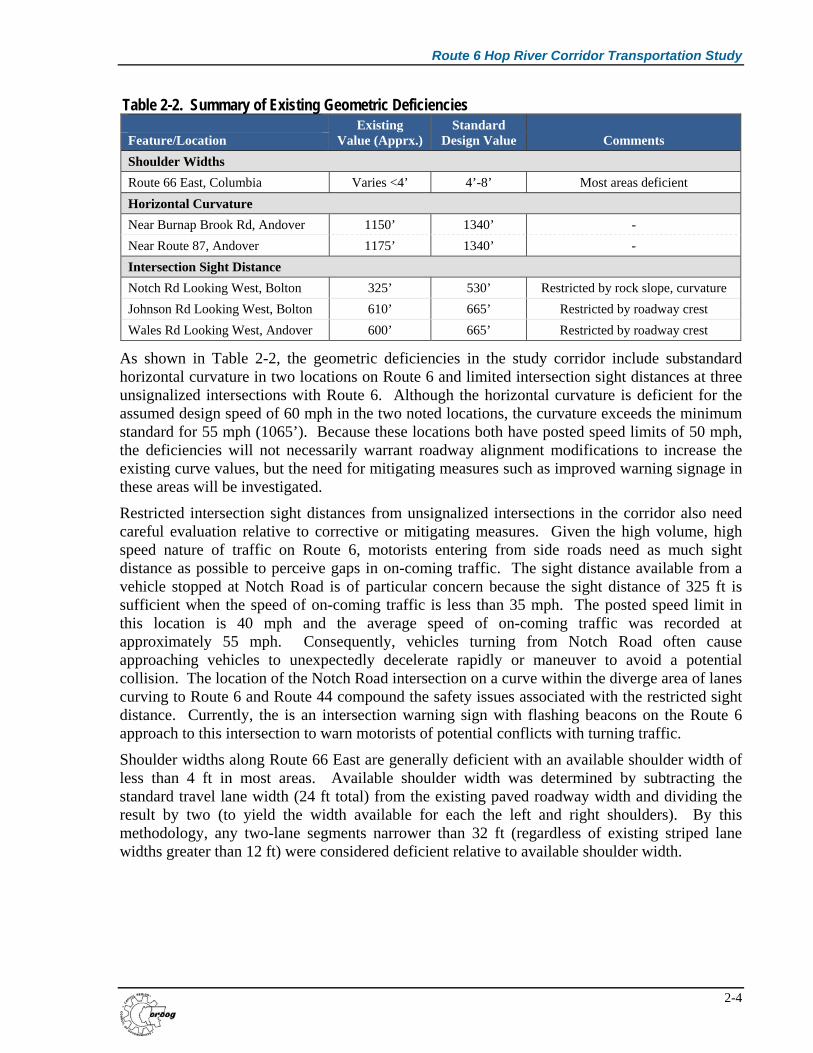
Table 2-2. Summary of Existing Geometric Deficiencies Existing
Value (Apprx.) Standard
Design Value
Comments Feature/Location
Shoulder Widths
Route 66 East, Columbia Varies <4’ 4’-8’ Most areas deficient
Horizontal Curvature
Near Burnap Brook Rd, Andover 1150’ 1340’ -
Near Route 87, Andover 1175’ 1340’ -
Intersection Sight Distance
Notch Rd Looking West, Bolton 325’ 530’ Restricted by rock slope, curvature
Johnson Rd Looking West, Bolton 610’ 665’ Restricted by roadway crest
Wales Rd Looking West, Andover 600’ 665’ Restricted by roadway crest
As shown in Table 2-2, the geometric deficiencies in the study corridor include substandard horizontal curvature in two locations on Route 6 and limited intersection sight distances at three unsignalized intersections with Route 6. Although the horizontal curvature is deficient for the assumed design speed of 60 mph in the two noted locations, the curvature exceeds the minimum standard for 55 mph (1065’). Because these locations both have posted speed limits of 50 mph, the deficiencies will not necessarily warrant roadway alignment modifications to increase the existing curve values, but the need for mitigating measures such as improved warning signage in these areas will be investigated.
Restricted intersection sight distances from unsignalized intersections in the corridor also need careful evaluation relative to corrective or mitigating measures. Given the high volume, high speed nature of traffic on Route 6, motorists entering from side roads need as much sight distance as possible to perceive gaps in on-coming traffic. The sight distance available from a vehicle stopped at Notch Road is of particular concern because the sight distance of 325 ft is sufficient when the speed of on-coming traffic is less than 35 mph. The posted speed limit in this location is 40 mph and the average speed of on-coming traffic was recorded at approximately 55 mph. Consequently, vehicles turning from Notch Road often cause approaching vehicles to unexpectedly decelerate rapidly or maneuver to avoid a potential collision. The location of the Notch Road intersection on a curve within the diverge area of lanes curving to Route 6 and Route 44 compound the safety issues associated with the restricted sight distance. Currently, the is an intersection warning sign with flashing beacons on the Route 6 approach to this intersection to warn motorists of potential conflicts with turning traffic.
Shoulder widths along Route 66 East are generally deficient with an available shoulder width of less than 4 ft in most areas. Available shoulder width was determined by subtracting the standard travel lane width (24 ft total) from the existing paved roadway width and dividing the result by two (to yield the width available for each the left and right shoulders). By this methodology, any two-lane segments narrower than 32 ft (regardless of existing striped lane widths greater than 12 ft) were considered deficient relative to available shoulder width.

Route 6 Hop River Corridor Transportation Study
2-5
Undesirable Roadway Conditions
In addition to the geometric deficiencies identified above, there are other conditions that are not necessarily substandard, but were identified through the study process as being undesirable. For the purposes of this study, several undesirable roadway conditions in the study corridor have been identified as potential concerns relative travel speeds and safety. These are shown Figure 2-1 and include:
Interchange-type layout of Route 6/44 intersection that accommodates high travel speeds and lacks a direct connection between westbound Route 6 and eastbound Route 44.
Location of Notch Road intersection within the diverge area to Route 6 and Route 44.
South Street intersection approach to Route 6 in Coventry. This approach was previously modified by CTDOT to eliminate skew, but the existing acute turn between South Street and Route 6 to the west, combined with a relatively steep grade on South Street approaching the intersection, can create issues for motorists negotiating the intersection.
Channelized right turn lanes at the intersection of Route 6 and Route 66 that accommodate high-speed turning movements.
Roadway flooding issues on Route 66 in the vicinity of Columbia Plaza (located just east of the Route 6 intersection) that can result in road closures.
Layout of Cards Mill Road and Commerce Drive intersection with Route 66 East that provides a heavily skewed approach leg to Route 66 East.

Undesirable intersection design of Route 6/44 encourages
ISD looking west from Johnson Road restricted by
high speeds and is more appropriate for an interchange
COVENTRY
ISD looking west from Notch Road restricted by rock slope and horizontal curvature
yroadway crest
Undesirable intersection approach at South Street
Deficient horizontal curvature (for 60 mph design speed) near
Burnap Brook Road
Notch Road intersects within diverge area of Route 6 and
Route 44
BOLTON
ISD l ki t f W l R d
Undesirable intersection geometry at Cards Mill Road and Commerce Drive intersections
COLUMBIA
ISD looking west from Wales Road restricted by roadway crest
D fi i t h i t l t (f 60 h
Roadway flooding issues on Route 66 near Columbia Plaza
ANDOVER
Deficient horizontal curvature (for 60 mph design speed) on Route 6 near Route 87
Narrow shoulders on Route 66 between Route 6 and Windham
Town Line
Narrow shoulders on Route 66 East between Route 6 and Windham
Town Line
Legend
Study Corridor
Geometric Concerns
Undesirable intersection geometry at Route 6/Route 66 intersection
Figure 2-1.Summary of Existing Roadway Concerns
Geometric Concerns
Other Concerns
NOT TO SCALE
Route 6 Hop River Corridor Transportation Study

Route 6 Hop River Corridor Transportation Study
2-7
2.1.2 Traffic Conditions
The existing traffic conditions in the study corridor are assessed to identify deficiencies relative to existing traffic capacity and operations and to establish a baseline condition against which the anticipated future conditions and potential impacts of future traffic growth can be evaluated. The study team compiled and analyzed average daily traffic volumes, peak hour traffic volumes and trends, truck traffic, corridor travel speeds, and peak hour intersection and roadway segment operations.
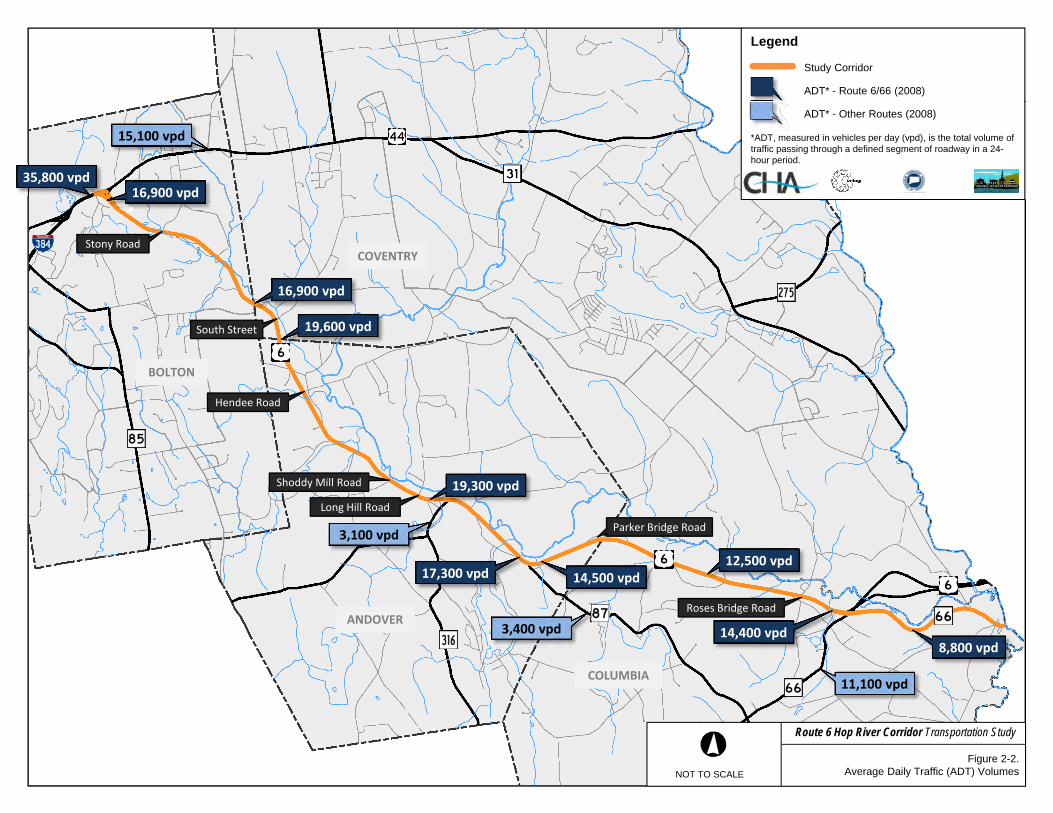
Daily Volumes CTDOT maintains a database of average daily traffic (ADT)1 volumes for all state and some select local roadways that was referenced for this study. The database is updated approximately every three years as new count data is collected. CTDOT most recently collected counts in the study area in 2008. Counts were also collected on four other occasions between 1992 and 2005 in both the Route 6 and Route 66 corridors. The 2008 and historical ADT volumes obtained from CTDOT are summarized in Tables 2-3 and 2-4 for Route 6 and Route 66, respectively. The 2008 ADT volumes for Route 6, Route 66 East, and other roadways proximate to the study corridor are also illustrated in Figure 2-2.
Table 2-3. ADT Volume Summary – Route 6 (1992 – 2008) ADT Volume [vpd]
Location 1992 1995 2002 2005 2008
West of Notch Road (Route 6 and 44 Overlap), Bolton 36,700 37,400 35,900 36,200 35,800
East of Boston Turnpike (Route 44), Bolton 14,900 16,600 17,400 17,100 16,900
Bolton/Coventry Town Line 15,600 17,200 17,200 17,300 16,900
Coventry/Andover Town Line 15,000 16,400 15,900 17,200 19,600
West of Hebron Road (Route 316), Andover - 16,000 15,400 17,100 19,300
East of Hebron Road (Route 316), Andover 13,600 15,000 15,000 16,100 18,000
West of Route 87, Andover 13,400 14,400 15,100 15,200 17,300
East of Route 87, Andover 10,900 11,800 12,100 12,400 14,500
East of Whitney Road, Columbia - - 11,600 14,100 12,500
West of Middletown Road (Route 66), Columbia - - 12,800 15,000 14,400
As shown in Table 2-3 and Figure 2-2, traffic volumes on the Route 6/Route 44 overlap are slightly more than double the average daily volume on Route 6 in the study corridor indicating that Route 44 and Route 6 carry approximately the same level of daily traffic. Elsewhere, volumes generally increase traveling east to west through Andover and decrease in Bolton prior to joining with Route 44.
1 ADT, measured in vehicles per day (vpd), is the total traffic volume passing through a defined segment of roadway in a 24-hour period.
Legend
Study Corridor
ADT* - Route 6/66 (2008)
16,900 vpd
15,100 vpd
35,800 vpd
ADT* - Other Routes (2008)
*ADT, measured in vehicles per day (vpd), is the total volume of traffic passing through a defined segment of roadway in a 24-hour period.
COVENTRYStony Road
16,900 vpd
BOLTON
South Street
Hendee Road
19,600 vpd
Shoddy Mill Road
Long Hill Road
19,300 vpd
Long Hill Road
17,300 vpd 14,500 vpd12,500 vpd
3,100 vpd
Roses Bridge Road
Parker Bridge Road
ANDOVER
COLUMBIA
14,400 vpd8,800 vpd
11,100 vpd
3,400 vpd
Roses Bridge Road
Figure 2-2.Average Daily Traffic (ADT) Volumes NOT TO SCALE
Route 6 Hop River Corridor Transportation Study

Route 6 Hop River Corridor Transportation Study
2-9
The historical data shows varying trends in different portions of the corridor. Daily volumes along the overlap of Route 6 and Route 44 have historically fluctuated with the 2008 volume being the lowest over the time period. The two other count locations in Bolton show a general trend upward prior to 2008 with slight decreases in volumes most recently. The five count locations in Andover all show a general trend upward through 2008. The two counts locations in Columbia, much like those on Route 6 in Bolton, show a trend upward prior to 2008 with decreases in volumes most recently. Table 2-4. ADT Volume Summary – Route 66 East (1996 – 2008) ADT Volume [vpd]
Location 1996 1999 2002 2005 2008
Route 66
East of Middletown Road/US 6 Intersection, Columbia 9,200 8,200 8,400 9,100 8,800
West of Cards Mill Road, Columbia - - 8,800 8,900 6,600
Columbia/Windham Town Line 9,100 9,000 8,500 9,600 8,200
As shown in Table 2-4, ADT volumes on Route 66 East in the study area are noticeably less than those on Route 6, indicating that a large portion of trips use the Route 6 Willimantic Bypass for east-west travel rather than continuing into Willimantic via Route 66. The historical data shows that volumes on Route 66 East have fluctuated higher and lower between 1996 and 2008. Overall, 2008 volumes are lower than their respective peaks, and the 1996 volumes (for the two sites which the data is available) are higher than their respective 2008 values, indicating that volumes have not consistently increased over time in the area.
Heavy Vehicle Volumes Automatic traffic recorder (ATR) data collected by the study team in 2010 shows that heavy vehicles2, including trucks and buses, comprise approximately 5% to 8% of the average daily traffic volumes on Route 6. Applying these percentages to the 2008 ADT volumes shows that heavy vehicle volumes range between 800 and 1400 vehicles per day on Route 6. The ATR locations are shown in Figure A2-1 in Appendix 2.2.
Travel Speeds Two sets of travel speed data were obtained for this study including average and 85th percentile speeds3 collected by ATRs over the course of several days, and speeds collected during the weekday morning (AM) peak period (7 to 9 am) and afternoon (PM) peak period (4 to 6 pm) using the floating car method and global positioning systems (GPS) data.
2 Heavy vehicles include trucks and buses that have more than four tires, including school buses, dump trucks, and combination tractor trailers. Passenger vehicles or passenger trucks towing trailers, campers, and boats are not considered heavy vehicles. 3 85th Percentile Speed – Speed at which 85% of vehicles are traveling at or below.
Route 6 Hop River Corridor Transportation Study
2-10
ATR Travel Speed Data
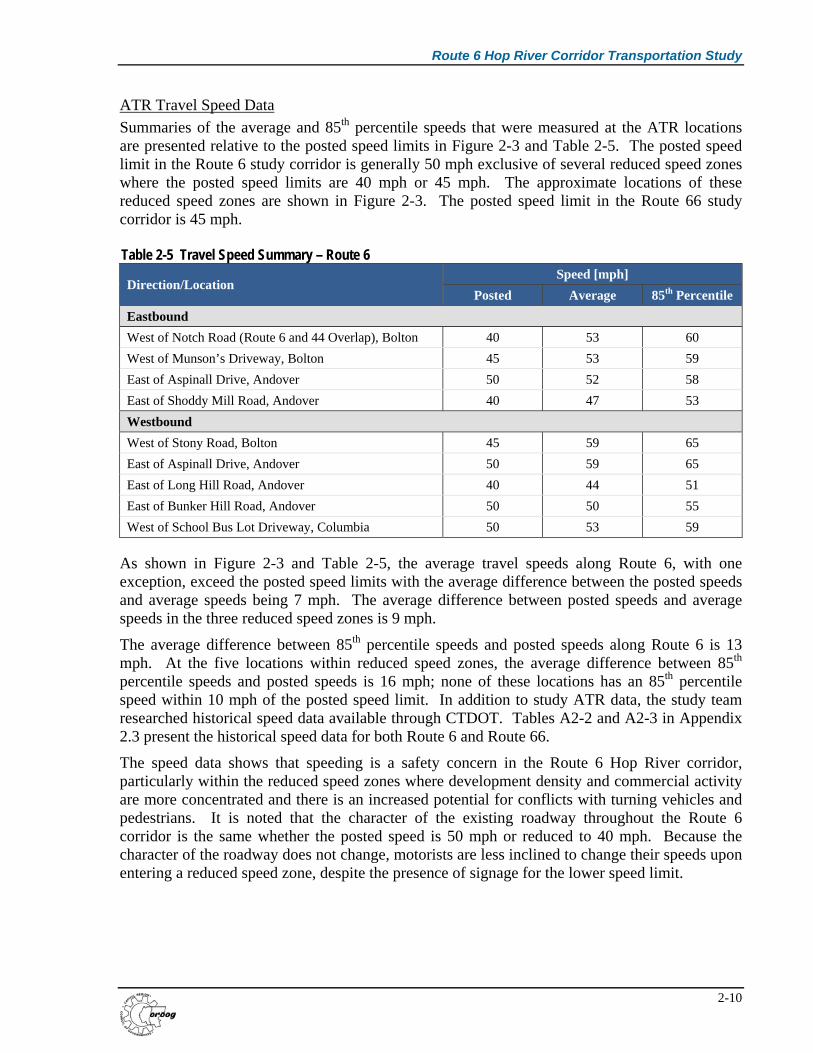
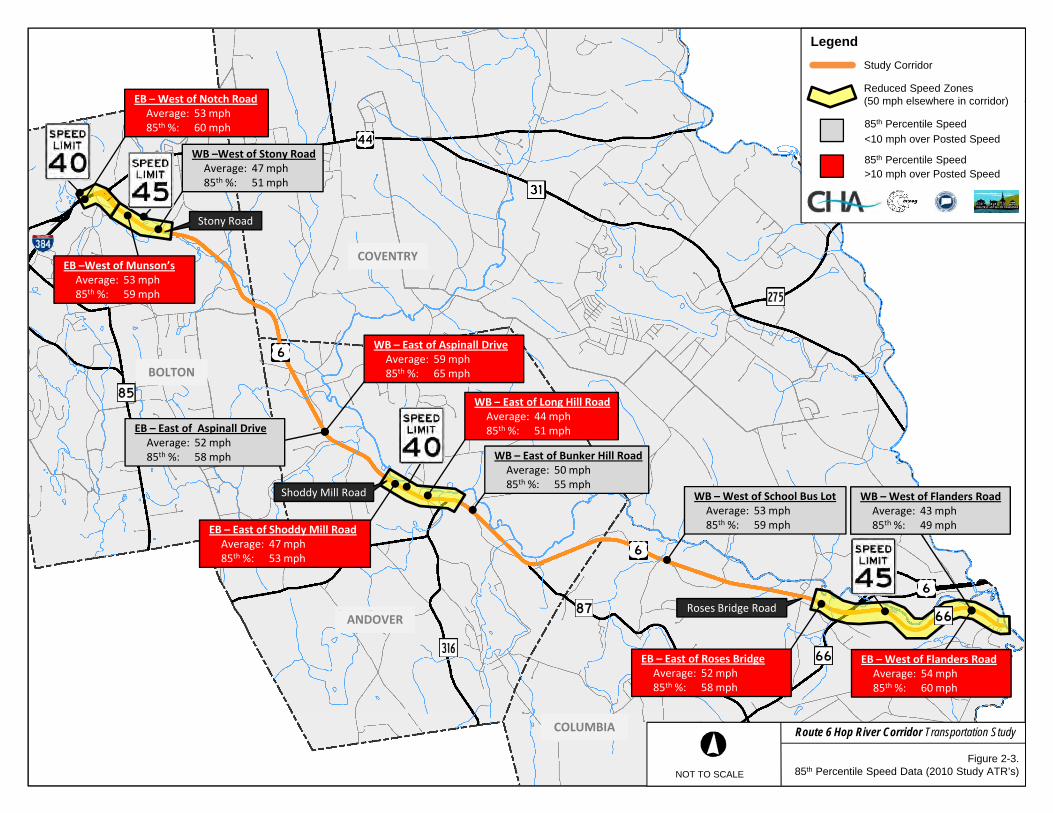
Summaries of the average and 85th percentile speeds that were measured at the ATR locations are presented relative to the posted speed limits in Figure 2-3 and Table 2-5. The posted speed limit in the Route 6 study corridor is generally 50 mph exclusive of several reduced speed zones where the posted speed limits are 40 mph or 45 mph. The approximate locations of these reduced speed zones are shown in Figure 2-3. The posted speed limit in the Route 66 study corridor is 45 mph.
Table 2-5 Travel Speed Summary – Route 6
Direction/Location Speed [mph]
Posted Average 85th Percentile
Eastbound
West of Notch Road (Route 6 and 44 Overlap), Bolton 40 53 60
West of Munson’s Driveway, Bolton 45 53 59
East of Aspinall Drive, Andover 50 52 58
East of Shoddy Mill Road, Andover 40 47 53
Westbound
West of Stony Road, Bolton 45 59 65
East of Aspinall Drive, Andover 50 59 65
East of Long Hill Road, Andover 40 44 51
East of Bunker Hill Road, Andover 50 50 55
West of School Bus Lot Driveway, Columbia 50 53 59
As shown in Figure 2-3 and Table 2-5, the average travel speeds along Route 6, with one exception, exceed the posted speed limits with the average difference between the posted speeds and average speeds being 7 mph. The average difference between posted speeds and average speeds in the three reduced speed zones is 9 mph.
The average difference between 85th percentile speeds and posted speeds along Route 6 is 13 mph. At the five locations within reduced speed zones, the average difference between 85th percentile speeds and posted speeds is 16 mph; none of these locations has an 85th percentile speed within 10 mph of the posted speed limit. In addition to study ATR data, the study team researched historical speed data available through CTDOT. Tables A2-2 and A2-3 in Appendix 2.3 present the historical speed data for both Route 6 and Route 66.
The speed data shows that speeding is a safety concern in the Route 6 Hop River corridor, particularly within the reduced speed zones where development density and commercial activity are more concentrated and there is an increased potential for conflicts with turning vehicles and pedestrians. It is noted that the character of the existing roadway throughout the Route 6 corridor is the same whether the posted speed is 50 mph or reduced to 40 mph. Because the character of the roadway does not change, motorists are less inclined to change their speeds upon entering a reduced speed zone, despite the presence of signage for the lower speed limit.
EB – West of Notch Road
Legend
Study Corridor
Reduced Speed Zones(50 mph elsewhere in corridor)
WB –West of Stony RoadAverage: 47 mph85th %: 51 mph
EB West of Notch RoadAverage: 53 mph85th %: 60 mph
(50 mph elsewhere in corridor)
85th Percentile Speed
<10 mph over Posted Speed
85th Percentile Speed>10 mph over Posted Speed
Stony Road
EB –West of Munson’sAverage: 53 mph85th %: 59 mph
COVENTRY
WB – East of Long Hill Road
WB – East of Aspinall DriveAverage: 59 mph85th %: 65 mphBOLTON
gAverage: 44 mph85th %: 51 mph
WB – East of Bunker Hill RoadAverage: 50 mph85th %: 55 mph
EB – East of Aspinall DriveAverage: 52 mph85th %: 58 mph
Shoddy Mill Road WB – West of School Bus LotAverage 53 mph
WB – West of Flanders RoadA 43 h
Roses Bridge Road
EB – East of Shoddy Mill RoadAverage: 47 mph85th %: 53 mph
Average: 53 mph85th %: 59 mph
Average: 43 mph85th %: 49 mph
Roses Bridge Road
EB – East of Roses BridgeAverage: 52 mph85th %: 58 mph
EB – West of Flanders RoadAverage: 54 mph85th %: 60 mph
ANDOVER
Figure 2-3.85th Percentile Speed Data (2010 Study ATR’s)NOT TO SCALE
Route 6 Hop River Corridor Transportation StudyCOLUMBIA
Route 6 Hop River Corridor Transportation Study
2-12
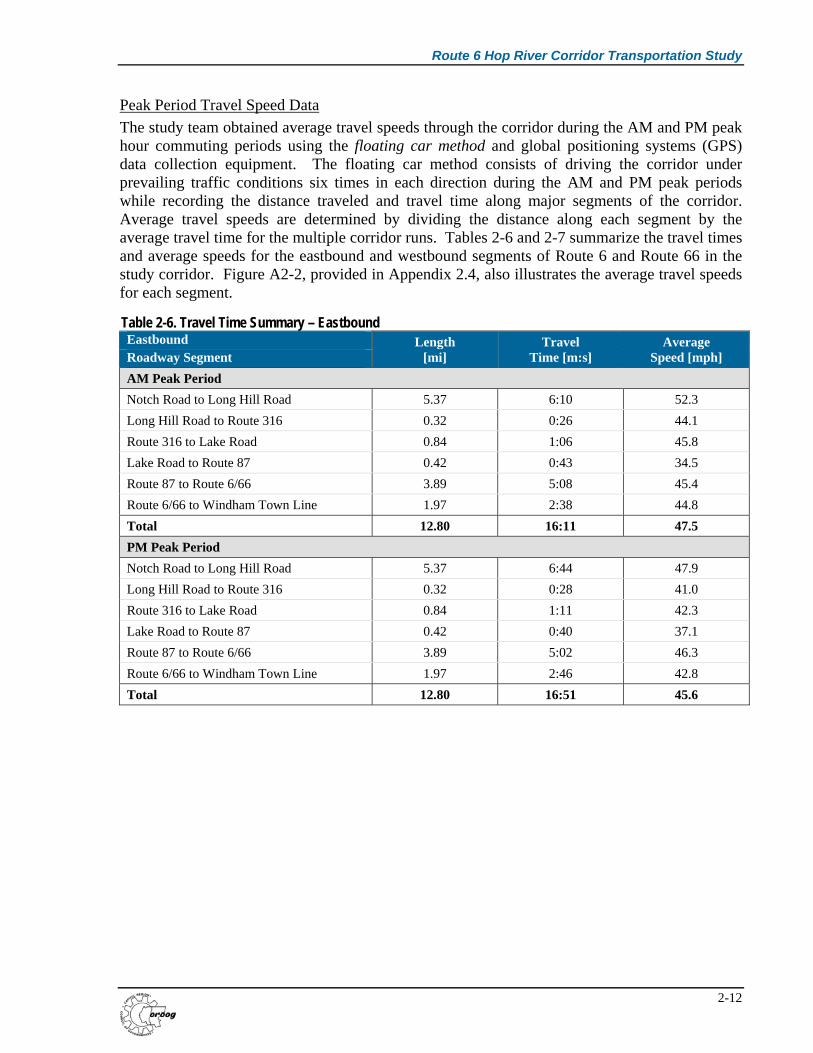
Peak Period Travel Speed Data
The study team obtained average travel speeds through the corridor during the AM and PM peak hour commuting periods using the floating car method and global positioning systems (GPS) data collection equipment. The floating car method consists of driving the corridor under prevailing traffic conditions six times in each direction during the AM and PM peak periods while recording the distance traveled and travel time along major segments of the corridor. Average travel speeds are determined by dividing the distance along each segment by the average travel time for the multiple corridor runs. Tables 2-6 and 2-7 summarize the travel times and average speeds for the eastbound and westbound segments of Route 6 and Route 66 in the study corridor. Figure A2-2, provided in Appendix 2.4, also illustrates the average travel speeds for each segment.
Table 2-6. Travel Time Summary – Eastbound Eastbound Length
[mi] Travel
Time [m:s] Average
Speed [mph] Roadway Segment
AM Peak Period
Notch Road to Long Hill Road 5.37 6:10 52.3
Long Hill Road to Route 316 0.32 0:26 44.1
Route 316 to Lake Road 0.84 1:06 45.8
Lake Road to Route 87 0.42 0:43 34.5
Route 87 to Route 6/66 3.89 5:08 45.4
Route 6/66 to Windham Town Line 1.97 2:38 44.8
Total 12.80 16:11 47.5
PM Peak Period
Notch Road to Long Hill Road 5.37 6:44 47.9
Long Hill Road to Route 316 0.32 0:28 41.0
Route 316 to Lake Road 0.84 1:11 42.3
Lake Road to Route 87 0.42 0:40 37.1
Route 87 to Route 6/66 3.89 5:02 46.3
Route 6/66 to Windham Town Line 1.97 2:46 42.8
Total 12.80 16:51 45.6

Route 6 Hop River Corridor Transportation Study
2-13
As shown in Tables 2-6 and 2-7, the average corridor travel time was approximately 16 minutes and 40 seconds, which equates to an overall average speed of approximately 46 mph. The eastbound AM runs yielded the fastest average run, which is to be expected, given the lighter eastbound volumes during the AM peak period. Conversely, the average westbound travel time during the PM peak period is approximately the same as the travel time during the AM peak period, which is somewhat unexpected given that the predominant direction of travel in the AM is westbound and greater delays would normally be expected. The study team notes that any given run had the opportunity of being delayed at any of the five signalized intersections through the corridor, with the Route 6/66 intersection being the most common place to be delayed. Additionally, local schools operate school bus routes along Route 6 during the AM peak period, leading to additional potential delays.
Peak Hour Volumes Intersection turning movement counts were obtained for 17 intersections in the study corridor in October 2009 (under REDC’s previous study); and in March 2010, April 2010, and September 2011 (under this study). Intersection turning movement counts were performed during the weekday morning (AM) peak period (7 to 9 am) and afternoon (PM) peak period (4 to 6 pm) to capture the influence of the peak daily commuting times. The actual peak hours at these intersections were generally from 7:15 to 8:15 am and from 4:45 to 5:45 pm. A traffic volume diagram representing the AM and PM peak hour traffic volumes is shown in Figure 2-4.
Table 2-7. Travel Time Summary – Westbound Westbound Length
[mi] Travel
Time [m:s] Average
Speed [mph] Roadway Segment
AM Peak Period
Windham Town Line to Route 6/66 1.97 2:54 40.7
Route 6/66 to Route 87 3.89 4:45 49.1
Route 87 to Lake Road 0.42 0:35 43.2
Lake Road to Route 316 0.84 1:12 42.1
Route 316 to Long Hill Road 0.32 0:33 35.6
Long Hill Road to Notch Road 5.37 6:47 47.5
Total 12.80 16:46 45.9
PM Peak Period
Windham Town Line to Route 6/66 1.97 3:10 37.3
Route 6/66 to Route 87 3.89 4:44 49.3
Route 87 to Lake Road 0.42 0:32 46.2
Lake Road to Route 316 0.84 1:03 47.9
Route 316 to Long Hill Road 0.32 0:29 39.8
Long Hill Road to Notch Road 5.37 6:53 46.9
Total 12.80 16:51 45.6

Legend
### AM Peak Volume
(###) PM Peak Volume
Sources:
Raw Counts: CT Counts, LLC, 2009, 2010GM2, Inc., 2011
Figure 2-4.Peak Hour Traffic Volumes (Existing)NOT TO SCALE
Route 6 Hop River Corridor Transportation Study
Route 6 Hop River Corridor Transportation Study
2-15
It is noted that two intersections for which counts were obtained were subsequently not analyzed for this study: the westbound Route 44 merge with westbound Route 6 in Bolton, and the Route 6 and CTDOT Park and Ride lot driveway intersection in Andover.
The study team used the volumes shown in Figure 2-4 to characterize peak hour travel trends in the study corridor and to determine existing traffic operations at the 14 study intersections. Peak hour travel trends and existing traffic operations are presented in the following sections.
Peak Hour Travel Trends Peak hour travel trends in the Route 6 study corridor are primarily influenced by traffic commuting to and from major employers in Hartford and the greater Hartford metro area via Route 6 and I-384. Specifically, the peak hour traffic counts indicate the following travel trends:
AM Peak Hour4
Predominant direction of travel is westbound toward I-384. The percentage of all two-way traffic in the Route 6 study corridor that is traveling westbound varies along the corridor within the range of 59% to 78%.
Westbound traffic volumes consistently build from approximately 800 vehicles entering the Route 6 study corridor at the Route 6/66 intersection to approximately 1300 vehicles exiting the corridor to Route 44 and I-384. The origins of this traffic are (approximately):
o 44% from Route 6 expressway o 20% from Route 87 in Andover o 10% from Route 316 in Andover o 8% from Hendee Road in Andover o 10% from South Street in Coventry o 8% from other locations
PM Peak Hour5
Predominant direction of travel is eastbound toward Willimantic. The percentage of all two-way traffic in the Route 6 study corridor that is traveling eastbound varies along the corridor within the range of 55% to 69%.
Eastbound traffic volumes consistently diminish from approximately 1200 vehicles entering the Route 6 study corridor at the Route 6/44 intersection to approximately 900 vehicles exiting the corridor to Route 6 expressway and Route 66. The proportions of traffic destined to Route 6 expressway and other intersecting roadways in the study corridor generally reflect a reverse of the AM peak hour commuting trends.
4 All percentages represent approximate values as calculated from the traffic volumes shown in Figure 2-4. 5 All percentages represent approximate values as calculated from the traffic volumes shown in Figure 2-4

Route 6 Hop River Corridor Transportation Study
2-16
Operations The study team evaluated existing traffic operations in the Route 6 Hop River corridor by determining levels of service (LOS) at the study intersections. LOS is based on the average delay (in seconds per vehicle, sec/veh) that motorists experience while traveling through the intersection. LOS can be determined for individual movements at signalized and unsignalized intersections, and for each signalized intersection as a whole. For this study, intersection operations of LOS D or better are considered acceptable.
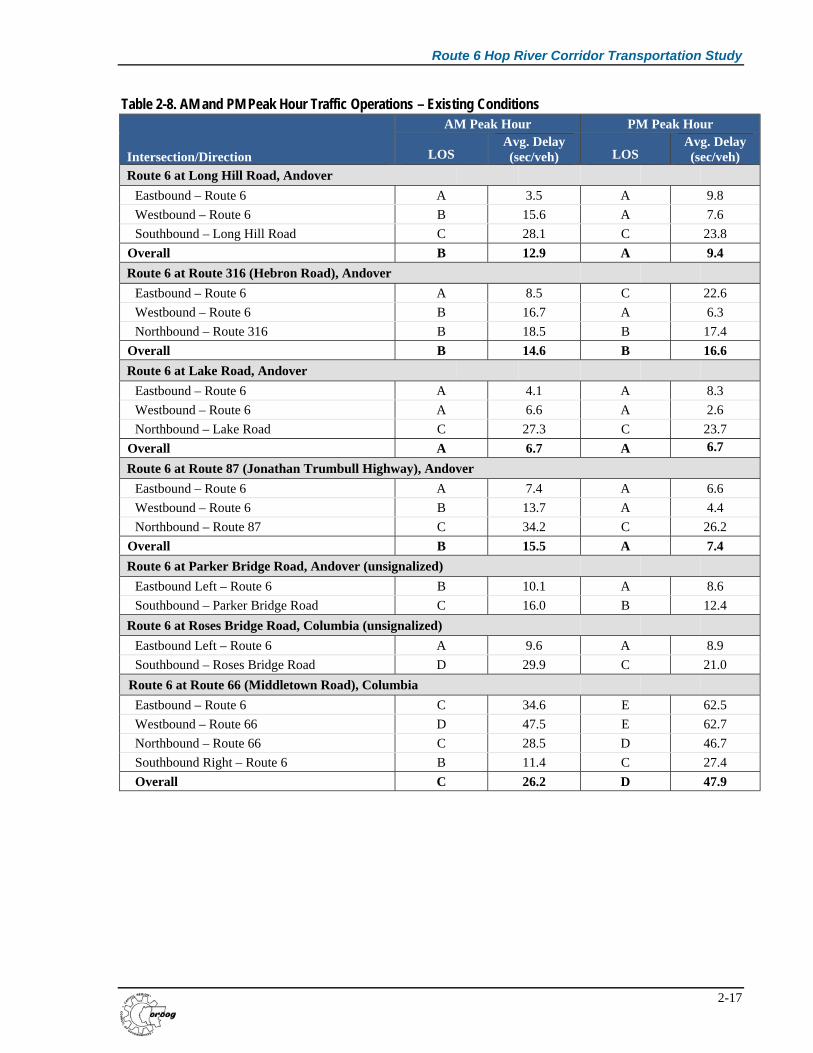
The study team determined the LOS for each of the 14 study intersections to provide a measure of the existing traffic operations at these intersections. The LOS for each intersection was determined by completing capacity analyses using the existing AM and PM peak hour turning movement volumes obtained by the study team and SYNCHRO software. The AM and PM peak hour traffic operations are summarized in Table 2-8 and illustrated in Figure 2-5 (AM) and Figure 2-6 (PM).
Table 2-8. AM and PM Peak Hour Traffic Operations – Existing Conditions
Intersection/Direction
AM Peak Hour PM Peak Hour
LOS Avg. Delay (sec/veh) LOS
Avg. Delay (sec/veh)
Route 6/44 at Notch Road, Bolton (unsignalized)
Northbound Right – Notch Road F 331.7 F -1
Route 6 at Stony Road, Bolton (unsignalized)
Eastbound Left – Route 6 C 15.6 A 9.1
Southbound – Stony Road F 160.6 E 47.3
Route 6 at South Road, Bolton (unsignalized)
Eastbound Left – Route 6 B 12.9 A 9.2
Southbound – South Road F 64.1 F 150.0
Route 6 at Steeles Crossing Road, Bolton (unsignalized)
Westbound Left – Route 6 A 8.8 B 11.1
Northbound – Steeles Crossing Road F 64.6 E 44.4
Route 6 at South Street, Coventry (unsignalized)
Eastbound Left – Route 6 B 12.9 B 10.2
Southbound – South Street F 114.6 F 81.6
Route 6 at Hendee Road, Andover (unsignalized)
Eastbound Left – Route 6 B 12.0 A 9.6
Southbound – Hendee Road F 55.0 F 54.0
Route 6 at Shoddy Mill Road, Andover (unsignalized)
Westbound Left – Route 6 A 8.5 B 11.2
Northbound – Shoddy Mill Road D 28.3 E 35.7 1Long Delay, SYNCHRO software outputs error message.
LOS values for intersections and roadway segments can range from A to F with LOS A representing the best operational conditions. LOS F represents generally congested, un-acceptable conditions.
Route 6 Hop River Corridor Transportation Study
2-17
Table 2-8. AM and PM Peak Hour Traffic Operations – Existing Conditions
Intersection/Direction
AM Peak Hour PM Peak Hour
LOS Avg. Delay (sec/veh) LOS
Avg. Delay (sec/veh)
Route 6 at Long Hill Road, Andover
Eastbound – Route 6 A 3.5 A 9.8
Westbound – Route 6 B 15.6 A 7.6
Southbound – Long Hill Road C 28.1 C 23.8
Overall B 12.9 A 9.4
Route 6 at Route 316 (Hebron Road), Andover
Eastbound – Route 6 A 8.5 C 22.6
Westbound – Route 6 B 16.7 A 6.3
Northbound – Route 316 B 18.5 B 17.4
Overall B 14.6 B 16.6
Route 6 at Lake Road, Andover
Eastbound – Route 6 A 4.1 A 8.3
Westbound – Route 6 A 6.6 A 2.6
Northbound – Lake Road C 27.3 C 23.7
Overall A 6.7 A 6.7
Route 6 at Route 87 (Jonathan Trumbull Highway), Andover
Eastbound – Route 6 A 7.4 A 6.6
Westbound – Route 6 B 13.7 A 4.4
Northbound – Route 87 C 34.2 C 26.2
Overall B 15.5 A 7.4
Route 6 at Parker Bridge Road, Andover (unsignalized)
Eastbound Left – Route 6 B 10.1 A 8.6
Southbound – Parker Bridge Road C 16.0 B 12.4
Route 6 at Roses Bridge Road, Columbia (unsignalized)
Eastbound Left – Route 6 A 9.6 A 8.9
Southbound – Roses Bridge Road D 29.9 C 21.0
Route 6 at Route 66 (Middletown Road), Columbia
Eastbound – Route 6 C 34.6 E 62.5
Westbound – Route 66 D 47.5 E 62.7
Northbound – Route 66 C 28.5 D 46.7
Southbound Right – Route 6 B 11.4 C 27.4
Overall C 26.2 D 47.9

Legend
Study Corridor
Delay (sec/veh)
Notch Roadto Route 6
F
LOS Signalized Unsignalized
A 10 10
B 10 and 20 10 and 15
C 20 and 35 15 and 25
COVENTRY
Stony Roadto Route 6
South Roadto Route 6
Steeles Crossing Roadto Route 6
F
F
F
D 35 and 55 25 and 35
E 55 and 80 35 and 50
F > 80 > 50
South Streetto Route 6
F
F
BOLTON
Hendee Roadto Route 6
Shoddy Mill Roadto Route 6
Long Hill Road
Route 316at Route 6
Lake Road Parker Bridge Road
DB B
Long Hill Roadat Route 6
at Route 6
Route 87at Route 6
to Route 6
C
C
D
B
A
ANDOVER
COLUMBIA
Roses Bridge Roadto Route 6
Route 66at Route 6
C
Figure 2-5.AM Peak Hour Traffic Operations (Existing)NOT TO SCALE
Route 6 Hop River Corridor Transportation Study
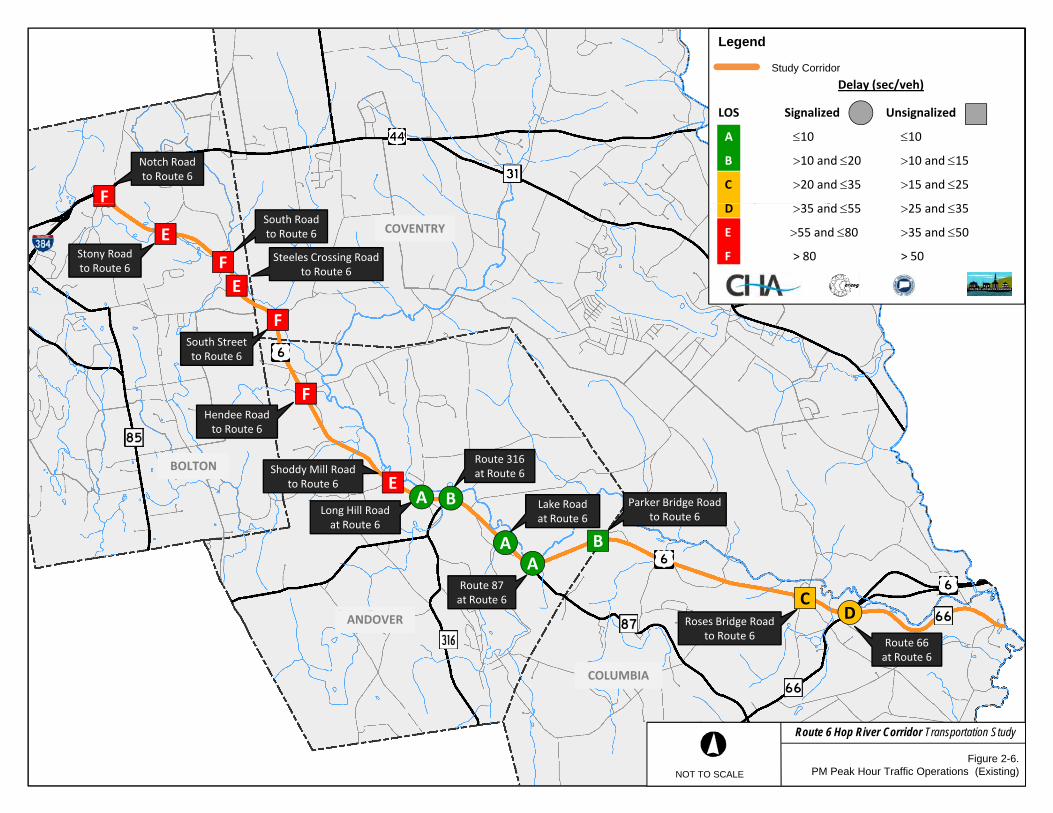
Legend
Study Corridor
Delay (sec/veh)
Notch Roadto Route 6
F
LOS Signalized Unsignalized
A 10 10
B 10 and 20 10 and 15
C 20 and 35 15 and 25
COVENTRY
Stony Roadto Route 6
South Roadto Route 6
Steeles Crossing Roadto Route 6
E
F
E
D 35 and 55 25 and 35
E 55 and 80 35 and 50
F > 80 > 50
South Streetto Route 6
F
F
BOLTON
Hendee Roadto Route 6
Shoddy Mill Roadto Route 6
Long Hill Road
Route 316at Route 6
Lake Road Parker Bridge Road
EA B
Long Hill Roadat Route 6
at Route 6
Route 87at Route 6
to Route 6
D
B
C
AA
ANDOVER
COLUMBIA
Roses Bridge Roadto Route 6
Route 66at Route 6
D
Figure 2-6.PM Peak Hour Traffic Operations (Existing)NOT TO SCALE
Route 6 Hop River Corridor Transportation Study

Route 6 Hop River Corridor Transportation Study
2-20
As shown in Table 2-8, overall operations are acceptable at each signalized intersection. However, there are signalized intersection approaches where the operations are currently LOS E or F during the AM or PM peak hour. These approaches include:
Route 6 at Route 66 (Middletown Road), Columbia o Eastbound Route 6 – LOS E during the PM peak hour. The eastbound left turn
movement from Route 6 to the Route 6 expressway experiences significant delay and long traffic queues (over 800 ft for the 95th percentile queue) which results in the overall eastbound movement being LOS E.
o Westbound Route 66 East – LOS E during the PM peak hour. Both the westbound left turn and through/right turn movements experience significant delays (though traffic queue lengths are moderated at less than 300 ft).
o Because of the skew of the intersection, the eastbound Route 6 and westbound Route 66 East movements require their own phase to prevent conflicts between the opposing left turn movements, resulting in longer traffic delays on these approaches.
In addition, there are unsignalized intersection approaches where the operations are currently LOS E or F during the AM or PM peak hour. As shown in Table 2-8, these approaches include:
Route 6 at Notch Road, Bolton o Northbound Notch Road – LOS F during AM and PM peak hours
Route 6 at Stony Road, Bolton o Southbound Stony Road – LOS F during the AM peak hour, LOS E during the PM
peak hour
Route 6 at South Road, Bolton o Southbound South Road – LOS F during AM and PM peak hours
Route 6 at Steeles Crossing Road, Bolton o Northbound Steeles Crossing Road– LOS F during the AM peak hour, LOS E
during the PM peak hour.
Route 6 at South Street, Coventry o Southbound South Street – LOS F during AM and PM peak hours
Route 6 at Hendee Road, Andover o Southbound Hendee Road – LOS F during AM and PM peak hours
Route 6 at Shoddy Mill Road, Andover o Northbound Shoddy Mill Road – LOS E during the PM peak hour
Based strictly upon the results of the existing traffic operations analyses, traffic capacity improvements to accommodate existing traffic demands are generally not warranted at the study intersections, particularly the signalized intersections which all operate at acceptable levels of service. Additionally, it is important to note that the long delays and unacceptable levels of service at the unsignalized intersection approaches throughout the western part of the corridor are generally a function of the relatively high volumes of through traffic on Route 6 in this area that limit the availability and size of gaps in traffic for vehicles entering Route 6 from side roads. Although entering traffic volumes are relatively low, long delays present safety issues when drivers become inpatient and attempt to enter traffic before it is safe to do so.

Route 6 Hop River Corridor Transportation Study
2-21
The potential effects of future traffic demand on intersection operations, and any associated capacity improvement needs to accommodate this future traffic demand, will be evaluated and discussed under the next phase of this study. This effort will include an assessment of signal warrants for unsignalized intersections and an assessment of other mitigating measures for unsignalized intersections that do not meet signal warrant criteria.
2.1.3 Access Management
Access management can be defined as the proactive management of vehicular access points to land parcels adjacent to roadways. Good access management promotes safe and efficient use of the transportation network and encompasses a set of techniques that state and local governments can use to control access to highways, major arterials, and other roadways.6
The access management assessment for this study included a field review of existing driveways and an assessment of the access management and driveway-related provisions of the zoning regulations for each of the four participating towns (see Table A2-4 in Appendix 2.5 for a summary of the zoning regulations review). In general, most segments of the Route 6 study corridor are sparsely developed with some clusters of residential driveways and small concentrations of commercial activity interspersed throughout. The Route 66 study corridor generally features more regularly spaced commercial activity interspersed with residential driveways. On average, there are approximately 20 driveways per mile of Route 6 and 30 driveways per mile of Route 66 in the study corridor.
Along both Route 6 and Route 66, the majority of driveways serve single family residential uses and are characteristically low volume. As such, these driveways create a relatively low frequency of turning conflicts with through traffic and have limited effect on the overall flow of traffic in the corridor. Commercial driveways that are relatively high volume create more turning conflicts and consequently create more opportunities for disruptions to the flow of traffic and turning-related collisions. Therefore, a key aspect of the access management review in the Route 6 Hop River corridor was to assess existing commercial access drives and identify potential issues associated with:
Location of drives relative to existing intersections and other driveways. Driveways should not be located within the functional area of an intersection to minimize conflicts between vehicles queuing and maneuvering through the intersection and vehicles accessing drives. Spacing between adjacent driveways should also be maximized to separate potential turning movements, or driveways should be consolidated and internal connections provided so that adjacent parcels can share access.
Width of drives (“curb cuts”). Driveway widths at their intersection with the roadway should not be excessively wide so that the point of access is clearly defined and conflicts are minimized.
Redundant drives. Businesses should not have more driveways than are required to maintain site access and operations. Redundant two-way driveways should be closed or converted to one-way egress and ingress to minimize conflict points.
6 FHWA, Office of Operations, http://ops.fhwa.dot.gov/access_mgmt/what_is_accsmgmt.htm

Route 6 Hop River Corridor Transportation Study
2-22
In general, access management issues in the study corridor include a number of businesses with redundant driveways or businesses with driveways that are wider than necessary. These locations are shown in Figure 2-7.
Opportunities to close redundant driveways, narrow excessively wide driveways, or share driveways between adjacent parcels should be considered in conjunction with the site plan application review and approval process for new development or redevelopment proposals in each town. Strategies to minimize the number of new access points on Route 6 within potential future development nodes will be evaluated as part of this study.
Figure 2-7. Access Management Issues

Route 6 Hop River Corridor Transportation Study
2-23
2.1.4 Multimodal Accommodations
The study team reviewed and assessed the availability and extent of the existing facilities and accommodations in the study corridor that support alternative modes of transportation such as walking, bicycling, and transit.
Pedestrian Facilities
Being rural in nature, the study corridor generally has no continuous sidewalks. Other pedestrian facilities are limited to four pedestrian actuated intersection crossings and only one crosswalk across Route 6. The locations of these facilities are noted in Figure 2-8, and include:
At Route 6 and Long Hill Road (Andover), curb ramps, a marked crosswalk on the east side of the intersection, and a pedestrian actuated green light which is concurrent with the green light for traffic on Long Hill Road. The sidewalk on the south side of the crosswalk extends east towards the Hop River Trail (see The Hop River Trail discussion that follows for trail details). There is no sidewalk on the north side of Route 6 nor a crosswalk on the Long Hill Road approach to the intersection that link the trail and other potential pedestrian destinations like the church, library, Park & Ride lot, post office, and ball fields in this area.
Figure 2-8. Pedestrian Facilities

Route 6 Hop River Corridor Transportation Study
2-24
At Route 6 and Lake Road (Andover), a pedestrian actuated green light used for crossing Route 6. The pedestrian crossing shares the green light with traffic from Lake Road. There are no sidewalks, curb ramps, or crosswalk markings at this location. The only notable destination near this intersection is a convenience store a few hundred feet west of the intersection.
At Route 6 and Route 87 (Andover), a pedestrian actuated green light used for crossing Route 6. The pedestrian crossing shares the green light with traffic from Route 87. There are no sidewalks, curb ramps, or crosswalk marking at this location. Additionally, there are no retail or business facilities in the proximity of this intersection.
At Route 6 and Route 66 (Columbia), a pedestrian actuated green light used for crossing Route 6. There is no provision for crossing Route 66. The pedestrian crossing shares the green light with traffic from Route 66. There are no sidewalks, curb ramps, or crosswalk markings at this location. Pedestrian push buttons are located in an island on the southwest corner of the intersection and on an island on the northwest corner. They are isolated and difficult to access. The button on the southwest corner does not function.
Bicycle Facilities
While having no marked or signed bicycle lanes or routes, Route 6 has wide (8 ft) shoulders which are suitable for cycling for the purposes of commuting or recreational use. CTDOT’s Connecticut Bike Map shows most of the Route 6 study corridor as being “more suitable” on the State Road Suitability Index based on an ADT volume greater than 10,000 vpd and shoulder widths greater than 6 ft.7 However, several side road and driveway intersections have dedicated right turn lanes that pose a potential hazard to cyclists using the wide shoulders. This hazard results from a cyclist having to cross the right turn lane and to travel between through traffic and right turning traffic in order to continue through the intersection and reach the shoulder across the intersection.
The Route 66 study corridor has narrow shoulders (typically less than 4 ft) and frequent curb cuts which make this roadway “less suitable” for cycling.
7 http://www.ctbikemap.org/bikemap.html

Route 6 Hop River Corridor Transportation Study
2-25
The Hop River Trail
The Hop River Trail is a fairly continuous recreational walking and bicycling trail that generally parallels Route 6 and Route 66, extending from Bolton Notch State Park at the western end of the study corridor to the Willimantic River at the eastern end. Trail conditions and quality vary in surface type and width along its length; the western section of the trail is mainly 6 ft wide or more with a gravel or stone dust surface, and the eastern section is 4 ft wide or less with a soil and grassed surface. The trail is commonly used by walkers, hikers, mountain bikers, and cross country skiers.
The placement of the trail varies relative to the road and Hop River. As shown in Figure 2-9, the Hop River Trail is accessible from Bolton Notch State Park via a vehicle-only access drive and trailhead. Just east of the trailhead, the trail passes through a tunnel under Route 6 and continues to be lower in elevation than Route 6 until the grade of Route 6 drops near the Bolton Ice Palace, where the trail becomes higher than adjacent uses. The trail continues through a wooded area to Steeles Crossing Road. There is an informal parking area off Steeles Crossing Road (approximately ¼ mile west of Route 6). There is no signage on Route 6 indicating trail access on Steeles Crossing Road or any of the road crossings to the east. This lack of signage for the trail was noted the length of the corridor.
From Steeles Crossing Road, the trail continues east to Coventry. In this area, the trail is relatively isolated and much higher than Route 6 and thus limited views of the road. The trail continues east into Andover with a road crossing at Bailey Road (approximately ¼ mile southwest of Route 6). It then continues to Burnap Brook Road. The trail in this location is dirt and there is an informal parking area which is well used. The trail continues east to Wales Road and Shoddy Mill Road. At Shoddy Mill Road, the trail is dirt with some stone dust. It runs
Figure 2-9. Hop River Trail

Route 6 Hop River Corridor Transportation Study
2-26
along Route 6 in Historic Andover. The trail is elevated above Route 6 and is very heavily used. The trail is closest to Route 6 in Historic Andover at Long Hill Road where a crosswalk allows pedestrian access to the trail from Long Hill Road. From this location east to Route 316 (Hebron Road), the trail is not maintained. At Route 316, a new bridge was installed in April 2012 to provide uninterrupted travel along the trail and over traffic on Route 316.
East of Route 316, the trail continues to the southeast crossing Merritt Valley Road then travelling under Route 6 and assuming a route north of Route 6, closely following the Hop River. The trail continues east, crossing River Road and Pucker Street before going under the limited access highway segment of Route 6. The trail continues east between the Route 6 expressway and Route 66 East to Kings Road in Coventry, where the trail is barricaded due to an impassable bridge over the Hop River just to the east. Trail users must follow Kings Road to Flanders River Road before reconnecting with the trail at the Flanders Road crossing in Columbia. The trail then continues east to its terminus at the Willimantic River in Windham.
Transit Service and Operations
Connecticut Transit (CTTransit), a CTDOT-owned bus service, provides bus service to downtown Hartford on weekdays from the Park & Ride lots (see page 2-27 for locations) located along Route 6 in the study area. The route is designated Route 18 Willimantic/Coventry Express. The duration of the trip to Hartford is approximately 40 minutes from Columbia, 30 minutes from Andover, and 15 minutes from Bolton. Buses provide service from each stop approximately every half-hour between 6:00 a.m. and 7:30 a.m. on weekday mornings. Service is provided from Hartford to the area about every half-hour between 4:30 p.m. and 6:30 p.m. on weekday evenings. In addition, there is one bus providing service from Hartford to the area at around 1:00 p.m. There is no service Saturday or Sunday.
Ridership averages approximately 4,000 trips per month, equating to approximately 200 trips per weekday, or 100 commuters per weekday. While trips originate in Willimantic, most of the ridership is generated from the Columbia Park & Ride lot and points west.
Route 6 Hop River Corridor Transportation Study
2-27
Park & Ride Facilities
There are three commuter parking lots in the general study area. All three of the lots are adequately signed from the corridor, are fully ADA-compliant, and are serviced by CTTransit. The lots and associated amenities include:
Bolton Park & Ride Lot: Located along Route 6/Route 44 at the intersection of Morancey Road just west of the Bolton Notch area. The lot shares a driveway with the Connecticut Department of Transportation Highway Garage. The facility has a total of 87 parking spaces, 4 of which are handicap spaces. Parking usage counts since 2000 have indicated parking utilization that has varied from a low of 54% to a high of 71%. The most recent count occurred in 2009, indicating a utilization rate of 64%. There is no bus shelter or bike rack at this location. Field inspection of the lot in 2011 noted that there are four area lights, all of which were functional.
Andover Park & Ride: Located on Route 6, one-half mile west of Route 316. The lot can only be accessed from Route 6. This facility has a total of 60 parking spaces, 3 of which are handicap spaces. This lot can be accessed via sidewalks and is in the vicinity of the post office and town library. Parking usage counts since 2000 have indicated parking utilization that has varied from a low of 37% to a high of 58%. The most recent count occurred in 2010, indicating a utilization rate of 47%. There is a bus shelter, but no bike rack at this location. Field inspection of the lot in 2011 noted that there are two area lights, one of which was broken (located over the shelter).
Columbia Park & Ride Lot: Located on the southwest corner of the intersection of Route 6 and Route 66. The lot can only be accessed from Route 66. This facility has a total of 53 parking spaces, 3 of which are handicap spaces. This lot can be accessed via sidewalks and is in the vicinity of a few commercial buildings. Parking usage counts since 2000 have indicated parking utilization that has varied from a low of 74% to a high of 108%. The most recent count occurred in 2010, indicating a utilization rate of 74%. In addition to CTTransit, this lot is serviced by EasyStreet ridesharing service consisting of a 15-passenger van that runs one morning and one evening trip between the lot and Hartford each weekday. There is a relatively new bus shelter, but no bike rack at this location. Field inspection of the lot in 2011 noted that there are two area lights, one of which was occupied by a bird’s nest.
It is noted that the Express service buses that service the Park & Ride lots are not equipped with bike racks; however bikes are allowed in empty luggage compartments of these buses. The lack of convenient bike storage on these buses; the lack of bike racks at each lot; and the lack of sidewalks to the Andover lot collectively discourage commuters from considering bicycling and walking as part of their regular commuting trip.
Route 6 Hop River Corridor Transportation Study
2-28
2.1.5 Accident History
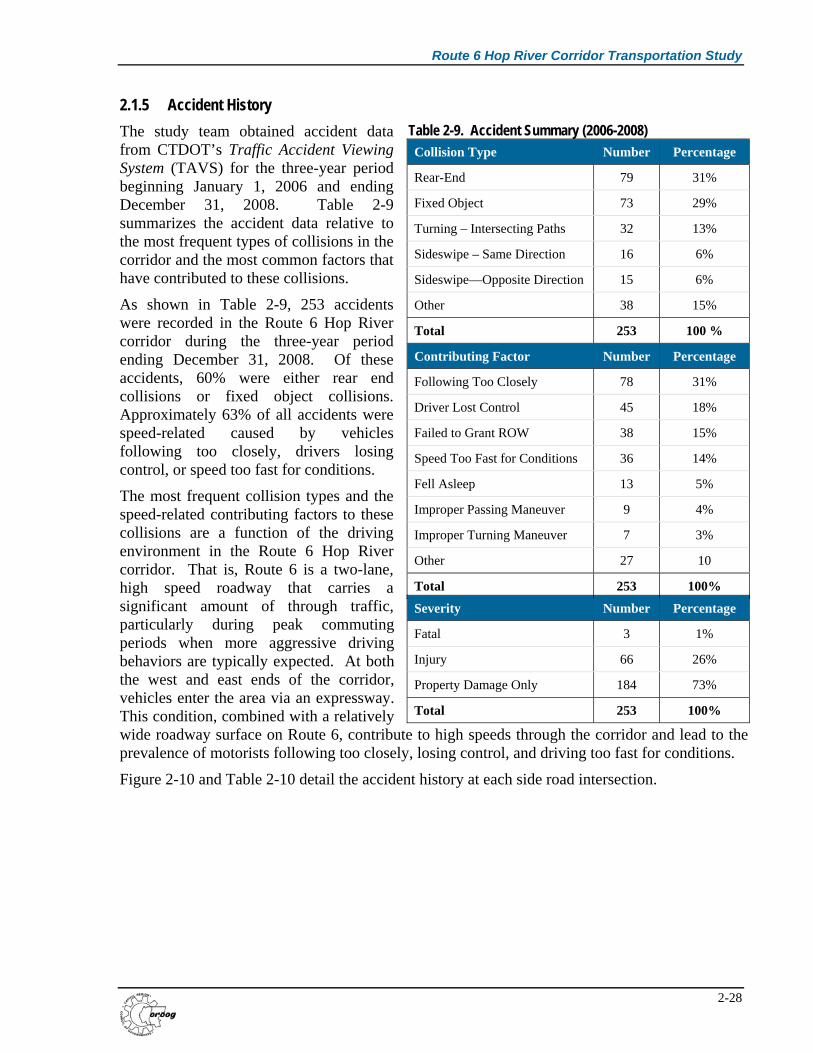
The study team obtained accident data from CTDOT’s Traffic Accident Viewing System (TAVS) for the three-year period beginning January 1, 2006 and ending December 31, 2008. Table 2-9 summarizes the accident data relative to the most frequent types of collisions in the corridor and the most common factors that have contributed to these collisions.
As shown in Table 2-9, 253 accidents were recorded in the Route 6 Hop River corridor during the three-year period ending December 31, 2008. Of these accidents, 60% were either rear end collisions or fixed object collisions. Approximately 63% of all accidents were speed-related caused by vehicles following too closely, drivers losing control, or speed too fast for conditions.
The most frequent collision types and the speed-related contributing factors to these collisions are a function of the driving environment in the Route 6 Hop River corridor. That is, Route 6 is a two-lane, high speed roadway that carries a significant amount of through traffic, particularly during peak commuting periods when more aggressive driving behaviors are typically expected. At both the west and east ends of the corridor, vehicles enter the area via an expressway. This condition, combined with a relatively wide roadway surface on Route 6, contribute to high speeds through the corridor and lead to the prevalence of motorists following too closely, losing control, and driving too fast for conditions.
Figure 2-10 and Table 2-10 detail the accident history at each side road intersection.
Table 2-9. Accident Summary (2006-2008) Collision Type Number Percentage
Rear-End 79 31%
Fixed Object 73 29%
Turning – Intersecting Paths 32 13%
Sideswipe – Same Direction 16 6%
Sideswipe—Opposite Direction 15 6%
Other 38 15%
Total 253 100 %
Contributing Factor Number Percentage
Following Too Closely 78 31%
Driver Lost Control 45 18%
Failed to Grant ROW 38 15%
Speed Too Fast for Conditions 36 14%
Fell Asleep 13 5%
Improper Passing Maneuver 9 4%
Improper Turning Maneuver 7 3%
Other 27 10
Total 253 100%
Severity Number Percentage
Fatal 3 1%
Injury 66 26%
Property Damage Only 184 73%
Total 253 100%

Legend
Study Corridor
0-3 Accidents
4-7 Accidents
≥ 8 Accidents
Route 6 at Johnson Road
Route 6 at
Route 6 at Notch Road
8
Route 6 at Stony Road
Route 6 at South Road
Route 6 at South Street
35
1
4
Route 6 at Edgarton Road
Inset 2
11
COVENTRYRoute 6 at Steeles Crossing Road Route 6 at
Aspinall Road
Route 6 at B rnap Brook Road
6 Route 6 at Roses Bridge Road
Route 6 at Route 66
34
BOLTON
See Inset 1
Route 6 at Wales Road
Burnap Brook RoadRoute 6 at
Long Hill Road
Route 6 at Bunker Hill Road
Route 6 to Lake Road
Route 6 at Parker Bridge Road
Route 6 at Woodward Road
0
1 3
0
25 4
Inset
Route 6 at Shoddy Mill Road
Route 6 at Route 316
Lake Road
Route 6 at Route 6 at
Woodward Road
Route 6 atHop River/Oakwood Lane
2
0 13
0 0
1
Route 6 at Hickory Hill Road
4
4
COLUMBIA
Route 6 at Route 87 Whitney Road
Route 66 at Cards Mill Road
Route 6 at Strickland Road
See Inset 2
6
ANDOVER
Route 66 atFlanders Road
1
Route 6 at Bailey Road
01
4ANDOVER
Inset 1Route 6 at
Hendee Road Figure 2-10.Intersection Accident History (2006-2008)NOT TO SCALE
Route 6 Hop River Corridor Transportation Study
Route 6 Hop River Corridor Transportation Study
2-30
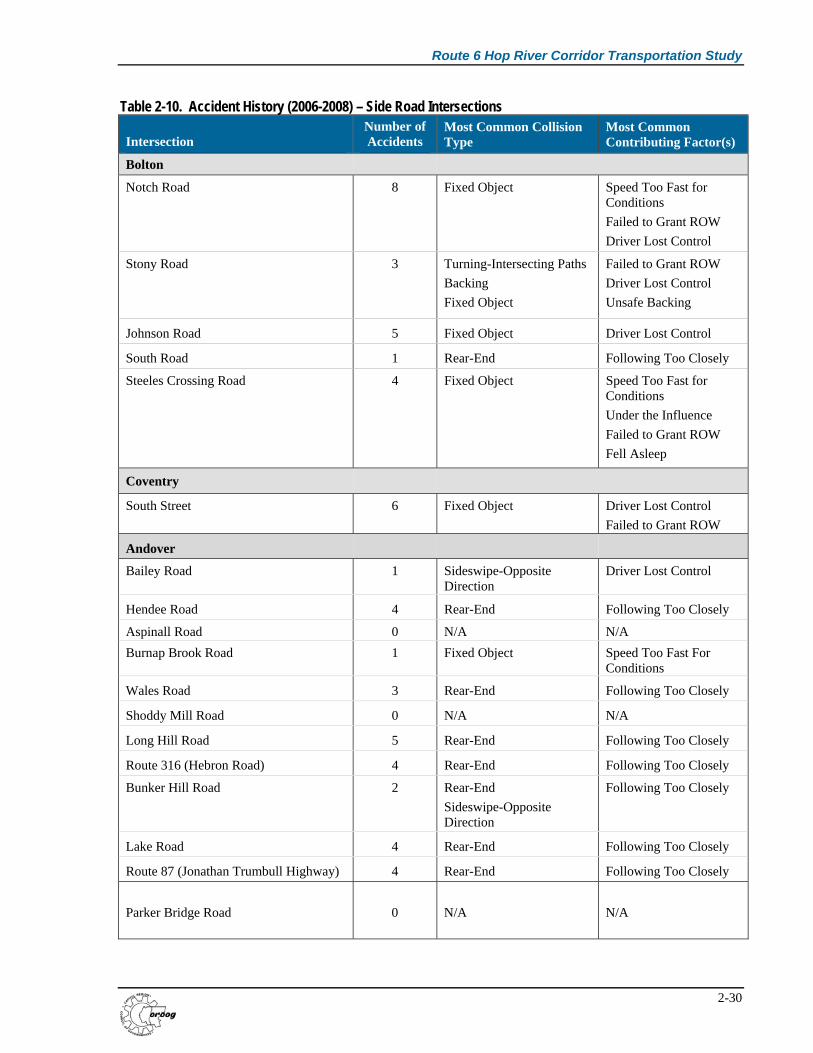
Table 2-10. Accident History (2006-2008) – Side Road Intersections
Intersection Number of Accidents
Most Common Collision Type
Most Common Contributing Factor(s)
Bolton
Notch Road 8 Fixed Object Speed Too Fast for Conditions
Failed to Grant ROW
Driver Lost Control
Stony Road 3 Turning-Intersecting Paths
Backing
Fixed Object
Failed to Grant ROW
Driver Lost Control
Unsafe Backing
Johnson Road 5 Fixed Object Driver Lost Control
South Road 1 Rear-End Following Too Closely
Steeles Crossing Road 4 Fixed Object Speed Too Fast for Conditions
Under the Influence
Failed to Grant ROW
Fell Asleep
Coventry
South Street 6 Fixed Object Driver Lost Control
Failed to Grant ROW
Andover
Bailey Road 1 Sideswipe-Opposite Direction
Driver Lost Control
Hendee Road 4 Rear-End Following Too Closely
Aspinall Road 0 N/A N/A
Burnap Brook Road 1 Fixed Object Speed Too Fast For Conditions
Wales Road 3 Rear-End Following Too Closely
Shoddy Mill Road 0 N/A N/A
Long Hill Road 5 Rear-End Following Too Closely
Route 316 (Hebron Road) 4 Rear-End Following Too Closely
Bunker Hill Road 2 Rear-End
Sideswipe-Opposite Direction
Following Too Closely
Lake Road 4 Rear-End Following Too Closely
Route 87 (Jonathan Trumbull Highway) 4 Rear-End Following Too Closely
Parker Bridge Road 0 N/A N/A
Route 6 Hop River Corridor Transportation Study
2-31
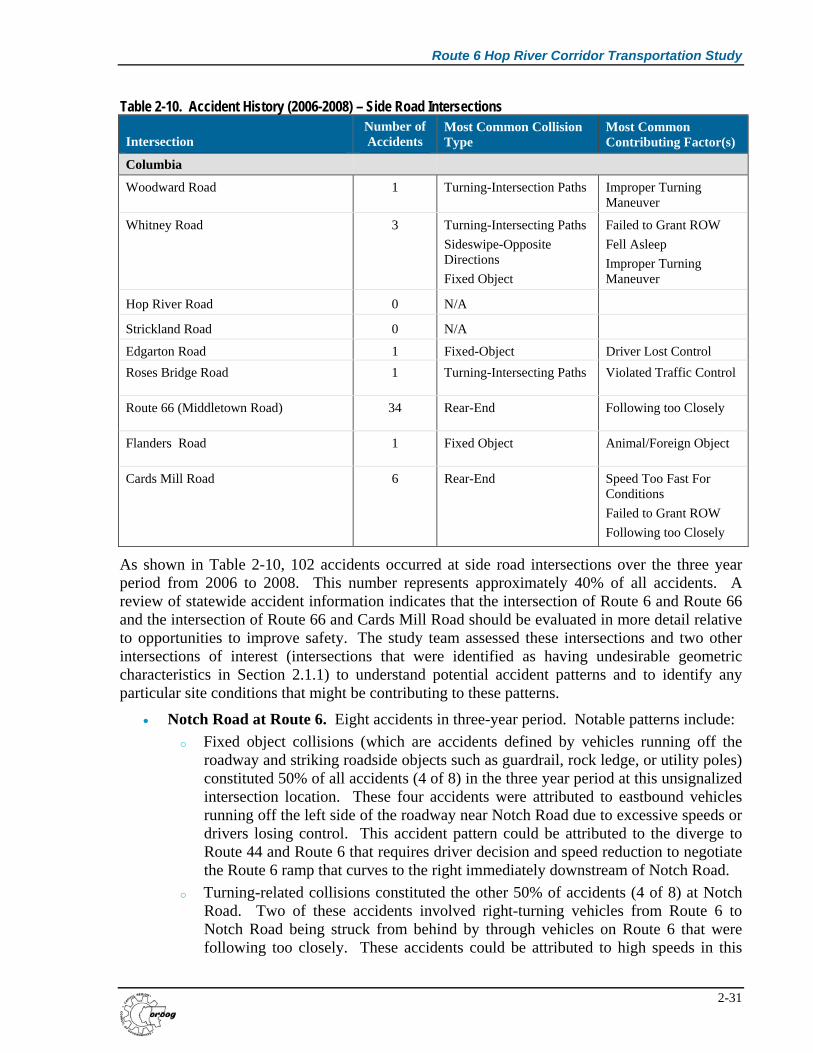
Table 2-10. Accident History (2006-2008) – Side Road Intersections
Intersection Number of Accidents
Most Common Collision Type
Most Common Contributing Factor(s)
Columbia
Woodward Road 1 Turning-Intersection Paths Improper Turning Maneuver
Whitney Road 3 Turning-Intersecting Paths
Sideswipe-Opposite Directions
Fixed Object
Failed to Grant ROW
Fell Asleep
Improper Turning Maneuver
Hop River Road 0 N/A
Strickland Road 0 N/A
Edgarton Road 1 Fixed-Object Driver Lost Control
Roses Bridge Road 1 Turning-Intersecting Paths Violated Traffic Control
Route 66 (Middletown Road) 34 Rear-End Following too Closely
Flanders Road 1 Fixed Object Animal/Foreign Object
Cards Mill Road 6 Rear-End Speed Too Fast For Conditions
Failed to Grant ROW
Following too Closely
As shown in Table 2-10, 102 accidents occurred at side road intersections over the three year period from 2006 to 2008. This number represents approximately 40% of all accidents. A review of statewide accident information indicates that the intersection of Route 6 and Route 66 and the intersection of Route 66 and Cards Mill Road should be evaluated in more detail relative to opportunities to improve safety. The study team assessed these intersections and two other intersections of interest (intersections that were identified as having undesirable geometric characteristics in Section 2.1.1) to understand potential accident patterns and to identify any particular site conditions that might be contributing to these patterns.
Notch Road at Route 6. Eight accidents in three-year period. Notable patterns include:
o Fixed object collisions (which are accidents defined by vehicles running off the roadway and striking roadside objects such as guardrail, rock ledge, or utility poles) constituted 50% of all accidents (4 of 8) in the three year period at this unsignalized intersection location. These four accidents were attributed to eastbound vehicles running off the left side of the roadway near Notch Road due to excessive speeds or drivers losing control. This accident pattern could be attributed to the diverge to Route 44 and Route 6 that requires driver decision and speed reduction to negotiate the Route 6 ramp that curves to the right immediately downstream of Notch Road.
o Turning-related collisions constituted the other 50% of accidents (4 of 8) at Notch Road. Two of these accidents involved right-turning vehicles from Route 6 to Notch Road being struck from behind by through vehicles on Route 6 that were following too closely. These accidents could be attributed to high speeds in this
Route 6 Hop River Corridor Transportation Study
2-32
area and the lack of a right turn lane to Notch Road that would allow turning vehicles to decelerate outside the path of through traffic. The other two accidents involved right-turning vehicles from Notch Road to Route 6 that did not grant the right of way to the vehicles on Route 6. These accidents could be attributed to the restricted sightlines from Notch Road to the west that make it difficult for turning vehicles to perceive sufficient gaps in traffic.
South Street at Route 6. Six accidents in three-year period. Notable patterns include:
o Fixed object collisions constituted 50% of all accidents (3 of 6) in the three year period at this unsignalized intersection location. Two of these accidents were attributed to westbound vehicles running off the right side of the roadway and one was attributed to an eastbound left-turning vehicle running off the roadway and striking guardrail near South Street. All three of these accidents were attributed to excessive speeds or drivers losing control. The curvature of Route 6 near South Street could also be a factor in these accidents.
o Turning-related collisions constituted 33% of all accidents (2 of 6). Both of these accidents were caused by vehicles turning left from South Street and colliding with through vehicles (one eastbound and one westbound) on Route 6. The relatively steep approach grade of South Street, which requires additional acceleration and time for a vehicle to complete a turn, and the left and right turn lanes on Route 6, which require additional distance and time for a vehicle to complete a turn, could be factors in these turning-related collisions involving left-turning vehicles from South Street.
Route 66 at Route 6. Thirty-four accidents in three-year period. Notable patterns include:
o Rear-end collisions constituted 59% of all accidents (20 of 34) in the three year period at this signalized intersection. The majority of these accidents (16 of 20) occurred on the Route 6 approaches to the intersection and were attributed to vehicles following too closely. Sight lines to the signal and vehicle queues on these approaches are good, but driver inattention combined with relatively high approach speeds could be factors in these accidents.
o Turning-related collisions constituted 15% of all accidents (5 of 34). Four of these accidents involved vehicles turning left from northbound Route 66 to westbound Route 6 or from southbound Route 6 to eastbound Route 66. The northbound/southbound movements at this intersection are concurrent and the left turn movements do not occur under a protected green signal phase. The geometry of the northbound and southbound approach legs – which includes medians, two-lane approaches, and offset left turns that occur from the shared through lane on the northbound approach and exclusive left turn lane on the southbound approach – requires left turning vehicles to traverse a greater distance than usual distance to complete a turn and requires motorists to compensate for this condition by selecting larger gaps in traffic. Failure of motorists to recognize the condition could be a factor in these accidents.

Route 6 Hop River Corridor Transportation Study
2-33
Cards Mill Road at Route 66 East. Six accidents in three-year period. Notable patterns include:
o Rear-end collisions constituted 33% of all accidents (2 of 6) in the three year period at this unsignalized intersection. These accidents occurred on the heavily skewed, stop-controlled Cards Mill Road approach to Route 66 East and were attributed to vehicles following too closely. Skewed approaches like the Cards Mill Road approach are often treated by drivers (who are making the oblique turn) as yield conditions and rolling stops because little reduction in speed is required to complete the turn. Consequently, when two vehicles are approaching the intersection and the driver of the second vehicle anticipates that the driver of the first vehicle will yield rather than stop at the intersection, rear end collisions oftentimes will result.
o One turning, one sideswipe, one overturning, and one fixed object collision constituted the other four accidents at this intersection. These accidents were attributed to excessive speeds and failure of motorists to grant the right of way. The variety in the types of collisions and these contributing factors do not indicate any other particular site condition at this intersection that should be investigated further.
Figure 2-11 and Table 2-11 detail the accident history along each roadway segment (between intersections) in the study corridor.

Legend
Study Corridor
0-4 Accidents
Notch Road to Stony Road: 32 Accidents
Johnson Road to South Road: 2 Accidents
5-10 Accidents
> 10 Accidents
COVENTRY
South Road toSteeles Crossing Road:
3 Accidents
South Street to Bailey Road: 2 Accidents
Stony Road to Johnson Road:2 Accidents 2 Accidents
Hendee Road toBurnap Brook Road:
2 Accidents
Burnap Brook Road to Wales Road:
2 Accidents
Steeles Crossing Road to South Street:7 Accidents
BOLTON
p3 Accidents
Long Hill Road to Route 316:3 Accidents
Parker Bridge Road to Woodward Road:1 A ident
Bailey Road to Hendee Road: 1 Accident
Wales Road to Shoddy Mill Road: 4 Accidents
Route 87 to Parker Bridge Road:4 Accidents
BOLTON 1 Accident
Shoddy Mill Road to Long Hill Road:5 Accidents
4 Accidents
Route 316 to Bunker Hill Road:1 Accident
Whitney Road to Hop River Road: 4 Accidents
Route 6 toFlanders Road:23 Accidents
Bunker Hill Road to Lake Road: 8 Accidents
Cards Mill Road to Windham: 0 Accidents
Lake Road to Route 87:3 Accidents
Woodward Road to Whitney Road:6 Accidents
Flanders Road to Cards Mill Road:10 Accidents
Roses Bridge Road to Route 66:16 Accidents
Hop River Road to Edgarton Road:9 Accidents
ANDOVER
COLUMBIAFigure 2-11.
Segment Accident History (2006-2008)NOT TO SCALE
Route 6 Hop River Corridor Transportation Study

Route 6 Hop River Corridor Transportation Study
2-35
Table 2-11. Accident History (2006-2008) – Roadway Segments
Intersection Number of Accidents
Most Common Collision Type(s)
Most Common Contributing Factor(s)
Bolton
Notch Road to Stony Road 32 Fixed Object Speeds Too Fast For Conditions
Stony Road to Johnson Road 2 Rear-End Following Too Closely
Johnson Road to South Road 2 Sideswipe-Opposite Direction
Rear-End
Driver Lost Control
South Road to Steeles Crossing Road 3 Rear-End Speed too Fast For Conditions
Failed to Grant ROW
Following Too Closely
Steeles Crossing Road to South Street
7 Fixed Object Fell Asleep
Coventry
South Street to Bailey Road 2 Fixed Object
Sideswipe-Opposite Direction
Driver Lost Control
Andover
Bailey Road to Hendee Road 1 Fixed Object Fell Asleep
Hendee Road to Aspinal Drive 0 N/A N/A
Aspinal Drive to Burnap Brook Road 2 Fixed Object
Sideswipe-Opposite Direction
Speed Too Fast For Conditions
Driver Lost ControlBurnap Brook Road to Wales Road 3 Fixed Object Speed Too Fast For
Conditions
Driver Lost Control
Fell Asleep
Wales Road to Shoddy Mill Road 4 Fixed Object Speed Too Fast For Conditions
Following Too Closely
Fell Asleep
Defective Equipment
Shoddy Mill Road to Long Hill Road 5 Rear-End Following Too Closely
Long Hill Road to Route 316 (Hebron Road)
3 Turning-Intersecting Paths Failed to Grant ROW
Route 316 (Hebron Road) to Bunker Hill Road
1 Rear-End Following Too Closely

Route 6 Hop River Corridor Transportation Study
2-36
Table 2-11. Accident History (2006-2008) – Roadway Segments
Intersection Number of Accidents
Most Common Collision Type(s)
Most Common Contributing Factor(s)
Bunker Hill Road to Lake Road 8 Turning-Opposite Direction
Turning-Intersecting Paths
Sideswipe Same Direction
Failed to Grant ROW
Lake Road to Route 87 (Jonathan Trumbull Hwy)
3 Rear-End Following Too Closely
Route 87 (Jonathan Trumbull Hwy) to Parker Bridge Road
4 Sideswipe Same Direction
Rear-End
Head On
Fixed Object
Under the Influence
Improper Passing Maneuver
Following Too Closely
Driver Lost Control
Columbia
Parker Bridge Road to Woodward Road
1 Sideswipe-Opposite Direction
Driver Lost Control
Woodward Road to Whitney Road 6 Fixed Object Fell Asleep
Whitney Road to Hop River Road 4 Rear-End Following Too Closely
Hop River Road to Edgarton Road 9 Rear-End Following Too Closely
Roses Bridge Road to Route 66 16 Turning-Intersecting Paths Failed to Grant ROW
Route 6 to Flanders Road 23 Fixed Object Driver Lost Control
Flanders Road to Cards Mill Road 10 Rear End
Fixed Object
Turning-Same Direction
Turning-Intersecting Paths
Failed to grant ROW
Improper Passing Maneuver
Following too Closely
Cards Mill Road to Windham 0 N/A N/A
As shown in Table 2-11, 151 accidents occurred along roadway segments between intersections over the three year period from 2006 to 2008. This number represents approximately 60% of all accidents. The study team further assessed each these segments and identified several notable accident patterns. These include:
Route 6 between Notch Road and Stony Road. Thirty-two accidents occurred in the three-year period, of these:
o Eleven accidents occurred in the Route 6/Route 44 “interchange” and were predominantly fixed object collisions attributed to excessive speeds.
o Five accidents occurred at the Bolton Ice Palace/Munson’s driveway intersection with Route 6 and were predominantly turning-related.
Route 6 Hop River Corridor Transportation Study
2-37
Route 6 between Roses Bridge Road and Route 66. Sixteen accidents occurred in the three-year period, of these:
o Eleven accidents occurred at commercial driveways and included turning, rear-end, and sideswipe collisions.
Route 66 between Route 6 and Flanders Road. Twenty-three accidents occurred in the three-year period, of these:
o Fourteen (61%) accidents were fixed object collisions predominantly attributed to excessive speeds and drivers losing control. There were no areas where a concentration of accidents would indicate that a specific site condition has contributed to the number of fixed object collisions in this segment. The relatively narrow shoulders throughout the segment and the generally curving alignment could be contributing factors.
o Two accidents were fatal collisions. One accident occurred at the Columbia Motorsports driveway and involved a motorcycle being struck by a truck exiting the driveway. The other accident occurred near Murphy’s Drive-in and involved a head-on collision.
Although one may feel that the number of accidents along any particular segment of the Route 6 Hop River corridor might appear high, analysis of the local accident data does not suggest a deficiency in vehicular safety along any particular segment when compared to statewide accident data.
2.1.6 Incident Management Severe accidents and other incidents in the Route 6 study corridor that result in the closure of Route 6 and the diversion of traffic from Route 6 to other local and state roadways was an expressed concern of the public and REDC members. Currently, there are no formal plans maintained by CTDOT, the Connecticut State Police, or local traffic authorities in Bolton, Coventry, Andover, or Columbia that outline how traffic is to be managed during these incidents on Route 6.
Formal diversion plans are typically developed for interstates and major expressways by CTDOT working in cooperation with the regional planning agencies and local municipalities to determine viable alternate routes for incident management. Formal diversion plans are not typically developed for other arterial roadways such as Route 6. When necessary, diversion plans for incident management on Route 6 are created and implemented by state and local officials on a case-by-case basis depending on the location of the incident and its proximity to viable alternate routes.
Whether formal diversion plans should be developed for Route 6 in the study corridor would be a point of further discussion among CTDOT, CRCOG, WINCOG, and municipal representatives. Because Route 6 in the study corridor carries a significant proportion of through traffic between the terminus of I-384 and the Route 6 expressway, there is valid reason to suggest that this section of roadway should be treated similarly to I-384 and the Route 6 expressway with respect to incident management.

Route 6 Hop River Corridor Transportation Study
2-38
The development of diversion plans for the Route 6 study corridor, whether as part of a formal planning process or in response to an immediate incident, should consider:
The identification of viable alternate routes that can most safely and efficiently accommodate large volumes of traffic – a significant percentage of which is through traffic, and a measurable percentage of which is heavy vehicle and truck traffic. Viable alternate routes for through traffic should include other arterial roadways or major, state-maintained collector roadways. In the region, viable alternate routes include:
o For a closure between Route 44 and Route 316, use Route 85 and Route 316 from I-384 in Bolton to Route 6 in Andover. This route would add approximately 11 miles to a trip between Route 44 and Route 316. It is noted that Route 603 (Boston Hill Road), which connects Route 85 and Route 316, was determined to be too narrow to safely accommodate high volumes of truck traffic and is therefore not considered a viable alternate in this area.
o For a closure between Route 316 and Route 87, use Route 316 and Route 66 from Route 6 in Andover to Route 6 in Columbia. This route would add approximately 7 miles to a trip between Route 316 and Route 66.
o For a closure between Route 87 and Route 66, use Route 87 and Route 66 from Route 6 in Columbia to the intersection of Route 6 expressway and Route 66 East, also in Columbia. This route would add approximately 1 mile to a trip between Route 87 and Route 66.
o For a closure anywhere on Route 6 between Route 44 and Route 66, use Route 44, Route 31, and Route 32 from I-384 in Bolton to Route 6 expressway in Columbia. This route would add approximately 0.1 mile to a trip between Route 44 and Route 6 expressway.
The need to maintain local access to Route 6. Formal diversion planning for an incident on Route 6 is different from diversion planning for an incident on a limited-access interstate because of the need to provide local access to points beyond the preferred point of diversion (for through traffic) from the main route. When an interstate is closed, all traffic is diverted to the nearest upstream exit and follows a defined detour route that is managed with temporary signs and traffic police. When a portion of Route 6 is closed, access for local traffic must be maintained up to the point of closure, which could be located beyond the preferred point of diversion for through traffic. Through motorists who receive notification in advance of the closure can divert to the most convenient and viable alternate route; through motorists who do not receive notification in advance could proceed into the corridor until the point of closure and bypass the incident along local roadways and detour routes. This latter condition is of particular concern when relatively large volumes of traffic and large trucks are using local roadways that are not designed to safely accommodate this traffic.
Route 6 Hop River Corridor Transportation Study
2-39
The potential for timely implementation of the diversion plan that includes real-time notification of motorists in the event of an incident. Currently, there are no permanent alert systems (variable message signs or highway emergency radio signs) deployed on eastbound I-384 or westbound Route 6 expressway approaching the Route 6 corridor that could be used to inform motorists of incidents, road closures, or alternate routes. It is noted that CTDOT’s current policy regarding variable message signs (VMSs) is that interstate and expressway VMSs are not used to display messages regarding conditions on adjacent or intersecting arterial roadways. Under this policy, signs deployed to the approach roadways would not be used to display Route 6 conditions.
It is noted that the development of a formal diversion plan for the Route 6 study corridor would be contingent upon a decision by state, regional, and local stakeholders regarding the need for a formal plan and further discussion on the applicability of a plan to a non-expressway/non-interstate route; the feasibility of implementing a plan that is targeted to the diversion of through traffic to other major roadways while maintaining local traffic access to Route 6; and the costs associated with developing a plan and deploying new infrastructure (such as permanent VMSs) to ensure its effectiveness.
2.2 Resources
The study team identified and reviewed environmental, historic, cultural, and visual resources in the study corridor. These resources are generally considered constraints that could affect the feasibility of various improvement alternatives in the corridor. Potential impacts to these resources will be avoided where possible. More specific environmental evaluations and documentation will be completed in accordance with CEPA and NEPA requirements under subsequent initiatives as study recommendations are advanced to design and implementation.
2.2.1 Environmental Resources
Environmental resources (shown in Figure A2-4 in Appendix 2.7) in the study corridor include:
Hop River and associated tributaries and floodplains. The Hop River generally runs parallel to, and north of, the study corridor beginning in Bolton north of Route 6 and west of Stony Road and terminating at the Willimantic River. The Hop River crosses to the south side of Route 6 and back between Stony Road and Steeles Crossing Road in Bolton. Several tributaries are also conveyed under Route 6 in the study area. Potential impacts to the Hop River floodplain need to avoided or minimized. The Hop River’s regulatory floodway will also need to be avoided or spanned in order to ensure that any increases in water surface elevations do not occur as a result of the improvement recommendations.
Wetland Soils. Wetland soils are located throughout the study corridor and are generally associated with the floodplains of the Hop River and its tributaries.

Route 6 Hop River Corridor Transportation Study
2-40
Natural Diversity Data Base (NDDB) Areas. NDDB Areas represent known locations, of state listed species and significant natural communities. NDDB Areas are a generalized representation of species and community locations; the exact locations and species names are masked to protect sensitive species from collection and disturbance.8 Four sections of the Route 6 study corridor pass through NDDB Areas, including locations in Bolton (at Route 44), Andover, and Columbia (at Route 66).
2.2.2 Historic and Cultural Resources
Historic and cultural resources in the study corridor were identified and documented under the REDC’s Route 6 Hop River Corridor Economic Development Strategy and Master Plan Study (shown in Figure A2-5 in Appendix 2.8). These resources include:
Patriot Farm at Steeles Crossing Road in Bolton Former White’s Tavern Washington Rochambeau Revolution Route and Stone Monument at the Post Farm Post Farm and barns Two farmhouses located on the north side of Route 6 just east of Wales Road Andover Library, First Congregational Church, and Andover Museum in Historic Andover “Dog Pound” structure Cemetery at the First Church and War Memorial at Route 316 Baptist Church at Roses Bridge Road Lighthouse building in the southwest quadrant of the Route 6 and Route 66 intersection
2.2.3 Visual Resources
Significant views that are known to be important to the communities were identified and documented under the REDC’s Route 6 Hop River Corridor Economic Development Strategy and Master Plan Study. In addition, the REDC determined several locations where gateways should be established to improve the visual appeal of the corridor. These significant views and gateway locations (shown in Figure A2-6 in Appendix 2.9) include:
Significant Views: o Patriot Farm at Steeles Crossing Road in Bolton o Historic houses at Post Farm and M. Dion properties in Andover o Historic Andover view of First Congregational Church and library o Farmland views of Post Farm and Hutchinson Farm in Andover o Open meadow wetlands view in Columbia at the Columbia Garage
Gateway Locations: o Bolton Notch in Bolton o Route 6 and Route 66 intersection in Columbia o Route 66 East near Windham Town Line in Columbia
8 http://cteco.uconn.edu/guides/Natural_Diversity_Database.htm