expanded cellular amino acid pools containing ... rinehart... · expanded cellular amino acid pools...
TRANSCRIPT

Expanded Cellular Amino Acid Pools Containing Phosphoserine,Phosphothreonine, and PhosphotyrosineJustin B. Steinfeld,∥,§ Hans R. Aerni,∥,†,‡ Svetlana Rogulina,†,‡ Yuchen Liu,§ and Jesse Rinehart*,†,‡
Department of †Cellular & Molecular Physiology, ‡Systems Biology Institute, and §Molecular Biophysics & Biochemistry, YaleUniversity, New Haven, Connecticut 06520, United States
*S Supporting Information
ABSTRACT: Adding nonstandard amino acids to the geneticcode of E. coli expands the chemical and biological functionalspace for proteins. This is accomplished with engineered,orthogonal aminoacyl-tRNA synthetase and tRNA pairs thatrequire a nonstandard amino acid in sufficient intracellularquantities to support protein synthesis. While cotranslationalinsertion of phosphoserine into proteins has been accom-plished, conditions that modulate intracellular phosphoaminoacid concentrations are still poorly understood. Here we usedgenetic and metabolic engineering to increase the freeintracellular levels of phosphoserine in E. coli. We show thatdeletion of the phosphoserine phosphatase serB elevates theintracellular levels of phosphoserine within ranges comparable to those of standard amino acids. These new conditions improvedinsertion of phosphoserine into recombinant proteins. Surprisingly, we also observed dramatic increases in intracellular levels ofphosphothreonine and phosphotyrosine when WT cells were grown in LB with supplemented phosphothreonine and serBdeficient cells were grown in low phosphate media with supplemented phosphotyrosine, respectively. These findings remove amajor barrier for further expansion of the genetic code with additional phosphorylated amino acids.
Site-directed incorporation of nonstandard amino acids(NSAA) to produce novel proteins in vivo has been the aim
of many studies with potential applications for biomedicalresearch, human health, and the biotechnology industry. Todate, the methodology developed for this purpose relies onprotein engineering efforts to generate orthogonal translationsystems (OTS) that utilize reassigned stop codons.1,2 Over 70NSAA have been site-specifically inserted into proteins.1 Thiswas accomplished with a number of strategies includingorthogonal tRNA:aminoacyl-tRNA synthetase pairs,1 orthogo-nal ribosomes,3 and more recently, elongation factor (EF-Tu)variants.4 Recently we reported using a combination of thesestrategies to incorporate the natural NSAA phosphoserine(pSer).4,5
Serine phosphorylation is among the most abundantposttranslational modifications in eukaryotic cells, andphosphorylated protein networks form the basis for regulatingmost physiological processes. The kinase component of thehuman genome is known, and tens of thousands ofphosphorylation sites on human proteins are being identified.6,7
However, the corresponding kinase responsible for proteinphosphorylation is often not obvious from phosphoproteomicsdata alone. Genetically encoded phosphorylated amino acidswould enable researchers to synthesize natural phosphoproteinswithout a priori knowledge of their natural posttranslationalmodification pathway.Despite many advances in the field, cellular NSAA levels are
not typically quantitatively measured in connection with OTS
development. This lack of information leads to questions ofwhether new cotranslationally incorporated NSAA systems maybe limited by NSAA bioavailability. Previously we established apSer OTS without directly examining levels of pSer in thecell.4,5 Questions about the levels of pSer in the cell andoptimum OTS function were left unanswered. Here, wedetermined the intracellular levels of pSer in E. coli andexplored the possibility of adding phosphothreonine (pThr)and phosphotyrosine (pTyr) to the intracellular amino acidpool. We accomplished this by developing a quantitative massspectrometry (MS) assay enabling the quantitation ofphosphorylated amino acid levels in E. coli extracts. We thenused this method to show that media conditions combined withgenomic and metabolomic engineering can elevate pSer tointracellular levels comparable to, or exceeding, other standardamino acids. These conditions improved cotranslationalinsertion of pSer via the pSer OTS. Furthermore, the sameapproaches yielded significant elevation of pThr and pTyr inthe intracellular amino acid pool. The conditions reported herecan be used as a starting point for further expansion of thegenetic code with additional phosphorylated amino acids.
Received: January 24, 2014Accepted: March 19, 2014
Letters
pubs.acs.org/acschemicalbiology
© XXXX American Chemical Society A dx.doi.org/10.1021/cb5000532 | ACS Chem. Biol. XXXX, XXX, XXX−XXX

■ RESULTS AND DISCUSSION
Expanding the genetic code with any NSAA requires theexpansion of the natural pool of free amino acids available forprotein synthesis. It has been known for decades that E. coli canimport NSAA from the media and even incorporate these newamino acids into proteins.8 We were interested in under-standing how phosphorylated NSAA levels would compare tothe levels of standard amino acids in the cell. Recentmetabolomics studies in E. coli have made quantitative surveysof hundreds of small molecules and metabolites, includingamino acids.9,10 However, naturally occurring phosphorylatedamino acids, such as pSer, were not considered in these studiesdespite evidence that pSer is part of serine biosyntheticpathways in most cells.11−13 Mass spectrometry (MS) hasincreasingly become the method of choice for metabolomics,and new methods have recently been described forquantification of underivatized amino acids from cellularextracts and other complex matrices.14−16 We therefore soughtto develop a method to quantitate pSer, pThr, pTyr, andstandard amino acids from E. coli cellular extracts. For thispurpose we developed a liquid chromatography tandem MS(LC−MS/MS) method on a triple quadrupole system forprecise label-free quantitation using multiple reaction monitor-ing (MRM). This workflow offers high sensitivity, specificity,linear dynamic range, and throughput while multiplexingquantitation of amino acids from a single LC−MS/MSexperiment.We began our study by developing a method to extract
amino acids from whole E. coli cells. Our extraction methodallowed us to isolate amino acids while removing salts, lipids,and proteins (Figure 1a). Cells lysis in 1 M HCl precipitatedout many lipids and most proteins without degrading O-linkedphosphorylated amino acids in the solution.17 A chloroformextraction step subsequently removed the majority of theremaining lipids, thereby extending the lifetime of the HPLCcolumn. Amino acids were directly analyzed by LC−MS/MSafter a filtration step and normalized for the number of cells inthe original cell culture. This method was validated withchemically pure amino acid standards that were spiked into cellextracts to validate efficient recovery. We next developed aMRM method to quantitate relative levels of pSer, pThr, pTyr,serine (Ser), threonine (Thr), tyrosine (Tyr), phenylalanine(Phe), lysine (Lys), histidine (His), and arginine (Arg) in ourE. coli extracts. Direct infusion of 30 pmol/μL solutions of eachpure amino acid standard into the MS was performed toidentify specific transitions for each amino acid and to optimizecollision energies for sensitive detection of the amino acids (seeMethods). On average, 5 product ions were observed for eachsingly charged amino acid precursor, and the most sensitivetransitions (precursor and product ion pairs) for each aminoacid were selected (Supplementary Table 1). The optimizedtransitions were then used to develop our LC−MS/MSworkflow, which included assigning specific retention timesfor each amino acid (Figure 1a and Supplementary Table 1).Most amino acids in the assay were chromatographicallyresolved (Figure 1a and Supplementary Table 1) except formoderate overlap of pSer with pThr peaks (0.68 and 0.74 min,respectively) and His, Lys, and Arg peaks (11.43, 11.43, and11.77 min respectively). A dynamic MRM method with a totaldwell time of 800 ms was used for monitoring at least 2 specifictransitions for each amino acid. This resulted in at least 1
quantitative transition and 1−3 qualitative transitions for eachamino acid (Supplementary Table 1).The LC−MS/MS workflow was used to create calibration
curves for each amino acid (Figure 1b and SupplementaryFigures 1b and 2b). The calibration curve for pSer showedgood linearity over a range of concentrations, with similarresults for all three phosphorylated amino acids. Calibrationcurves were fit with a weighted (1/x) quadratic calibrationcurve ignoring the origin. The quality of the fit for assessingcalibration curves was the maximum percent residual ascalculated by MassHunter software. All of the amino acids inour study formed calibration curves that were linear up to 250pmol and began to saturate by 500 pmol, with the exception ofpThr, which was linear up to 500 pmol. We used our calibrationcurves to empirically determine a lower limit of detection(LLOD) and upper limit of detection (ULOD) for each aminoacid (Figure 1b and Supplementary Table 2). The lower limitof quantitation (LLOQ) was established in the E. coli matrixassuming a minimum signal/noise ratio of 9:1 for each analyte
Figure 1. LC−MS/MS analysis of phosphorylated amino acids. (A)Scheme showing the preparation of cell extracts for LC−MS/MSanalysis. A typical chromatogram from an LC−MS/MS run of a 90pmol amino acid standard is shown. Unique MRM transitions areplotted for the amino acids indicated above the individual peaks. (B)Representative calibration curve for pSer. Calibration curves for allanalytes were acquired daily in duplicate, and calibration curves wereobtained after applying a weighted (1/x) quadratic curve fit. The fittedcalibration function for this curve was y = −5.095375x2 +6398.390847x − 673.466721, and the maximum % residual was 3.9.Experimentally determined lower and upper limits of quantitation forpSer, pThr, and pTyr are listed in the table.
ACS Chemical Biology Letters
dx.doi.org/10.1021/cb5000532 | ACS Chem. Biol. XXXX, XXX, XXX−XXXB

peak. The upper limit of quantitation (ULOQ) was fixed at 500pmol for all amino acids, providing good analytical sensitivityand dynamic range for detection of analytes. We used theindividual amino acid standard curves and 3−5 replicatemeasurements from our E. coli extracts to estimate the relativeamounts of amino acids in each sample. The measured levelsfor the standard amino acids were comparable to previousreports.9,10
We first explored the steady-state levels of phosphorylatedamino acids found in wild type E. coli K12 cells grown in richLuria−Bertani media (LB) and low phosphate minimal media(LPM). Phosphate concentrations used in LPM were based onprevious research conducted to induce the PHO regulon.18
Wild type cells in minimal or rich media were generally devoidof phosphorylated amino acids, while standard amino acidslevels were easily detected and showed similar concentrations(Figure 2a). The one unexpected exception was pThr, whichwas present only in cells cultured in LB and was 10-fold lessabundant than standard amino acids. To our knowledge therehave been no previous reports of steady-state pools of pThr inany cell. We next tested whether supplementing the media with5 mM concentration of each phosphorylated amino acidseparately would elevate intracellular levels in a wild typebackground. Supplementing LB media with 5 mM pSerincreases steady-state levels in the cell, but the detectedconcentration is well below the concentration of canonical
Figure 2. Quantitation of intracellular amino acids in E. coli extracts. (A) Measured amino acid quantities of select amino acids in K12 BW25113 WTE. coli grown in LPM (light gray) and LB (dark gray) media. (B) Relative amino acid concentrations of K12 BW25113 WT E. coli grown in LPM(light gray) and LB (dark gray) media compared to WT E. coli grown in LPM with 5 mM pSer (light blue), LB with 5 mM pSer (dark blue), LPMwith 5 mM pThr (light violet), LB with 5 mM pThr (dark violet), LPM with 5 mM pTyr (light orange), and LB with 5 mM pTyr (dark orange).Error bars were calculated using the 95% confidence interval with n = 5.
ACS Chemical Biology Letters
dx.doi.org/10.1021/cb5000532 | ACS Chem. Biol. XXXX, XXX, XXX−XXXC

amino acids (Figure 2b). LPM supplemented with 5 mM pSerproduced no detectable levels of pSer in the cell extracts butrather produced an increase in free Ser levels (Figure 2b). Thissuggested an increase in phosphoserine phosphatase activityconsistent with previous studies of E. coli cultured in lowphosphate media.19 A slightly more dramatic effect wasobserved with pThr supplementation. In LB, pThr levelswere similar regardless of supplementation, yet in LPM,addition of 5 mM pThr caused a dramatic spike in Thr levelsand suggested that, similar to pSer, a phosphate scavengingmechanism is induced and degrades pThr19 (Figure 2b). Thismechanism also explains the depletion of the natural pThr poolin LPM without pThr supplementation (Figure 2a). We next
examined pTyr by supplementing LB with 5 mM pTyr andobserved no detectable levels in the cell. In contrast, a dramaticincrease in intracellular pTyr concentration was observed incells cultured in LPM supplemented with 5 mM pTyr, evengreater than pSer/pThr, proportionately (Figure 2b). It isunclear why this might be the case; however, the increase in L-Ser and L-Thr levels after adding pSer and pThr, respectively,relative to L-Tyr might suggest that degradation is the maincause of this difference and not entry into the cell. The moststriking effect was a 10-fold rise in Tyr levels after pTyrsupplementation in LB (Figure 2b). All three phosphoaminoacids are very stable in both media after overnight culture (datanot shown) suggesting that pTyr enters the cell and is degraded
Figure 3. Quantitation of intracellular amino acids in a ΔserB E. coli strain extracts. (A) Measured amino acid quantities of select amino acids in K12BW25113 WT vs ΔserB E. coli grown in LPM media and LB media. (B) Measured amino acid quantities of ΔserB E. coli grown in LPM media (lightgray), LB media (dark gray), LPM with 5 mM pSer (light blue), LB with 5 mM pSer (dark blue), LPM with 5 mM pThr (light violet), LB with 5mM pThr (dark violet), LPM with 5 mM pTyr (light orange), and LB with 5 mM pTyr (dark orange). Error bars were calculated using the 95%confidence interval with n = 5.
ACS Chemical Biology Letters
dx.doi.org/10.1021/cb5000532 | ACS Chem. Biol. XXXX, XXX, XXX−XXXD
enzymatically or chemically by endogenous pathways. Furtherexploration is necessary to understand why pTyr is turned overin cells grown in LB but not in LPM. One possibility is thatpTyr is less utilized than pSer/pThr in phosphate scavengingbut is degraded for tyrosine scavenging when the cell is in richmedia where Tyr is necessary for rapid growth. This suggeststhat there are divergent mechanisms for pTyr and pSer/pThrturnover in the cell with a previously unrecognized pathway forpTyr turnover in rich media with pThr-sparing properties.Supplementing LB and LPM with phosphorylated amino
acids showed that phosphatase activity may be a criticallynchpin to elevate intracellular levels of phosphorylated aminoacids. We have previously shown that deletion of the serB geneis required for our system to genetically encode pSer.4,5
However, we never directly measured the effect of serB deletion(ΔserB) on the steady-state levels of pSer in the cell. Wetherefore used our LC−MS/MS method to explore the effectsof ΔserB on cellular levels of pSer, pThr, and pTyr. Weobserved a dramatic 10-fold increase in pSer levels in the ΔserBstrain compared to wild type cells in LB media (Figure 3a). Thesame experiment was repeated in LPM and showed an evengreater 100-fold increase in pSer levels (Figure 3a). Theseextreme increases were not influenced by supplementation withpSer and had no dramatic effects on the canonical amino acids
monitored in our experiments (Figure 3a,b). Thus, we showedthat a mutation in the serine biosynthetic pathway had a moredramatic effect on increasing pSer than supplementing themedia with this NSAA.We next examined the levels of pTyr and pThr in the ΔserB
strain. While the ΔserB background stabilized pSer levels, freepThr levels were not protected in LPM and suggested thatanother phosphatase scavenges pThr in low phosphateconditions (Figure 3a). Supplementing LPM with pThrstabilized free pThr in the cell but with an accompanying 10-fold increase in Thr levels. Furthermore, this provides evidencefor a pSer-sparing pThr phosphatase activity in the ΔserB cells(Figure 3b). We conducted a similar set of experiments in aΔphnE1 background and saw a dramatic reduction of Ser andThr levels in cells grown in LPM+pThr or pSer compared withWT cells (Supplementary Figure 3). This observation is againconsistent with a typical PHO regulon response which includesthe induction of transport pathways (that require phnE) tobring phosphate-containing molecules into the cell. Interest-ingly, serB disruption also had no effect on the striking pTyrturnover in LB but produced 10-fold more intracellular pTyr inLPM supplemented with pTyr (Figure 2b). These resultssuggest the pTyr- and pSer-sparing effects of the serB deletionare connected in low phosphate conditions but suggest a more
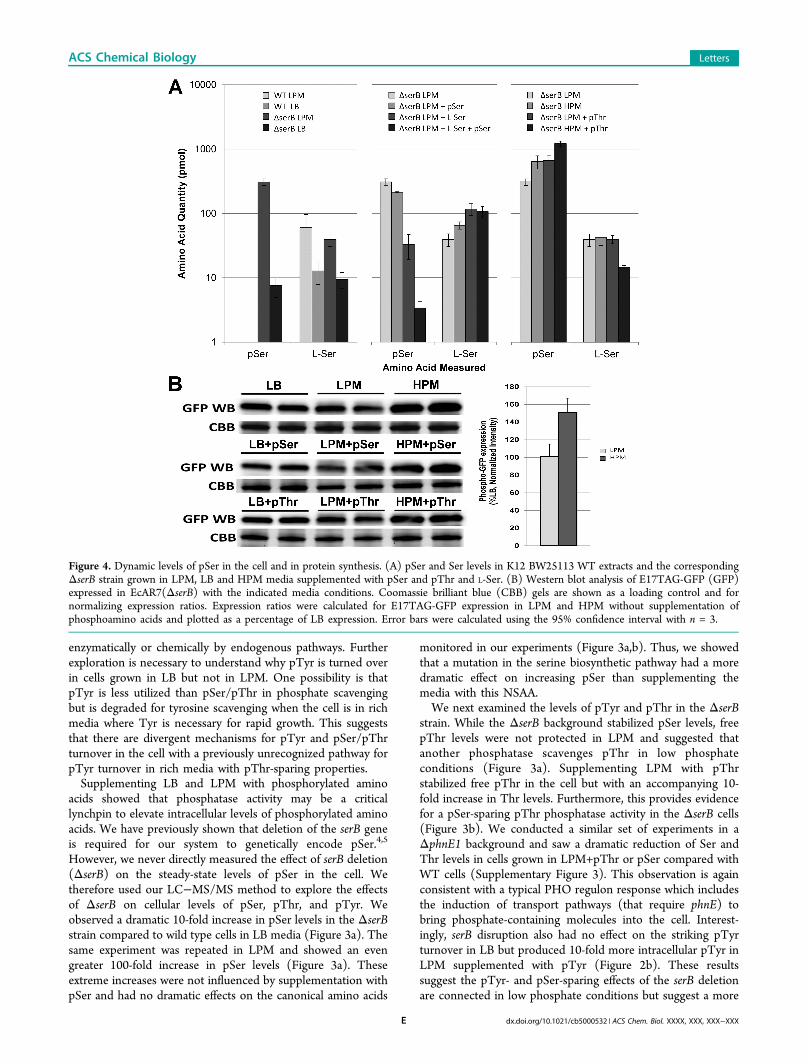
Figure 4. Dynamic levels of pSer in the cell and in protein synthesis. (A) pSer and Ser levels in K12 BW25113 WT extracts and the correspondingΔserB strain grown in LPM, LB and HPM media supplemented with pSer and pThr and L-Ser. (B) Western blot analysis of E17TAG-GFP (GFP)expressed in EcAR7(ΔserB) with the indicated media conditions. Coomassie brilliant blue (CBB) gels are shown as a loading control and fornormalizing expression ratios. Expression ratios were calculated for E17TAG-GFP expression in LPM and HPM without supplementation ofphosphoamino acids and plotted as a percentage of LB expression. Error bars were calculated using the 95% confidence interval with n = 3.
ACS Chemical Biology Letters
dx.doi.org/10.1021/cb5000532 | ACS Chem. Biol. XXXX, XXX, XXX−XXXE

complicated relationship between the three phosphorylatedamino acids in LPM vs LB. Taken together, our data showedthat genetic lesions in amino acid metabolism combined withsupplementation can be used to elevate the levels of threedifferent phosphorylated amino acids in E. coli.Removing serB had the greatest pSer-sparing effect in the
cell; however, a shift to LPM clearly elevated additional nativepSer/pThr phosphatase pathways and suggested it might bepossible to further elevate pSer levels by deleting nonessentialphosphatase enzymes. We observed an increase in Ser levels inLPM media in both WT and serB-deficient backgrounds, whichsuggested that LPM was stimulating serine biosynthesis (Figure4a). Since free Ser is a direct inhibitor of serA, which isupstream of serC-dependent pSer formation, we added Ser toLPM and examined the effect on steady-state pSer levels in thecell. LPM+Ser reduced the pSer levels, while pSer supple-mentation had little effect (Figure 4a). Interestingly, LPM+Ser+pSer drove pSer levels down even further. The mechanismbehind the additive effect of pSer and Ser on the serinebiosynthesis pathway is unknown, but the serB deficientbackground suggests cooperativity between serA and serC inthis scenario and points to a possible negative feedbackcontribution of pSer in this pathway.Since the LPM conditions stimulate phosphate scavenging
pathways via the PHO regulon, we added phosphate to create ahigh phosphate minimal media (HPM). The HPM conditionsincreased the free levels of pSer compared to LPM and weremore stabilizing than adding pSer to LPM (Figure 4a andSupplementary Figure 4). Since our previous experimentssuggested that pSer/pThr phosphatase pathways were stillactive in the ΔserB cells, we added pThr to both LPM andHPM. pThr in LPM had a similar pSer-sparing effect as HPM,while HPM+pThr had a striking additive effect and pushedpSer levels to the highest measured for any amino acid in theentire study. Although pThr contribution is unclear, theaddition of pThr appears to drive down L-Ser levels by anunknown mechanism and thus, indirectly, to accelerate the
serine biosynthesis pathway (Figure 4a). Finally, we tested theeffect of elevated free pSer on protein synthesis. We used anestablished system in which pSer is incorporated into position17 of GFP (GFP-E17TAG) and GFP synthesis is dependent onrobust insertion of pSer via our pSer OTS.4,5 Western blots ofpSer-dependent GFP-E17TAG synthesis showed a 50%increase in GFP synthesis in HPM conditions, regardless ofpSer or pThr supplementation (Figure 4b). This providesdirect evidence that the conditions identified in this studyelevate the levels of endogenous phosphorylated amino acids toranges that improve pSer incorporation into recombinantproteins.Nature has evolved complex networks of posttranslational
modification to ensure accurate and stoichiometric phosphor-ylation of proteins in vivo. The majority of these networks arenot characterized in sufficient detail to provide the informationneeded to accurately synthesize phosphoproteins for bio-chemical analysis. Furthermore, reconstituting these complexpathways might not be possible for the production ofrecombinant phosphoproteins in E. coli. To solve this problemwe added phosphoserine to the genetic code of E. coli to enablethe de novo synthesis of important phosphoserine-containingproteins.4,5 This system required adequate intracellularphosphoserine concentrations to support protein synthesis,yet the concentrations of free phosphorylated amino acids in E.coli was not known. Of primary importance, we address thatpSer, pThr, and pTyr levels can be measured and altered bymanipulating metabolic pathways genetically and throughmedia conditions. Our results suggest insufficient pSerconcentrations in E. coli was a limiting factor in recombinantphosphoprotein synthesis and increasing intracellular pSerconcentration appears to increase the yield of recombinantphosphoproteins. Furthermore, by understanding the under-lying principles for phosphoserine levels in the cell, we maygain important insight into controlling other phosphorylatedamino acids in E. coli for future development of orthogonalpThr and pTyr incorporation systems. It is important to note
Figure 5. A model for steady-state pSer, pThr, and pTyr levels in WT vs ΔserB E. coli strains. A WT cell (left) contains low levels ofphosphothreonine (pT), and the serine biosynthetic pathway (SerA, SerC, SerB) catabolizes phosphoserine (pS). Low phosphate conditions(middle) induces the PHO regulon and phosphate uptake machinery. In the absence of SerB, pS accumulates and extracellular pS, phosphothreonine(pT); phosphotyrosine (pY) can elevate intracellular pT/pY levels. In this study, we show that pY is imported by additional unknown transportpathways and various media conditions can support intracellular pS/pT/pY levels on par with standard amino acids (20 aa, represented by circlesize). High phosphate minimal media (right) suppresses PHO regulon phosphatase activities and, in the absence of SerB, can result in pS levels 10-fold higher than the standard 20 aa. Abbreviations: D-glyceraldehyde 3-phosphate (pG); 3-phosphohydroxypyruvate (pHP); serine (S); threonine(T); inorganic phosphate (Pi); Organophosphate transporter (phnD,phnE1,phnC).
ACS Chemical Biology Letters
dx.doi.org/10.1021/cb5000532 | ACS Chem. Biol. XXXX, XXX, XXX−XXXF

that although increasing pSer might aid in pSer incorporationefficiency, each modification in the media and genome can haveopposite effects on the health of cells. This might explain whyHPM+pThr did not result in the highest yield of proteinalthough it had the greatest proportion of pSer (Figure 4b).Thus, there is a balance between both ensuring pSer levelssufficient for protein synthesis while optimizing cell fitness inorder to yield the greatest amount of phosphoprotein.We developed an assay to quantitate phosphorylated amino
acids with LC−MS/MS and subsequently discovered con-ditions by which pSer, pThr, and pTyr could be added to thenatural pool of amino acids in E. coli (Figure 5). We found thatpThr is naturally present in E. coli and that pSer and pTyr canbe imported into the cell via known pathways (Figure 5). Wealso confirmed that deletion of the phosphoserine phosphataseserB increased intracellular pSer concentration as predicted.4
Surprisingly, serB deletion further stabilized the levels of pTyrin the cell while having only a modest effect on pThr. LPMinduces the PHO regulon,20 which stimulates the uptake ofpSer, pTyr, and pThr (Figure 2, Figure 3, and SupplementaryFigure 4). Cells harboring a serB deletion and culturedseparately in pSer-, pTyr-, and pThr-supplemented LPMbring the phosphorylated amino acids within a suitable rangefor protein synthesis. This was demonstrated by testing HPMthat enhanced pSer levels in the cell and enhancedphosphoprotein synthesis (Figure 4). While a serB deletionstrain cultured in LB supplemented with 5 mM pTyr elevatedall three phosphorylated amino acids in the same cell, we foundoptimal conditions that enhanced each phosphoamino acidseparately (summarized in Figure 5 and Supplementary Table5).We investigated the natural pool of amino acids to find
preexisting pSer, pThr, pTyr or ways to naturally stabilize theseamino acids by modulating known metabolic pathways. Wefocused on these three amino acids because of their pivotal rolein signal transduction, regulation of biological systems, and theneed to decipher their function. Incorporation of pSer into thegenetic code was enabled by the discovery of a natural systemfor charging pSer onto tRNA.21 Subsequent engineering effortsthen provided a system for incorporation of pSer at amber(UAG) codons.4 Furthermore, we and others have shown thatthe amber stop codon can be reassigned from a stop to a sensecodon by eliminating release factor 1 from E. coli.5,22−26 Wetherefore had all of the requirements for a UAG codondedicated for pSer, except for a clear understanding of the levelsof pSer in the cell. We reasoned that serB would degrade freepSer and thus be refractory to pSer incorporation intopolypeptides. Indeed, this idea was upheld, and in this studywe showed that serB was the key factor in elevating pSer levelsfor protein synthesis. Since most of the components have beenworked out for pSer, future studies will focus on engineeringorthogonal translation systems for pThr and pTyr. Importantly,while more work needs to be done to add combinations ofNSAA into proteins, we have demonstrated, in principle, thatall three phosphorylated NSAA can be present in the same celland could theoretically be added to the same polypeptide (seeSupplementary Table 5).E. coli encodes a complex protein network to ensure
phosphate (Pi) is provided to the intracellular environmentand made available for vital processes.20 Phosphorylated aminoacids and a myriad of other organophosphates can enter the cellduring low Pi conditions via the well characterized PHOregulon. The preferred phosphate source is Pi, which enters the
cell via either low or high affinity phosphate transporters.Alternatively, organophosphates or phosphonates can beutilized by the cell, and many of the components of theiruptake have been described.20 We hypothesized that lowphosphate concentrations in the media could increase theuptake of phosphorylated amino acids and could divert orinhibit their subsequent breakdown into Pi to further stabilizethe levels of the phosphorylated amino acid (Figure 5). Thisgeneral hypothesis was confirmed for pSer (Figure 3). Weconfirmed that known organophosphate uptake pathwaysplayed a role by using phnE1 deletion strains (SupplementaryFigure 3). This protein comprises the main conduit fororganophosphate transport into the cytoplasm18−20 (Figure 5).However, the pathways for pThr and pTyr, once inside the cell,are not well understood. While we were able to elevateintracellular concentrations of pTyr and pThr, there was clearevidence of increased phosphatase activity directed at these twoamino acids. Interestingly, this background phosphatase activitywas evident even under pSer-sparing conditions (Figure 3b).Oddly, there was clearly an enhanced pTyr turnover in richmedia where the actions of the PHO regulon could not easilybe explained (Figure 3b). This evidence suggests that otherphosphatases might be targeted in future studies which mayfurther stabilize pTyr and pThr levels for expanding the geneticcode.Genetic code expansion and engineering has been explored
for its potential to introduce NSAA into proteins for industrialand medical applications. These efforts have mostly focused onthe orthogonal pairs of aminoacyl-tRNA synthetases (aaRS)and tRNAs, and less effort has been devoted to establishingintracellular amino acid pools necessary for stoichiometricincorporation of NSAA into proteins. Indeed, if the NSAA isnot freely available at concentrations needed for translation,engineering and laboratory evolution experiments could fail toproduce orthogonal translations systems that would becomparable to their natural counterparts.27,28 The uptake ofNSAA into the cell has been appreciated and studied far longerthan engineering of orthogonal aaRS and tRNA pairs.8 Thedescribed LC−MS/MS method has broad applicability forquantitative measurement of NSAA levels in the intracellularpool and will be a useful tool to optimize intracellular NSAAconcentrations that support efficient NSAA protein production.Here we leveraged this approach to improve our system forgenetically encoded pSer and opened up a new pathway toadding pThr and pTyr to the genetic code.
■ METHODSAmino Acid Standards. Standards of free amino acids were
prepared by weight in HPLC grade water as follows: 10 mM O-phospho-L-tyrosine (Sigma P9405), 10 mM O-phospho-L-threonine(Sigma P1053), 10 mM O-phospho-L-serine (Sigma P0878), 10 mM L-lysine (Sigma L5626), 10 mM L-arginine (Sigma A-5131), 10 mM L-histidine (Sigma H8000), and 10 mM L-phenylalanine (Sigma P-2126)all prepared at 10 mM, 20 mM threonine (Sigma-Aldrich 89179), 20mM serine (Sigma-Aldrich S4500), and 2 mM tyrosine (Sigma-Aldrich93829). A combination of these amino acid stocks was prepared at 1mM. All standards were filtered (0.22 μm, Millipore) and stored at−80 °C.
Strains and Culture Conditions. The E. coli strains MG1655,BW25113, ΔserB(Keio Collection JW4351), ΔphnE1(Keio CollectionJW4064), and EcAR75 were used in this study. Twenty-millilitercultures were grown for 18 h at 37 °C in the appropriate media, andOD600 values were recorded for normalization. LB media contained 5g/L NaCl (American Bioanalytical NaCl AB01915), 5 g/L yeast
ACS Chemical Biology Letters
dx.doi.org/10.1021/cb5000532 | ACS Chem. Biol. XXXX, XXX, XXX−XXXG

extract (BD Bacto Yeast Extract REF212750), and 10 g/L of tryptone(BD Bacto tryptone REF211705). Low Phosphate Minimal Media(LPM) media was made with 200 mL of 5x LPM salts (2.5 g NaCl [43mM], 5 g NH4Cl [94 mM], 0.07 g KH2PO4 [0.5 mM], 0.015g CaCl2[0.14 mM], and 60 g 2-amino-2-(hydroxymethyl)-1,3-propanediol(Tris) [500 mM] adjusted to pH 7.0 with conc HCl (J.T. Baker), 1mL of 1 M MgSO4, 4 mL of 50% D-glucose, 88 mL of 2 mM L-tyrosine(Sigma-Aldrich 93829), 38 mL of 30 mM L-aspartic acid (Sigma-Aldrich A9256), 17 mL of 30 mM L-glutamic acid (Sigma-AldrichG1251) and 10 mL of 20% pure amino acid mix [50 mL water, 0.44 gL-alanine (Sigma-Aldrich A7627), 0.21 g L-arginine (Sigma-AldrichA5131), 0.06 g L-cysteine (Sigma-Aldrich C7880), 0.11 g L-glycine(American Bioanalytical AB00730), 0.11 g L-histidine (Sigma-AldrichH8000), 0.27 g L-isoleucine (Sigma-Aldrich I2752), 0.46 g L-leucine(Sigma-Aldrich L8000), 0.57 g L-lysine (Sigma-Aldrich L5626), 0.12 gL-methionine (Sigma-Aldrich M9625), 0.19 g L-phenylalanine (Sigma-Aldrich P2126), 0.57 g L-proline (Sigma-Aldrich P-0380), 0.21 g L-serine (Sigma-Aldrich S4500), 0.05 g L-threonine (Sigma-Aldrich89179), 0.34 g L-valine (Sigma-Aldrich V0500)] was added. Finally,the volume was adjusted with DI water to 1000 mL. Amino acidconcentrations were based on standard casein preparation. Additionalamino acids were added at the concentrations indicated. HighPhosphate Minimal Media (HPM) was formulated as the LPMmedia with 5x M9 salt (56.4 g/L BD Difco M9 salts REF 248510), 28μL/L of 1 M CaCl2, 1 mL/L of 1 M MgSO4, 4 mL/L of 50% D-glucose, 88 mL of 2 mM L-tyrosine, 38 mL of 30 mM L-aspartic acid,17 mL of 30 mM L-glutamic acid, and 10 mL/L of 20% pure aminoacid mix.Protein Expression. The E. coli strain EcAR7 was transformed
with a plasmid bearing a GFP variant with an amber STOP codon atposition 17 (E17TAG-GFP) and an all-in-one OTS plasmid to enablecotranslational insertion of phosphoserine.4,5 The all-in-one OTSplasmid was created with pSepT and pKD-SepRS-EFSep plasmids.4
The 250 bp tRNASep cassette was PCR amplified from the pSepTplasmid using primers tRNASep −F (5′-ACC GCG GCC GCA AAAAAA ATC cttagctttcg-3′) and tRNASep −R (5′-AAA GCG GCC GCGCTT CTT TG agcgaac-3′). The PCR primers added NotI restrictionsites to each end of the PCR product. The pKD-SepRS-EFSep plasmidwas linearly digested with NotI, and two copies of the tRNASep cassettewere ligated sequentially. Phosphoserine insertion at position 17 inGFP was confirmed with mass spectrometry as previously described.5
The transformed EcAR7 precultures were grown at 30 °C overnight inLB media (pH 7.5), with 0.08% glucose and 25 μg/mL of both zeocinand kanamycin, to retain the E17TAG-GFP and all-in-one OTSplasmid; respectively. The preculture was pelleted (1000g for 7 min)and resuspended in LPM (with antibiotics) in a 20:1 ratio. Theresuspended cells were inoculated into each of the following mediaconditions containing the appropriate antibiotics in duplicate: LB,LPM, HPM, LB+5 mM pSer, LPM+5 mM pSer, HPM+5 mM pSer,LB+5 mM pThr, LPM+pThr, and HPM+pThr. The cultures weregrown at 30 °C, 230 rpm for 24 h. The cultures were further diluted1:2 in the corresponding growth media with antibiotics and theaddition of 1 mM IPTG, and 100 ng/mL anhydrotetracycline toinduce the SepRS, EFSep, and E17TAG-GFP. Protein was overex-pressed at 30 °C, 230 rpm for 6 h. After expression, OD600 values wereobtained for each culture and the amount of cells harvested wasnormalized on the basis of optical density. The normalized cell pelletsfrom each condition were resuspended in lysis buffer (50 mM Tris/HCl pH 7.5, 150 mM NaCl, 5% glycerol, 0.5x BugBuster, 1 mM DTT,protease inhibitors (Roche), 25 U/mL benzonase, 50 mM NaF, 1 mMNa3VO4) and incubated at RT for 15 min. The total lysates werediluted with 2x Laemmli sample buffer, boiled at 95 °C for 5 min, andcentrifuged to remove insoluble debris. The samples were analyzedwith both SDS−PAGE electrophoresis followed by staining withCoomassie brilliant blue (CBB) and parallel Western blot analysis.Western blot analysis was performed with mouse monoclonal anti-GFP (Invitrogen no. 332600) and imaged with an HRP secondaryantibody via chemiluminescence on a ChemiDoc system (BioRad).Quantitation was performed with BioRad software, and GFP signalswere normalized to reference Coomassie-stained proteins. Data from
biological triplicates were exported to Microsoft Excel for generationof the graphs. Error bars were constructed using the 95% confidenceinterval.
Amino Acid Extraction. E. coli were grown overnight in 20-mLcultures, and cells were harvested by centrifugation for 10 min at4,000g at 4 °C. The cell pellets were transferred into a 1.5-mL PCRtube and washed three times with 1 mL of ice cold 1x LPM saltsolution. The cell pellets were then lysed in 1 mL of 1 M HCl17,29 andcentrifuged for 20 min at 19,000g at RT. The resulting clear aminoacid extract was transferred into a new 1.5-mL Eppendorf tube anddried in a rotary vacuum centrifuge operated at 2500g for 3 h at 55 °Cand an additional 90 min at 30 °C. The dried pellets were frozen at−80 °C until use. The dry pellet was reconstituted in 300 μL of water,and lipids were removed by serial liquid−liquid extraction with 500and 300 μL of chloroform, respectively. Extractions were performed byvortex (30 s), and phase separation was facilitated by centrifugation for30s at 13000g. The upper aqueous layer containing the amino acidswas collected. The two chloroform phases were extracted once morewith 300 μL of water. The combined amino acid extracts were clarifiedthrough a 0.22 μm pore size Durapure PDVF centrifugal filter (2 minat 12,000g at 4 °C), and the filter was washed 1x with 100 μL of water.The combined aqueous phases were dried in a rotary vacuumcentrifuge with the following program: 80 min at 2,500g and 65 °Cand then 80 min at 55 °C. The dried pellet was stored at −80 °C untiluse.
LC−MS. Frozen pellets were thawed on ice, dissolved by vortex in50 μL of HPLC grade water, and then centrifuged for 3 min at 17,500gat RT. The clarified solution was diluted for LC−MS/MS according tothe OD600 of the cell culture. As an example 8.4 μL extract of a OD1.00 culture was mixed with 21.6 μL eluent A (see below). Deactivatedglass inserts (Agilent no. 5182-0720) were found critical for theperformance of the method as polypropylene vials resulted insignificant analyte loss (data not shown). Calibration curves wereobtained by dilution of the 1 mM amino acid master mix in eluent A.LC−MS/MS was performed on an Agilent 6490 triple quadrupoleinstrument equipped with a JetStream ion source operated at 350 °Cand 2500 V spray voltage. Transitions for quantitation of amino acidswere obtained by direct infusion of amino acid standards prepared at2−30 pmol/μL in HPLC eluent B (see below). The flow rate was 200μL/min, and collision energies for up to 6 transitions were obtainedusing the optimizer software package provided with the instrument.Reversed phase HPLC was performed on a Agilent 1260 systemequipped with a temperature-controlled autosampler operated at 4 °C.The column was an Acuity UPLC BEH C18 2.1 × 50 mm (Waters,Millford MA) that was packed with 1.7 μm C18 particles.Chromatography was performed at RT with a flow rate of 0.2 mL/min unless noted otherwise. The injection volume was 3 μL for allexperiments. Eluent A consisted of 0.5% acetonitrile (ACN)containing 0.1% formic acid and 0.1% perfluorooctanoic acid(PFOA), and eluent B was 90% ACN with 0.1% formic acid and0.1% PFOA. Gradient conditions were optimized by injecting anamino acids standard mix prepared at 30 pmol/μL into eluent A. Thisresulted in the following optimized linear gradient: 0−2 min, 0% B; 3min, 30% B; 15 min, 62% B; 15.5 min, 100% B (0.3 mL/min); 21.5min, 100% B (0.35 mL/min); 22.5 min, 0% B; and 30 min, 0% B. Thefinal dynamic MRM method had a cycle time of 800 ms. Details of thismethod can be found in the supplemental material (SupplementaryTable 4). Standards for obtaining the calibration curve were analyzedin triplicate. Samples were analyzed in a randomized fashion, andblanks and quality control standards were run after sets of no morethan 10 samples. Between 3 and 5 biological replicates were analyzedfor each experimental condition tested.
Data Processing and Statistical Analysis. Quantitation ofMRM data was performed with Agilent MassHunter Software v. 5.00considering 1 quantifier and up to 3 qualifier ions for each analyte.Peaks below the limit of quantitation (signal-to-noise ratios <9:1) wereexcluded from the analysis. The ratio between quantifier and qualifiertransitions had to be within 20% of the ratio obtained from the analysisof a corresponding pure amino acid standard. Automated peakintegration was manually checked and if necessary adjusted to ensure
ACS Chemical Biology Letters
dx.doi.org/10.1021/cb5000532 | ACS Chem. Biol. XXXX, XXX, XXX−XXXH

consistent peak integration. Finally, data were exported to MicrosoftExcel for generation of the graphs. Error bars were constructed usingthe 95% confidence interval.
■ ASSOCIATED CONTENT*S Supporting InformationAdditional figures and tables as described in the text. Thismaterial is available free of charge via the Internet at http://pubs.acs.org.
■ AUTHOR INFORMATIONCorresponding Author*E-mail: [email protected] Contributions∥These authors contributed equally to this work.NotesThe authors declare no competing financial interest.
■ ACKNOWLEDGMENTSWe thank D. Soll for helpful discussion and support for J.Steinfeld and Y. Liu during preliminary phases of this study(Grants to D.S.: NIH GM22854, Defense Advanced ResearchProjects Agency contract N66001-12-C-4020, and NSF MCB-0950474). We thank N. Pirman, L. Cheng, and J. Ling forcritical review of the manuscript and J. Lynch, D. Postl, S.Kulkarni, and G. Alexis for helpful discussion and support ofthe LC−MS platform. Funding to J.R. by NIH NIDDK-K01DK089006 and DARPA contract N66001-12-C-4211.
■ REFERENCES(1) Liu, C. C., and Schultz, P. G. (2010) Adding new chemistries tothe genetic code. Annu. Rev. Biochem. 79, 413−444.(2) Chin, J. W. (2011) Reprogramming the genetic code. EMBO J.30, 2312−2324.(3) Wang, K., Neumann, H., Peak-Chew, S. Y., and Chin, J. W.(2007) Evolved orthogonal ribosomes enhance the efficiency ofsynthetic genetic code expansion. Nat. Biotechnol. 25, 770−777.(4) Park, H. S., Hohn, M. J., Umehara, T., Guo, L. T., Osborne, E.M., Benner, J., Noren, C. J., Rinehart, J., and Soll, D. (2011) Expandingthe genetic code of Escherichia coli with phosphoserine. Science 333,1151−1154.(5) Heinemann, I. U., Rovner, A. J., Aerni, H. R., Rogulina, S., Cheng,L., Olds, W., Fischer, J. T., Soll, D., Isaacs, F. J., and Rinehart, J. (2012)Enhanced phosphoserine insertion during Escherichia coli proteinsynthesis via partial UAG codon reassignment and release factor 1deletion. FEBS Lett. 586, 3716−3722.(6) Manning, G., Whyte, D. B., Martinez, R., Hunter, T., andSudarsanam, S. (2002) The protein kinase complement of the humangenome. Science 298, 1912−1934.(7) Grimsrud, P. A., Swaney, D. L., Wenger, C. D., Beauchene, N. A.,and Coon, J. J. (2010) Phosphoproteomics for the masses. ACS Chem.Biol. 5, 105−119.(8) Budisa, N. (2004) Prolegomena to future experimental efforts ongenetic code engineering by expanding its amino acid repertoire.Angew. Chem., Int. Ed. 43, 6426−6463.(9) Bennett, B. D., Kimball, E. H., Gao, M., Osterhout, R., Van Dien,S. J., and Rabinowitz, J. D. (2009) Absolute metabolite concentrationsand implied enzyme active site occupancy in Escherichia coli. Nat.Chem. Biol. 5, 593−599.(10) Yuan, J., Fowler, W. U., Kimball, E., Lu, W., and Rabinowitz, J.D. (2006) Kinetic flux profiling of nitrogen assimilation in Escherichiacoli. Nat. Chem. Biol. 2, 529−530.(11) Kung, C., Hixon, J., Choe, S., Marks, K., Gross, S., Murphy, E.,DeLaBarre, B., Cianchetta, G., Sethumadhavan, S., Wang, X., Yan, S.,Gao, Y., Fang, C., Wei, W., Jiang, F., Wang, S., Qian, K., Saunders, J.,Driggers, E., Woo, H. K., Kunii, K., Murray, S., Yang, H., Yen, K., Liu,
W., Cantley, L. C., Vander Heiden, M. G., Su, S. M., Jin, S., Salituro, F.G., and Dang, L. (2012) Small molecule activation of PKM2 in cancercells induces serine auxotrophy. ACS Chem. Biol. 19, 1187−1198.(12) Lau, K. H., Farley, J. R., and Baylink, D. J. (1989)Phosphotyrosyl protein phosphatases. Biochem. J. 257, 23−36.(13) Pizer, L. I. (1963) Pathway and control of serine biosynthesis inEscherichia coli. J. Biol. Chem. 238, 3934−&.(14) Armstrong, M., Jonscher, K., and Reisdorph, N. A. (2007)Analysis of 25 underivatized amino acids in human plasma using ion-pairing reversed-phase liquid chromatography/time-of-flight massspectrometry. Rapid Commun. Mass Spectrom. 21, 2717−2726.(15) Piraud, M., Vianey-Saban, C., Petritis, K., Elfakir, C., Steghens, J.P., and Bouchu, D. (2005) Ion-pairing reversed-phase liquidchromatography/electrospray ionization mass spectrometric analysisof 76 underivatized amino acids of biological interest: a new tool forthe diagnosis of inherited disorders of amino acid metabolism. RapidCommun. Mass Spectrom. 19, 1587−1602.(16) Qu, J., Wang, Y., Luo, G., Wu, Z., and Yang, C. (2002) Validatedquantitation of underivatized amino acids in human blood samples byvolatile ion-pair reversed-phase liquid chromatography coupled toisotope dilution tandem mass spectrometry. Anal. Chem. 74, 2034−2040.(17) Niedbalski, J. S., and Ringer, D. P. (1986) Separation andquantitative analysis of O-linked phosphoamino acids by isocratichigh-performance liquid chromatography of the 9-fluorenylmethylchloroformate derivatives. Anal. Biochem. 158, 138−145.(18) Wanner, B. L., and Metcalf, W. W. (1992) Molecular geneticstudies of a 10.9-kb operon in Escherichia coli for phosphonate uptakeand biodegradation. FEMS Microbiol. Lett. 79, 133−139.(19) Rao, N. N., Wang, E., Yashphe, J., and Torriani, A. (1986)Nucleotide pool in pho regulon mutants and alkaline phosphatasesynthesis in Escherichia coli. J. Bacteriol. 166, 205−211.(20) Wanner, B. L. (1993) Gene-regulation by phosphate in entericbacteria. J. Cell. Biochem. 51, 47−54.(21) Sauerwald, A., Zhu, W. H., Major, T. A., Roy, H., Palioura, S.,Jahn, D., Whitman, W. B., Yates, J. R., Ibba, M., and Soll, D. (2005)RNA-dependent cysteine biosynthesis in archaea. Science 307, 1969−1972.(22) Mukai, T., Hayashi, A., Iraha, F., Sato, A., Ohtake, K., Yokoyama,S., and Sakamoto, K. (2010) Codon reassignment in the Escherichiacoli genetic code. Nucleic Acids Res. 38, 8188−8195.(23) Johnson, D. B. F., Xu, J. F., Shen, Z. X., Takimoto, J. K., Schultz,M. D., Schmitz, R. J., Xiang, Z., Ecker, J. R., Briggs, S. P., and Wang, L.(2011) RF1 knockout allows ribosomal incorporation of unnaturalamino acids at multiple sites. Nat. Chem. Biol. 7, 779−786.(24) Johnson, D. B. F., Wang, C., Xu, J. F., Schultz, M. D., Schmitz,R. J., Ecker, J. R., and Wang, L. (2012) Release factor one isnonessential in Escherichia coli. ACS Chem. Biol. 7, 1337−1344.(25) Ohtake, K., Sato, A., Mukai, T., Hino, N., Yokoyama, S., andSakamoto, K. (2012) Efficient decoding of the UAG triplet as a full-fledged sense codon enhances the growth of a prfA-deficient strain ofEscherichia coli. J. Bacteriol. 194, 2606−2613.(26) Lajoie, M. J., Rovner, A. J., Goodman, D. B., Aerni, H. R.,Haimovich, A. D., Kuznetsov, G., Mercer, J. A., Wang, H. H., Carr, P.A., Mosberg, J. A., Rohland, N., Schultz, P. G., Jacobson, J. M.,Rinehart, J., Church, G. M., and Isaacs, F. J. (2013) Genomicallyrecoded organisms expand biological functions. Science 342, 357−360.(27) Guo, L. T., Helgadottir, S., Soll, D., and Ling, J. Q. (2012)Rational design and directed evolution of a bacterial-type glutaminyl-tRNA synthetase precursor. Nucleic Acids Res. 40, 7967−7974.(28) Umehara, T., Kim, J., Lee, S., Guo, L. T., Soll, D., and Park, H. S.(2012) N-Acetyl lysyl-tRNA synthetases evolved by a CcdB-basedselection possess N-acetyl lysine specificity in vitro and in vivo. FEBSLett. 586, 729−733.(29) de Witte, P. A., Cuveele, J. F., Merlevede, W. J., andVandenheede, J. R. (1995) Analysis of phosphorylhydroxyaminoacids present in hydrolyzed cell extracts using dabsyl derivatization.Anal. Biochem. 226, 1−9.
ACS Chemical Biology Letters
dx.doi.org/10.1021/cb5000532 | ACS Chem. Biol. XXXX, XXX, XXX−XXXI