expanding student opportunities
TRANSCRIPT

Expanding Student Opportunities
Prime 6 Program Review
Clark County School District
Las Vegas, Nevada
by
Veronica Terriquez
Jennifer Flashman
Sarah Schuler-Brown
Introduction by Gary Orfield
June 2009

!!"#$%&'()$*$&)+'),$$
UCLA Civil Right Project/Proyecto Derechos Civiles
Clark County School District Prime 6 Program Report
Page 2 of 33
TABLE OF CONTENTS
I. Introduction by Gary Orfield Page 3
II. Background Page 9
III. Key Findings Page 12
IV. District-wide School Population Change by Race/Ethnicity, 1987-2006 Page 15
V. Demographic Composition of Prime 6 Schools, Grades 1-5, 2001-2007 Page 17
VI. School Enrollment Patterns of Students from the Prime 6 Area Page 21
VII. Teacher Experience at Prime 6 Schools Page 26
VIII. Student Test Score Outcomes Page 27
IX. AYP & INOI Designation of Prime 6 Schools 2003-2008 Page 32
X. Suggestions for Further Research Page 33
APPENDIX*
*The appendix is provided in a separate document.
!!"#$%&'()$*$&)+'),$$
UCLA Civil Right Project/Proyecto Derechos Civiles
Clark County School District Prime 6 Program Report
Page 3 of 33
I. INTRODUCTION by Gary Orfield
The Clark County school district promised the leaders of the West Las Vegas
region of the “Prime Six schools,” which includes important areas of African American
settlement, that it would make a serious effort to provide equal education for students in
those schools. In spite of substantial investments over the years, the results have been
disappointing. Because of this, the District took the unusual step of asking for an
independent assessment of the area’s trends in population, educational choice and
educational success. District officials produced the data we requested for this task and
made no attempt to control this report. They should be commended for risking an outside
evaluation of a very sensitive subject. Too often districts wait until problems become
massive and the community becomes polarized before seriously recognizing a problem.
When this data was initially presented to the district’s senior staff by our research team,
with the participation of two national experts on these issues, Professor Robert Peterkin
of Harvard and Professor William Trent of the University of Illinois, we were all
impressed by the frank and wide-ranging discussion by the district’s top administrators
concerning the need to find ways to produce better results.
The following statistical report, prepared by three researchers working under my
supervision, shows the trends in enrollment, the patterns of choice by students of
different races and income, enrollment patterns of the various schools, and test scores of
students enrolled in different schools. It offers very useful information and shows
relationships that are troubling, but the authors have carefully resisted offering
recommendations that may go beyond the data made available to them.
My role in this introduction is to interpret the findings and raise the questions the
district leaders need to resolve. As someone who has observed many similar situations
over a multitude of years, and who is very familiar with the research on issues of
desegregation, choice, demographic change and educational inequality, my task is to
vouch for the credibility of the statistical research and to suggest what implications can
be drawn from not only this data but also from a large body of research on the impact of
school composition and the operation of choice plans with varying degrees of
effectiveness and fairness. My role is not to offer a solution but to raise questions that--
when answered by local leaders--can produce a better plan.
This research is accurate. It relies on data from the school district and federal
government. The analysis was carefully performed by a diverse group of young scholars
in sociology and education at UCLA. This was an interracial group of African American,
Latina, and white researchers who collaborated effectively in this work and it was
reviewed for factual accuracy by district experts. The lead researcher has just been
honored by being hired as an Assistant Professor at the University of Southern California,
something very rare in a year with very few new academic jobs. The team has provided
essential raw material for discussion by leaders of the Clark County. They have reported
facts that are disturbing and need to be confronted.

!!"#$%&'()$*$&)+'),$$
UCLA Civil Right Project/Proyecto Derechos Civiles
Clark County School District Prime 6 Program Report
Page 4 of 33
My observations are based on looking at their raw statistics and asking for further
computations, from some familiarity with the district, and from extensive work on closely
related issues in other cities and at the national level for many years. I have visited Clark
County on several occasions, we have computed statewide segregation measures for
Nevada many times, and we conducted a survey of Clark County teachers in the l990s. I
have had the privilege of speaking on issues of school reform to many teachers and
administrators at the districts “Expectations” conferences. I have not, however, done
independent on-the-ground research in the Prime Six area. For this reason, I am not
going to offer observations or conclusions about any particular school or program, only
on the statistical patterns and what I see as their implications and the questions the district
needs to answer to be sure that the students get a fair chance and the neighborhood has a
good future.
All of the schools in Prime Six have populations that are very poor with virtually
no students whose family income is above the free lunch level; there are almost no white
students attending these schools. Across the country, there are a handful of remarkable
schools that manage to produce high achievement in the face of all the problems of
intense, isolated and persistent poverty. But the vast majority of such schools perform
poorly because the children come to kindergarten far behind, many are lacking basic
essentials at home, health care is inadequate, the families often face involuntary moves or
even homelessness, and experienced teachers typically leave such schools, which are
often threatened by state and federal sanctions. None of the Prime Six schools are among
those rare “break-the-mold” schools that produce strong results in the face of such
entrenched problems. Most Prime Six schools have failed to meet the goals of NCLB.
Obviously, the Prime Six schools have been the subject of special interest by the
district for some years and are particularly important to the district’s African American
community. Yet, in spite of a variety of efforts, substantial expenditures, and two of the
schools making Adequate Yearly Progress under No Child Left Behind, the schools have
extremely disadvantaged and isolated student bodies. Their intense double segregation
by race and poverty is linked to achievement scores seriously behind the district’s
average performance both for total enrollment and for black and Latino students.
Although the Prime Six area is a historic center of African American settlement, it
is now an area with two large disadvantaged groups of students, one black and one
Latino. Often within African American communities, although surveys show the large
majority of parents typically prefer integrated schools, there is a debate about whether or
not it might be better to try black-controlled schools. There have been many efforts to do
that in various districts since the l960s, with very little lasting success, because of the
problems of isolated and persistent poverty. Now, in any case, it is also usually
impossible to follow this course in the Western states because historically black
neighborhoods are experiencing dramatic growth in the Latino population and large
shares of the black population are moving from inner cities into suburbs. As a result, the
number of schools with African American majorities has declined sharply. Statistics we
have produced show that across the entire Western United States, African American
students segregated from whites are in schools with twice as many Latinos as fellow
!!"#$%&'()$*$&)+'),$$
UCLA Civil Right Project/Proyecto Derechos Civiles
Clark County School District Prime 6 Program Report
Page 5 of 33
African Americans and this pattern is intensifying. The trends in Prime Six are definitely
moving in that direction. There are no overwhelmingly black schools now, there are now
as many Latinos as African Americans in the community, and the population trends in the
lower grades show continuing change. That means that a total return to neighborhood
schools, transferring back all students who left, would not produce African American
schools but schools divided between African Americans and Latinos, most of whom are
ELL’s. This return to neighborhood schools would result in a declining minority status
for African American students if the existing trends in births and housing change
continue. Only a very small minority of students now transfer out, and there is no
assurance that they would be willing, in any case, to enroll in Prime Six schools if
transfers were ended.
The transfer patterns are disturbing. The students who are not poor are
substantially more likely to transfer out. Transfer to higher achieving schools is an
important opportunity for students performing poorly in low performing schools. It
usually produces both academic gains and greater likelihood of graduating and going to
college, if the transfer is to a school with higher achievement and graduation levels.
Research shows that schools have more powerful impacts on low income and
disadvantaged children because there are fewer opportunities in their homes and
neighborhoods than middle class children experience. Yet the low-income students of
color are the least likely to transfer and are remaining in schools that do not attract
transfers from elsewhere. The “assigned schools” and the magnet schools are performing
at substantially higher levels, yet many better schools to where students have a right to
transfer are receiving zero transfers. The great majority of impoverished African
American and Latino students remain in their low achieving Prime Six school. Research
shows that such enrollment patterns tend to reflect the lack of information and
understanding of the choice systems by many parents living in poverty. When parents
receive good information about the relative academic standing of schools and they and
their children are welcomed in better schools, substantial numbers are likely to transfer.
The area now has two schools on track to become segregated Latino schools,
which could face triple segregation by ethnicity, 100 percent poverty, and growing
linguistic segregation. One third of the Prime Six students are already classified as ELLs.
Only an extremely small fraction of such schools across the country produce high level
academic achievement and there are none now in this region. If these trends continue,
such segregation will expand. The developing pattern requires action to forestall this
likely outcome.
Scores of studies over the past forty years has found over and over again that
childrens’ academic achievement, measured by both tests and by graduation rates, is
linked to problems connected with poverty, including instability of enrollment, untreated
health and emotional problems, low parental education, and many other sources of
inequality. School quality matters most for low income and minority children who have
fewer educational resources at home and in the community. Access to good schools and
teachers is very important. Under pure neighborhood school plans, blacks and Latinos
overwhelmingly end up in concentrated poverty schools with weak academic

!!"#$%&'()$*$&)+'),$$
UCLA Civil Right Project/Proyecto Derechos Civiles
Clark County School District Prime 6 Program Report
Page 6 of 33
performance and whites end up in middle class schools with more experienced teachers
and higher levels of competition. Minority students who transfer out from the Prime Six
schools do better than those who remain, though their scores are still relatively low.
There is powerful evidence that children’s academic success is affected by their
relationships with other children in the school. If the school has many academically
prepared students performing well, planning on college, and positively oriented toward
school and academic achievement, disadvantaged children tend to perform better and
graduate at higher rates.
Research consistently shows that poor families have the least information about
and networks to schools in other areas and are least likely to exercise choice, unless there
is a strong parent information system and personal connections with the receiving
schools. The total absence of even a single transfer student in many of the assigned
schools, which have better performance than the Prime Six schools, means that these
conditions probably do not exist.
In research for a faculty seminar at Harvard (which produced the book, Who
Chooses? Who Loses?), and in many other studies around the world, it is clear that in a
choice plan without strong information and equity provisions, more educated and affluent
parents will have far more information about the alternatives and better understanding of
the system. Too often, choice plans without strong outreach and recruitment produce
choice mostly for the students who have the greatest home advantages. The existing
choice effects in the Prime Six area actually slightly increase race and poverty
segregation for the students there, rather than produce better opportunities for those most
in need.
Teacher quality plays an extremely important role in shaping school
opportunities, but the Prime Six schools have much less success in holding experienced
teachers. Teacher experience and quality of training are the most important resource a
school possesses.
In most of the Prime Six schools, the parents have a federal right to transfer their
children from schools failing to meet AYP. The district apparently does not, however,
have adequate information and recruitment efforts to help them make good choices and
very few of the eligible students transfer.
Issues to Consider
It is impossible to mandate attendance at neighborhood schools, given the NCLB
requirements, which means that students in schools not meeting Adequate Yearly
Progress must be given transfer opportunities. It is also very unlikely that the district
would be successful in reassigning students--who now have chosen to leave--back to
weaker neighborhood schools. Our research suggests that a significant number would
very likely leave the public schools or the neighborhood.
!!"#$%&'()$*$&)+'),$$
UCLA Civil Right Project/Proyecto Derechos Civiles
Clark County School District Prime 6 Program Report
Page 7 of 33
How can the choice system be improved? Parent information and recruitment are
critical, and so is a genuine welcome from the staff in assigned and magnet schools. An
improved choice plan should answer these questions: What would be the elements of a
plan with good recruitment and support for transfers by nonwhite students? What can be
done to create positive, welcoming conditions at the assigned schools? What should be
the requirements and incentives that would lead to more welcoming receiving schools? It
is not healthy in the long run that choices focus only on two schools. How can the
transfer patterns be broadened?
The magnet schools are obviously performing better and attracting better students
and retaining teachers. Can the magnets be expanded? Can any of the existing schools be
converted to one or more additional magnets and can outreach from magnets to local
black and Latino families be improved?
What kind of incentives, support, or improved conditions could be offered to hold
good teachers in the Prime Six schools? A survey of teachers in the area would doubtless
disclose what teachers see as primary obstacles and what they would see as strong
encouragement to stay and help develop stronger schools.
How can the special history of Las Vegas’ African American community be
respected and reflected in the operations of schools within the area and in schools to
which students may transfer?
There are many impressions about what parents want and would respond to in the
region, but little solid information exists. Should the district survey parents in the region
and in the receiving schools to learn more about their knowledge of the schools, their
priorities, their goals for their children, and what they think would create the most
positive choices for their children? Focus groups and a good survey could provide a much
stronger basis for future planning that takes into account the community perspective.
How can the issues of black-Latino relationships be most successfully worked out
in these schools? In school districts that have neglected these issues, they often have had
to deal with serious conflicts. Does the district have a strategy for training teachers in the
human relations and multicultural education dimensions of such schools? Is there an
opportunity to create a dual immersion school that would begin to treat the language issue
as a resource, instead of just an educational challenge, and would involve each group of
students helping the other to learn another language?
Should there be intense investment in research-based strategies on high quality
early childhood education and on the few other interventions for which relatively clear
evidence exists? Why have the existing efforts fallen short?
I believe that there are good answers to these questions and effective leaders in
the district who can provide them. The important thing will be to do this in a thoughtful
way, to realize that no plan will ever be supported by everyone in the short run, to
carefully consider parents’ views, and to make a decision and follow it through. The
!!"#$%&'()$*$&)+'),$$
UCLA Civil Right Project/Proyecto Derechos Civiles
Clark County School District Prime 6 Program Report
Page 8 of 33
district showed leadership in commissioning an independent study. I believe it has the
talent to create a plan that would expand opportunity and improve the education of
children in the Prime Six region.
!!"#$%&'()$*$&)+'),$$
UCLA Civil Right Project/Proyecto Derechos Civiles
Clark County School District Prime 6 Program Report
Page 9 of 33
II. BACKGROUND
The 1954 United States Supreme Court Brown v. Board of Education decision
established that separate schooling is inherently unequal. However, over 50 years later,
Latinos and African-American students experience comparable if not worse schooling
conditions. Schools remain highly unequal, where segregated African-American and
Latino students are more likely than their White and Asian counterparts to have less
prepared teachers and classmates, suffer from poor access to rigorous curriculum, attend
schools with inadequate facilities, and perform poorly on measures of academic
achievement. African-American and Latino students are not only segregated by race, but
also by poverty. School segregation by race and poverty contributes to the poor
academic performance and low educational attainment of African-American and Latino
students. In Reviving the Goal of an Integrated Society: A 21st Century Challenge,
Professor Gary Orfield of the UCLA Civil Rights Project explains that the negative
outcomes of school segregation are not the result of “any defect of nonwhite students and
parents, who have the same basic goals as whites, but on a system of segregation by race,
poverty, and, increasingly, language, where nonwhite students rarely receive similar
opportunities” (Orfield, 2009, p. 4).
Unfortunately, desegregation plans have been systematically shut down due to the
loss of federal aid for voluntary integration efforts and Supreme Court decisions that have
undermined the spirit of Brown. The dismally segregated state of public education can
be attributed to our dissolving commitment to civil rights policy and insufficient support
for housing and school reform efforts that facilitate educational and societal integration.
The Clark County School District and the Prime 6 Program
This report provides a review of the Prime 6 Program, a Clark County School
District initiative targeting students in West Las Vegas, a historically African-American
area of the County. Implemented in 1994, the initial proposal aimed to enhance learning
opportunities in culturally and racially diverse school settings. The Prime 6 Program
modified CCSD’s prior desegregation plan while increasing families’ school choice
options. The Prime 6 Program was implemented on the assumption that “elementary
neighborhood schools are a viable and realistic educational concept” and that “all
students should have the option to remain within their attendance neighborhoods” (Prime
6 Educational Proposal, 1992, p. A-3).
Today, six schools in West Las Vegas participate in the Prime 6 program. They are
Booker Elementary, Carson Elementary, Fitzgerald Elementary, Kelly Elementary,
McCall Elementary, and Wendell Williams Elementary. Pre-K and Kindergarten
students living near these six schools attend their local neighborhood school. Starting in
Grade 1, students are assigned to a school outside of West Las Vegas, but families have
several options regarding where they can send their children to school. Children in
grades 1-5 residing in a Prime 6 kindergarten attendance area may:
1. Enroll in their “Assigned” school outside of West Las Vegas;

!!"#$%&'()$*$&)+'),$$
UCLA Civil Right Project/Proyecto Derechos Civiles
Clark County School District Prime 6 Program Report
Page 10 of 33
2. Enroll in a school outside of their local community to which they were not
assigned (based on NCLB requirements, space availability, racial/ethnic make-up,
and access to transportation, and other considerations);
3. Enroll in a Prime 6 school that they attended in Pre K or kindergarten;
4. Enroll in another Prime 6 school;
5. Enroll in a Magnet school, if the student’s application is accepted; or
6. Enroll in a charter school.
The map below shows the West Las Vegas Prime 6 area. In addition to
containing the six Prime 6 schools, the area also contains three magnet schools open to
students district-wide who meet admissions requirements. The three magnets are Gilbert,
Hoggard, and Mackey Magnet Schools. Children who live in the neighborhoods
surrounding these magnet schools attend their local neighborhood school for
kindergarten. Children in grades 1-5 residing in the kindergarten area of one of the three
magnet schools share similar enrollment options as students assigned to one of the six
Prime 6 schools for kindergarten. However, students may not enroll in the neighborhood
school they were assigned to attend for kindergarten because it is a magnet school and
they must apply.
What this Report Accomplishes
This report draws on National Center for Education Statistics (NCES) data for
1987-2006 to provide an overview of the racial/ethnic composition of the CCSD over a
two-decade period. It also reviews demographic trends, teacher experience, and test score
outcomes for the Prime 6 Program. Findings for the six West Las Vegas Prime 6 schools
for the 2001/02, 2003/04, 2005/06, and 2007/08 school years are at times compared to

!!"#$%&'()$*$&)+'),$$
UCLA Civil Right Project/Proyecto Derechos Civiles
Clark County School District Prime 6 Program Report
Page 11 of 33
findings for 41 to 42 Prime 6 Assigned schools outside of West Las Vegas (hereinafter
often referred to as the Assigned schools); the three Magnet schools in West Las Vegas;
to all “other schools” within the District; or to District-wide trends. The appendix further
describes the types of schools compared in analyses.
This report provides a statistical overview of the Prime 6 program up to 2007. It
does not capture demographic trends since 2007 that may have been impacted by the
foreclosure crisis and the return of some Latino immigrants to Mexico. The District may
consider hearing directly from the West Las Vegas community to complement the
quantitative data analysis reported here.
!!"#$%&'()$*$&)+'),$$
UCLA Civil Right Project/Proyecto Derechos Civiles
Clark County School District Prime 6 Program Report
Page 12 of 33
III. KEY FINDINGS
Below are the key findings described in this report.
District-wide School Population Change by Race/Ethnicity, 1987/88- 2006/07
• The number of students enrolled in Clark County School District (CCSD) schools
went from 100,027 students in 19s87/88 to 303,448 students in 2006/07, an
increase of 303% in the number of students served.
• Between 1987/88 and 2006/07 White students made up a declining share of CCSD
enrollment, while Latino students made up an increasing share of enrollment.
• Between 1987/88 and 2006/07 African-American students comprised a fairly
constant share of 14%-15% of total CCSD enrollment.
Demographics of Prime 6 Schools, 2001/02, 2003/04, 2005/06 and 2007/08
• Prime 6 schools serve fewer than 2% of the CCSD’s 1st through 5
th graders.
• Prime 6 schools enroll disproportionately high percentages of African-American
students.
• Prime 6 schools enroll extremely low numbers of White students.
• The Latino composition of Prime 6 schools increased to slightly exceed the
District’s Latino composition.
• Prime 6 schools serve extremely high percentages of Free and Reduced Lunch
students.
• Approximately 1/3 of students in Prime 6 schools and the District are English
Language Learners.
Grade 1-5 Enrollment of Students Residing in the Prime 6 Kindergarten Attendance
Areas, 2001/02, 2003/04, 2005/06 and 2007/08
• In the 2007/08 school year less than one-tenth of 1-5 grade students residing in a
Prime 6 kindergarten attendance area enrolled in an Assigned school outside of
West Vas Vegas, a drop from 17% in the 2001/02 school year.
• Nearly one tenth of African-American students residing in a Prime 6 kindergarten
attendance area enroll in an Assigned school outside of West Las Vegas for grades
1-5.

!!"#$%&'()$*$&)+'),$$
UCLA Civil Right Project/Proyecto Derechos Civiles
Clark County School District Prime 6 Program Report
Page 13 of 33
• Students eligible for free and reduced meals were less likely than their more
affluent counterparts to enroll in Assigned schools outside of West Las Vegas in
2001, 2005, and 2007, but not in 2003.
• Most Assigned schools enrolled very few, if any students from a Prime 6
kindergarten attendance area. In fact, over 1/3 of Assigned schools did not enroll a
single student assigned to a Prime 6 school for kindergarten.
• Students who enroll Assigned schools are less segregated by race and poverty than
if they had all remained at their local Prime 6 school.
• Only 3%-8% of students residing in one of the six Prime 6 school kindergarten
attendance areas enrolled in a local magnet school in West Las Vegas.
Teacher Experience in West Las Vegas Schools, 2001/02, 2003/04, 2005/06 and 2006/07
• Teachers at Prime 6 schools average less years of experience than the District
average.
Student Outcomes, 2001/02, 2003/04, 2005/6 and 2007/08
• Students enrolled in Prime 6 schools perform well below the District average on
math and reading tests.
• Students at Fyfe Elementary and Gray Elementary, the Assigned schools with the
most students from West Las Vegas, average higher math and reading test scores
than do students at Prime 6 schools.
• African-American and Latino students enrolled in Prime 6 schools average lower
math and reading test scores than African-American and Latino students enrolled in
other District schools.
• Free and Reduced Lunch students enrolled in Prime 6 schools average lower math
and reading test scores than Free and Reduced Lunch students enrolled in other
District schools.
• Among West Las Vegas students, those enrolled in Assigned schools outside of
West Las Vegas average higher math and reading test scores than those enrolled in
Prime 6 schools.
!!"#$%&'()$*$&)+'),$$
UCLA Civil Right Project/Proyecto Derechos Civiles
Clark County School District Prime 6 Program Report
Page 14 of 33
Suggestions for further research
• More research may be necessary to determine whether West Las Vegas students
have enough information about Assigned and Magnet schools, whether available
transportation provides adequate access to Assigned schools, and whether they feel
welcome at all Assigned schools.
!!"#$%&'()$*$&)+'),$$
UCLA Civil Right Project/Proyecto Derechos Civiles
Clark County School District Prime 6 Program Report
Page 15 of 33
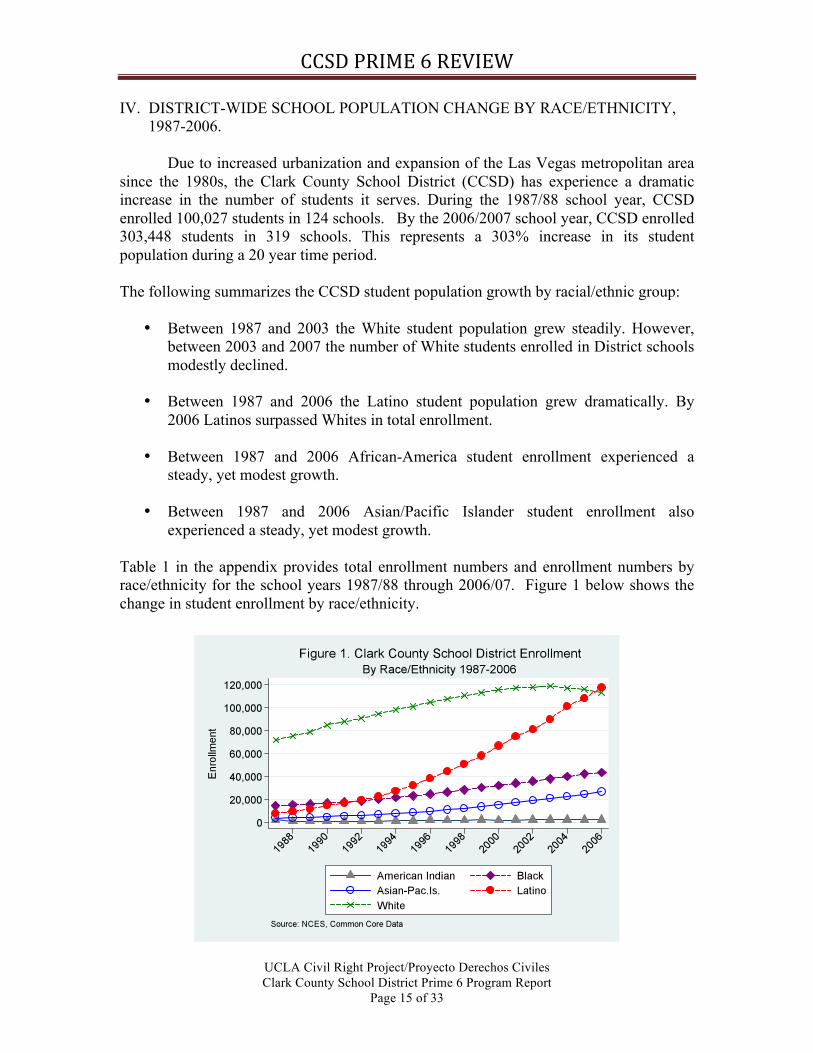
IV. DISTRICT-WIDE SCHOOL POPULATION CHANGE BY RACE/ETHNICITY,
1987-2006.
Due to increased urbanization and expansion of the Las Vegas metropolitan area
since the 1980s, the Clark County School District (CCSD) has experience a dramatic
increase in the number of students it serves. During the 1987/88 school year, CCSD
enrolled 100,027 students in 124 schools. By the 2006/2007 school year, CCSD enrolled
303,448 students in 319 schools. This represents a 303% increase in its student
population during a 20 year time period.
The following summarizes the CCSD student population growth by racial/ethnic group:
• Between 1987 and 2003 the White student population grew steadily. However,
between 2003 and 2007 the number of White students enrolled in District schools
modestly declined.
• Between 1987 and 2006 the Latino student population grew dramatically. By
2006 Latinos surpassed Whites in total enrollment.
• Between 1987 and 2006 African-America student enrollment experienced a
steady, yet modest growth.
• Between 1987 and 2006 Asian/Pacific Islander student enrollment also
experienced a steady, yet modest growth.
Table 1 in the appendix provides total enrollment numbers and enrollment numbers by
race/ethnicity for the school years 1987/88 through 2006/07. Figure 1 below shows the
change in student enrollment by race/ethnicity.
!!"#$%&'()$*$&)+'),$$
UCLA Civil Right Project/Proyecto Derechos Civiles
Clark County School District Prime 6 Program Report
Page 16 of 33
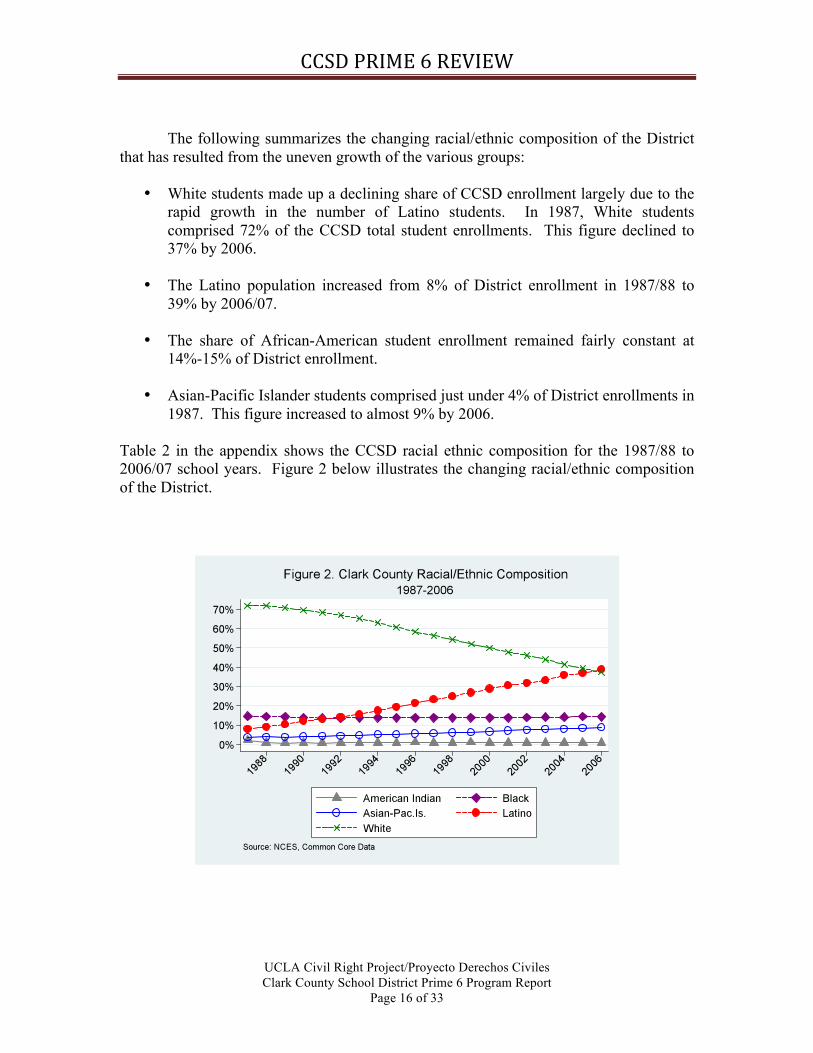
The following summarizes the changing racial/ethnic composition of the District
that has resulted from the uneven growth of the various groups:
• White students made up a declining share of CCSD enrollment largely due to the
rapid growth in the number of Latino students. In 1987, White students
comprised 72% of the CCSD total student enrollments. This figure declined to
37% by 2006.
• The Latino population increased from 8% of District enrollment in 1987/88 to
39% by 2006/07.
• The share of African-American student enrollment remained fairly constant at
14%-15% of District enrollment.
• Asian-Pacific Islander students comprised just under 4% of District enrollments in
1987. This figure increased to almost 9% by 2006.
Table 2 in the appendix shows the CCSD racial ethnic composition for the 1987/88 to
2006/07 school years. Figure 2 below illustrates the changing racial/ethnic composition
of the District.

!!"#$%&'()$*$&)+'),$$
UCLA Civil Right Project/Proyecto Derechos Civiles
Clark County School District Prime 6 Program Report
Page 17 of 33
V. DEMOGRAPHIC COMPOSITION OF PRIME 6 SCHOOLS, GRADES 1-5, 2001/02-
2007/08
This section documents the demographic composition of the six Prime 6 Schools,
focusing on students in grades 1-5 for the 2001/02, 2003/05, 2005/06, and 2007/08 school
years. Aggregated statistics exclude enrollment figures for the three magnet schools in
West Las Vegas. Prime 6 schools are compared to District-wide figures. The appendix
further compares the Prime 6 schools to other District schools and provides descriptive
statistics for each of the Prime 6 schools, Magnet schools in West Las Vegas, and the 41-
42 Assigned schools outside of West Las Vegas.
Prime 6 schools enroll under 2% of the CCSD’s 1st through 5
th graders.
In 2001, the six prime schools in West Las Vegas enrolled a combined total of
1,946 students in grades 1-5, 1.9% of the total CCSD grade 1-5 enrollment. This number
dropped to 1,818 students in 2007, 1.5% of the total CCSD grade 1-5 enrollment.
Percent of CCSD Students in Grades 1-5 Enrolled in
Prime 6 Schools, 2001-2007
Year % in Prime 6
Schools Total CCSD students
in grades 1-5
2001 1.9% 102,377
2003 1.7% 109,532
2005 1.7% 116,868
2007 1.5% 122,530
!!"#$%&'()$*$&)+'),$$
UCLA Civil Right Project/Proyecto Derechos Civiles
Clark County School District Prime 6 Program Report
Page 18 of 33
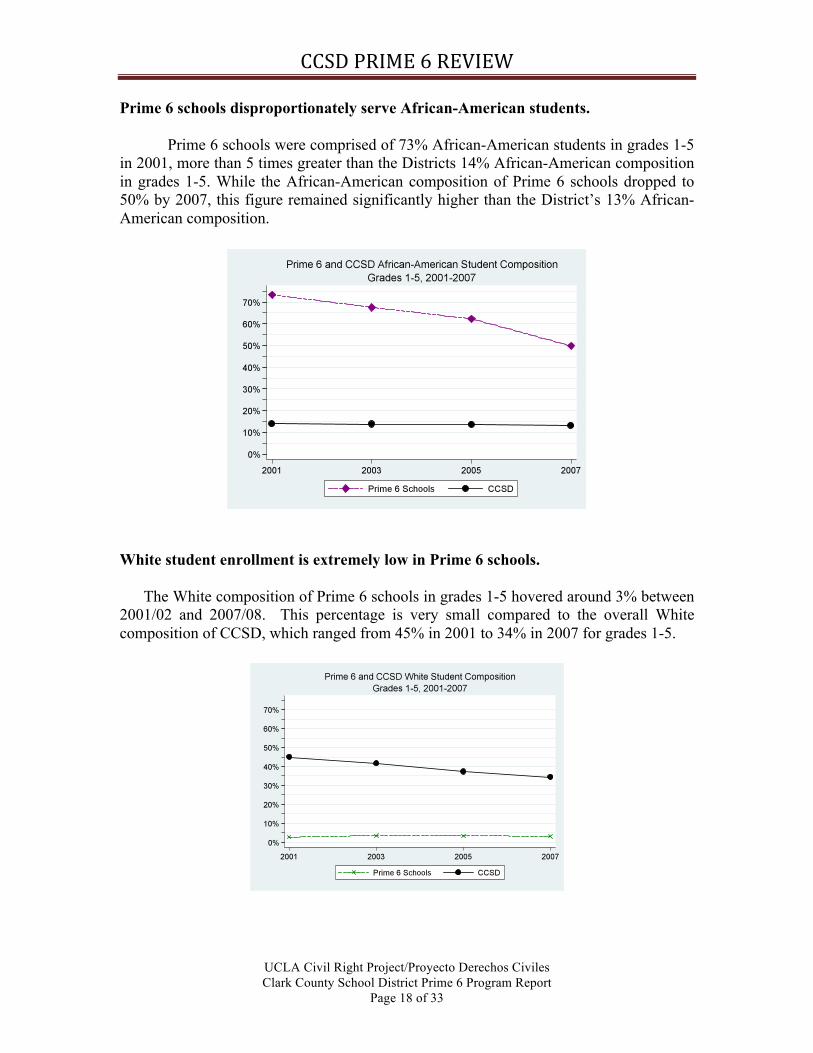
Prime 6 schools disproportionately serve African-American students.
Prime 6 schools were comprised of 73% African-American students in grades 1-5
in 2001, more than 5 times greater than the Districts 14% African-American composition
in grades 1-5. While the African-American composition of Prime 6 schools dropped to
50% by 2007, this figure remained significantly higher than the District’s 13% African-
American composition.
White student enrollment is extremely low in Prime 6 schools.
The White composition of Prime 6 schools in grades 1-5 hovered around 3% between
2001/02 and 2007/08. This percentage is very small compared to the overall White
composition of CCSD, which ranged from 45% in 2001 to 34% in 2007 for grades 1-5.

!!"#$%&'()$*$&)+'),$$
UCLA Civil Right Project/Proyecto Derechos Civiles
Clark County School District Prime 6 Program Report
Page 19 of 33
The Latino composition of Prime 6 schools has increased to slightly exceed the
District’s Latino composition.
In 2001/02 Prime 6 schools were comprised of 23% Latino students in grades 1-5,
lower than the District’s 34% Latino composition in grades 1-5. The Latino composition
of Prime 6 schools increased more rapidly than the District’s Latino composition. By the
2007/08, Latinos comprised 45% of Prime 6 students in grades 1-5, compared to 43% of
the District’s enrollment in grades 1-5.
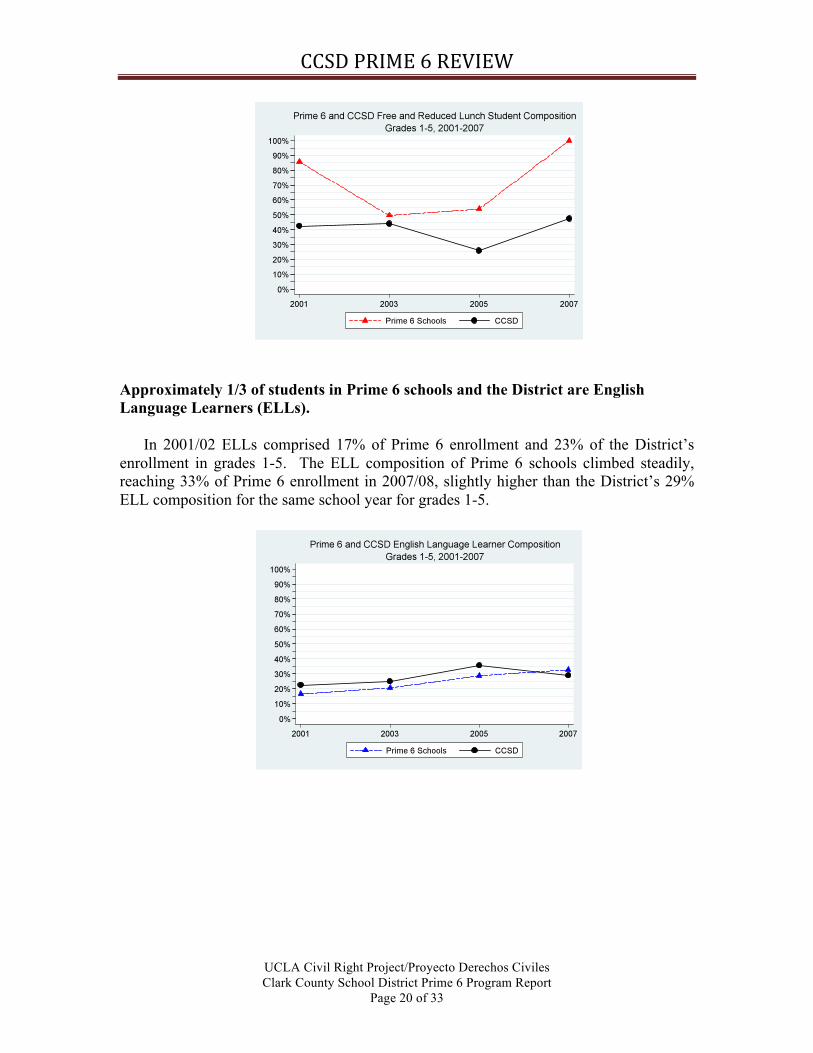
Prime 6 schools serve extremely high percentages of Free and Reduced Lunch
(FRL) students.
While participation in the Free and Reduced Lunch Program varied dramatically
District-wide during the time period from 2001-2007, Prime 6 schools consistently
enrolled higher percentages of FRL students than the District. The disparity in the
concentration of FRL students was notable in 2001 and 2005, but it became especially
acute in 2007 when Prime 6 schools enrolled 100% FRL students in grades 1-5, over
twice the District’s 47% FRL enrollment in grades 1-5. Such high concentrations of
poverty within Prime 6 schools can create challenges for teachers in adequately meeting
the learning-related needs of the students.
!!"#$%&'()$*$&)+'),$$
UCLA Civil Right Project/Proyecto Derechos Civiles
Clark County School District Prime 6 Program Report
Page 20 of 33
Approximately 1/3 of students in Prime 6 schools and the District are English
Language Learners (ELLs).
In 2001/02 ELLs comprised 17% of Prime 6 enrollment and 23% of the District’s
enrollment in grades 1-5. The ELL composition of Prime 6 schools climbed steadily,
reaching 33% of Prime 6 enrollment in 2007/08, slightly higher than the District’s 29%
ELL composition for the same school year for grades 1-5.
!!"#$%&'()$*$&)+'),$$
UCLA Civil Right Project/Proyecto Derechos Civiles
Clark County School District Prime 6 Program Report
Page 21 of 33
VI. GRADE 1-5 SCHOOL ENROLLMENT PATTERNS OF STUDENTS FROM
PRIME 6 KINDERGARTEN ATTENDANCE AREAS
This section of the report documents the grade 1-5 school enrollment patterns of
students residing in the six Prime 6 kindergarten attendance area. Findings focus on their
enrollment in Assigned Schools outside of West Las Vegas. These figures exclude those
who were assigned to a Magnet School in West Las Vegas for kindergarten. Additional
information on the school enrollments of West Las Vegas students can be found in the
appendix.
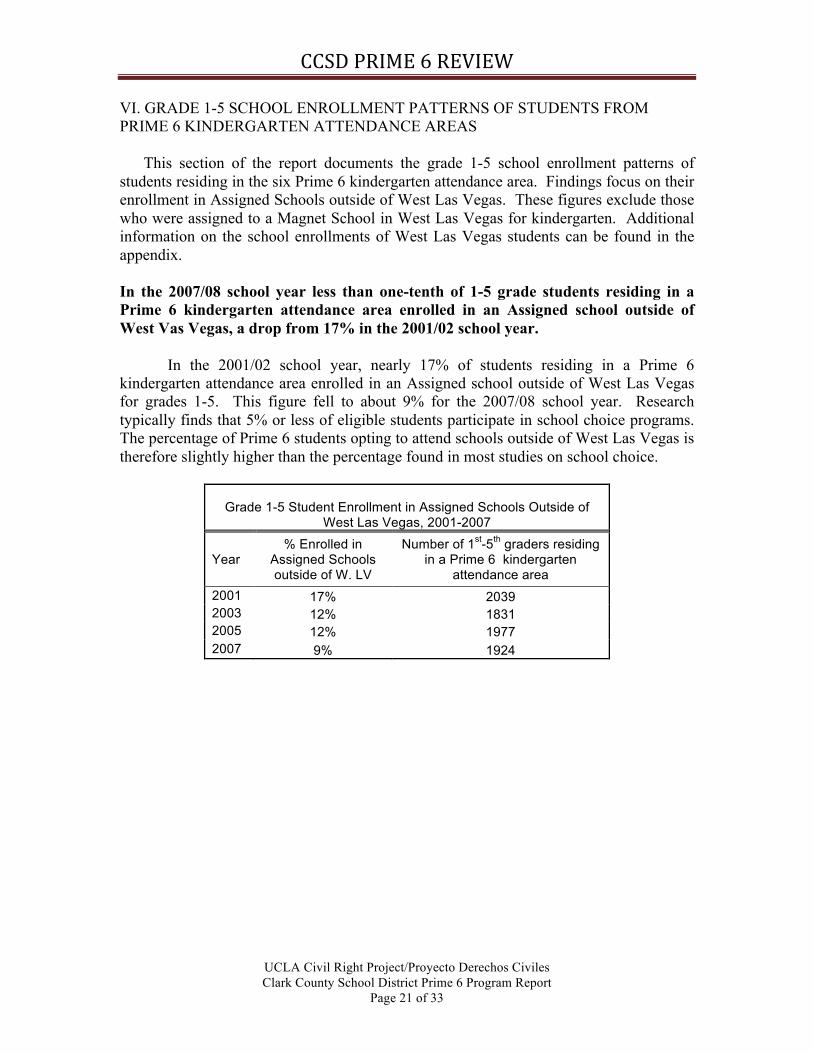
In the 2007/08 school year less than one-tenth of 1-5 grade students residing in a
Prime 6 kindergarten attendance area enrolled in an Assigned school outside of
West Vas Vegas, a drop from 17% in the 2001/02 school year.
In the 2001/02 school year, nearly 17% of students residing in a Prime 6
kindergarten attendance area enrolled in an Assigned school outside of West Las Vegas
for grades 1-5. This figure fell to about 9% for the 2007/08 school year. Research
typically finds that 5% or less of eligible students participate in school choice programs.
The percentage of Prime 6 students opting to attend schools outside of West Las Vegas is
therefore slightly higher than the percentage found in most studies on school choice.
Grade 1-5 Student Enrollment in Assigned Schools Outside of West Las Vegas, 2001-2007
Year % Enrolled in
Assigned Schools outside of W. LV
Number of 1st-5
th graders residing
in a Prime 6 kindergarten attendance area
2001 17% 2039
2003 12% 1831
2005 12% 1977
2007 9% 1924

!!"#$%&'()$*$&)+'),$$
UCLA Civil Right Project/Proyecto Derechos Civiles
Clark County School District Prime 6 Program Report
Page 22 of 33
Nearly one tenth of African-American students residing in a Prime 6 kindergarten
attendance area enroll in an Assigned school outside of West Las Vegas for grades
1-5.
During the 2001/02, 2002/03, 2005/06, and 2007/08 school years, 8%-13% of
African-Americans residing in a Prime 6 kindergarten attendance area enrolled in an
Assigned school outside of West Las Vegas for grades 1-5. Latinos enrolled in Assigned
schools outside of West Las Vegas in similar numbers as African-Americans; however,
the actual percentage of Latinos enrolled in Assigned Schools ranges from 19%-36%.
While 13%-32% of Whites and 9%-24% of Asian students enrolled in Assigned schools
outside of West Las Vegas, their numbers were fairly small.
Grade 1-5 Student Enrollment in an Assigned School
Outside of West Las Vegas
by Ethnic/Racial Group, 2001-2007
Year Racial/Ethnic Group
% Enrolled in Assigned
Schools outside of W.
LV
Number of 1st-5
th graders residing in
a Prime 6 kindergarten attendance
area
White 32% 78
African-American 13% 1399
Latino 24% 529 2001
Other 36% 33
White 18% 74
African-American 9% 1169
Latino 18% 545 2003
Other 19% 43
White 23% 86
African-American 8% 1188
Latino 15% 659 2005
Other 27% 44
White 13% 71
African-American 8% 928
Latino 9% 879 2007
Other 22% 46
!!"#$%&'()$*$&)+'),$$
UCLA Civil Right Project/Proyecto Derechos Civiles
Clark County School District Prime 6 Program Report
Page 23 of 33
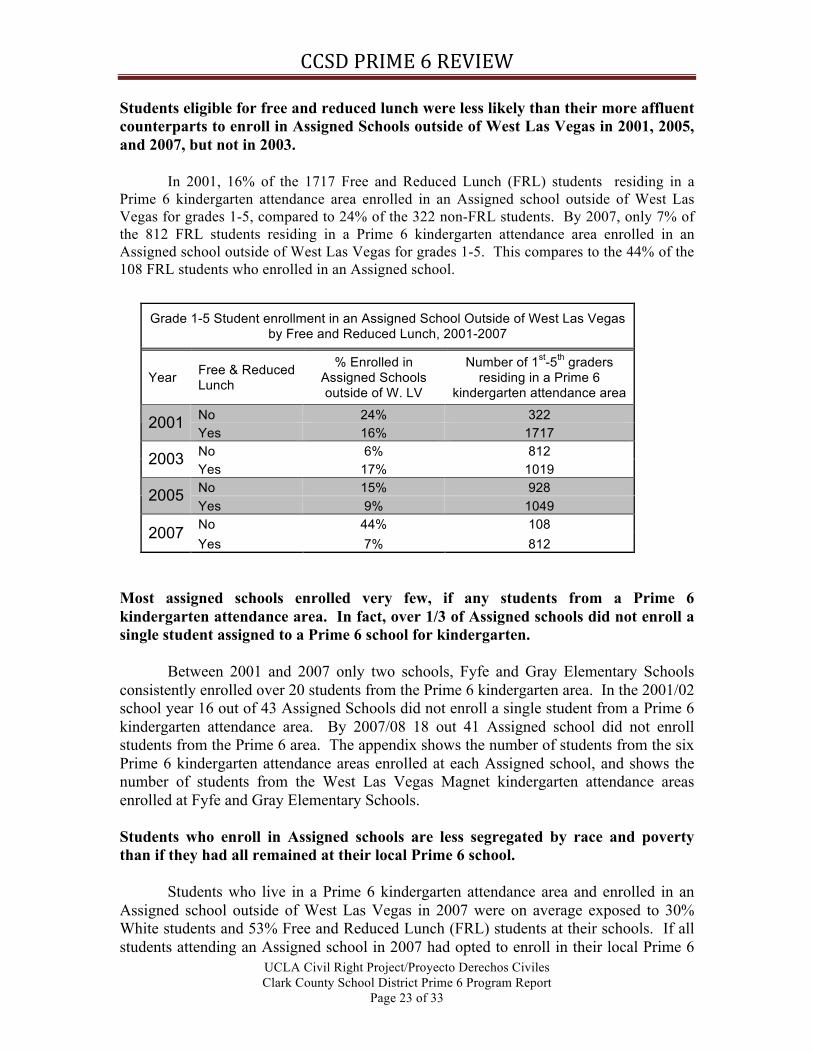
Students eligible for free and reduced lunch were less likely than their more affluent
counterparts to enroll in Assigned Schools outside of West Las Vegas in 2001, 2005,
and 2007, but not in 2003.
In 2001, 16% of the 1717 Free and Reduced Lunch (FRL) students residing in a
Prime 6 kindergarten attendance area enrolled in an Assigned school outside of West Las
Vegas for grades 1-5, compared to 24% of the 322 non-FRL students. By 2007, only 7% of
the 812 FRL students residing in a Prime 6 kindergarten attendance area enrolled in an
Assigned school outside of West Las Vegas for grades 1-5. This compares to the 44% of the
108 FRL students who enrolled in an Assigned school.
Most assigned schools enrolled very few, if any students from a Prime 6
kindergarten attendance area. In fact, over 1/3 of Assigned schools did not enroll a
single student assigned to a Prime 6 school for kindergarten.
Between 2001 and 2007 only two schools, Fyfe and Gray Elementary Schools
consistently enrolled over 20 students from the Prime 6 kindergarten area. In the 2001/02
school year 16 out of 43 Assigned Schools did not enroll a single student from a Prime 6
kindergarten attendance area. By 2007/08 18 out 41 Assigned school did not enroll
students from the Prime 6 area. The appendix shows the number of students from the six
Prime 6 kindergarten attendance areas enrolled at each Assigned school, and shows the
number of students from the West Las Vegas Magnet kindergarten attendance areas
enrolled at Fyfe and Gray Elementary Schools.
Students who enroll in Assigned schools are less segregated by race and poverty
than if they had all remained at their local Prime 6 school.
Students who live in a Prime 6 kindergarten attendance area and enrolled in an
Assigned school outside of West Las Vegas in 2007 were on average exposed to 30%
White students and 53% Free and Reduced Lunch (FRL) students at their schools. If all
students attending an Assigned school in 2007 had opted to enroll in their local Prime 6
Grade 1-5 Student enrollment in an Assigned School Outside of West Las Vegas by Free and Reduced Lunch, 2001-2007
Year Free & Reduced Lunch
% Enrolled in Assigned Schools outside of W. LV
Number of 1st-5
th graders
residing in a Prime 6 kindergarten attendance area
No 24% 322 2001
Yes 16% 1717
No 6% 812 2003
Yes 17% 1019
No 15% 928 2005
Yes 9% 1049
No 44% 108 2007
Yes 7% 812

!!"#$%&'()$*$&)+'),$$
UCLA Civil Right Project/Proyecto Derechos Civiles
Clark County School District Prime 6 Program Report
Page 24 of 33
school these same students would have been exposed to an average of 3% White students
and 93% FRL students.
Students enrolled in Assigned schools outside of West Las Vegas attended
schools with somewhat more Latinos and English Language Learners (ELLs) than if they
had all remained at their local Prime 6 school. In 2007 these students were exposed to
48% Latinos and 32% ELLS at their Assigned schools outside of West Las Vegas,
compared to 40% Latinos and 29% ELLs if they had all enrolled in their local Prime 6
schools.
Average Exposure to Demographic Groups for Students Attending Assigned Schools Outside of West Las Vegas
Year White African-
American Latino Other
Free & Reduced
Lunch
English Learners
2001 45% 17% 32% 7% 45% 21%
2003 40% 17% 35% 7% 51% 24%
2005 35% 16% 42% 8% 25% 36%
2007 30% 15% 48% 7% 53% 32%
Average Exposure to Demographic Groups for Students Attending Assigned Schools Outside of West Las Vegas IF They Had ALL Enrolled in Their Local Prime 6 School
Year White African-
American Latino Other
Free & Reduced
Lunch
English Learners
2001 3% 76% 19% 2% 82% 12%
2003 4% 72% 21% 3% 55% 16%
2005 4% 67% 26% 3% 51% 23%
2007 3% 54% 40% 3% 93% 29%
Only 3%-8% of students residing in one of the six Prime 6 school kindergarten
attendance areas enrolled in a local magnet school in West Las Vegas.
Students residing in the Prime 6 kindergarten attendance area have the option to
apply for admission at magnet schools, including one of the three magnet schools located
in West Las Vegas, Gilbert, Hoggard, and Mackey Magnets. While located in the same
general community as the Prime 6 schools, these three magnet schools tend to be more
diverse, enrolling higher percentages of White and Asian students, and lower percentages
of Free and Reduced Lunch students than the Prime 6 schools. Although magnet schools
expose students to greater diversity, consistently small numbers of students residing in a
Prime 6 kindergarten attendance area enrolled in a West Las Vegas Magnet school from
2001 to 2007.

!!"#$%&'()$*$&)+'),$$
UCLA Civil Right Project/Proyecto Derechos Civiles
Clark County School District Prime 6 Program Report
Page 25 of 33
Enrollment in a West Las Vegas Magnet School Among 1st-5
th Graders Residing
in a Prime Kindergarten Attendance Area
Year % Enrolled in a West Las Vegas
Magnet School # of 1
st-5
th graders residing in Prime 6
kindergarten attendance area
2001 3% 2039
2003 3% 1831
2005 4% 1977
2007 8% 1924
The appendix provides additional information on the school enrollment patterns
of students from the Prime 6 area. Data are disaggregated by Race/Ethnicity, Free and
Reduced Lunch Status, English Language Learner background, and individual Prime 6
School. The appendix also includes information on Assigned schools outside of West
Las Vegas and Gilbert, Hoggard, and Mackey magnet schools.
!!"#$%&'()$*$&)+'),$$
UCLA Civil Right Project/Proyecto Derechos Civiles
Clark County School District Prime 6 Program Report
Page 26 of 33
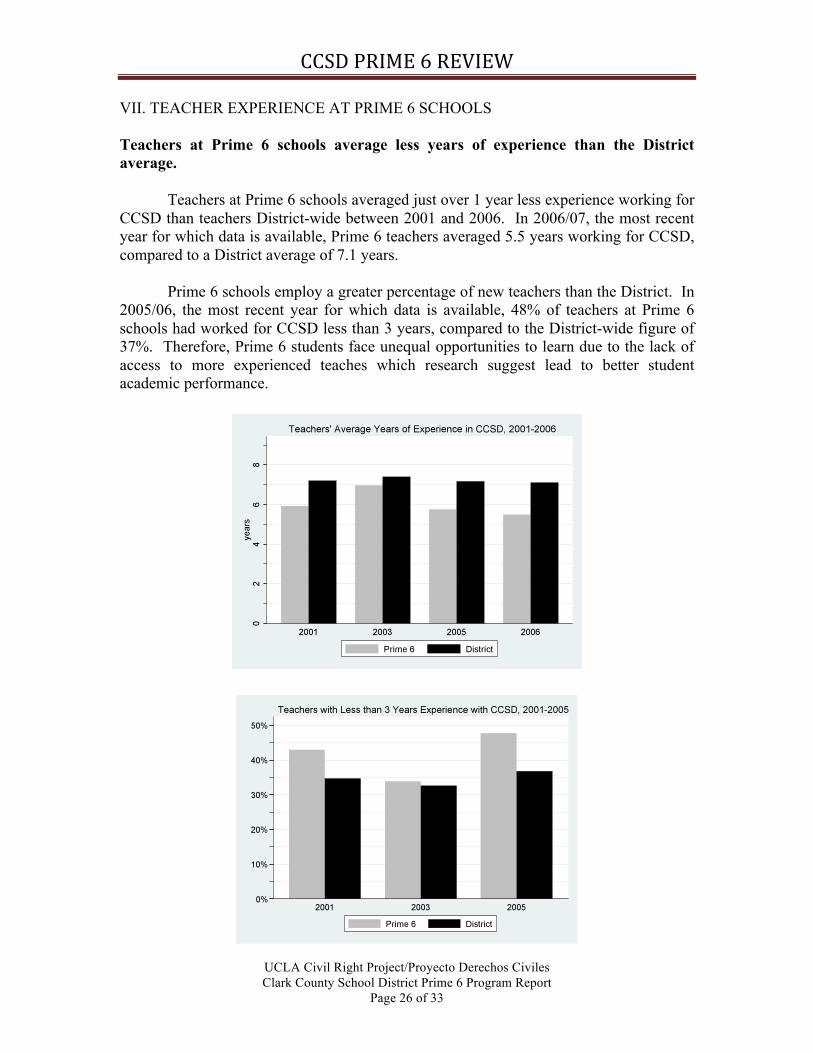
VII. TEACHER EXPERIENCE AT PRIME 6 SCHOOLS
Teachers at Prime 6 schools average less years of experience than the District
average.
Teachers at Prime 6 schools averaged just over 1 year less experience working for
CCSD than teachers District-wide between 2001 and 2006. In 2006/07, the most recent
year for which data is available, Prime 6 teachers averaged 5.5 years working for CCSD,
compared to a District average of 7.1 years.
Prime 6 schools employ a greater percentage of new teachers than the District. In
2005/06, the most recent year for which data is available, 48% of teachers at Prime 6
schools had worked for CCSD less than 3 years, compared to the District-wide figure of
37%. Therefore, Prime 6 students face unequal opportunities to learn due to the lack of
access to more experienced teaches which research suggest lead to better student
academic performance.
!!"#$%&'()$*$&)+'),$$
UCLA Civil Right Project/Proyecto Derechos Civiles
Clark County School District Prime 6 Program Report
Page 27 of 33
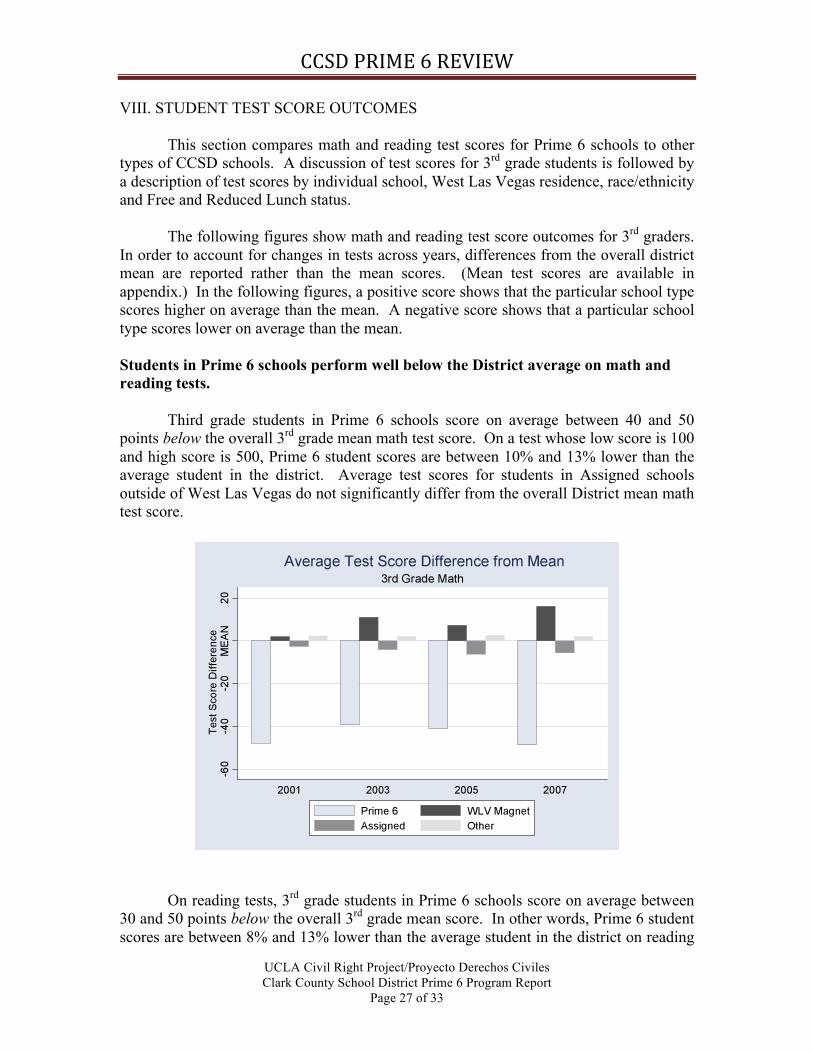
VIII. STUDENT TEST SCORE OUTCOMES
This section compares math and reading test scores for Prime 6 schools to other
types of CCSD schools. A discussion of test scores for 3rd
grade students is followed by
a description of test scores by individual school, West Las Vegas residence, race/ethnicity
and Free and Reduced Lunch status.
The following figures show math and reading test score outcomes for 3rd
graders.
In order to account for changes in tests across years, differences from the overall district
mean are reported rather than the mean scores. (Mean test scores are available in
appendix.) In the following figures, a positive score shows that the particular school type
scores higher on average than the mean. A negative score shows that a particular school
type scores lower on average than the mean.
Students in Prime 6 schools perform well below the District average on math and
reading tests.
Third grade students in Prime 6 schools score on average between 40 and 50
points below the overall 3rd
grade mean math test score. On a test whose low score is 100
and high score is 500, Prime 6 student scores are between 10% and 13% lower than the
average student in the district. Average test scores for students in Assigned schools
outside of West Las Vegas do not significantly differ from the overall District mean math
test score.
On reading tests, 3rd
grade students in Prime 6 schools score on average between
30 and 50 points below the overall 3rd
grade mean score. In other words, Prime 6 student
scores are between 8% and 13% lower than the average student in the district on reading

!!"#$%&'()$*$&)+'),$$
UCLA Civil Right Project/Proyecto Derechos Civiles
Clark County School District Prime 6 Program Report
Page 28 of 33
tests. Average test scores for students at Assigned schools again do not significantly
differ from the overall mean reading test score.
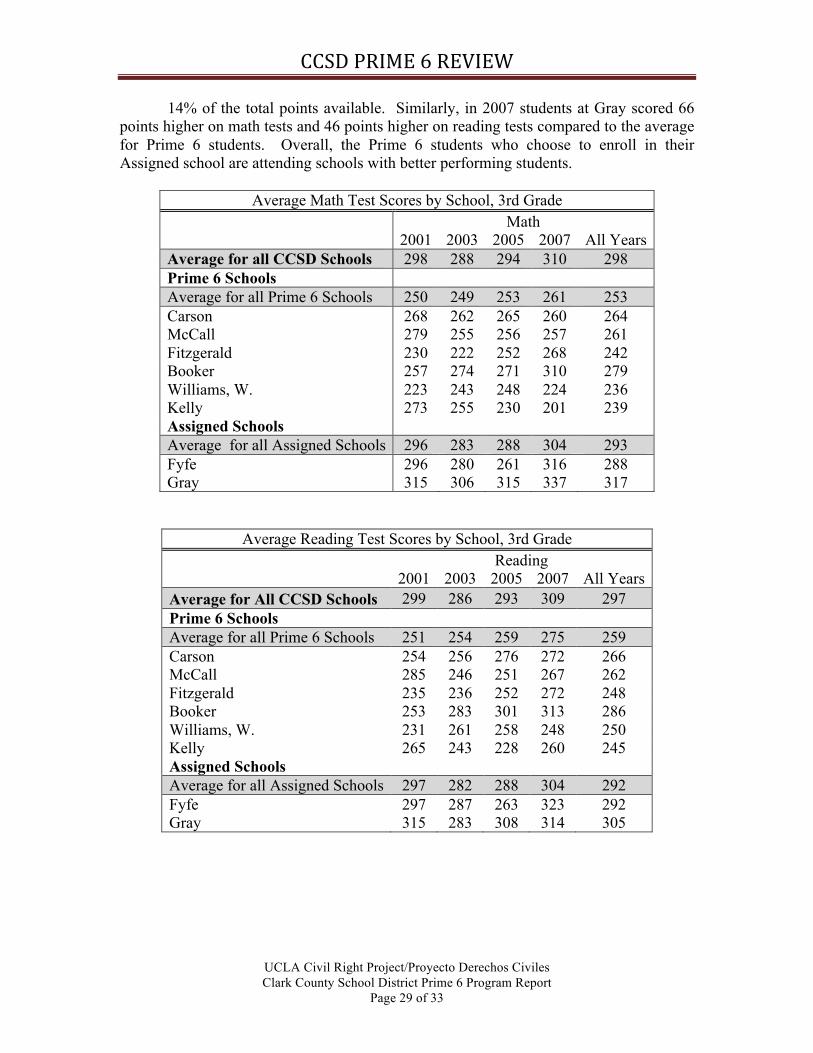
Students at Fyfe Elementary and Gray Elementary, the Assigned schools with the
most students from West Las Vegas, average higher math and reading test scores
than do students at Prime 6 schools.
The following tables show average 3rd
grade test scores for each of the Prime 6
schools and the two Assigned schools that enroll the most students from Prime 6
kindergarten attendance areas. Williams and Kelly are the worst performing Prime 6
schools. In 2007, Williams students scored 37 points below the Prime 6 mean math test
score. This difference represents almost 10% of the possible 400 points. Although Kelly
students score well compared to other Prime 6 students in 2001, math test scores in 2007
are 60 points or 15% below the Prime 6 mean. Reading test scores at Williams and Kelly
are closer to the Prime 6 means across years but consistently below the District mean. In
2007, Williams’ reading test scores average 27 points below the Prime 6 mean and Kelly
reading test scores average 15 points below the Prime 6 mean. Booker has performed
better than the other Prime 6 schools, particularly in recent years. By 2007, students at
Booker score 12% above the Prime 6 average on math and 10% above the Prime 6
reading average score.
Test scores of students at Fyfe and Gray are comparable to the mean test scores at
all Prime 6 Assigned schools and dramatically better than the mean test scores at Prime 6
schools. In 2007, students at Fyfe scored 55 points higher on math tests and 48 points
higher on reading tests compared to the average for Prime 6 students. This represents 12-
!!"#$%&'()$*$&)+'),$$
UCLA Civil Right Project/Proyecto Derechos Civiles
Clark County School District Prime 6 Program Report
Page 29 of 33
14% of the total points available. Similarly, in 2007 students at Gray scored 66
points higher on math tests and 46 points higher on reading tests compared to the average
for Prime 6 students. Overall, the Prime 6 students who choose to enroll in their
Assigned school are attending schools with better performing students.
Average Math Test Scores by School, 3rd Grade
Math
2001 2003 2005 2007 All Years
Average for all CCSD Schools 298 288 294 310 298
Prime 6 Schools
Average for all Prime 6 Schools 250 249 253 261 253
Carson 268 262 265 260 264
McCall 279 255 256 257 261
Fitzgerald 230 222 252 268 242
Booker 257 274 271 310 279
Williams, W. 223 243 248 224 236
Kelly 273 255 230 201 239
Assigned Schools
Average for all Assigned Schools 296 283 288 304 293
Fyfe 296 280 261 316 288
Gray 315 306 315 337 317
Average Reading Test Scores by School, 3rd Grade
Reading
2001 2003 2005 2007 All Years
Average for All CCSD Schools 299 286 293 309 297
Prime 6 Schools
Average for all Prime 6 Schools 251 254 259 275 259
Carson 254 256 276 272 266
McCall 285 246 251 267 262
Fitzgerald 235 236 252 272 248
Booker 253 283 301 313 286
Williams, W. 231 261 258 248 250
Kelly 265 243 228 260 245
Assigned Schools
Average for all Assigned Schools 297 282 288 304 292
Fyfe 297 287 263 323 292
Gray 315 283 308 314 305

!!"#$%&'()$*$&)+'),$$
UCLA Civil Right Project/Proyecto Derechos Civiles
Clark County School District Prime 6 Program Report
Page 30 of 33
African-American and Latino students enrolled in Prime 6 schools average lower
math and reading test scores than African-American and Latino students enrolled
in other District schools.
African-Americans attending Prime 6 schools average lower test scores than
African-Americans attending Magnet schools in West Las Vegas, Prime 6 Assigned
schools outside of West Las Vegas, or other District schools. African American students
in Prime 6 schools score between 14 and 36 points or 4-9% below African American
students attending Assigned schools on math and reading tests. Similarly, Latino
students attending Prime 6 schools average lower test scores than Latino students
attending other types of schools in the District. Math test scores of Latino students
attending Prime 6 schools are between 6 and 26 points lower than Latino student test
scores in Assigned schools1. Reading test scores of Latino students attending Prime 6
schools are 3 points higher than reading test scores of Latinos attending Assigned schools
in 2001. By 2007, Latinos attending Prime 6 schools scored 17 points or 4% lower than
Latino students attending Assigned schools.
Free and Reduced Lunch (FRL) students enrolled in Prime 6 schools average lower
math and reading test scores than FRL students enrolled in other District schools.
Prime 6 FRL students score on average between 25 and 33 points (6%-8% of total
available points) below FRL students at Assigned schools on math tests and between 10
and 28 (3%-7% of total available points) points below their mean reading test score. On
math and reading tests, Prime 6 students who do not qualify for FRL score between 27
and 51 points (7%-13% of total available points) below non-FRL students who attend
Assigned schools.
Among West Las Vegas students, those enrolled in Assigned schools outside of West
Las Vegas average higher math and reading test scores than those enrolled in Prime
6 schools.
West Las Vegas students score below the District average math and reading
scores across all different types of schools.2 However, West Las Vegas students at
Assigned schools perform considerably better than those who attend Prime 6 schools,
with the exception of reading test scores for 2005. Math scores of West Las Vegas
students attending Prime 6 schools are 8 to 25 points lower than math scores of West Las
Vegas students attending Assigned schools. Reading test scores of West Las Vegas
students attending Prime 6 schools are between 14 and 22 points below West Las Vegas
students attending Assigned schools, except in 2005. West Las Vegas students who
attended a Prime 6 school average up to 41 points lower (about 10% of all points
1 2001 is the exception. In 2001, Latino student math test scores in Prime 6 schools were actually higher
than Latino student math test scores in all other schools. 2 This analysis includes West Las Vegas students residing in the kindergarten attendance areas of Gilbert,
Hoggard, and Mackey Magnet schools because the number of students in the Prime 6 area who attend a
school other than their local Prime 6 is small. Students residing in the Gilbert, Hoggard, and Mackey
kindergarten attendance areas are also assigned to the Prime 6 Assigned schools for Grades 1-5.
!!"#$%&'()$*$&)+'),$$
UCLA Civil Right Project/Proyecto Derechos Civiles
Clark County School District Prime 6 Program Report
Page 31 of 33
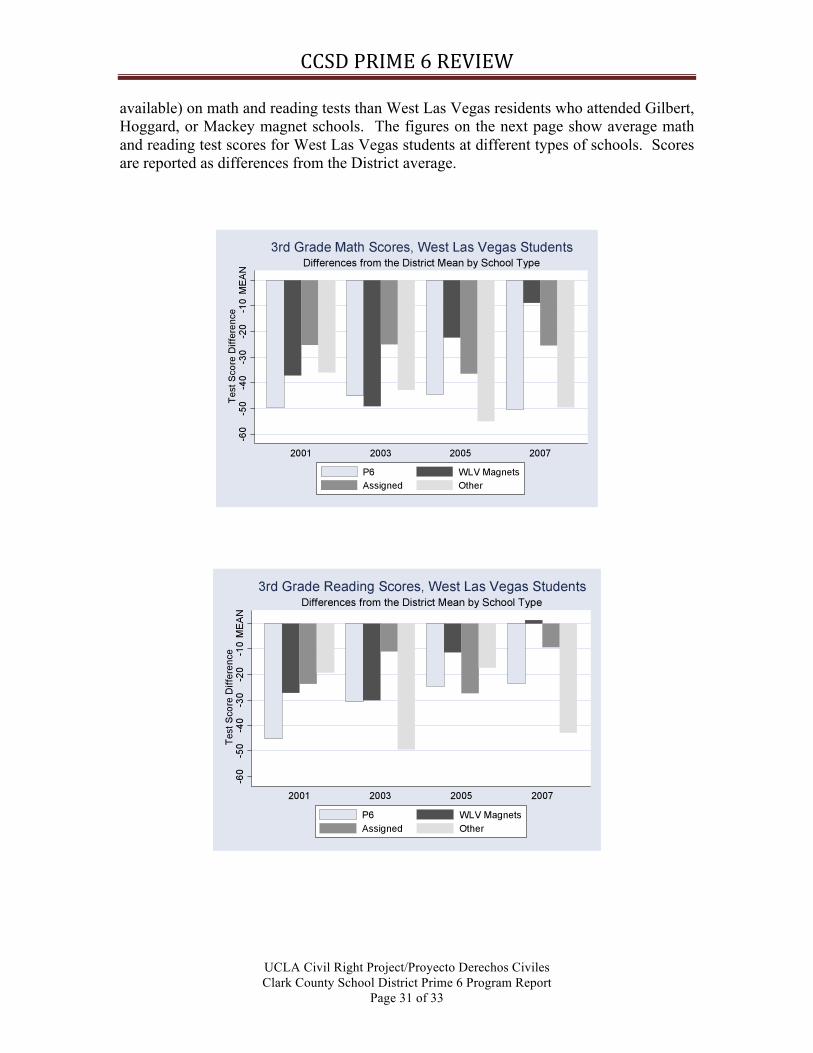
available) on math and reading tests than West Las Vegas residents who attended Gilbert,
Hoggard, or Mackey magnet schools. The figures on the next page show average math
and reading test scores for West Las Vegas students at different types of schools. Scores
are reported as differences from the District average.

!!"#$%&'()$*$&)+'),$$
UCLA Civil Right Project/Proyecto Derechos Civiles
Clark County School District Prime 6 Program Report
Page 32 of 33
IX. AYP & INOI DESIGNATION OF PRIME 6 SCHOOLS 2003-2008
How AYP and INOI are Determined
NCLB requires that states implement an accountability system for schools that
evaluates whether they are making Adequate Yearly Progress (AYP) toward the goals of
the legislation. Nevada AYP classifications are based on school attendance or graduation
rates; the percentage of students tested; and the percentage of students who score at or
above the proficient level on annual statewide tests in English Language Arts (ELA) and
Math. A school’s average test scores do not always correspond with AYP since growth
in test scores contributes to the calculation of AYP. Furthermore, under NCLB,
performance is evaluated for each identifiable student group within the school. In
Nevada, 9 sub-groups are identified and if any one of the groups does not meet the
criteria for the three AYP indicators, the school is classified as not making AYP. Schools
not demonstrating AYP for two consecutive years, in any of the three content areas, are
designated as In Need of Improvement (INOI). To be removed from INOI status, a school
must have met their AYP for two consecutive years in the same content area where it had
previously failed.
Prime 6 School AYP and INOI Designation 2003-2008
For the school years 2003/04, 2005/06 and 2007/08 the Prime 6 West Las Vegas
schools mostly failed to meet AYP and were INOI, with some exceptions. Carson
Elementary met AYP for the 2003/04 academic year but remained INOI. Booker
Elementary School met AYP and was no longer INOI in 2007/08. Wendell Williams
met AYP for 2006/07, but was then placed on Watch for 2007/08. The table below
shows AYP and INOI designation for the Prime 6 schools. It indicates whether or not the
school met its AYP and identifies the AYP content area failed. It also indicates whether
the school is INOI and the number of years it has been designated as such. A designation
of “Watch” identifies a school that failed to meet AYP even though it may have achieved
AYP during the prior school year. If it fails the following year, it will be designated as
INOI (Year 1).
Prime 6 School Adequately Yearly Progress (AYP) & In Need of Improvement (INOI)
Designation 2003-2008
2003-2004 2005-2006 2007-2008
School
Name
Met
AYP? INOI?
Met
AYP? INOI?
Met
AYP? INOI?
Booker No
(ELA) Watch
No
(ELA)
Yes
(Year 2) Yes No
Carson Yes Yes
(Year 2)
No
(ELA & Math)
Yes
(Year 3)
No
(ELA & Math)
Yes
(Year 4)
Fitzgerald No
(ELA & Math) Watch
No
(ELA & Math)
Yes
(Year 2)
No
(ELA)
Yes
(Year 4)
Kelly No
(Math)
Yes
(Year 1)
No
(ELA & Math)
Yes
(Year 2)
No
(ELA & Math)
Yes
(Year 1)
McCall No
(ELA & Math)
Yes
(Year 2)
No
(ELA & Math)
Yes
(Year 3)
No
(ELA & Math) Watch
Wendell No
(ELA & Math)
Yes
(Year 2)
No
(ELA & Math)
Yes
(Year 3)
No
(ELA & Math) Watch
!!"#$%&'()$*$&)+'),$$
UCLA Civil Right Project/Proyecto Derechos Civiles
Clark County School District Prime 6 Program Report
Page 33 of 33
X. SUGGESTIONS FOR FURTHER RESEARCH
More research may be necessary to determine whether West Las Vegas Families
have enough information about Assigned and Magnet schools, whether available
transportation provides adequate access to Assigned schools, and whether students
feel welcome at all Assigned schools.
Gilbert, Hoggard, and Mackey Magnet schools and Assigned schools expose
West Las Vegas students to more racial/ethnic diversity and higher performing students
than their local Prime 6 schools. However, local Magnet schools enroll very few students
from the Prime 6 area, and only a couple of the 41 Assigned schools outside of West Las
Vegas consistently enroll more than 20 students from West Las Vegas. It is beyond the
scope of this report to determine whether families in West Las Vegas are provided with
enough information about enrollment options outside of their local Prime 6 schools.
Future research should include surveys and interviews with parents to assess their access
to information about school options and transportation to non-local schools.
Furthermore, future research should assess the extent to which West Las Vegas students
feel welcome at Assigned schools outside of their community.